
Abstract
Economic growth is commonly seen as the main driver of poverty reduction in a global perspective, but its impact varies substantially across cases. Meanwhile, the literature has been relatively silent regarding the role of social policy in explaining this variation. In light of an emerging attention to redistribution and social protection in promoting inclusive growth, this article analyses how government cash transfer systems moderate the effect of economic growth on both relative and absolute child poverty across low- and middle-income countries. The empirical analyses compare trends within 16 countries, using data from the Luxembourg Income Study (LIS), by means of descriptive analyses and multivariate regression techniques. Findings show that both economic growth and the expansion of government transfer schemes were associated with falling absolute child poverty rates. While the association between growth and relative child poverty was on average more muted, the analyses found growth to be related to reductions in relative child poverty when combined with sufficiently extensive government transfers, while the opposite effect was found in the face of inadequate levels of transfers. The study provides a framework for studying interrelated effects of national institutions and economic processes, with the findings highlighting the fruitfulness of including indicators on social protection policies when inquiring about enabling conditions for inclusive growth in a development context.
Keywords
Introduction
How can societies across the globe foster inclusive growth, that is, economic development that benefits broad segments of the populations in these countries, including the most vulnerable? This article draws on the recent expansion of cash transfer programmes targeted at families with children across many low- and middle-income countries (LMICs), to investigate the role of social policy in shaping the link between growth and child poverty reduction in these countries over the last decades.
Children are overrepresented among the global poor (Castañeda et al., 2018), and additionally tend to face higher risks of malnutrition, disease, abuse and exploitation, compared to adults in similar situations of vulnerability (Roelen and Sabates-Wheeler, 2012). Living standards during childhood also matters for a range of outcomes across the life-course, with child poverty having long-term consequences for both individuals and societies (Black et al., 2017). Such insights have made combating child poverty through early interventions one of the cornerstones of the social investment paradigm and Sustainable Development Agenda (Clark et al., 2020).
The predominant strategy to achieve poverty reduction, also with regard to children, has been the promotion of aggregate economic growth, and empirical studies have repeatedly found economic growth to raise the well-being of the poor (Bergstrom, 2020; Cerra et al., 2021; Dollar et al., 2016). However, disappointing poverty trends and growing inequalities observed amid high rates of economic growth in many emerging economies has sparked debates over the possibility to eradicate global poverty by relying on increasing national incomes. Scholars have pointed to important differences between countries and growth episodes in the degree to which growth actually reduces poverty (Adams, 2004; Bourguignon, 2003; Ravallion, 2001; Shaffer et al., 2019). Meanwhile, attention to ‘inclusive’ growth has been growing, reflecting concerns that rising average living standards over the last decades on many occasions have failed to benefit the less priviliged (Cerra et al., 2021; Cook, 2018; Mahon, 2019; Organisation for Economic Co-operation and Development (OECD), 2018; The World Bank, 2020). Still, the literature has been ‘relatively silent regarding the specific factors that could foster a larger impact of economic growth on poverty’ (Alvaredo and Gasparini, 2015: 785). This article addresses this gap in previous research by embarking from the notion that distributional processes associated with economic growth are fruitfully understood as moderated by institutions that vary across countries, highlighting particularly the role of government cash transfer schemes.
The empirical analyses draw on the emergence of social protection as a central tool to address poverty and social exclusion. Families with children have often been a core target group of novel social protection programmes in developing countries (Barrientos and DeJong, 2006; Leisering, 2018). More expansionary reforms in some countries have moreover led to growing cross-country variation in the scope of social protection for children in emerging economies. Comparative analyses could thus provide important insights into how policies influence the distributional outcomes of economic growth.
Comparative research on high-income countries shows that government transfers are central in explaining how economic growth reduces poverty (e.g. Brady and Bostic, 2015; Hermansen et al., 2016; Kenworthy, 2011), but whether government transfer systems influence the degree to which growth reduces poverty in developing countries remains an understudied topic. By focusing on child poverty and government support provided to families with children this article make use of the emerging cross-country variation in social protection for this group, by measuring direct effects of cash transfers on poverty as well as estimating the extent to which government cash transfer systems moderate the effect of economic growth on child poverty across a sample of LMICs.
Related to the debates around inclusive growth and shared prosperity, and the increasing average living standards alongside widening inequalities in emerging economies, is a growing uneasiness of using only absolute poverty lines, such as the widely known measure of extreme poverty developed by The World Bank (Atkinson, 2017; Ravallion, 2020). In high-income countries, it is often recognised that poverty also has a relative dimension that concerns the distances between households in the income distribution, and national poverty lines in LMICs also tend to reflect typical living standards in that country (Jolliffe and Prydz, 2021). Relative poverty lines rise along with typical living standards, acknowledging that more resources are required to avoid social exclusion in more affluent societies. This article recognises that both of these approaches are of importance when evaluating the inclusiveness of economic growth and social development, and incorporates both types of measures in the analyses.
The main question guiding the analyses presented below has been how government transfer systems in LMICs influence the effect of economic growth on child poverty? The study also seek to answer to what extent the direct and indirect effects of government transfers differ depending on whether poverty is measured in absolute or relative terms. The empirical analyses draw on comparative household surveys from 16 countries, using data from the Luxembourg Income Study (LIS) database. The associations between the incidence of government transfers, economic growth and changes in child poverty rates are explored using descriptive statistics and multivariate analyses of comparative longitudinal data.
The article makes at least three important contributions to the literature. A main contribution is to provide estimates of the extent to which the effect of growth on child poverty is moderated by the scope of government transfer systems, thus providing new insights on the sources of variation in the growth elasticity of poverty (Adams, 2004; Bourguignon, 2003; Cerra et al., 2021; Ravallion, 2001). The study also adds to the literature by providing econometric analyses of both direct and indirect effects of transfers on poverty reduction, based on a comparative longitudinal dataset, unlike most previous comparative studies on social protection and poverty in LMICs which have mainly been based on cross-sectional data (e.g. Fiszbein et al., 2014; Goñi et al., 2011; Lustig, 2016; Nell et al., 2016). In addition, the study brings social exclusion and relative poverty into the debate about social development in emerging economies, adjoining with an increased emphasis on inequality and ‘leaving no one behind’ in debates on global sustainable development (Kanbur, 2019; United Nations, 2015).
A first section of the article reviews theory and previous research on the linkages between economic growth and child poverty, with particular attention the role of government transfer schemes. A second section introduces the data and analytic techniques employed in the study. The results of the empirical analyses are presented subsequently, and the article is thereafter concluded with a discussion of these results and their implications.
Economic growth, government transfers and child poverty
Growth and poverty reduction
Empirical analyses have repeatedly found economic growth to be associated with falling absolute poverty rates (see Bergstrom, 2020; Cerra et al., 2021). However, these studies also reveal much heterogeneity in the growth elasticity of poverty; that is the responsiveness of the poverty rate to economic growth, across regions, countries and particular growth episodes (Adams, 2004; Bourguignon, 2003; Dollar et al., 2016; Kraay, 2006; Ravallion, 2001). In fact, there are many instances in which poverty rates have remained stable or even increased as the overall economy has grown (Shaffer et al., 2019), and others in which poverty rates fell despite poor records of economic growth (e.g. Ferreira et al., 2010). With regard to relative poverty, evidence moreover suggests that, on average, growth is unrelated to changes in the relative incomes of the poor (Dollar et al., 2016; Ravallion, 2020). Still, this lack of an overall association also obscures much heterogeneity in the degree to which growth has been associated with decreasing or increasing inequality (Kanbur, 2019).
Research on which factors that make some growth episodes more pro-poor than others is still emerging (Alvaredo and Gasparini, 2015; Cerra et al., 2021), and there is a ‘difficulty of identifying specific macroeconomic policies that are significantly associated with the growth rates of those in the poorest quintiles relative to everyone else’ (Dollar et al., 2016: 68). This study will look to government cash transfer schemes as one potentially consequential source of variation in this respect.
Government transfers and poverty
Comparative research on poverty in rich countries has commonly highlighted the role of government transfers as a central factor determining the degree to which those with low incomes benefit from economic growth (Marx et al., 2015). Korpi and Palme (1998) regarded welfare institutions as a key ‘intervening variable’ shaping distributional outcomes, and in a seminal study on the subject, Lane Kenworthy (2011) concludes that ‘[w]hen growth has trickled down to the poor, government transfers have been the principal conduit’ (p. 17). Another study found that productivity gains in OECD countries increased market income for the middle-class and above, while ‘the poor and the lower-middle class were taken on board when moving from market to disposable income’ (Hermansen et al., 2016: 31).
Similar evidence is now also being presented with regard to developing countries (Margitic and Ravallion, 2019), bolstering a growing recognition of the importance of social protection systems for inclusive growth and poverty reduction, also in a developmental context (Cook, 2018; Mahon, 2019; see also OECD, 2018; The World Bank, 2020). The redistributive capacity of many LMICs has increased substantially as their economies have grown (Hoy and Sumner, 2016), and many countries have also implemented various types of anti-poverty programmes. Alongside the provision of basic services and labour market programmes, cash transfer schemes has received particular attention in recent years (Barrientos and DeJong, 2006; Bastagli et al., 2019; Fiszbein and Schady, 2009; Leisering, 2018; Margitic and Ravallion, 2019). Contributory social insurance systems have historically been the most prominent type of government transfer scheme in developing countries, but these have often had a narrow and selective coverage, leaving the most vulnerable without sufficient protection (Mares and Carnes, 2009). This has led some to question whether increased spending on government transfers actually decreases poverty and inequality in LMICs (e.g. Rudra, 2004). More recently, new non-contributory social assistance transfers have been introduced on broad scale across the Global South, often focused particularly on families with children (Leisering, 2018). However, the often meagre budgets as well as the inadequate targeting and frequent exclusion errors of these programmes have spurred concerns regarding their ability to actually lift large groups out of poverty (Brown et al., 2018; Ferrarini et al., 2016).
Empirical evidence however shows promising results of many of these schemes. A systematic literature review concluded that two thirds of the studies examined had found non-contributory transfer schemes to have reduced poverty, whereas in some cases, the impact on household consumption was not large enough to effectively lower aggregate poverty levels (Bastagli et al., 2019). Also studies looking specifically at child poverty in LMICs have demonstrated that social assistance schemes targeting children in poor households, if well designed and well implemented, are effective in reducing poverty among children (Barrientos and DeJong, 2006; Fiszbein and Schady, 2009). Also, by not conditioning receipt of cash transfers on being out of work, benefits can be relevant for reducing in-work poverty as transfers can be used to top-up low and irregular earnings (Barrientos and Unnikrishnan, 2018).
The overall redistributive impact of government transfers in developing countries have often been assessed through benefit incidence analyses (e.g. Fiszbein et al., 2014; Goñi et al., 2011; Lustig, 2016; Skoufias et al., 2010). These studies show that transfers contribute to reduce poverty and inequality, albeit more moderately than in developed countries and with important variation across countries, highlighting low spending and a failure to reach the most vulnerable as causes of a more limited redistributive impact of transfers in many LMICs. While similar analyses that focus on the situation of children are still rare, a study using income data from LIS found that taxes and transfers often, but not always, contributed significantly to poverty reduction (Nell et al., 2016).
Transfers and dynamic effects
These approaches reviewed above suggest that social protection contributes to poverty reduction directly through redistribution. But, cash transfers could additionally have indirect effects on the incomes of poor households by strengthening their capacities to earn income from the market. At societal level, there is now increasing evidence of a positive link between some types of social expenditure and economic growth (e.g. Cammeraat, 2020), potentially with particular relevance for the welfare of low-income households. Globally, growing attention is paid to the potential multiplier effects of cash transfers (Gassmann et al., 2023). Social protection, including cash transfers, can accordingly make vulnerable groups better equipped to share in the opportunities associated with increased economic activity.
A number of mechanisms linking transfers to higher productivity among poor households, also in the shorter run, are highlighted in the literature (Alderman and Yemtsov, 2012; Barrientos, 2012). First, because poverty is associated with risk aversion, security provided through the receipt of a regular cash transfer could encourage poor people to take certain risks, such as searching for more productive employment opportunities or making different kinds of productive investments. Second, cash transfers can enable poor people to employ more beneficial coping strategies, for example, by retaining productive assets in face of external shocks to the household’s economy. Third, as the poor tend to spend locally, cash transfers are likely to stimulate demand for goods and services, promoting growth in local economies, thereby benefitting also non-recipients (see, for example, Barrientos and Malerba, 2020).
Transfer schemes could also have other consequences for labour markets, such as increasing reservation wages and thus potentially raise earnings for low-paid workers. The sceptic view that government transfers could generate more poverty by depressing labour supply through the lowering of work incentives, has moreover been mostly dispelled by research from developing countries (Barrientos and Malerba, 2020; Bastagli et al., 2019; Fiszbein and Schady, 2009). In fact, some studies point to increased labour market participation as transfers are used to cover cost for job searching and migration. However, a lack of economic opportunities could hamper the positive effects of a greater productive capacity of households (Barrientos, 2012), pointing to the combination of growth and social policy as a key factor.
Research on high-income countries has moreover emphasised that social policies that promote maternal employment, are conducive to lower rates of child poverty (Gornick and Nell, 2018). Also with regard to low- and middle-income countries, gender equity is associated with lower child deprivation (Ekbrand and Halleröd, 2018). To the extent that social assistance programmes in LMICs also include subsidies meant to facilitate the use of services complementary to work, such as schooling and childcare, cash transfers in LMICs could also contribute to support maternal employment, thereby reducing child poverty even further (Barrientos and Unnikrishnan, 2018).
These mechanisms implies that people are supported to make use of market-based opportunities to increase their earnings, pointing to the potential that cash transfer schemes, alongside other forms of social protection, could support vulnerable groups to benefit from the opportunities associated with a growing economy. Cash transfer schemes might accordingly contribute to make growth episodes more ‘pro-poor’ as low-income households are integrated into labour markets on more favourable terms. Also, the possibility to combine income from transfers with earnings (Barrientos and Unnikrishnan, 2018) could be another mechanism whereby the combination of growth and transfers promotes poverty reduction.
Alternative explanations
Other factors besides social protection, might undoubtedly contribute to explaining cross-country variation in the growth elasticity of child poverty. The level of inequality is often highlighted as a source of variation, with lower initial inequality associated with a stronger association between growth and poverty reduction (Bergstrom, 2020; Bourguignon, 2003; Cerra et al., 2021; Lakner et al., 2020; Ravallion, 2001). Also, building on the notion of the ‘Kuznets curve’, that is a U-shaped relationship between growth and poverty, it is commonly hypothesised that the growth elasticity of poverty will be higher as economies develop and modernise, although this hypothesis has been increasingly challenged by empirical research on LMICs during later decades (see, for example, Ravallion and Chen, 2022). Beyond the influence of transfers, the growth elasticity of child poverty could in similar ways be influenced by other social protection measures. The provision of basic services, including education and healthcare are obvious candidates but would operate mostly over a longer period of time (Barrientos and DeJong, 2006; Fiszbein and Schady, 2009). Research has also indicated that corruption, and poor governance more generally, is related to higher rates of child poverty in low- and middle-income countries (Halleröd et al., 2013). With lower quality of government institutions, growth could to a greater extent be captured by elites.
Data and method
Dependent variable
The main data source for this study is the LIS Data Centre, a well-renowned source of comparable data on households’ incomes and socio-demographic characteristics, which now hosts a growing number of datasets from LMICs. The dependent variable is the child poverty headcount ratio, that is the proportion of children below age 18 with a standard of living under a given poverty line. The living standard of children is approximated by dividing household income by the square root of the number of household members, in order to arrive at a measure of equivalised disposable household income (DHI).
A set of alternative poverty lines are then employed when calculating the poverty rate. On one hand, income poverty is measured with reference to the absolute poverty lines put forward by The World Bank (2020). The most known of these is the international poverty line used by the Bank to monitor global extreme poverty, which reflects a minimum level to sustain a livelihood in the world’s poorest countries, adjusted using Purchasing Power Parities (PPPs). Prompted by the 2014 release of a new set of PPP conversion factors, the value of the line was updated to US$1.90 a day (Ferreira et al., 2016). The analyses performed here additionally include the higher poverty lines suggested by the Word Bank to reflect national poverty lines in middle-income countries, until recently set at US$3.20 and US$5.50 per day, respectively (The World Bank, 2020).
The analyses also incorporate relative child poverty measures, with the poverty line set as a fraction of the median equivalised DHI in the total population in each country at the time of measurement. While 50% of the median is a common cut-off in comparative studies, the European Union has for some time used 60% as the threshold to calculate at-risk-of-poverty rates. As the choice of a cut-off below which one is to be considered poor is not unambiguous, analyses have been performed using poverty lines set at 40%, 50% and 60% of median equivalised DHI, with the presentation below focusing on the 50 percent line. The resulting evolution of child poverty, using poverty lines set at US$3.20 and 50% of median income, is depicted in Figure 1.
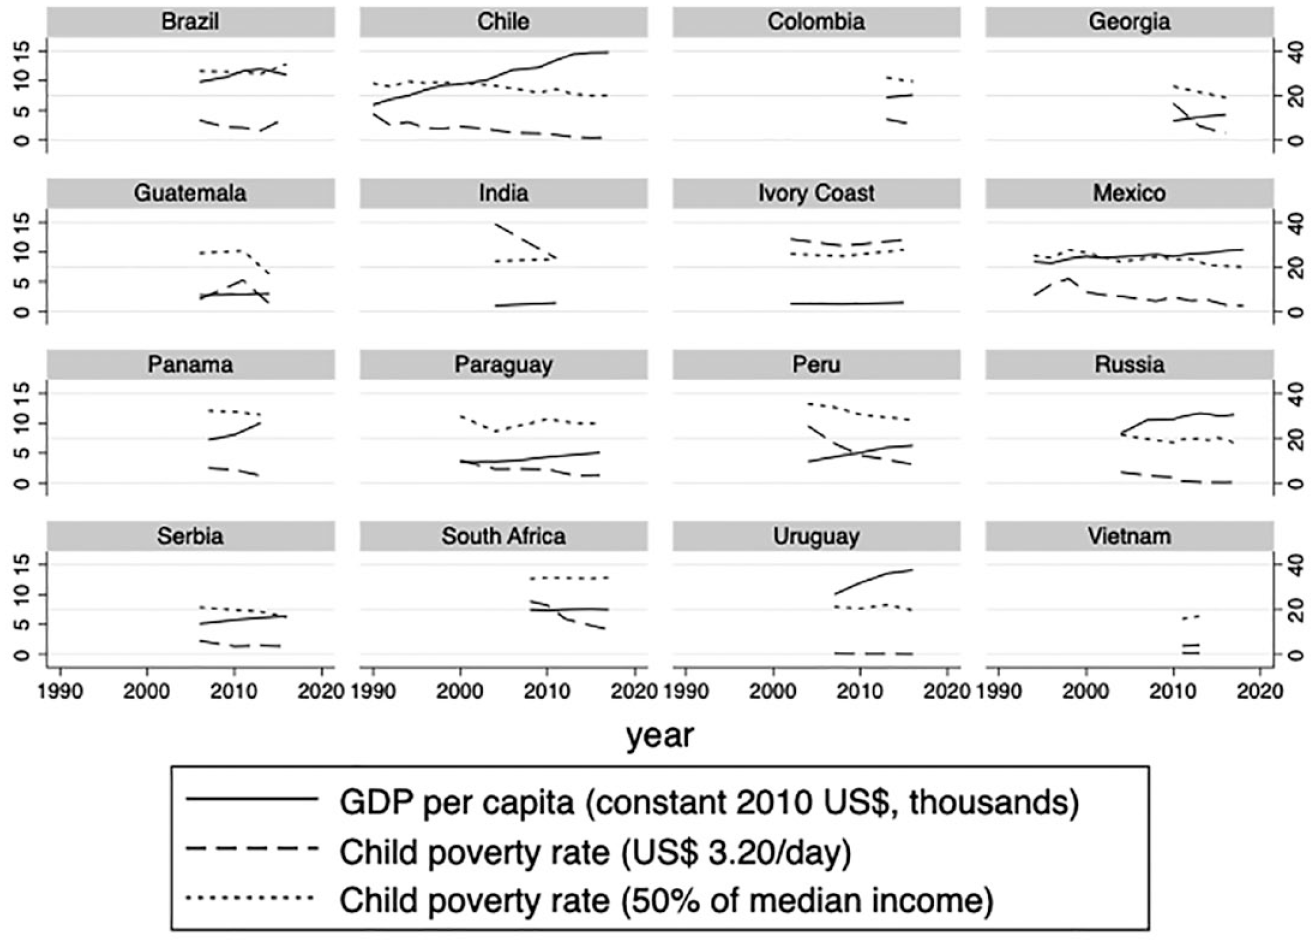
Time-series of child poverty and economic growth in 16 LMICs.
Independent variables
In order to explore the extent to which economic growth is associated with reductions in child poverty, the analyses use a measure of gross domestic product (GDP) per capita, expressed in constant 2010 US Dollars, from the World Development Indicators (see Figure 1). Capturing the extensiveness of government transfers then requires an indicator that reflects cross-sectional as well as longitudinal variation. Measures based on social rights have commonly been seen as preferable for comparing the scope and change of affluent welfare states, but such data are not available for a broader sample of non-OECD countries. Scholars analysing developing countries have therefore sometimes relied on other socio-economic indicators though to proxy differences in welfare arrangements between countries (Wood and Gough, 2006). Such measures are however not well-suited to capture the role of government policy. Another alternative is to rely on assignment of countries to different welfare regimes. Such analyses, in turn, suffer from well-known difficulties to capture changes over time.
The analyses presented below instead employ an indicator of the transfer share (TS) in children’s equivalised household incomes as a measure of governments’ welfare state effort. Such measures have repeatedly been associated with poverty and inequality in previous research based on LIS data from rich countries (see Brady and Bostic, 2015 for references). The TS reflects the degree to which social risks are socialised and provided for by the public. While not unrelated to the distribution of risks and resources among households, variation will ultimately depend on the degree to which governments recognise these risks and the level of support that is provided, thus limiting the degree to which the indicator is itself responsive to changes in poverty levels. Also, as the assessment of need used to establish who is eligible for benefit commonly involves other criteria than the poverty concept employed here, the risk of endogeneity is further reduced. Measuring the receipt of benefits by households is also a way to avoid capturing policies that are mere paper rights.
The TS is calculated by dividing the equivalised sum of government transfers; including public pensions and other social insurance benefits, benefits from universal cash transfers, social assistance benefits, as well as the value of in-kind social assistance transfers; by equivalised DHI for the population of children. One value is calculated for each survey making it possible to follow changes in TS over time. Figure 2 shows the mean TS for each country in the dataset. Higher values are accordingly found in Serbia, Russia, South Africa and Brazil, while the lowest scores pertain to Guatemala, India and the Ivory Coast.
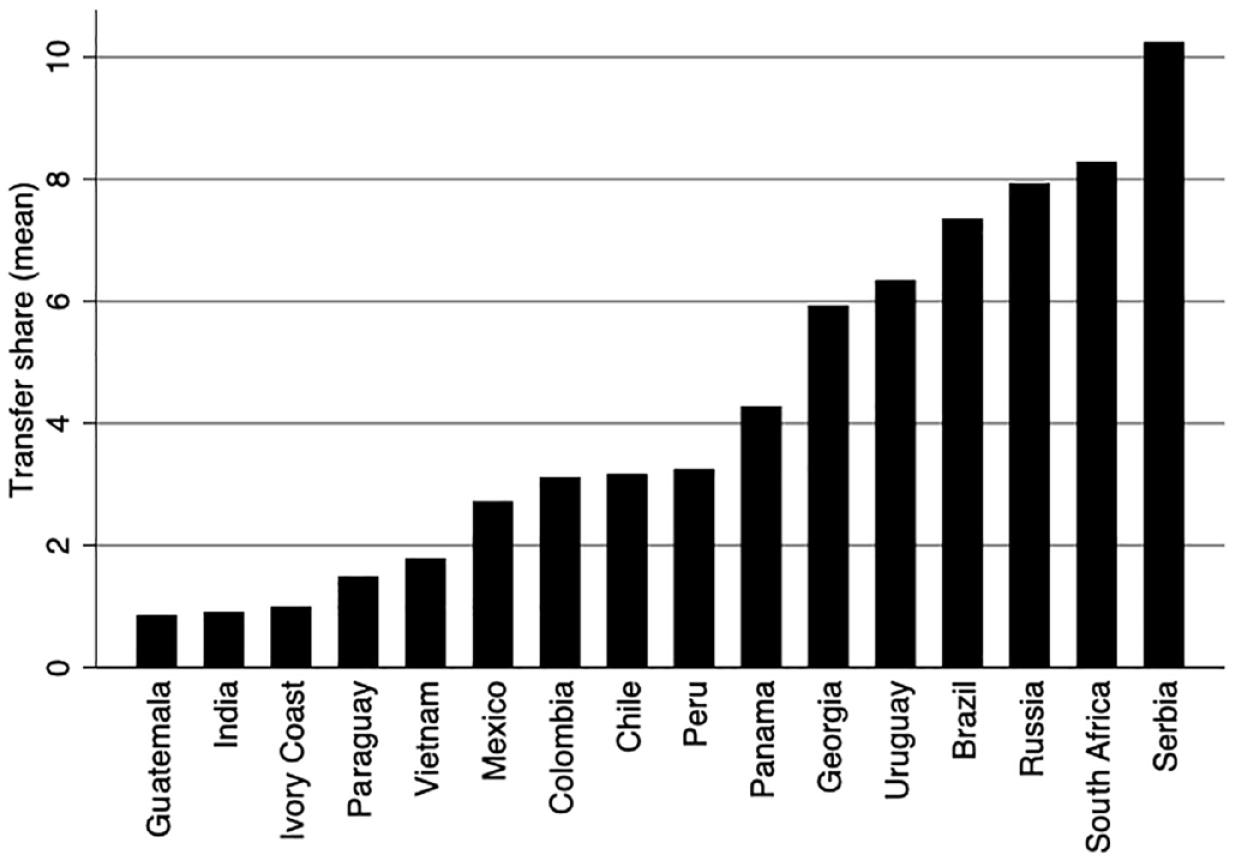
Average share of children’s equivalised disposable household income coming from government transfers in 16 LMICs, mean value of data points from each country.
It should be noted that this measure includes all government transfers received by households with children, including, for example, old-age pensions, in cases where a retired person lives in the same household as a child, reflecting that income pooling within multi-generational households tend to reduce poverty risks among children (e.g. Duflo, 2000), and that other transfers are generally at least as important for reducing child poverty as specifically family oriented schemes (Gornick and Nell, 2018).
The analyses also incorporate a set of potential confounders, chosen based on their prevalence in previous studies on the determinants of child poverty, and calculated based on information in the LIS data files. These indicators reflect previous findings that child poverty tend to be higher in households with more children, among those living in rural areas, in single-parent households, and when adults are not employed (Barrientos and Unnikrishnan, 2018; Gornick and Nell, 2018). Conversely, children living in multi-generational households typically have a lower risk of poverty.
Estimation strategy
The household level data are used to generate macro-level indicators on the relevant variables. Data from all countries in LIS for which at least two waves of data were available, and which were classified by The World Bank as a low- or middle-income country at the time of at least at one of the waves, are compiled into a dataset containing information from 81 surveys from 16 countries unevenly distributed over the time-period from 1990 to 2017 (see Table 4 in the statistical annex) for a list of the datasets and summary statistics). 1
Analysing hierarchically structured data like this, with observations nested within higher level units (countries in this case) comes with a number of well-known challenges. A main issue is that unobserved time-invariant characteristics of countries will influence the error term in regression analyses, thus causing heterogeneity bias. A common procedure to handle these difficulties when analysing cross-section time-series data is to only analyse within-country differences by basing the analyses on differenced data or relying on fixed effects models. For the purposes of this study, as well as in many other comparative analyses of effects of institutional variation, a random effects (RE) model is preferred (Bell and Jones, 2015; Fairbrother, 2014). A main advantage of the RE model is that information pertaining to cross-country variation is not discarded in the analyses. This also means that it is possible to include time-invariant, or slowly changing, variables in the analysis. This is essential as we can assume that not only changes in the rate of cash transfers but also levels, is of relevance for this study.
The main analyses presented below make use of the possibility within the RE framework to explicitly separate between within-unit effects and between-unit effects. This is done by taking the group mean as an indicator of the country level effects, and subtracting the group mean from the original variable to get a demeaned indicator of the within-unit variance. Both indicators are then included in the model, and can be analysed using multilevel regression techniques. This is sometimes referred to as the between-within model (Bell and Jones, 2015). This way it is also possible to create a cross-level interaction term between changes in GDP within a country and the extensiveness of the cash transfers in that country, measured by TS. The models presented below also include a random intercept, meaning that the intercept is allowed to vary across the higher level units. 2 The models are furthermore run with cluster robust variance estimators to account for potential heteroscedastic distribution of the residuals due to the nested character of the data. Following the conventional notation in multilevel modelling, the model can be stated as
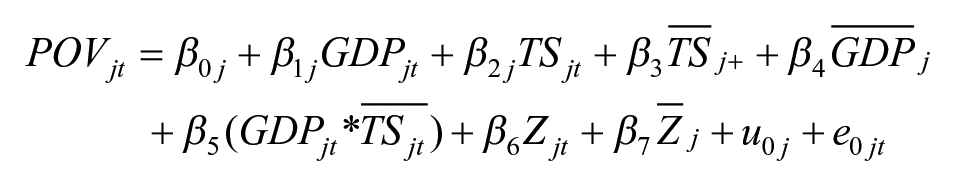
where POVit is the rate in country j at time t, GDPjt and TSjt are variables containing the demeaned level of economic output and government transfers, respectively; while the variables with the subscript j contain the group means of the respective variable. The Z in this case represents the set of control variables introduced in the models, appearing in their group mean and demeaned forms. uoj capture the country-level departure from the overall intercept, and is the same for all observation from each country, followed by an error term denoted e0jt.
To account for the potentially confounding effect of unobserved contextual factors on the interaction effect between GDP growth and the level of the TS, additional analyses have been performed including other contextual variables. Regressions were also run excluding one county at the time, as well as by weighting down cases that contribute with many observations, in order to explore the impact of particularly influential cases. Alternative analyses were also performed that emulates the conventional model for estimating the growth elasticity of poverty in development economics (Adams, 2004; Bourguignon, 2003; Ravallion, 2001), using ordinary least squares (OLS) regression to estimate coefficients based differenced variables. These sensitivity analyses are discussed following the presentation of the main results.
Results
Descriptive analyses
As a first step, associations between annualised changes in the log of GDP and child poverty (equivalent to the growth elasticity of poverty, cf. Adams, 2004), with reference to absolute and relative poverty lines, is presented in Figure 3. The left panel plots changes in child poverty rates, using the US$3.20 poverty line, against economic growth, with fitted lines for three different poverty thresholds. The plot reveals an overall association between growth and child poverty reduction, with a somewhat steeper gradient obtained when using lower poverty thresholds compared to higher ones. The plot moreover displays a considerable dispersion of the observations, indicating that there is substantive heterogeneity in the extent to which economic growth is translated into reductions in absolute child poverty.
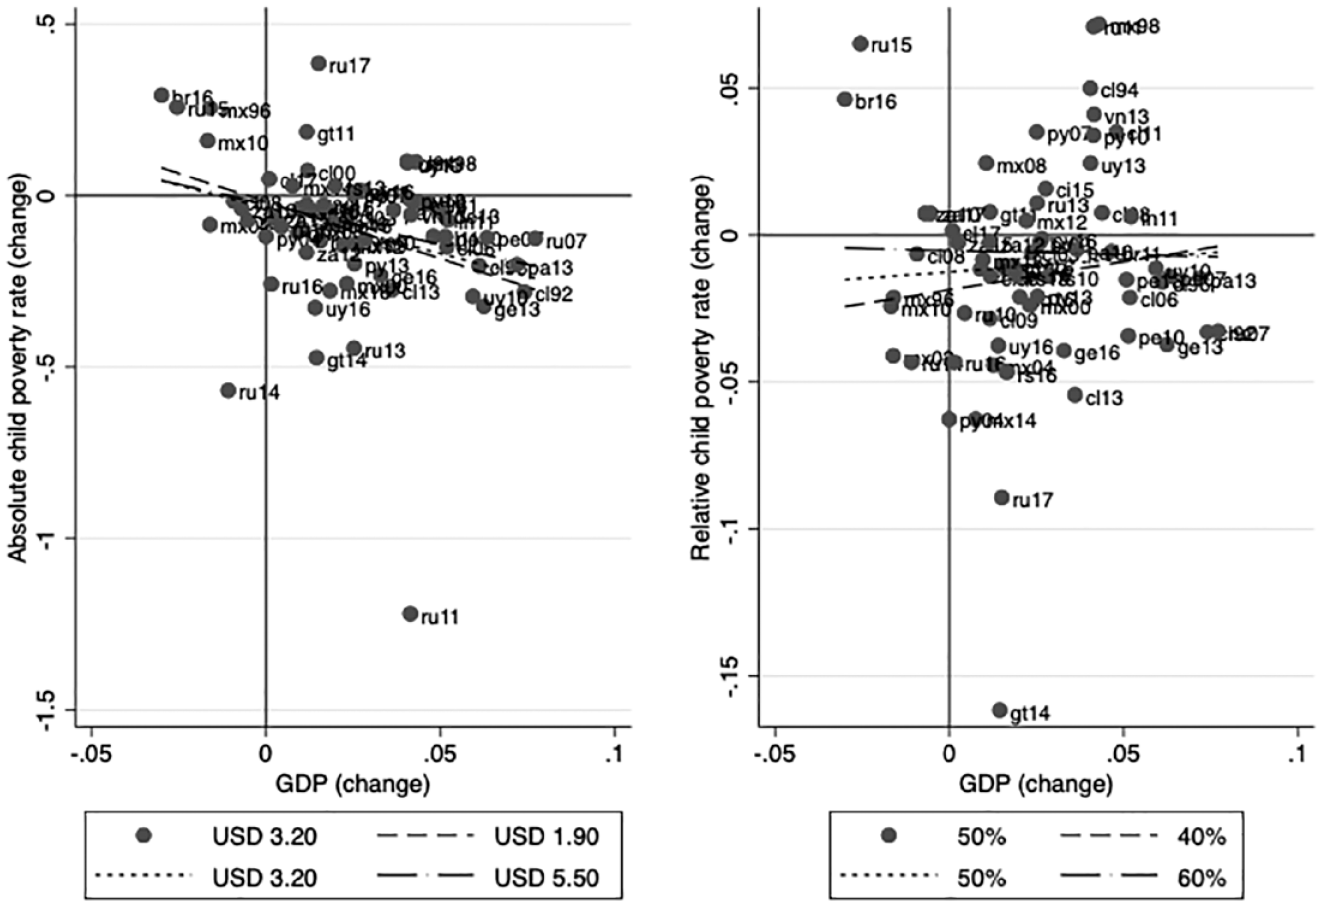
The growth elasticity of absolute and relative child poverty. Scatterplot of annualised change in the log of child poverty and GDP, with fitted lines for different poverty thresholds.
The right-hand panel in Figure 3 presents the equivalent picture when relative poverty lines are used. Here, the dispersion is even wider, with no clear overall pattern. A larger share of cases end up in the top-right quadrant, signalling that increases in relative child poverty seem to have occurred alongside economic growth on several instances. This picture resonates with findings in previous research that growth on average has little effect on the relative incomes of the poor (Dollar et al., 2016; Ravallion, 2020). Lowering the relative poverty threshold tilts the fitted line slightly, from a flat line towards a marginally positive slope.
As a first exploration of whether government transfers are helpful in explaining the observed variation in the growth elasticity of child poverty, Figures 4 and 5 show the same association when the sample is split in two equally sized groups based on the share of public transfers in household incomes. Figure 4 uses absolute poverty lines, again with a focus on the US$3.20 line, but with fitted lines pertaining also to higher and lower thresholds. The differences between the panels are not striking, but the variation is larger and the negative slope somewhat steeper in case of a higher TS. Figure 5 display the corresponding patterns with reference to relative poverty. Here, the difference is more pronounced. In fact, growth seems associated with an increased child poverty rate in the context of a lower TS, particularly when a lower cut-off is employed. Meanwhile, growth seems associated with falling relative child poverty for the cases with higher shares of government transfers, although with a wide spread of observations around the fitted line.
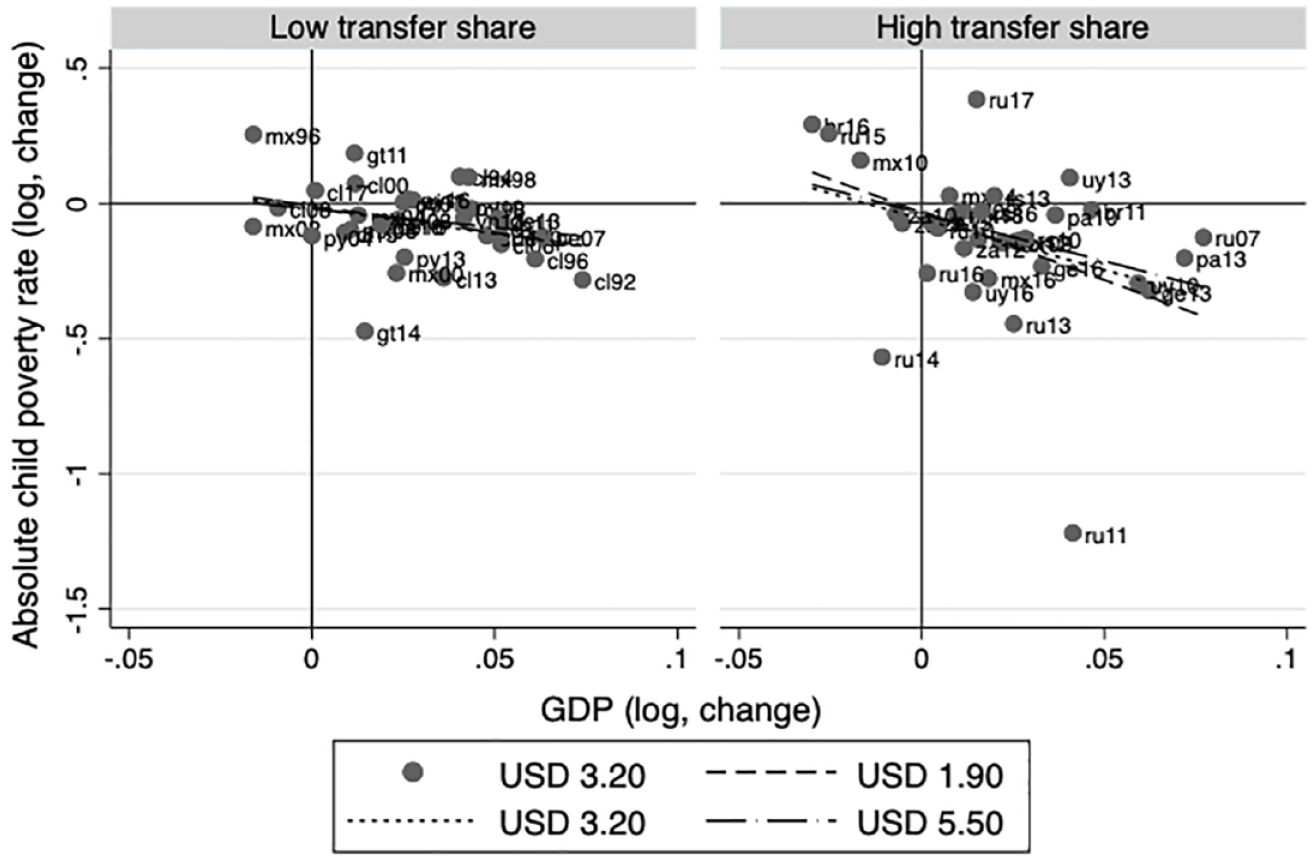
The growth elasticity of absolute child poverty, for high and low levels of the Transfer Share. Scatterplots of annualised change in the log of child poverty and GDP, with fitted lines for different poverty thresholds.
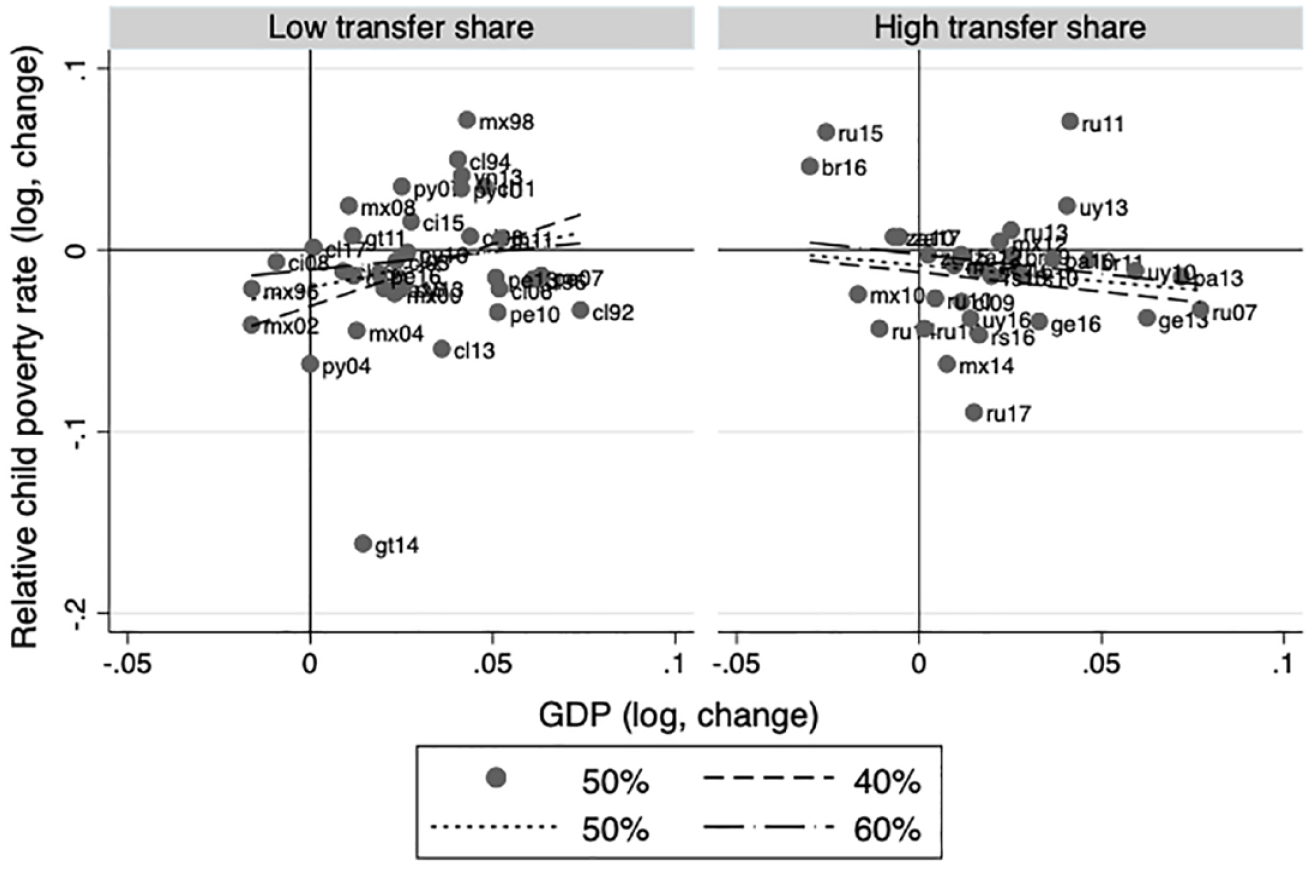
The growth elasticity of relative child poverty, for high and low levels of the Transfer Share. Scatterplots of annualised change in the log of child poverty and GDP, with fitted lines for different poverty thresholds.
Regression analyses
As a second step, the potential interaction between the transfer share and economic growth is explored through multivariate regression techniques. The first model in Table 1 shows the results from regressing absolute child poverty rate on GDP, with a significantly negative coefficient of within-unit variation in GDP, reflecting the bivariate relationship that could be observed from Figure 3. To explore the role of government transfers, Model 2 includes measures of TS, both in the form of a demeaned variable reflecting changes over time and the country-level mean, with results pointing towards an association between expansion of cash transfers and poverty reduction.
Mixed-effects models of absolute child poverty on economic growth and government transfers.
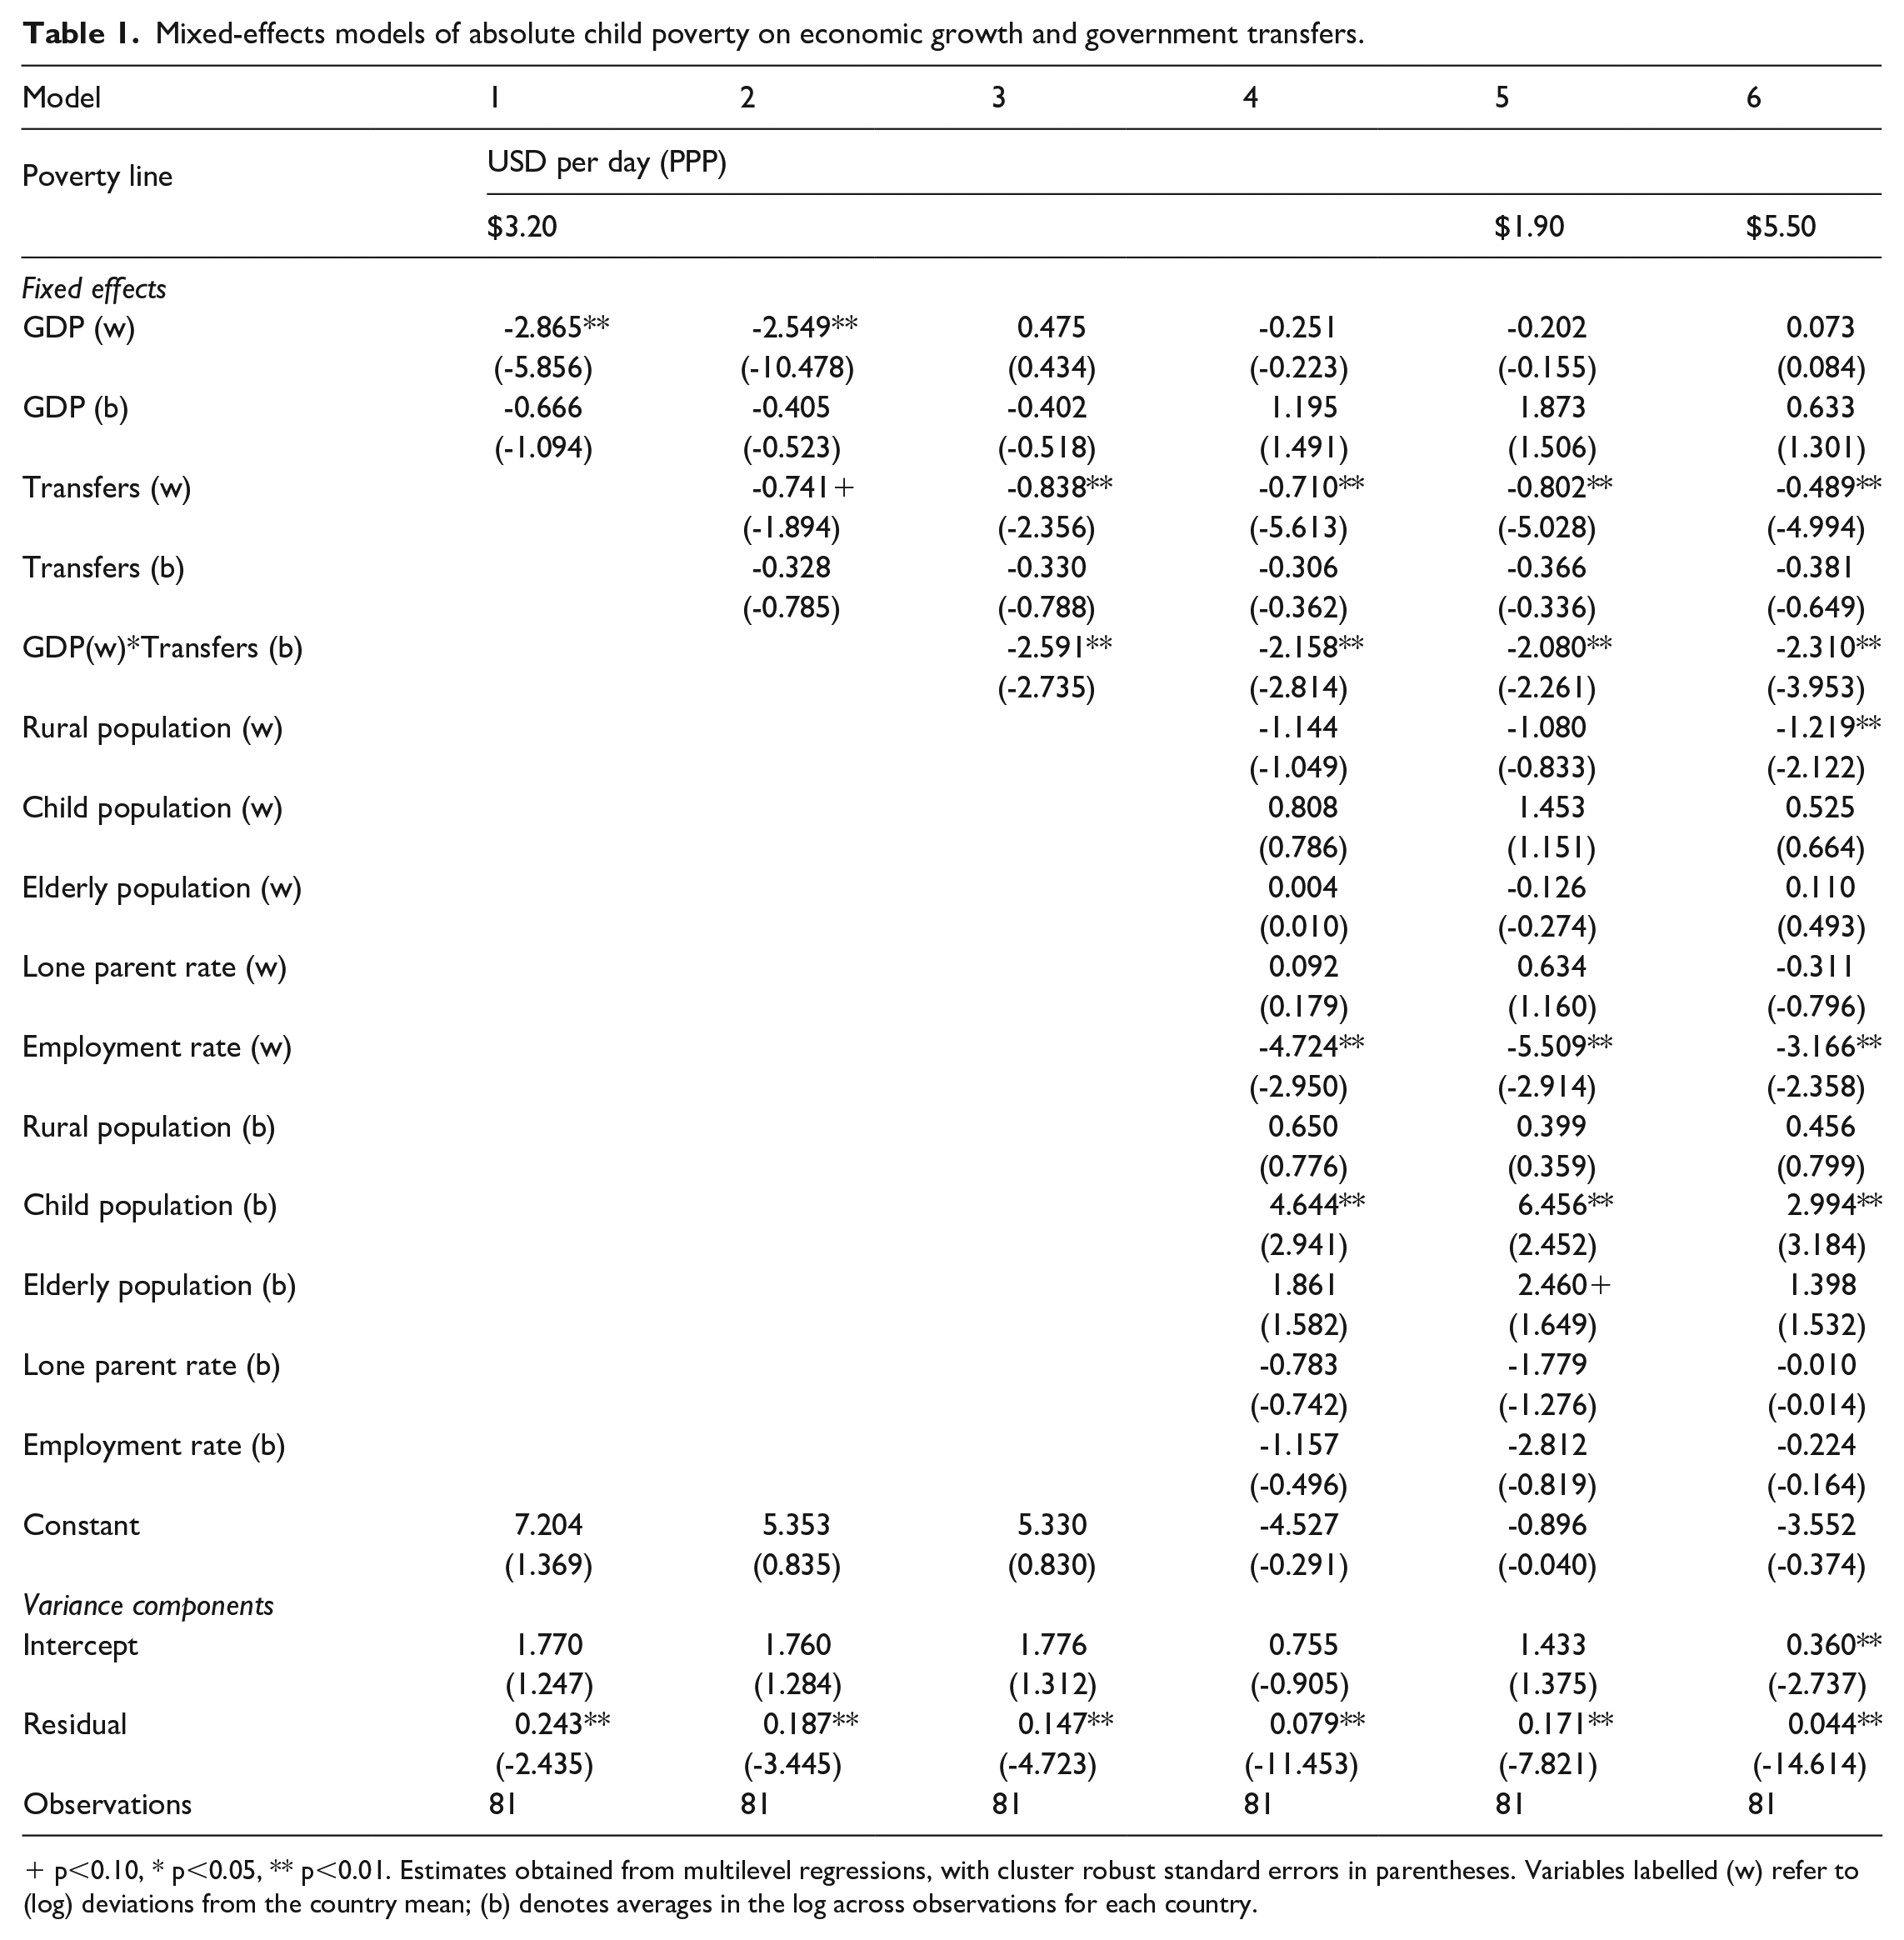
p<0.10, * p<0.05, ** p<0.01. Estimates obtained from multilevel regressions, with cluster robust standard errors in parentheses. Variables labelled (w) refer to (log) deviations from the country mean; (b) denotes averages in the log across observations for each country.
Model 3 introduces an interaction term between the level of TS and economic growth, showing that the association between growth and child poverty reduction seems to be more pronounced at higher levels of TS. Also, the direct effect of government transfers on child poverty is clearly significant in this model. Model 4 tests the robustness of these findings in face of a set of potential confounders. Looking at the coefficients of these variables, only coefficients for employment growth and the relative size of the child population, is within the standard bounds of statistical significance. The inclusion of this set of potential confounders did not alter the main associations referred to above. Results from analyses using the US$1.90 and US$5.50 thresholds are displayed in Models 4 and 5, respectively, showing similar results from those obtained using the US$3.20 line.
Results using relative poverty lines, first set at 50% of median income, are presented in Table 2. The regression coefficient in Model 1 reflects a weak, but still significant, overall association between growth and relative child poverty. The results from including the TS indicators in Model 2 indicate that, like with the absolute poverty rates, the expansion of government transfers is associated with falling relative child poverty rates. When the interaction term is introduced in Model 3, the results hint at a moderation effect, whereby economic growth is more strongly associated lower relative poverty rates in cases with a higher TS, although the estimate has a large standard error. Controls are again added to the analyses in Model 4, with the result that the interaction term comes out as more clearly significant, and with the growth variable turning positive. The share of children in the population is the only significant control variable. Models 5 and 6 replicates this analysis using poverty lines at 40% and 60% of median income, displaying a somewhat larger coefficient of both the original growth variable and the interaction term when a lower threshold is considered.
Mixed-effects models of relative child poverty on economic growth and government transfers.
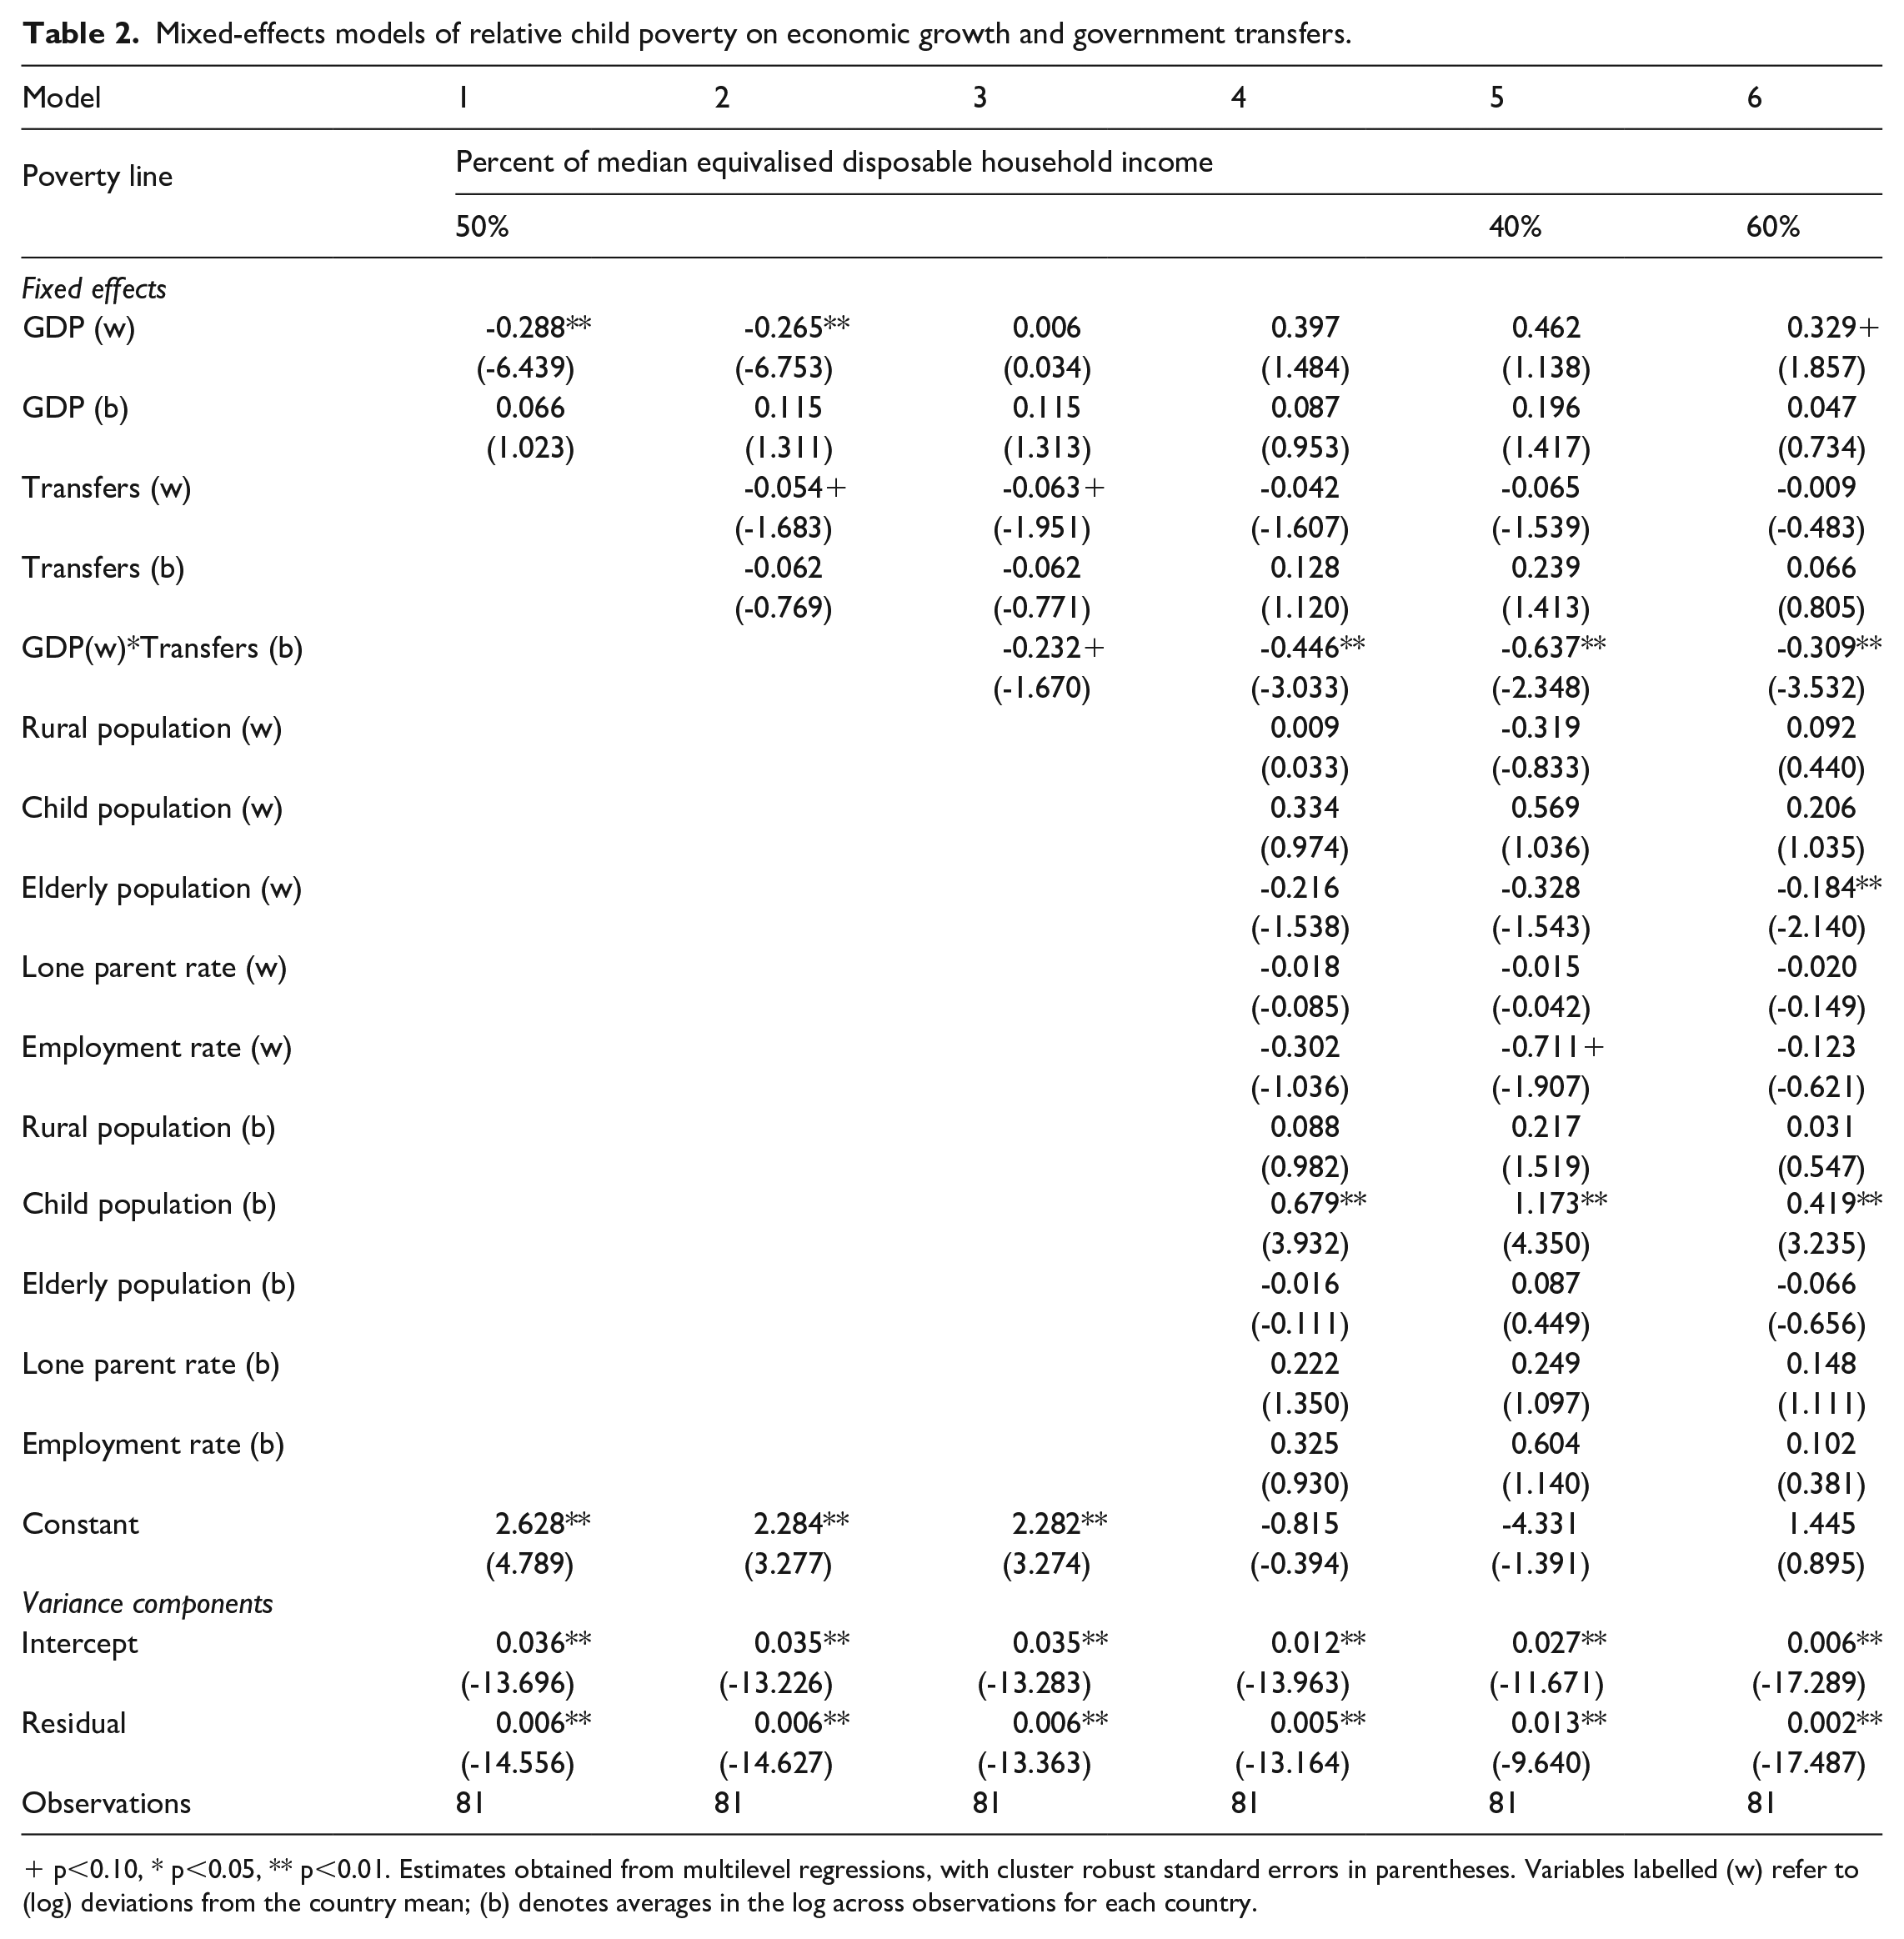
p<0.10, * p<0.05, ** p<0.01. Estimates obtained from multilevel regressions, with cluster robust standard errors in parentheses. Variables labelled (w) refer to (log) deviations from the country mean; (b) denotes averages in the log across observations for each country.
As it might be misleading to draw conclusions about interaction effects based on regression coefficients alone (see Brambor et al., 2006 for a discussion), additional analyses of marginal effects were performed. The left hand panel of Figure 6 displays the marginal effects of growth on the absolute child poverty rate, based on Model 4 in Table 2, for different levels of TS observable in the data. The marginal effects of growth on absolute poverty rates are not evidently negative at the lowest levels of government transfers, but become stronger at higher levels public transfers. This is partly due to a wider bound for statistical significance, with fewer cases at low levels of TS, but it is also a result of a more sizable estimated effect of growth on poverty in the context of a higher TS.
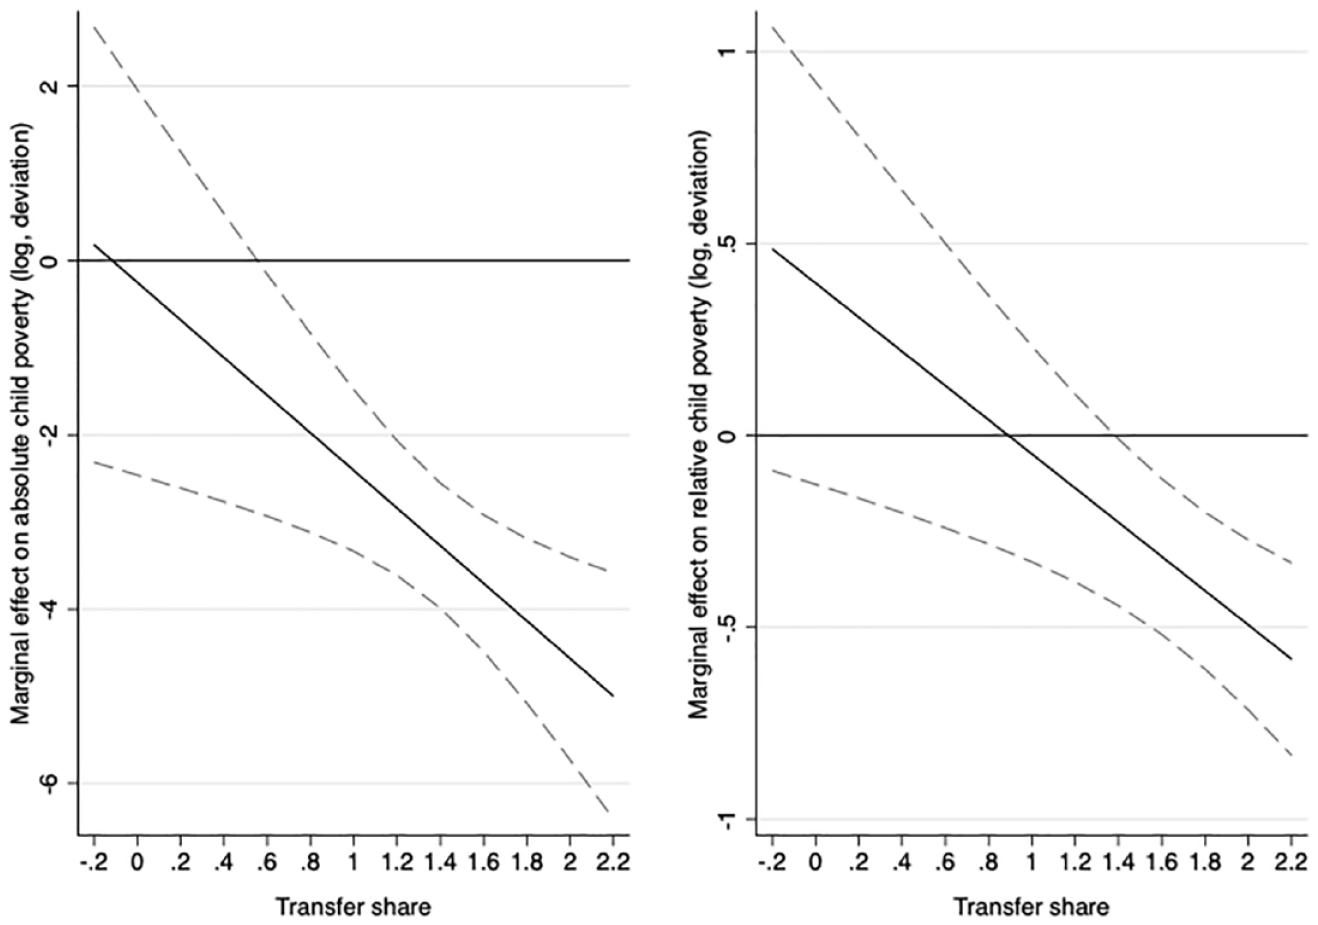
Marginal effects of growth on absolute and relative child poverty, for different levels of the Transfer.
From the right-hand panel of Figure 6, we can observe marginal effects of growth on relative child poverty rates that are positive (although not significantly different from zero) in the absence of government transfers, and negative in face of a higher TS. A value of the log of TS of approximately one, meaning transfers accounting for roughly 2.7% of household income, represents a branching point when the sign of the association changes from positive to negative. A bit more than a fourth of the observations in the sample exhibit transfer shares below this threshold.
Sensitivity analyses
Table 3 explores how using alternative contextual factors, that could potentially have similar interaction effects with GDP growth as the TS, affects the results. The first three models have changes in absolute child poverty as the outcome variable. Model 1 includes and interaction between GDP growth and the level of GDP, following the hypothesis that growth is equalising at higher level of economic development. Model 2 instead introduces and interaction to explore the role of the level of inequality for poverty reduction. As the quality of public institutions is another potential factor that could make economic growth more conducive to reducing child poverty (c.f. Halleröd et al., 2013), Model 3 includes an interaction term between growth and an index of corruption from the V-Dem database (Teorell et al., 2019). Models 4 through 6 repeat the same exercise using a relative poverty measure. The interaction effect between growth and government transfers, as well as direct effect of transfers on absolute poverty remains also when controlling for these alternative interaction effects. The only caveat appears with regard to Model 1 where the interaction effect is only significant at the 10% level. Results are similar also for the alternative poverty thresholds (see Tables 5 and 6 in the annex)
Mixed-effects models of child poverty on economic growth and government transfers, with controls for alternative interaction effects.
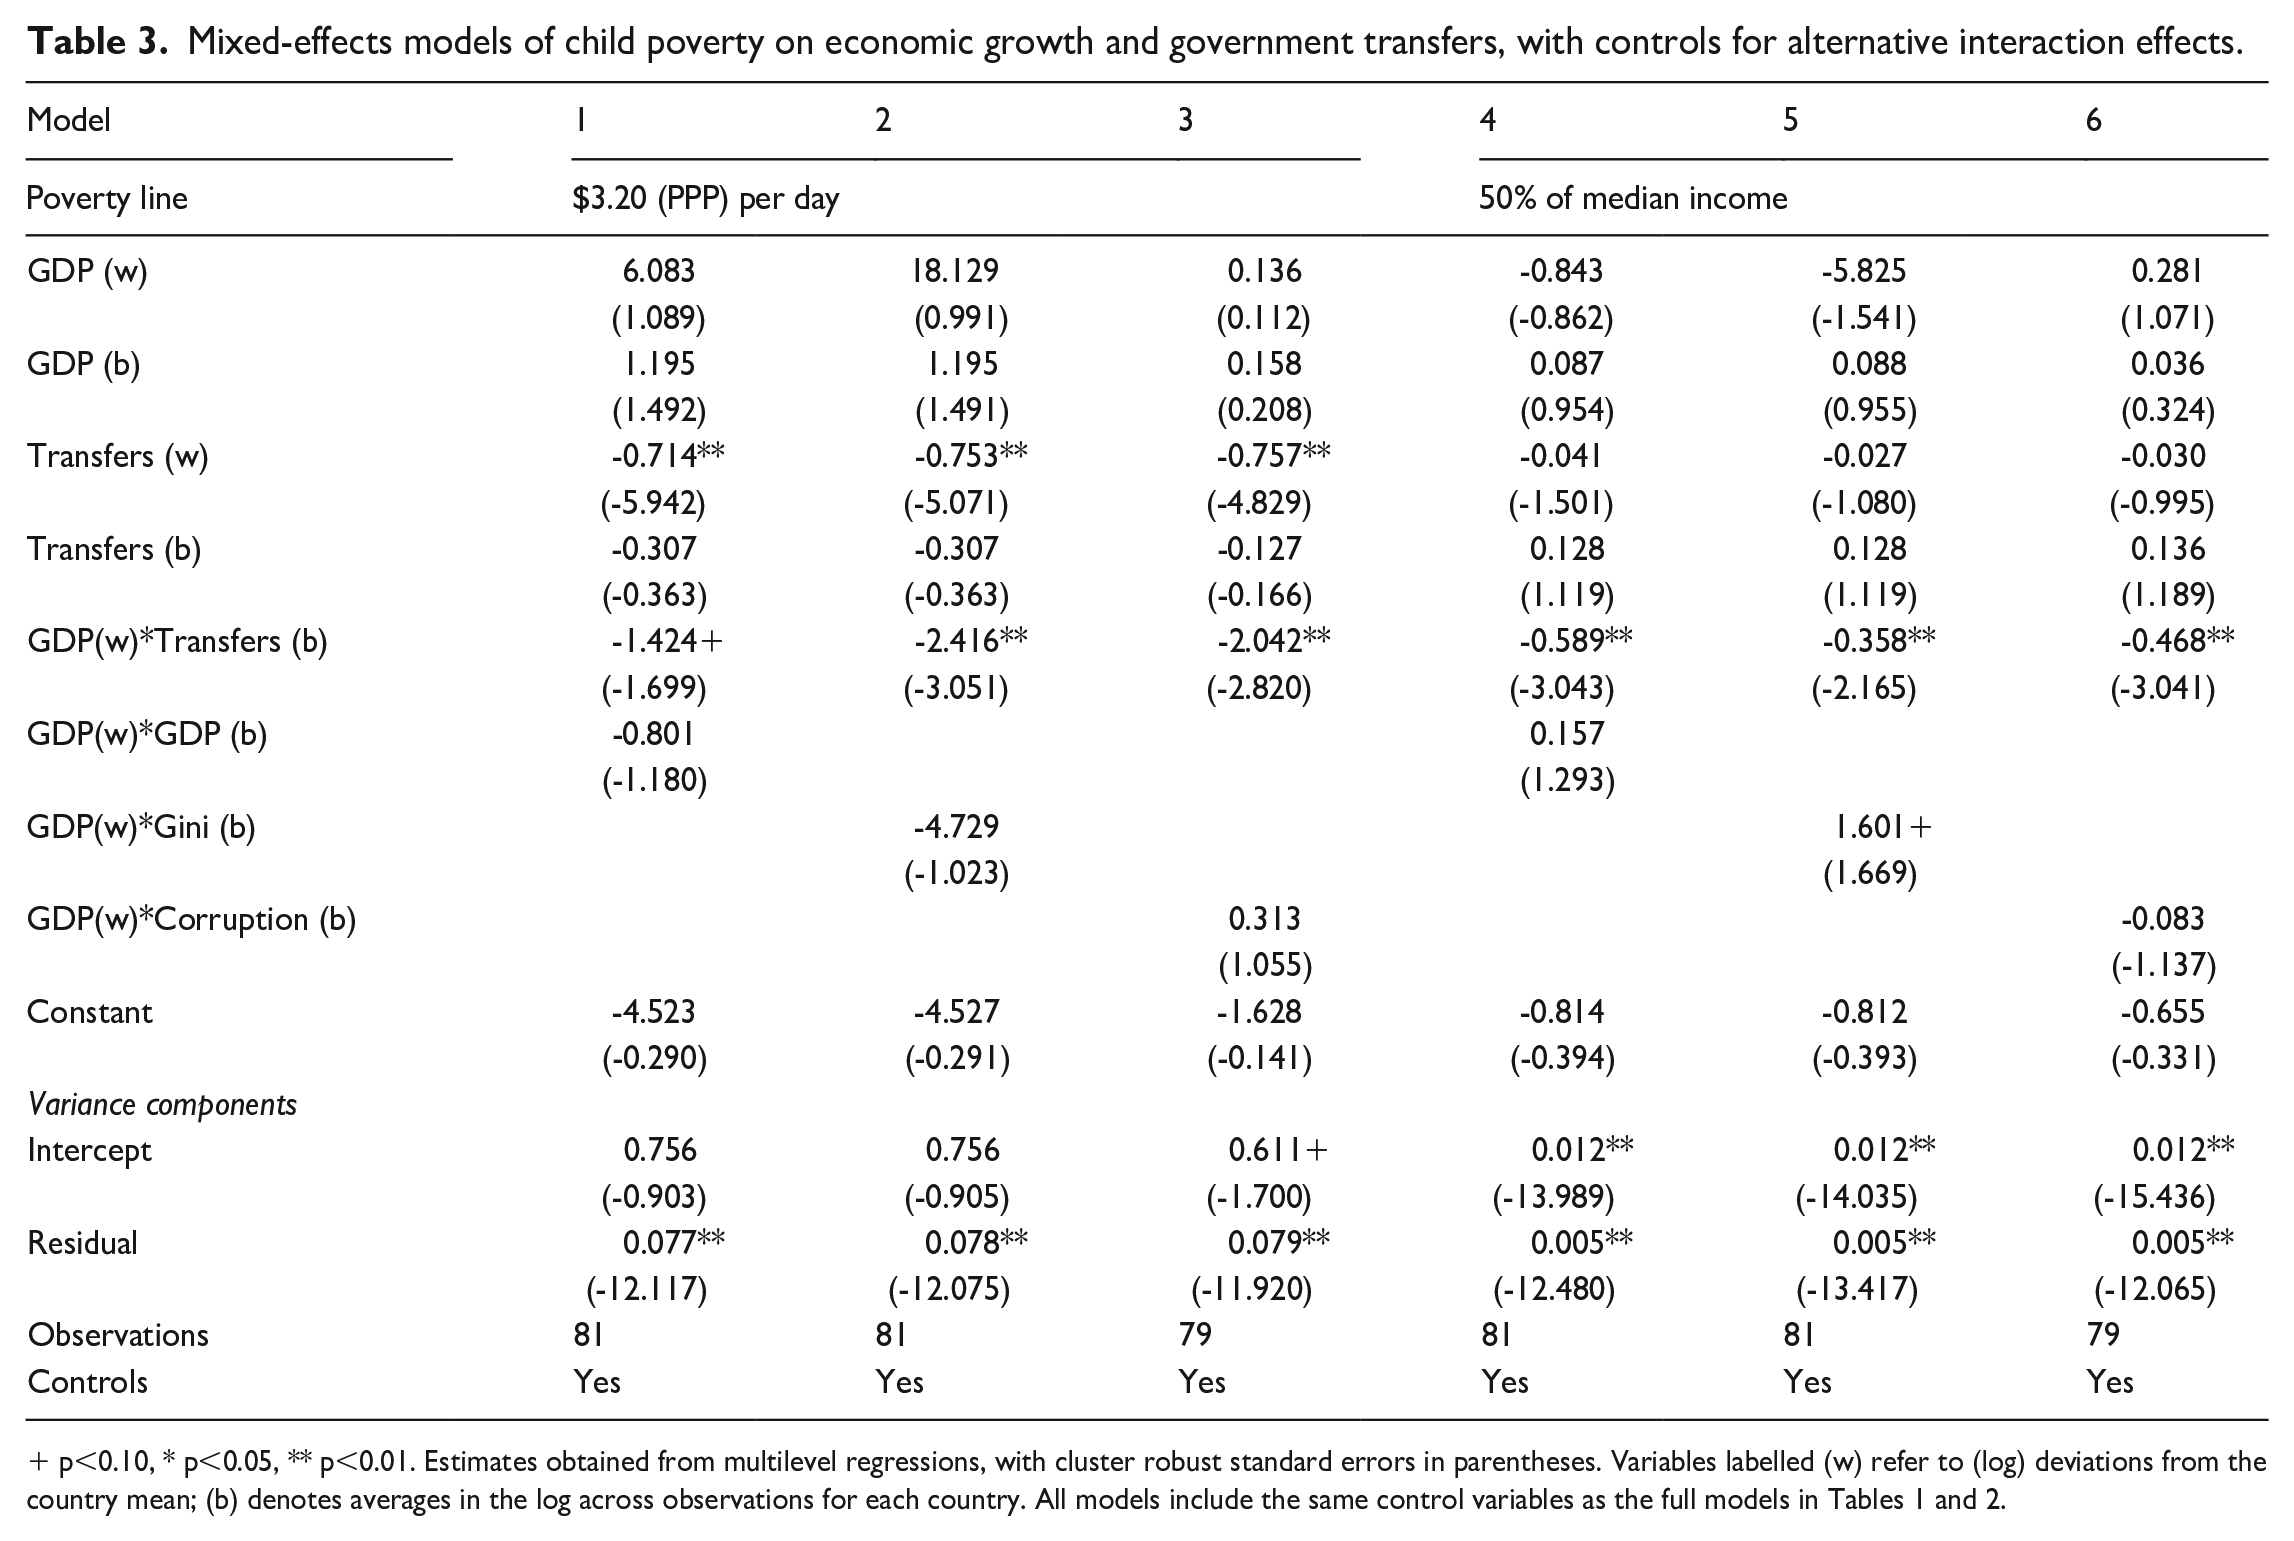
p<0.10, * p<0.05, ** p<0.01. Estimates obtained from multilevel regressions, with cluster robust standard errors in parentheses. Variables labelled (w) refer to (log) deviations from the country mean; (b) denotes averages in the log across observations for each country. All models include the same control variables as the full models in Tables 1 and 2.
As the number of countries in the sample is admittedly limited, and as some countries contribute with more observations than others, additional analyses were also carried out to expose the sensitivity of the results to the exclusion of individual countries. The results are in general robust when excluding one country at the time. Especially, the observed direct association between within-country variation in transfers and absolute poverty is unaffected by this exercise. The interaction effect with regard to absolute child poverty is however diminished once India is excluded from the sample, and is then only significant for the higher threshold at US$5.50. Turning to the relative poverty thresholds, the interaction effect is robust to the exclusion of individual countries when the 50% and 60% thresholds are used, but for the 40 percent line, the interaction affect disappears and is replaced by a direct effect of changing transfers on child poverty when India or Paraguay are excluded.
Another way of limiting the influence of the countries contributing with more observations to the dataset (Mexico, Chile, Russia and Paraguay) without fully excluding them is to give observations from these countries weights calibrated to make the contribution of the country equal to that of a country with the median number of observations. Regressions where run with such weights, and the main results were robust in these models (see Table 7 in the annex).
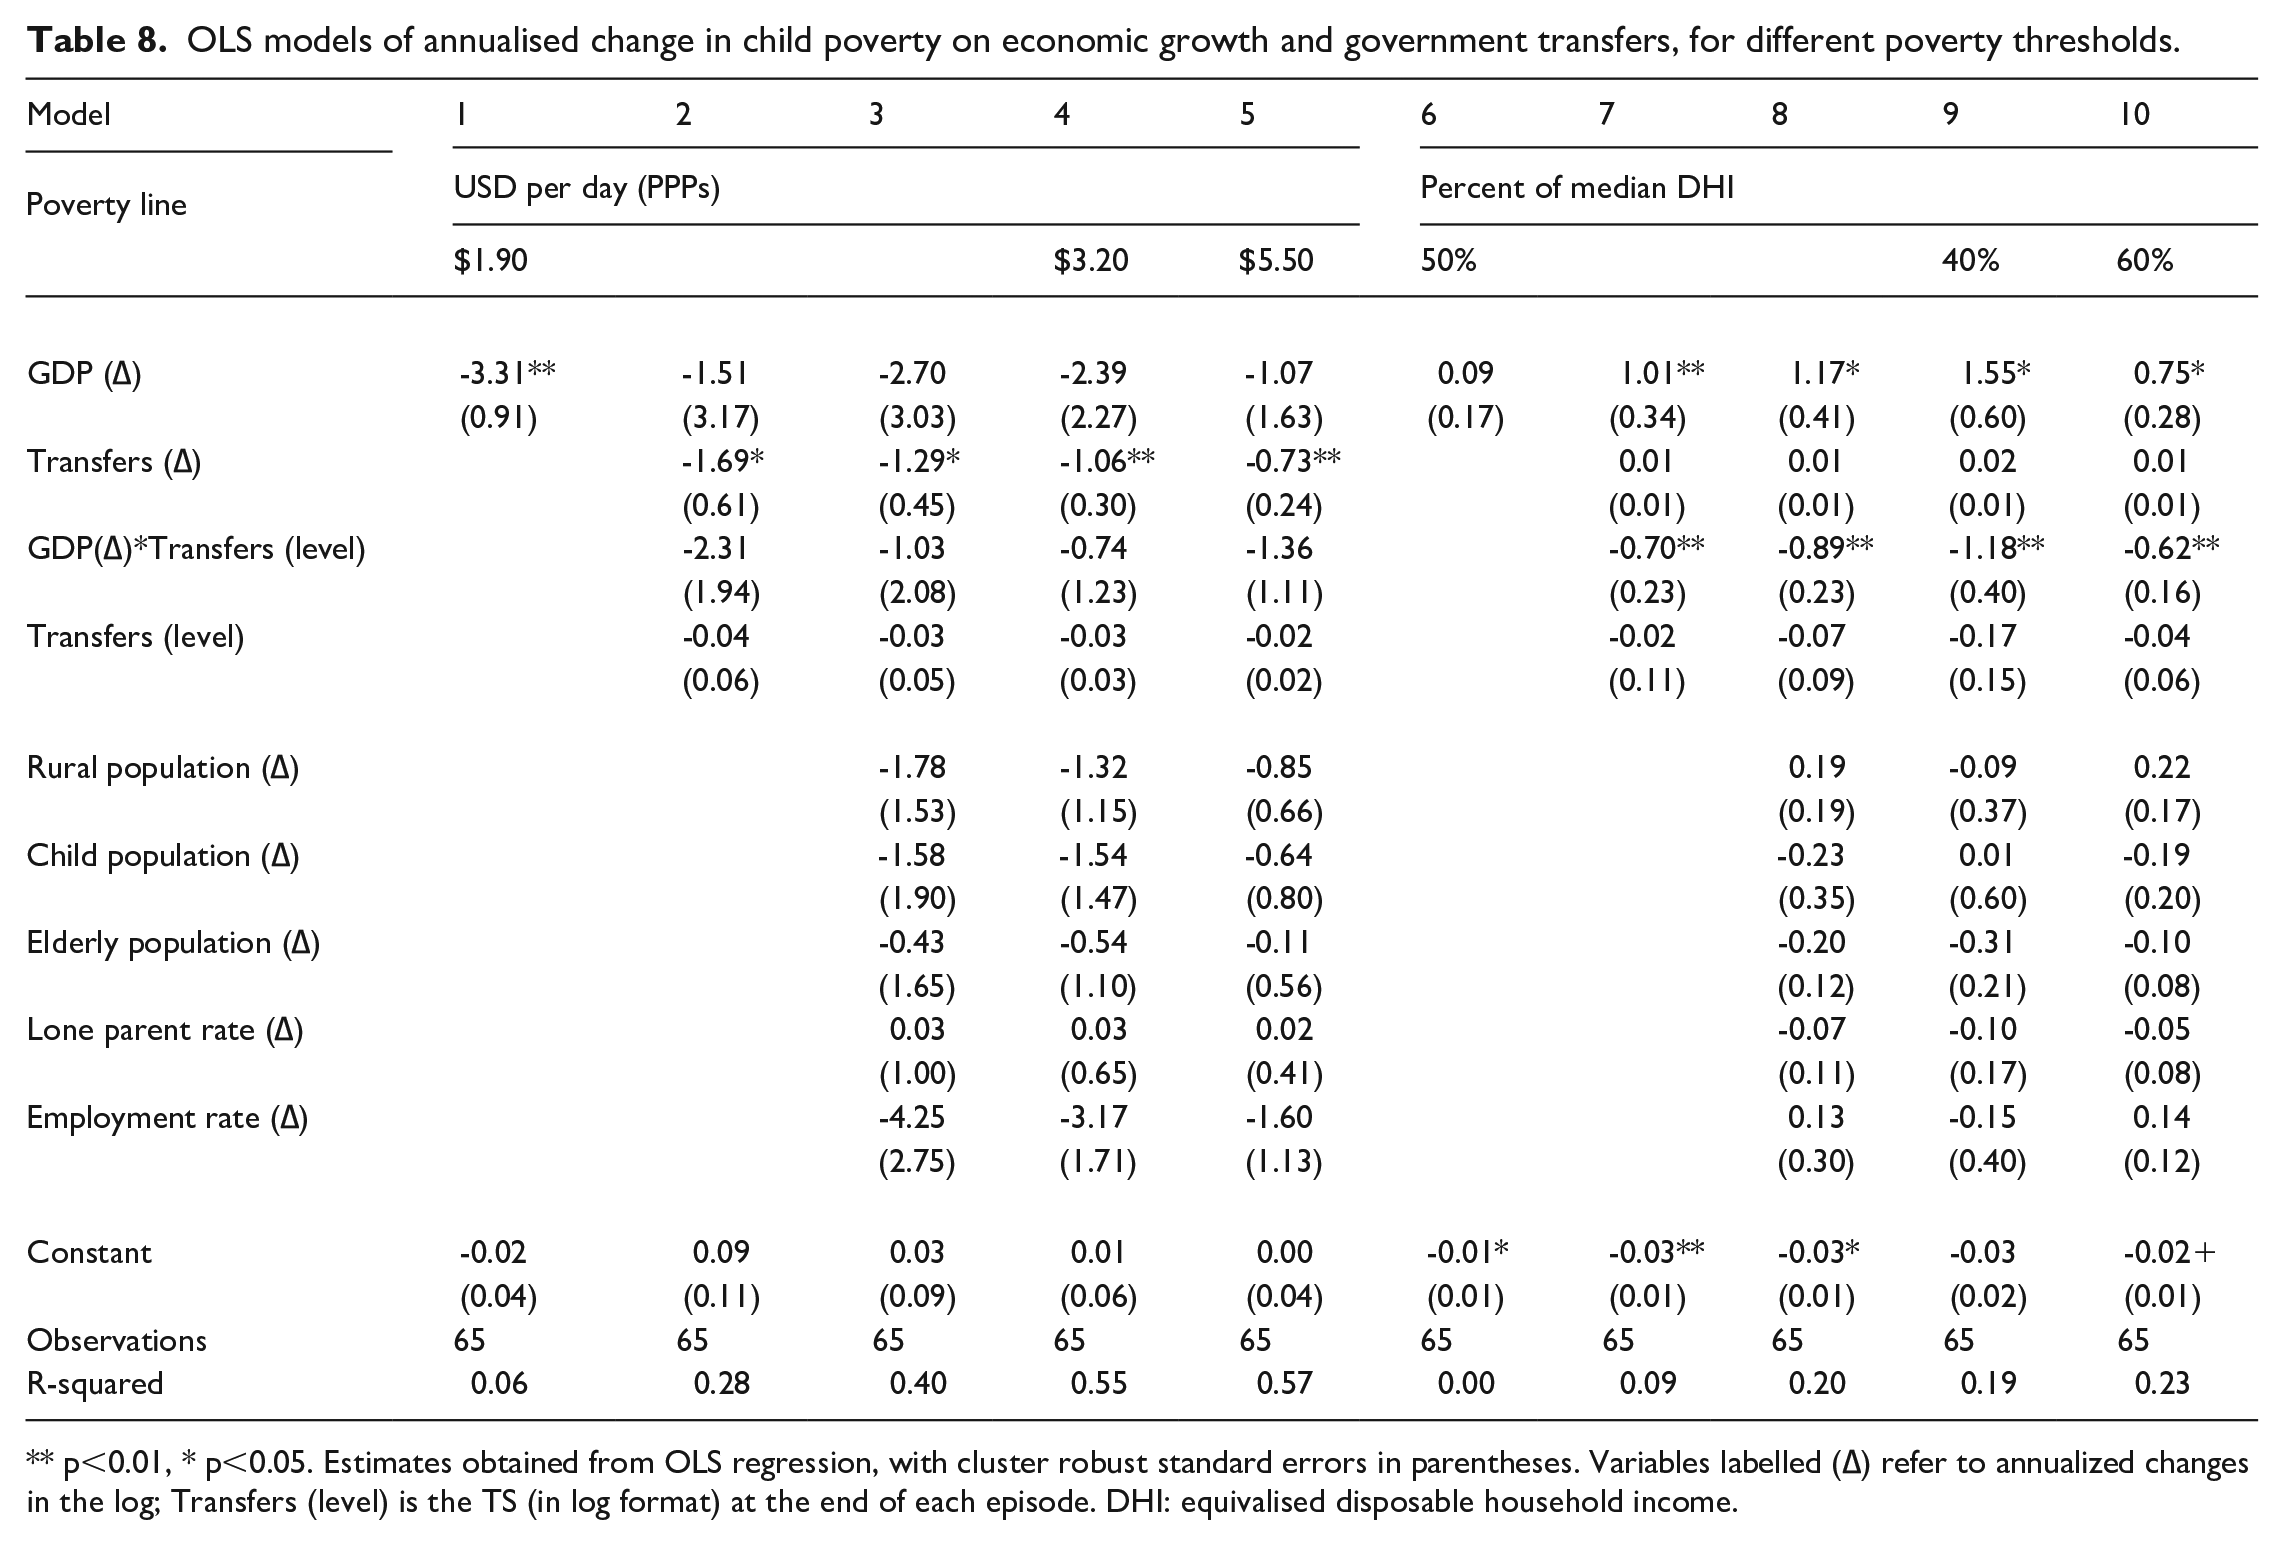
Alternative analyses were also performed that emulates the conventional model for estimating the growth elasticity of poverty in development economics (Adams, 2004; Bourguignon, 2003; Ravallion, 2001). Variables were differenced by taking the annualised changes in the log of the original variable, calculated on the basis of the difference between two adjacent surveys. Estimation results were then obtained using OLS regression, with cluster robust standard errors. These models included an interaction term between GDP growth and the level of TS for each growth spell, alongside differenced versions of the same confounders as in the main analyses. These analyses yielded similar results as those presented earlier (see Table 8 in the annex), with the difference that for absolute poverty the interaction effect was not statistically significant (but like in the models presented above the direct effect of TS was).
Conclusion
Finding the means to forcefully reduce the incidence of child poverty is arguably paramount for the continued pursuit of the Sustainable Development Goals (cf. Clark et al., 2020). While it is commonly held that promoting economic growth is the main route to achieving poverty reduction, it is unlikely that poverty eradication within the nearest decade can be achieved by growth alone (Hoy and Sumner, 2016; Lakner et al., 2020). What is more, the extent to which growth actually results in lower poverty has historically been highly variable. Against this background, and the commitment of the international community to ‘end poverty in all its forms everywhere’ and to ‘leave no one behind’ (UN, 2015), this study has inquired about how government transfers can contribute to making economic growth more inclusive and more conducive towards eradicating child poverty, in absolute as well as in relative terms. Data on the heterogeneity of the association between growth and child poverty across countries, combined with information on the scope of government cash transfers paid out to families with children, is here exploited in order to explore how social protection contributes to strengthen the poverty reducing effect of economic growth, using longitudinal comparative data from a broad sample of LMICs.
The analyses corroborate previous findings of an association between economic growth and reductions in child poverty when absolute measures where used. This association was more muted when poverty was defined in relative terms. The analyses then highlighted that expansions of cash transfer systems during recent decades were found to be linked to reductions in absolute, but not relative, child poverty. Also, the association between economic growth and falling absolute child poverty rates was additionally found to be somewhat stronger in the context of more extensive cash transfer systems, although for the lower poverty thresholds this finding was not entirely robust to alternative model specifications. Finally, economic growth was found to be linked to reductions in the rate of relative child poverty when combined with sufficiently extensive systems of government transfers. In fact, whether the association between growth and relative child poverty was positively or negatively signed seemed conditional upon the extensiveness of transfer systems. This moderating effect of public cash transfers on the growth elasticity of poverty in LMICs has not been documented in previous studies and is arguably a central finding of these analyses. These findings moreover highlight some differences in effects between absolute and relative child poverty. It could be the case that the combination of social protection and favourable economic opportunities is particularly relevant for lifting children in vulnerable households above a poverty line that rise with median incomes. Conversely, the success of the more recent expansion of novel anti-poverty programmes seems reflected in lower rates of absolute, but not relative poverty.
Some of the limitations of the analyses presented point to avenues for further inquiries. Further studies based on data with a wider temporal and geographical coverage, and considering poverty more broadly in the population, should seek to explore the generalisability of these results as well as the potential variance across world-regions and time-periods. With regard to measurement, the transfer share is admittedly a coarse indicator of the quality of social protection systems. Aspects regarding the design and organisation of social protection systems have not been explored empirically here, but could undoubtedly hold a key to better understand how policies contribute to poverty reduction. Also, as a life-course perspective lies at the heart of a child-centred social protection strategy (cf. Black et al., 2017; Clark et al., 2020), future comparative research should ideally seek to incorporate longer term effects, on the level of individuals as well as on societal level. The mechanisms behind the interaction effect between GDP growth and government transfers also remain to be further explored, with attention also to the role of other aspects of social policy, labour market regulation and developmental strategies.
At least tentatively, the results presented here indicate that government transfer schemes are essential components of a global development agenda that emphasises the eradication of child poverty, irrespective of definition. Lane Kenworthy’s (2011) assertion that ‘growth is good for the poor, if social policy passes it on’ (p. 5), seemingly holds some truth also with regard to LMICs, and particularly with reference to relative poverty. In an agenda that puts the equality of childrenf’s life chances at centre stage, government transfers accordingly have an important role to play.
Footnotes
Statistical annex
OLS models of annualised change in child poverty on economic growth and government transfers, for different poverty thresholds.
| Model | 1 | 2 | 3 | 4 | 5 | 6 | 7 | 8 | 9 | 10 |
|---|---|---|---|---|---|---|---|---|---|---|
| Poverty line | USD per day (PPPs) | Percent of median DHI | ||||||||
| $1.90 | $3.20 | $5.50 | 50% | 40% | 60% | |||||
| GDP (∆) | -3.31** | -1.51 | -2.70 | -2.39 | -1.07 | 0.09 | 1.01** | 1.17* | 1.55* | 0.75* |
| (0.91) | (3.17) | (3.03) | (2.27) | (1.63) | (0.17) | (0.34) | (0.41) | (0.60) | (0.28) | |
| Transfers (∆) | -1.69* | -1.29* | -1.06** | -0.73** | 0.01 | 0.01 | 0.02 | 0.01 | ||
| (0.61) | (0.45) | (0.30) | (0.24) | (0.01) | (0.01) | (0.01) | (0.01) | |||
| GDP(∆)*Transfers (level) | -2.31 | -1.03 | -0.74 | -1.36 | -0.70** | -0.89** | -1.18** | -0.62** | ||
| (1.94) | (2.08) | (1.23) | (1.11) | (0.23) | (0.23) | (0.40) | (0.16) | |||
| Transfers (level) | -0.04 | -0.03 | -0.03 | -0.02 | -0.02 | -0.07 | -0.17 | -0.04 | ||
| (0.06) | (0.05) | (0.03) | (0.02) | (0.11) | (0.09) | (0.15) | (0.06) | |||
| Rural population (∆) | -1.78 | -1.32 | -0.85 | 0.19 | -0.09 | 0.22 | ||||
| (1.53) | (1.15) | (0.66) | (0.19) | (0.37) | (0.17) | |||||
| Child population (∆) | -1.58 | -1.54 | -0.64 | -0.23 | 0.01 | -0.19 | ||||
| (1.90) | (1.47) | (0.80) | (0.35) | (0.60) | (0.20) | |||||
| Elderly population (∆) | -0.43 | -0.54 | -0.11 | -0.20 | -0.31 | -0.10 | ||||
| (1.65) | (1.10) | (0.56) | (0.12) | (0.21) | (0.08) | |||||
| Lone parent rate (∆) | 0.03 | 0.03 | 0.02 | -0.07 | -0.10 | -0.05 | ||||
| (1.00) | (0.65) | (0.41) | (0.11) | (0.17) | (0.08) | |||||
| Employment rate (∆) | -4.25 | -3.17 | -1.60 | 0.13 | -0.15 | 0.14 | ||||
| (2.75) | (1.71) | (1.13) | (0.30) | (0.40) | (0.12) | |||||
| Constant | -0.02 | 0.09 | 0.03 | 0.01 | 0.00 | -0.01* | -0.03** | -0.03* | -0.03 | -0.02+ |
| (0.04) | (0.11) | (0.09) | (0.06) | (0.04) | (0.01) | (0.01) | (0.01) | (0.02) | (0.01) | |
| Observations | 65 | 65 | 65 | 65 | 65 | 65 | 65 | 65 | 65 | 65 |
| R-squared | 0.06 | 0.28 | 0.40 | 0.55 | 0.57 | 0.00 | 0.09 | 0.20 | 0.19 | 0.23 |
p<0.01, * p<0.05. Estimates obtained from OLS regression, with cluster robust standard errors in parentheses. Variables labelled (∆) refer to annualized changes in the log; Transfers (level) is the TS (in log format) at the end of each episode. DHI: equivalised disposable household income.
Funding
The author(s) disclosed receipt of the following financial support for the research, authorship, and/or publication of this article: This work was supported by the Swedish Reasearch Council for Health, Working Life and Welfare (Forte), Grant/Award Number: 2012-1708.
Notes
Author biography
Sebastian Sirén is a postdoctoral researcher at the School of Business, Society and Engineering, Mälardalen University, with a background in comparative welfare state research from the Swedish Institute for Social Research (SOFI) at Stockholm University. His main research interest is the causes and consequences of social policy institutions and the political economy of their evolution, in rich and poor countries alike.