
Abstract
In this research work, recycled high-density polyethylene (rHDPE)/silicon carbide (SiC) composites were produced by melt compounding followed by injection moulding technique. It has been revealed from the mechanical properties that the addition of SiC increases the hardness, density, flexural strength of the composite and tensile strength of the composite. The impact strength at 15 wt-% SiC composite gives the best results. From the thermal analysis, it was observed that the addition of SiC in rHDPE increases the melting point and total enthalpy of crystallisation. The residual value of rHDPE composites increases with the rise in filler loading which enhances the thermal stability of the composites. Melt flow index (MFI) decreases with the increased in silicon carbide. The heat deflection temperature (HDT) increased with the loading of filler content. The contact angle analysis revealed the hydrophilic nature of the composite. MFI reduced with the incorporation of filler content. The SEM images concluded the agglomeration of the composite at higher filler fractions. These results confirm the possibility of using rHDPE/SiC composite to produce various parts for household commodities and structural applications.
Keywords
Introduction
Polypropylene and polyethylene make up the majority of the plastic in household solid waste. 1 The largest consumer of polymeric materials like plastics is the packaging industry. Even though materials are recycled materials like paperboard, glass and aluminium have been used rather frequently, recycling of Polymer technology has not yet matured due to the vast range of polymeric materials accessible. 2 To lessen the impact on the environment and the use of virgin resources, efforts have been made to recycle post-consumer based plastics. 3 More strategies to recycle the plastic solid waste are still to be tried. All of them – primary, secondary, tertiary and quaternary – are discussed in Al-Salem (2010). When plastic things are thrown away after a while cycles and contemporary mechanical recycling techniques themselves as a potential user of a % of garbage that is recycled or used as filler. 4 Physical treatment is a component of mechanical recycling (also known as secondary or material recycling), whereas chemical recycling and treatment (also known as tertiary, which includes feedstock recycling) generates compounds used as feedstock for the chemical business. 5 Since polyethylene goods are difficult to decompose and persist in the environment for a long time, the rising usage of polyethylene products in recent decades has resulted in a significant increase in solid waste generation.3,6 Therefore, finding new applications for recycled polyethylene is crucial to reducing waste. Due to its excellent dimensional, mechanical and thermal resilience, HDPE is a typical example of recycled polyethylene that is now available.3,7 Additionally, the average cost of manufacturing plastic goods from recycled HDPE (rHDPE) is between 31% and 34% lower than that of manufacturing them from virgin HDPE. 7 As a result, utilizing rHDPE not only alleviates waste disposal problems, but also lowers the price of products made from HDPE. 8 Due to the fact that landfills can take up to a thousand years to breakdown plastics made of petroleum, plastic waste causes major environmental issues. 9 Environmentalists worry that recycling plastic garbage will not only use less energy and virgin resources, but also less post-consumer waste and the disposal of post-industrial plastic trash. 10
Numerous scientists are investigating the blending of recycled plastic, including Avila and Duarte 11 worked in recycled PET/HDPE composites. It describes thermos-mechanical properties of recycled plastic bottles that are made of polyethylene terephthalate (PET) blends with HDPE for engineering purposes. The results showed good performance for compression and machinability. Rafey et al. 12 developed HDPE/PBS/HDPE-g-MA composite through injection moulding technique. The results revealed that the elongation at break, the impact strength and hardness of the composite were enhanced by increasing PBS and HDPE-g-MA. The thermal properties showed decrease in the crystallinity with the addition of PBS and thus results in decrease in melt flow index (MFI). Lei et al. 13 worked on the properties of recycled HDPE/natural fibre composites. The results showed that the modulus and impact strength of the developed composites gives maximum with the addition of maleated polyethylene (MAPE). The composite shows less thermal stability than rHDPE. Techawinyutham et al. 14 found that incorporation of PETG in blending of LDPE and HDPE enhanced the mechanical properties and MFI but reduced thermal stability, storage modulus, loss modulus and complex viscosity of neat LDPE and neat HDPE. However, LDPE/PETG composite shows better impact strength and flexibility as compare to HDPE/PETG composite. Ibitoye et al. 15 worked on the mechanical properties of rHDPE/SiC composite. The results concluded that the addition of SiC increases the tensile and impact strength and the modulus of elasticity and stiffness of the rHDPE/SiC composite also increases. However, the ductility decreases whereas the brittleness of the composite increases. It has been observed that the 5 wt-% and 15 wt-% SiC enhanced the mechanical properties of the rHDPE/SiC composite. Xiaolin et al. 16 observed that crystallinity of the treated wood straw fibre improved. The tensile strength, flexural strength, and flexural modulus increased with nano-SiC content of 0.4 wt-% with treated wheat straw fibre (WSF)-reinforced high-density polyethylene (HDPE) composites. CARDOSO et al. 17 found that the deformation and tensile strength, and impact strength were reduced whereas the hardness increased with the addition of alumina and silicon carbide (SiC) particles. Rana et al. 18 worked with HDPE reinforced with Al–SiC particles. The results showed that the optimum mechanical properties achieved with the addition of 40 wt-% of aluminium powder and SiC particles. Zang et al. 16 worked with nano-SiC/WSF/HDPE hybrid composites. The results concluded that the crystallinity of the treated WSFs composites increased compared with untreated fibre-reinforced composites. The mechanical properties of composites showed optimum results with 0.4 wt-% nano-SiC content. The tensile strength, flexural strength, and flexural modulus enhanced by 15.5%, 11.5% and 12.4%, respectively. The water absorption increased, however, decreased the thermal stability. SEM revealed that the addition of nano-SiC reduced the cracks and pores on composite surface. Sahu and Sreekanth 19 used FEM based representative volume element approach to evaluate tensile properties of SiC-reinforced recycled HDPE. The results found that the rHDPE/30% SiC composite found to be maximum equivalent stress of 4.1133 MPa and it reduced to 13.8, 7.8 and 6.85 for rHDPE/10% SiC, rHDPE/15% SiC and rHDPE/20% SiC composite, respectively. Singh et al. 20 investigate thermomechanical properties of rHDPE/SiC/Al2O3 composites. The feed stock filament was prepared using single-screw extrusion and overpowered to tensile test. After obtaining tensile test results, multifactor optimisation has been performed. The results found that the developed composite FDM filament has potential for possible applications as rapid tooling. Singh et al. 21 worked with Al2O3 and SiC-reinforced recycled HDPE. A sacrificial pattern (SP) for investment casting were made by 3D printing (using fused deposition modelling (FDM) machine) from rHDPE blended with Al2O3 and SiC particles in various proportions. These SP were used for making of sandwiched composite material (SCM). The casted prototypes as SCM were studied for various tests such as surface hardness, porosity and grain size measurement. The results found hardness of 34.9 HV and porosity of 6.165 for industrial applications.
In this work, composites based on recycled high-density polyethylene (rHDPE) and SiC were prepared by melt compounding followed by injection moulding and effect of SiC particles on the mechanical properties, thermal properties, structural properties and morphological properties of the developed rHDPE/SiC composites were investigated.
Experimental techniques
Some remarks must be addressed before going on to describe the experimental procedure described in this study. The polymers utilised in this paper are immiscible, and the recycling process is mostly thermo-mechanical. The goal of this project is to create a totally recycled polymeric matrix composite that may be used in engineering applications without the use of any stabilisers, compatibilisers or additives.
Materials
The recycled polymer materials of high-density polyethylene (rHDPE) were collected from CIPET-IPT Bhubaneswar. The grade of HDPE was InnoPlus HD6200B from PTT Global Chemical Public Co., Ltd in Thailand, and had specific gravities of 0.962, and melt flow rates of 0.45 g per 10 min. The SiC (200 mesh particle size) was procured from Sigma Aldrich by Merck from local vendor.
Composite formulation
HDPE is recycled material that is obtained from the waste HDPE pipe. The recycled HDPE (rHDPE) is first cut into pieces, washed for un-contamination of polymer, dried in sunlight for 4–5 hours and then put into machine cutter. In the machine cutter, the rHDPE is cut into small pieces. The calculated amounts of small pieces are dried in the oven at 60 °C for 4–5 hours for preheating, to remove moisture from the material. The rHDPE is compounded with different weight percentages of SiC particulates (5 wt-%, 10 wt-%, 15 wt-%, 20 wt-%) in a twin-screw extruder (PTW 16, Thermo Electron Corpo, Germany) with D = 15 mm and L/D = 25:1. rHDPE and SiC particles were added through two feeders. The temperature of the six sections of the extruder barrel and die (3 mm), was set at 180 °C, 185 °C, 195 °C, 200 °C, 210 °C and 210 °C, respectively, with screw speed of 150 rpm, processing temperature of 232 °C and pressure of 20 bars. The strands that are coming out from the extruder were cooled in water bath and cut into pellets. All the specimens were moulded by micro Compounder (X plore, 15 ml, DSM, Netherland) machine with a 38-N platen force. The processing temperature was fixed at 225 °C in the barrel and 235 °C at the nozzle, however the mould was maintained at 37 °C. The complete sample preparation is shown in Figure 1.
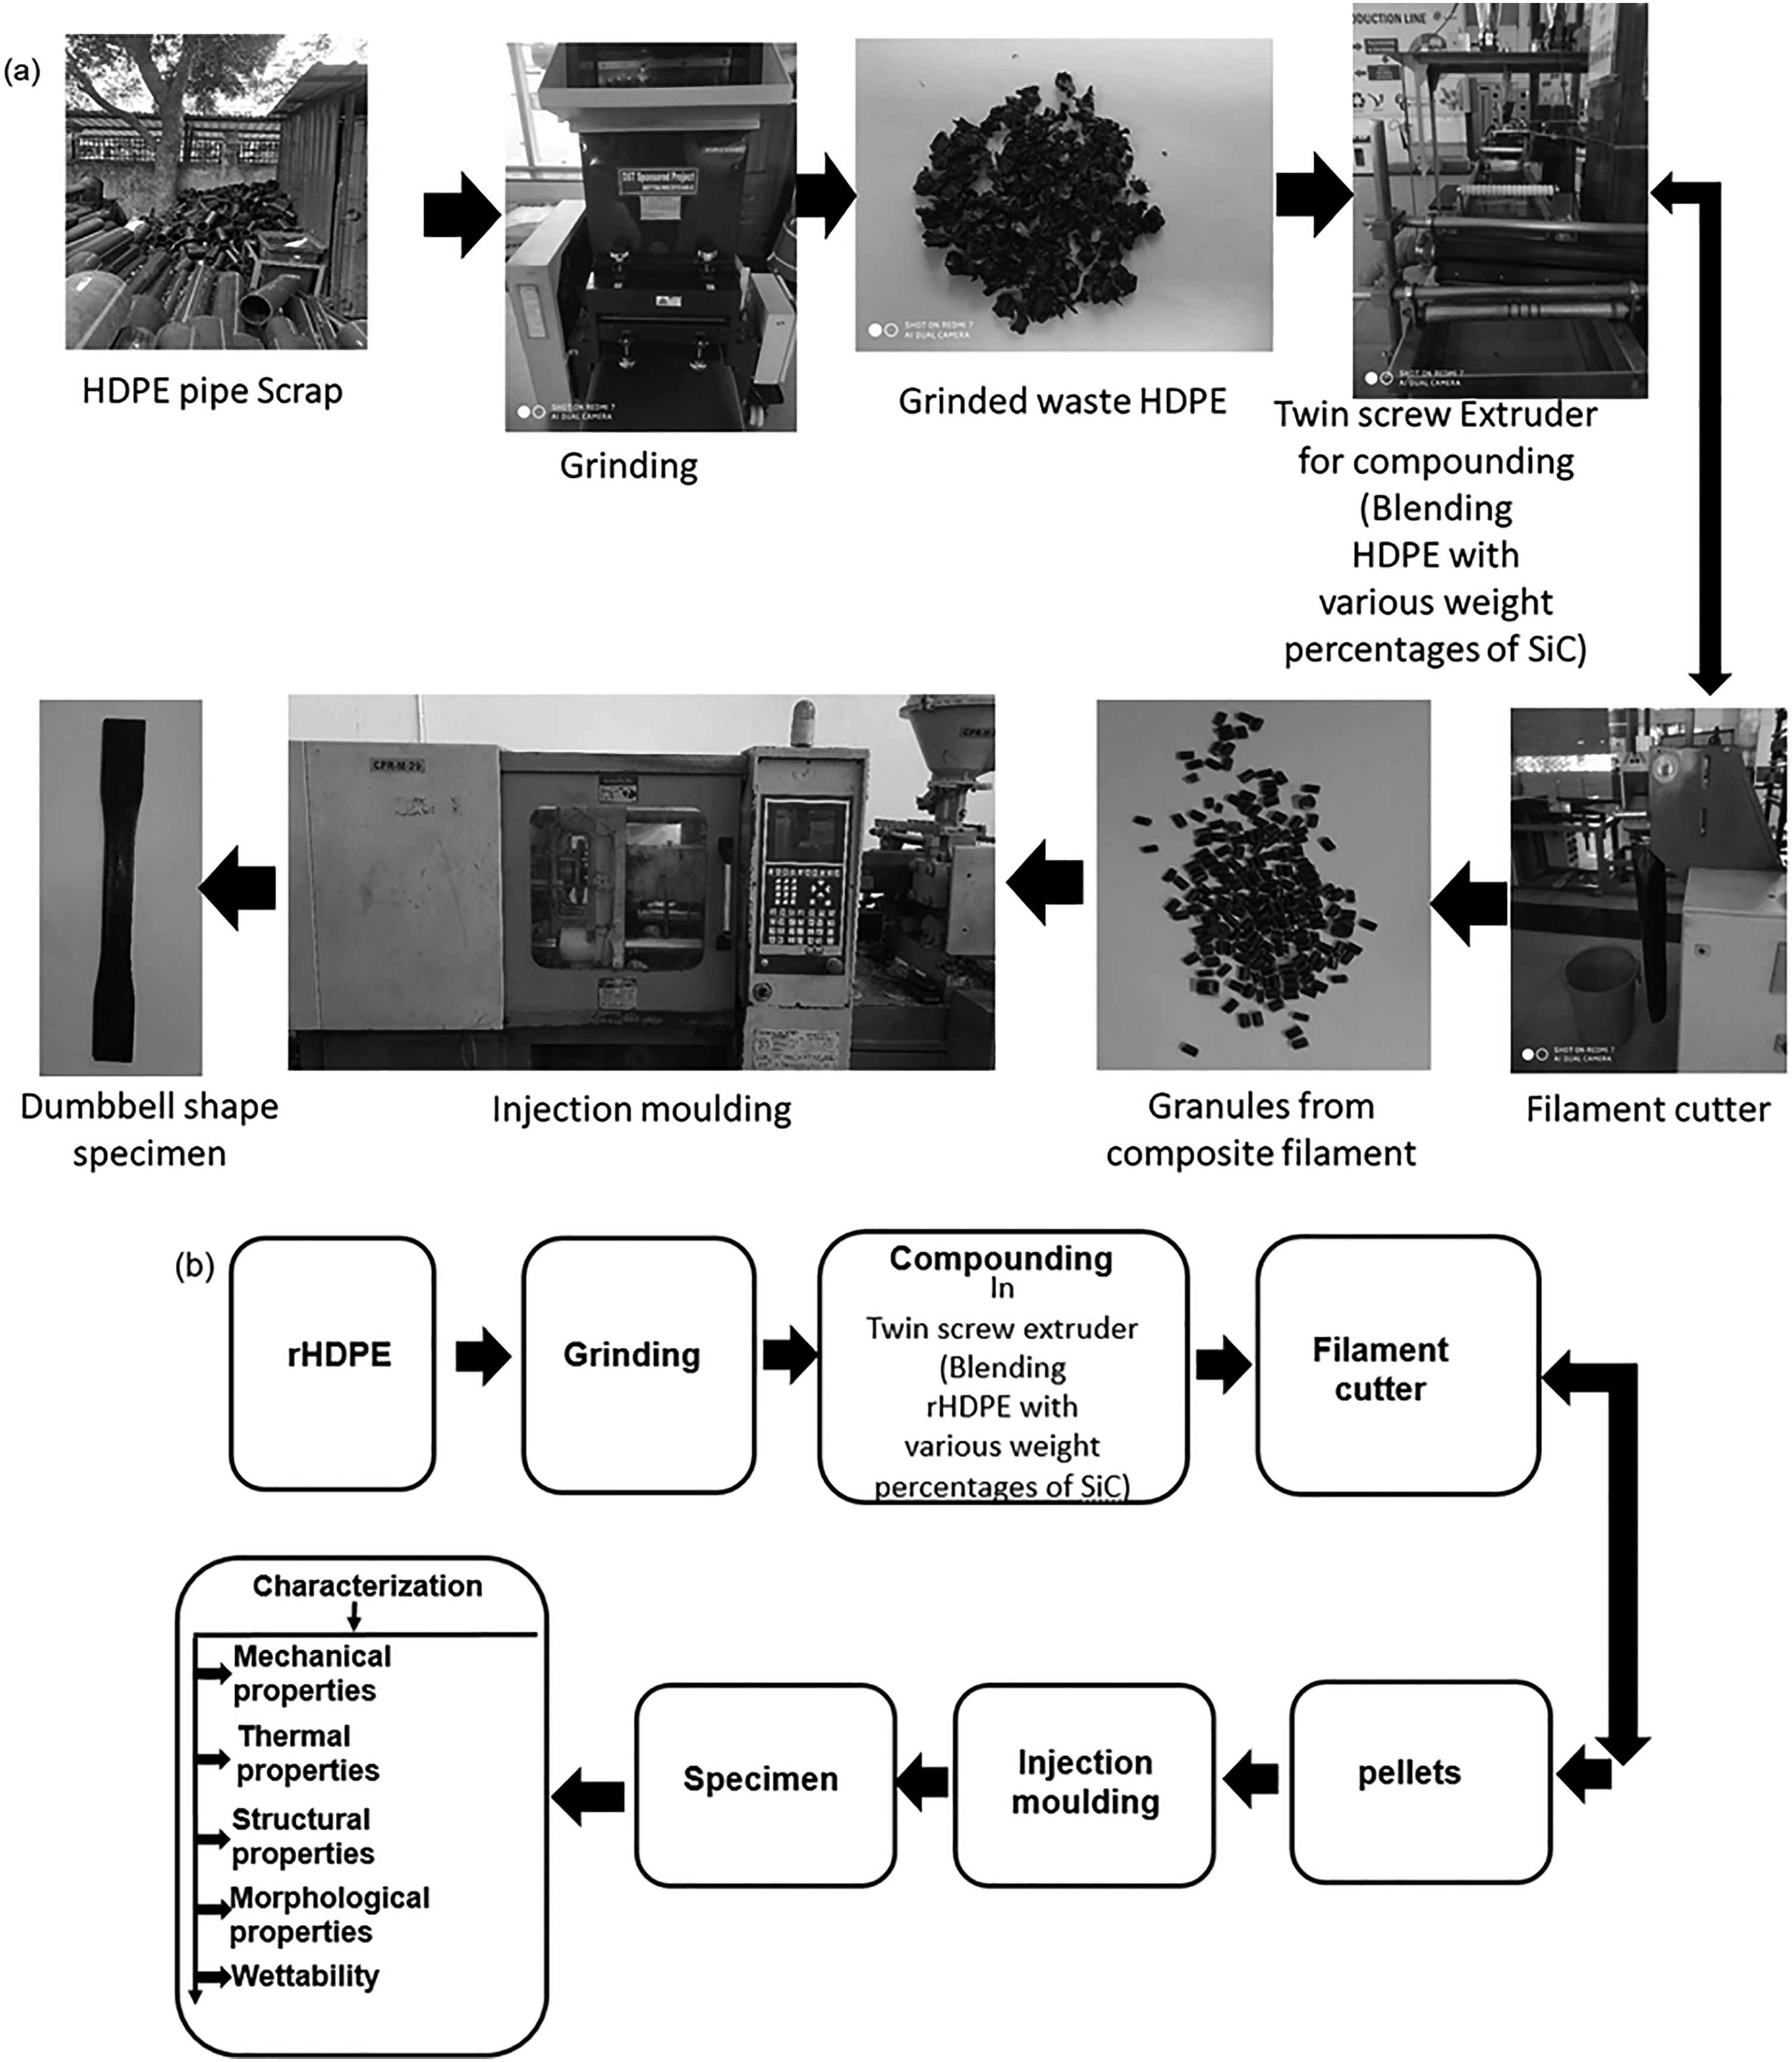
(a) Pictorial representation of complete procedure of rHDPE/SiC composite and (b) flow chart of rHDPE/SiC composite preparation.
Testing
Mechanical properties
Tensile test
Tensile test of the specimens were carried out with an INSTRON Universal Testing Machine (model 3382, UK). The test was conducted with a cross head speed of 2 mm/min at ambient temperature. The dog-bone shaped specimens for the tensile strength test were taken according to ASTM D638-14 standard. 22 Five specimens are typically tested to ensure accuracy and reproducibility. Tensile properties such as Young's modulus, ultimate tensile strength, tensile strain at yield, tensile strain at break, tensile modulus of the composites were acquired from the stress–strain graph. The testing parameters/processing parameters can be obtained from Ref. 22
Flexural test
On an INSTRON, Universal Testing Machine, the Flexural Test (Model 3382, UK) was conducted utilising the three-point bend test method in accordance with ASTM D790-17 standard. 23 A 140-mm long by 15 mm wide specimen was cut and inserted into a three-point bending fixture using the specified 16:1 span to depth ratio. The specimens were evaluated using a 10-kN load cell and a crosshead speed of 2 mm/min. For accuracy testing, five specimens are typically tested to ensure accuracy. The testing parameters/processing parameters can be obtained from Ref. 23
Hardness (shore A)
Shore A durometer was used to gauge the hardness of the rHDPE and rHDPE/SiC composite materials (GS-709; Teclock, Osaka, Japan). The measurement of the test composites follows ASTM D2240-15 guidelines. 24 The test was run with a continuous load of 10 N. Five measurements were made, spaced 6 mm apart, and the mean value was computed. The testing parameters/processing parameters can be obtained from Ref. 24
Density
The Archimedes principle is used to calculate the composite's density. With the help of the solvent isopropyl alcohol, the density of the composites was estimated. The measurement of the test composites follows ASTM D792-20 guidelines. 25 Equation (1) was used to determine the weight fraction of composite materials.
Specific gravity,


Density of rHDPE composite = specific gravity × 0.7825 g/cm3 (density of isopropyl at 23 °C).
Impact test
The impact tests specimens were carried out with an Impact tester with notch cutter machine (model IT 504 plastic Impact, 899, Tinius Olsen, USA) with an impact pendulum 2.75 J. The specimens were conducted according to ASTM D 256-10. 26 All tests were carried out at room temperature, five specimens were used in each test. The testing parameters/processing parameters can be obtained from Ref. 26
Thermal properties
Heat deflection temperature
The heat deflection temperature (HDT) was calculated using HV-2000A-C3, GoTech, Taiwan HDT tester. The specimens were measured according to ASTM D 648-18. 27 The test specimens were having dimension of 125 × 12.7 × 3.2 mm3. The heating rate of the silicone oil was 2 °C/min. The starting temperature was 30 °C and soaking time was 5 minutes. The testing parameters/processing parameters can be obtained from Ref. 27
Thermal conductivity
The tests were carried out using thermal conductivity tester, Unitherm 2022, Anter Corpo, USA. The test samples of dimensions 5 × 5 × 1 mm3 were placed on the sample holder that is covered with a heat shield. The heat shield specimens were put into the sample chamber and tested at room temperature with 30, 60 and 90 °C temperature range. Five specimens are typically tested to ensure accuracy and reproducibility. The testing parameters/processing parameters can be obtained from Ref. 28 The specimens were measured according to ASTM E1530-11. 28
Structural properties
Melt flow index
MFI tester was measured by melt flow modular 7027, Ceast, Italy. The test was conducted according to ASTM D1238-20. 29 A standard load of 2.16 N was applied on rHDPE and rHDPE/SiC composite granules at a processing temperature of 190 °C and flow of material was observed for 10 minutes. The material weight that flowed through die cavity (orifice dia.-2.096 mm) for 10 minutes gave the MFI in g/10 minutes. Five specimens are typically tested to ensure accuracy and reproducibility. The testing parameters/processing parameters can be obtained from Ref. 29
Contact angle
An apex instrument pvt. Ltd Germany was used to measured contact angle of the rHDPE/SiC composites. A drop of distilled water was placed on the surface of the rHDPE/SiC composite, contact angle was measured each second and average of the first 10 measurement is reported. Contact angle was measured for three specimen of each composite with two different locations per specimen. The specimens were measured according to ASTM D5946-04. 30 Five specimens are typically tested to ensure accuracy and reproducibility. The testing parameters/processing parameters can be obtained from Ref. 30
Rheological properties
The rheological properties of the rHDPE and rHDPE/SiC composites were conducted by using parallel plate rheometer (mars III, Thermofisher scientific, Germany) with ASTM D7395-18. 31 The measurement temperature was 220 °C. The scanning frequency range is 1–100 rad/s and the strain amplitude is 1%, which was within the linear viscoelastic behaviour of the material. Five specimens are typically tested to ensure accuracy and reproducibility. The testing parameters/processing parameters can be obtained from Ref. 31
Characterisation
Differential scanning calorimeter
A differential scanning calorimeter (DSC Q20) was used for DSC (TA Instruments, USA). The experiments were conducted between 30 and 200 °C with nitrogen flowing continuously at a rate of 10 °C/min. To erase their previous thermal history, the samples were heated from 30 to 200 °C at the start of the test, then cooled to room temperature. To reach 200 °C, the heating cycle was repeated. As required by ASTM D3418-15, 32 the tests were measured. Five specimens are typically tested to ensure accuracy and reproducibility. The testing parameters/processing parameters can be obtained from Ref. 32
Thermogravimetric analysis (TGA) test of the samples
TGA test of the specimens were performed by TGA Q50, TA instruments, USA. The tests were conducted according to ASTM E1131-08. 33 The sample weight was about 5 mg to 8 mg. The analyses were carried out within a range from 30 to 800 °C at a heating rate of 10 °C/min under a nitrogen flow rate of 20 mL/min. Five specimens are typically tested to ensure accuracy and reproducibility. The testing parameters/processing parameters can be obtained from. 33
Fourier transform infrared (FTIR)
FTIR was examined by Nicolet (iS 50, USA). The chemical composition of the specimens were investigated in a mid-infrared region (400–4000 cm−1). The test was conducted according to ASTM E1252-98. 34 Five specimens are typically tested to ensure accuracy and reproducibility. The testing parameters/processing parameters can be obtained from Ref. 34
Scanning electron microscope
The morphology observation of specimens before and after tests was examined by scanning electron microscopy (SEM; EVO MA15, Carl Zeiss SMT, and Germany). The test was conducted according to ASTM E986-04. 35
Results and discussion
Mechanical properties
Tensile strength
Figure 2 shows the tensile properties of rHDPE/SiC composites. The tensile properties include ultimate tensile strength, modulus of elasticity and elongation at break. The ultimate tensile strength goes on increasing with the addition of filler content in rHDPE (see Figure 2a). The tensile strength is maximum (27 MPa) at 15 wt-% SiC and minimum (21 MPa) at 0 wt-% SiC. The tensile strength of composite gradually increases with the addition of SiC and after 15 wt-% SiC content the strength start decreasing (at 20 wt-% SiC). However, it was still more than that of neat rHDPE. The modulus of elasticity increases with the incorporation of SiC from 0 wt-%, 471.13 MPa to 700.73 MPa at 15 wt-%. But after that at 20 wt-%, the modulus of elasticity starts reducing from 700.73 MPa to 546.52 MPa (see Figure 2b). The elongation at break % decreases with the addition of filler content from 27.67% at 0 wt-% SiC to 15.19% 20 wt-% SiC (16.23%) (see Figure 2c).
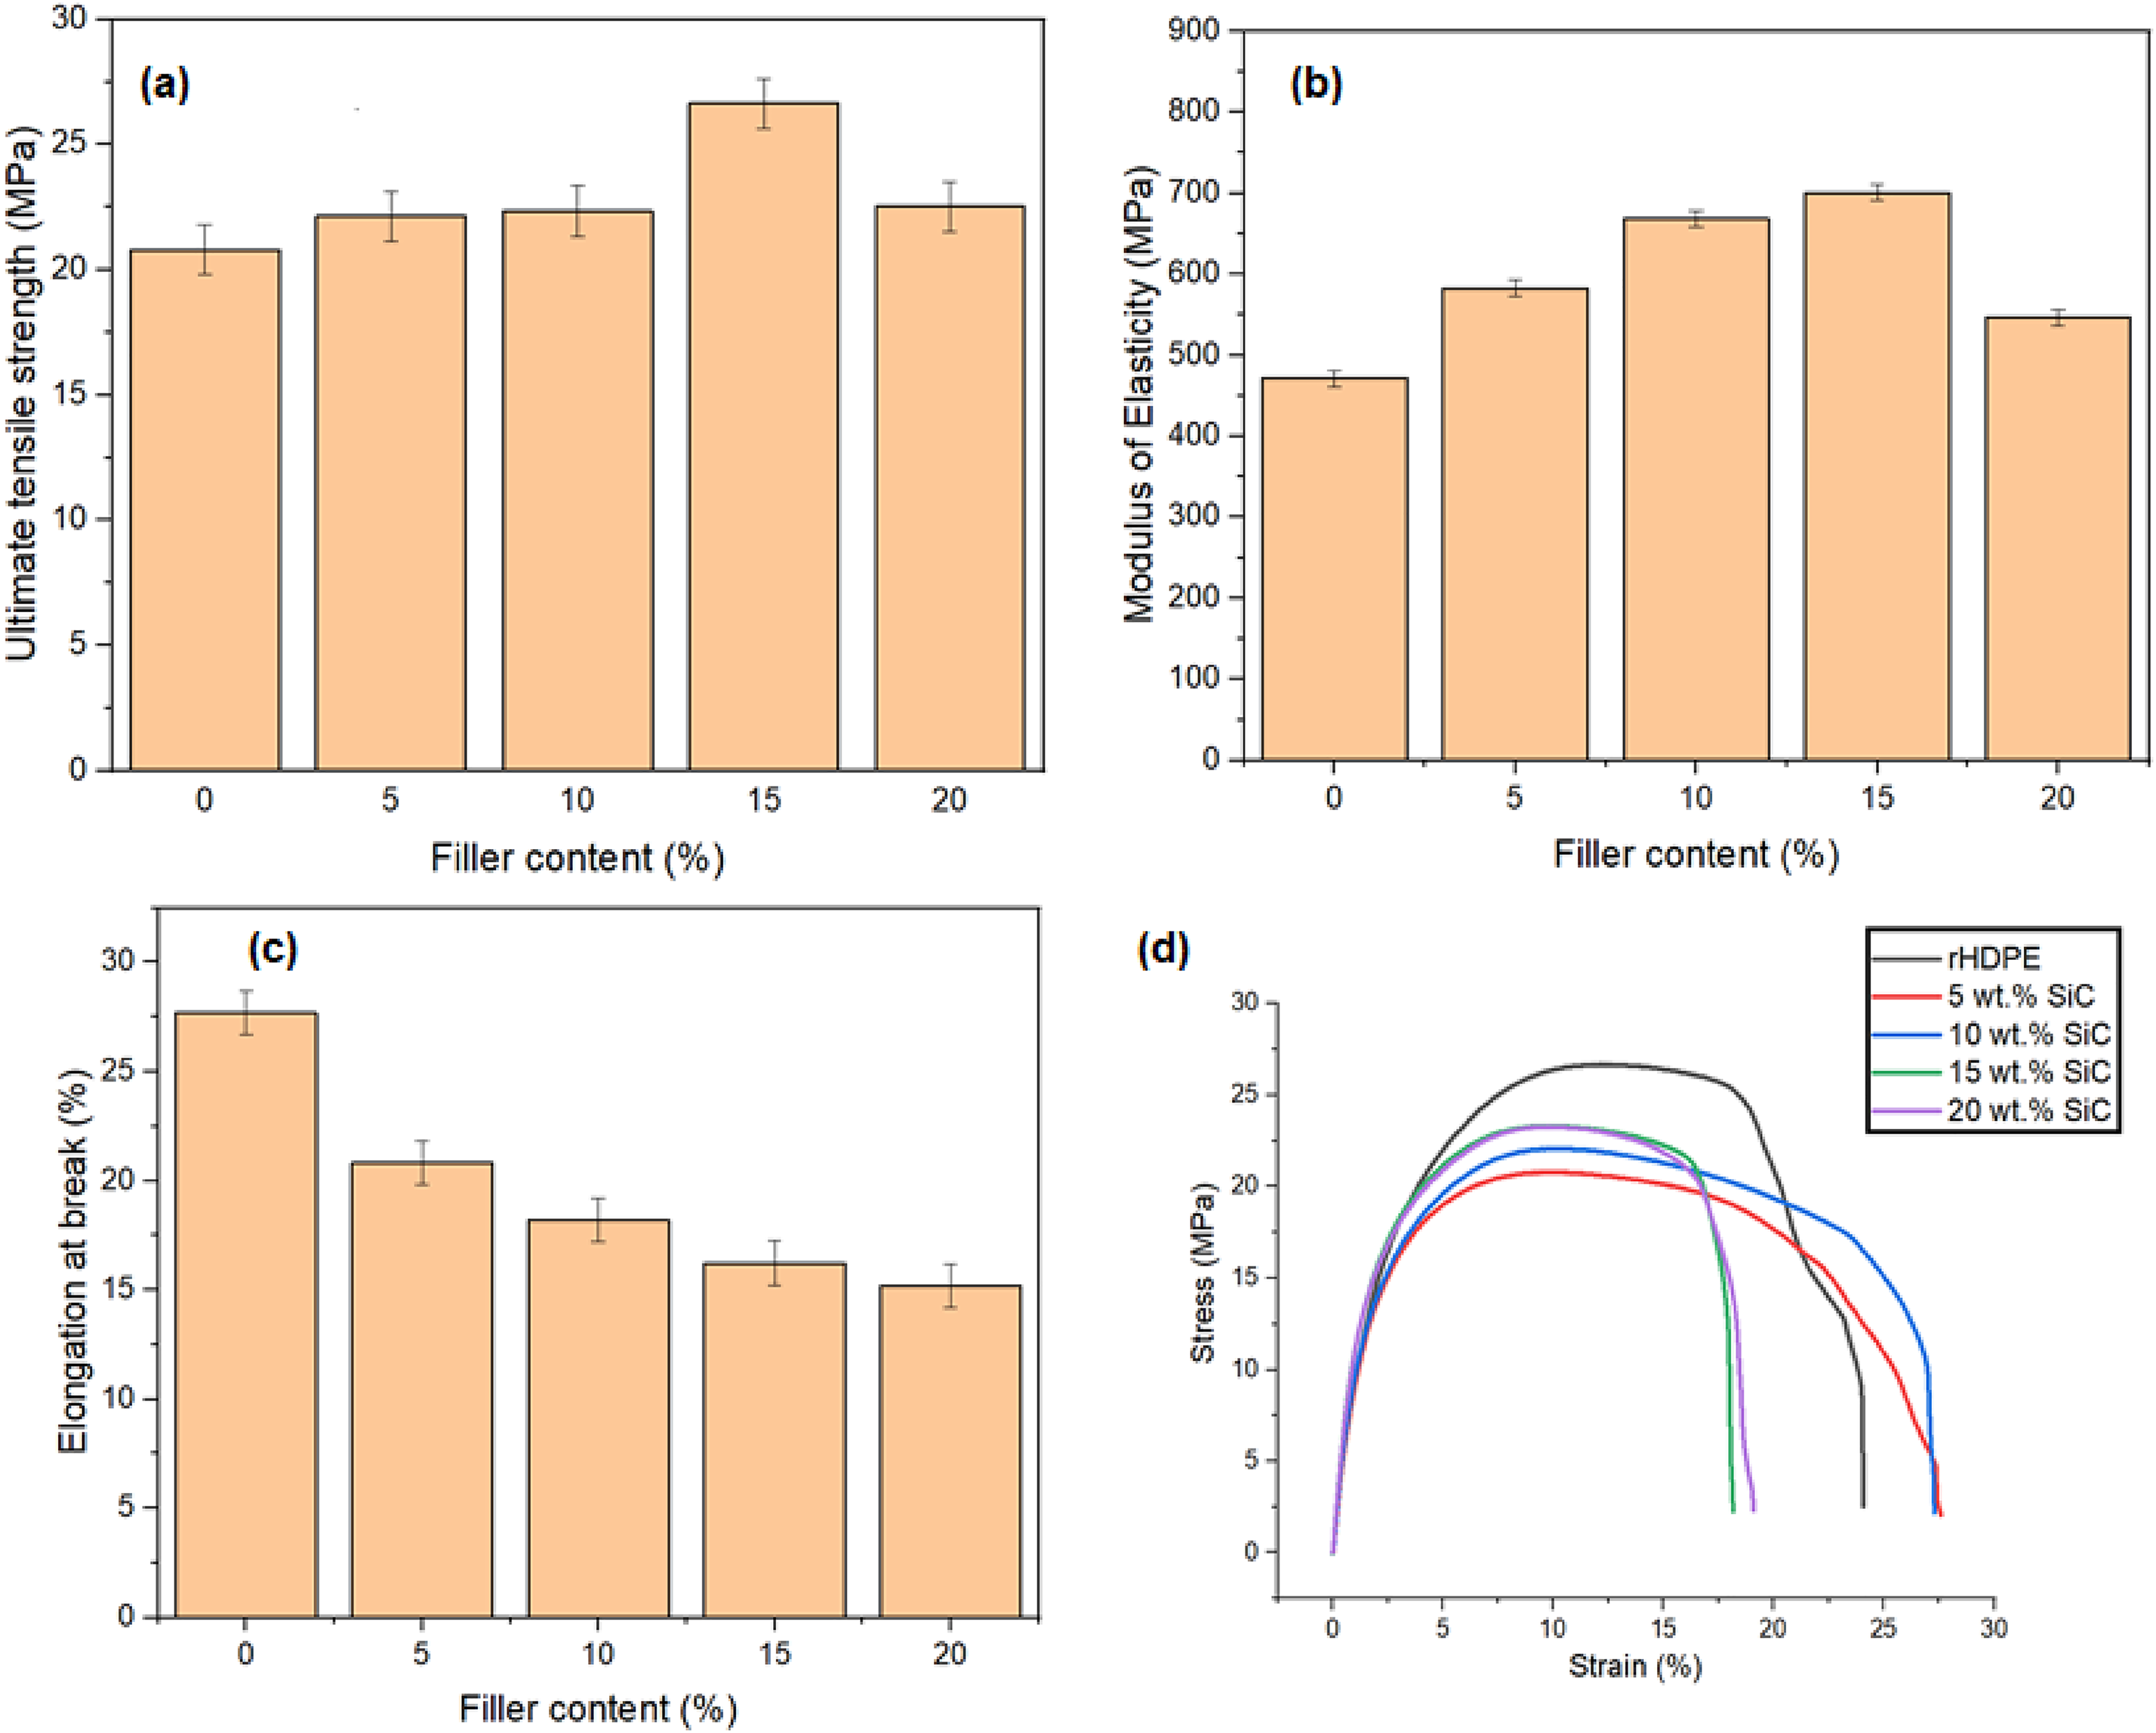
Tensile properties of rHDPE and rHDPE/SiC composites as a function of SiC content: (a) ultimate tensile strength, (b) modulus of elasticity, (c) elongation at break and (d) stress–strain curves.
The reason for the increase in tensile strength and modulus of elasticity is due to the structure of SiC, which is built with tetrahedral of carbon atoms at the core and shared with silicon atoms along its periphery as rigid bonding in the crystal lattice, which helps to achieve superior modulus value. 19 The increase in strength and modulus up to 15 wt-% is due to uniform dispersion, stress is created because of applied load is disseminated equally. It also shown from Figure 2(a) and (b) that bonding between filler and matrix is better up to 15 wt-% composite and further addition of filler (20 wt-%) results in agglomeration, hence strength reduces due to this agglomeration of filler material which results in amorphous nature of the composite. 36 The similar results were obtained by Arrakhiz et al. 37 with HDPE/coir fibre and Molefi et al. 38 with polyethylene/copper composites.
The addition of SiC content in the rHDPE composite reduces the elongation at break because increase in filler content enhances the stiffness of the composite. This is due to fact that the deformation of the filler is generally much less than the polymer matrix; thus, the filler forces the matrix to deform more than the overall deformation of the composites. Hence, results in reduction of elongation at break of composites. 39 The similar results was in agreement by Molefi et al. 38
The stress–strain graph of the rHDPE/SiC composites was shown in Figure 2(d). It was observed from the stress strain diagram that the fracture toughness of the composite gradually increases up to 10 wt-% SiC then it decreases drastically when the content of the SiC was more than 15 wt-%. The increase of the composite fracture toughness was mainly due to evenly dispersion of the SiC particles in the rHDPE matrix when the SiC particle is less than 20 wt-%. The homogeneous distribution of SiC in the matrix encouraged the bonding strength between the SiC particle and the rHDPE matrix. When the SiC particle is more than the 15 wt-%, the size of the SiC aggregates which reduces the filler–polymer bonding strength.
Flexural strength
Composite's flexural strength is seen in Figure 3(a). In comparison to rHDPE, the inclusion of SiC leads in an enhancement of flexural strength. The flexural strength is lowest at 0 wt-% SiC (20.13 MPa) and highest at 15 wt-% SiC (23.26 MPa). The further addition of SiC after 15 wt-% reduces the flexural strength (at 20 wt-%, 21.49 MPa). Figure 3(b) presents the flexural modulus with filler content. The flexural modulus graph shows the similar trend as flexural strength obtained. The highest value obtained with 15 wt-% SiC (839.03 MPa) and lowest with 0 wt-% SiC. (620.19 MPa). This kind of behaviour is due to microstructure characteristics (i.e. size, shape and dispersion) of particulates. 40 The flexural modulus of PMMCs increases with increasing particle size. Circular-shaped particles are considered better than spherical and angular-shaped ones to achieve improved flexural properties. 41 Flexural stress increases with the rise in filler content (Figure 3(c)). The stress value of rHDPE is minimum but as filler content increases the flexural stress goes on increasing and reaches maximum at 15 wt-% SiC content. Addition of filler after 15 wt-% the strength, modulus and stress gradually reduces due to poor dispersion (important factor for enhancement of the strength and modulus), the increase in filler at 20 wt-% results in agglomeration which cause reduction in flexural properties. Similar results were seen in the mechanical properties of powder coating waste reinforced polyolefin materials investigated by Kısmet 42 and characterisation of mechanical, thermal and morphological properties with thermoset powder coating waste as filler in LDPE by Kismet and Dogan. 43
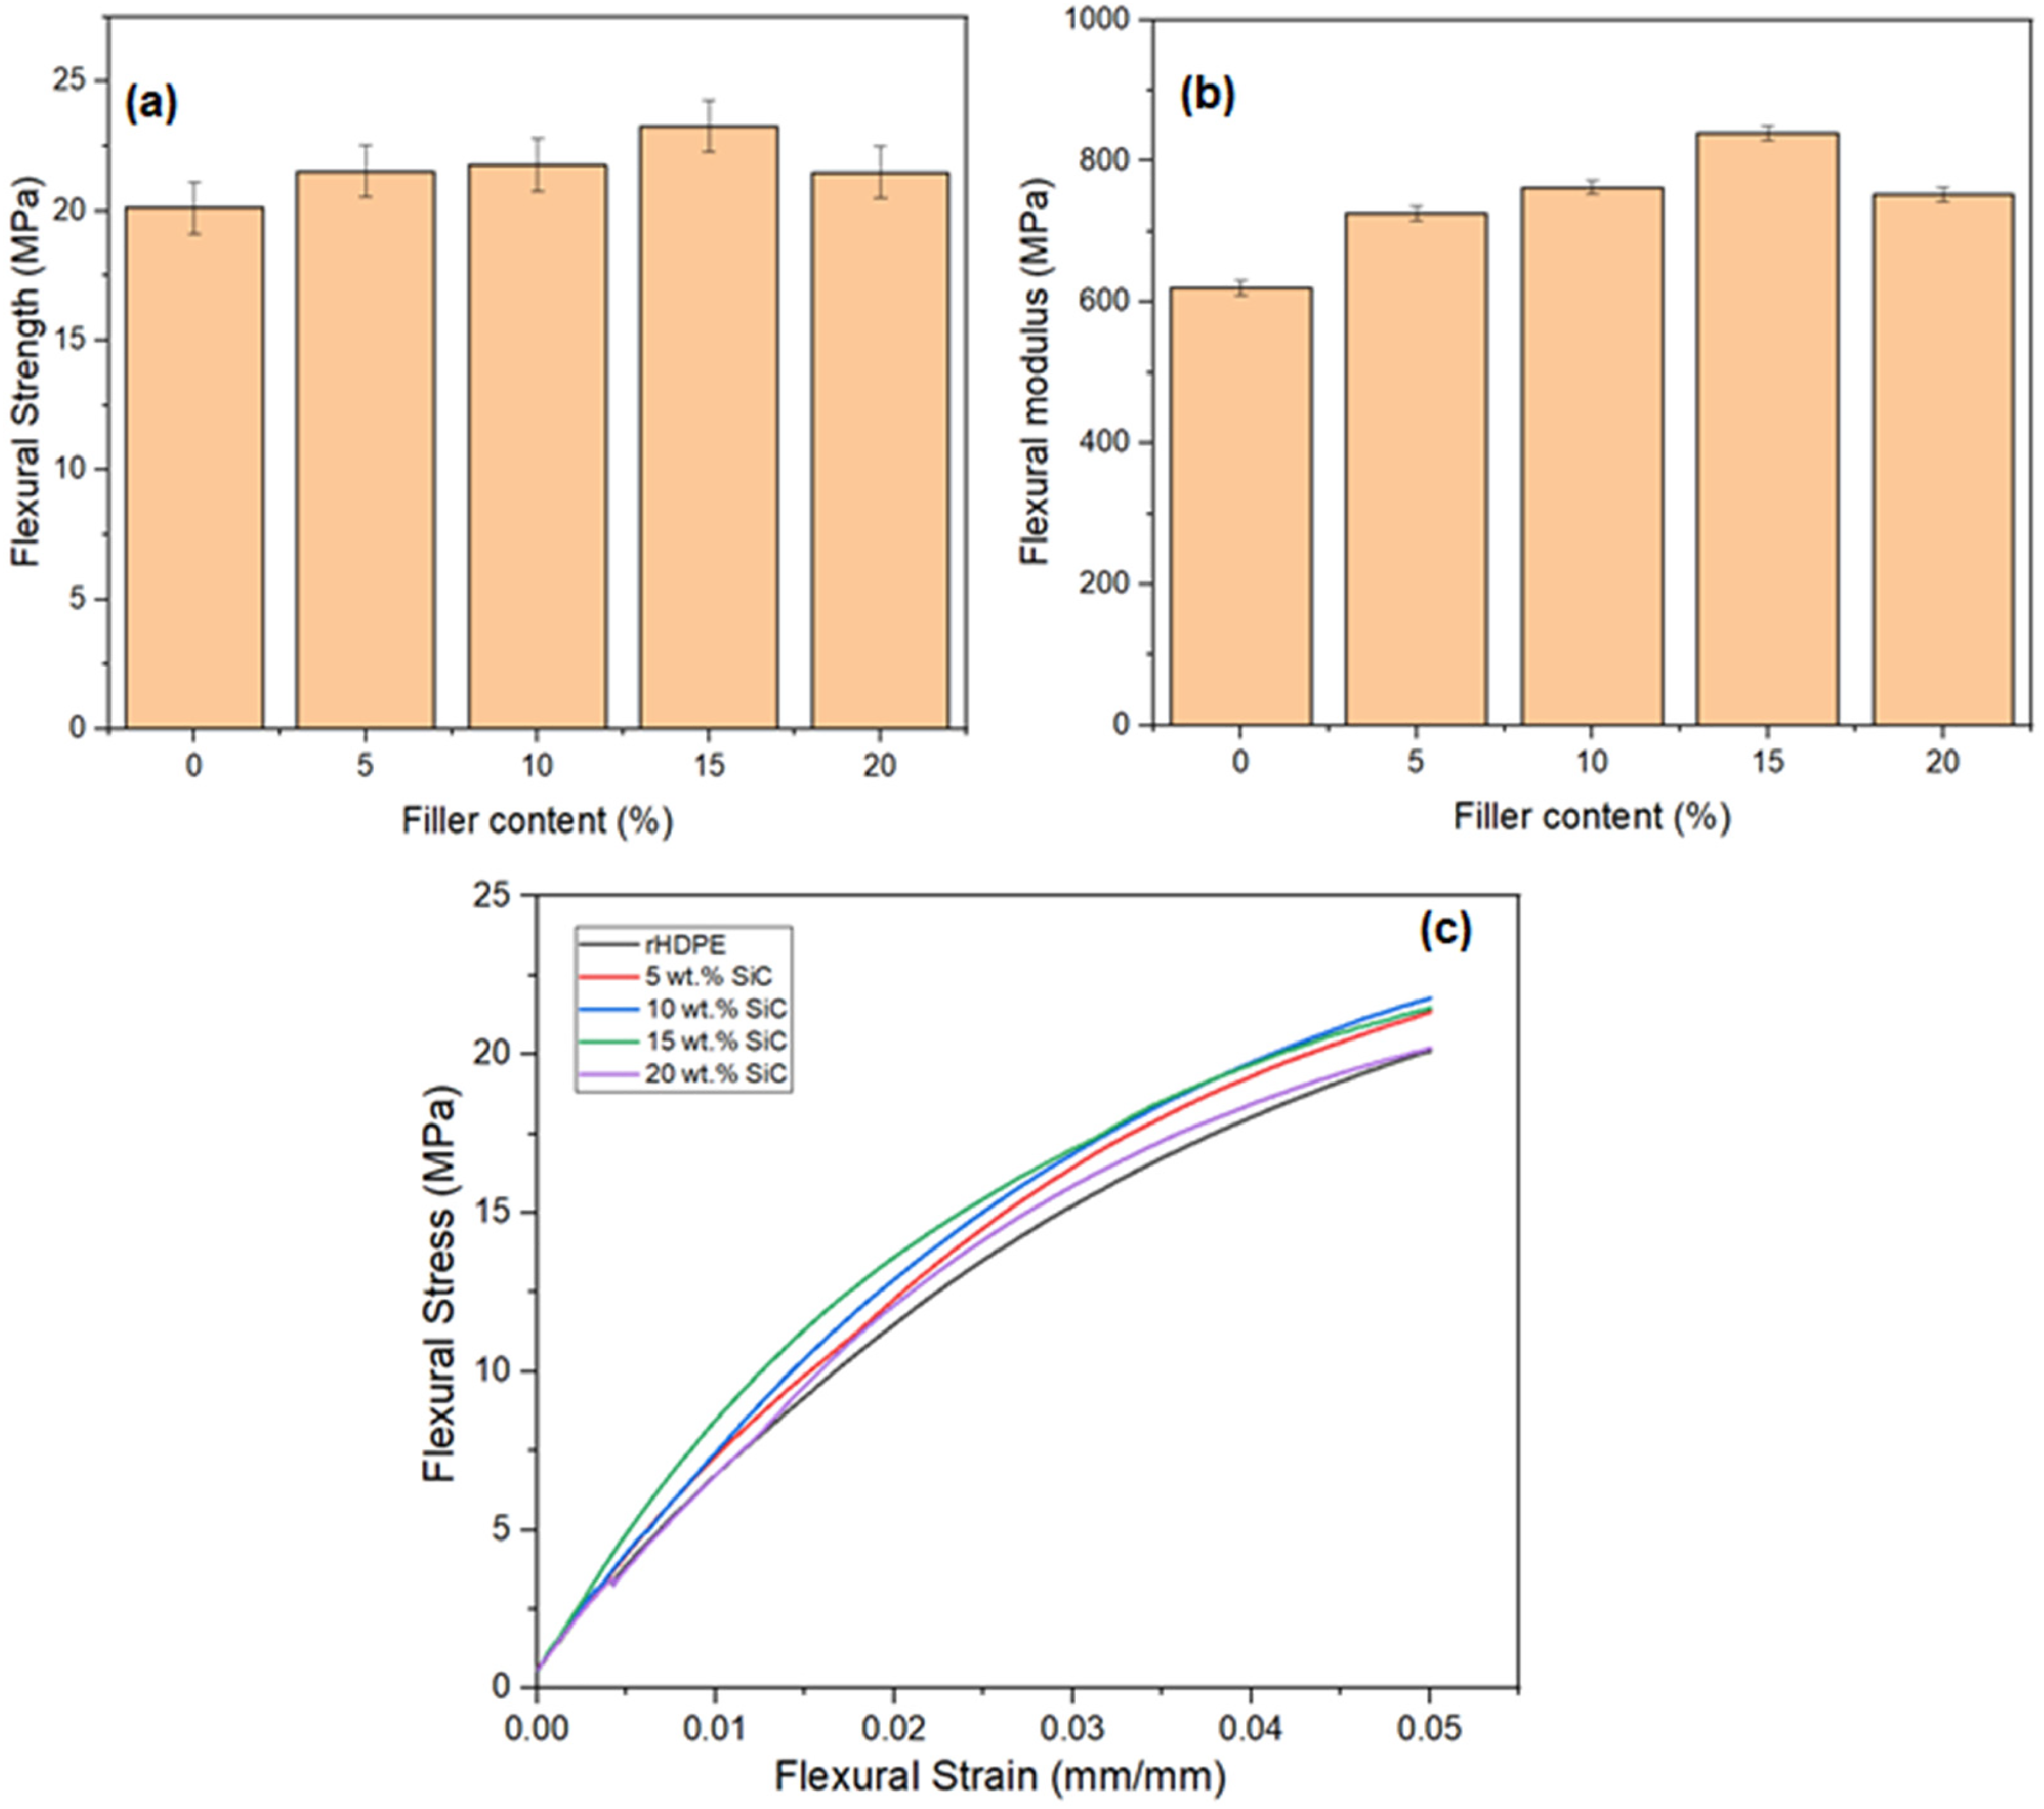
Flexural properties of rHDPE and rHDPE/SiC composites as a function of SiC content: (a) flexural strength, (b) flexural modulus and (c) flexural stress and strain.
Hardness
Hardness test results reported that the addition of SiC particle to rHDPE increased the shore A hardness, from 98 to 148. The similar results obtained by Kismet et al. 43 with LDPE/waste powder coating composites. The increase in hardness of the composites may be due to the load transfer effect and thermal mismatch of the filler particles and matrix. Due to this when load applied on materials the load transfer from softer matrix to harder particle so hardness increases. The highest value, 148 was accomplished at 20 wt-% SiC and lowest 98 at 0 wt-% SiC (Figure 4).
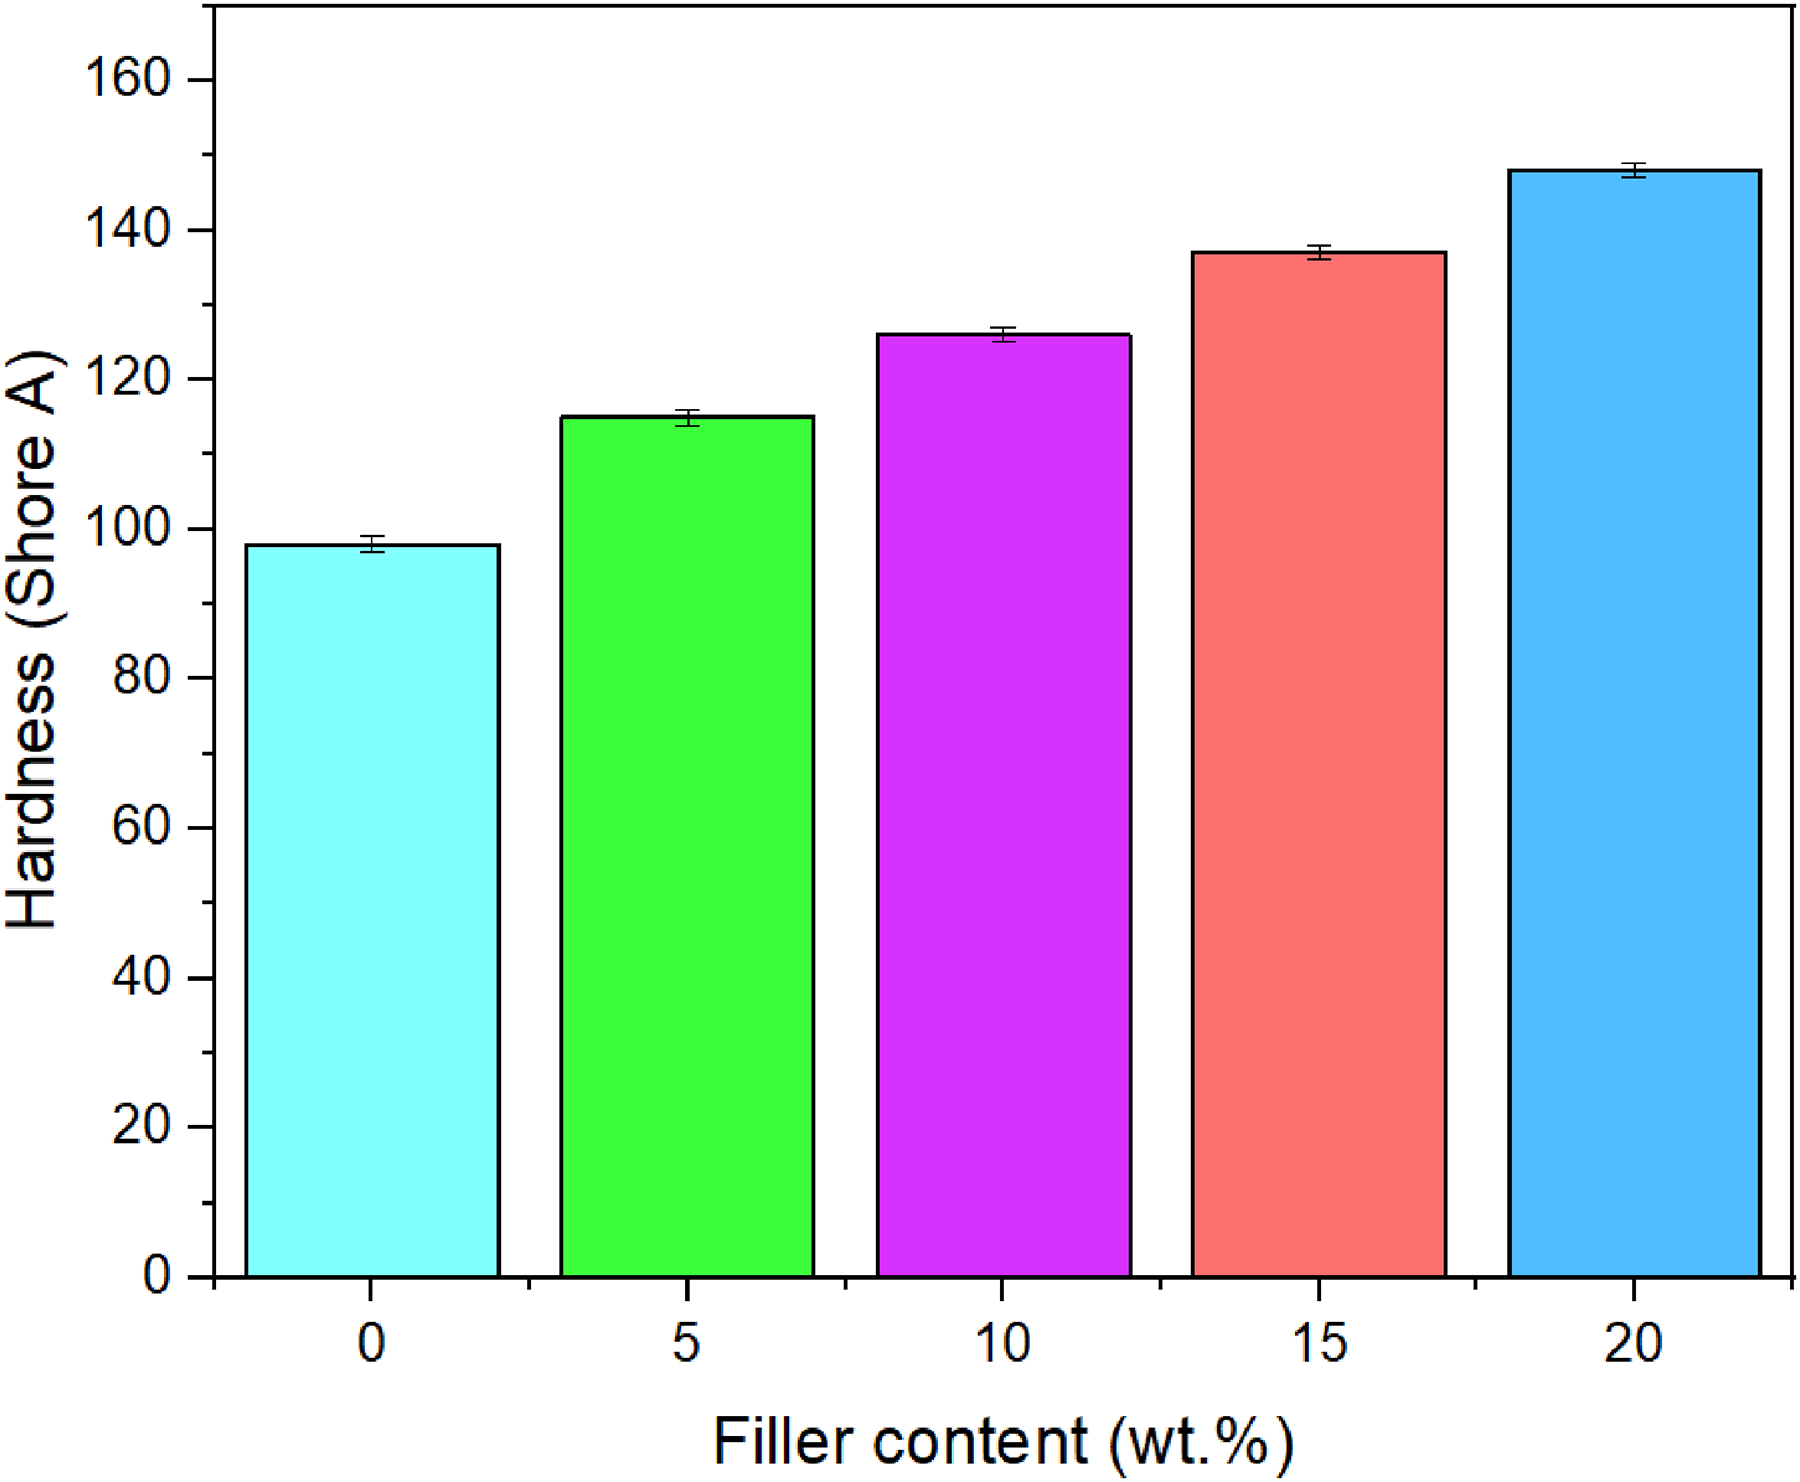
Hardness (shore A) value of rHDPE/SiC composites.
Density
Density of rHDPE/SiC composites were shown in Figure 5. It was observed that density of the composite increases with the addition of the SiC. For SiC reinforced rHDPE composites, the density varied from 0.9434 to 1.0761 g/cm3. This can be due to fact that density of SiC is higher than that of HDPE. The similar findings were obtained by Bhaskar et al. 44 with wood plastic composites.
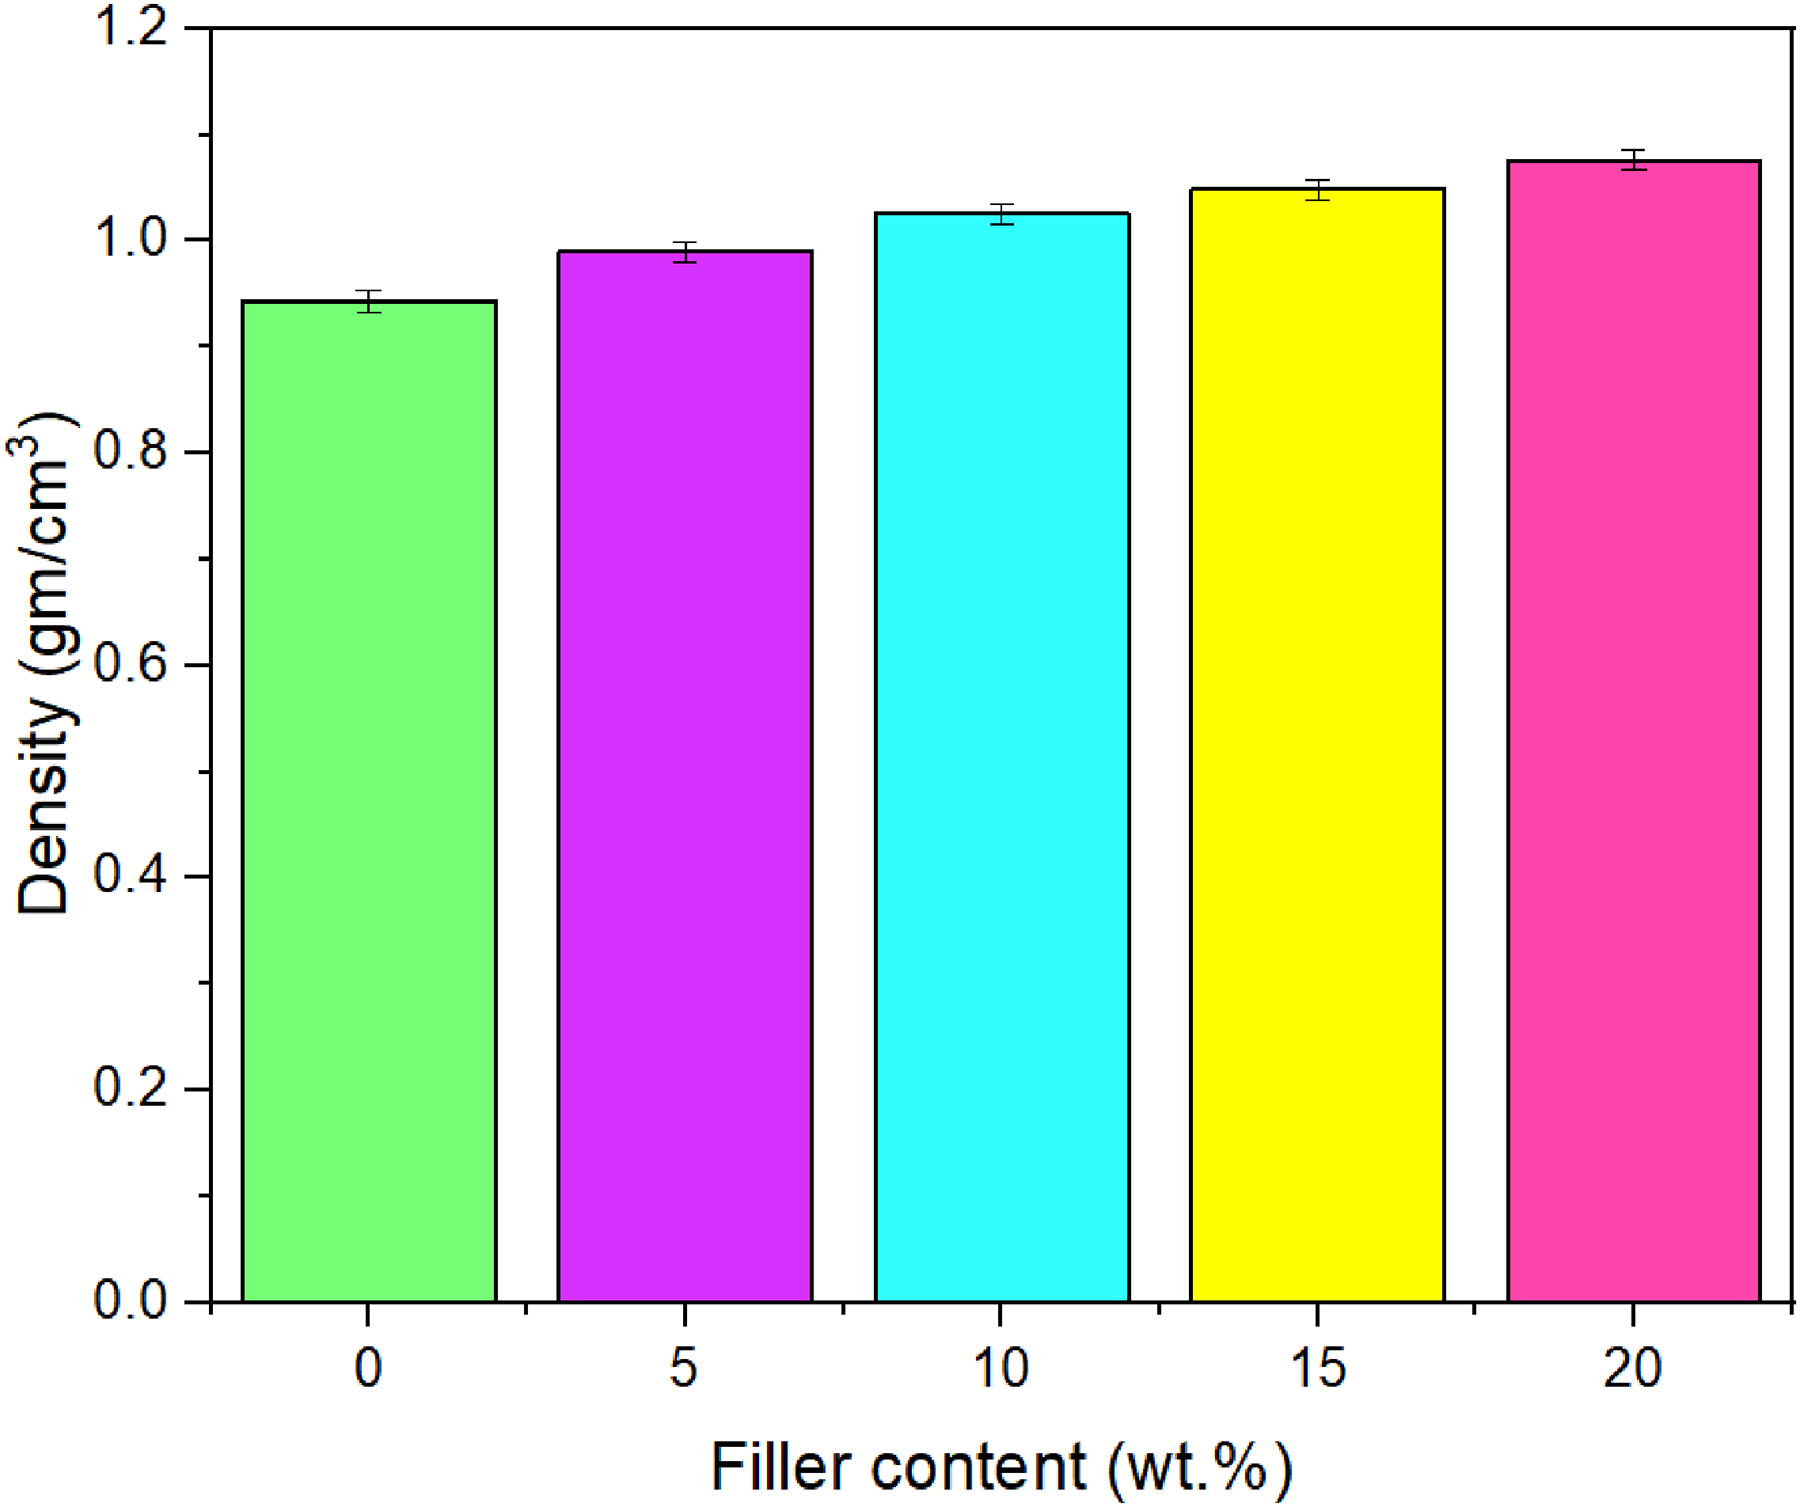
Density of rHDPE/SiC composites.
Impact strength
The Izod impact test method was used for measuring the impact behaviour of the composite. It was found that impact strength of the composite first increases at 0 wt-% SiC (0.23453 kJ/m2) than decreases with 10 wt-% SiC (17.985 kJ/m2). It increases again at 15 wt-% SiC (25.152 kJ/m2) than reduces at 20 wt-% SiC (22.136 kJ/m2). The maximum value of impact strength is obtained at 15 wt-% SiC (Figure 6). The rise in toughness of the composite was less. Kismet et al. 43 also claimed that with the additions of waste powder coatings revealed the similar findings in LDPE.
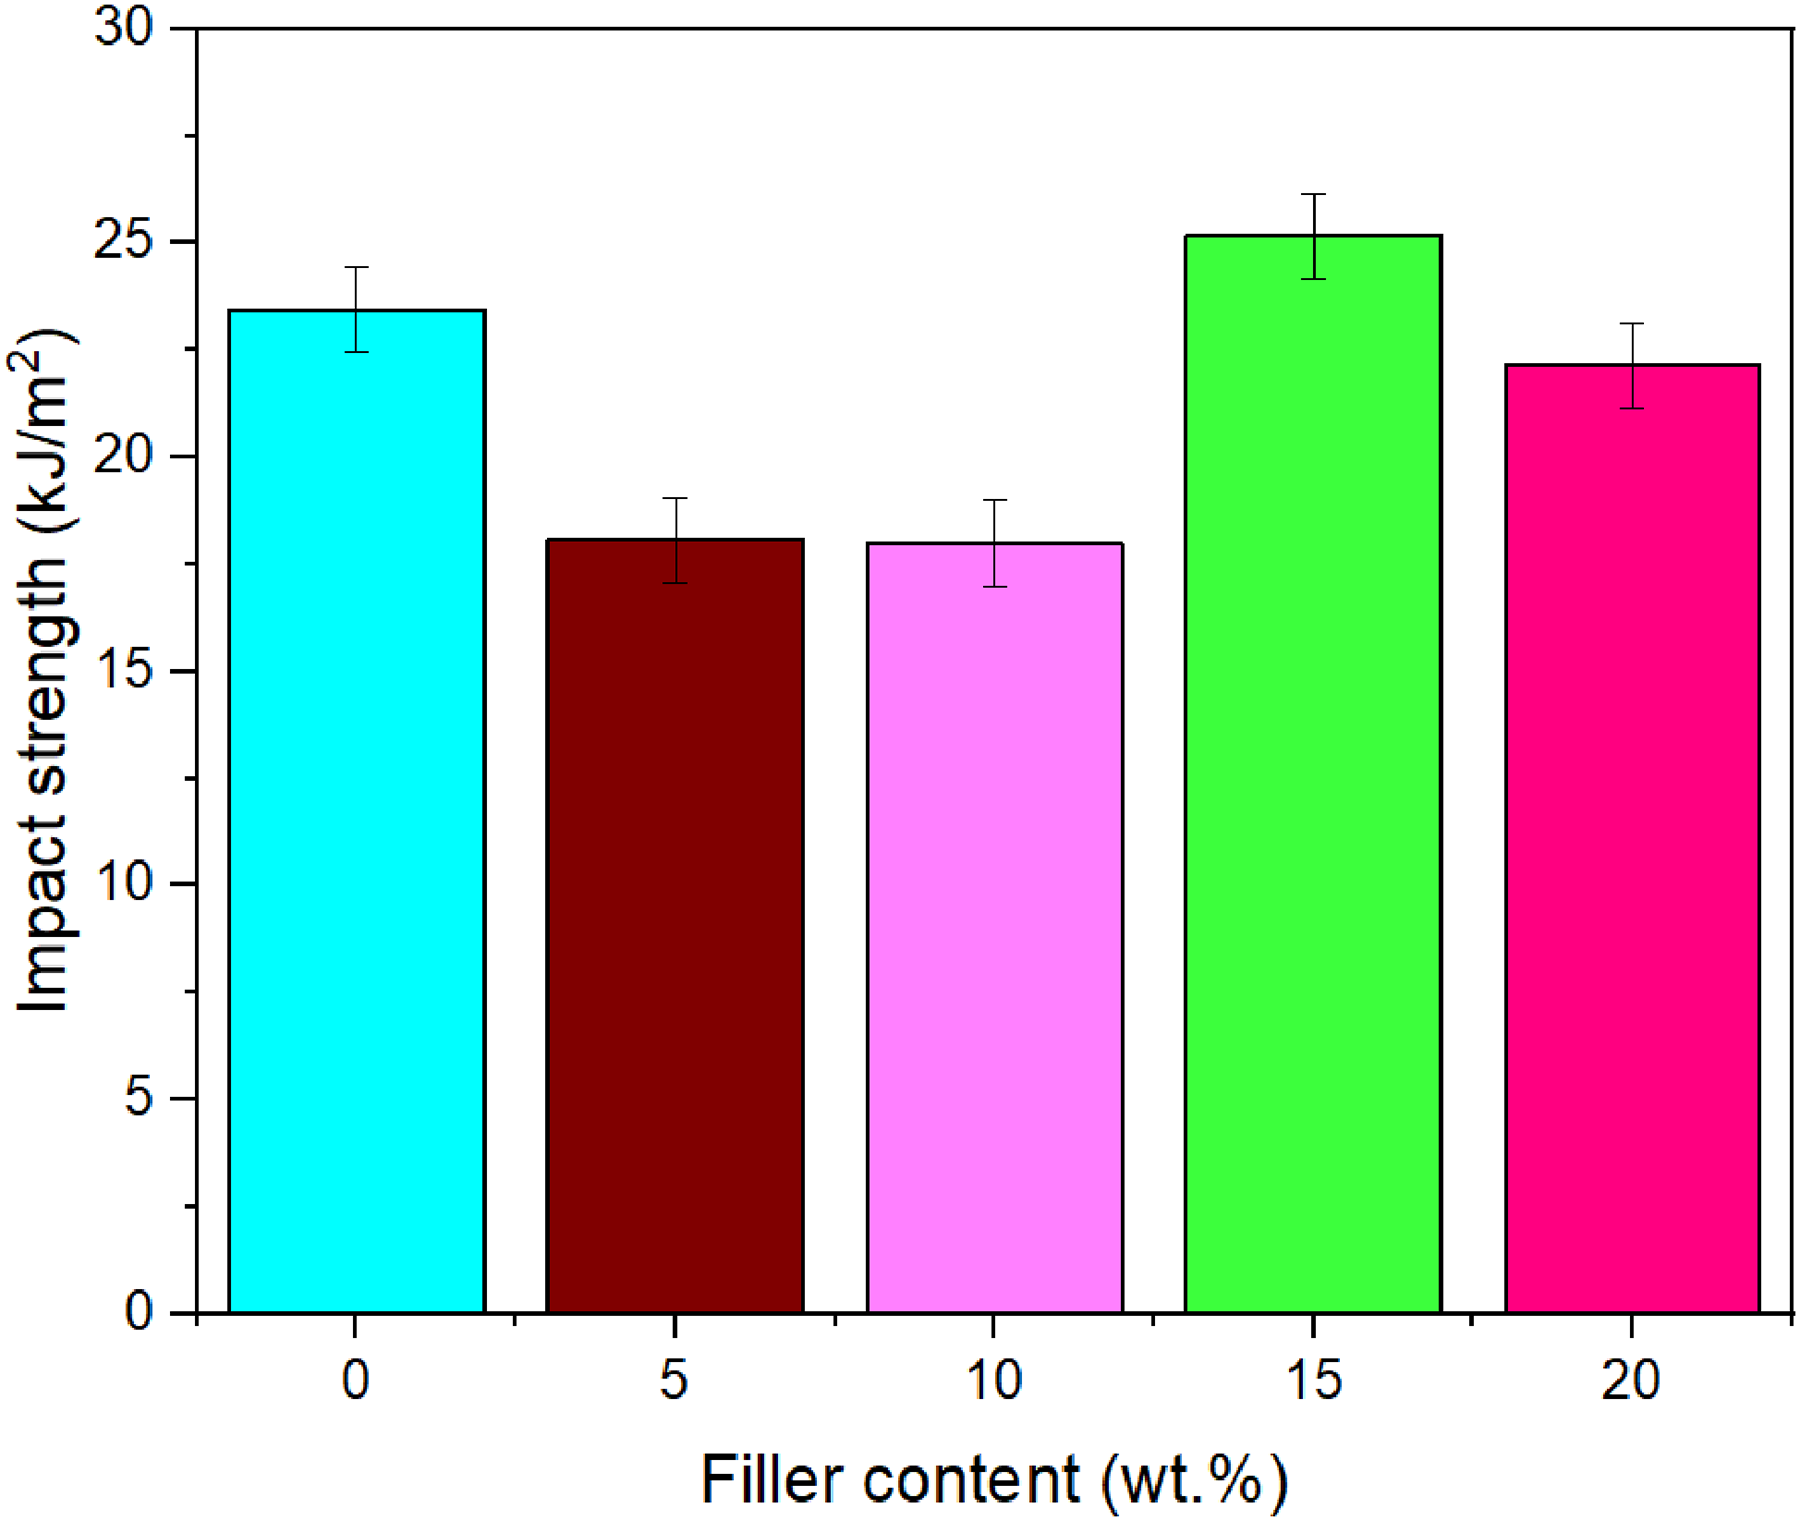
Impact strength of rHDPE/SiC composites.
Thermal properties
Differential scanning calorimeter
DSC curves of rHDPE/SiC composite were shown in Figure 7. It provides the information regarding the melting temperature (Tm) of the rHDPE composites with different wt-% of SiC. The melting peak of rHDPE and its composites, revealed that there is remarkable difference in their position. The melting point (Tm) of rHDPE of 133.52 °C was moved to 140.75 °C after filler loading with 20 wt-% SiC. This increase due to enhancement of surface interaction between SiC and rHDPE matrix.
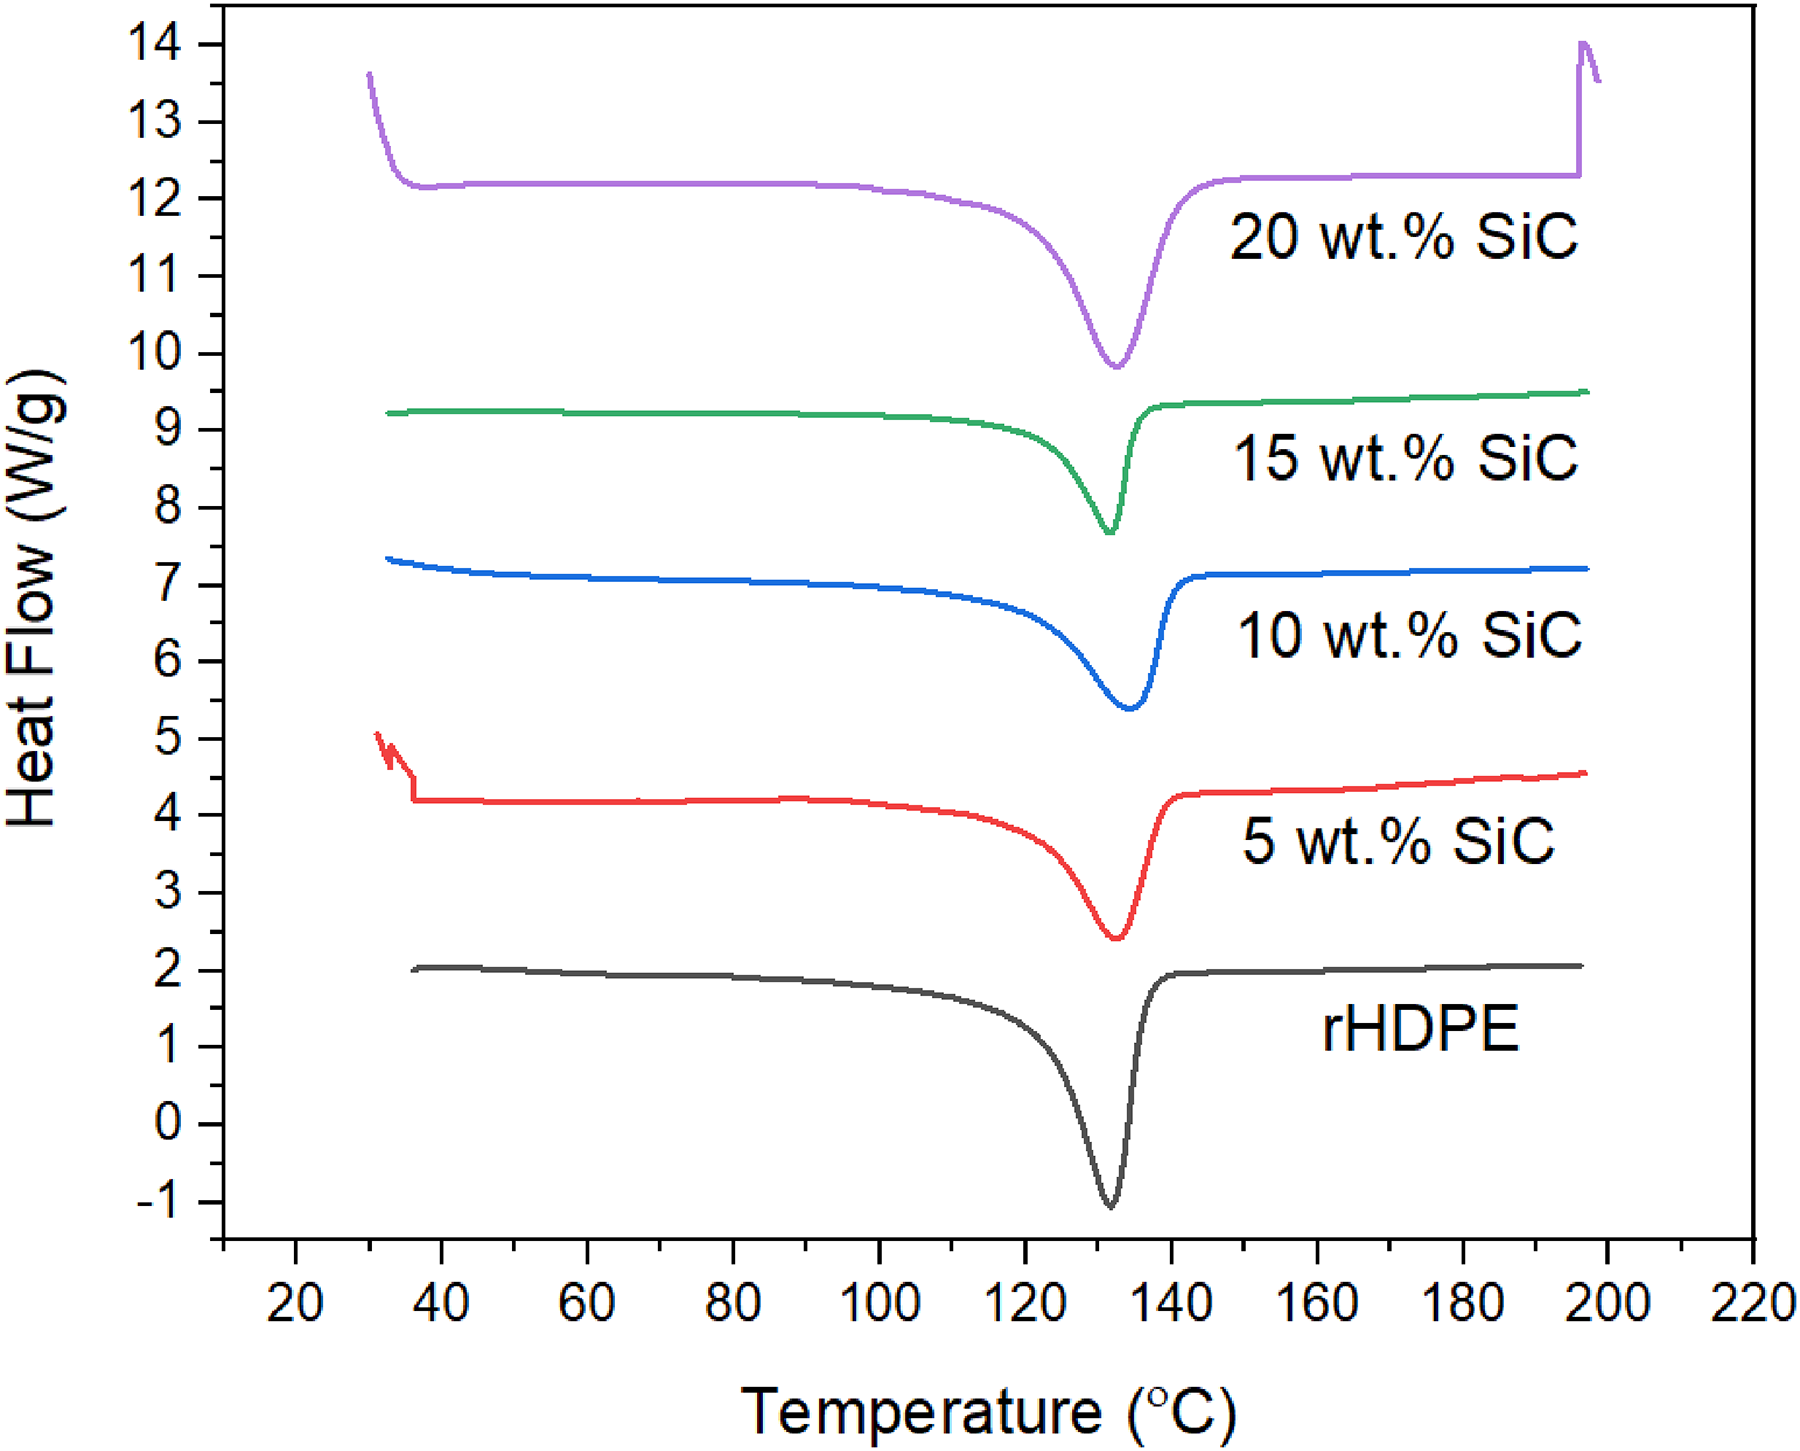
DSC curves of rHDPE/SiC composites.
The enthalpy of crystallisation is 117.6, 123.3, 128.8, 130.2 and 132.1 J/g for 0, 5, 10, 15 and 20 wt-% SiC, respectively. The addition of SiC in rHDPE increases the melting point and total enthalpy of crystallisation. It revealed that SiC act as nucleation sites for the recrystallisation of rHDPE material. The higher concentration of SiC continuously accelerates the crystallisation of rHDPE as it propagates the diffusion of polymer chains for growing crystallites. The value and trend obtained from the DSC plots of rHDPE/SiC composites are in agreement with the work of Kismet et al., 43 and Cho et al. 44 of LDPE/waste powder coatings and polyketone/carbon fibre composites, respectively.
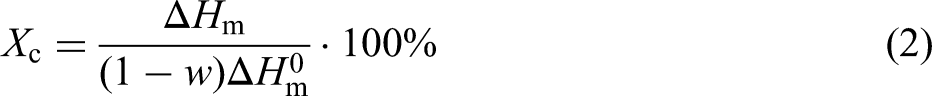
The degree of crystallinity (
Thermogravimetric analysis
The thermogravimetric analysis (TGA) was carried out on rHDPE/SiC composites to study the thermal stability (Figure 8). The TGA results have been displayed in Figure 8 and encapsulated in Table 1. It can be revealed that both T10 and T50 have augmented for rHDPE/SiC composite as compared to that of the rHDPE. The T10 values of rHDPE decreases with the addition of filler content, rHDPE value was 450.1 °C and 20 wt-% SiC was 432.2 °C. At T50, rHDPE value was 480.4 and with 20 wt-% SiC, the value of T50 reduces to 465.8 °C.
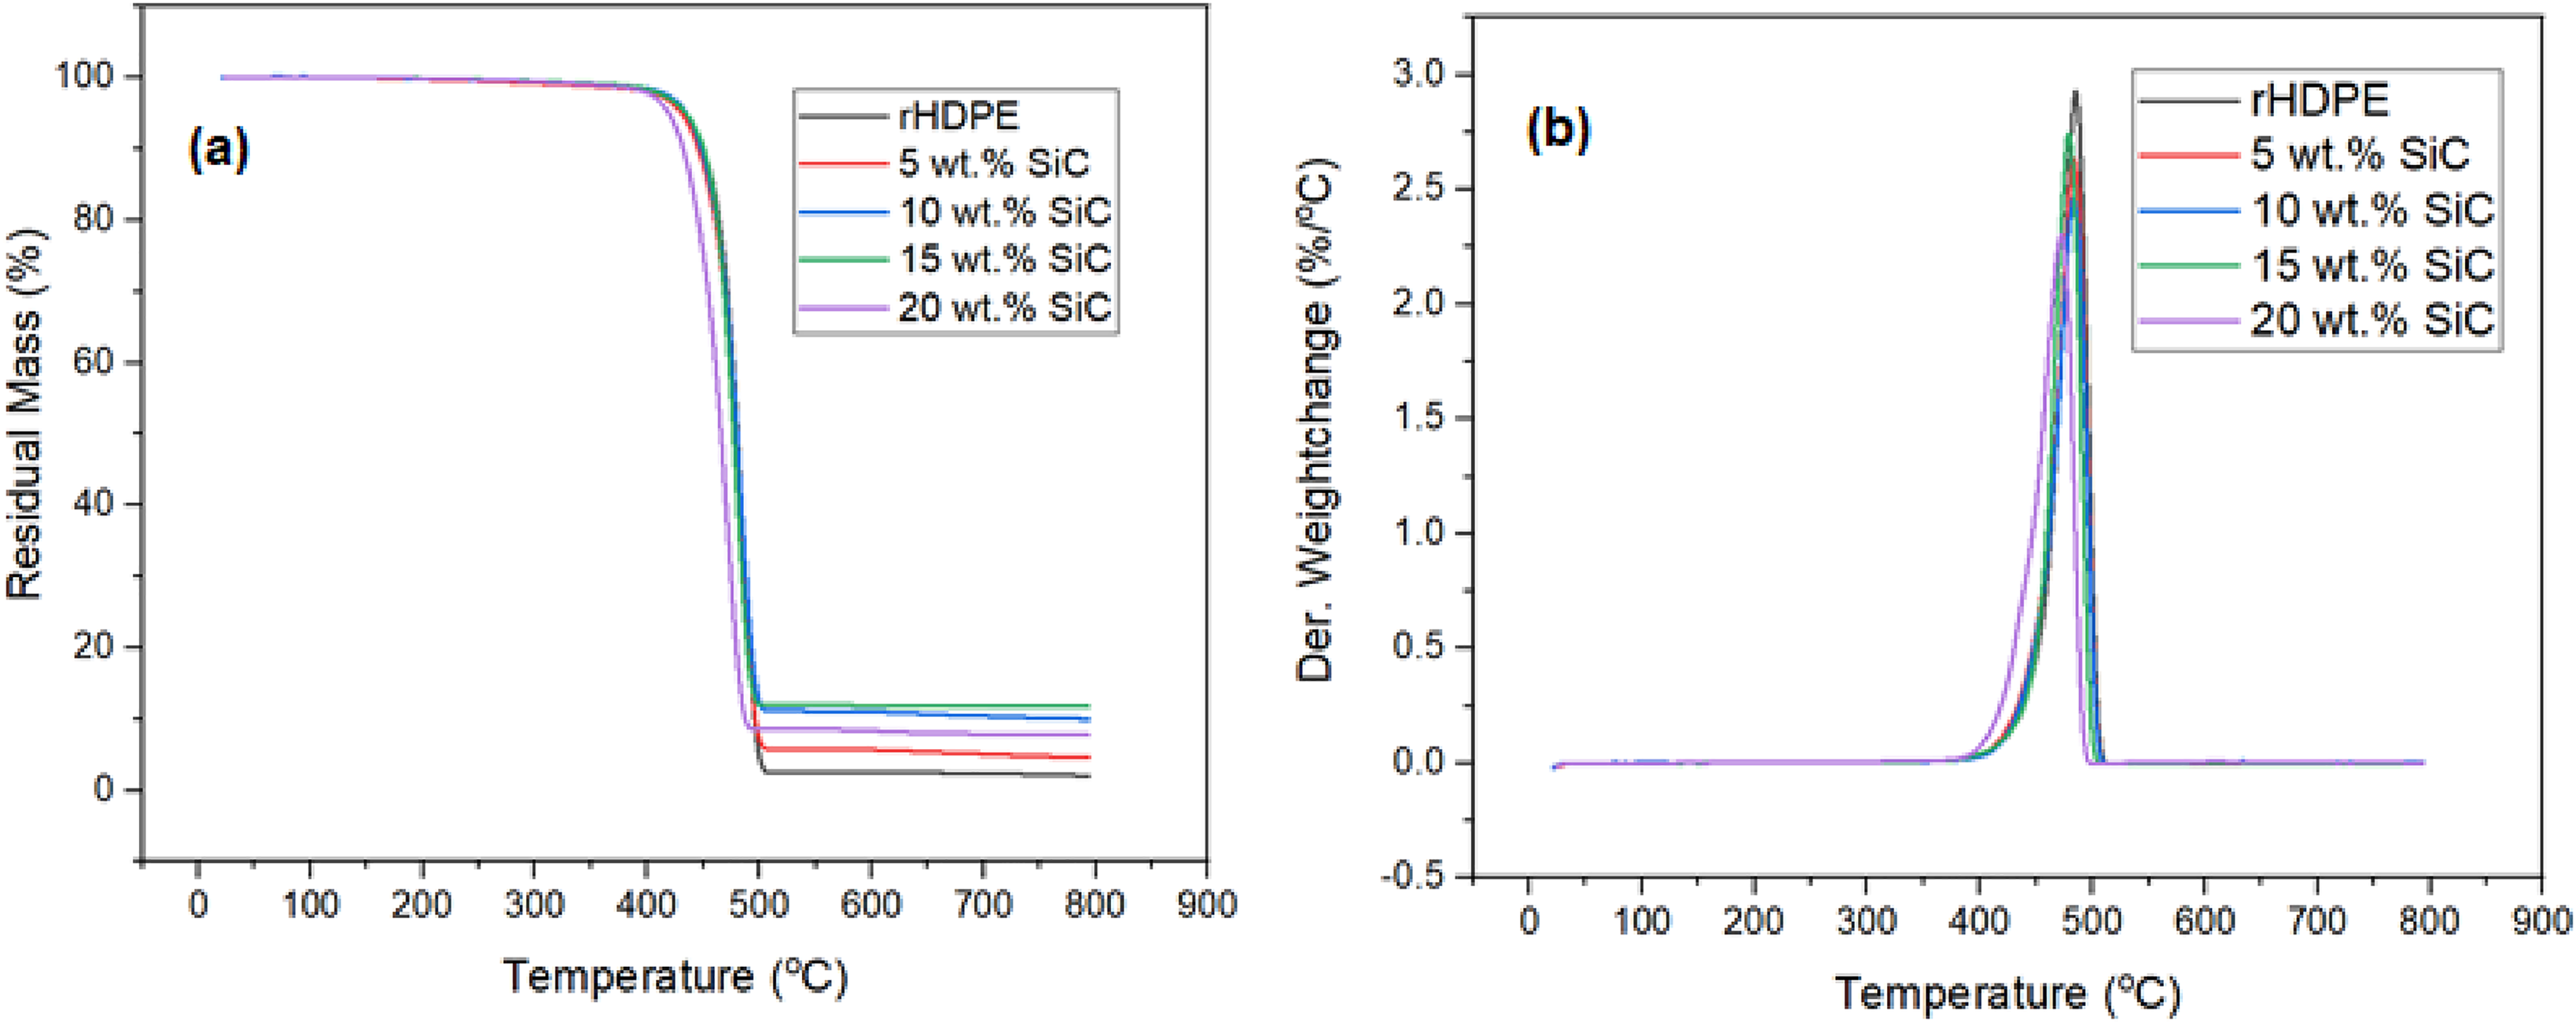
TGA analysis of rHDPE/SiC composites.
Thermal properties of rHDPE/SiC composites measured by TGA.
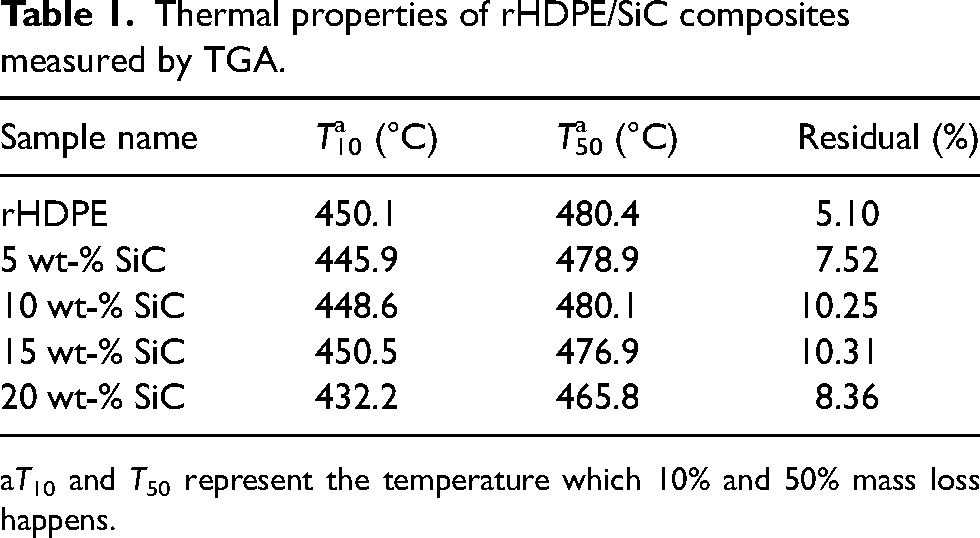
T10 and T50 represent the temperature which 10% and 50% mass loss happens.
It was observed in Figure 8(a) that rHDPE depicts minor residual mass loss in temperature below 400 °C. The major fall in residual mass loss starts at 410 °C. To have a finer view on residual mass loss in terms of temperature, dM/dT curves (obtained from deriving weight loss as a function of temperature) are presented in Figure 8(b). As visible in Figure 8(b) dM/dT curve of rHDPE and rHDPE/SiC composites has peaks that are absolutely placed in the range from 476 to 478 °C. In a range of temperature from 400 to 500 °C, rHDPE lost 97.4% of its weight, and at 800 °C, ash content is close to zero for rHDPE and all composites. The residual value of rHDPE composites increases with the rise in filler loading. This increase in residual mass of rHDPE/composite with the addition of SiC enhances the thermal stability of the composite as compare to pure rHDPE. The similar observation was obtained from Lui et al. 46 with graphene foam-embedded epoxy composites. Yiga et al. 47 also obtained the similar trend was observed with polypropylene reinforced with treated rice and coffee husks.
Heat deflection temperature
It is evident from Figure 9 that the without SiC, the HDT of rHDPE was only 63.9 °C. As the amount of filler content increased, the HDT of the HDPE/SiC composites slowly increased.
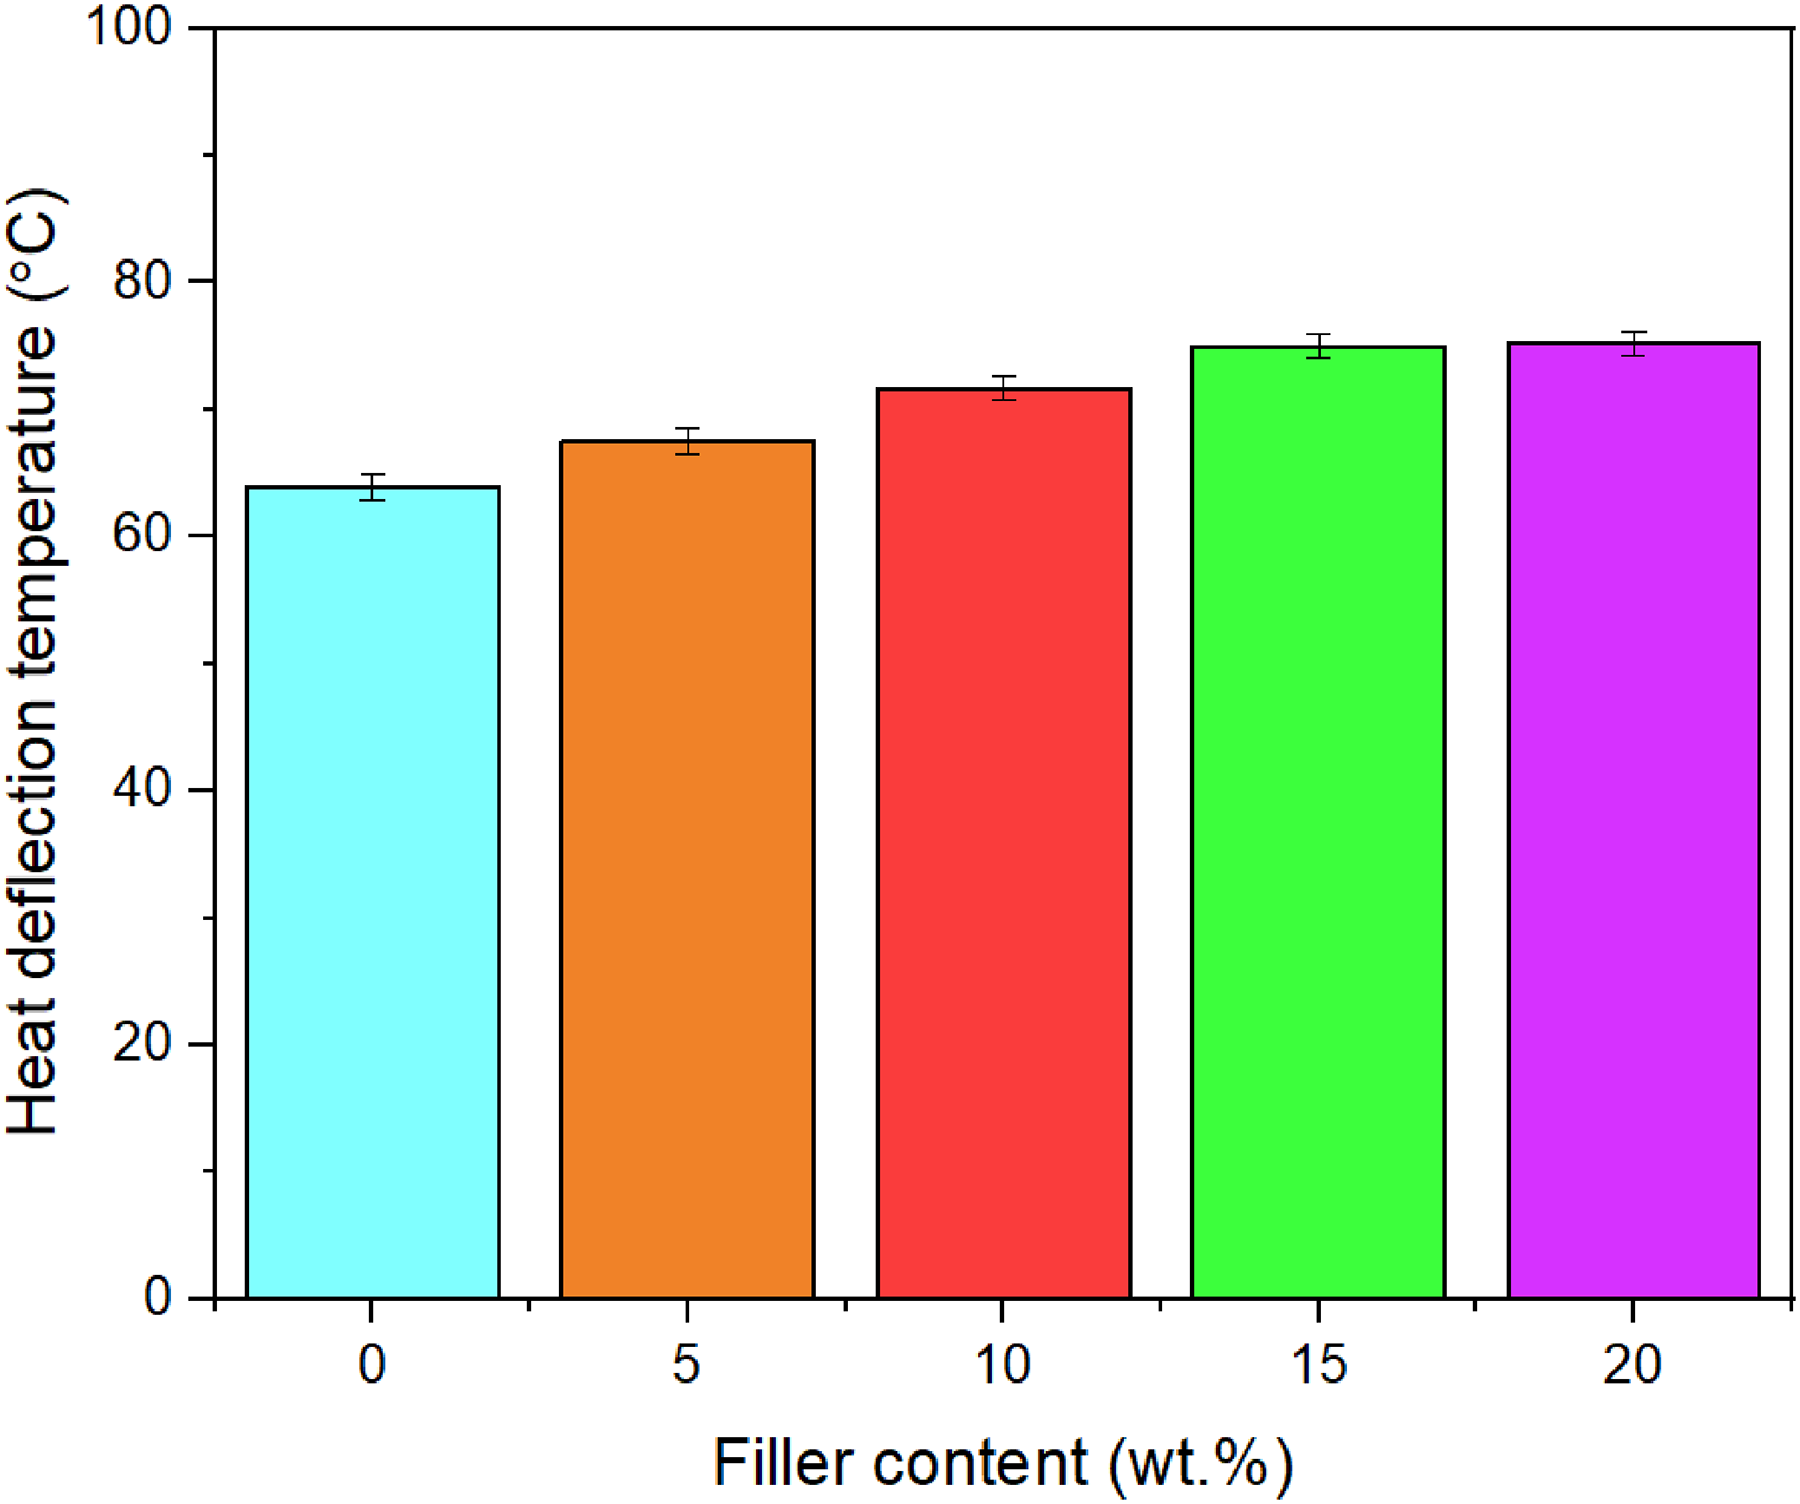
HDT of rHDPE/SiC composites.
When the filler content was 20 wt-%, The HDT come to 75.2 °C, which was 11.3 °C higher than that of rHDPE. This might be due to enhancement of the force by the addition of filler content, between the rHDPE molecular chains, and hindering their movement, hence resulted in improved resistance to bending deformation, so that hardening the matrix. The similar findings were reported by Kim and Cho 48 and Sun et al. 49 with kenaf fibre/polypropylene composites and polylactic acid/aromatic hyperbranched polyamide.
Thermal conductivity
Figure 10 represents the thermal conductivity at three different temperature ranges (30, 60 and 90 °C) of the pure HDPE and HDPE/SiC composites. The graph (Figure 10) depicts that the thermal conductivity at various temperature range were increased. This could be attributed to the SiC direct interaction with one another within the polymer matrix, which allowed an electron to successfully travel through the pathway they had previously established. Enhancing thermal conductivity required the covalent functionalisation of SiC and its interaction with the polymer matrix. Li et al. 50 found similar findings with polymer composites with boron nitride and Huang et al. 51 obtained same type of results with graphene based polymer nanocomposites.
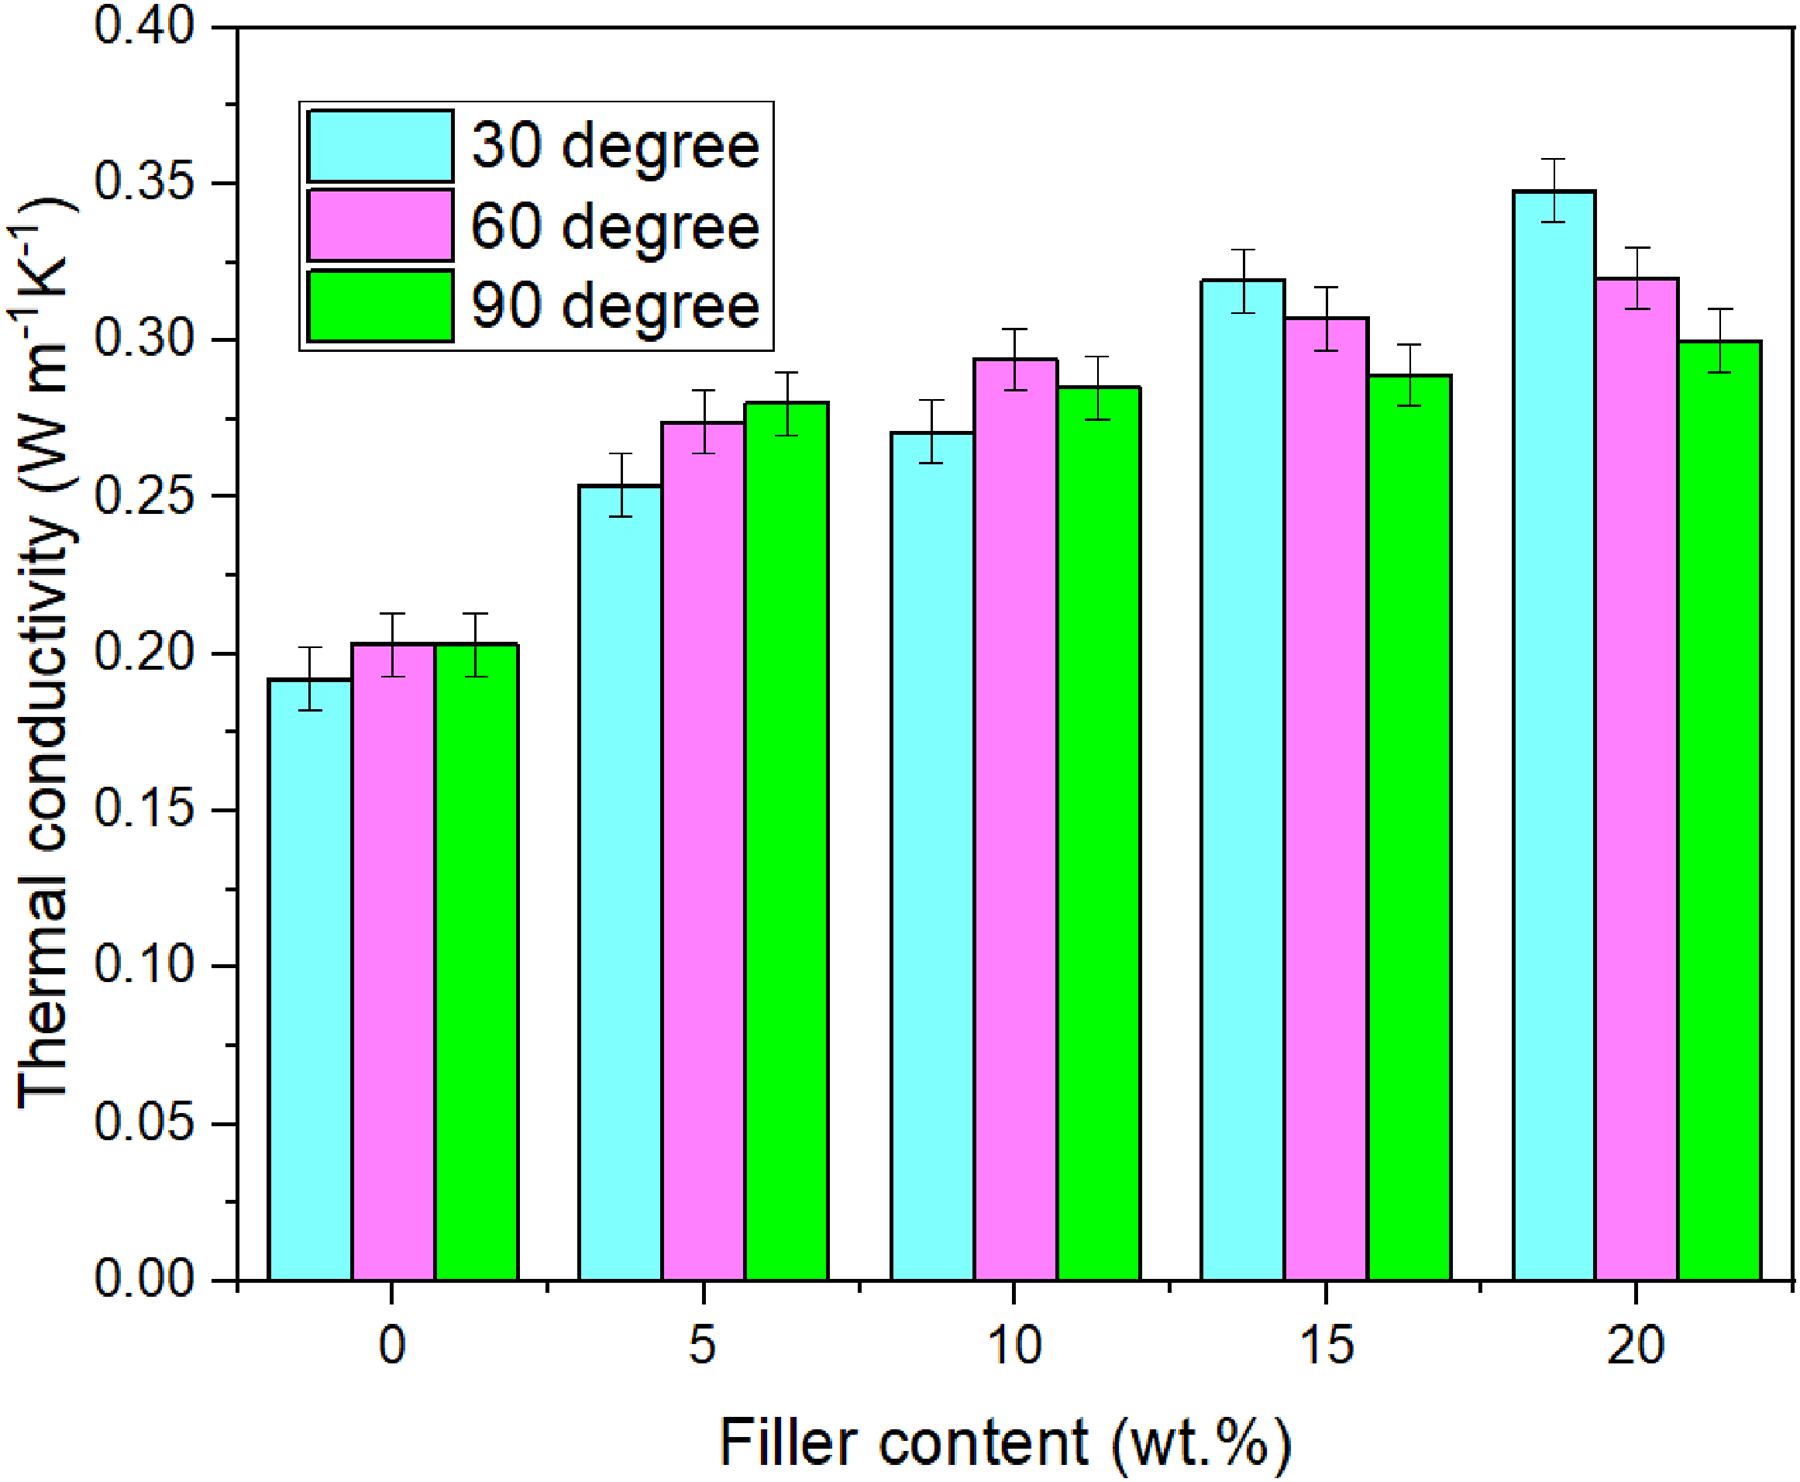
Thermal conductivity of rHDPE composites.
Structural properties
Fourier transform infrared
Figure 11 presented the FTIR spectra of rHDPE, rHDPE/5 wt-%, rHDPE/10 wt-%, rHDPE/15 wt-%, rHDPE/ 20 wt-% SiC composites. As observed from Figure 11, the predictable transmittance peak at 1461.95 cm-1 for rHDPE communicate to the C–H rocking of amorphous region in rHDPE and C–H bending of rHDPE structure. Additionally, peaks are depicts at 2847.99 and 2915.23 cm-1 due to methyl group (C–CH3) and –CH2 stretching, respectively. Whereas peaks noticed to functional groups of rHDPE at 2915.33, 2847.97, 1461.95 and 718.44 cm-1, additional peaks are detected for rHDPE/SiC composite at 1381.01 and 730.08 cm-1. Which communicate to PO4-3 and O–H groups. Some more peaks at 606.74 cm-1 most likely concern to chemical interconnection between SiC and rHDPE matrix. The similar findings were obtained by Essabir et al. 52 and Cho et al. 44 of treated argan nut shell/polyethylene and carbon fibre-reinforced thermoplastic polyketone composites, respectively.
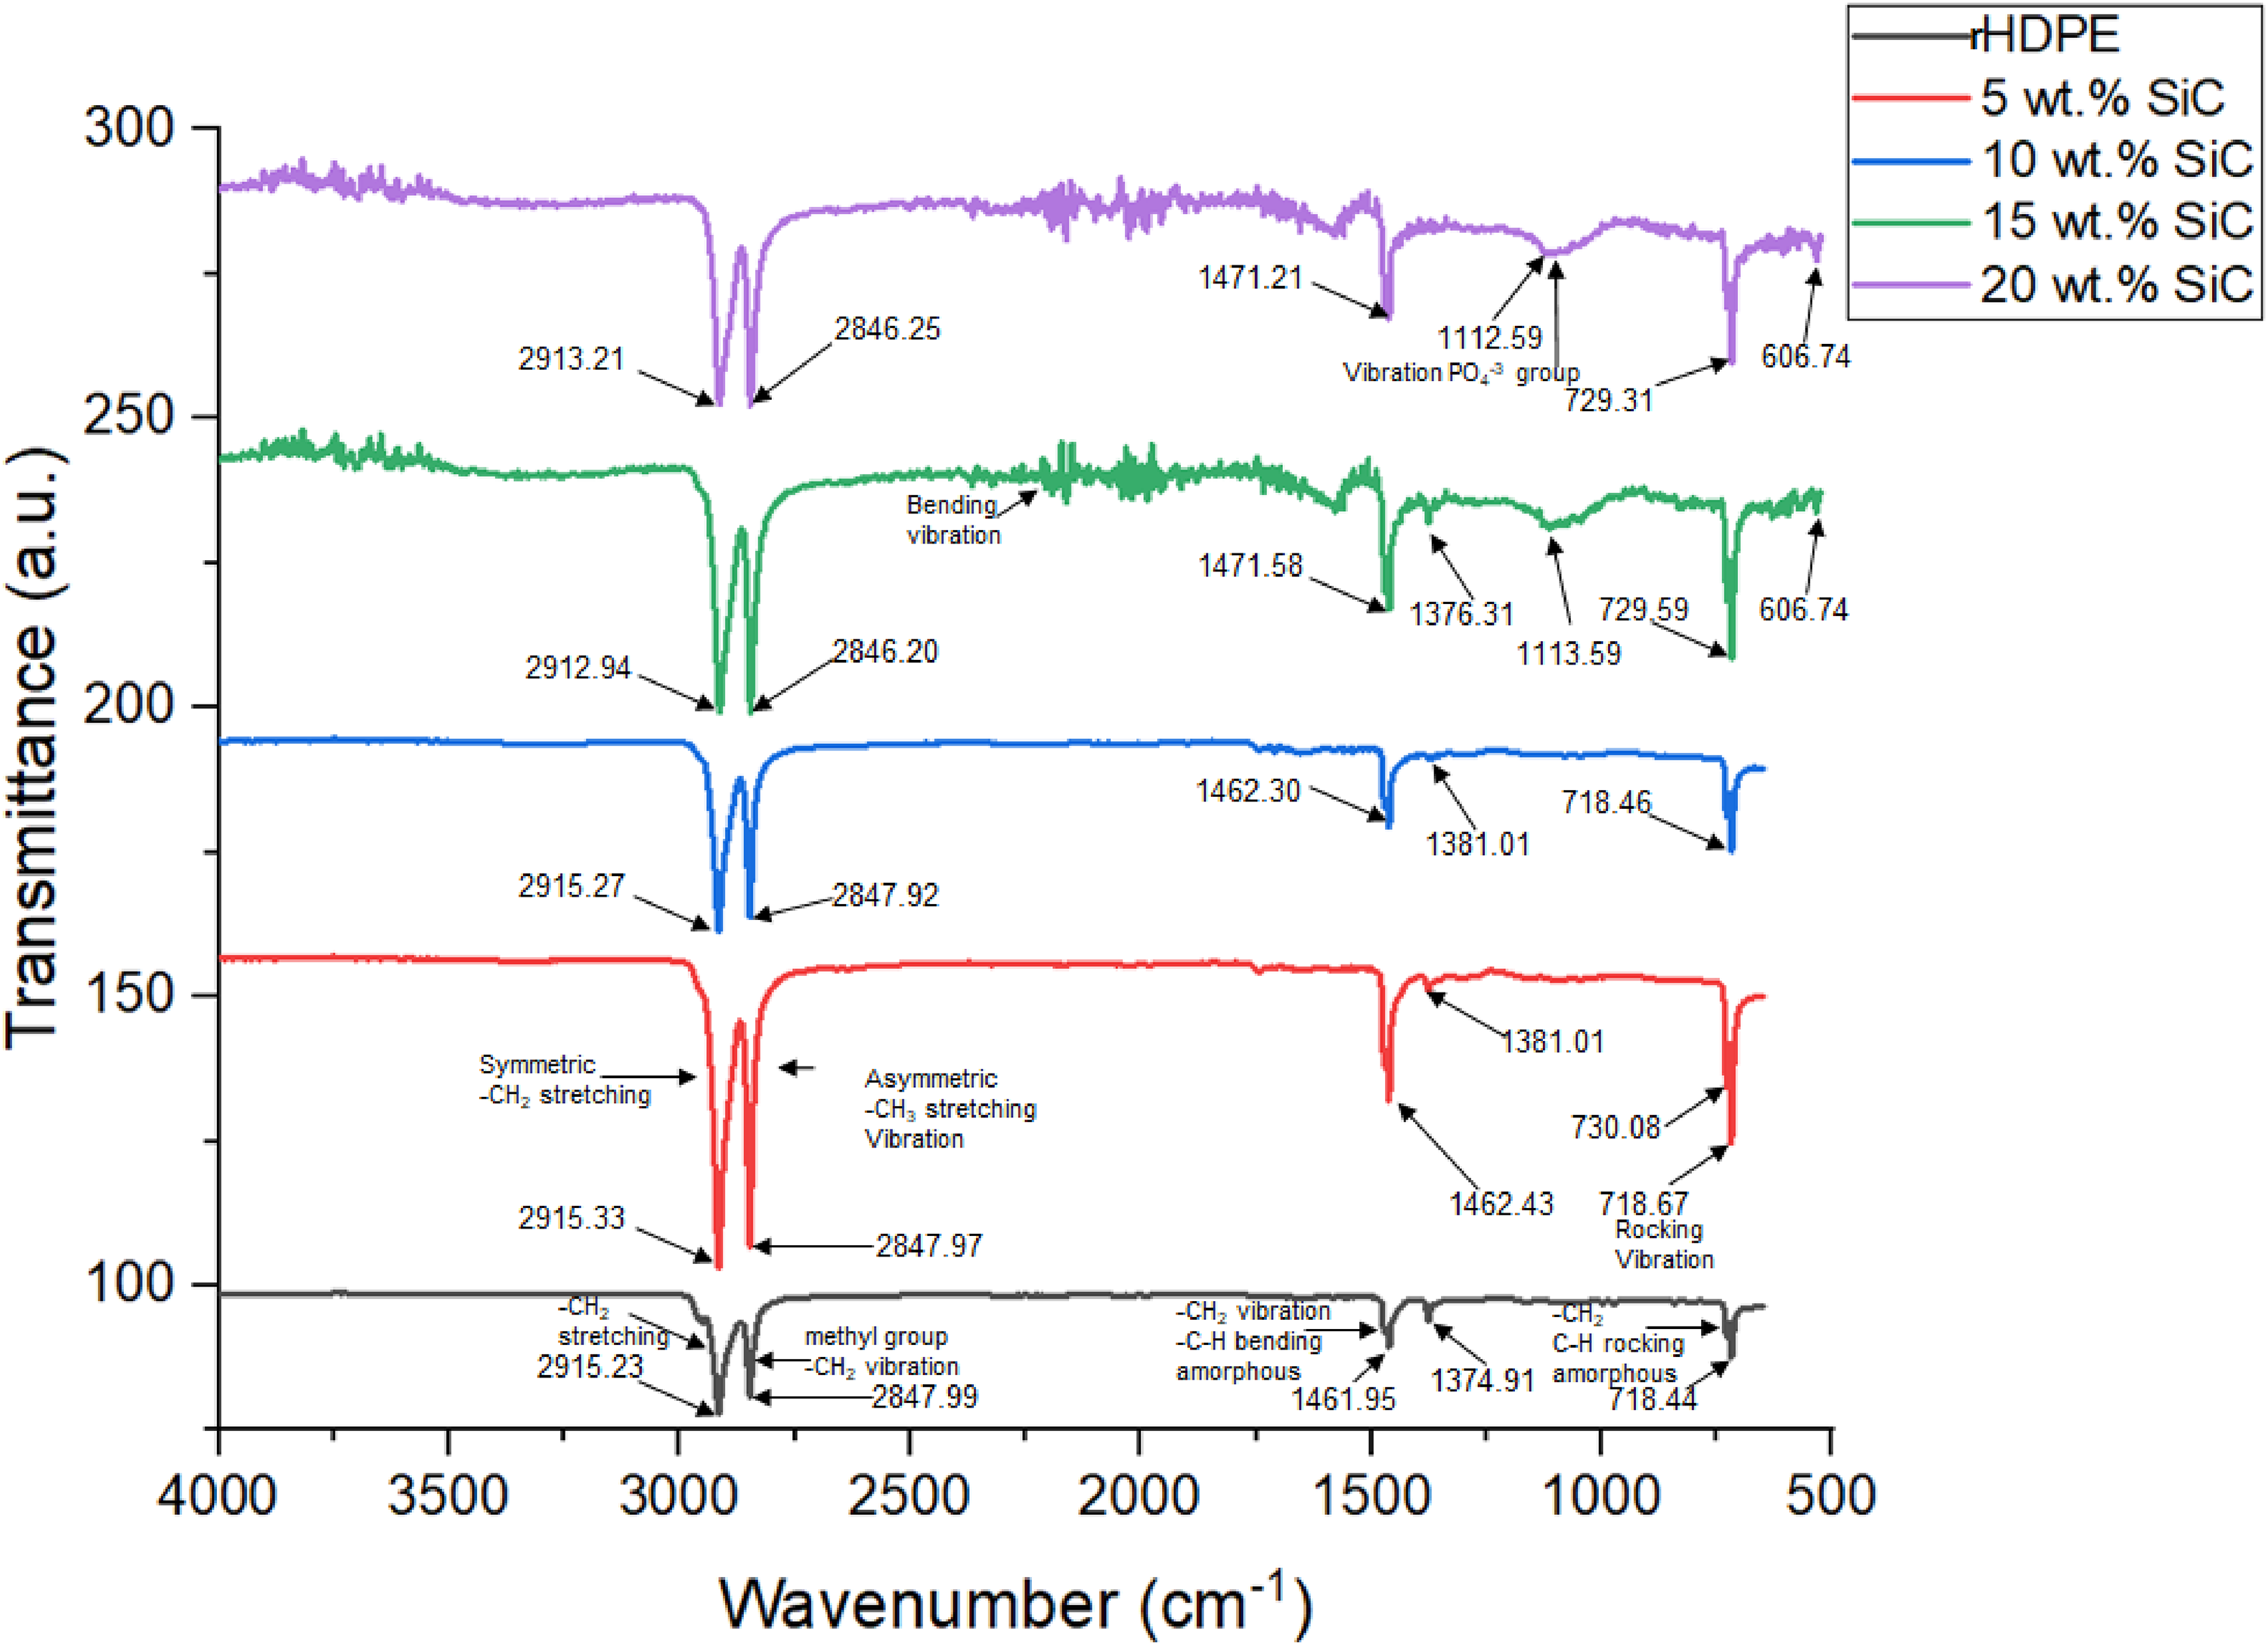
FTIR spectra of HDPE/SiC composites.
Melt flow index
As we are increasing the value of filler content (5, 10, 15 and 20 wt-% SiC), MFI of composite reduces from 0.194 to 0.032 g/10 minutes (see Figure 12). This might be due to interaction between the filler and the matrix, which results in difficult in chain movement and hence reduces the composite's flow ability. However, incorporation of filler in matrix increases the viscosity and reduces the elasticity of the material; this can also be the reason. Liu et al. 53 obtained similar results with polylactic acid/wood plastic composites.
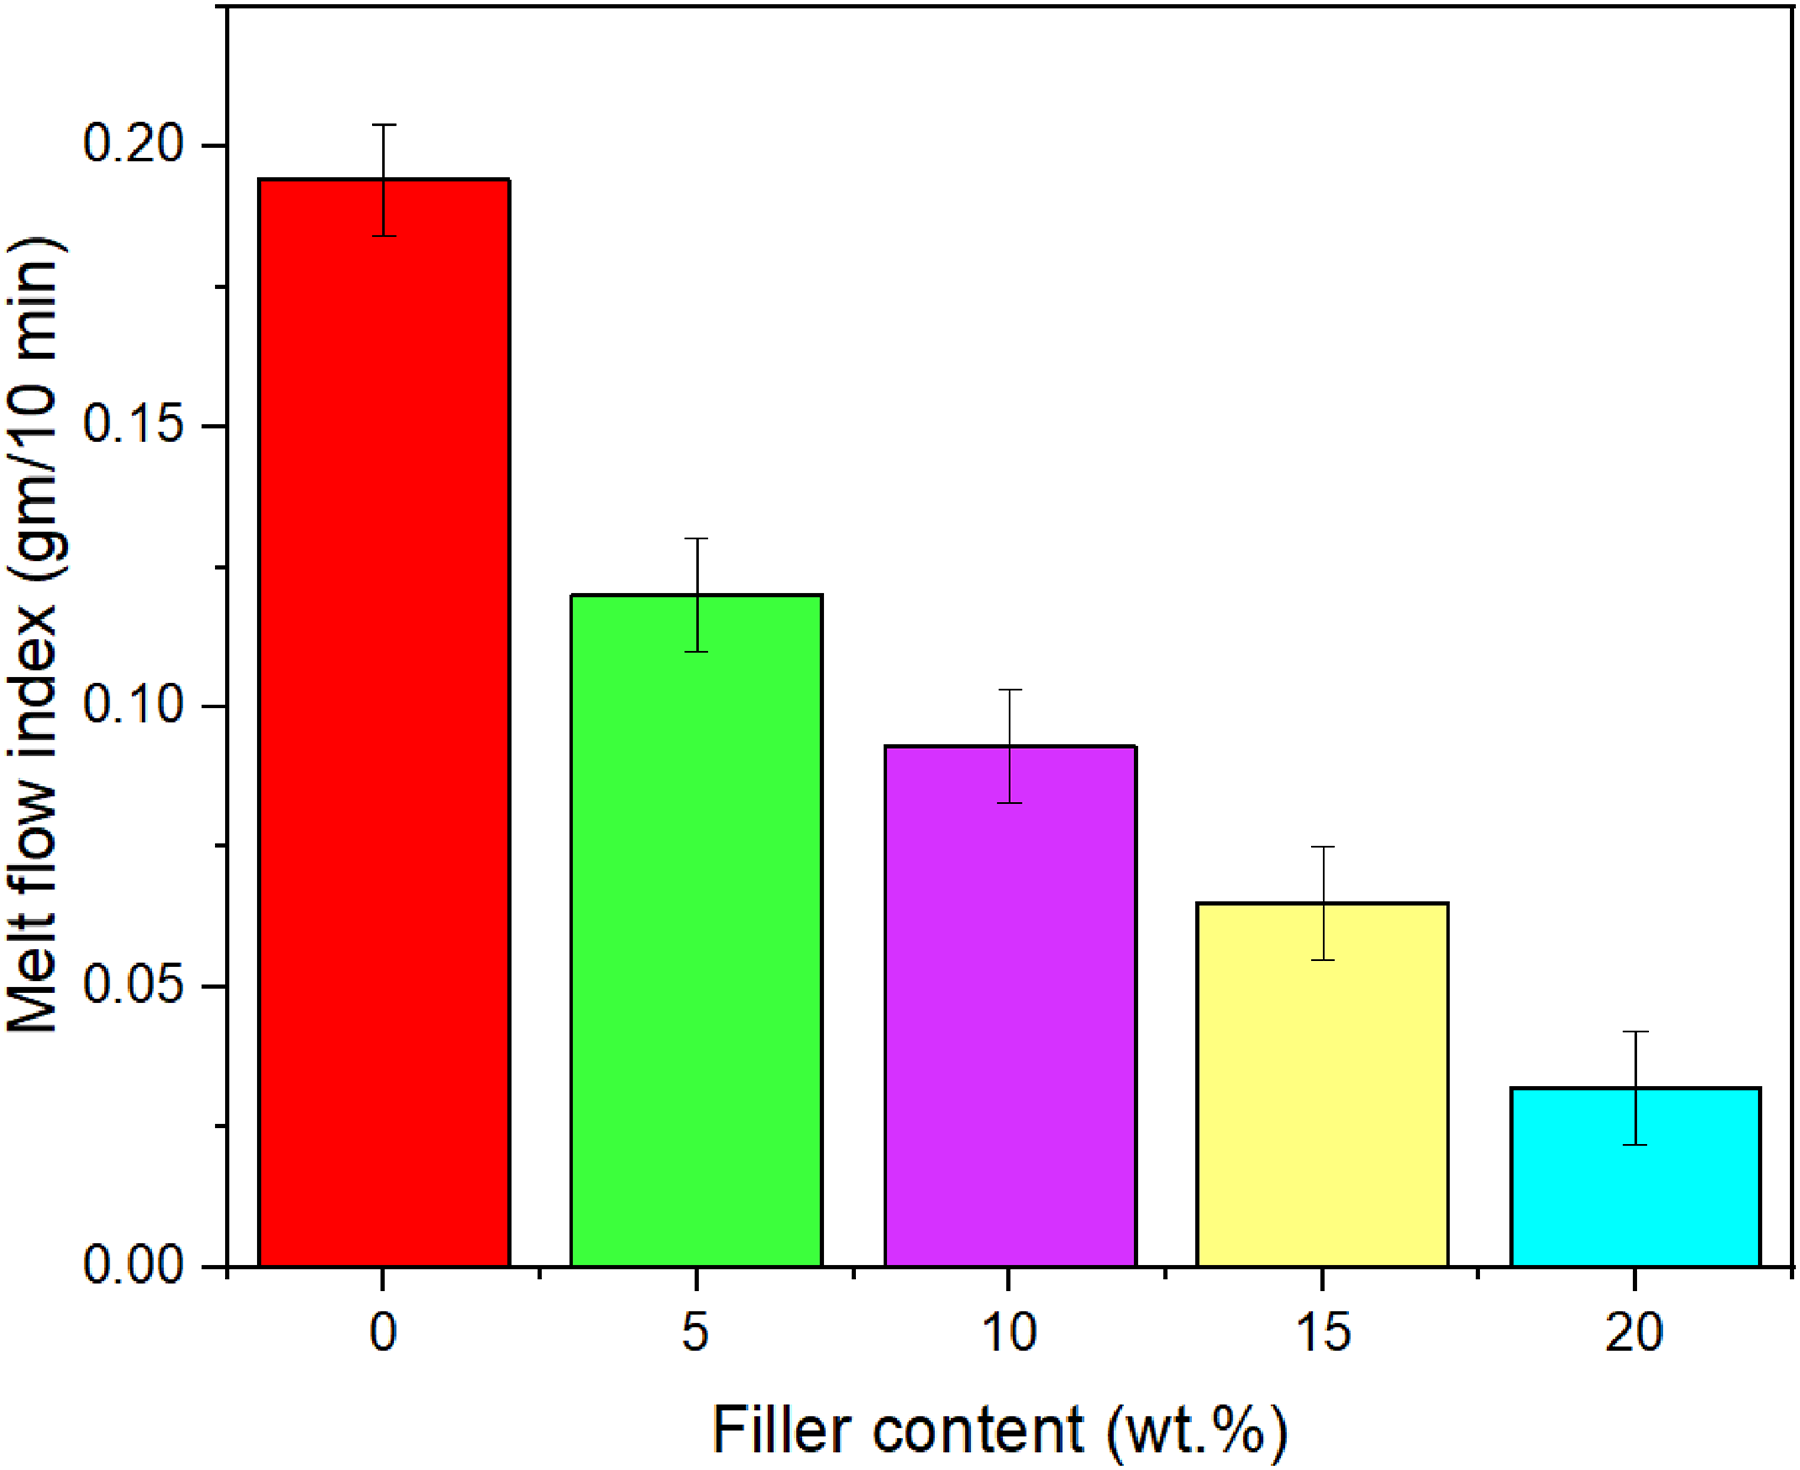
MFI of rHDPE/SiC composites.
Contact angle
Figure 13 depicts the static contact angle of HDPE/SiC composite surface, and it has been observed that the composite surface containing more HDPE content suggested hydrophobicity behaviour with an angle of 77.33°. Although the contact angle has significantly dropped up to 57.12° whenever SiC content is more than HDPE within the designed composite, lower contact angle is apparently due to accumulating the roughness of the composite surface acquired by SiC contents. The dropping in contact angle values is expected due to the hydrophilicity of the SiC filler content in the HDPE matrix. The similar trend obtained from contact angle of rHDPE/SiC composites are in agreement with the work of Zheng et al. 54
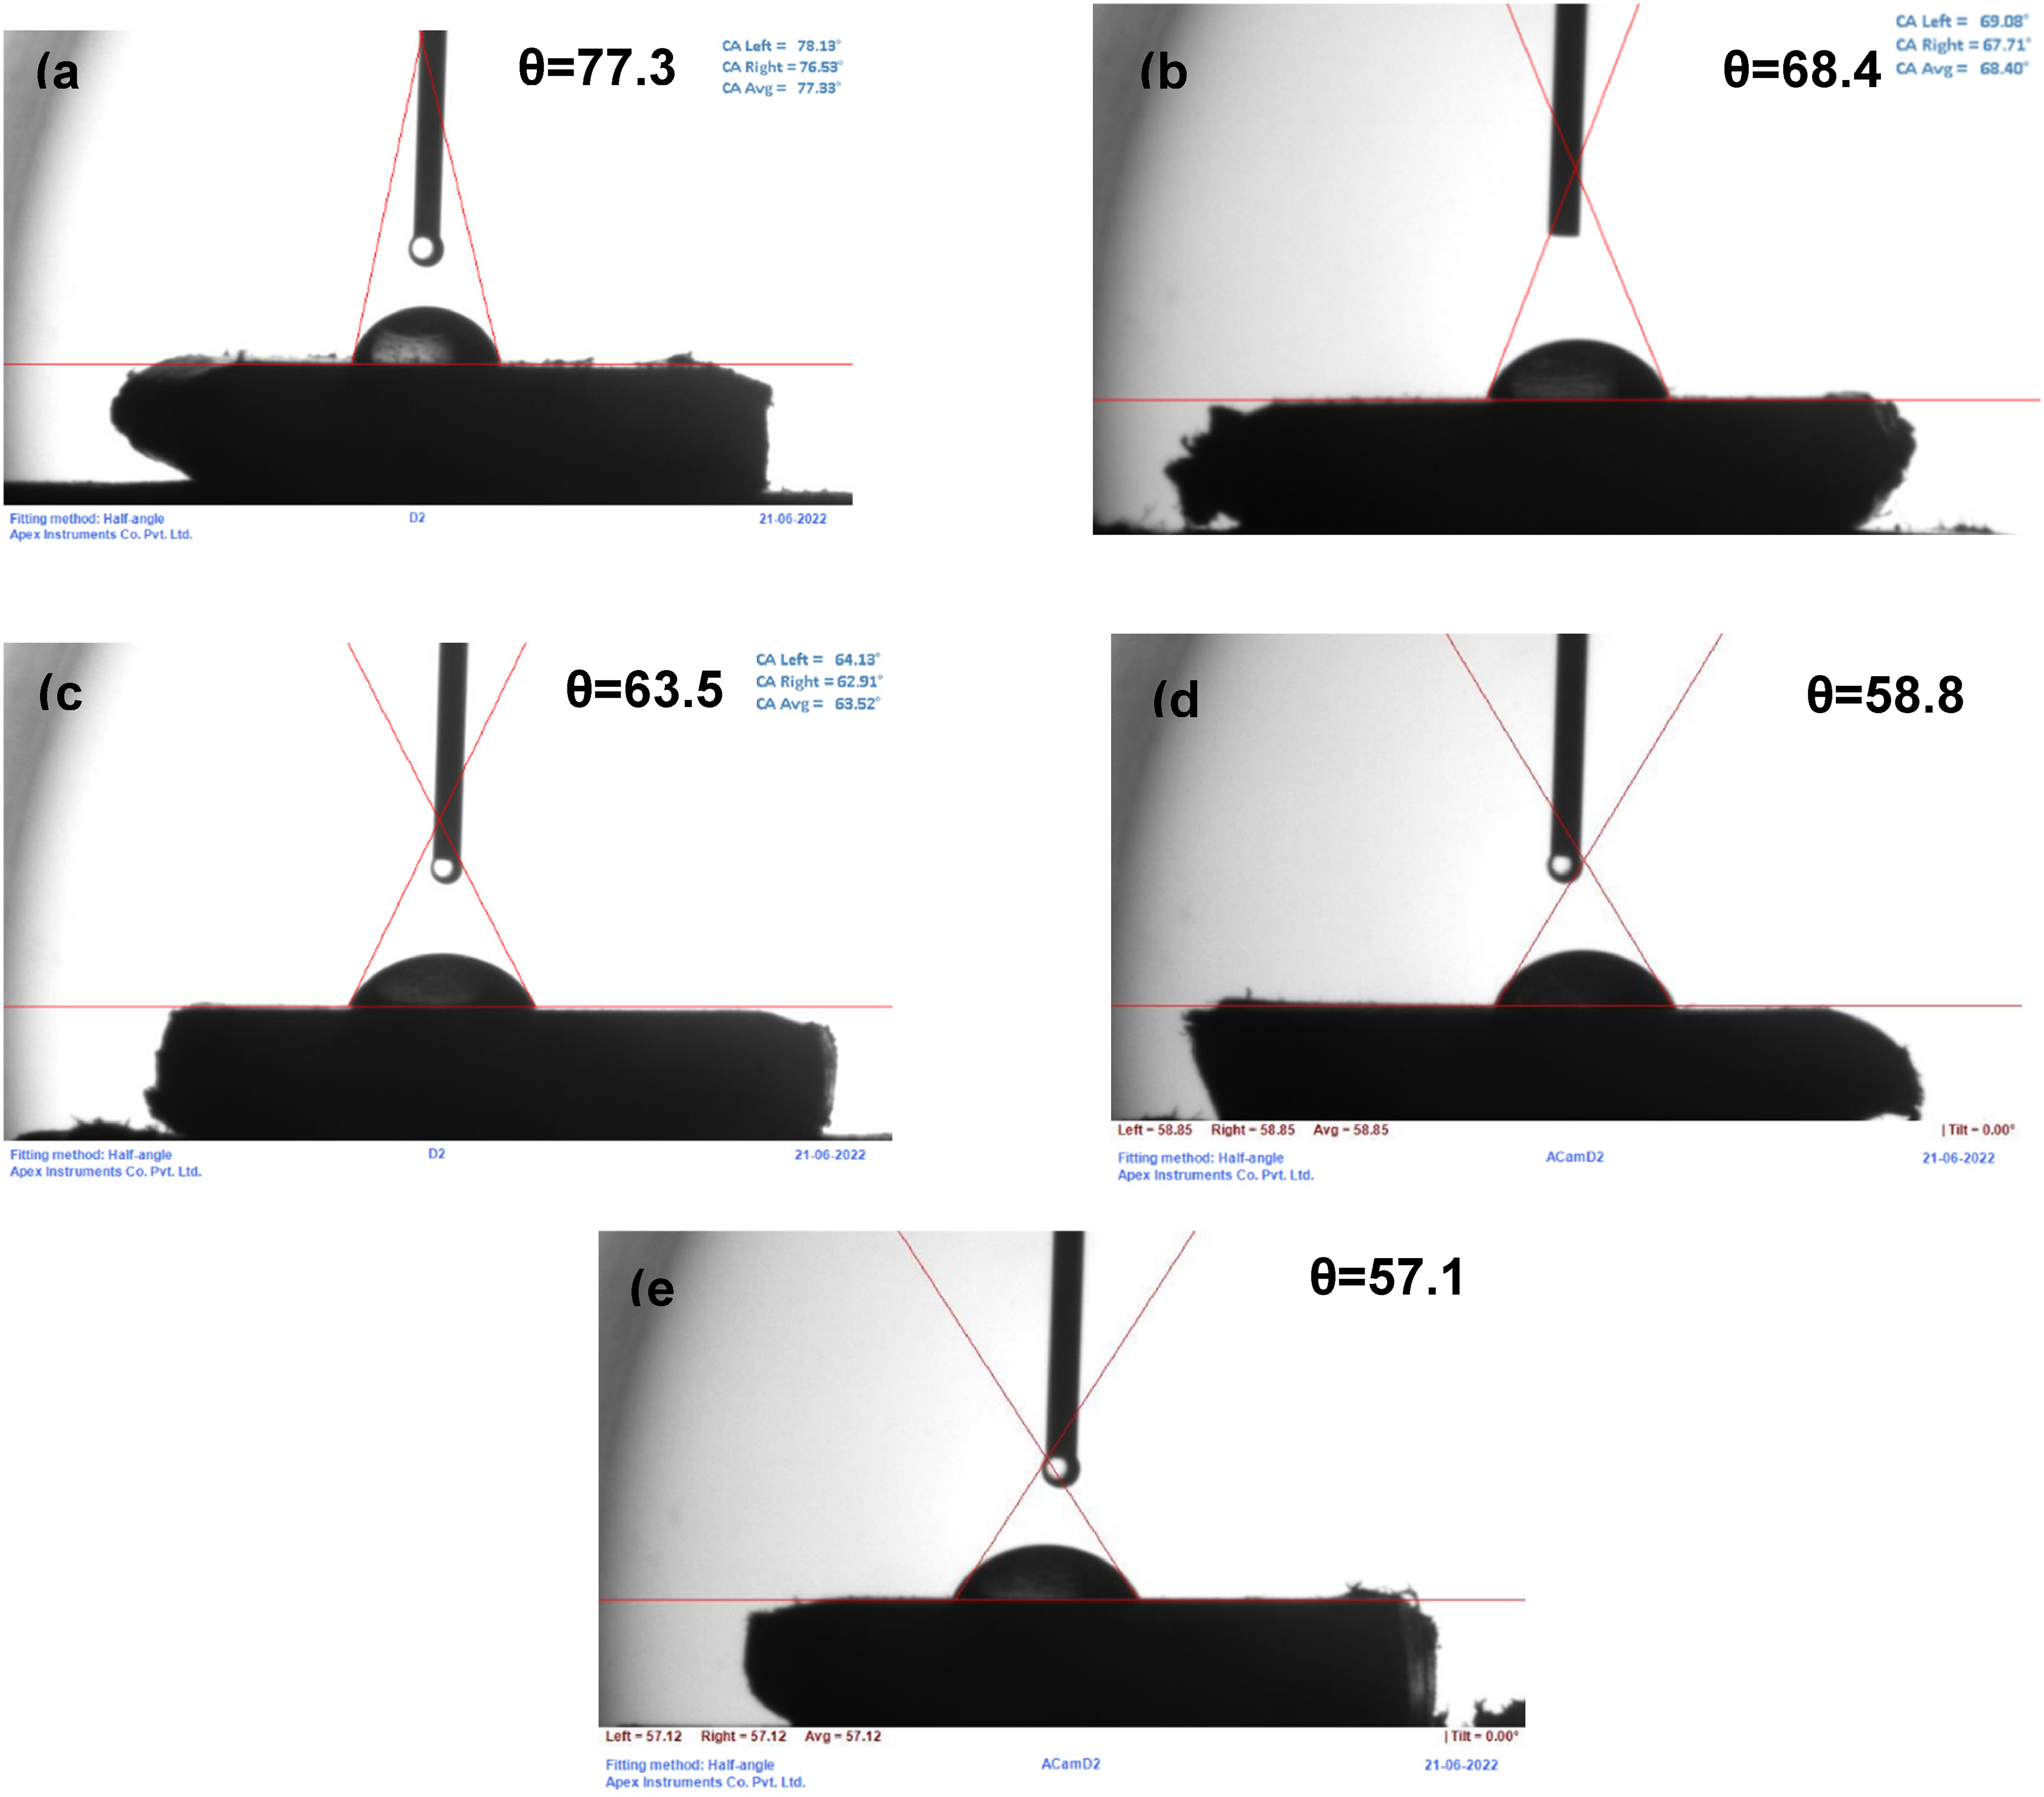
Contact angles: (a) rHDPE, (b) 5 wt-% SiC, (c) 10 wt-% SiC, (d) 15 wt-% SiC and (e) 20 wt-% SiC.
Rheological properties
The variation of complex viscosity with frequency with different SiC contents was presented in Figure 14. As shown in figure, the complex viscosity as a function of frequency. The complex viscosity decreases with the rise in frequency. This mainly due to decayed rHDPE molecular chains, which act as plasticizing medium during the rheological test. The prolonged time, increased temperature as well as frequency, the more the deterioration of the rHDPE chains, which results in speed up the decrease of the complex viscosity of the rHDPE/SiC composites. The similar findings were reported by Sahu et al. 55 with multidimensional carbon nano filler/HDPE composite.
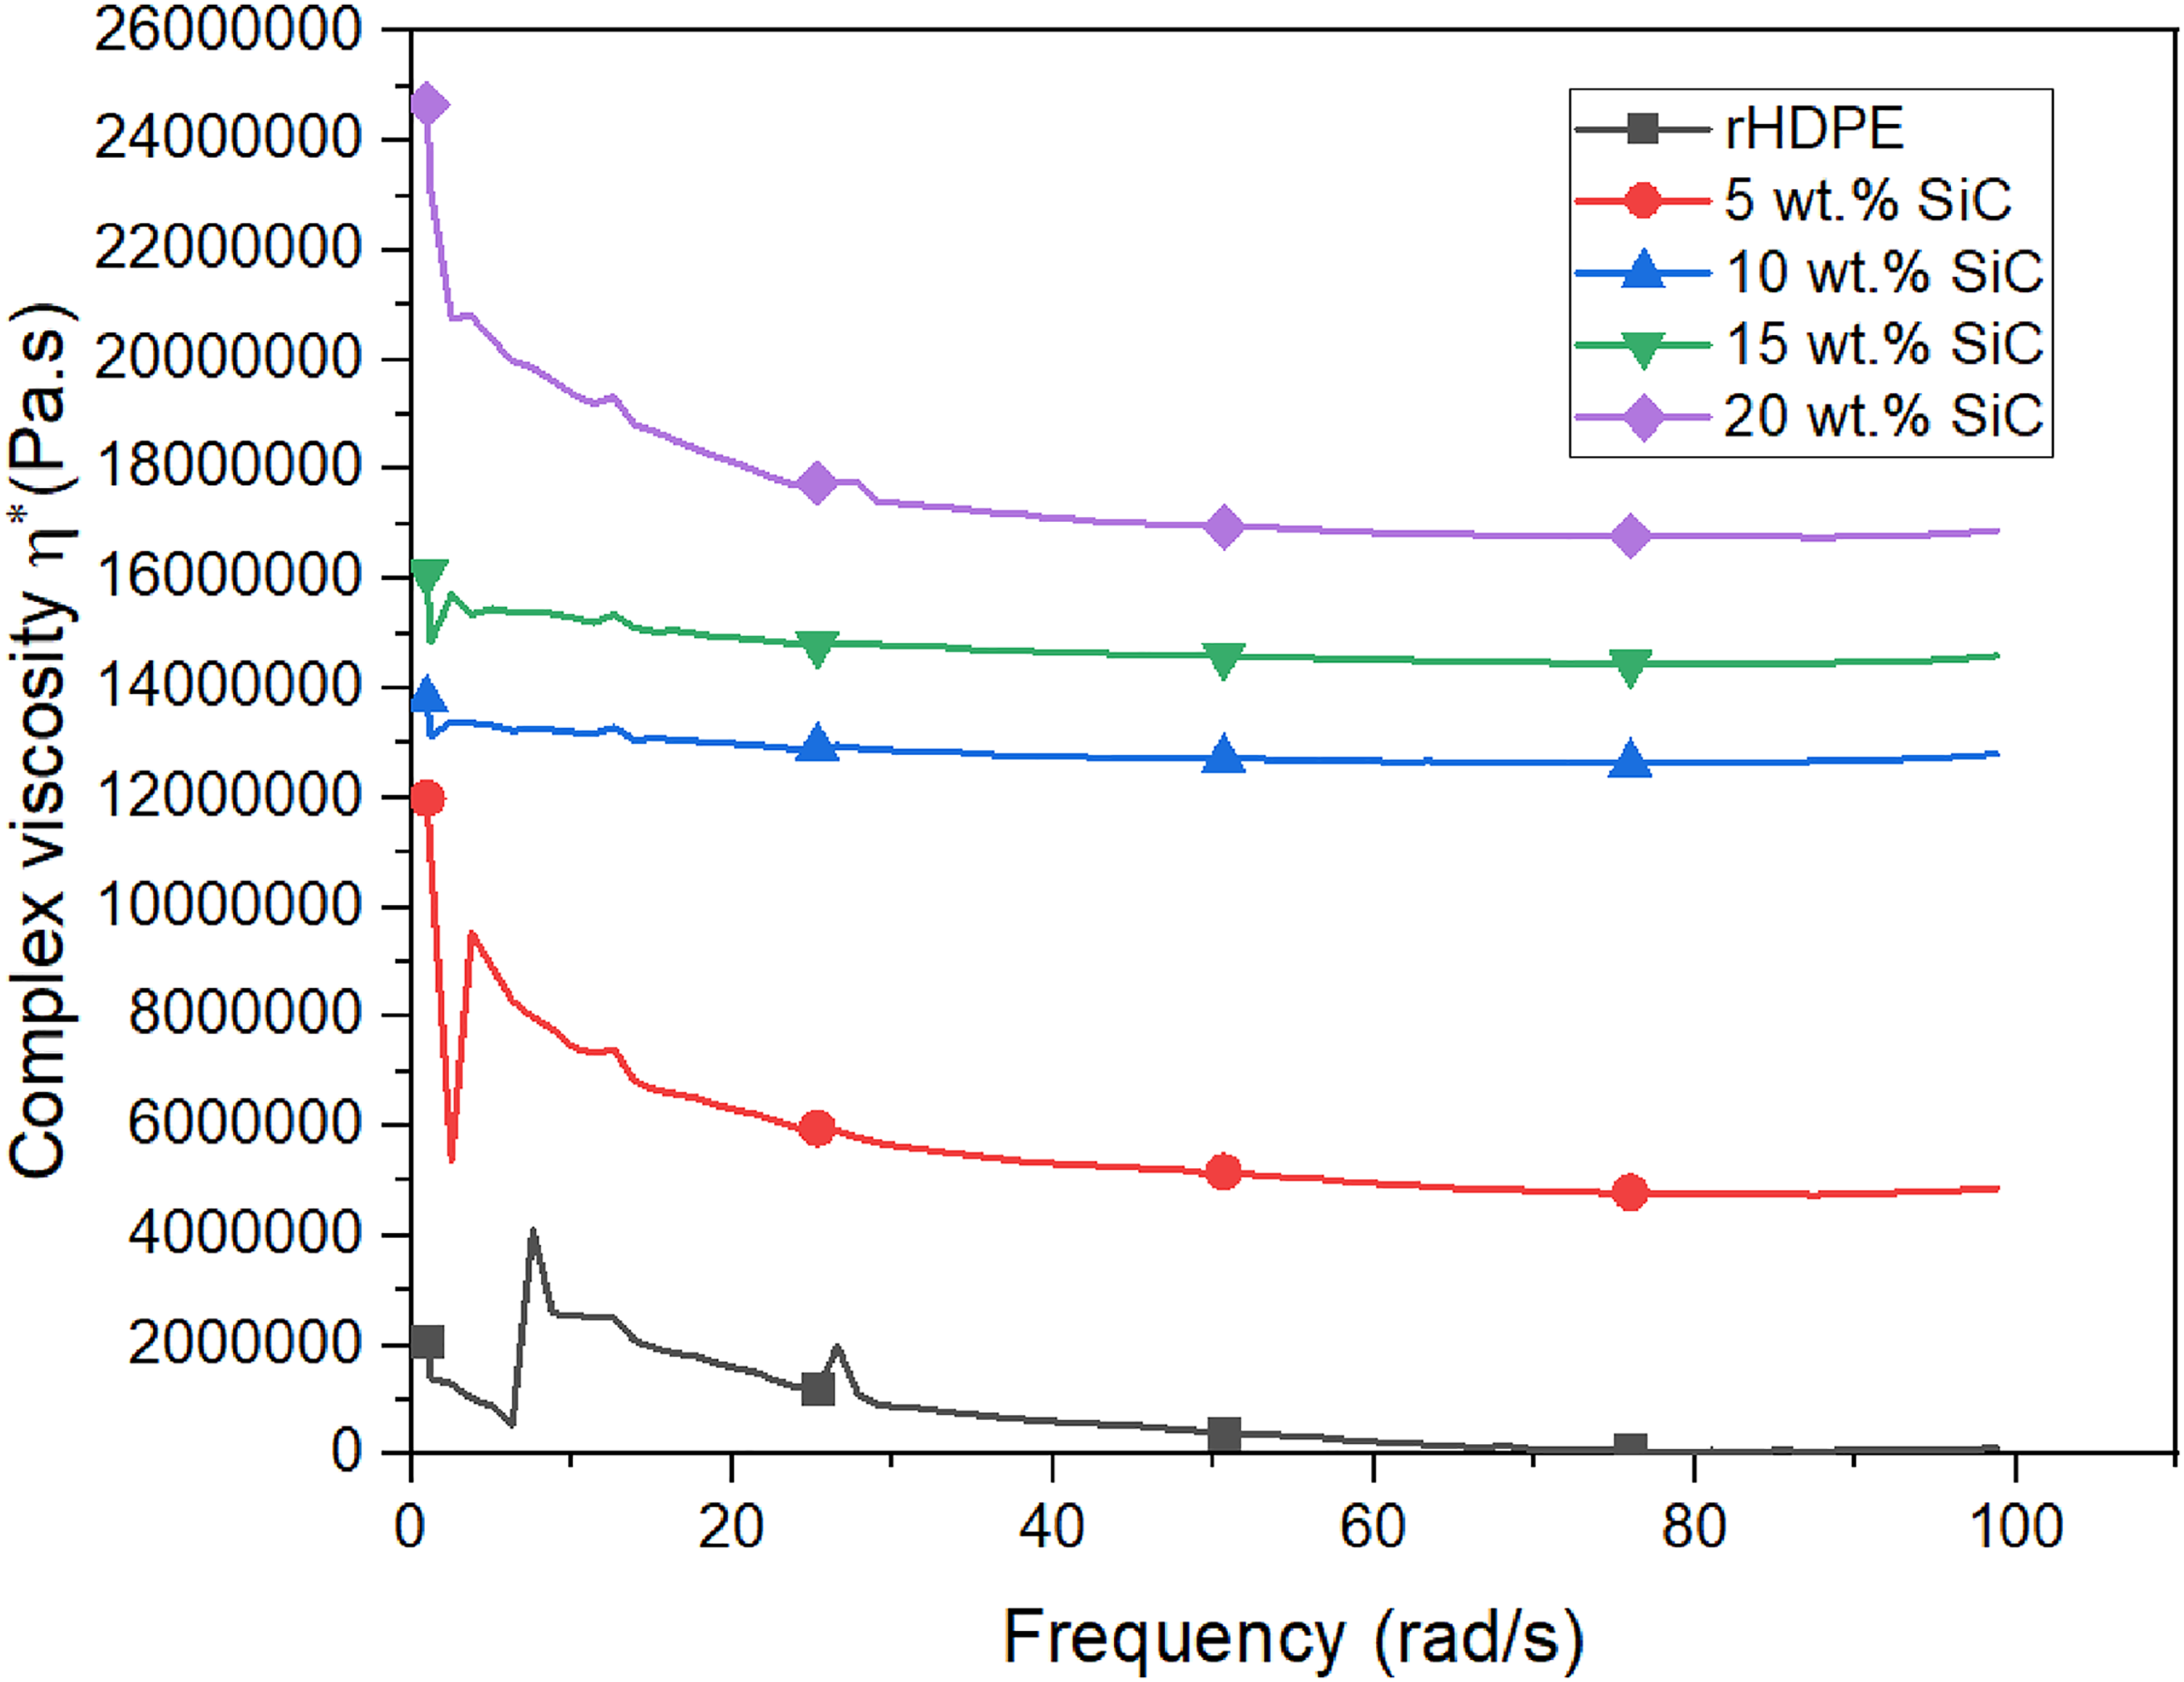
Complex viscosity of rHDPE/SiC composites.
Morphological properties
SEM images of rHDPE and rHDPE/SiC composites are shown in Figure 15. Figure 15(a) represents the rHDPE specimen. It has been observed that the broken rHDPE tensile test specimen includes lot of cavities (Figure 15(a)). The cavities were very deep and large because the tensile strength and flexural strength and hardness is low, which results in very rough surface with deep cavities. When we observe Figure 15(b), the deep cavities were diminished and only some broken polymer particles were seen. This might be due to increase in hardness (see Figure 4), increase in tensile strength and modulus (see Figure 2(a) and (b)). As we observe Figure 15(c), the surfaces of the broken specimen (10 wt-% SiC) consists of shallow cavity compare to deep and large cavities in rHDPE. This might be due to incorporation of hard SiC particles, results in increase the hardness of the composite (see Figure 4) and enhancement of bending strength (see Figure 3(a) and (b)). Figure 15(d) reveals only smaller broken polymers on the surface but cavities were not present with the higher percentages of filler, this might be due to better tensile strength and flexural strength at 15 wt-% composite compare to other composites. Hence, as we increased the filler content further to 20 wt-%, the formation of deep and wide cavities obtained (Figure 15(e)), this might be due to decrease in strength and modulus of the composite.
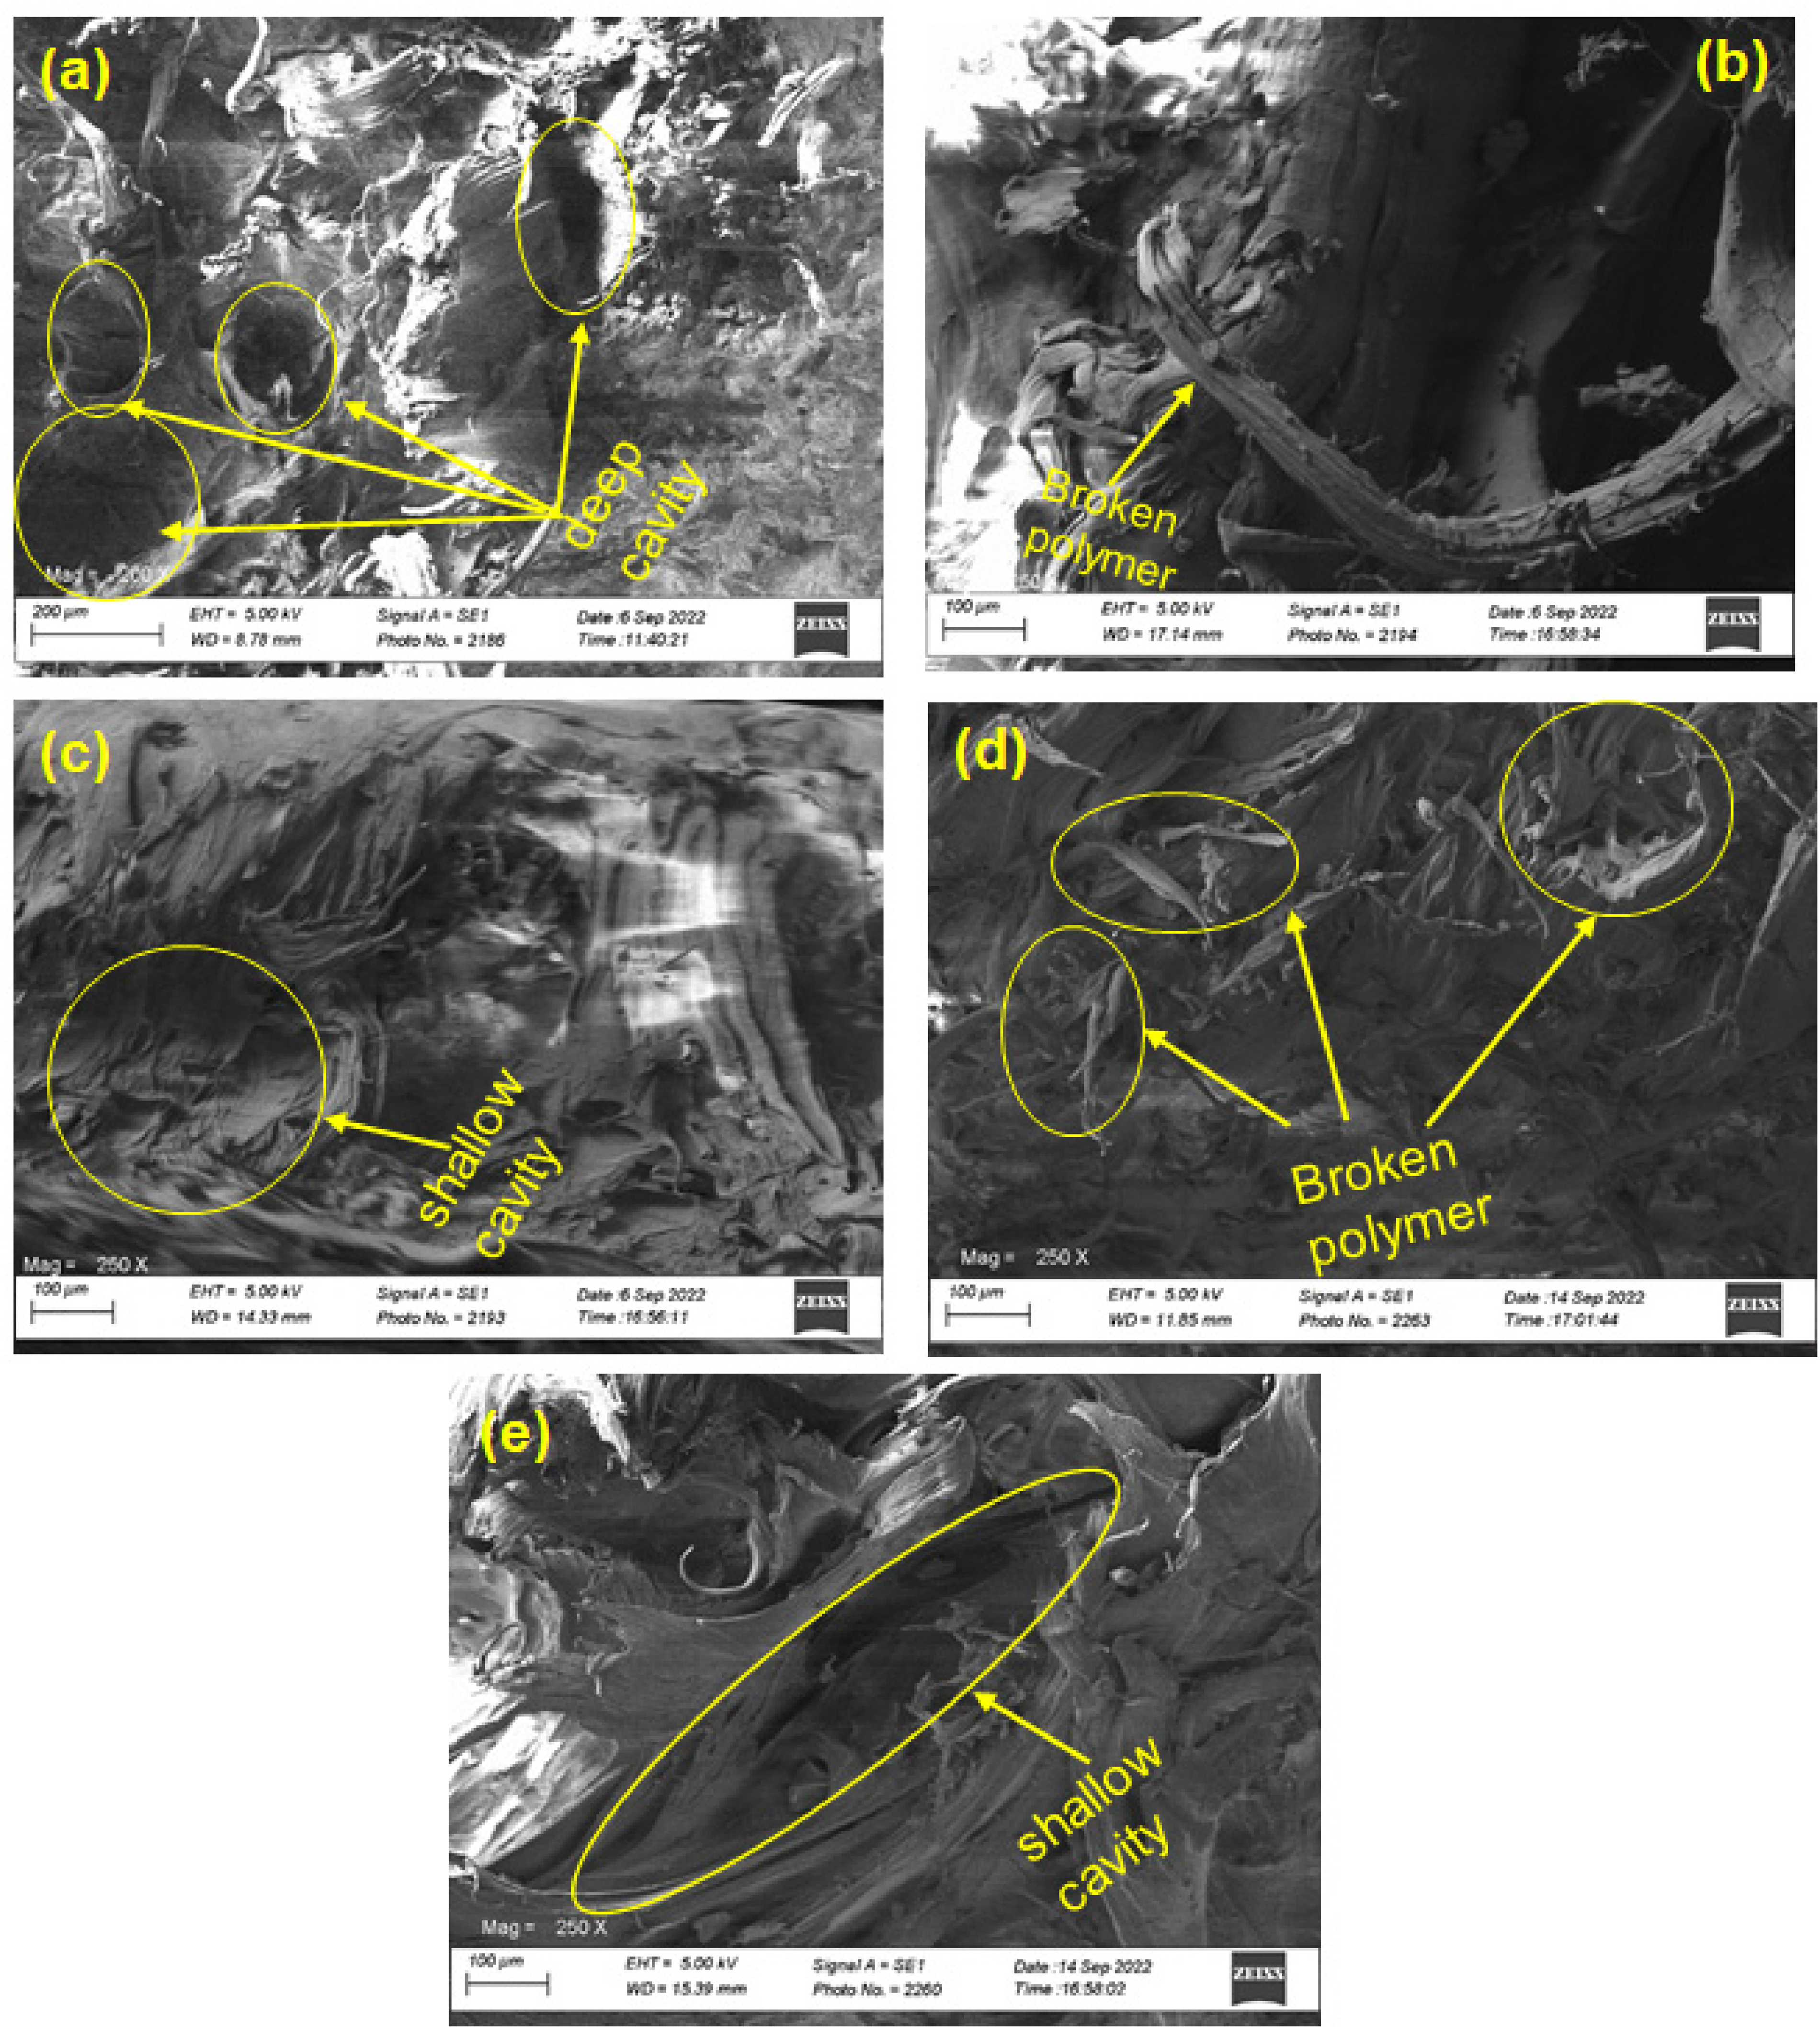
SEM micrographs of tensile broken specimens: (a) rHDPE, (b) 5 wt-% SiC, (c) 10 wt-% SiC, (d) 15 wt-% SiC and (e) 20 wt-% SiC.
Therefore, the SEM results revealed that there is proper interaction between the filler and the matrix at higher weight fractions. This is attributed by the agglomeration of SiC after 15 wt-% SiC.
Conclusions
It was revealed at the end of the research that the mechanical properties enhances with the addition of filler content. The hardness value is maximum at 20 wt-% SiC composite (148 MPa). The density of the developed composite increases from 0.9434 to 1.0761 g/cm3. The impact strength at 15 wt-% SiC composite (25.152 kJ/m2) was optimum compare to other composites. The DSC curves concluded that the melting point of the composite increased with the addition of filler (Tm increased from 133.52 to 140.75 °C). The TGA analysis revealed that the residual value of rHDPE composites increases with the rise in filler content (5.10–8.36%). The HDT value increased from 63.9 to 75.2 °C. It was concluded from the Thermal conductivity test with (30, 60 and 90 °C) temperature range that the thermal conductivity of the composites increased with the filler content; hence, 30 °C temperature range of thermal conductivity shows optimum results in all composites. The MFI results concluded that MFI of composites reduced (0.194–0.032 g/10 minutes). The contact angle revealed the hydrophilicity nature of rHDPE/SiC composite. The SEM images revealed that there were large and deep cavities at rHDPE composite. However, rHDPE/SiC composite morphology concludes shallow cavity with small broken polymer on the surface at 15 wt-% composite. Hence, it was concluded by the above research that the reuse of waste HDPE materials as starting materials for the development of new product is an area of research that should be advanced.
Footnotes
Acknowledgements
The authors are grateful to the Department of Chemicals and Petrochemicals, Ministry of Chemicals and Fertilizers (DCPC), Government of India for sponsoring of “Centers of Excellence” in the field of Petrochemicals.
Declaration of conflicting interests
The authors declared no potential conflicts of interest with respect to the research, authorship, and/or publication of this article.