
Abstract
Objective:
To apply an automated computerised method to categorise and determine the prevalence of different types of lip traits, and to explore associations between lip traits and sex differences.
Design:
Observational descriptive study utilising an automated method of facial assessment.
Setting and participants:
A total of 4747 children from the Avon Longitudinal Study of Parents and Children (ALSPAC) who each had 3D facial scans carried out at 15 years of age.
Methods:
Each of the participants was automatically categorised regarding predetermined lip morphological traits. Descriptive statistics were applied to report the prevalence of the different types of each trait, and chi-square tests were used to investigate sex differences and associations between traits.
Results:
A total of 4730 individuals were assessed (47% male, 53% female). Eight predetermined lip traits have been reported previously. There were differences in prevalence for all lip traits in male and female patients (all P ⩽ 0.0002), with differences between the sexes described for each trait. For example, a deeply grooved philtrum of average width was more prevalent in boys, and an indentation near the upper vermilion border was more prevalent in girls. Each of the traits was significantly associated with the other traits (all P < 0.0001), with particularly strong associations seen between traits in the same region (e.g. upper lip). Individual associations between traits are reported; for example, a straight lip contour was found to be associated with no true vermilion border in both the upper and lower lip regions.
Conclusion:
The automated computerised method described is an invaluable tool for the categorisation of lip morphological traits. The prevalence of various types of traits has been described. Sexual dimorphism exists for all the lip traits assessed. Generally, each of the traits are associated with all other traits, with individual associations reported.
Keywords
Introduction
Routine assessment of the orthodontic patient includes assessment of the lips, as they are known to influence overall facial attractiveness, aetiology of malocclusions and the stability of the outcome of orthodontic treatment (Burstone, 1967; Mills, 1966; Proffit, 1978). In addition to simple chairside assessment, there has been a drive to standardise morphological assessment using a number of methods – for clinical and research purposes. These methods include anthropometry (the study of measurements and proportions), morphometry (the study of form), cheiloscopy (the study of ‘lip prints’) (Suzuki and Tsuchihashi, 1970) and Likert scales. Likert scales have been developed to aid the diagnosis of fetal alcohol syndrome, which presents with characteristic facial features including a smooth or flat philtrum shape (Astley, 2004; Astley and Clarren, 1995), as well increased prevalence of learning disability and behavioural problems (Hoyme et al., 2005). Similar scales have also been produced to facilitate classification of philtrum shapes, for example, with respect to surgical cleft repair (Mori et al., 2005), and to describe discrete morphological traits in a population using a visual scale, for example, the Wilson-Richmond Scale (Wilson et al., 2012; Wilson-Nagrani, 2016). Recently, an automated lip identification system has been developed (Abbas, 2017; Abbas et al., 2015, 2018, 2019) to overcome the laborious and time-consuming task of manually identifying lip traits and improve consistency in categorisation.
The aims of this study were to apply this automated method to categorise and determine the prevalence of different types of lip traits in the population, and to explore the associations between lip traits and sex differences.
Materials and methods
The sample comprised individuals from the Avon Longitudinal Study of Parents and Children (ALSPAC), a birth cohort study that recruited 14,541 pregnant women living in the Bristol area during 1990–1992 and in which 96% of the cohort reported their ethnicity as white. When the oldest children were approximately seven years of age, the initial sample was bolstered, bringing the total number of fetuses to 15,589, of which 14,901 were alive at one year of age (Boyd et al., 2013; Fraser et al., 2013). The study website contains details of all the data that are available through a fully searchable data dictionary and variable search tool (http://www.bristol.ac.uk/alspac/researchers/our-data/). During 2006–2007, at age 15, 4747 of the individuals had 3D facial scans obtained for analysis. The 3D image capture has been reported extensively (Kau and Richmond, 2008; Kau et al., 2005, 2006). Ethical approval for the study was obtained from the ALSPAC Ethics and Law Committee and the Local Research Ethics Committees. This includes all questionnaire content, analysis of the pre-existing dataset and acquisition of the facial scans (reference: 06/Q2006/53 Avon Longitudinal Study of Parents and Children [ALSPAC], Hands on Assessments: Teen Focus 3 [Focus 15+] [7 August 2006; confirmed 15 September 2006]). Informed consent for the use of data collected via questionnaires and clinics was obtained from participants following the recommendations of the ALSPAC Ethics and Law Committee at the time.
The automated lip traits were based on the Wilson-Richmond Scale (Wilson et al., 2012; Wilson-Nagrani, 2016). The automated categorisation (Abbas, 2017; Abbas et al., 2015, 2018, 2019) considered eight facial landmarks localised in the lip region as outlined in Figure 1 (subnasale, labiale superius, labiale inferius, pogonion, and bilateral christa philtri and cheilion). Geodesic paths, which represent the shortest distance on a surface between two points, were constructed between lip landmarks as outlined in Figure 1, using a combination of fast-marching and exact algorithms on the 3D facial scans. For lower lip tone, a geodesic path was constructed connecting both christa philtri points following the lower vermilion border, and four extra geodesic paths were replicated inferior to this path. By analysing the variation of these geodesic paths by means of Kmeans++, a type of cluster analysis, lip morphological traits were automatically identified and classified (Abbas, 2017; Abbas et al., 2019).
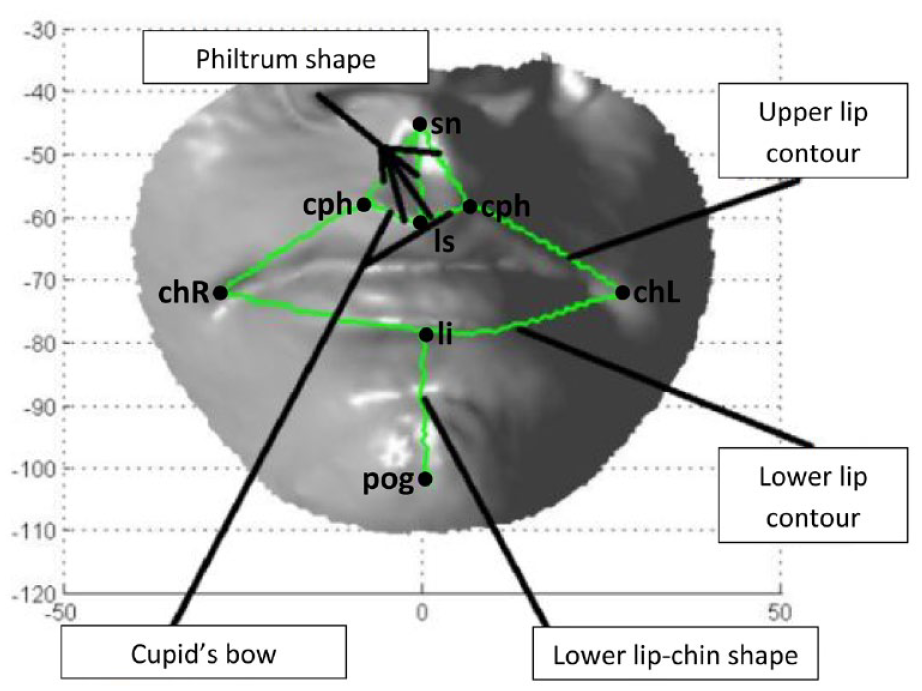
Lip landmarks and geodesic paths for automated categorisation of lip traits (excluding lower lip tone), adapted from Abbas et al. (2019).
Kmeans++, as described by Abbas et al. (2019), is an algorithm that first involves the identification of a random centroid on an individual’s anatomy, before computing the distance for each data point to this existing centroid, then selecting subsequent centroids using a weighted probability proportional to distance value. Once cluster centroids have been identified, data points are assigned to the nearest cluster according to their Euclidian distance metric. In order to find an optimum number of clusters, which are representative of classes or categories for each lip morphological trait, three internal validation indices were utilised: the Silhouette Index; the Dunn Index; and the Calinski-Harabasz Index. For all lip traits other than philtrum shape, the three indices were in agreement as to the optimum number of clusters, or classes. Concerning philtrum shape, the optimum number of clusters was 5 when the Silhouette and Dunn indices were applied, but 7 for the Calinski-Harabasz index. For the purpose of this study, the variable ‘7 classes’ was for analysis as this was in closest agreement with manual categorisation carried out by a medical expert, as described by Abbas et al. (2019). The nature of the process means that different results can be obtained on different runs of the algorithm, so the process was run 100 times to reduce the effect of randomisation.
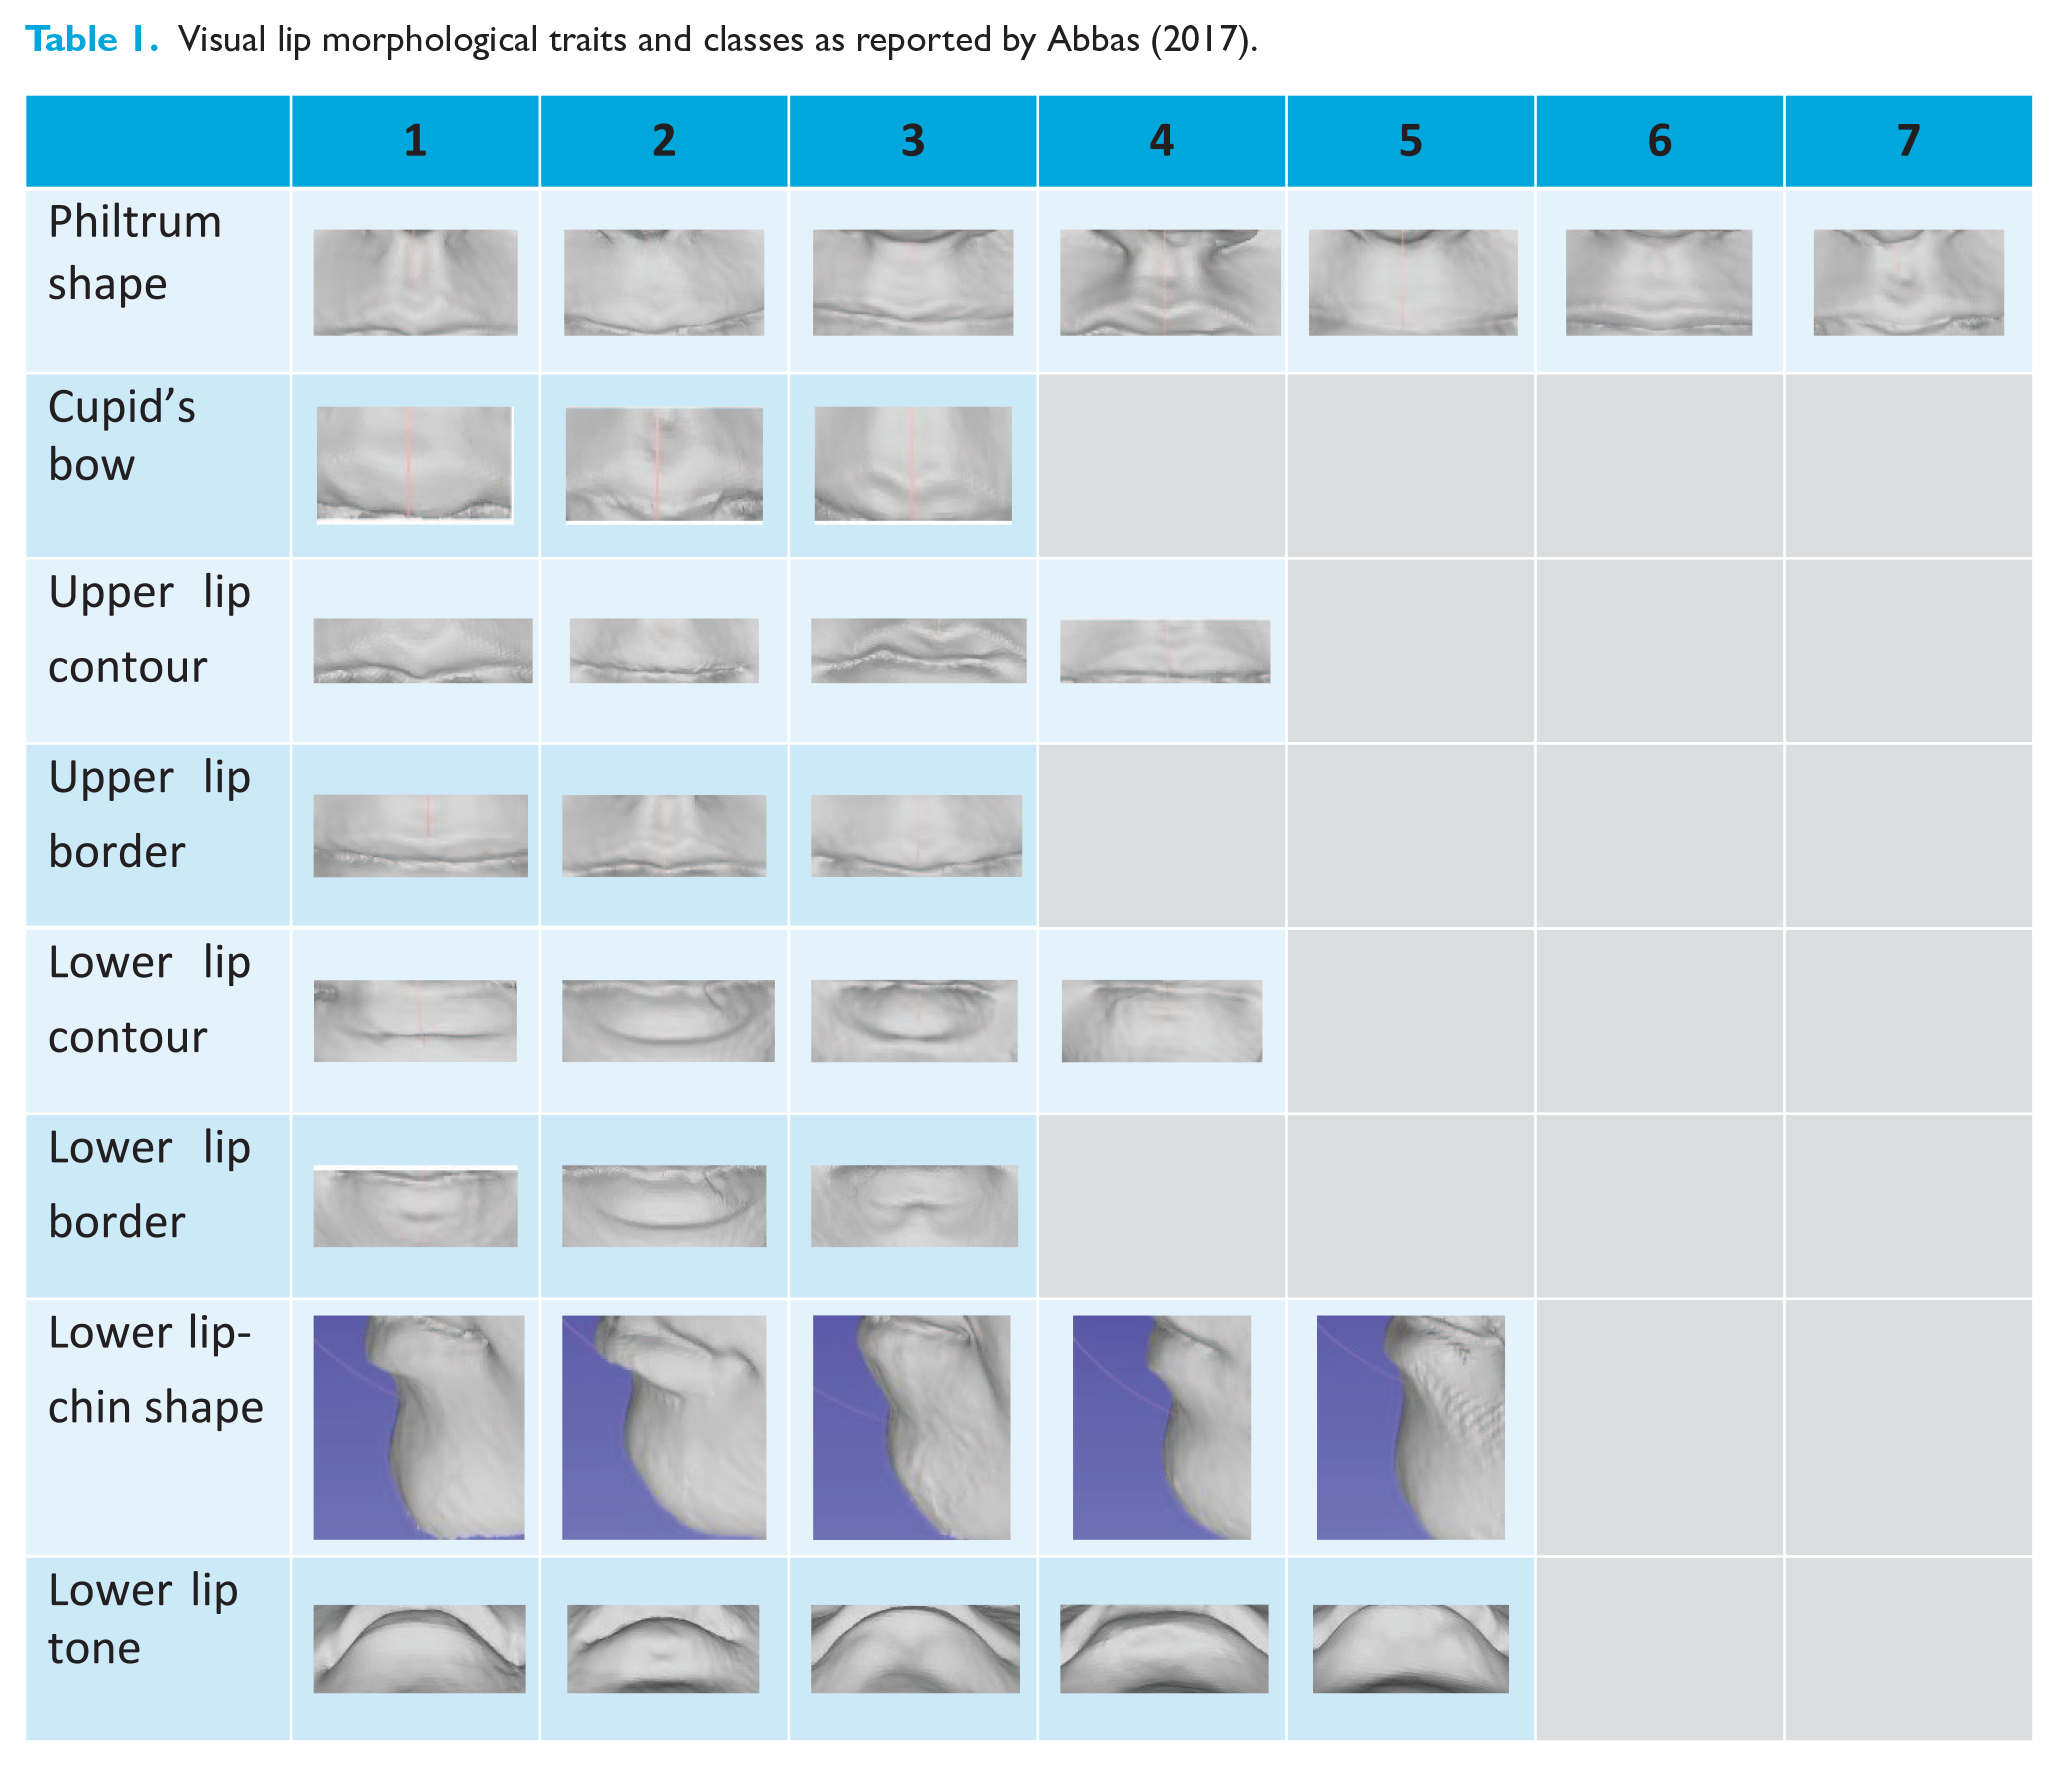
Subsequently, each of the facial scans were analysed using this method, and each individual was categorised according to the lip traits, with Table 1 showing representative examples from each class. Each class had a corresponding written descriptor (included in the supplemental information). The efficiency and accuracy of the automated method was confirmed by partial least squares regression analysis (Abbas et al., 2019).
Visual lip morphological traits and classes as reported by Abbas (2017).
Data for this present study were analysed using the statistical software RStudio (R Core Team, 2018; RStudio Team, 2016). Descriptive statistics were applied to report the prevalence of each type of the individual lip morphological traits in the sample. Chi-square tests were utilised to investigate sex differences between each of the traits, and to test for associations between individual traits.
Results
Out of the full sample of 4747 facial scans obtained at the age of 15 years, 4730 of these scans underwent automated computerised categorisation. The remaining 17 scans were of insufficient quality to be processed for the computerised method. There were approximately equal numbers of male (n=2222, 47.0%) and female patients (n=2506, 53.0%) in the sample, with missing data for sex for two participants.
Prevalence of each type of lip morphological trait and sex differences
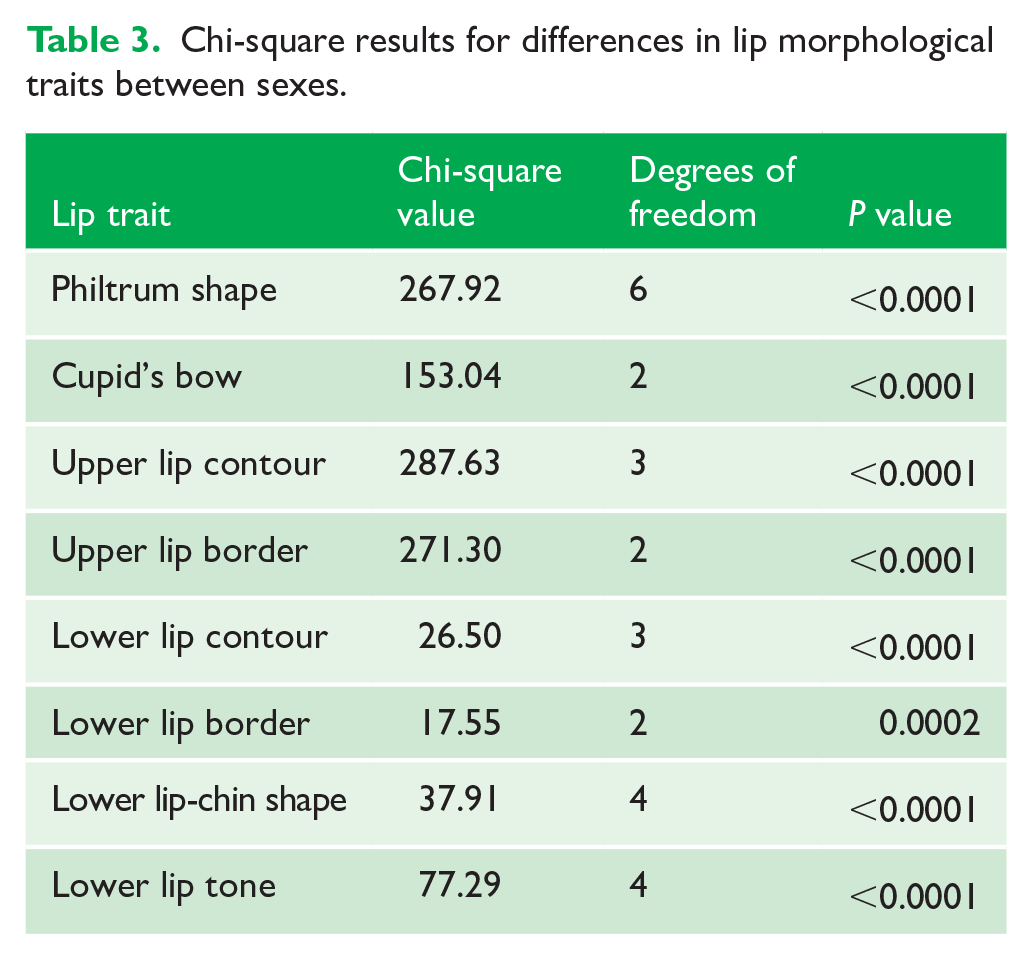
Table 2 displays the prevalence of each of the automated classes for the lip traits (Abbas, 2017). The most (+) and least (–) common types of each lip morphological trait are identified, overall, and for both male and female participants. As demonstrated in Table 3, there were statistically significant differences between the sexes for all traits (lower lip border P = 0.0002; all other lip traits P < 0.0001), suggesting sexual dimorphism. Since the sample size is so large, the significant P values are not particularly informative, but by looking at the chi-square values in relation to degrees of freedom and to the effect sizes, it is clear that the differences between sexes are particularly strong for Cupid’s bow, upper lip contour and upper lip border.
Prevalence of lip morphological trait categories in the sample.
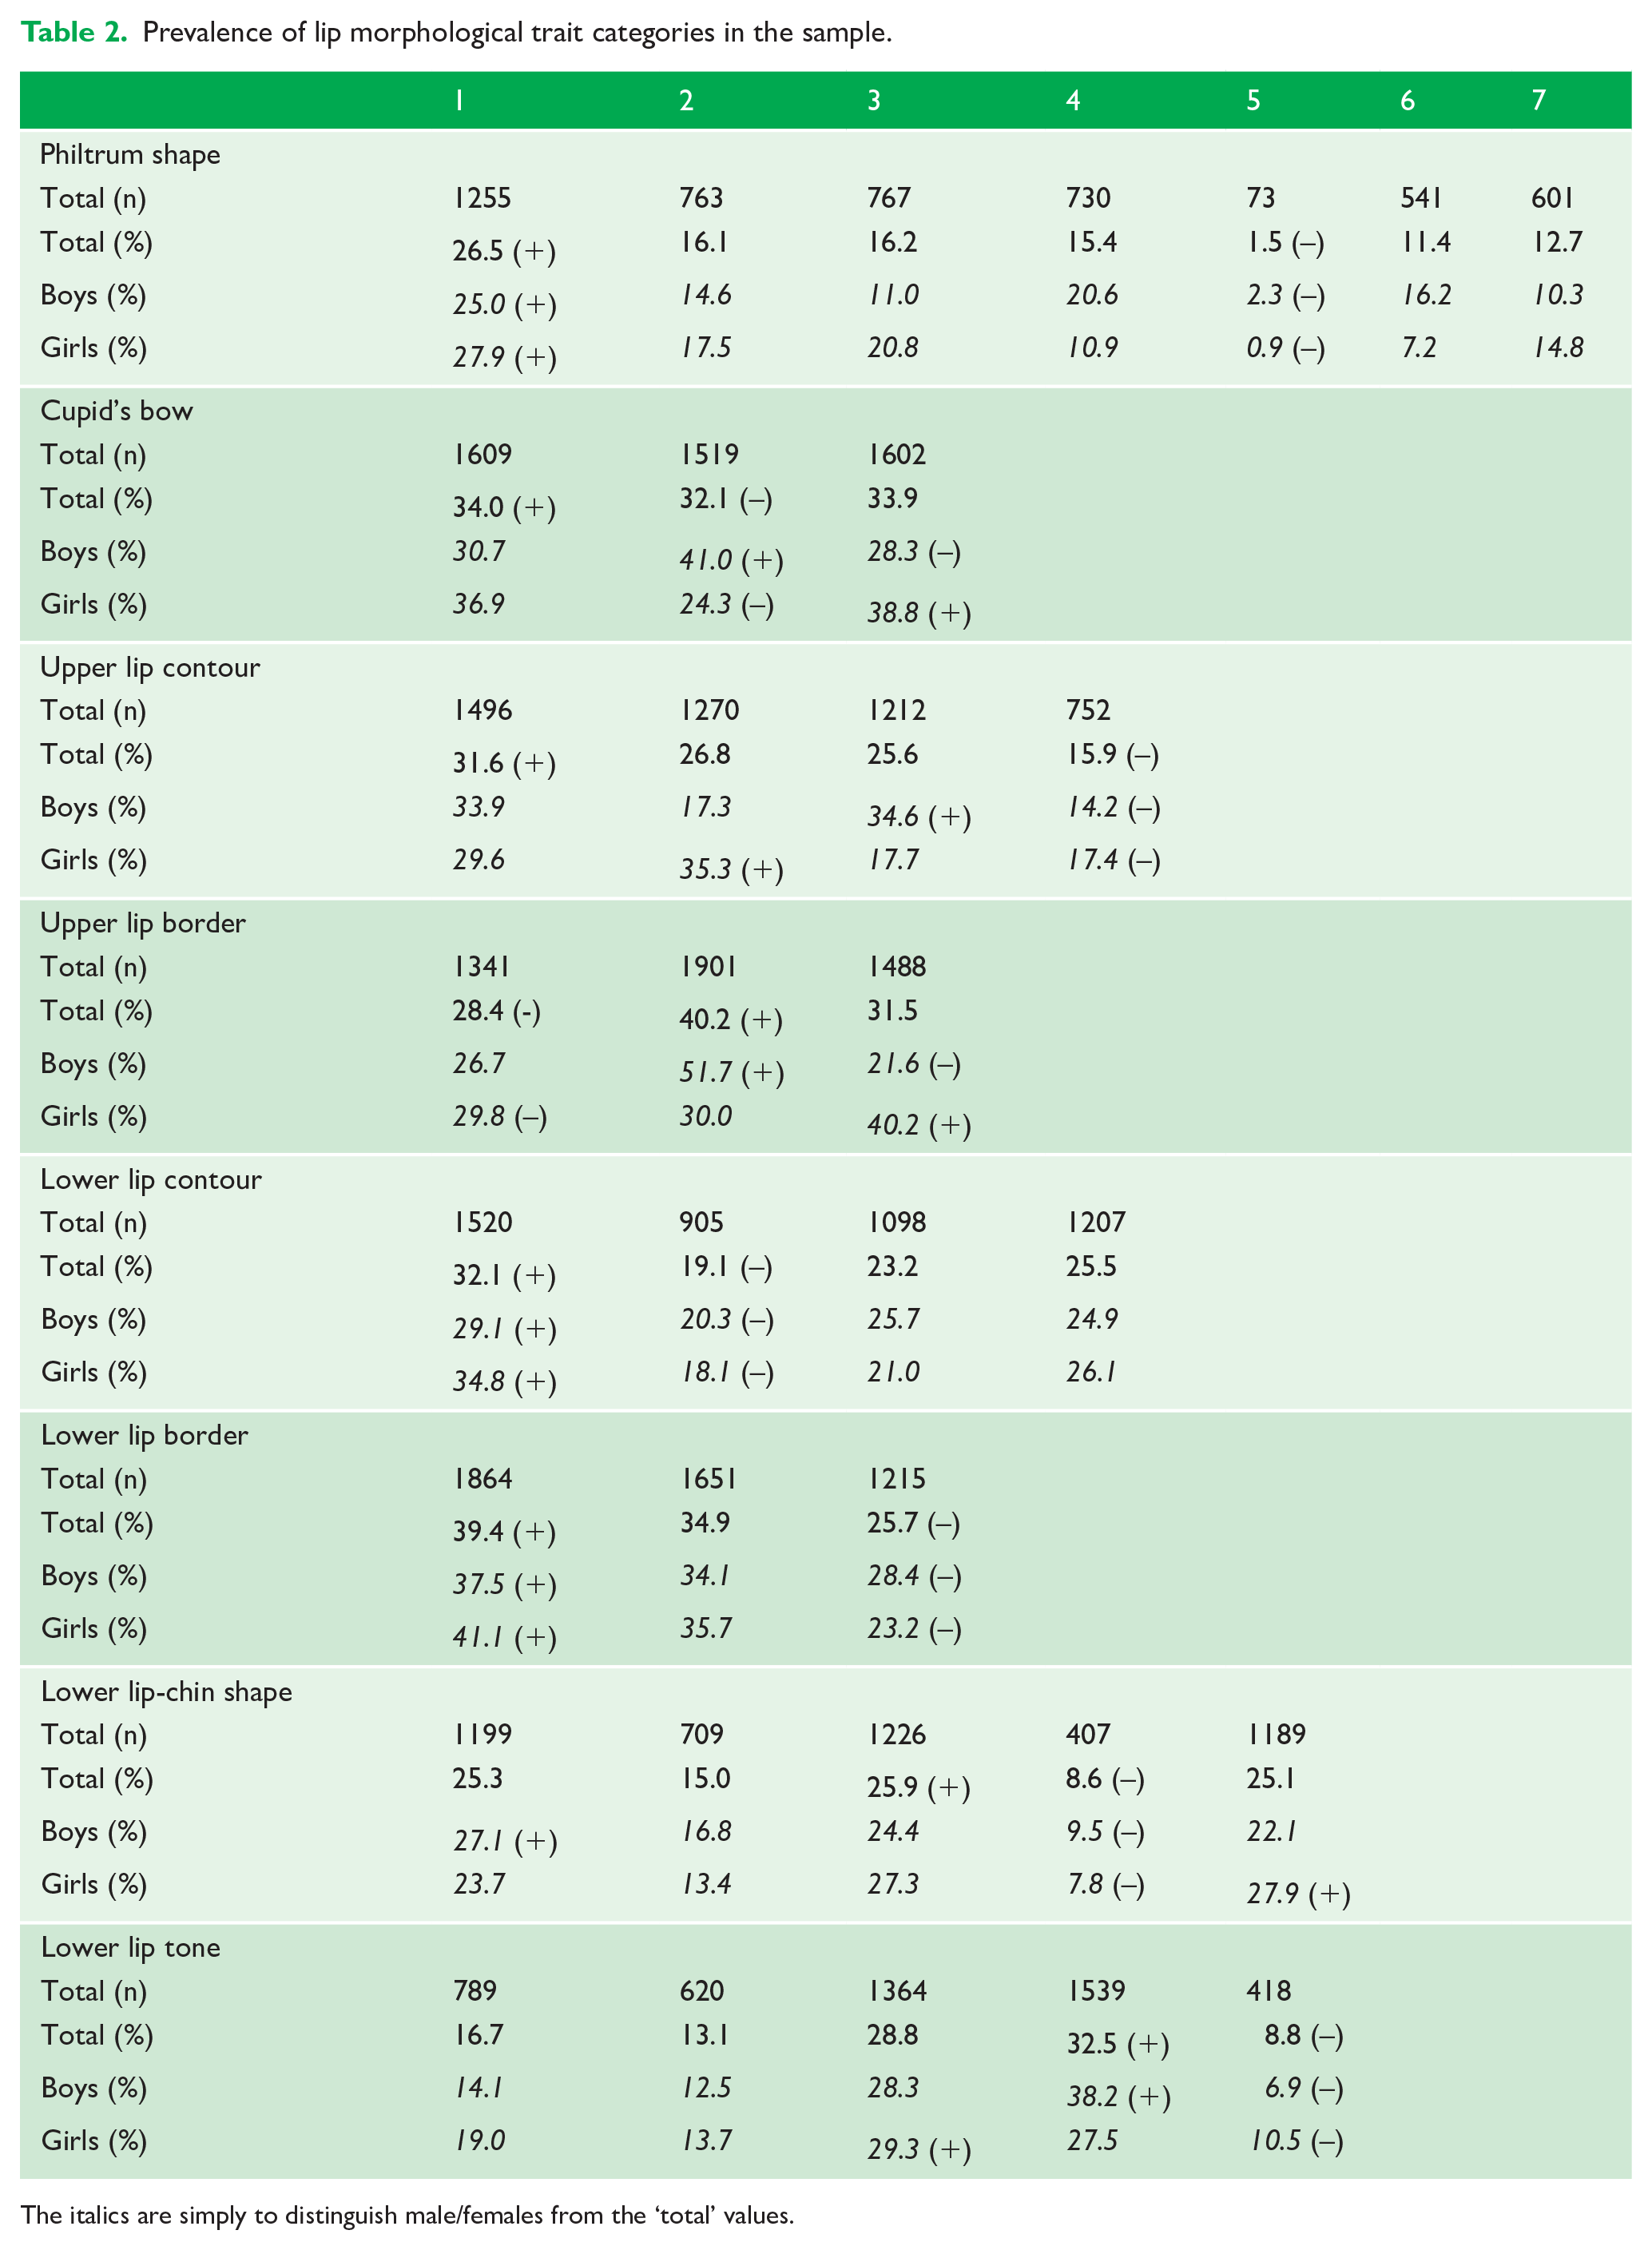
The italics are simply to distinguish male/females from the ‘total’ values.
Chi-square results for differences in lip morphological traits between sexes.
In the upper lip region, the most prevalent philtrum shape was Type 1 (narrow, with a deep groove). There was an approximately even spread across the three types of Cupid’s bow overall; however, boys were more likely to present with a U-shaped Cupid’s bow and girls were more likely to present with a flat or V-shaped Cupid’s bow. The most commonly observed upper lip contour was Type 1 (concave), while the most commonly observed upper lip border was Type 2 (a clear border at the Cupid’s bow), with boys more likely to exhibit this than girls.
In the lower lip region, most lower lip contours were narrow in the midline, with boys more likely to exhibit curved lower lip contour phenotypes, and there was commonly no true lower lip border (Type 1). Lower lip-chin shapes exhibiting an angular concavity, such as Type 4, were less common than those exhibiting convexity. Type 4 was the most prevalent type of lower lip tone (a wide concavity), especially in boys, followed by Type 3 (marked lateral mounds and a central concavity). Girls were more likely to exhibit ‘no tone’ than boys.
Associations between lip morphological traits
Chi-square tests were applied to investigate the relationship of lip traits to each other (Table 4). Each of the traits were significantly associated with the other traits (all P < 0.0001); however, the magnitude of the chi-square values of traits focussed on the upper lip region (philtrum shape, Cupid’s bow, upper lip contour and upper lip border) suggest they exhibit a particularly strong association. This was also true for traits localised to the lower lip region (lower lip contour, lower lip border, lower lip-chin shape, lower lip tone).
Results of chi-square tests demonstrating associations between lip morphological traits.*
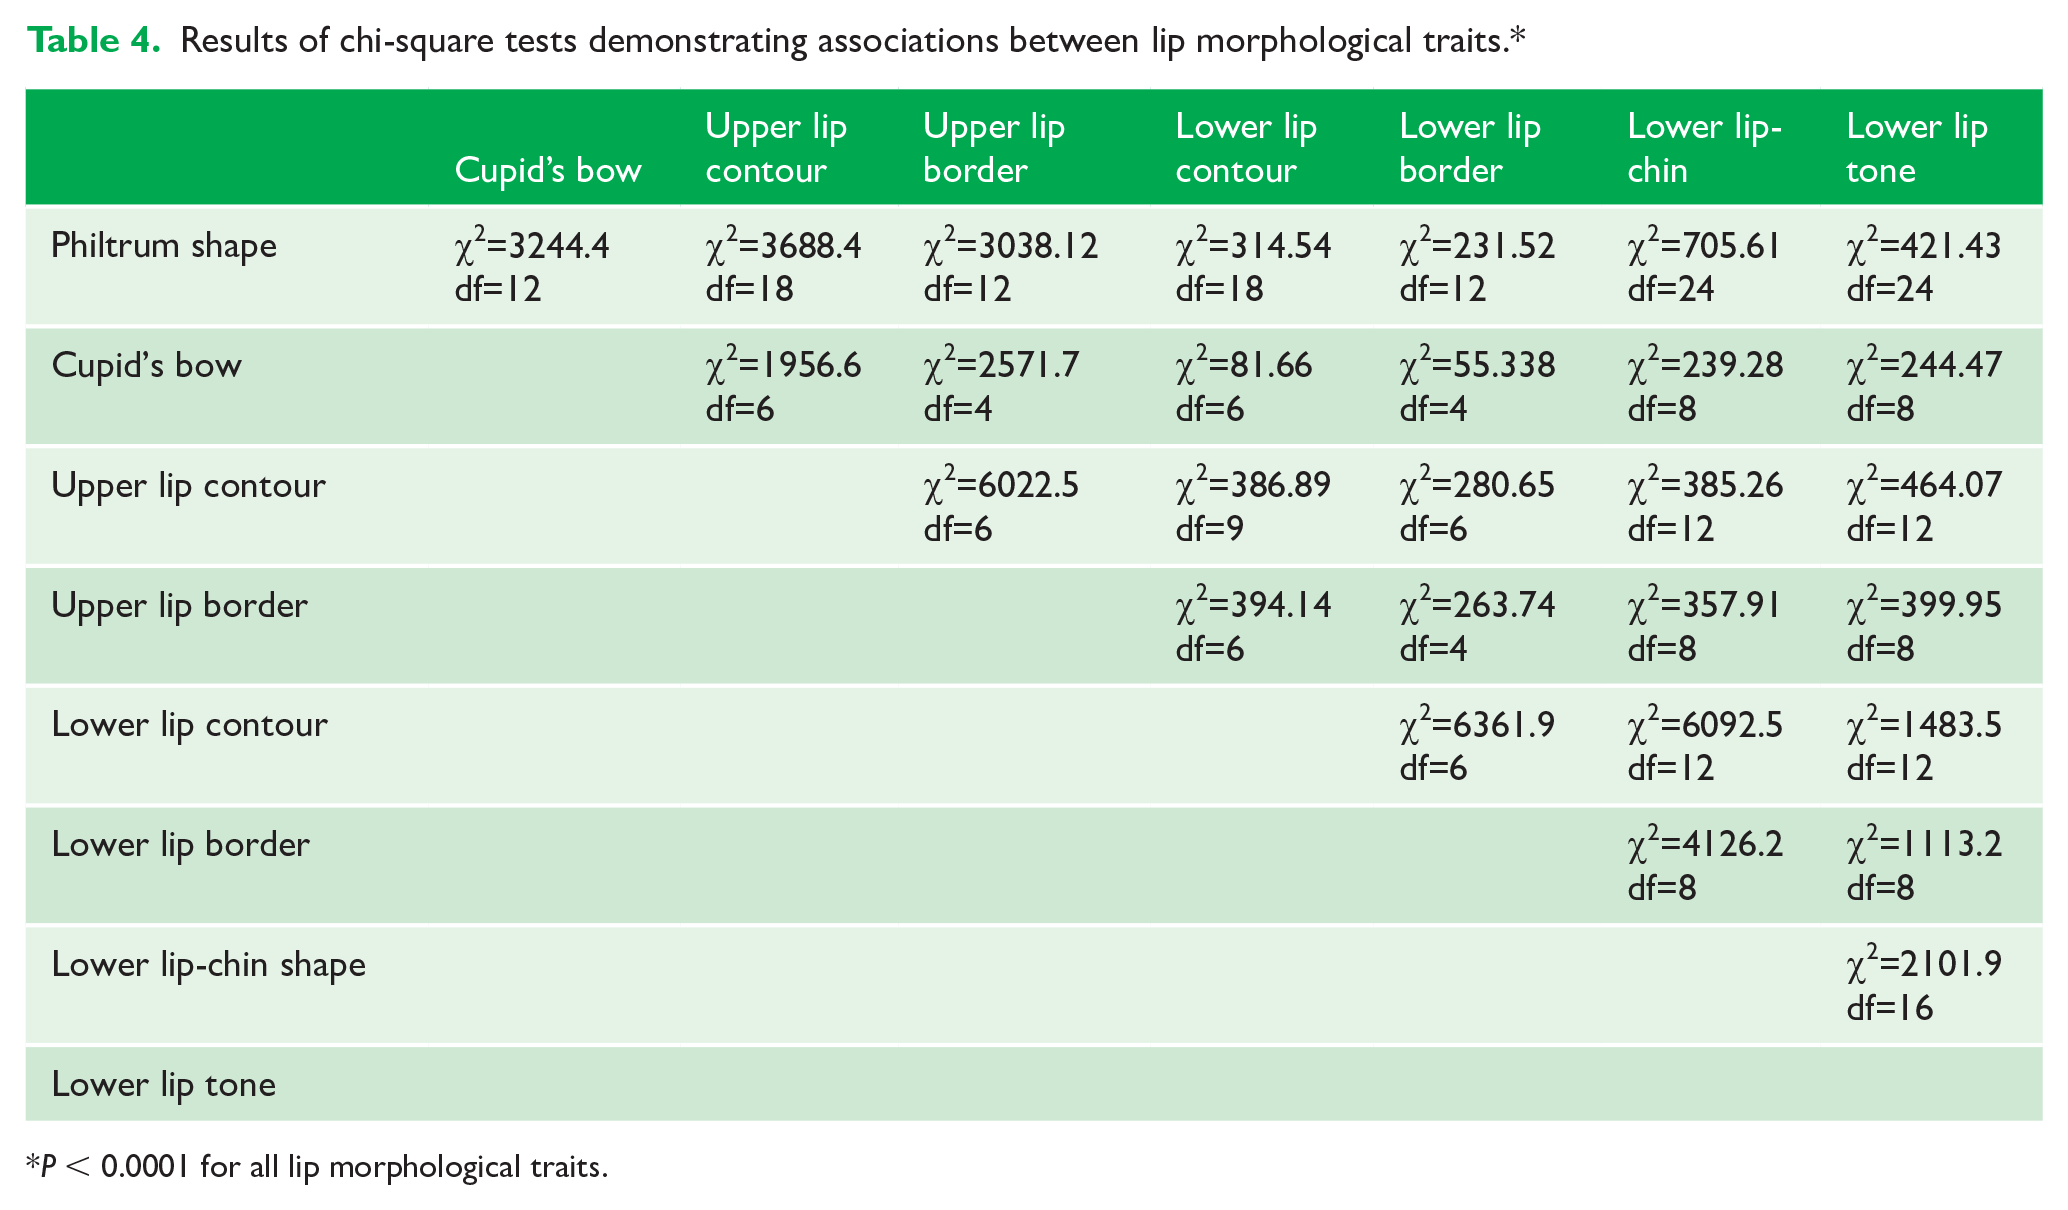
P < 0.0001 for all lip morphological traits.
Post-hoc analysis of the associations revealed many individual associations between traits in the upper lip region (P < 0.0001), including the following notable associations based on the effect sizes. Of the individuals with a Type 3 philtrum shape (wide, with an indentation near the vermilion), 91.13% had a V-shaped Cupid’s bow. Each of the participants who had a Type 5 philtrum shape (wide, with no indentation) also presented with a V-shaped Cupid’s bow, convex upper lip contour and full upper lip ‘double’ border. The following observations were noted with respect to the relationship between upper lip contour and upper lip border: of the participants, 95.43% with a straight upper lip contour had no true border, 94.72% with a pseudo-convex upper lip contour had a full upper lip border with a clear border at the Cupid’s bow, and 99.87% with a convex upper lip contour had a full upper lip ‘double’ border.
Similarly, individual associations were observed between traits in the lower lip region (P < 0.0001). Of the individuals with a Type 3 lower lip contour (markedly curved), 97.09% had a lower lip border with an indentation in the middle, and 94.53% of participants with a Type 4 lower lip contour (straight) presented with no true border. An angular lower lip-chin shape was associated with a curved lower lip contour, with 97.54% of those participants with a Type 4 lower lip-chin shape presenting with a Type 3 lower lip contour, and 83.5% of those participants with a Type 2 lower lip-chin shape presenting with a Type 2 lower lip contour. All the individuals with an angular lower lip-chin shape (Type 4) presented with an indentation in the middle of the lower border.
Discussion
The prevalence of lip traits for 4730 15-year-olds has been reported, and it is clear to see that, even within this normal population cohort, a wide variation of lip morphology exists. The automated lip trait classes differed slightly to those reported by Wilson et al. (2012) and Wilson-Nagrani (2016), as some of the classes in the original scale were found to be unbalanced. As a result, some traits from the original scale were combined (for example, philtrum shape and philtrum width to become ‘philtrum shape’) and some excluded completely (for example, lip fullness). It is therefore not possible to compare the results directly.
It has been suggested that there are likely to be genetic influences on normal lip morphology (Wilson-Nagrani et al., 2018), and as such, associations between lip traits and sexual dimorphism are likely to be dependent on genetic influences (Richmond et al., 2018; Xiong et al., 2019). Sexual dimorphism was found to exist across all of the traits assessed, which is largely in agreement with Wilson-Nagrani (2016), who reported sexual dimorphism across all traits except lower lip border. Other studies have reported sexual dimorphism in lip dimensions (Ferrario et al., 2000; Sforza et al., 2010) and philtrum shape (Hennessy et al., 2005; Sforza et al., 2010), although a morphometric study by Mori et al. (2005) found no significant sexual dimorphism in philtrum width. Regarding specific differences between boys and girls, there is agreement between this present study and that published by Wilson-Nagrani (2016) in that a concave or angular lower lip-chin shape is more prevalent in boys than girls, and a narrow philtrum and a flat Cupid’s bow are more prevalent in girls than boys. Wilson-Nagrani (2016) reported that a wide philtrum was more prevalent in girls, and that a philtrum with an indentation near the nose was more prevalent in boys, although this was not the case in this present study.
There were a number of individual associations observed between lip traits. A wide philtrum with an indentation near the vermilion was likely to be associated with a V-shaped Cupid’s bow. All of the participants in the sample who had with a smooth, wide philtrum also had a convex upper lip contour with a full border and, interestingly, a V-shaped Cupid’s bow. This does not concur with Wilson-Nagrani (2016), nor Carey et al. (2009), who both report an association between a smooth philtrum and flat Cupid’s bow. The results indicate that a straight upper lip contour is likely to be associated with no true vermilion border, while a pseudo-convex upper lip contour is likely to be associated with a full, clear vermilion border, and a convex upper lip contour with a full, ‘double’ vermilion border. In the lower lip region, there was an association between a markedly curved lower lip contour and a lower lip border with an indentation in the middle. As seen in the upper lip region, there was an association between a straight lower lip contour and no true lower lip vermilion border. The results suggest an association between an angular lower lip-chin shape and a curved lower lip contour. In addition, a convex lower lip-chin shape was likely to be associated with no true lower lip vermilion border, and a lower lip-chin shape with a marked angular concavity was likely to be associated with a full vermilion border. These results are in agreement with Wilson-Nagrani (2016), who reported that more defined or angular features are often associated with each other. There is otherwise little published literature investigating associations between lip characteristics in a normal population with which to compare.
The automated categorisation method described by Abbas (2017) and Abbas et al. (2019) and utilised in this present study has been proven to be a more accurate way of categorising lip morphological traits and contributes towards the standardisation of lip morphological assessment for clinical and research purposes. It can negate the need for manual assessment, thus improving consistency, and can be applied to aid with diagnosis, investigate associations between individual traits, or investigate the influence of specific environmental or genetic factors.
While the automated method provided visual examples for each type of morphological trait, these classes seemed less intuitive than the Wilson-Richmond Scale. In reality, lip morphological traits of individuals exhibit infinite variability and do not fit into discrete categories (such as those seen for eye colour, for example) and thus the categories are representations only. Abbas et al. (2019) report that although the Kmeans++ algorithm showed accurate categorisation results, alternative clustering techniques could include spectral clustering (Ng et al., 2002) or distance measures (Galluccio et al., 2013).
The reported differences in findings between this present study and that carried out by Wilson-Nagrani (2016) may be accounted for by variation in the descriptors for each category; for example, the automated approach grouping individual features of the philtrum into one variable: ‘philtrum shape’. The possibility of error with subjective manual assessment and superior consistency with the automated approach may also be important to consider.
Conclusion
The automated computerised method described is a useful tool for the categorisation of lip traits that can be applied to investigate both genetic and environmental influences on lip morphology. It has been used to investigate a sample of 4730 individuals, and the prevalence of particular types of various lip morphological traits has been described. Sexual dimorphism exists across all the lip traits, with significant differences in the prevalence of the different types of each individual lip trait, including a concave or angular lower lip-chin shape being more prevalent in boys, and a narrow philtrum and a flat Cupid’s bow being more prevalent in girls. Generally, each of the lip morphological traits are associated with one another. Individual associations have been reported, including an association between straight lip contours and the lack of a true vermilion border.
Supplemental Material
sj-docx-1-joo-10.1177_14653125221106489 – Supplemental material for Applying an automated method of classifying lip morphological traits
Supplemental material, sj-docx-1-joo-10.1177_14653125221106489 for Applying an automated method of classifying lip morphological traits by Kristian James Michael Davies, Stephen Richmond, Renata Jorge Medeiros-Mirra, Hawraa Hassan Abbas, Caryl Eleri Wilson-Nagrani, Megan Gael Davis and Alexei Zhurov in Journal of Orthodontics
Footnotes
Acknowledgements
We are extremely grateful to all the families who took part in this study, the midwives for their help in recruiting them, and the whole ALSPAC team, which includes interviewers, computer and laboratory technicians, clerical workers, research scientists, volunteers, managers, receptionists and nurses.
Declaration of conflicting interests
The author(s) declared no potential conflicts of interest with respect to the research, authorship, and/or publication of this article.
Funding
The author(s) disclosed receipt of the following financial support for the research, authorship, and/or publication of this article: The UK Medical Research Council and Wellcome (Grant ref: 217065/Z/19/Z) and the University of Bristol provide core support for ALSPAC. This publication is the work of the authors, and they will serve as guarantors for the contents of this paper. A comprehensive list of grants funding is available on the ALSPAC website (![]() ). The research relating to 3D face shape scanning was specifically funded by Cardiff University.
). The research relating to 3D face shape scanning was specifically funded by Cardiff University.
Supplemental material
Supplemental material for this article is available online.
References
Supplementary Material
Please find the following supplemental material available below.
For Open Access articles published under a Creative Commons License, all supplemental material carries the same license as the article it is associated with.
For non-Open Access articles published, all supplemental material carries a non-exclusive license, and permission requests for re-use of supplemental material or any part of supplemental material shall be sent directly to the copyright owner as specified in the copyright notice associated with the article.