
Abstract
On 4 January 1971, Ti-Grace Atkinson delivered a talk entitled ‘Strategy and Tactics: A Presentation of Political Lesbianism’. The talk was later published in her collected essays, Amazon Odyssey. The essay contains thirty-five diagrams: ten ‘Strategy Charts’, three ‘Tactical Charts’ and twenty-two ‘Tactical-Strategy Charts’, which map a strategy of the ‘Oppressor’ (men) and the tactics that the ‘Oppressed’ (women) might develop to lead to a revolution – lesbians, significantly, are the ‘Buffer Zone’ between these two classes. In the only reference I have managed to find to these diagrams, they are referred to as ‘crazy’. This article re-visits these diagrams, exploring the role of the diagram in how Atkinson attempts to map patriarchal relations and also imagine a feminist revolution. Taking Atkinson’s diagrams as a starting point, the article then uses them to begin to narrate a genealogy of the diagram in feminist theory, exploring a diagrammatic imaginary that is an often-used but rarely discussed tactic in feminist writing. Finally, the article opens out to consider how this history of feminist diagrams might be a precursor to more contemporary feminist data visualisations.
Introduction
On 4 January 1971, in New York City, Ti-Grace Atkinson delivered a talk, ‘Strategy and Tactics: a Presentation of Political Lesbianism’, at the dedication of the first Lesbian Centre in the United States. The speech was later published in a collection of her essays, Amazon Odyssey (1974). There, the essay states its two main goals: to provide a ‘“map” of our [women’s] oppression’ and to analyse the role of lesbianism in feminism (Atkinson, 1974: 135). While many of Atkinson’s essays in Amazon Odyssey examine women’s oppression and consider the relationship between lesbianism and the women’s movement, this particular essay stands out because of the way it relies on diagrams to achieve these aims. ‘Strategy and Tactics’ contains thirty-five diagrams in total: ten ‘Strategy Charts’, three ‘Tactical Charts’ and twenty-two ‘Tactical-Strategy Charts’. Atkinson’s charts, produced in collaboration with the artist Barbara Nessim, collectively map the relationship between the ‘oppressed’ and the ‘oppressor’, visualising, much like tactical war diagrams, the strategic ways that enemy territory might be overtaken (Figure 1). Each diagram is rectangular, divided into two halves: ‘oppressor’ and ‘oppressed’. Within these two halves, further divisions are contained: ‘neutral (nonfeminists)’ are represented as small dots, ‘anti-rebellion (anti-feminists)’ are depicted as jagged vertical lines and ‘pro-rebellion (feminists or pro-feminists)’ appear as wavy horizontal lines. The diagrams aim to visually model the possibility of shifting power relations, strategising a feminist revolution.
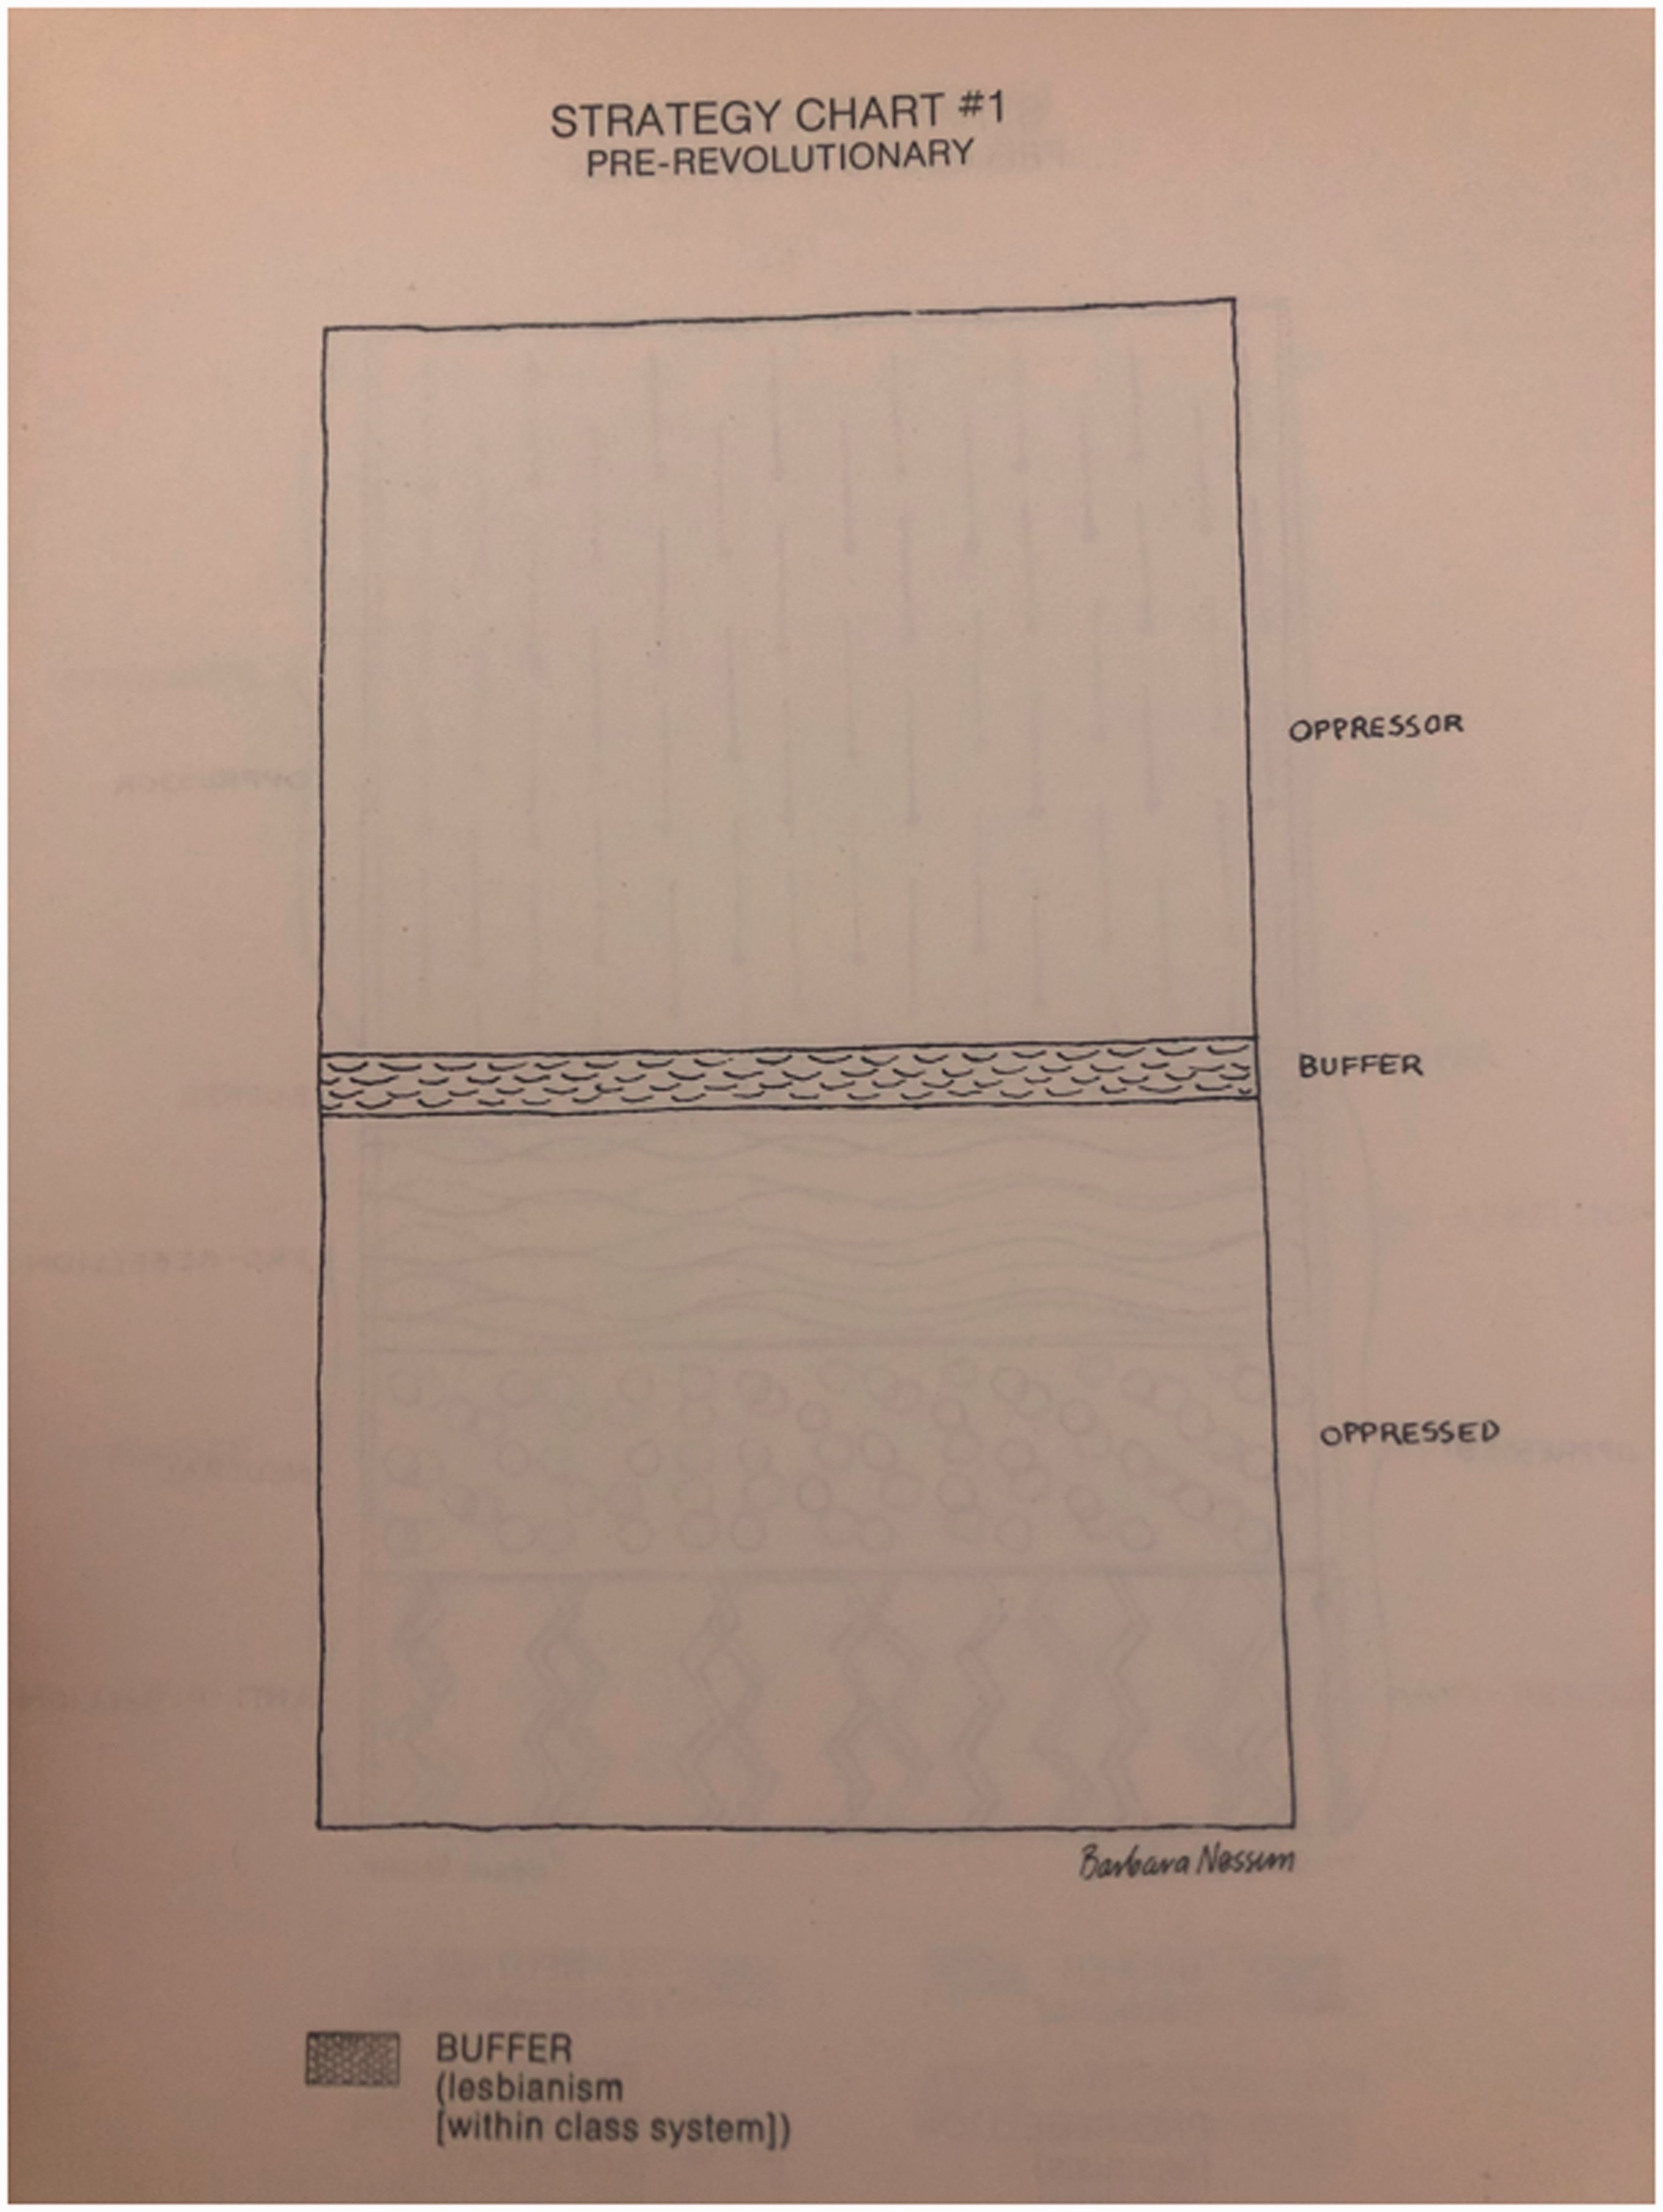
Strategy Chart #1 (Atkinson, 1974: 141).
I first encountered the charts in ‘Strategy and Tactics’ via a recommendation from an audience member at a talk that I delivered at Newcastle University in 2017. The talk was an early attempt of mine to map the types of visual imaginaries that appear in writing about sexuality and gender, an early paper on feminism’s diagrams. After the talk, the audience member excitedly told me about the diagrams in Amazon Odyssey. It was an excitement that I recognised; it seemed to me the very same excitement that motivated my talk. The audience member’s response reflected back to me my own enthusiasm for feminism’s diagrams – evident as well in the delight I take in teaching Gayle Rubin’s ‘charmed circle’, or the pleasure I get from Shulamith Firestone’s diagram from The Dialectic of Sex (a poster-sized version hangs above my office desk). At the time of my exchange with the audience member, I had been struggling to find theoretical frameworks to make sense of diagrams in feminism. But then I started to notice and take seriously all the enthusiasm I received from friends and colleagues when I said that I was writing about feminist theory’s diagrams. This positive affect seems like a vital aspect of their place in feminism, of my own and others’ attachment to them. Indeed, one of the anonymous readers who provided valuable feedback on an earlier version of this piece started their review by ‘confessing’ that they too are ‘a diagram fanatic’.
Despite both this positive affect and Atkinson’s centrality to American feminist history – Breanna Fahs describes her as ‘a nucleus of radical feminism’ (2011: 563) – I have come across only one scholarly (or otherwise) reference to these charts. In this singular reference, Meaghan Morris refers to them as ‘crazy’ and ‘fanatical attempts to make the metaphorical war [between the sexes] a real one’ (1988: 68). It is understandable why Morris might have this reaction to the charts and to Atkinson’s insistence that feminist revolution is a matter of military-like strategising. In their sheer number, the charts attempt to exhaustively map the possibilities for war games, while also remaining significantly abstract – patriarchy and feminist revolution become shapes, lines and formal fantasies of territorial expansion. In a footnote in the Afterword to Amazon Odyssey, Atkinson notes the abstract beauty she sees in the charts, explaining: ‘Some of the Charts remind me of Jasper Johns’ numbered lithographs, which, by the way, I’d like to see some of these Charts become’ (1974: ccxivi; emphasis in original). There is none of this pleasure in Morris’ judgment of the charts, where it seems as though the diagrams’ depiction of feminist revolution as a literal battleground can only be a curious and characteristic object of the so-called second wave, and radical feminism of the 1970s in particular. They seem to be dismissed partly because their rendering of feminist revolution as a war between the sexes evidences what Clare Hemmings has summarised as the oft-told story that the 1970s was ‘the essentialist decade’ (2011: 120). There is, no doubt, much to be critiqued about how Atkinson models the feminist revolution: the binary and simplistic rendering of oppressor/oppressed, the way lesbians are depicted as the ‘buffer zone’ between the two sex classes and the language of warfare that Atkinson deploys. Yet, following my own attraction to the diagrams and the enthusiasm I keep encountering in others, I want to approach the diagrams as something more than crazy or idiosyncratic objects from feminism’s past.
In line with this special section’s interest in approaching seemingly outdated concepts, ideas and thinking from feminism’s past, I explore reading Atkinson’s diagrams in the present. I do not think that these diagrams can be easily defended as particularly ‘useful’ to the present in any straightforward way (although, of course, ‘use value’ is a terrible way to approach anything), but nor does it feel satisfactory to critique them from a supposedly more enlightened present – as ‘fanatical’ objects typical of a so-called outdated radical feminism. Kathi Weeks suggests that we might do well to conceive of feminism in ways that ‘can account for both continuity and rupture, for our attractions and repulsions, for the possibility that any moment could generate both inspiration and cautionary tales, and that each of these judgments could be leveled backward and forward in time’ (2015: 736). Weeks does not suggest transporting the lessons of the past into the present in some easy way, but rather insists on approaches that might displace the otherness of the past (judged as good or bad), account for our affective responses in the present and explore resonances between now and then (ambivalent as they may be). With this in mind, this article uses these charts as a starting point to begin to narrate a genealogy of the diagram in feminist theory. I start by situating Atkinson’s diagrams within their historical emergence, before folding them into larger contemporary conversations about diagrams, data visualisation and feminism. Following my audience member’s hunch that these diagrams are an important part of the story of feminist diagrams, my own attraction to them as objects and Atkinson’s insistence on them as politically necessary, I argue for the importance of mapping and diagramming to feminist theory.
Strategy and tactics
‘Strategy and Tactics’, in Atkinson’s words, is described as ‘the crudest and most minimal suggestion of the degree to which we must develop “war games”’ (1974: 155). The essay is built around thirty-five diagrams, organised into three sets: one set aims to explain the function of the buffer (the zone between oppressed and oppressor) in the oppressor’s strategy, the second set explores defensive tactics that the oppressed might take and the third set explores possible oppositional tactics of the oppressed. Concerned primarily with revealing how individuals are spatially organised under the signs of ‘oppressor’ and ‘oppressed’, these diagrams attempt to map the field of relations that patriarchy produces and that a feminist revolution might re-map. For example, in a series of tactical-strategy charts, Atkinson maps the changes in relations between the ‘oppressor’ and the ‘oppressed’ if the oppressed mounted an infiltration of the front line (Figures 2–4). This infiltration re-draws the relationship between the oppressed and the oppressor, now adding categories of ‘anti-rebellion (anti-feminists)’, ‘pro-rebellion (feminists)’ and ‘neutral (nonfeminists [in Oppressed instance] or nonaligned [in Oppressor instance])’. The tactics are imagined in terms of infiltration – in any given ‘move’, the diagrams plot out what percentage of the oppressor might be ‘turned’ or what percentage of the oppressed might be convinced to join the rebellion. In the diagrams’ meticulously detailed interest in the positioning of oppressed, oppressor, anti-rebellion factions, pro-rebellion factions and neutral parties, patriarchal oppression and feminist revolution start to look a bit like a board game. Yet, even if the diagrams’ war games aesthetics are estranging, they also contain a more familiar feminist aim. They attempt to map in detail the relations that patriarchal oppression creates – not only between oppressed and oppressor, but also within those categories as well. Feminism is, among other things, about understanding how white heteronormative patriarchy structures relations, as well as the way it produces and populates the categories of gendered subjectivity.
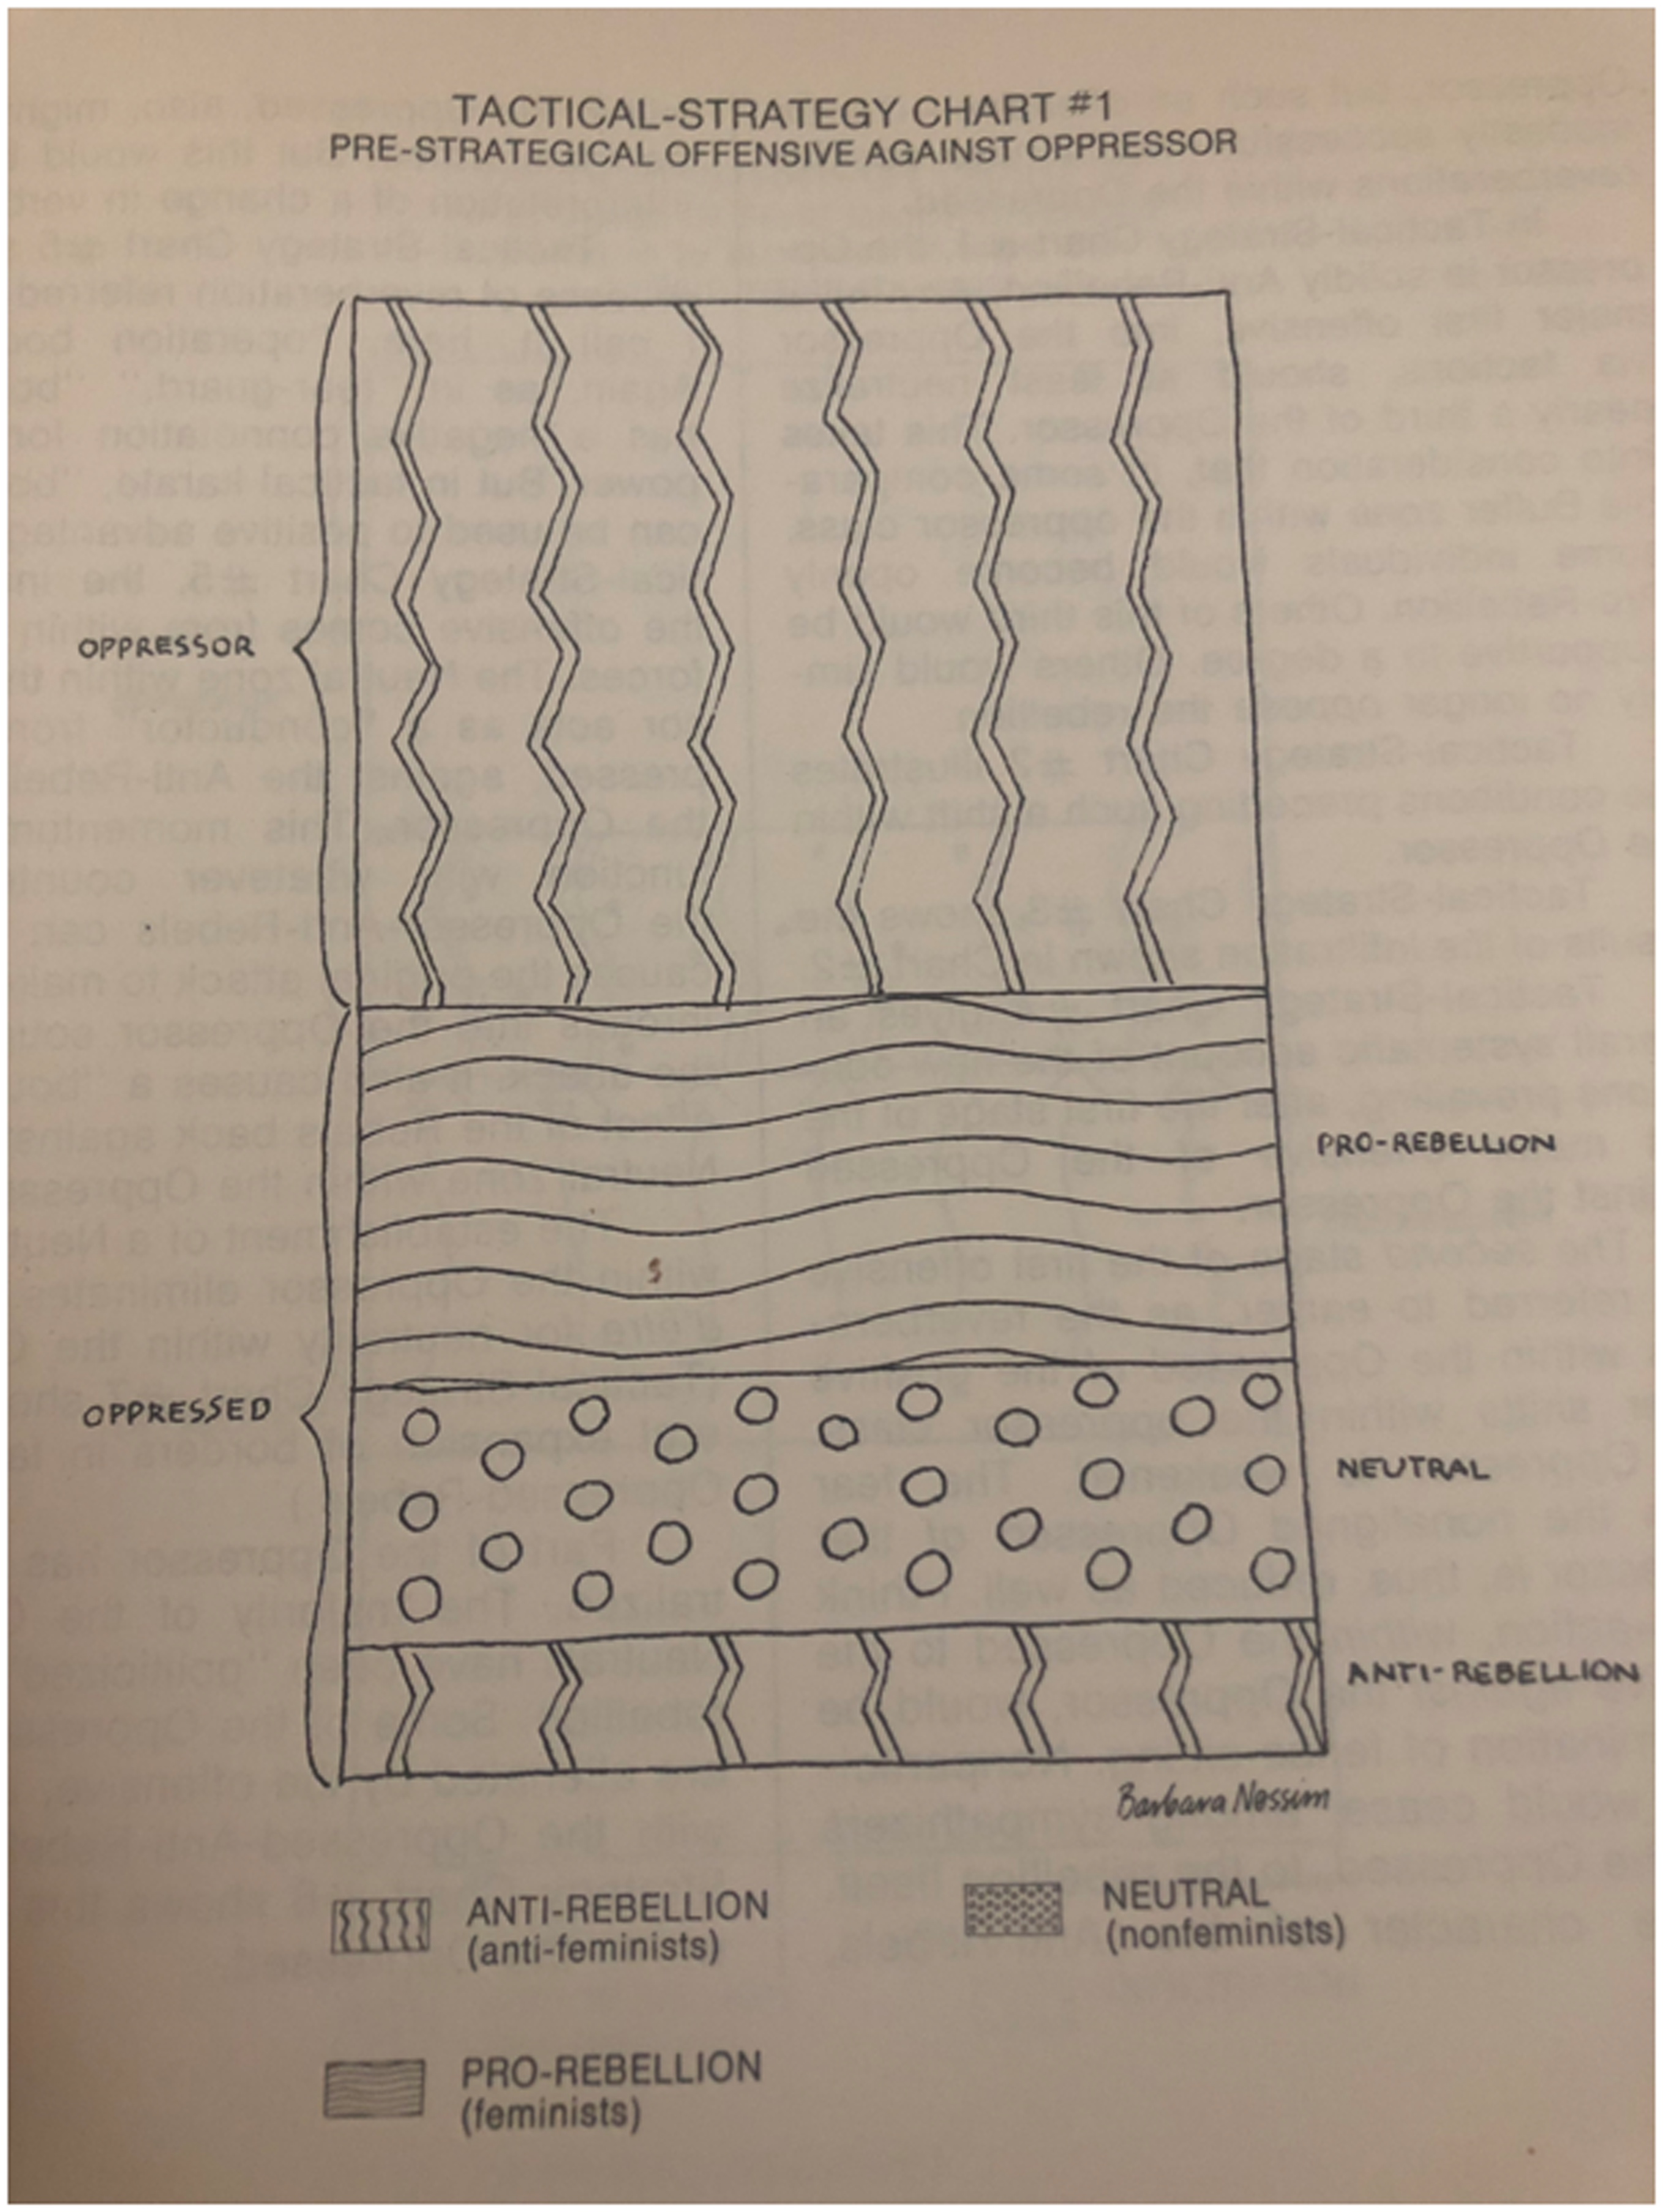
Tactical-Strategy Chart #1 (Atkinson, 1974: 161).
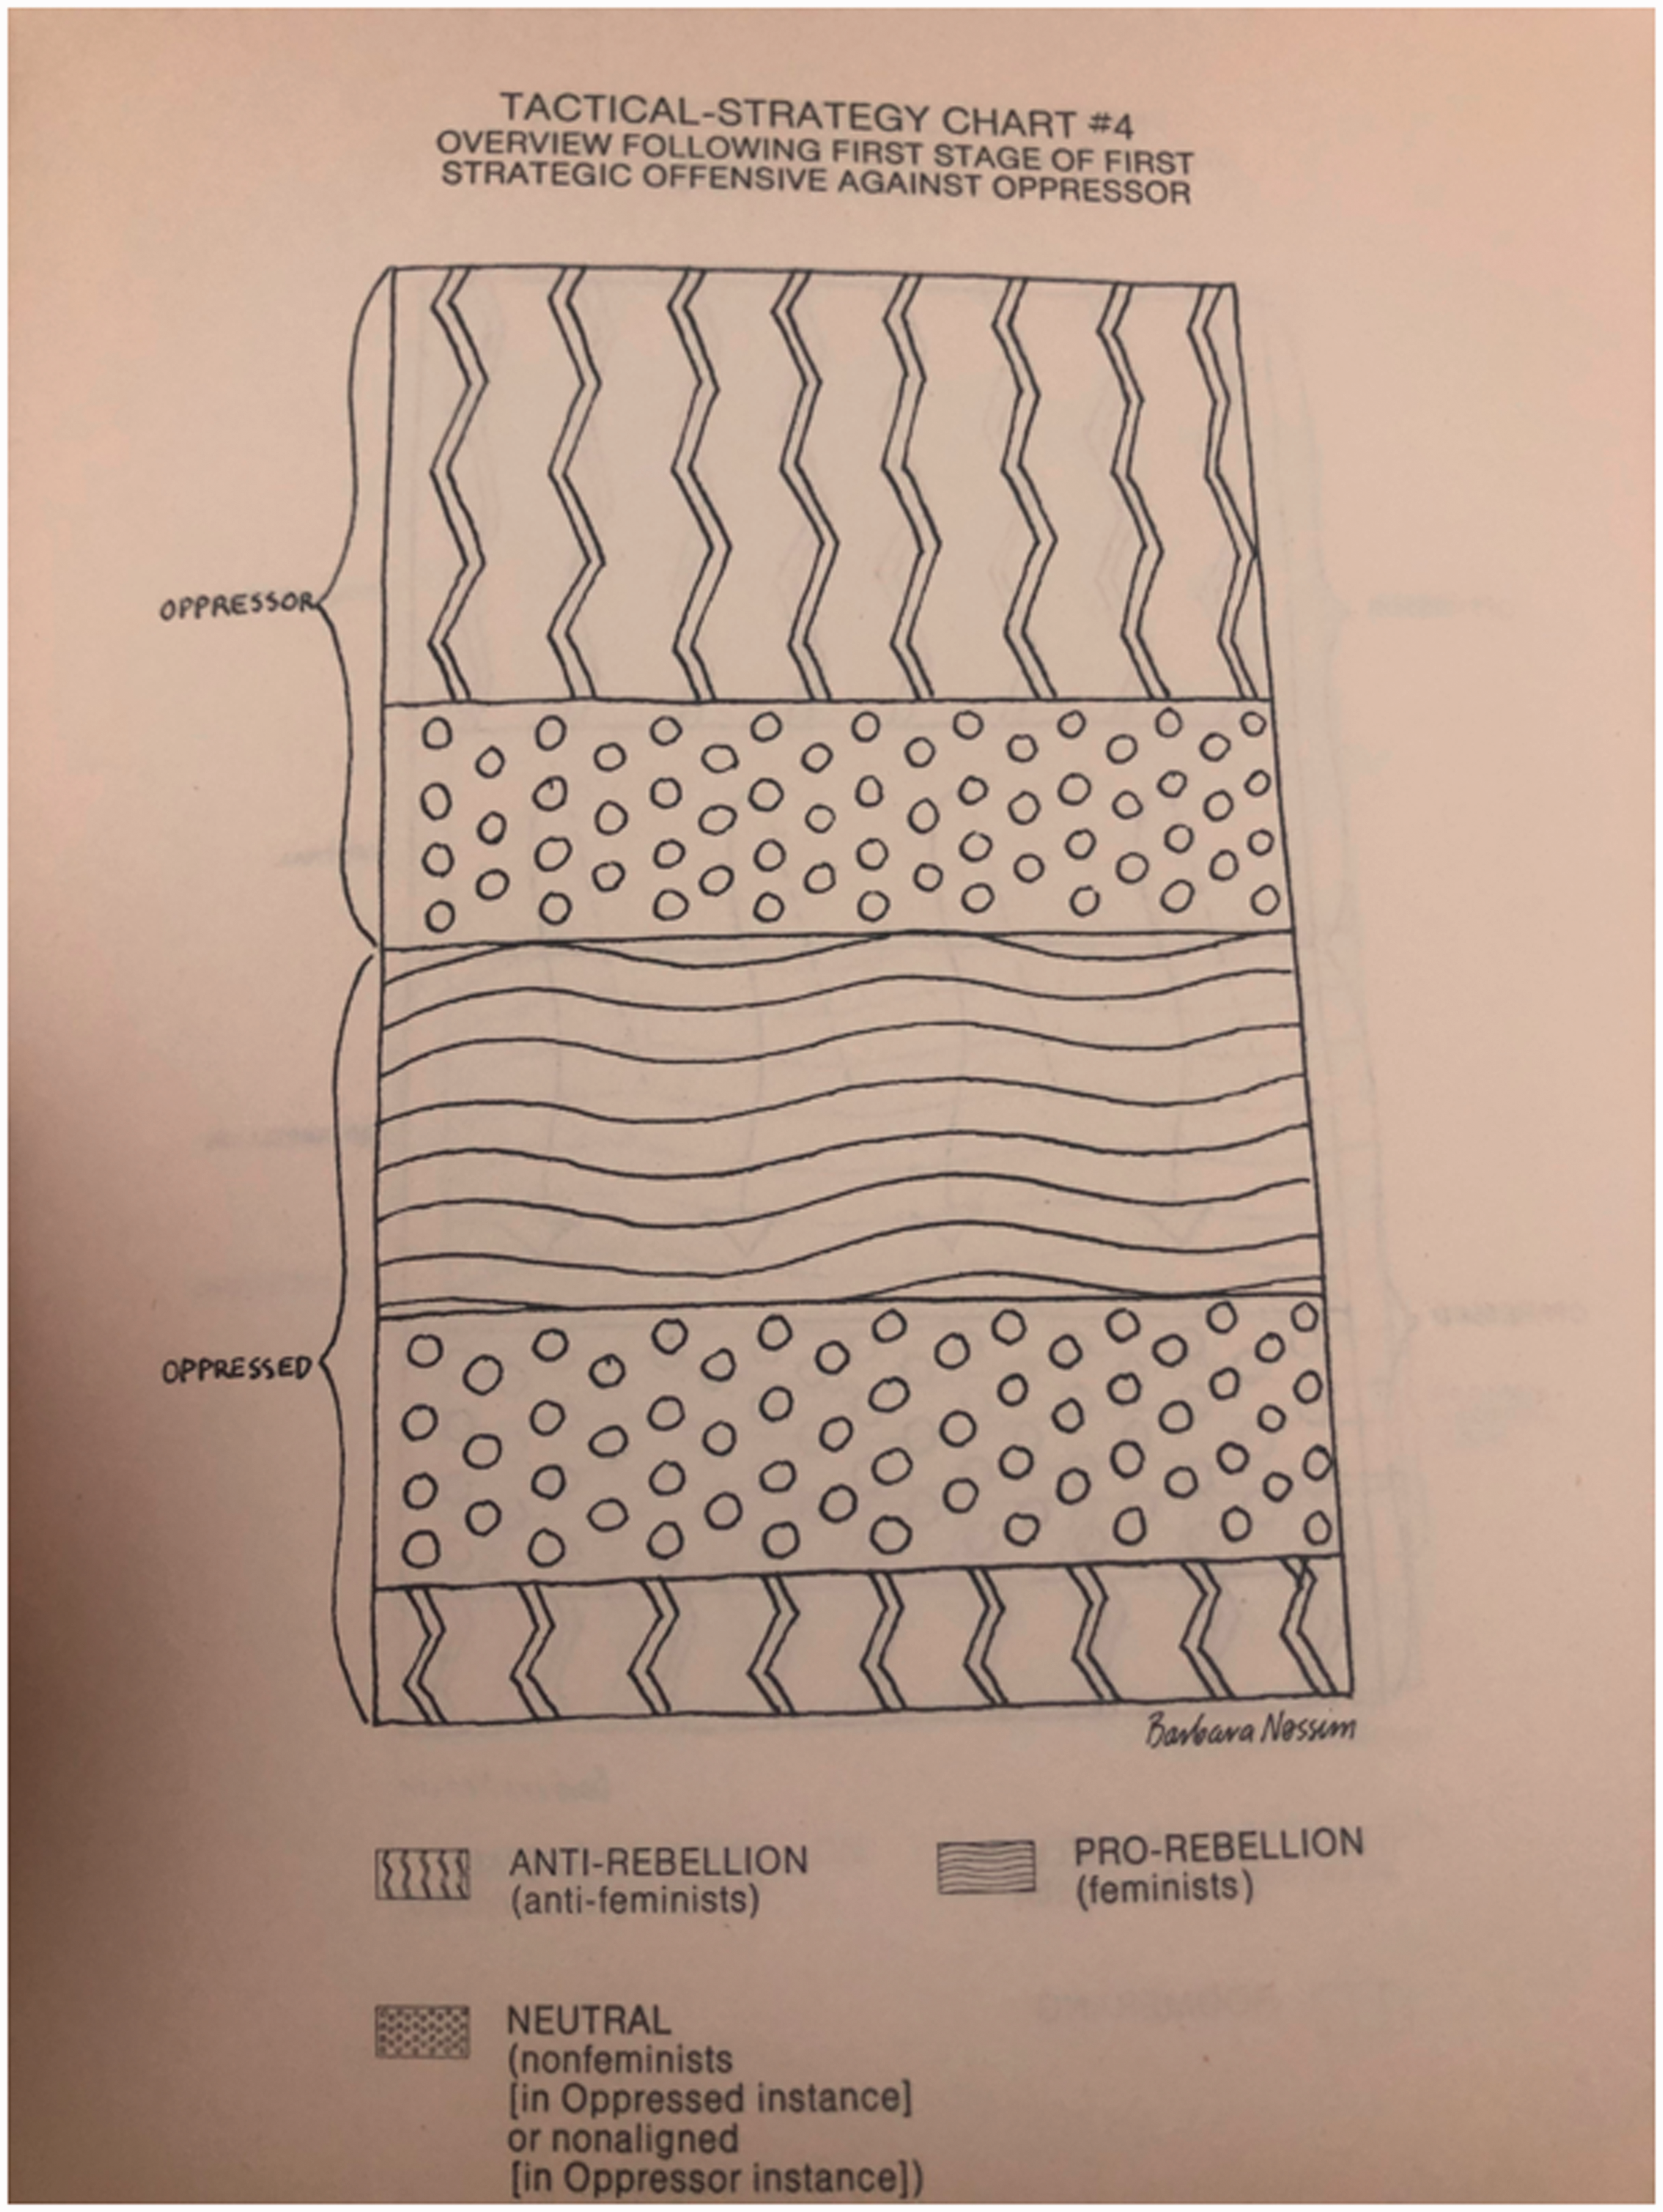
Tactical-Strategy Chart #4 (Atkinson, 1974: 165).
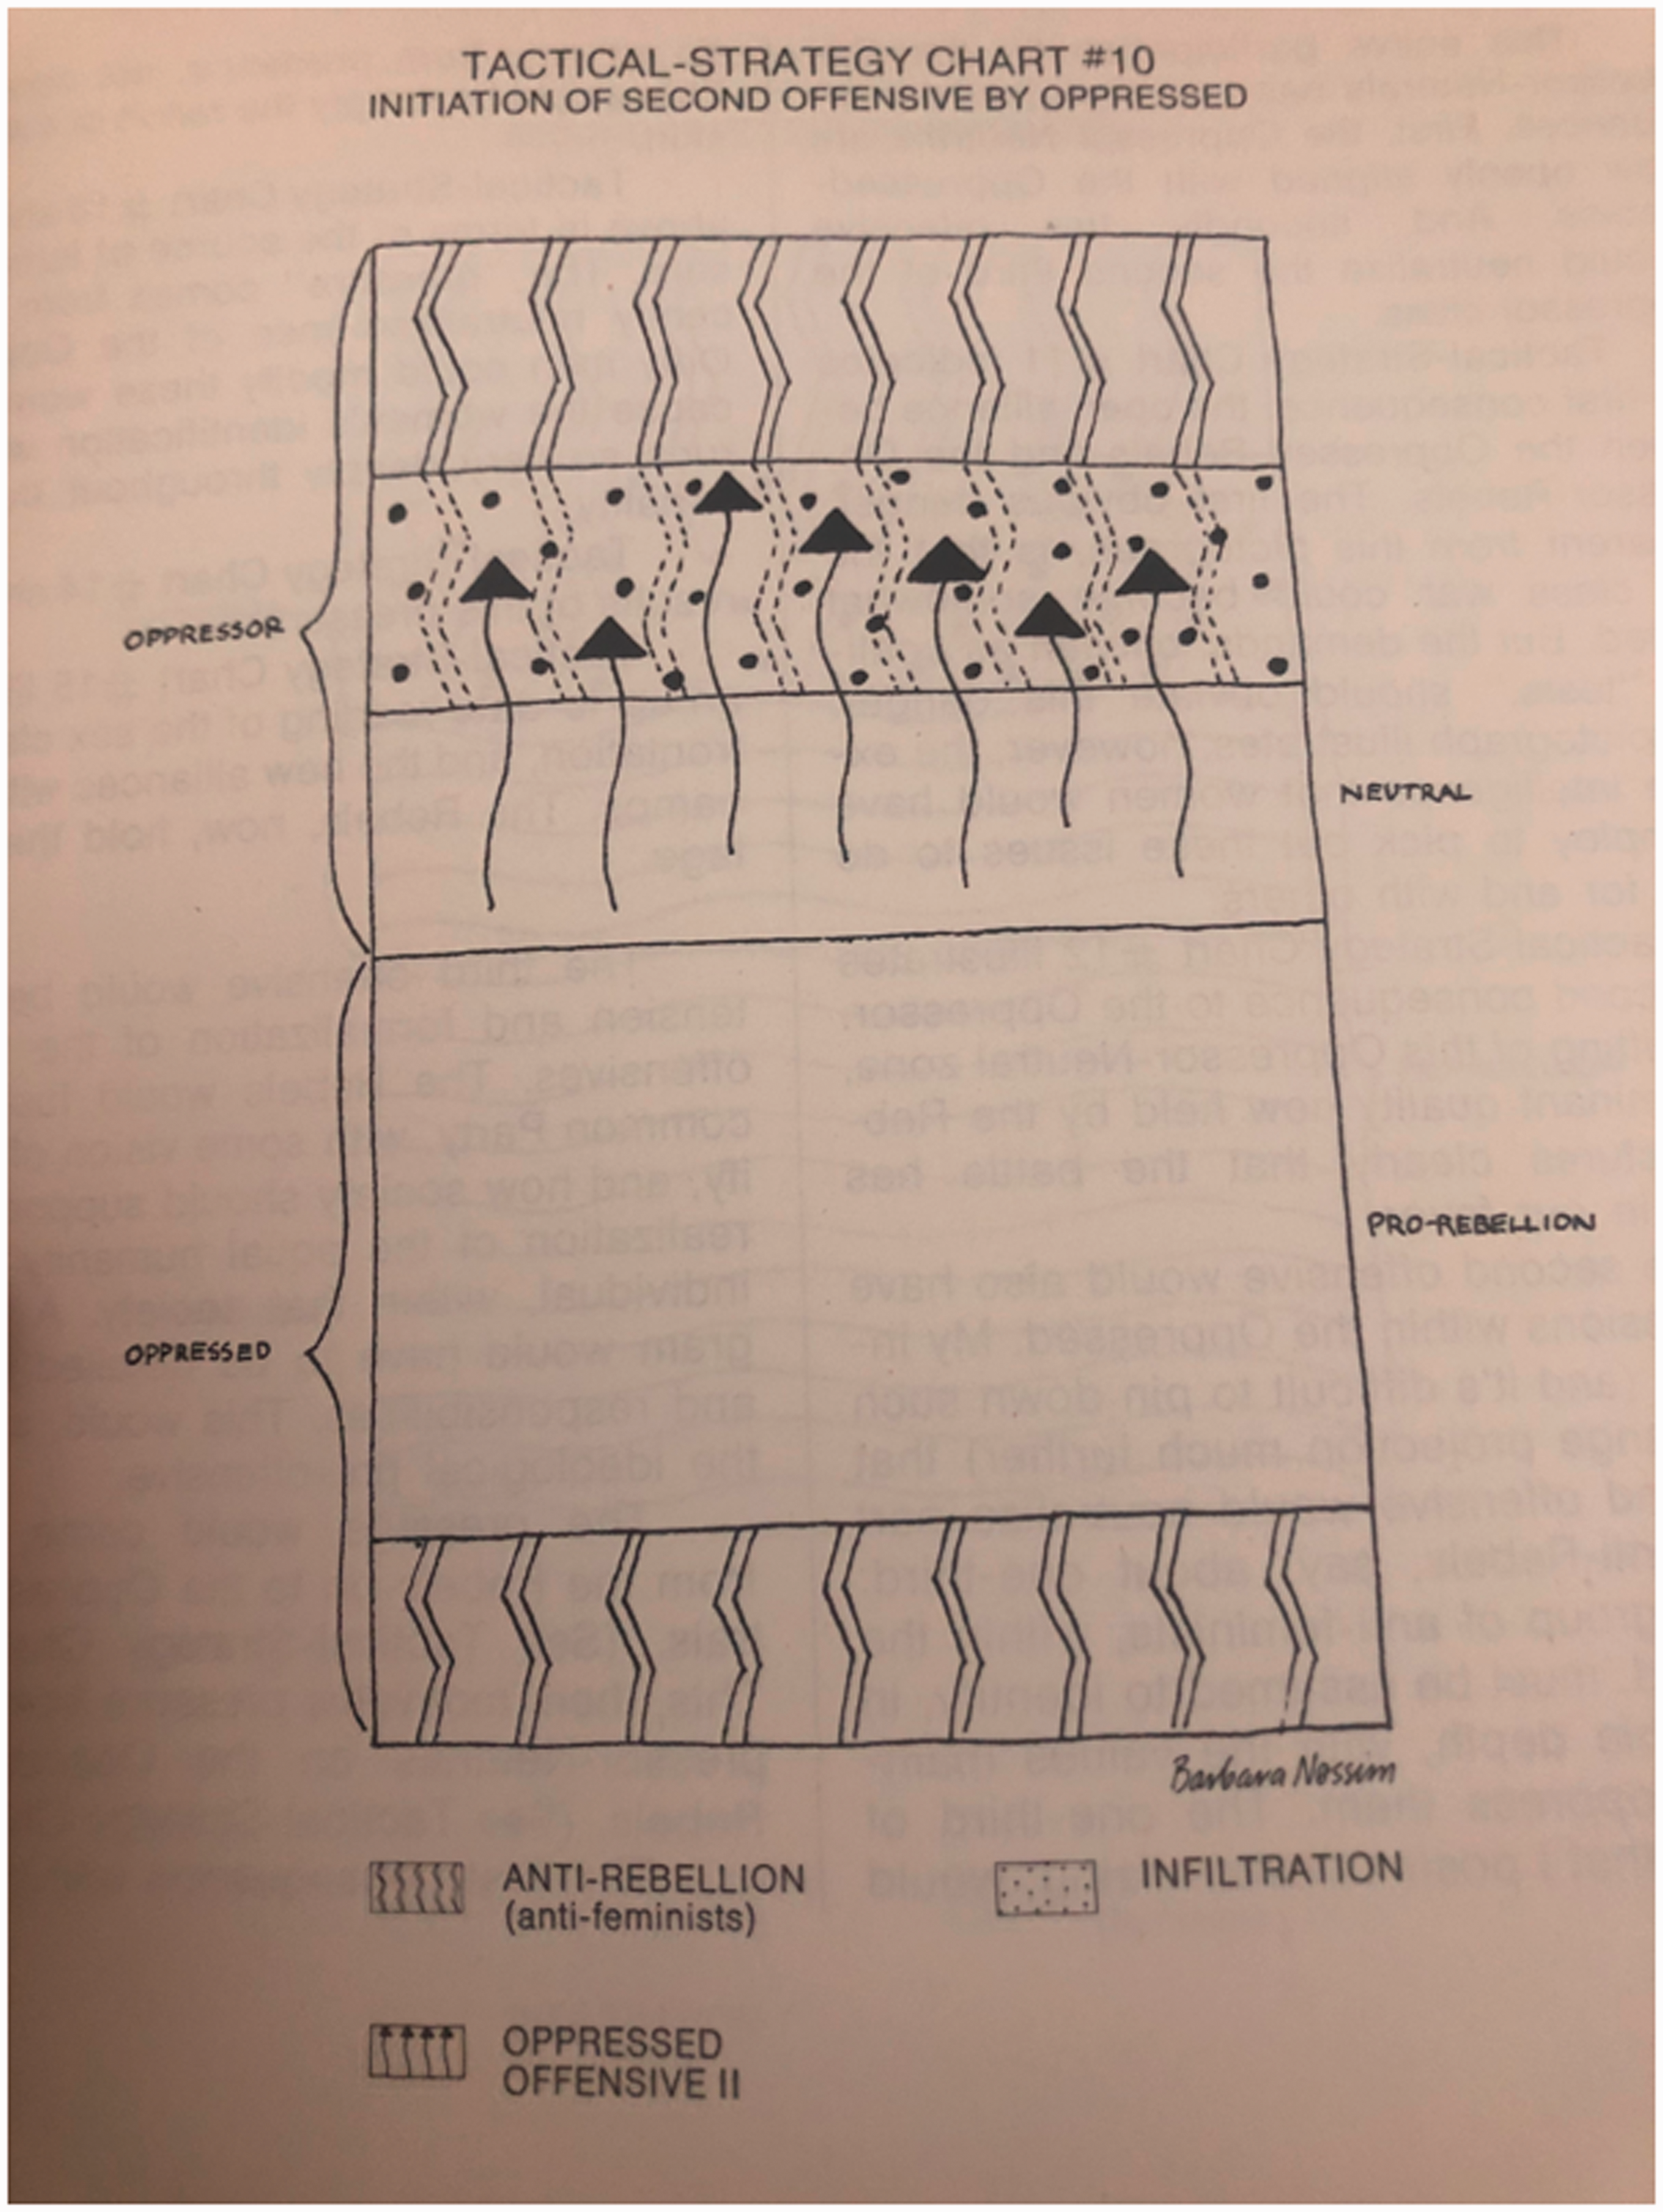
Tactical-Strategy Chart #10 (Atkinson, 1974: 173).
Integrally, the diagrams aim not only to map patriarchal relations as Atkinson currently sees them, but to demonstrate that these relations might be shifted, that a feminist revolution is possible. Atkinson writes, in the essay that accompanies the diagrams: ‘Good strategists make several plans to allow for any one plan not working out as expected’ (1974: 145). She argues that what is needed is a ‘complete map of the enemy’s territory’, and ‘an overall strategy’, a ‘long-range offensive, designed to achieve certain conditions not presently in effect’ (Atkinson, 1974: 154). Atkinson differentiates between ‘strategy’ and ‘tactics’. Tactics are ‘an emergency measure that can’t win the war’ (1974: 154), small-scale actions that are produced out of immediate necessity. Strategy, however, is for Atkinson a bolder, broader sketching out of the bigger picture and an overall plan for how to win not just a few battles, but the war. Strategy unfolds over time, strategy is large scale and strategy needs to be flexible, needs to anticipate the enemy’s move and have numerous options for how to proceed in any given situation. Strategy needs a map. The diagrams are the best way that Atkinson is able to imagine this future-oriented strategy. They offer a diagrammatic imaginary that is able to convey the unfolding temporality of a future, a future that cannot be entirely predicted, but nevertheless must be strategised. The diagrams, for Atkinson, are both an analysis of ‘the way things are’ and an argument for the possibility of a shift in relations under patriarchy; they are tentative, imaginary, hypothetical – they aim to predict what might happen in any given scenario, they aim for and require flexible thinking about the future.
This temporal complexity, a flexibility around thinking the future, is matched in Atkinson’s views about political lesbianism, the second key focus of the essay. Atkinson aims not just to map the relationship between oppressor and oppressed (understood as men and women), but also to understand the role of lesbians to the feminist revolution. In ‘Strategy and Tactics’, lesbians, for Atkinson, are imagined as tactically positioned between the oppressed and the oppressor – not quite women because they reject the ‘female role’, but also not oppressors either. As she explains it, ‘[w]hile these individuals cannot fully escape their native class, their rebellion segregates them into an area, neither fully outside one class (the Oppressed), nor quite within its counterclass (the Oppressor). These individuals insist on violating the “law” of their class system (they insist on living outside that law), and, thereby, become “criminals” within it’ (Atkinson, 1974: 138; emphasis in original). The lesbian, as she understands it, is positioned in this middle zone: ‘[t]he Buffer is, in fact, a sort of no man’s land’ (1974: 146). Yet, this no man’s land is described as central to the struggle between the oppressed and oppressor, acting as the front line. The buffer is particularly vital territory: ‘THE BUFFER IS, ABOVE ALL, THE KEY MANIPULATIVE MARGIN WITHIN ANY GIVEN CLASS SYSTEM’ (Atkinson, 1974: 139; emphasis in original). In ‘Strategy and Tactics’, lesbians act as the buffer between men and women, represent key tactical territory and are thus central to Atkinson’s radical feminist revolutionary imaginary. Yet, the above statement’s vehemence about the buffer’s importance to revolution potentially obscures Atkinson’s much more complex history of thinking about political lesbianism. While Atkinson’s position in ‘Strategy and Tactics’ is that lesbians are absolutely key to a sex class revolution, this was an unfolding position that she developed over the course of 1970.
While Atkinson has subsequently become known for her thinking on political lesbianism (and the kind of position that seems to be illustrated in ‘Strategy and Tactics’), her archive contains conflicted, contradictory and ambivalent ideas about lesbians and the women’s movement, reflecting not a coherent position, but a developing standpoint. Atkinson’s ambivalences about political lesbianism were perhaps characteristic of the early days of women’s liberation. As Victoria Hesford (2013) argues, despite the popular belief that the women’s liberation movement was full of man-hating lesbians, the relationship between feminism and lesbianism was still very much a question in the early days of the movement. Or, as Katie King puts it, this was a ‘historical context in which lesbians and feminists were not automatically assumed to be necessarily overlapping categories’ (1994: 125), were not necessarily seen as having anything in common. Atkinson was critical of heterosexuality and the way it organised desire, but her initial arguments at the beginning of 1970 were not for lesbianism, but for a feminist politics ‘that would allow women to escape from sexuality altogether’ (Hesford, 2013: 142). In a speech given on 21 February 1970, Atkinson argues that sex is ‘the premise of male oppression’ (1974: 85) and that women’s freedom depends on rejecting sex. Lesbianism, as a sexual identity, was for Atkinson definitionally reliant on sex. Despite the fact that the lesbian might reject men sexually, Atkinson understood the lesbian as bound to the ‘premise’ of patriarchy: sex. For Atkinson, feminism was the site of politics and lesbianism was the site of sex, and, as Hesford puts it, ‘[i]n setting up an opposition between politics and sex, Atkinson’s initial analysis of the relationship between lesbianism and feminism suggests not simply a distinction but a mutually antagonistic relation between the two’ (2013: 142).
Yet, by the end of 1970 and immediately preceding the delivery of ‘Strategy and Tactics’ in January 1971, Atkinson’s position had changed completely. In an op-ed piece from 21 December, written for but rejected by the New York Times and subsequently published in the Village Voice on 30 March 1972, Atkinson explains: ‘Lesbianism is to feminism what the Communist Party was to the trade union movement. Tactically, any feminist should fight to the death for lesbianism because of its strategic importance’ (1974: 134). As Hesford writes, this equation ‘now positions the lesbian as the movement’s true radical and lesbianism as its most subversive political practice’ (2013: 143). By the end of 1970, Atkinson was arguing that the lesbian’s rejection of a traditional ‘female’ role (in her rejection of heterosexuality and its ensuing roles) must be understood as a radical feminist act – lesbians were now at the forefront of feminist struggle, the most visibly ‘criminal element’ of women as a class. The analogy in the quotation above, its use of the language of battle, tactics and strategy, also foreshadows the terminology that Atkinson would deploy in ‘Strategy and Tactics’.
Perhaps this complicated and unfolding history is best summarised in the history of the famous statement ‘feminism is the theory and lesbianism is the practice’. While the phrase is frequently attributed to Atkinson, King (1994: 125) has shown that this attribution is complicated. It is Anne Koedt, in ‘Lesbianism and Feminism’ (1971 [1973]), who uses the phrase as an epigraph, connecting it to Atkinson. However, as King notes, Koedt does not actually say that Atkinson said it but rather writes: ‘attributed to Ti-Grace Atkinson’ (1994: 125). This slightly removes the phrase from Atkinson herself, noting only that it is a phrase that is attributed to her (rather than something she definitely said). King investigates this attribution and argues that what Atkinson actually said, in a speech in 1970, was: ‘Feminism is a theory; but Lesbianism is a practice’ (1994: 125). This, of course, is a substantially different claim – lesbianism and feminism are not brought together by the ‘and’ of the infamous statement, but are rather sharply divided by the ‘but’ of what was perhaps actually said. King writes: ‘the phrase is revealed to have been transformed historically in the women’s movement to mean its actual opposite’ (1994: 125). King suggests that this makes Atkinson ‘look like a different person’ (1994: 125) – no longer does she seem to be arguing for political lesbianism, but instead seems critical of this possibility. Yet, for me, the complexity of this attribution does not so much turn Atkinson into a different person, but instead reveals the ways that Atkinson’s views are unsettled and complicated in this particular historical moment. The suggestion that Atkinson merely ‘was’ a key voice in exploring political lesbianism erases the ambivalences and uncertainties that Atkinson had about political lesbianism in 1970. It is an example of the way a clear ideological standpoint becomes attached to a figure that has a much more complicated intellectual history. Acknowledging this complexity does not erase the importance of Atkinson’s later thinking on political lesbianism, but it does provide an opportunity to insert a bit more ambivalence into this history.
I narrate this pre-history to Atkinson’s position on political lesbianism in ‘Strategy and Tactics’ to perform the insistence that we might approach feminist ideas with a sense of their unfolding nature. To suggest that Atkinson represented a radical form of political lesbianism is to erase the ways that she was actively engaged in working out this position across a period of time – her archive displays conflicting messages about political lesbianism, and she tests out a number of hypotheses. As Hesford argues, the history of women’s liberation is rarely treated in its complexity. Instead, it is ‘largely read as evidence of specific and coherent ideological standpoints, which are then defended or criticized in a more knowing present’ (2013: 2). The erasure of the complexity of the archive of women’s liberation limits the kinds of critical perspectives we might have towards this history – predominantly producing either critique or defensiveness. Against these two modes, Hemmings (2018: 5) argues that ambivalence might be structurally central to feminist and queer politics, both historically and in the present.
I also narrate Atkinson’s initial ambivalence about lesbianism, and the ensuing development of her arguments for the absolute necessity of lesbianism to the feminist revolution, to suggest that this is an important context through which to read the function of the diagrams in ‘Strategy and Tactics’. A focus on developing ideas, changeability and uncertainty seems to be precisely what Atkinson’s diagrams offer. The diagrams evidence Atkinson working out what role lesbians might play in feminist ‘war games’, playing out of a range of political possibilities. For instance, in the essay, Atkinson tentatively suggests that every feminist might wear a button that read ‘I am a lesbian’. She argues that this might counter the oppressor’s use of the accusation that all feminists are lesbians. If feminists were not afraid of the label and instead claimed it, this could frustrate the oppressor’s strategy (Atkinson, 1974: 155). This is a hypothetical idea, a suggestion, a tactic that Atkinson plays out – a small example of the strategy of the essay as a whole. One way to read these diagrams is to see them not only as attempts to map a series of relations (between ‘oppressor’, ‘oppressed’ and the ‘buffer’), but as themselves a kind of praxis that evidences process, perhaps above knowledge. They are tentative, they speculate, they test out possibilities for a feminist future.
Just as it is often difficult to recognise the complexity contained in feminism’s various archives, the diagrams are perhaps challenging or estranging precisely because of the way they test out ideas, rather than seem to offer a coherent or singular programme. They might be difficult to approach, difficult to understand, precisely because of this play with multiple possibilities, unknowingness and trial and error. Perhaps though, this is precisely the pleasure and also the productive possibilities contained in diagrams such as Atkinson’s. They present relationships in motion, rather than static and unchanging/unchangeable. The diagrams are committed to a logic of ‘if this happens, then this’, attempting to map a number of different possible scenarios. While only a set number of possibilities are charted, the diagrams not only demand that feminism stay alive to the moves of the ‘enemy’; they also imagine an openness in the field of relations produced by patriarchy – the diagrams are deeply invested in the possibility for change. It is this idea that I pick up on in the next section, where I turn to consider diagrams in feminism more broadly. If there has been nothing written about Atkinson’s diagrams, I want to suggest that the feminist diagram more generally has also received almost no attention. This next section will experiment with moving from Atkinson’s diagrams, to a beginning genealogy of the diagram in feminist theory, to finally, more contemporary feminist data visualisation projects, suggesting that Atkinson’s commitment to diagrams has wider resonance within feminism.
The revolution will be diagrammed
I cannot hope to offer a comprehensive history of diagrams or diagrammatic imaginaries in this essay. 1 Diagrams cut across disciplinary fields and are numerous. While perhaps being most readily associated with the sciences, diagrams are also widespread in the humanities – from psychoanalysis to geography to digital humanities. Moreover, there is no one type of ‘diagram’. The Greek diagramma is a combination of dia, ‘through’, and graphein, ‘writing’ and the Oxford English Dictionary definitions of ‘diagram’ all emphasise that it is an illustrative figure used to explain something – this ‘something’ is often a process or a set of relations. This definition makes a distinction between an image per se and a visualisation that is meant to express a particular argument, process or relation between objects. It is difficult to source any sustained discussion about the practice of diagramming in feminist writing. While texts such as Lynne Pearce’s The Rhetorics of Feminism (2004) and Hemmings’ Why Stories Matter (2011) explore the rhetorics of feminist argument, and feminism’s political grammar, the diagram as a form is not explored in either. 2 In thinking about diagrams within feminism, I do not mean ‘images’ or ‘the visual’ in broad terms, but more specifically, how feminist thinkers have used diagrams as a way of illustrating or ‘writing through’ ideas. I am interested specifically in moments when a diagram is what a particular thinker turns to in order explicate a concept, to think through a set of relations or to illustrate an argument. Another way to put this would be to suggest that I am focused on instances where a particular commitment or theoretical idea is modelled. While diagrams have a vast history in activism (for instance on protest signs or banners, in zines, worn as badges), it is the diagram in feminist theory that I am particularly interested in. Without wanting to draw too clear a division between activism and theory (which might suggest that activism isn’t theory or that theory isn’t activism, neither of which I want to imply), I think it is possible to argue that the function of the diagram in feminist writing and theorising has been under-addressed as a recurrent tactic.
Perhaps the most famous feminist diagram is the one that hangs above my office desk: Firestone’s diagram of the revolution in The Dialectic of Sex ([1970] 2015). It is this diagram that almost everyone mentions to me when I say I am interested in feminist diagrams and its popularity seems confirmed by Verso’s decision, upon re-issuing The Dialect of Sex in 2015, to produce and sell large poster-sized versions of this diagram. After all of her textual argumentation, Firestone includes, at the very end of the book, a two-paged diagram of the revolution, which she prefaces the page before with a dedication: ‘For that rare diagram freak, 3-D REVOLUTION →’ ([1970] 2015: 243). In this diagram, Firestone maps the categories of ‘sex’, ‘class’ and ‘culture’ in the ages she names ‘Classical’, ‘Renaissance’ and ‘Modern’. She envisions the three revolutions necessary to achieve the ultimate goals – these revolutions being the ‘Sexual Revolution’, the ‘Economic Revolution’ and the ‘Cultural Revolution’. For Firestone, these revolutions will enable ‘Full Sexual Freedom’, ‘Self-determination’ and ‘The Realization of the Conceivable in the Actual’ ([1970] 2015: 244–245). Encompassing all of the history of the world and diagramming the revolution, a transition period and the ultimate aims, Firestone uses this revolutionary map to make links between class, culture and sex, and also to insist on the possibility for change. While this two-page graph that maps the stages of a Marxist feminist revolution is very well known, it is rarely addressed in critical engagements with Firestone’s work. 3 While Firestone’s diagram looks nothing like Atkinson’s, both projects are interested in detailing visually a set of relations under patriarchy and in exploring how these relations might be shifted. The diagram, for both, is an attempt not only to explain the way things are, but to start to envision ways out – to depict a present, but a present that might change or, rather, be changed by feminist activism. The pleasure in both of these projects comes in part, I think, from the risks that each thinker takes to imaginatively invest in a future that might be realised in only a few moves – a schema for a possible revolution.
Firestone’s diagram is perhaps the most historically expansive attempt at mapping a feminist revolution (and perhaps the most akin to Atkinson’s charts), but diagrams exist across a range of feminist works. Notably, Gloria Anzaldúa, who was invested in the value of creativity to thought, produced numerous diagrams as a way to think through her ideas. 4 As a small example of the importance of diagrams to Anzaldúa, there is an interview from 1998 in which she explains how colonised people are not outside of the frames of understanding of the coloniser, and vice versa: ‘there is no such thing as an “other.” The other is in you, the other is in me. This White culture has been internalized in my head’ (Lunsford, 1998: 8). She pauses the textual discourse and offers: ‘Let me show you a little drawing, so you can see what I am saying’ (Lunsford, 1998: 7). The drawing offers two almost tadpole-like figures on either side of the divide; one of them is labelled ‘subject’ and is given the descriptors ‘dominance, us, we’, while the second one is labelled ‘other’ and given the descriptors ‘subordination, they, them’. Above the drawing she has written nosotras (we) and below ‘disrupts binary oppositions’ (Lunsford, 1998: 7). The diagram becomes a shorthand, or a creative intervention, in the textual language of the interview. Anzaldúa, in this moment (and in her archive more generally), turns to diagrams to supplement what the written word can achieve.
The explanatory power of diagrams is a tactic used in a number of other feminist works. Griselda Pollock, in Vision and Difference: Feminism, Femininity, and the Histories of Art, uses charts to connect ‘impressionist paintings to the erotic territories of modernity’ (1988: 104), while also mapping the more ‘private’ spaces that dominated women’s impressionistic paintings (1988: 114). The charts in Pollock offer a data visualisation of the spaces and the sexual politics of these spaces as they appear in impressionist paintings. Similarly, Juliet Mitchell uses a chart in Woman’s Estate (1971). In her chart, Mitchell compares and contrasts the views of, on the one hand, the ‘radical feminists’ and, on the other hand, the ‘abstract socialists’. Striving towards a socialist feminist theory, she outlines the various debates textually before offering the chart. Mitchell gives some justification for the chart, explaining that ‘perhaps tabulating some of the arguments on either side will give it the necessary concreteness’ (1971: 94). In Pollock, the use of charts enables her to map a field of power relations, whereas Mitchell uses the chart to concretise what she sees as the disagreements between radical feminism and socialism.
There are still other sites though where we might think about the importance of the diagram to feminist theory. These examples are not diagrams themselves, but work by invoking what I am suggesting is a kind of diagrammatic imaginary. In her 1980 essay ‘Compulsory Heterosexuality and Lesbian Existence’, Adrienne Rich introduces the concept of the lesbian continuum. The concept aims to break down the binary between lesbians and straight women, by suggesting that sexual relationships between women might be mapped on a continuum with the many other ways that women might devote time and energy to each other. For Rich, this continuum produces the possibility of suturing a fracture in the women’s movement between lesbians and non-lesbian feminists, by connecting all of the various ways that women might develop intimacies with each other. While there was no diagram in this essay, the concept works, and, to draw on Sara Ahmed, is perhaps ‘sticky’ (2004: 11), because of the way it evokes a diagram – a graph that any woman might plot herself along. I would also hazard that in many teaching and learning contexts, the continuum is rendered as an actual diagram by educators and students. A similar argument could be made about Marilyn Frye’s concept of the ‘bird cage of sexism’, a metaphor that she uses to explain the way that women, like a bird in a cage, are ‘surrounded by a network of systematically related barriers, no one of which would be the least hindrance to its flight, but which, by their relations to each other, are as confining as the solid walls of a dungeon’ (1983: 4–5). While her essay does not contain a diagram, any cursory search online shows that teaching material frequently renders this concept diagrammatically. Peggy McIntosh’s concept of the ‘knapsack of white privilege’, in which she describes whiteness as ‘like an invisible weightless knapsack of special provisions, maps, passports, codebooks, visas, clothes, tools and blank checks’ (1989: 10), provides yet another example of this kind of concept. In my own teaching, I have rendered Judith Butler’s ‘heterosexual matrix’, which ‘designates that grid of cultural intelligibility through which bodies, genders, and desires are naturalized’ (1990: 208, n. 6), as a diagram on many a whiteboard.
Kimberlé Crenshaw, credited with the development of the theory of intersectionality, also relies on a diagrammatic imaginary. Intersectionality, for Crenshaw, denotes ‘the various ways in which race and gender interact’ (1991: 1244), and disrupts ‘the tendencies to see race and gender as exclusive or separable’ (1991: 1244, n. 9). In order to explain this concept, to make visible how multiple axes of identity are experienced as interlocked, Crenshaw invokes an intersection: ‘Discrimination, like traffic through an intersection, may flow in one direction, and it may flow in another. If an accident happens in an intersection, it can be caused by cars traveling from any number of directions and, sometimes, from all of them’ (1989: 149). While the article does not include a diagram, Crenshaw delivered a TED Talk in 2016, in which she did use a visualisation. The diagram is a simple intersection, with a road running horizontally labelled ‘sexism’, a road running vertically labelled ‘racism’ and a woman standing at the intersection. Intersectionality, the lesbian continuum, the bird cage of sexism and the knapsack of white privilege are all well-known and important concepts in both feminist theorising and feminist teaching. Part of the appeal of these concepts is the way they use and invite visualisation. Moreover, much like Atkinson, these concepts are also all tools for mapping. They are each concepts that think through how subjects are located and produced in relation under white heteronormative patriarchy.
To reflect again on the context of this special section, and the editors’ invitation to think about what it means to engage with feminism’s past in ways that might be forward-looking, I want to briefly suggest that this beginning genealogy of the history of the diagram in feminist theory might provide a pre-history to more contemporary feminist data visualisation projects. While feminist data visualisation is not necessarily illustrative of concepts or ideas in the ways that the diagrams I have been charting might be said to be, there is, I venture, a shared commitment to the feminist possibilities of maps and diagrams as being able to reveal and transform relations of power. While feminist data visualisation is a broad field, what unites feminist thinking in the field is the insistence that data visualisations do not represent objective knowledge. 5 Much of this work draws on Donna Haraway’s earlier critiques of scientific objectivity in ‘Situated Knowledges’ (1988), where she argues that all knowledge comes from a particular perspective, and is therefore always partial. Feminist data visualisation insists that diagrams, in other words, are not neutral objects that ‘express’ a relation – rather, they shape relations and knowledge. While data might seem to be neutral, feminist data visualisation projects emphasise that diagrams are sites of power. This is explored, for instance, in Giorgia Lupi and Stefanie Posavec’s project Dear Data (2016), in which, over the course of a year, the pair sent weekly postcards to each other, on which were visualised aspects of their daily lives, rendered as data. For instance, week 24 was ‘A week of doors’ and week 32 was ‘A week of sounds’, recording their encounters with doors or sounds, respectively. Each week Lupi and Posavec visualised the information differently, made decisions on what to include and therefore explored how data is something that is interpreted and selected. As Miriam Kienle puts it, they pose a feminist challenge to the idea that ‘the world is data that can be captured and visualized with neutral, distanced, and all-encompassing technologies of vision’ (2019: 130).
This is a commitment to exploring power and biases in how the world is represented. It is also, integrally, a means of using visualisations differently, creating new kinds of worlds. Diagrams, in other words, can be used to map subjects and relationships that are missing from more dominant archives or historical records. These often large-scale diagrams are attempts at making visible erased, marginalised or forgotten histories. 6 For example, Andrea Geyer’s ‘Revolt, They Said’ (2012–present), is a large network diagram that maps influential women in the American cultural landscape (and the connections between them) as a way of making visible the frequently marginalised women of American cultural history. In the scale of the diagram and the open-ended nature of the project, Geyer’s network diagram means to astound the viewer with the extent of the erasure of this network of women. In visualising connections this way, Geyer maps an entire world of connection that otherwise had remained mostly invisible. Similarly, Lubaina Himid’s diagram ‘Thin Black Line(s)’, which was displayed at Tate Britain in 2012 in an exhibition of the same name, illustrates the connections and networks of young Black and Asian women artists in the United Kingdom, connections which informed three exhibitions in London in the 1980s. Much like Geyer, Himid uses the visual to map a world of otherwise marginalised women. Along with these explicitly feminist examples, further diagrammatic works by contemporary artists and practitioners were exhibited in Eindhoven, the Netherlands in 2019, for the exhibition Diagrams of Power, curated by Patricio Dávila (2019). Diagrams, in these examples, are explored for the possibility that they might achieve political aims – they become ways to imagine transforming relations of power.
These more contemporary examples of feminist data visualisation projects share Atkinson’s investment in thinking through power relations via visual diagrams. To suggest that Atkinson’s diagrams (as well as the other diagrams discussed above) might be a kind of pre-history to feminist data visualisation is not to argue that they are the same. There are important differences between Atkinson’s project and the ones briefly sketched above. In making tentative connections across time, I am also making tentative connections across disciplines, bringing together what is often imagined as separate – the more literary or humanities-based feminist theory with feminist science studies. But, following the diagram suggests that modelling or mapping as a feminist practice might not only have a longer history, but also a more unruly disciplinary history in feminism. If, as I have suggested, most work on feminist data visualisation draws on the insights of Haraway, Atkinson’s work with diagramming comes almost two decades earlier. Perhaps contemporary feminist data visualisation theory and practice is not just anchored in Haraway’s critique of scientific objectivity but might also come from a broader feminist commitment to the rhetorical and also revolutionary possibilities of diagrams and diagrammatic imaginaries.
Conclusion
In an afterword to the collection Amazon Odyssey, Atkinson offers an account of the development of the charts. She worked on the charts with artist Nessim, who drew not only the thirty-five charts in ‘Strategy and Tactics’, but also the other illustrations contained throughout the edited collection. Much of the afterword is dedicated to explaining the charts specifically, with Atkinson exclaiming ‘How in the hell could anybody understand that piece, in terms even close to what I was trying to get at, without them [the thirty-five charts]?’ (1974: ccxxxvii). In the afterword, the charts are able, better than words, to illustrate and map precisely the relationships that Atkinson is interested in. As Atkinson writes, ‘[e]ach of the 35 charts saved me pages of explanation. […] Relationships can be taken at a glance that simply could not be explained adequately in any other way’ (1974: ccxxxvii). Of course, this is a complicated statement. Feminist data visualisation theory argues that the world cannot be neutrally translated into data or diagrams. In Atkinson’s charts, we see not a neutral representation – the diagrams, for instance, translate patriarchal relations into specific categories (oppressor, oppressed, the buffer zone), when there might have been others. They are arranged as if on a spatial battleground – again, there are other ways that this might have been visualised. So, even as Atkinson imagines the charts as the most accurate way to convey the relationship between oppressor and oppressed, and to visualise how these relationships might be shifted, the charts are not neutral or objective representations. However, it is not their ‘rightness’ or ‘wrongness’ that I am interested in. Rather, it is Atkinson’s commitment to using diagrams to visualise relations of power. The afterword reveals the stakes of the diagrams, and also Atkinson’s investments in the possibilities of mapping. She writes: ‘[a] map of the enemy’s territory must be meticulously reconstructed. Exactly how is the sex class system constructed? What holds it in place? What keeps it going? Such a map should reveal the strongholds from within which oppressive power is generated. It is these strongholds which must be attacked’ (Atkinson, 1974: 159; emphasis in original). Contained in Atkinson’s diagrams, in her project, is the belief that a meticulously drawn map of patriarchy could lead to the revolution. Diagrams, for Atkinson, make it possible to envision shifts in the gendered relations of power that patriarchy produces. Enfolded into a broader genealogy of diagramming as feminist practice, it becomes possible to insist that Atkinson is not alone in her desires.
If I have been arguing that the diagrams in ‘Strategy and Tactics’ might be enfolded into a larger genealogy of diagrams and diagrammatic imaginaries in feminist theory, I also want to suggest that Atkinson’s investment in the map as leading to the revolution might not be a strange mode of belief but rather a central attachment within feminist theory. It might also be that this investment is part of the pleasure of the diagrams, the kind of pleasure that only a perfect plan, a perfect map, can generate. Robyn Wiegman argues that central to academic feminism is ‘a resolute, indeed unwavering commitment to knowledge production as the scene of political struggle, one that wagers the relationship between what and how we know as crucial to knowing what to do’ (2012: 71; emphasis in original). Across a number of debates within feminism about the ideal framework, language or term to employ is the underlying belief that the right framework, language or term will provide a map of what to do. This, after all, is why we debate terms and frameworks – because of the relationship that is imagined between how we know and what we think this knowing will do. Finally, then, to return to my attraction to the diagrams, perhaps the pleasure I take in them, the pleasure of the diagram, is not only about what they represent, but the beauty of the promise of the perfect map. As though the perfect map will not only explain gendered power relations, but might lead us to a different future. Diagrams seem to attempt to bridge these two temporalities – on the one hand they seem to be about explaining things as they are. Yet, on the other hand, feminist theory’s diagrams and diagrammatic imaginaries are not just about observing the state of things. Feminist theory’s diagrams aim to shift and challenge power relations; they straddle ‘the way things are’ and a future that might be different.
Footnotes
Funding
The author(s) disclosed receipt of the following financial support for the research, authorship, and/or publication of this article: I wish to thank the Alexander von Humboldt Foundation for the funding to support this work.