
Abstract
The laser welding of Cu–Al alloys for battery applications in the automotive industry presents significant challenges due to the high reflectivity of copper. Inadequate bonding and low mechanical strength may occur when the laser radiation is directed toward the copper side in an overlap configuration welding. To tackle these challenges, a laser surface treatment technique is implemented to enhance the absorption characteristics and overcome the reflective nature of the copper material. However, elevating the surface roughness and heat-energy input over threshold values leads to heightened temperature and extreme weld. This phenomenon escalates the formation of detrimental intermetallic compounds (IMC), creating defects like cracks and porosity. Metallurgical analysis, which is time-consuming and expensive, is usually used in studies to detect these phases and defects. However, to comprehensively evaluate the weld quality and discern the impact of surface structure, adopting a more innovative approach that replaces conventional cross-sectional metallography is essential. This article proposes a model based on the image feature extraction of the welds to study the effect of the laser-based structure and the other laser parameters. It can detect defects and identify the weld quality by weld classification. However, due to the complexity of the photo features, the system requires image processing and a convolutional neural network (CNN). Results show that the predictive model based on trained data can detect different weld categories and recognize unstable welds. The project aims to use a monitoring model to guarantee optimized and high-quality weld series production. To achieve this, a deeper study of the parameters and the microstructure of the weld is utilized, and the CNN model analyzes the features of 1310 pieces of weld photos with different weld parameters.
Keywords
Introduction
Copper and aluminum are common materials used to manufacture automotive lithium-ion batteries. High electrical and thermal conductivity properties encourage their use in this industry. In addition, copper and aluminum's lightweight and corrosion-resistant characteristics make using these dissimilar materials in battery production essential. For example, these materials join in a Li-ion cell pouch. Copper serves as the anode and aluminum serves as the cathode. These cells have a high energy density and are used in automotive batteries. 1 However, a high-quality joint between copper and aluminum is required. It must withstand high mechanical and thermal stress and preserve sufficient electrical conductivity.
Laser welding of Cu–Al is a promising technology that is used in the automotive battery industry due to its short cycle time, precise production, and high degree of automation. 2 However, laser welding poses some challenges due to the difference in physical and chemical properties of copper and aluminum. It can affect the quality of the weld joint, leading to weld defects. 3 The high reflectivity of these materials results in low laser beam absorption and a lack of keyhole formation. This, in turn, can lead to an unstable and weak mechanical joint, making it unfit for industry applications.4,5
Increasing the laser beam energy input is proposed to address welding instability to facilitate keyhole formation. However, weld analysis indicates that a deep keyhole may form intermetallic compounds (IMCs) in Cu–Al weld. These phases are characterized by their brittleness; they can be a reason for accelerating crack propagation due to the differences in melting temperature and thermal coefficient of expansion of copper and aluminum.6,7 Furthermore, Schmalen et al. 8 have emphasized that IMCs exhibit high electrical resistance and should be avoided or minimized, specifically in lower-thickness joints. Nevertheless, achieving a narrow process parameter window based on beam trajectory and beam power is necessary to minimize the heat input and formation of defects in welding thin sheets materials.9,10
Researchers have investigated numerous methods to enhance the copper absorption rate and address the issue of reflectivity, weld defects, and detrimental IMCs. For example, adding a copper nano-composite to the pure copper surface specimen in laser welding demonstrates a deeper keyhole than an as-received specimen. This method helped significantly reduce copper reflectivity from 88% to 15%. 11 Research by Steen et al. 12 has stated that using a short-wavelength laser beam in copper welding enhances laser beam absorption. Their findings demonstrate that a transition from a laser wavelength of 1000–500 nm can result in an approximate increment in absorption rate ranging from 3% to as much as 40%. Subsequent investigations, as carried out by Engler et al., 13 have tried to distinguish between infrared and green laser welding techniques when the laser beam is applied to the copper surface. The analysis revealed that employing a green laser can facilitate the creation of keyholes. The shorter wavelength inherent to the green laser contributed significantly to increased absorption rates within copper's solid and liquid phases.
Although using a short laser wavelength is often regarded as a practical approach for copper laser welding, alternative methods using an infrared laser beam source have also been explored, making laser welding of copper feasible. Maina et al. 14 have concluded that a rough surface can have superior effects on laser beam absorption rates. Specifically, a surface featuring 30 μm grooves depth exhibits enhanced laser penetration and more stable micro-welding. In the related study by Helm et al., 15 a fiber laser with a wavelength of 1070 nm is employed for copper welding. It is concluded that a pre-processing step involving laser engraving to create surface structures on the copper is considered effective in increasing absorption. This method has achieved an 86% reduction in reflectivity compared to laser welding performed on the as-received copper surface. These results state that a low-power laser can modify randomized and unstable welding for high-reflective material like copper with an engraved surface structure. To prepare copper sheets for laser welding, Lee and colleagues 16 have implemented femtosecond laser surface modification to increase surface absorption and make a texture on the copper specimens. This approach has yielded successful outcomes, leading to increased weld width and depth and a 300% boost in the speed of the laser welding process.
A study by Amne Elahi et al. 17 shows the effect of surface roughness on absorption when a laser-based structured method is used to make structures on the copper surface. They used three different copper surfaces for welding with aluminum in an overlap weld configuration. The low thickness of copper specimens leads to using a small process parameter window. Using very rough surface structures and high energy input levels has a heightened risk of encountering several welding defects, such as cracks, voids, and the formation of IMCs. They applied destructive tests and metallurgical analyses to study the characteristics of the phases and defects. However, they concluded that using an intelligent and non-destructive system that can categorize different welds is necessary. One can use the optimized parameters based on the experiments for the system model training.
In recent studies, researchers have started adopting machine learning in laser welding. The aim is to monitor the process and avoid the necessity for destructive tests. Zhang et al. 18 have utilized a convolutional neural network (CNN) model to identify the porosity defect in aluminum laser welding. Using a high-speed camera and capturing the welding process, they achieved 96.1% accuracy in porosity detection. However, some tiny pores with a size of 150 μm require a higher resolution and frame rate to guarantee high predictive capability. In another investigation, Kastner et al. 19 used a thermal camera to generate a dataset and classify spot welds. They implemented a CNN model that achieved 95% in accurately categorizing spot welding quality. This method offers a monitoring system that can improve welding efficiency.
In a study by Mathivanan et al., 20 a CNN model is used for the data analysis of Cu–Al laser welding. This study focused on the impact of laser beam power and its correlation with the percentage of melted aluminum in the weld zone. They categorized different welds using a range of heat energy inputs and studied the weld zone by Energy-dispersive X-ray spectroscopy (EDS) analysis. Based on these results, they trained a CNN model and could achieve 100% accuracy. These findings have motivated further research into applying CNN technology in Al–Cu laser welding, considering more welding parameters and different models.
In contrast to the prior study, thin copper sheets of 0.1 mm thickness with different surface structures are used in this study. The number of captured photos increases and different image qualities ranging from high to low quality are considered. This study's initial phase involves examining the parameters associated with the laser-based structuring of copper as a pre-welding process, followed by an investigation into the laser beam welding of Cu–Al. Subsequently, a comprehensive metallurgical analysis will be conducted on the joint to identify the presence of IMCs. The classification of the weld quality will be based on the results obtained from the hardness test. However, this article aims to identify weld quality through non-destructive methodologies. To achieve this goal, images of the weld zone captured from a top-view perspective will undergo thorough image processing. In this stage, a CNN model will be employed to predict the weld quality/class by detecting distinctive features.
Experimental procedure
The experimental procedure's initial phase involves using a pulsed laser source, Trumark 6030, to structure the copper surface before the welding process. This laser-based surface structure procedure is employed to generate a surface texture, thereby enhancing the absorption of the copper sheet. Subsequently, the processed copper sheet (oxide free, 99.95%), 0.1 mm thickness, is clamped in an overlap configuration to an aluminum sheet, Al 1050, with a thickness of 0.5 mm. This joining process is carried out under a 400-watt power fiber laser source, the Trufiber 400, equipped with a Scanlab HS20 2D f-ϴ scanner. The spiral trajectory of the laser beam on the copper material is characterized by movement originating from the central point and extending outwards.
In order to execute the predictive model in the subsequent phase, acquiring a considerable quantity of welded samples is critical. Specifically, 20 spiral trajectory welds have been undertaken for each sample. The Fujifilm camera, X-Pro20 model, is employed to acquire images of the weld bead. Subsequently, the rough images, with 4000 × 4000 pixels, undergo processing, resulting in processed images with dimensions reduced to 1200 × 1200 pixels. Figure 1 specifies the welding configuration, series of welding, clamping forces, spiral trajectory, and materials dimensions.
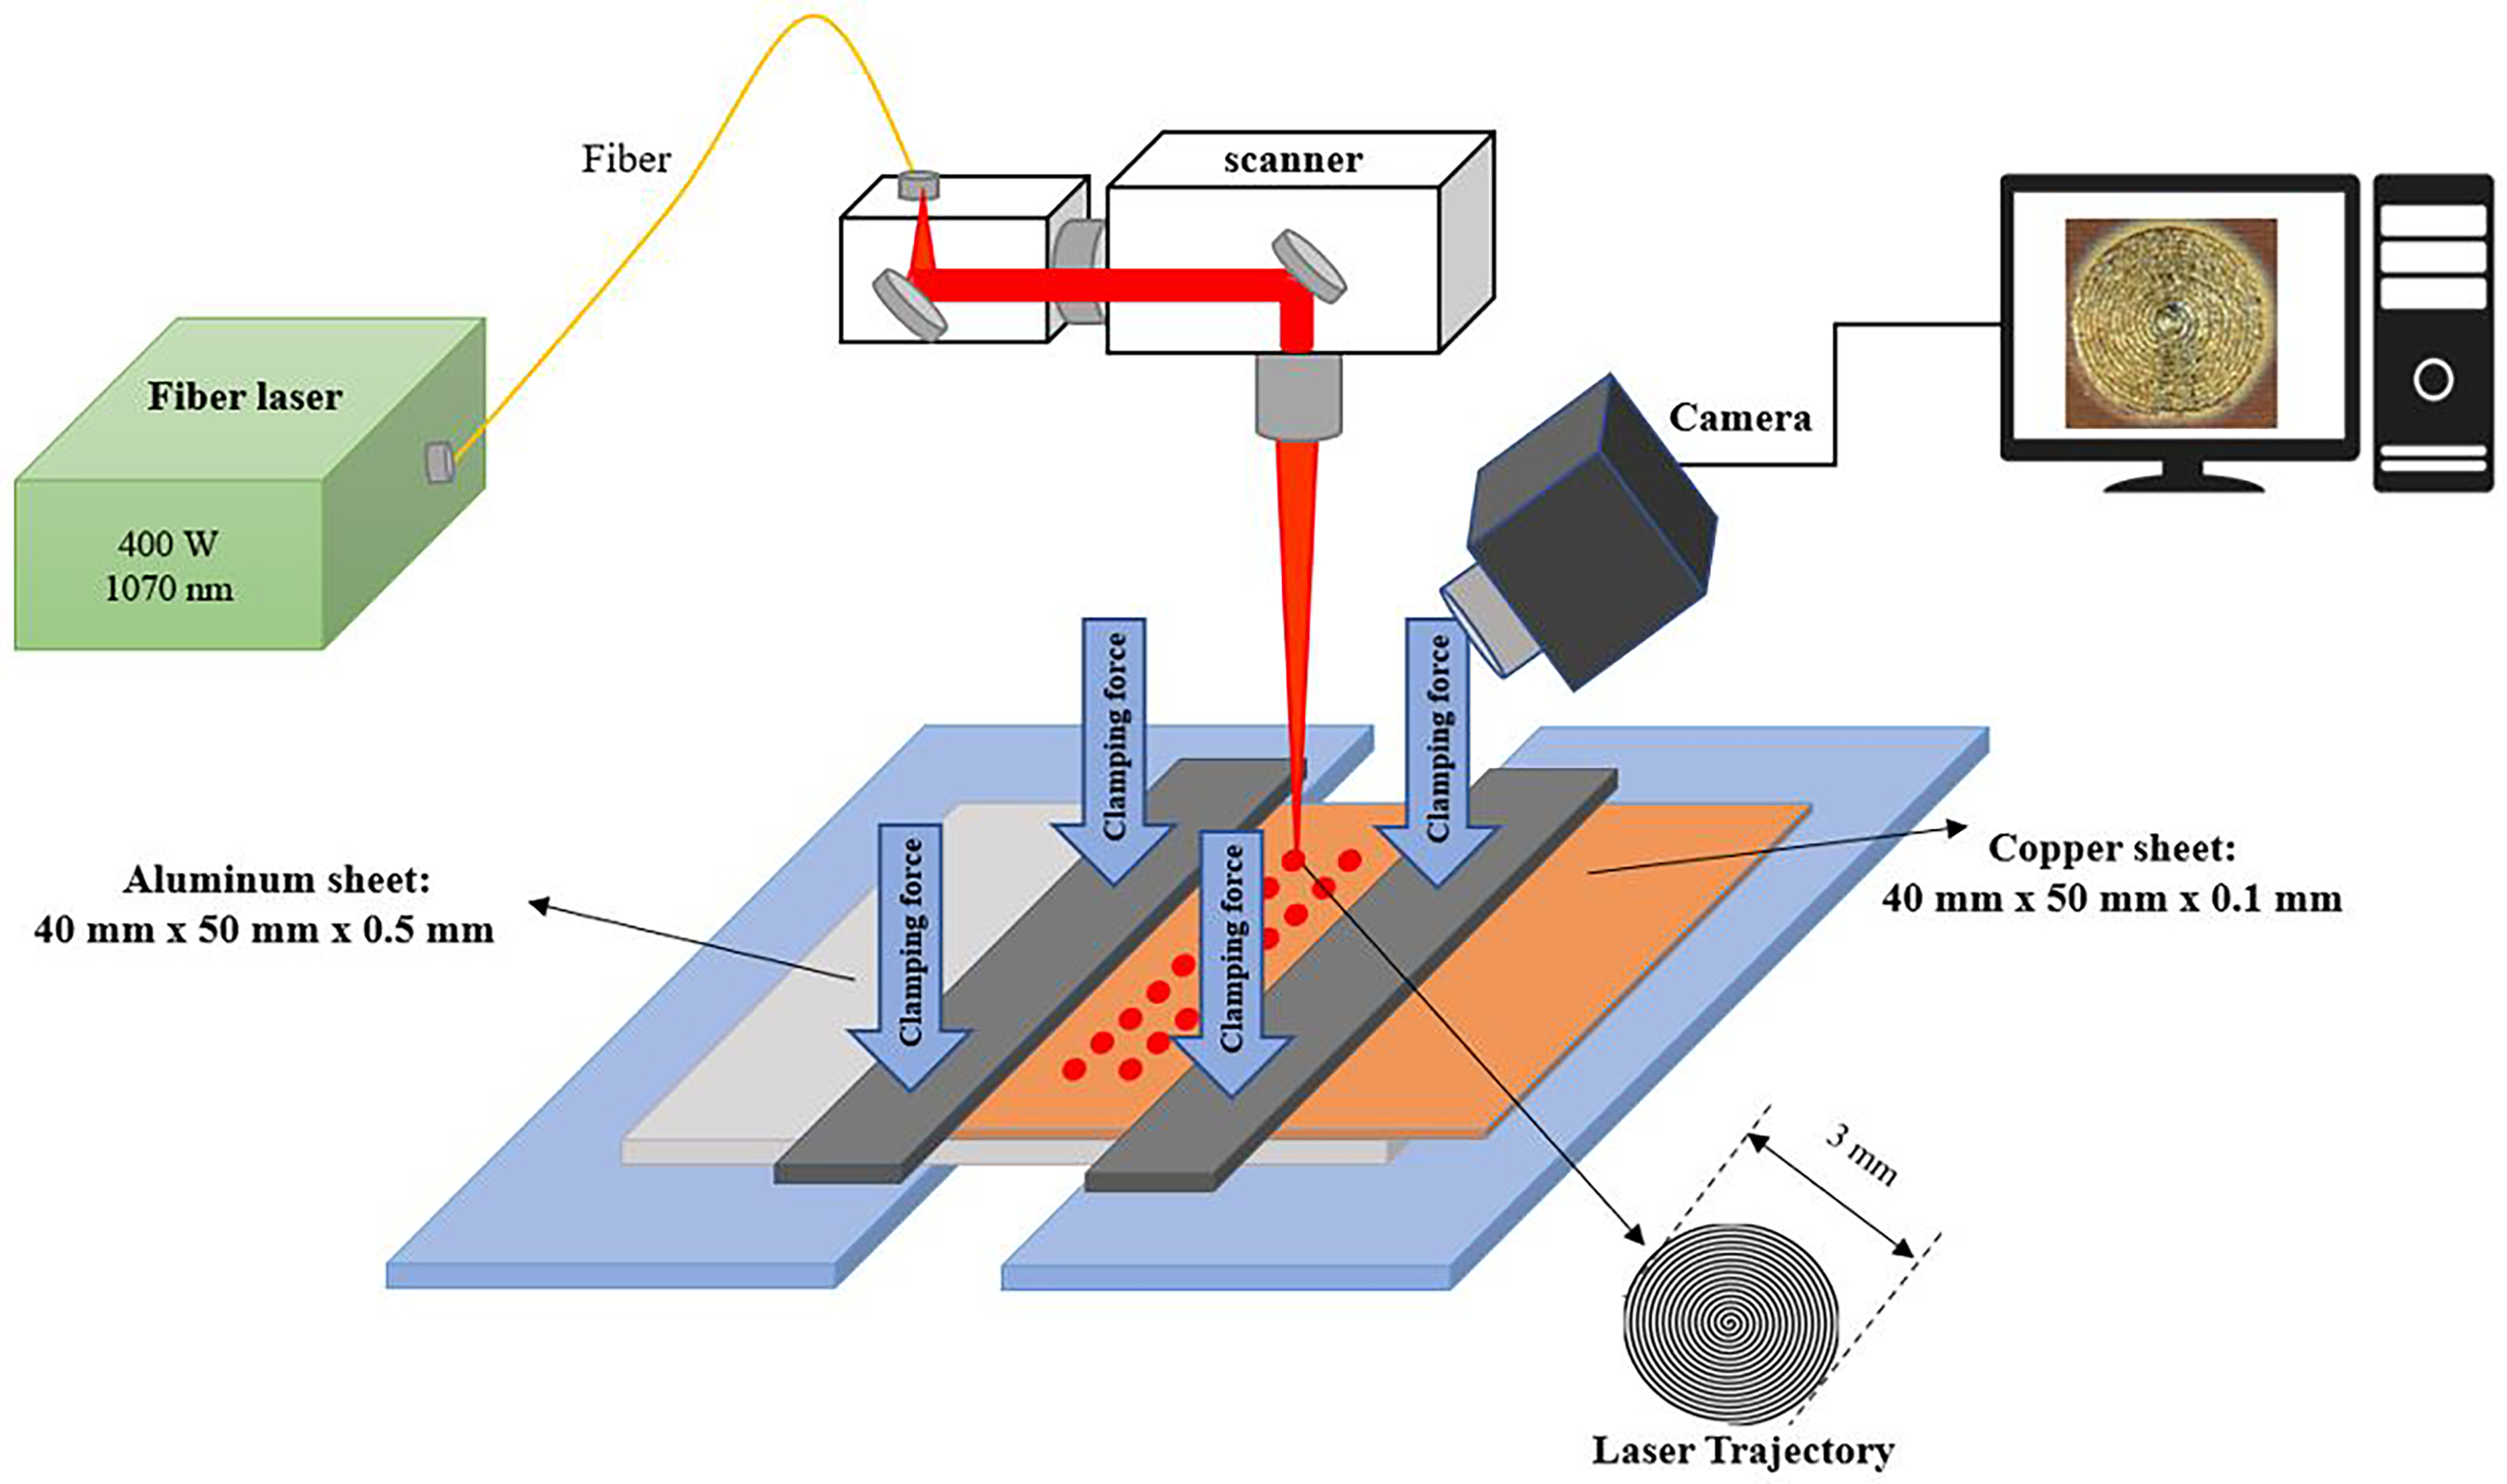
Laser configuration setup system and material dimensions.
Laser-based structuring on Cu surface: copper surface preparation
The present method increases surface roughness and investigates its influence on laser beam energy absorption. The laser beam is directed toward the copper surface to create grooves and increase surface roughness. Two distinct surface structures, R1 and R2, are compared against the as-received copper surface. The focal point of the laser beam is fixed on the surface of the copper sheet.
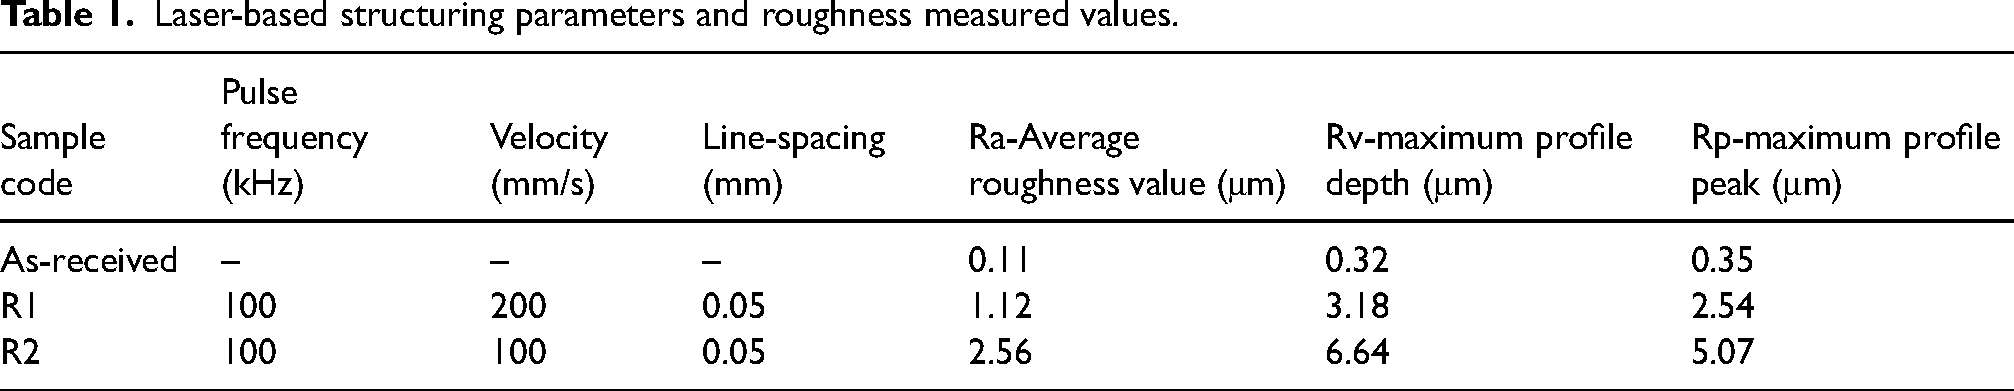
For roughness measurement, TESA-rugosurf 10-G device is used, and three average roughness (Ra), maximum profile depth (Rv), and maximum profile peak (Rp) values are measured. The process parameters and measured roughness values are outlined in Table 1. In addition, the top view and cross-section photos of R1, R2 structures, and as-received surfaces are depicted in Figure 2.
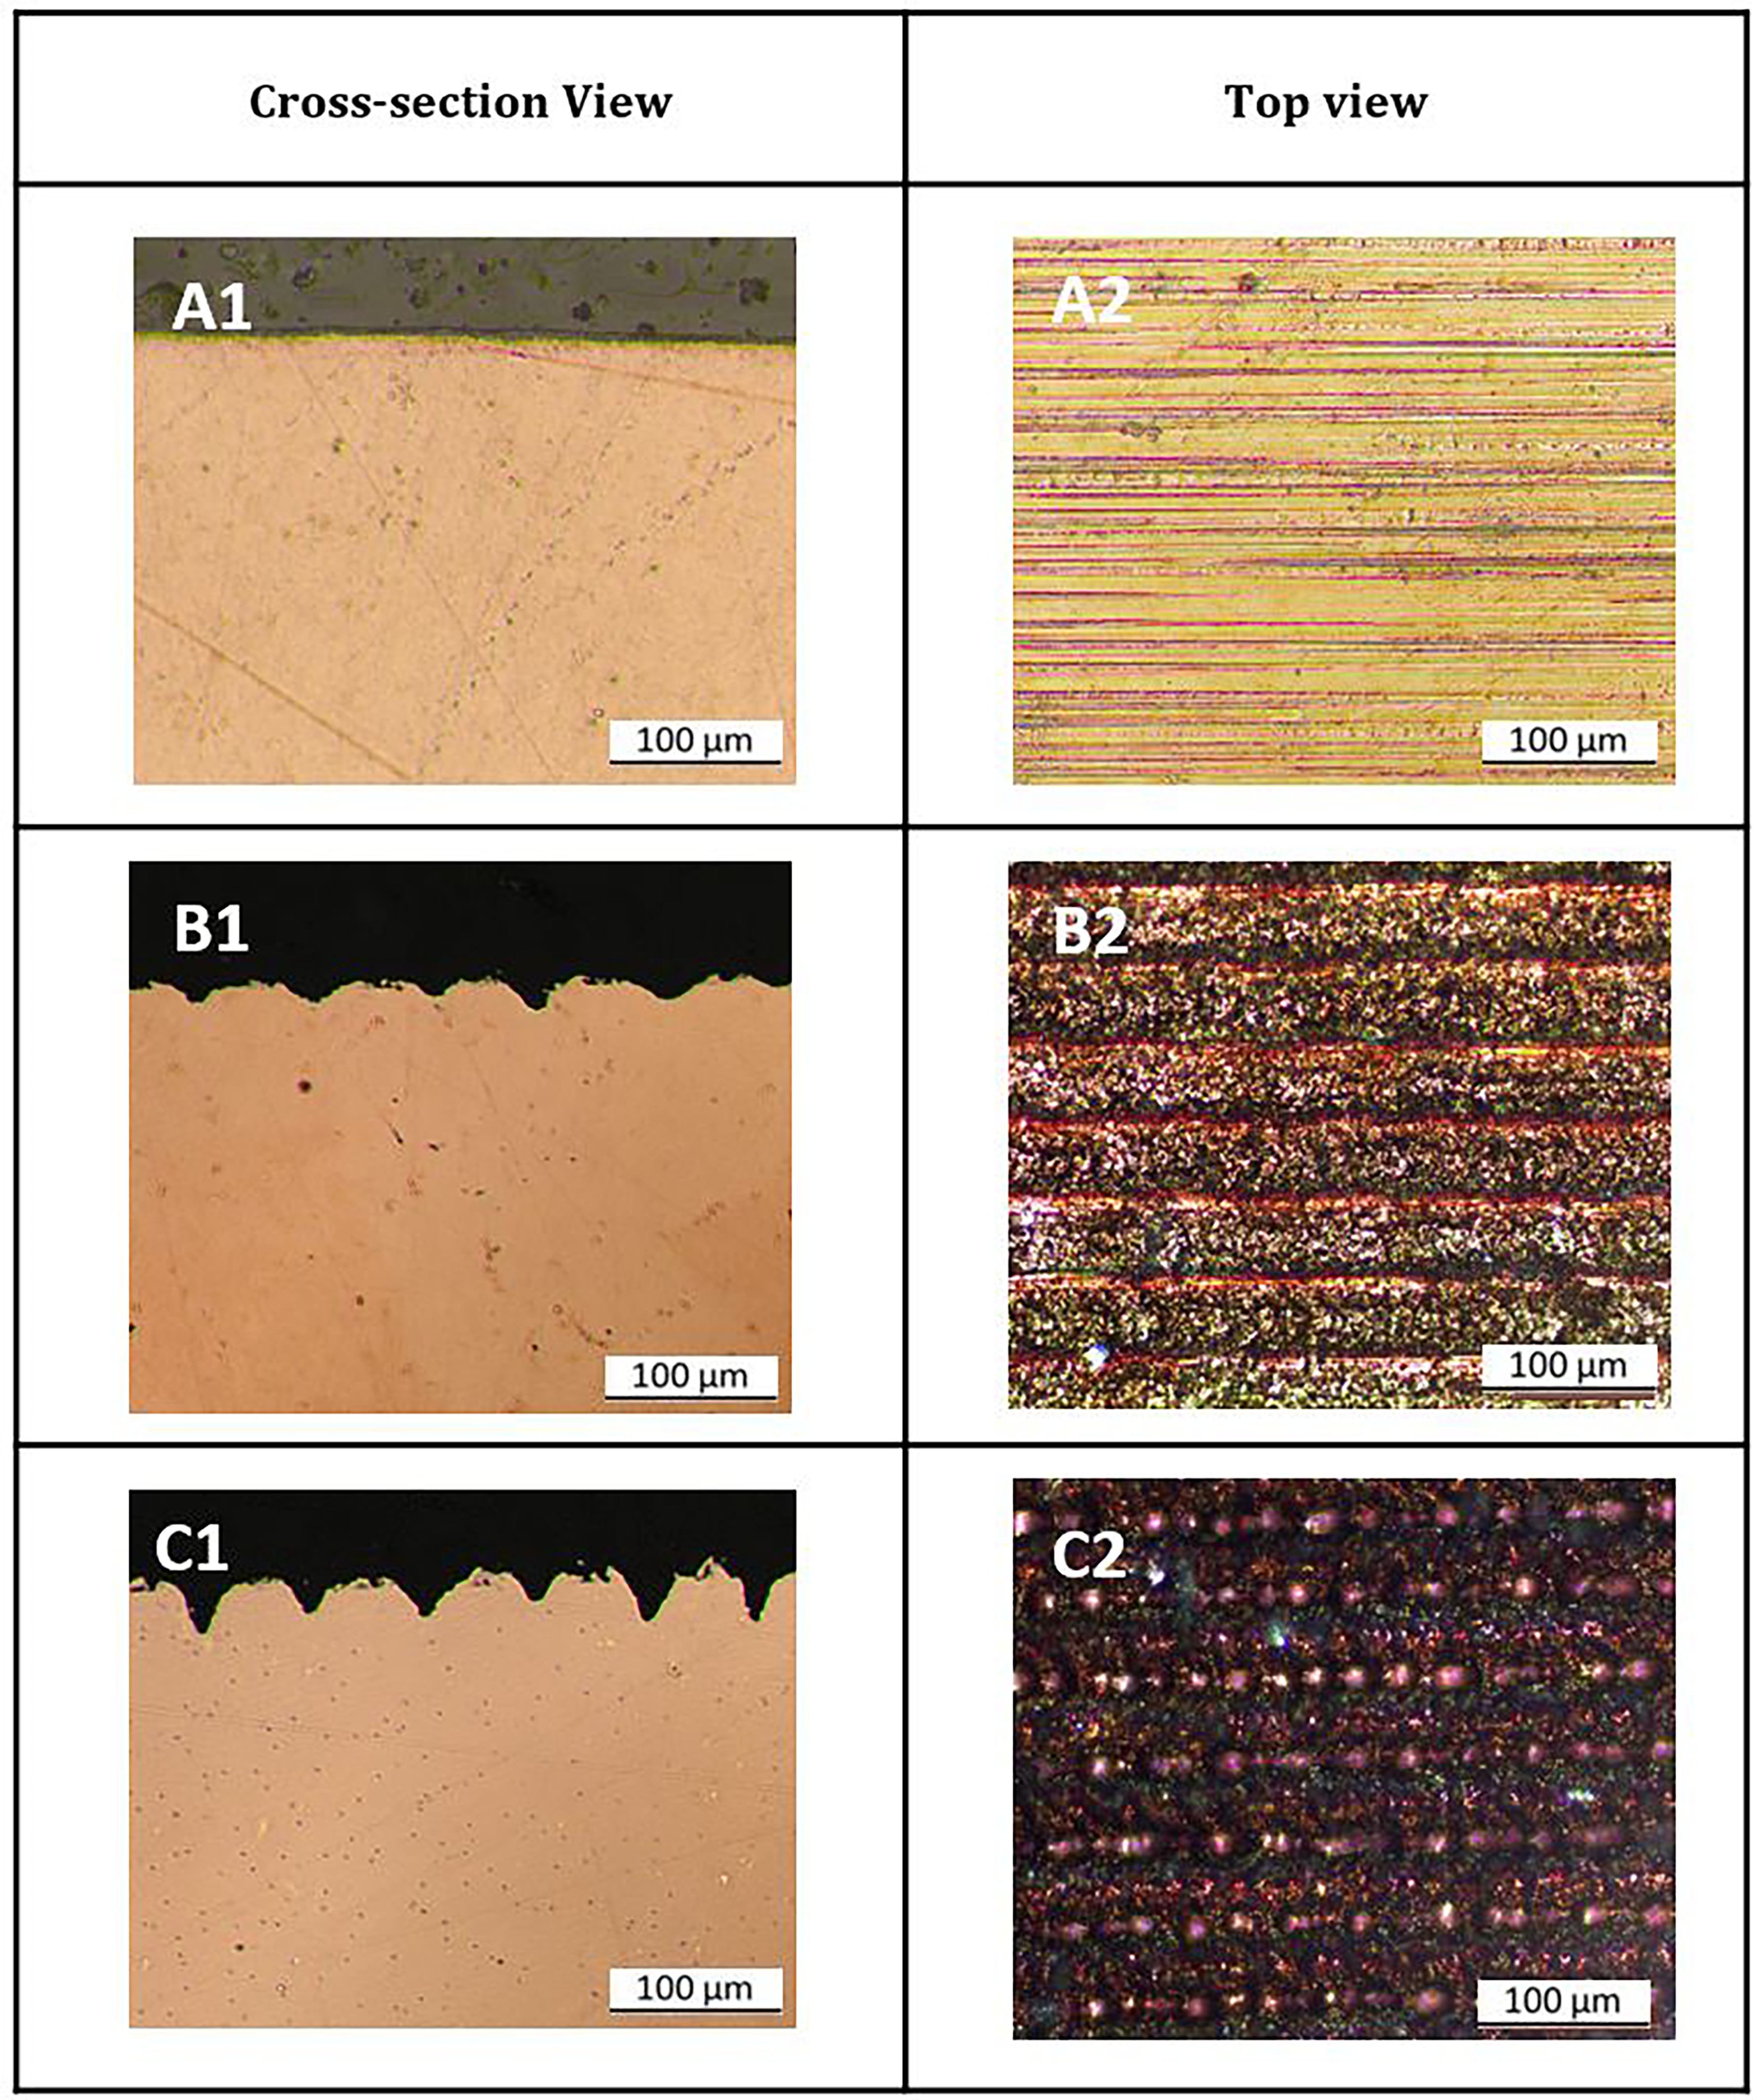
Copper cross-section and top view for as-received, photos A1 and A2 (Ra = 0.11 μm), R1 laser-based structure, photos B1, B2 (Ra = 1.12 μm), R2 laser-based structure photos C1, C2 (Ra = 2.56 μm).
Laser-based structuring parameters and roughness measured values.
Laser welding of Cu to Al
An overlap configuration has been selected to weld copper to aluminum. The laser is directed on the copper surface using a continuous laser beam with a power output of 400 W, which has a spot size of 32 μm. This is achieved by following a continuous spiral trajectory weld with a diameter of 3 mm. The spiral's line spacing is set at 0.1 mm. The parameters of the welding velocity and heat energy input for each weld category are shown in Table 2.
Cu–Al laser welding parameters.
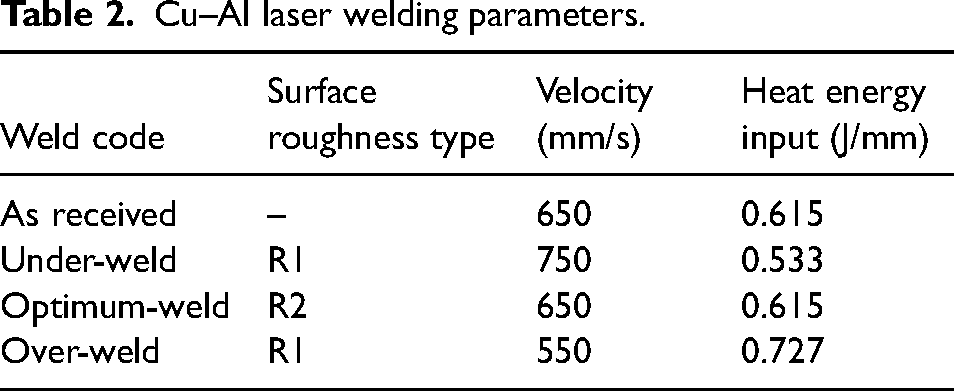
The experimental approach involved a small experimental window process to comprehensively investigate the impact of surface roughness and heat energy input. This process enables this study to employ three distinct surface roughness conditions (As-received, R1, and R2) in conjunction with three different welding velocities, as shown in Table 2. Welds are categorized into four groups: “as-received,” “under-weld,” “optimum-weld,” and “over-weld.” These categories and labels are assigned based on welding parameters like heat energy input, copper surface roughness value, and outcomes analysis. They will be discussed in subsequent sections. Figure 3 illustrates 6 out of 20 Cu–Al spiral trajectory welded zones with as-received copper surface (A) and a rough laser-based surface structure, R2, (B).
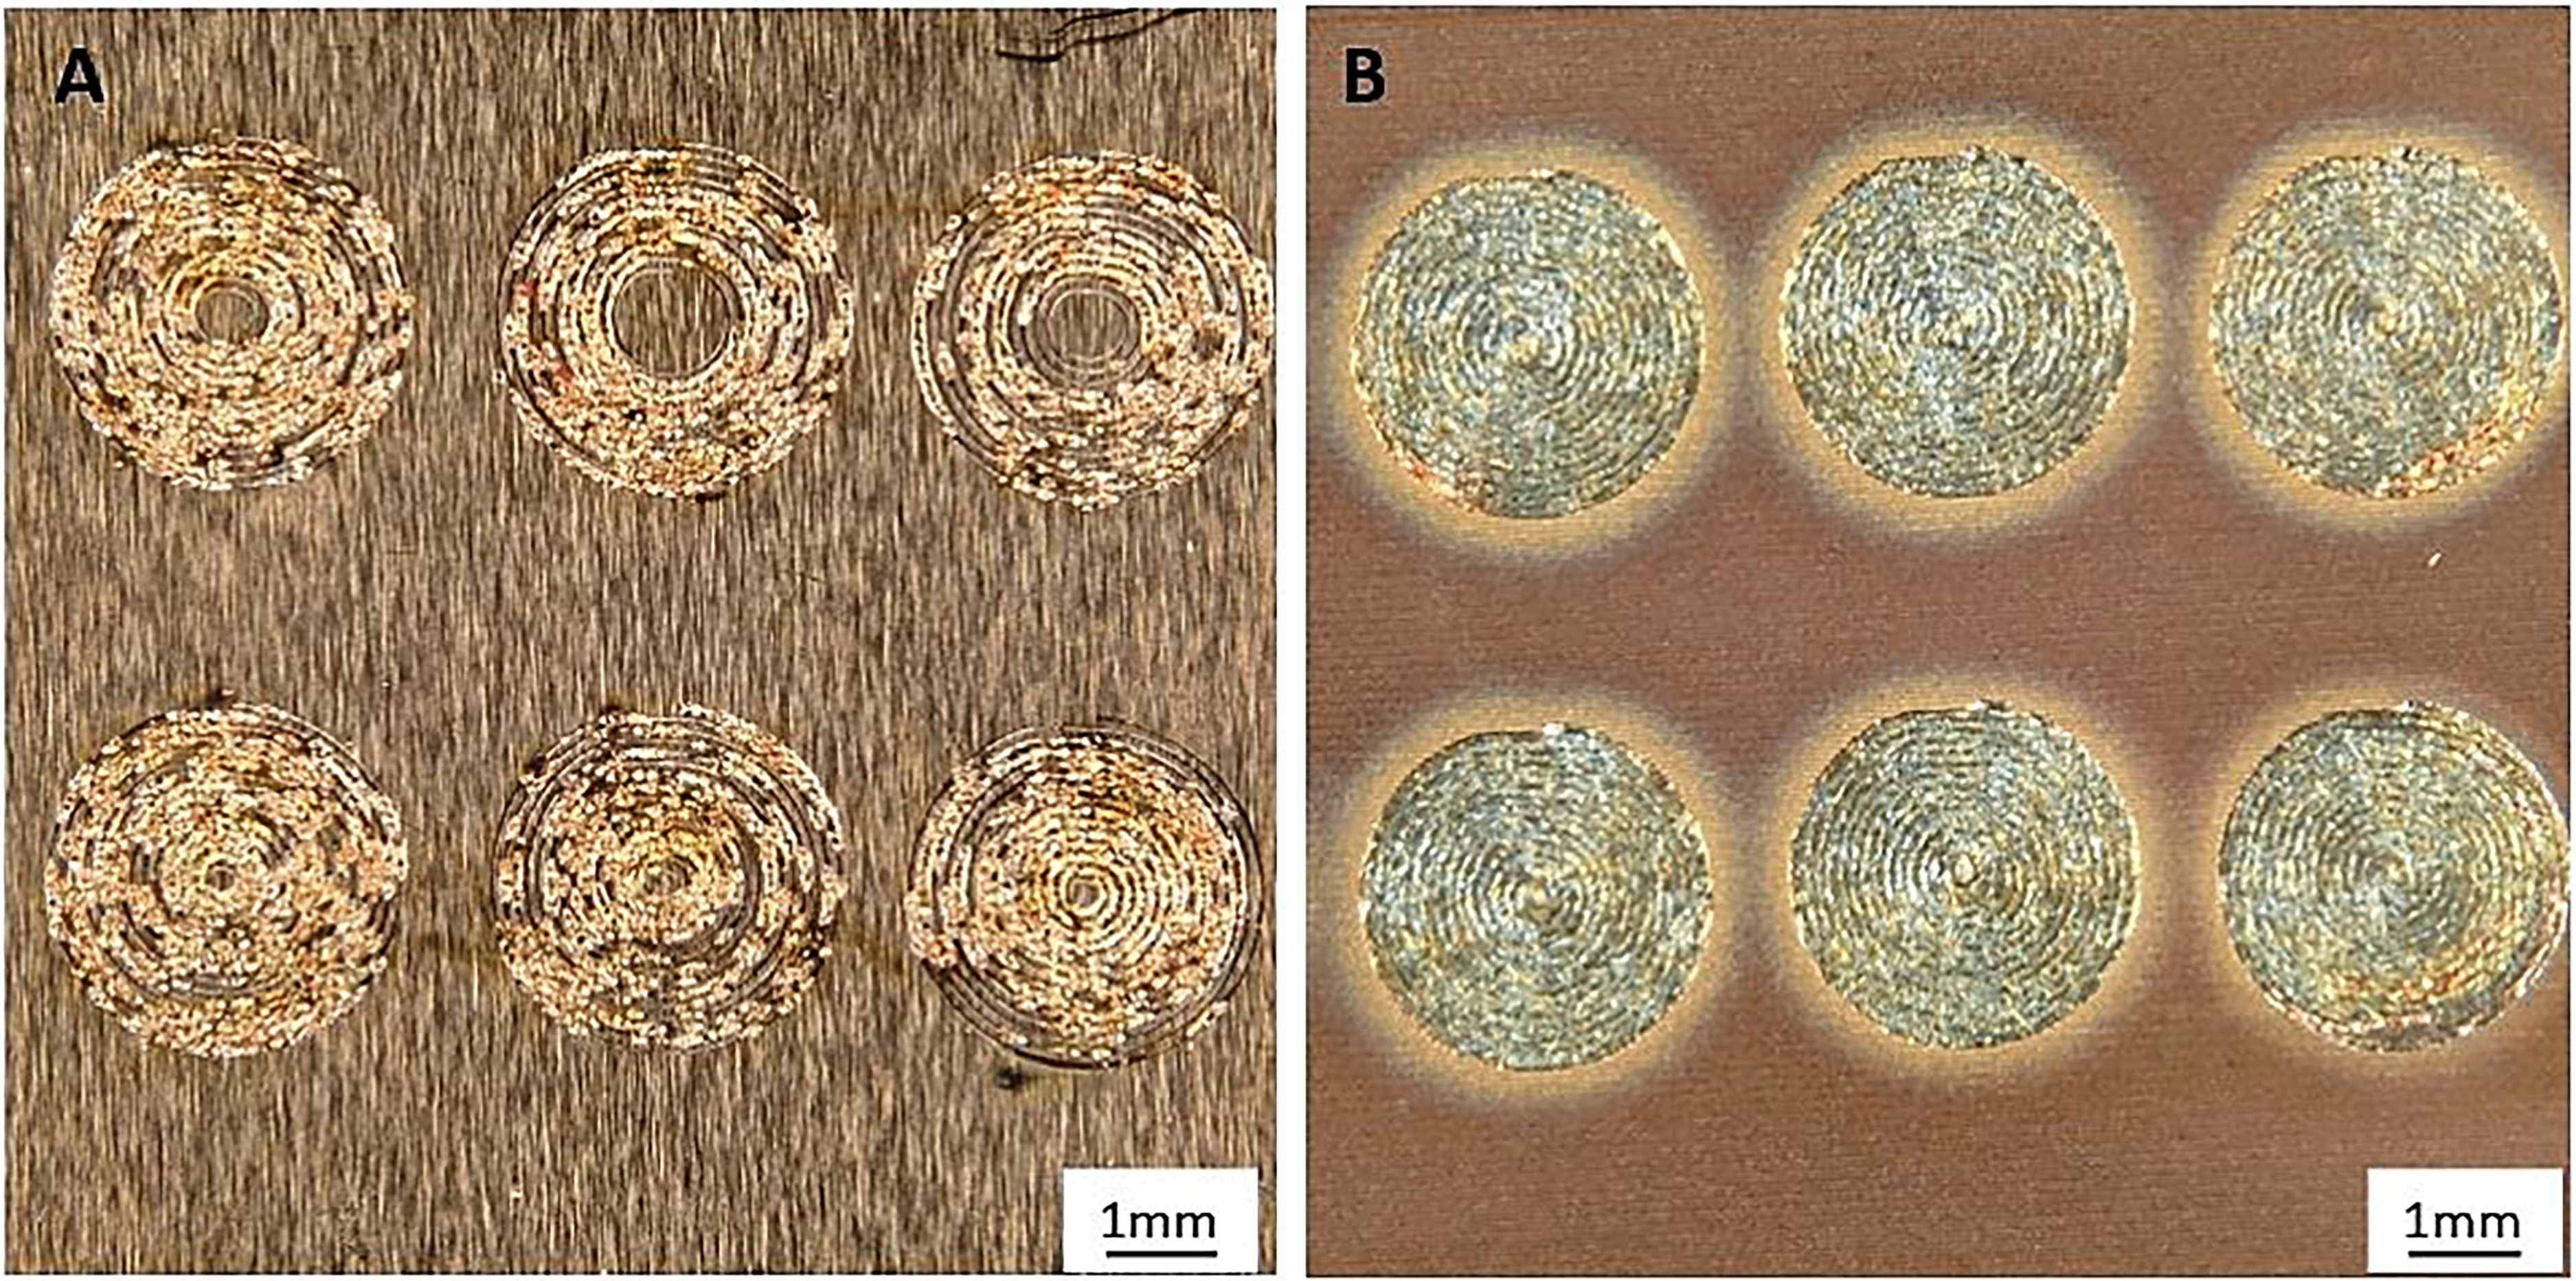
Cu–Al series welded samples, (A) as-received weld, copper with an as-received surface. (B) Optimum-weld, copper with Laser-based surface structure, R2.
Microscopic analyses and hardness measurement
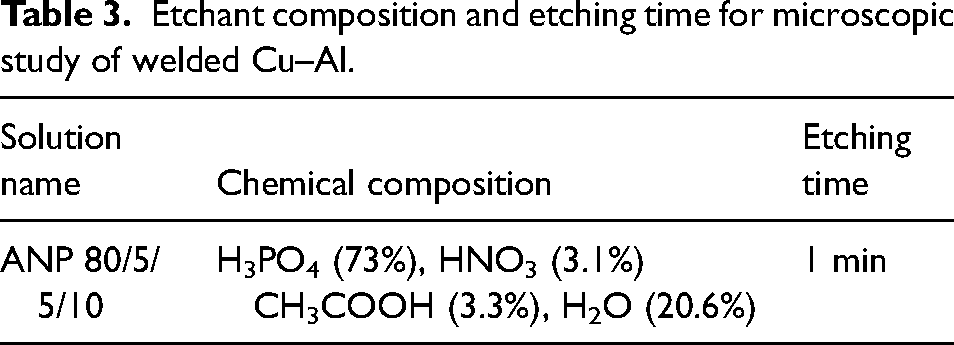
Samples from each welding category are cut for subsequent metallographic preparation to study IMCs within the welded zone. These samples are securely mounted using a thermoset resin for grinding and polishing procedures. Subsequently, they are analyzed using the Leica DM4000 M optical microscope, with multiple images captured after etching with the chemical solution ANP 80/5/5/10 (see Table 3).
Etchant composition and etching time for microscopic study of welded Cu–Al.
Scanning electron microscopy (SEM) and energy dispersive X-ray (EDX) analysis were performed in high vacuum mode at 20 kV accelerating voltage using an FEI Quanta 400 FEG equipped with an EDAX Genesis V6.04 X-ray spectrometer.
Hardness measurements are conducted using the Zwick/Roell machine, model DuraVision macro hardness tester, with an applied test load of 0.3 kg to facilitate a comparative hardness assessment across each weld category. The procedure involves the application of a diamond pyramid indenter against the cross-sectioned specimen within the welded Cu–Al zone. The entire diameter of the weld zone within the cross-section is subjected to a series of hardness measurements along a linear path to analyze and compare the obtained results. Figure 4 depicts the Optimum-weld crossed section, where the diamond pyramid pressed the weld zone in multiple zones. Twenty points are selected for the hardness measurements, and they are conducted on each weld type to assess the influence of phases and IMCs on the hardness value.
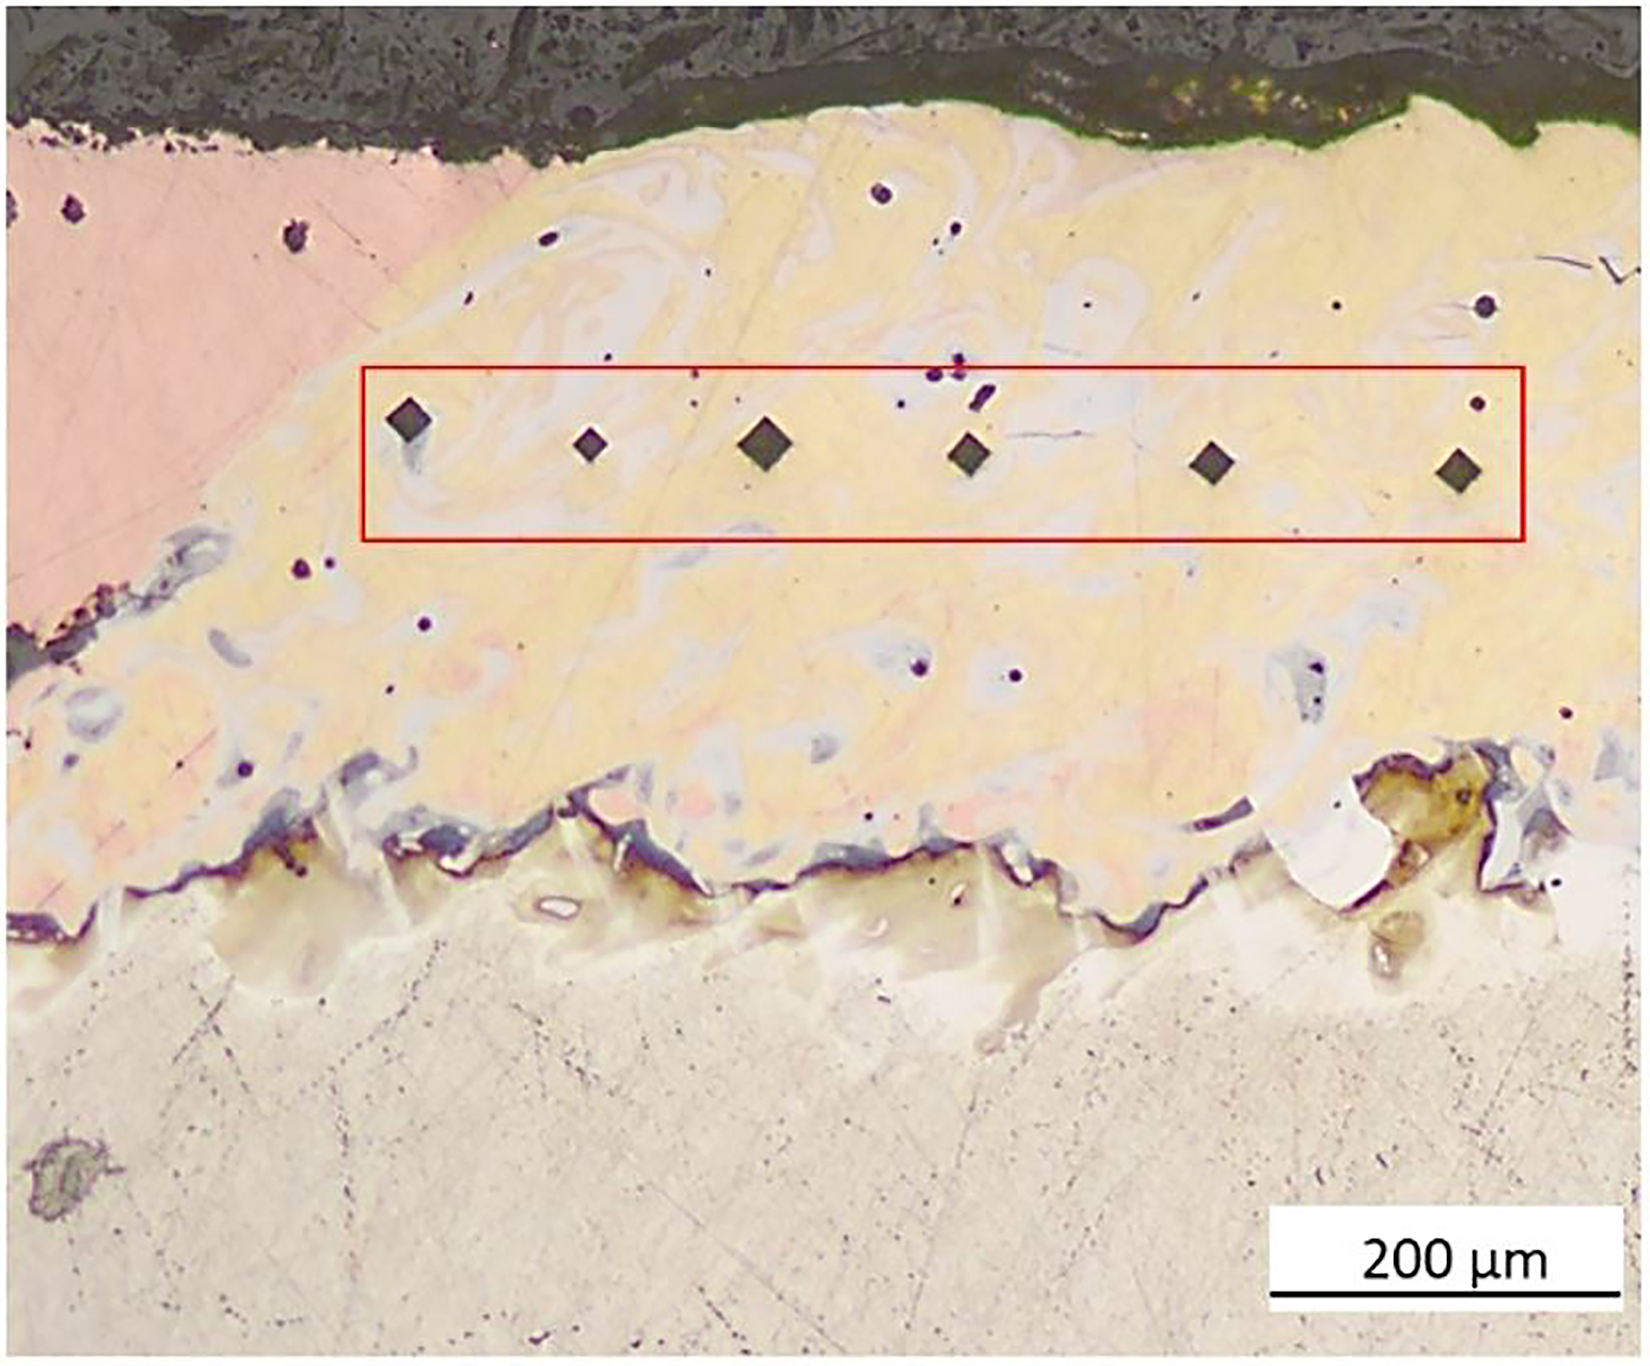
Hardness measurement method in Cu–Al weld zone.
Results and discussion
Weld categories
Laser welding of Cu–Al is using the parameters outlined in Table 2. The visual representation of these welds is provided in Figure 5, which is used by capturing images from both the top and the cross-section views. Upon examination of the as-received weld, it becomes apparent that it does not constitute a complete weld and exhibits keyhole instability. Images of the As-received weld zone reveal that specific segments have undergone melting and possess the potential to establish a keyhole, while other parts of the trajectory merely display scratching, and most of the copper in the weld zone is not melted. This can be attributed to the high reflectivity of the copper surface, which prevents the absorption of sufficient energy required for melting copper and subsequent keyhole establishment.
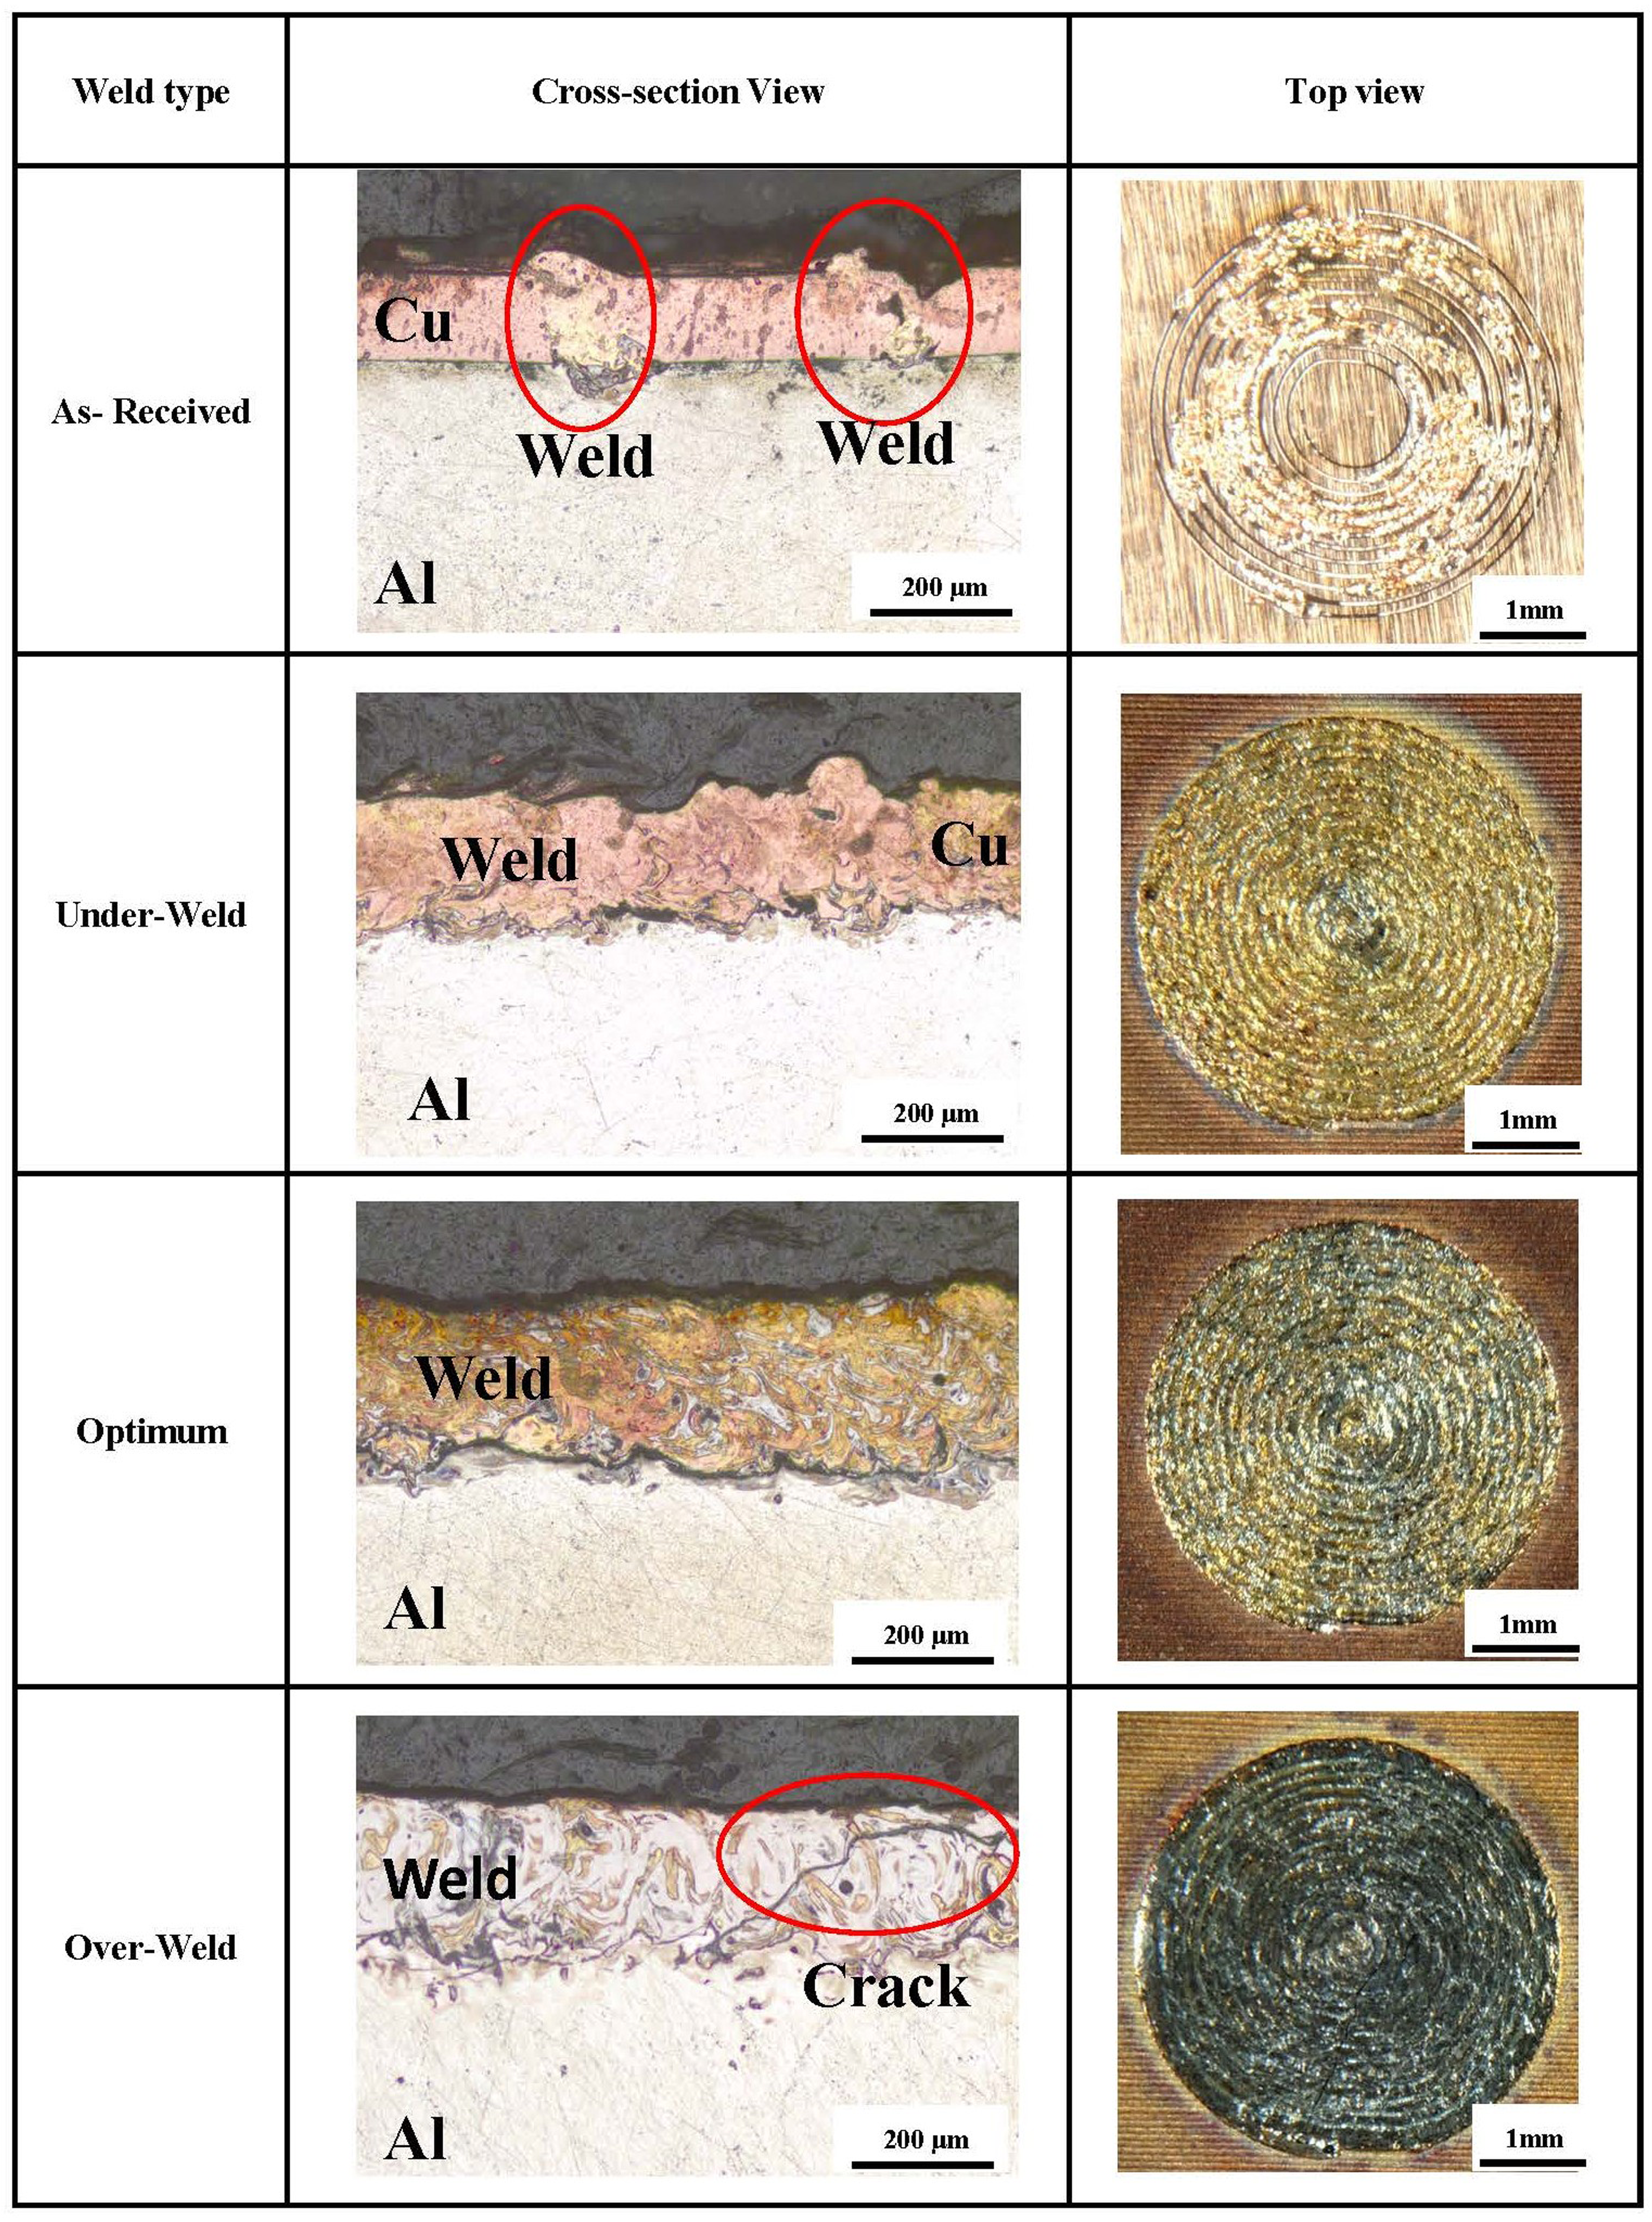
Cross section and top view of four weld types.
A laser-based surface structuring technique is employed on the copper surface, using parameters in Table 1. This process aimed to create a surface with increased roughness (R1), with an average surface roughness of 1.12 μm. In the second category, the “under-weld,” a reduced energy heat input of 0.533 J/mm is employed, in contrast to the “as-received” weld type, which used 0.615 J/mm. This welding type exhibited a more stable keyhole formation, complete melting, and subsequent solidification of the copper material. This welding method demonstrated an enhanced capacity for energy absorption. This can be attributed to pre-processing-induced grooves and higher surface roughness, which traps the laser beam and increases energy absorption.
The third welding type, the Optimum-weld, uses the same heat energy input of the As-received weld, 0.615 J/mm; however, the copper surface is R2 with an average roughness (Ra) of 2.56 μm. The Optimum-weld's cross-section image reveals an aluminum and copper mixture within the weld zone. The top view image also illustrates a comparatively darker weld zone when contrasted with the “under-weld” category. This weld type substantiates the impact of a surface characterized by a heightened roughness value. The cross-section shows no cracks and defects in the weld zone.
In contrast to the other categories, the “over-weld” classification exhibits a cross-sectional weld profile featuring a whiter color weld zone in the cross-section image. This distinctive coloring indicates the presence of aluminum and IMCs within the weld zone. An extreme welding process with defects such as voids and cracks characterizes the “over-weld” category. This specific welding contains an R1 surface structure and a heightened heat energy input of 0.727 J/mm. This welding type significantly illustrates the potential consequences when surface roughness and excessive heat energy input are employed simultaneously. Such conditions can result in the formation of deep keyholes and defects within the weld. However, to detect the phases and IMCs in each welding and compare the categories, one must analyze deeper and consider the hardness measurement test according to Microscopic analyses and hardness measurement section and Figure 4.
Hardness measurement and metallography
The hardness measurements of pure copper have an average hardness value of 24.65 HV, whereas for aluminum, this value is 42.35 HV. Figure 6 illustrates the average hardness values of three distinct welding categories, Under-weld, Over-weld, and Optimum-weld, on the cross-section welding zone. This measurement involves the test of 20 points along the central region of the weld zone, as depicted in Figure 4. Among the three weld types, Over-weld exhibits the highest average hardness at 617.05 HV, whereas Under-weld displays the lowest hardness value at 85.41 HV. Optimum-weld falls in between with a hardness value of 181.36 HV. This observation establishes Over-weld as the hardest weld type among the welding categories. However, the considerable hardness range (416–803 HV) within the Over-weld category suggests the presence of multiple phases and IMCs with varying hardness values. Conversely, such variability is not observed in the Under-weld category, where the hardness range is confined to 58.70–103 HV.
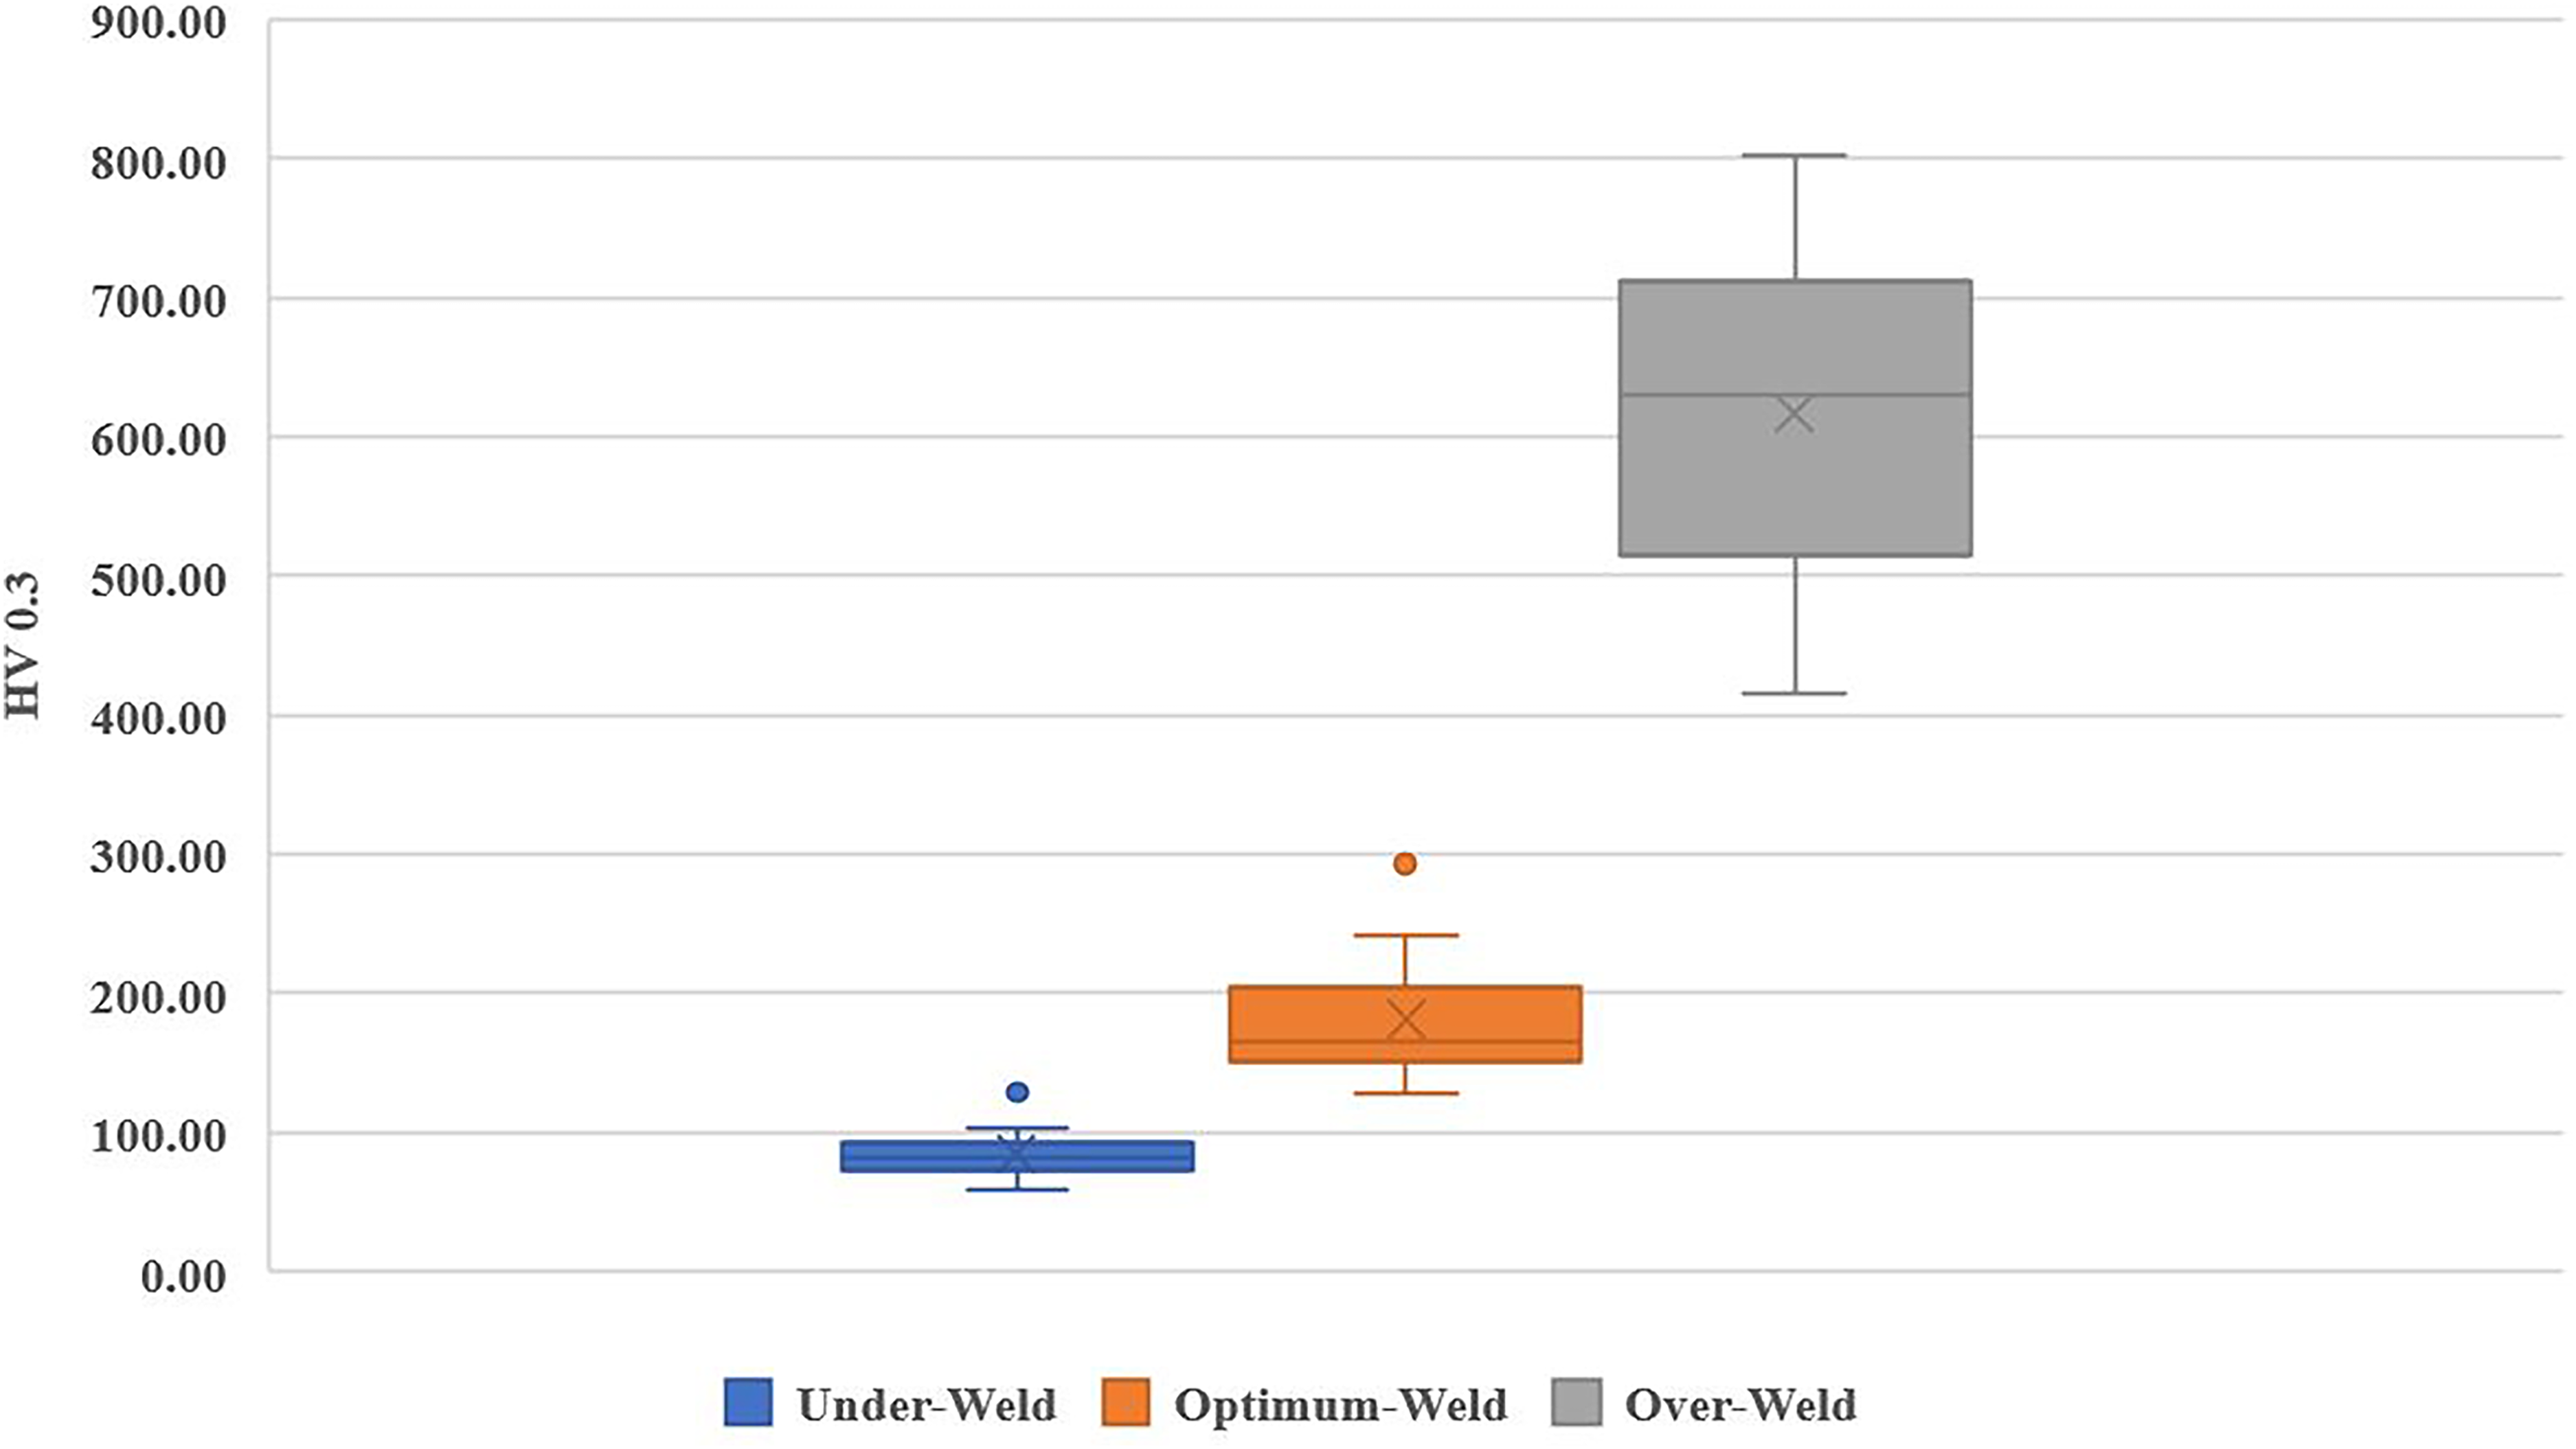
Measured hardness values of under-weld, optimum-weld, and over-weld categories.
An examination of phase formation within the weld zone reveals a correlation between hardness, intermetallic phase formation, and the occurrence of weld defects. Figure 7 depicts the Optimum-weld cross-section, where cracks are not observed. The image, captured with a 200 μm scale, exhibits the weld zone characterized by predominantly yellowish and orangish colors, with small white regions at the center. Dark areas are also primarily situated in the lower section of the weld zone and along the aluminum border. Among the phases under Cu–Al welding, the Cu-rich phase (81.5–100% Cu) and the Al-rich phases (ranging from 0 to 30% Cu) are advantageous, as they exhibit ductile properties. Conversely, compositions falling within 50–81.5% Cu are associated with detrimental characteristics.
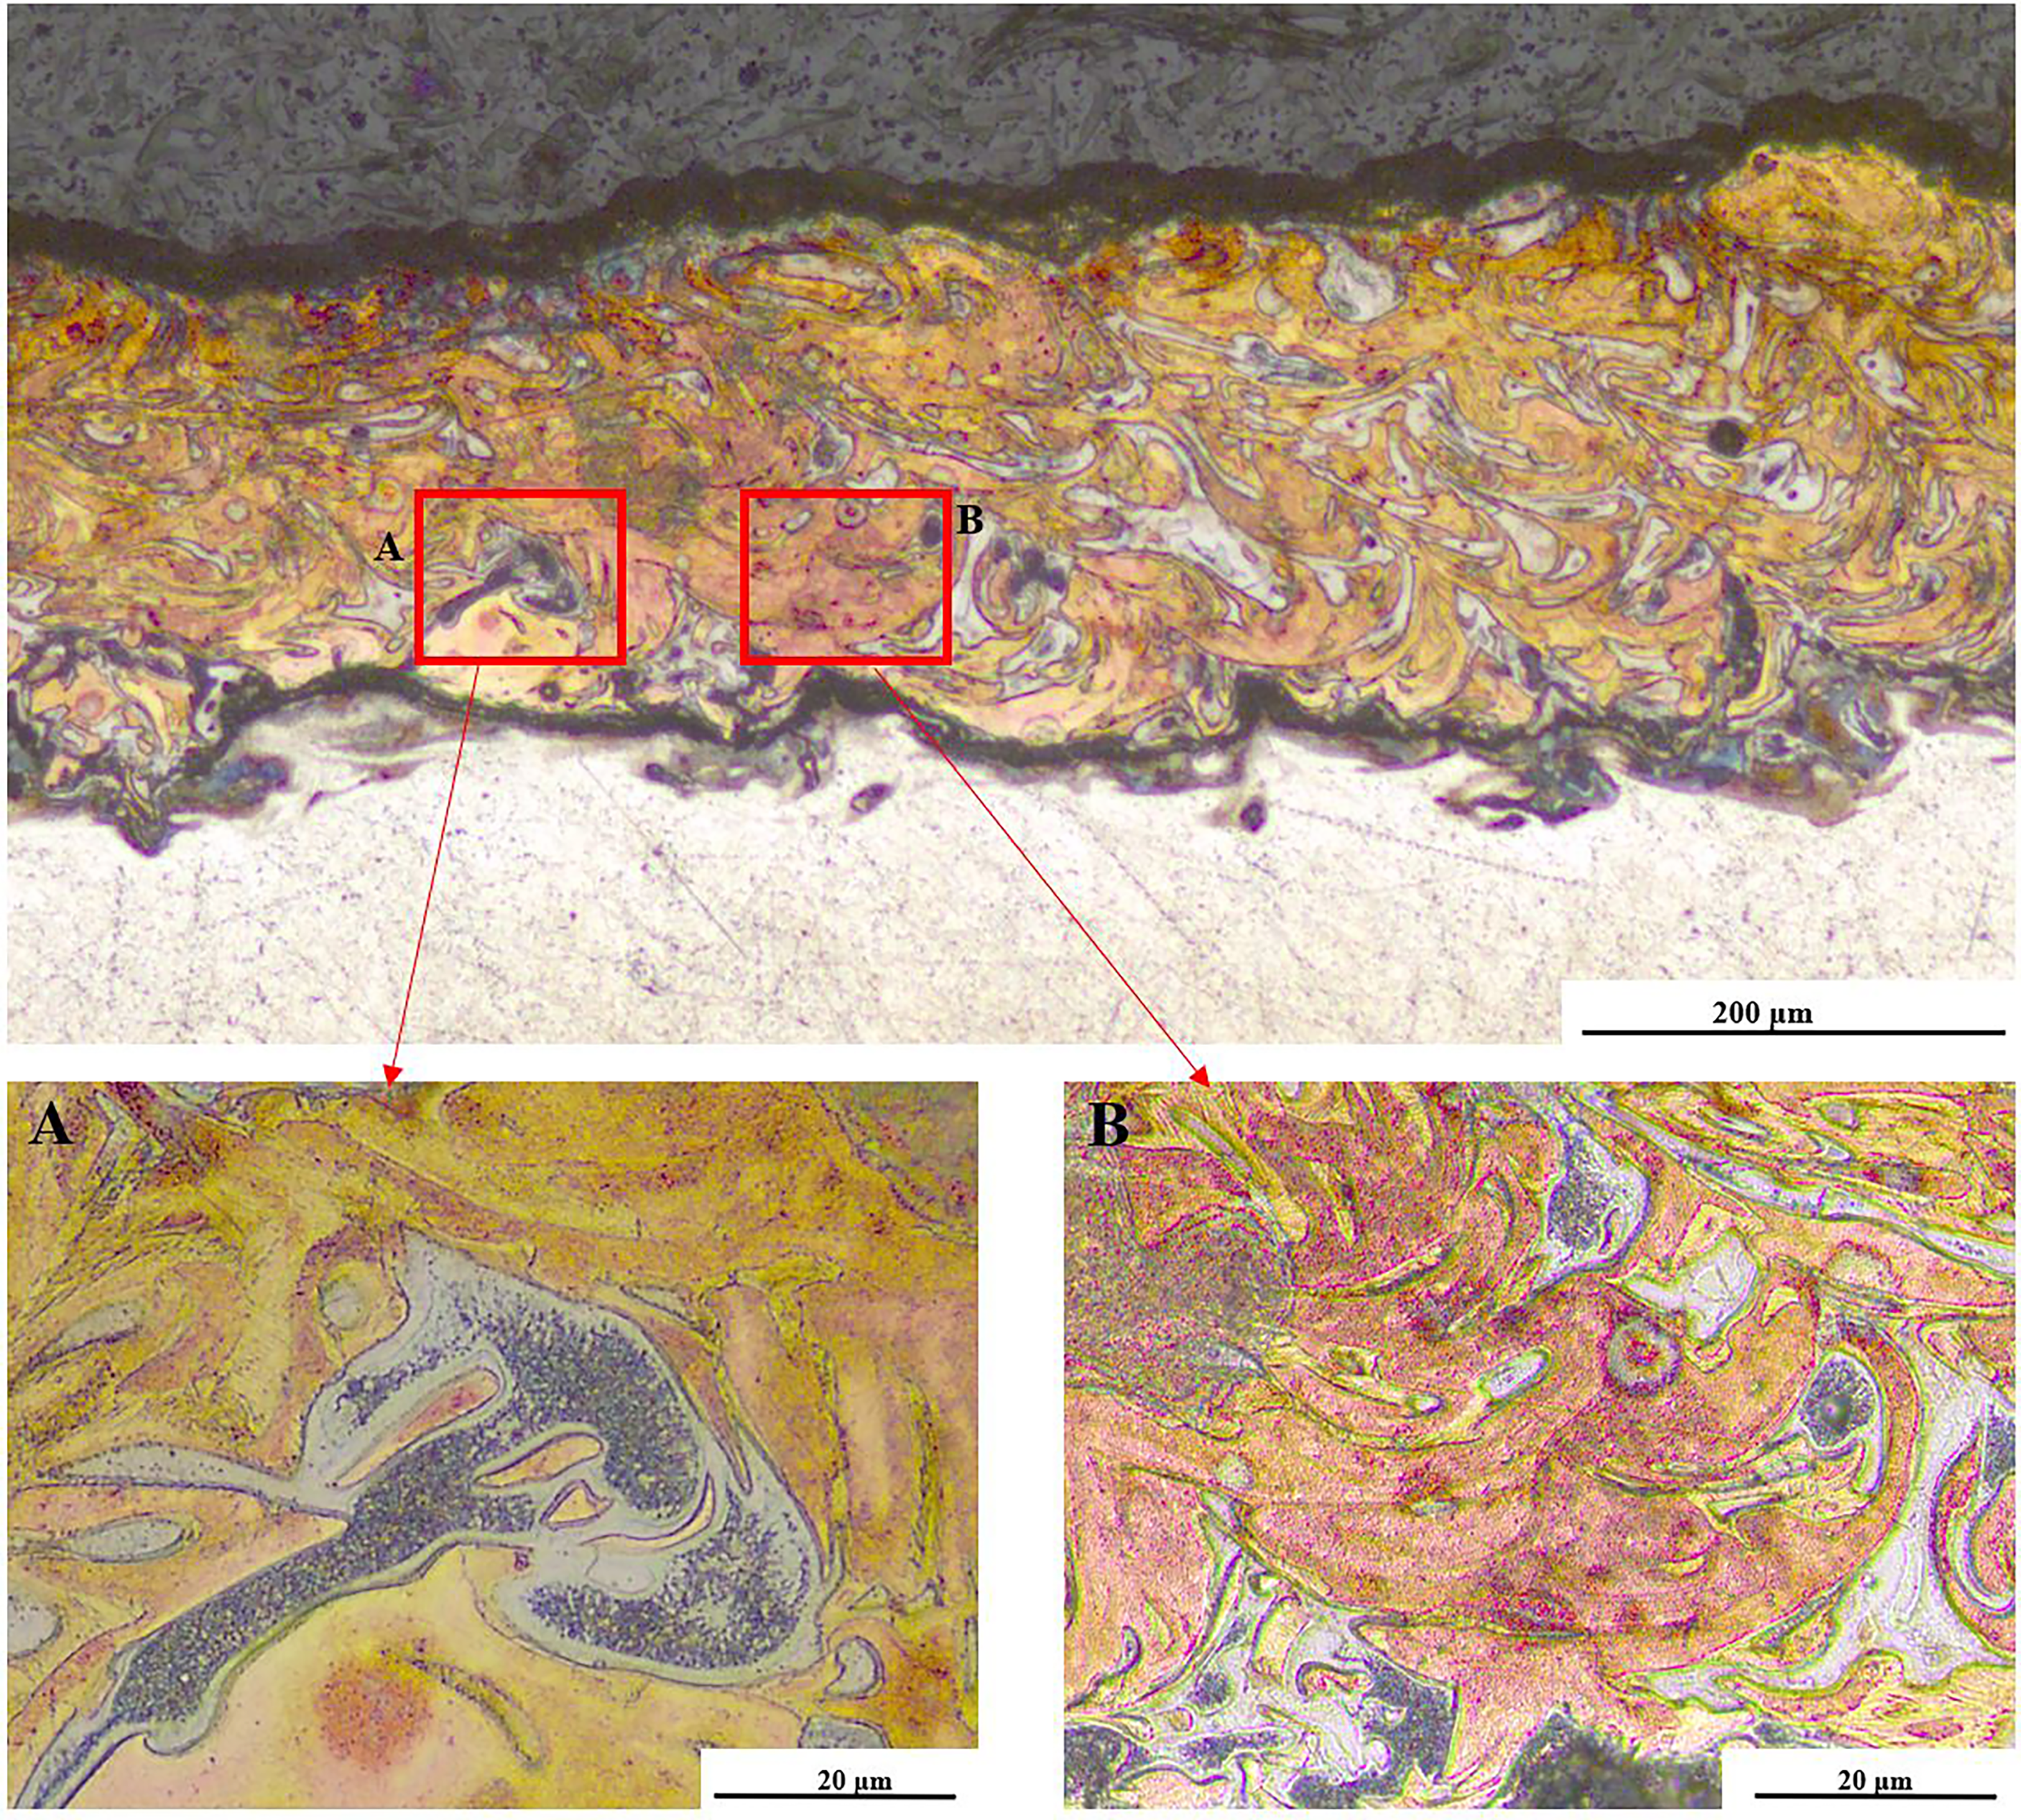
The cross-section of etched optimum-weld.
As displayed in Figure 7(A), more details regarding the phases are provided. The aluminum parts have melted and dissolved within the weld zone, creating new intermetallic phases by mixing with copper. The dark dendritic structures with a few microns grain size and rounded morphology are positioned centrally within Figure 7(A). They are identified as η phase-AlCu, which are rounded and fine-distributed and are only a few microns long. 21 Measurements indicate that these phases exhibit more hardness than copper, aluminum, and Al–bronze. A needle-shaped microstructure, which is a copper-rich zone, covered the white zone with the intermetallic phases.
Figure 7(B) shows a zone characterized by a higher copper content, manifested through its distinctive reddish color. The lower section of this image exhibits the presence of IMC; however, their proportion relative to copper and Al–bronze is comparatively lower. This zone is further characterized by its low hardness values compared to the intermetallic phases. The Optimum-weld cross-section reveals a zone with low IMC content and an increased percentage of copper and Al–bronze. This welding category results in a more stable and homogeneous composition with diminished brittleness, freeing it from defects. While some brittle phases are still detectable, the reasonably average hardness value of 181.36 HV guarantees a high-quality weld.
In contrast to the categories of Under-weld and Optimum-weld, the “over-weld” cross-section, as depicted in Figure 8, reveals mixed Cu–Al in the weld zone. Most of the weld zone exhibits white, with certain sections featuring dark dendritic phases. Weld defects, including voids stemming from the high-energy input and material evaporation, are evident. Furthermore, cracks are observed in the middle and right sides of the weld zone, primarily attributed to the heightened brittleness of the microstructure.
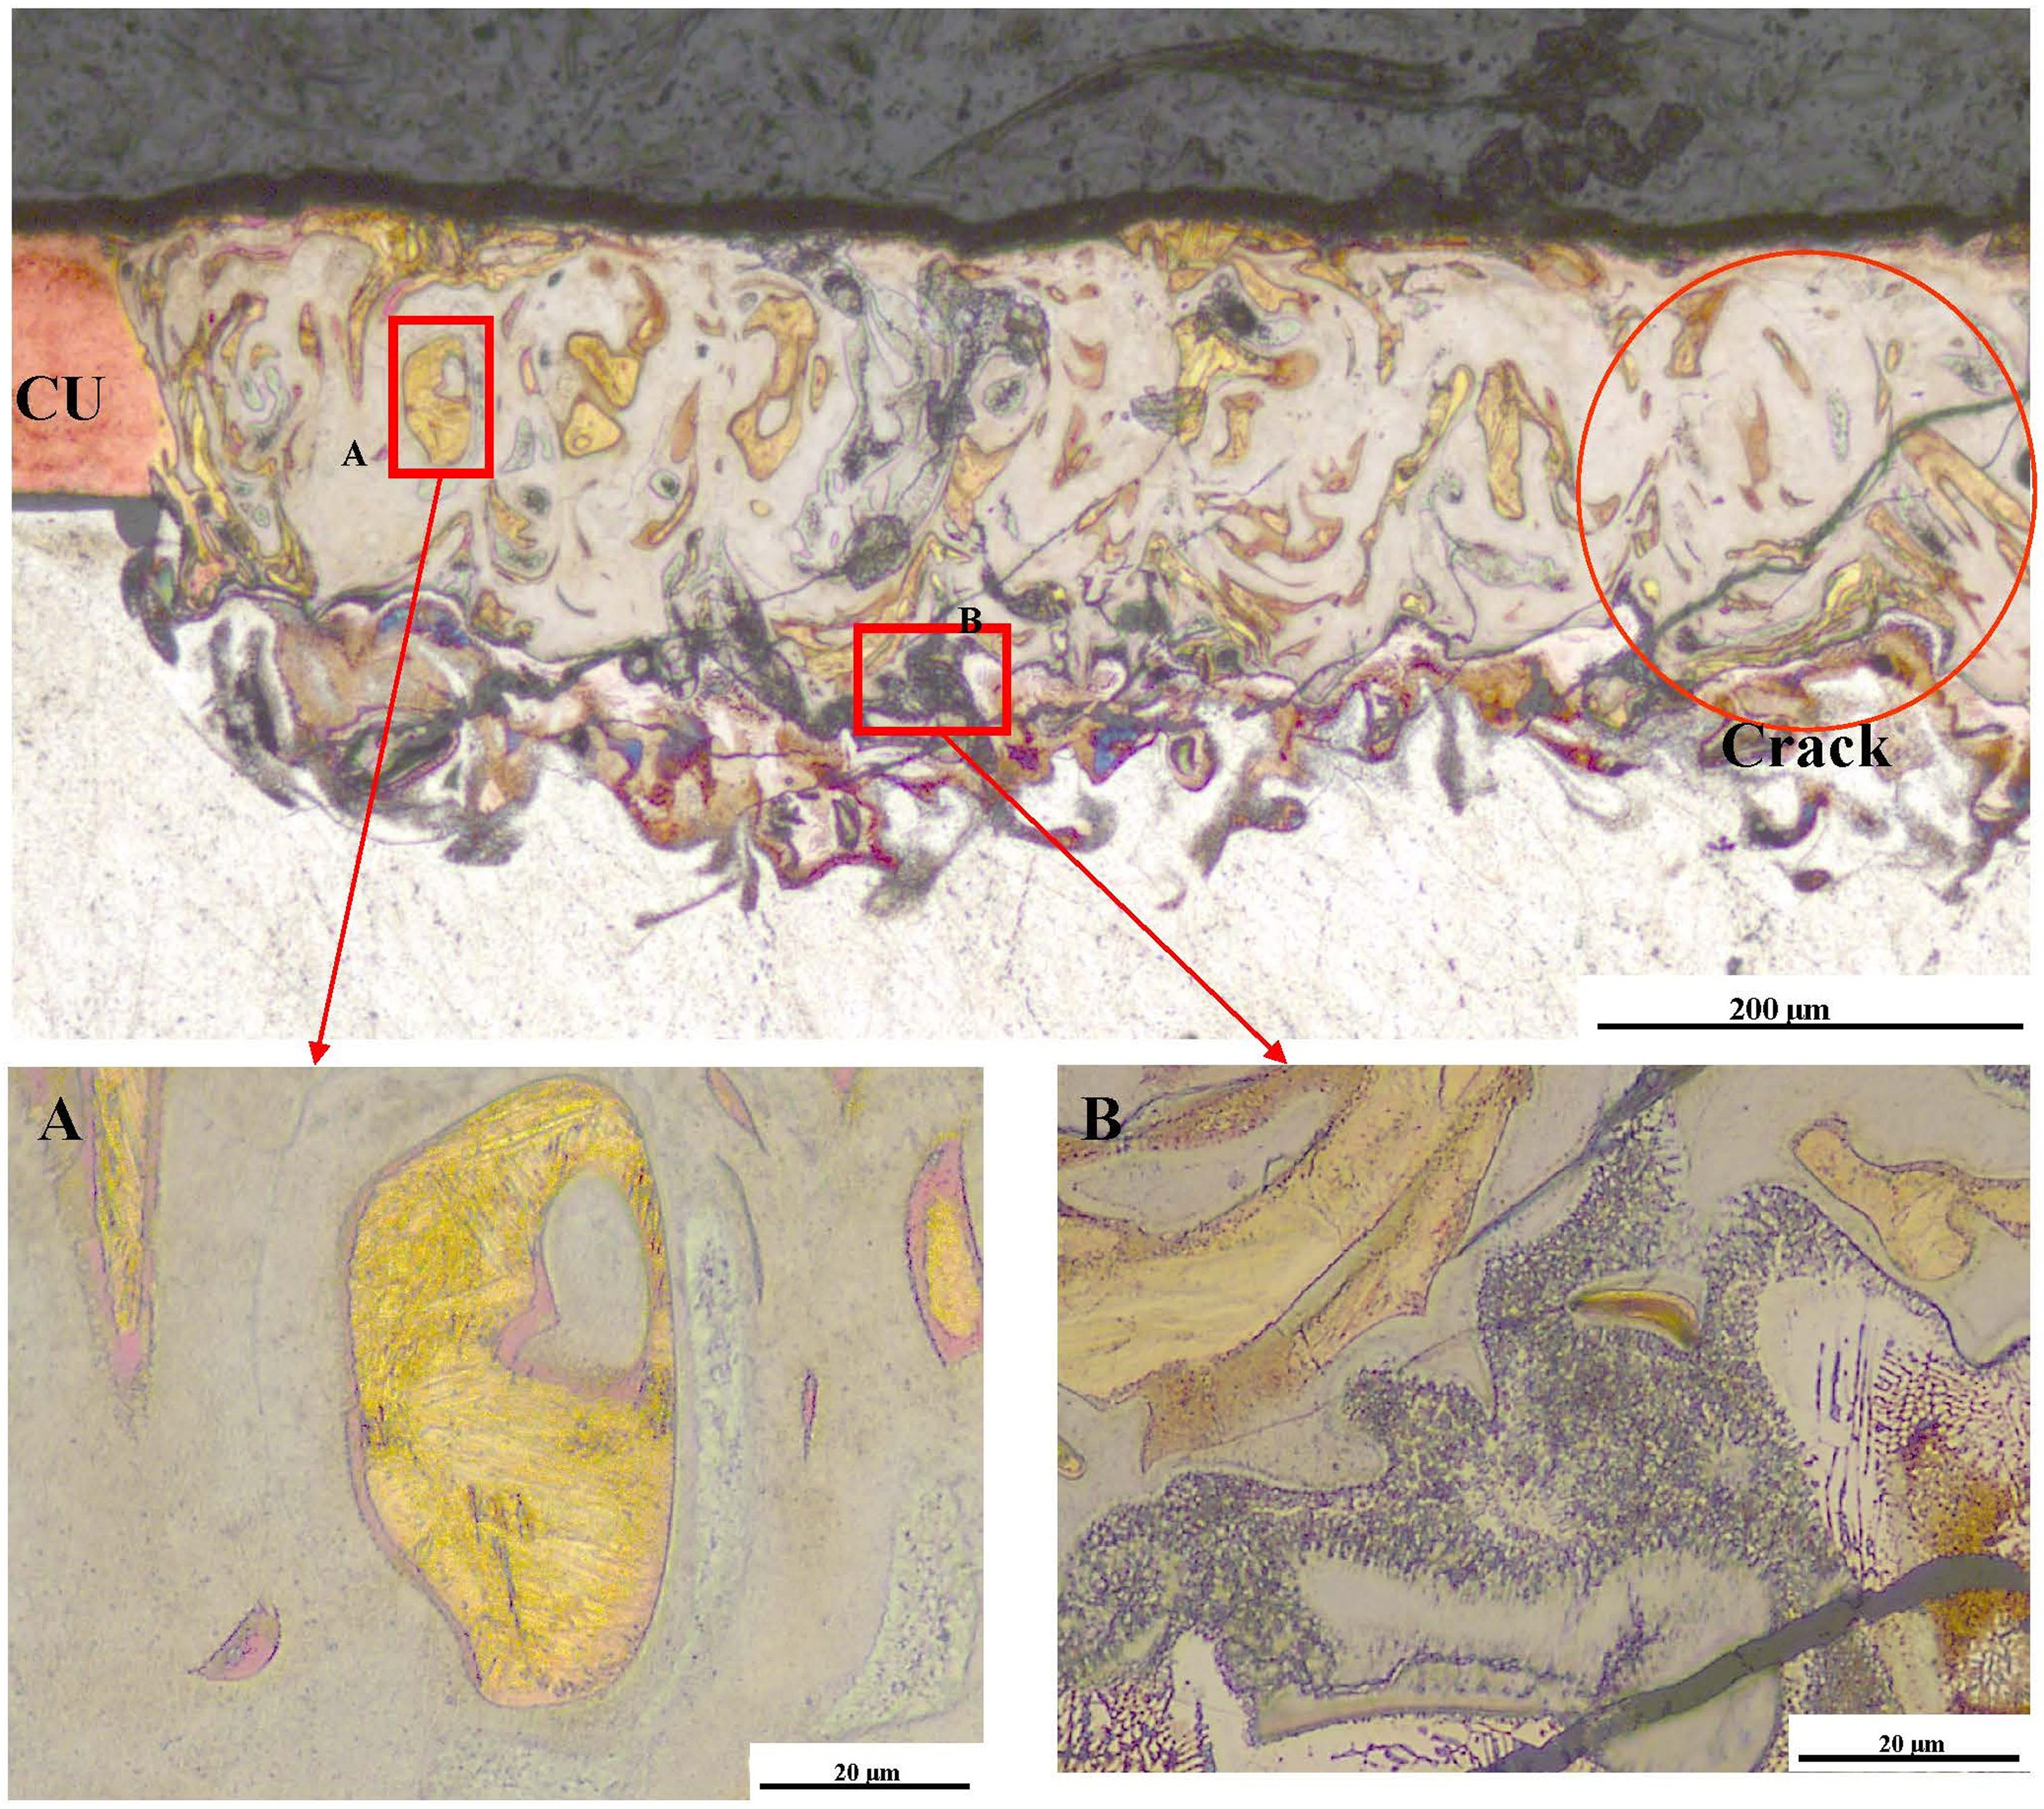
The cross-section of etched over-weld.
The interaction between material properties, microstructural features, and heat energy input affects the crack propagation mechanism in Cu–Al laser welding. The crack initiation in the weld zone can be due to the localized stress concentration in heterogeneous microstructures or because of pores and inclusions. In addition, IMCs can serve as the initiation crack point due to their low ductility and high brittleness. The brittleness of certain IMCs, like Θ phase Al2Cu leads to crack propagation. They may occur and propagate along or close to these phases. The size of the IMC can affect the crack propagation mechanism. Cracks may appear at or adjacent to larger IMCs and propagate along the boundaries of these compounds. Clusters of rounded and small IMCs like η phase-AlCu can also localize the brittleness and contribute to crack formation and propagation. Complete mixing due to high energy input and R2 surface leads to forming a thoroughly mixed composition and the absence of a beneficial Cu phase. The percentage of copper and Al–bronze within this zone is notably lower than the Optimum-weld (Figure 7).
Figure 8(A) shows a small segment of the weld zone, displaying a needle-shaped copper feature. The existence of this martensite structure with approximately 5 µm length can be attributed to the metastable transformation of the β-phase. In the other image, Figure 8(B), the lower section of the weld is magnified, and the presence of the η phase-AlCu in the middle with rounded and small size, and Θ phase Al2Cu at the interface, and the γ-Al4Cu9 phase characterized by peak-like formations which have 3–15 µm on the right side is visible. 22
SEM and EDX analysis
To enhance understanding of the compositional variation and its impact on the weld quality, more analyses on the phases and IMCs for each weld category are critical. SEM and EDX analysis have been employed to achieve this objective. Figure 9 exhibits the top views of three weld categories. The keyhole instability of the “under-weld” category is evident in Figure 9(A). While the center and middle of the spiral trajectory are melted, the weld depicts instability on the outer lines of the spiral. The laser beam encountered difficulty in effectively penetrating the surface of the copper, resulting in an inability to weld the copper to aluminum. The Optimum-weld, Figure 9(B), represents the consistently maintained welding spiral trajectory. The whole part of the weld zone shows crack-free joints from the top view. Increasing the heat energy input and surface roughness manifests a weld zone with some cracks. Figure 9(C) is considered an over-weld category due to its extreme conditions.
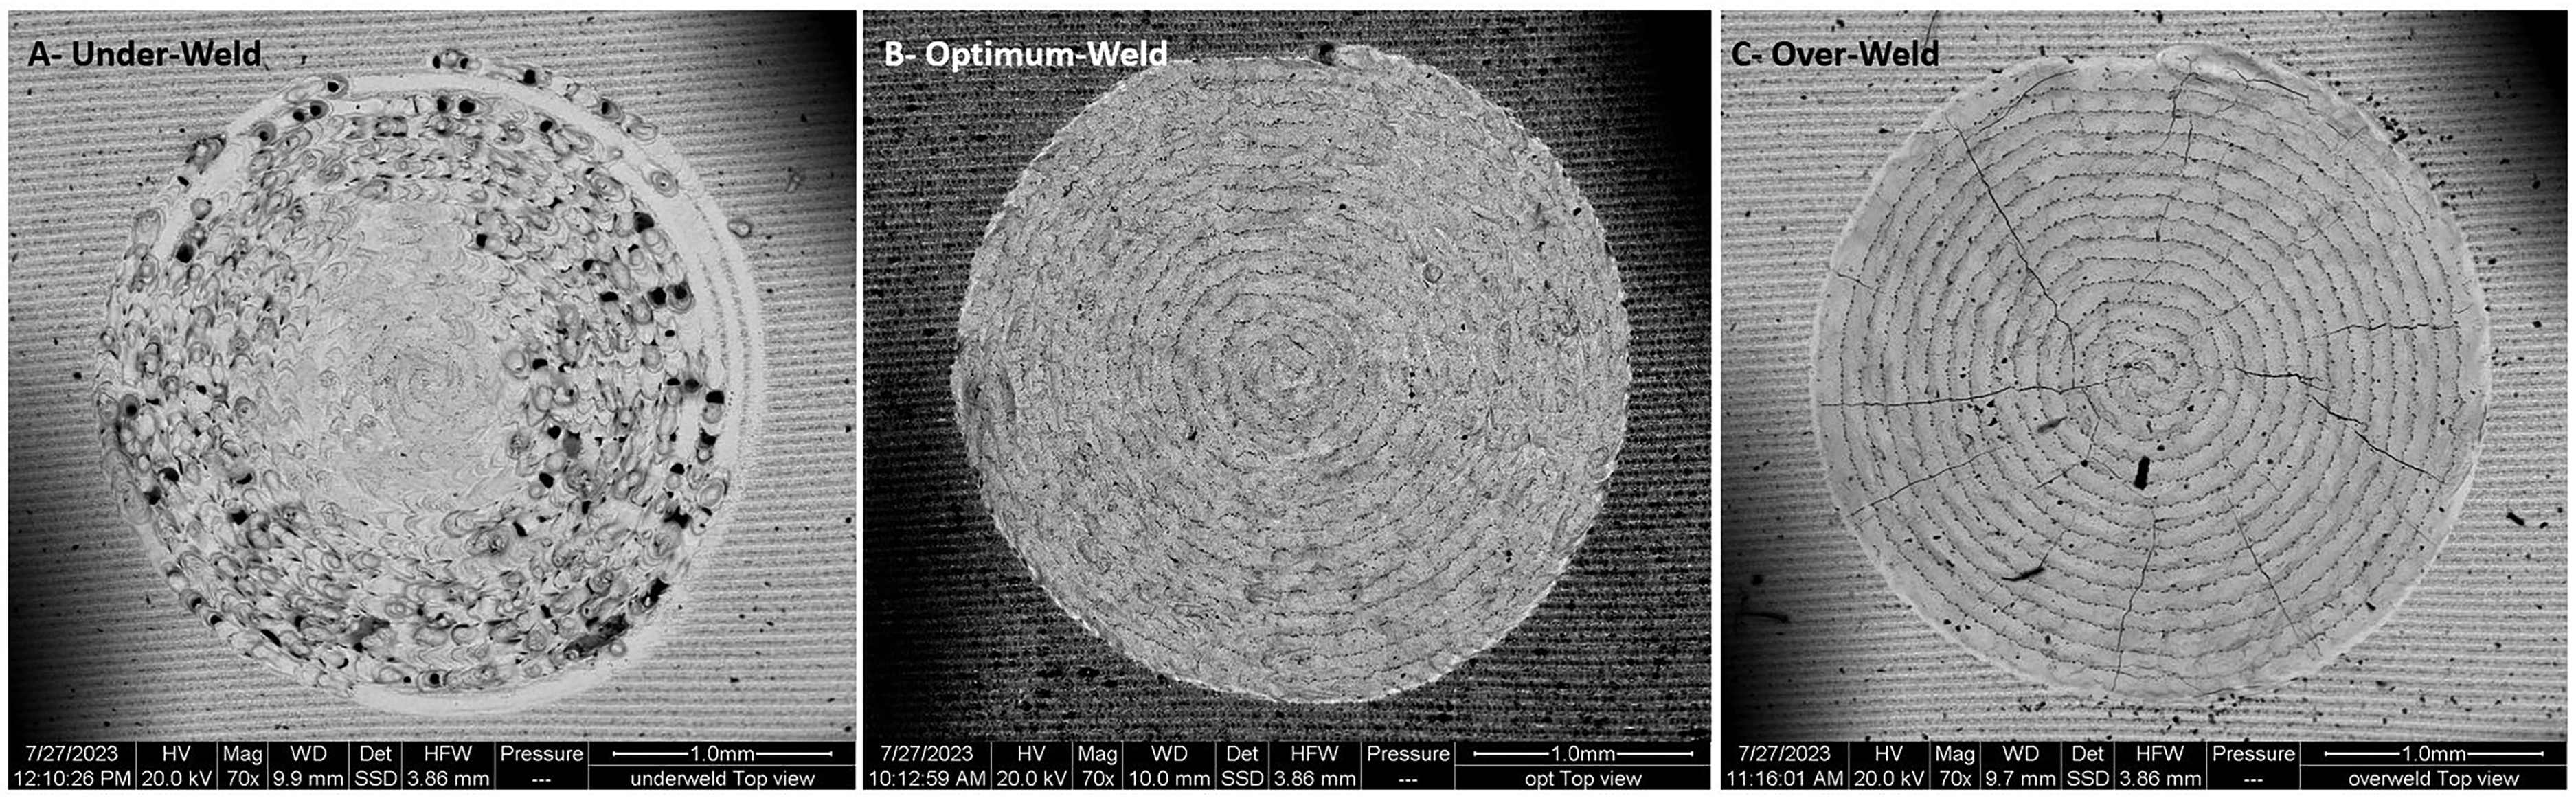
SEM images of the top view for (A) under-weld, (B) optimum-weld, and (C) over-weld.
Figure 10 investigates the “over-weld” category using the EDX analysis at two designated points A and B. This magnification provides a more precise observation of cracks, with black dots discernible along the spiral trajectory between the lines. Point A is situated on the light-colored segment of the weld, and its corresponding EDX graph exhibits peaks for copper, aluminum, and oxygen. The results indicate copper as the primary and dominant element with substantial amounts of aluminum present. This selected point showcases the intermixture of copper and aluminum, representing an IMC. Conversely, point B is located in the designated black area and displays a high peak of the aluminum element. This phenomenon is attributed to the elevated laser beam energy input, causing the aluminum to melt and ascend to the top surface of the weld zone.
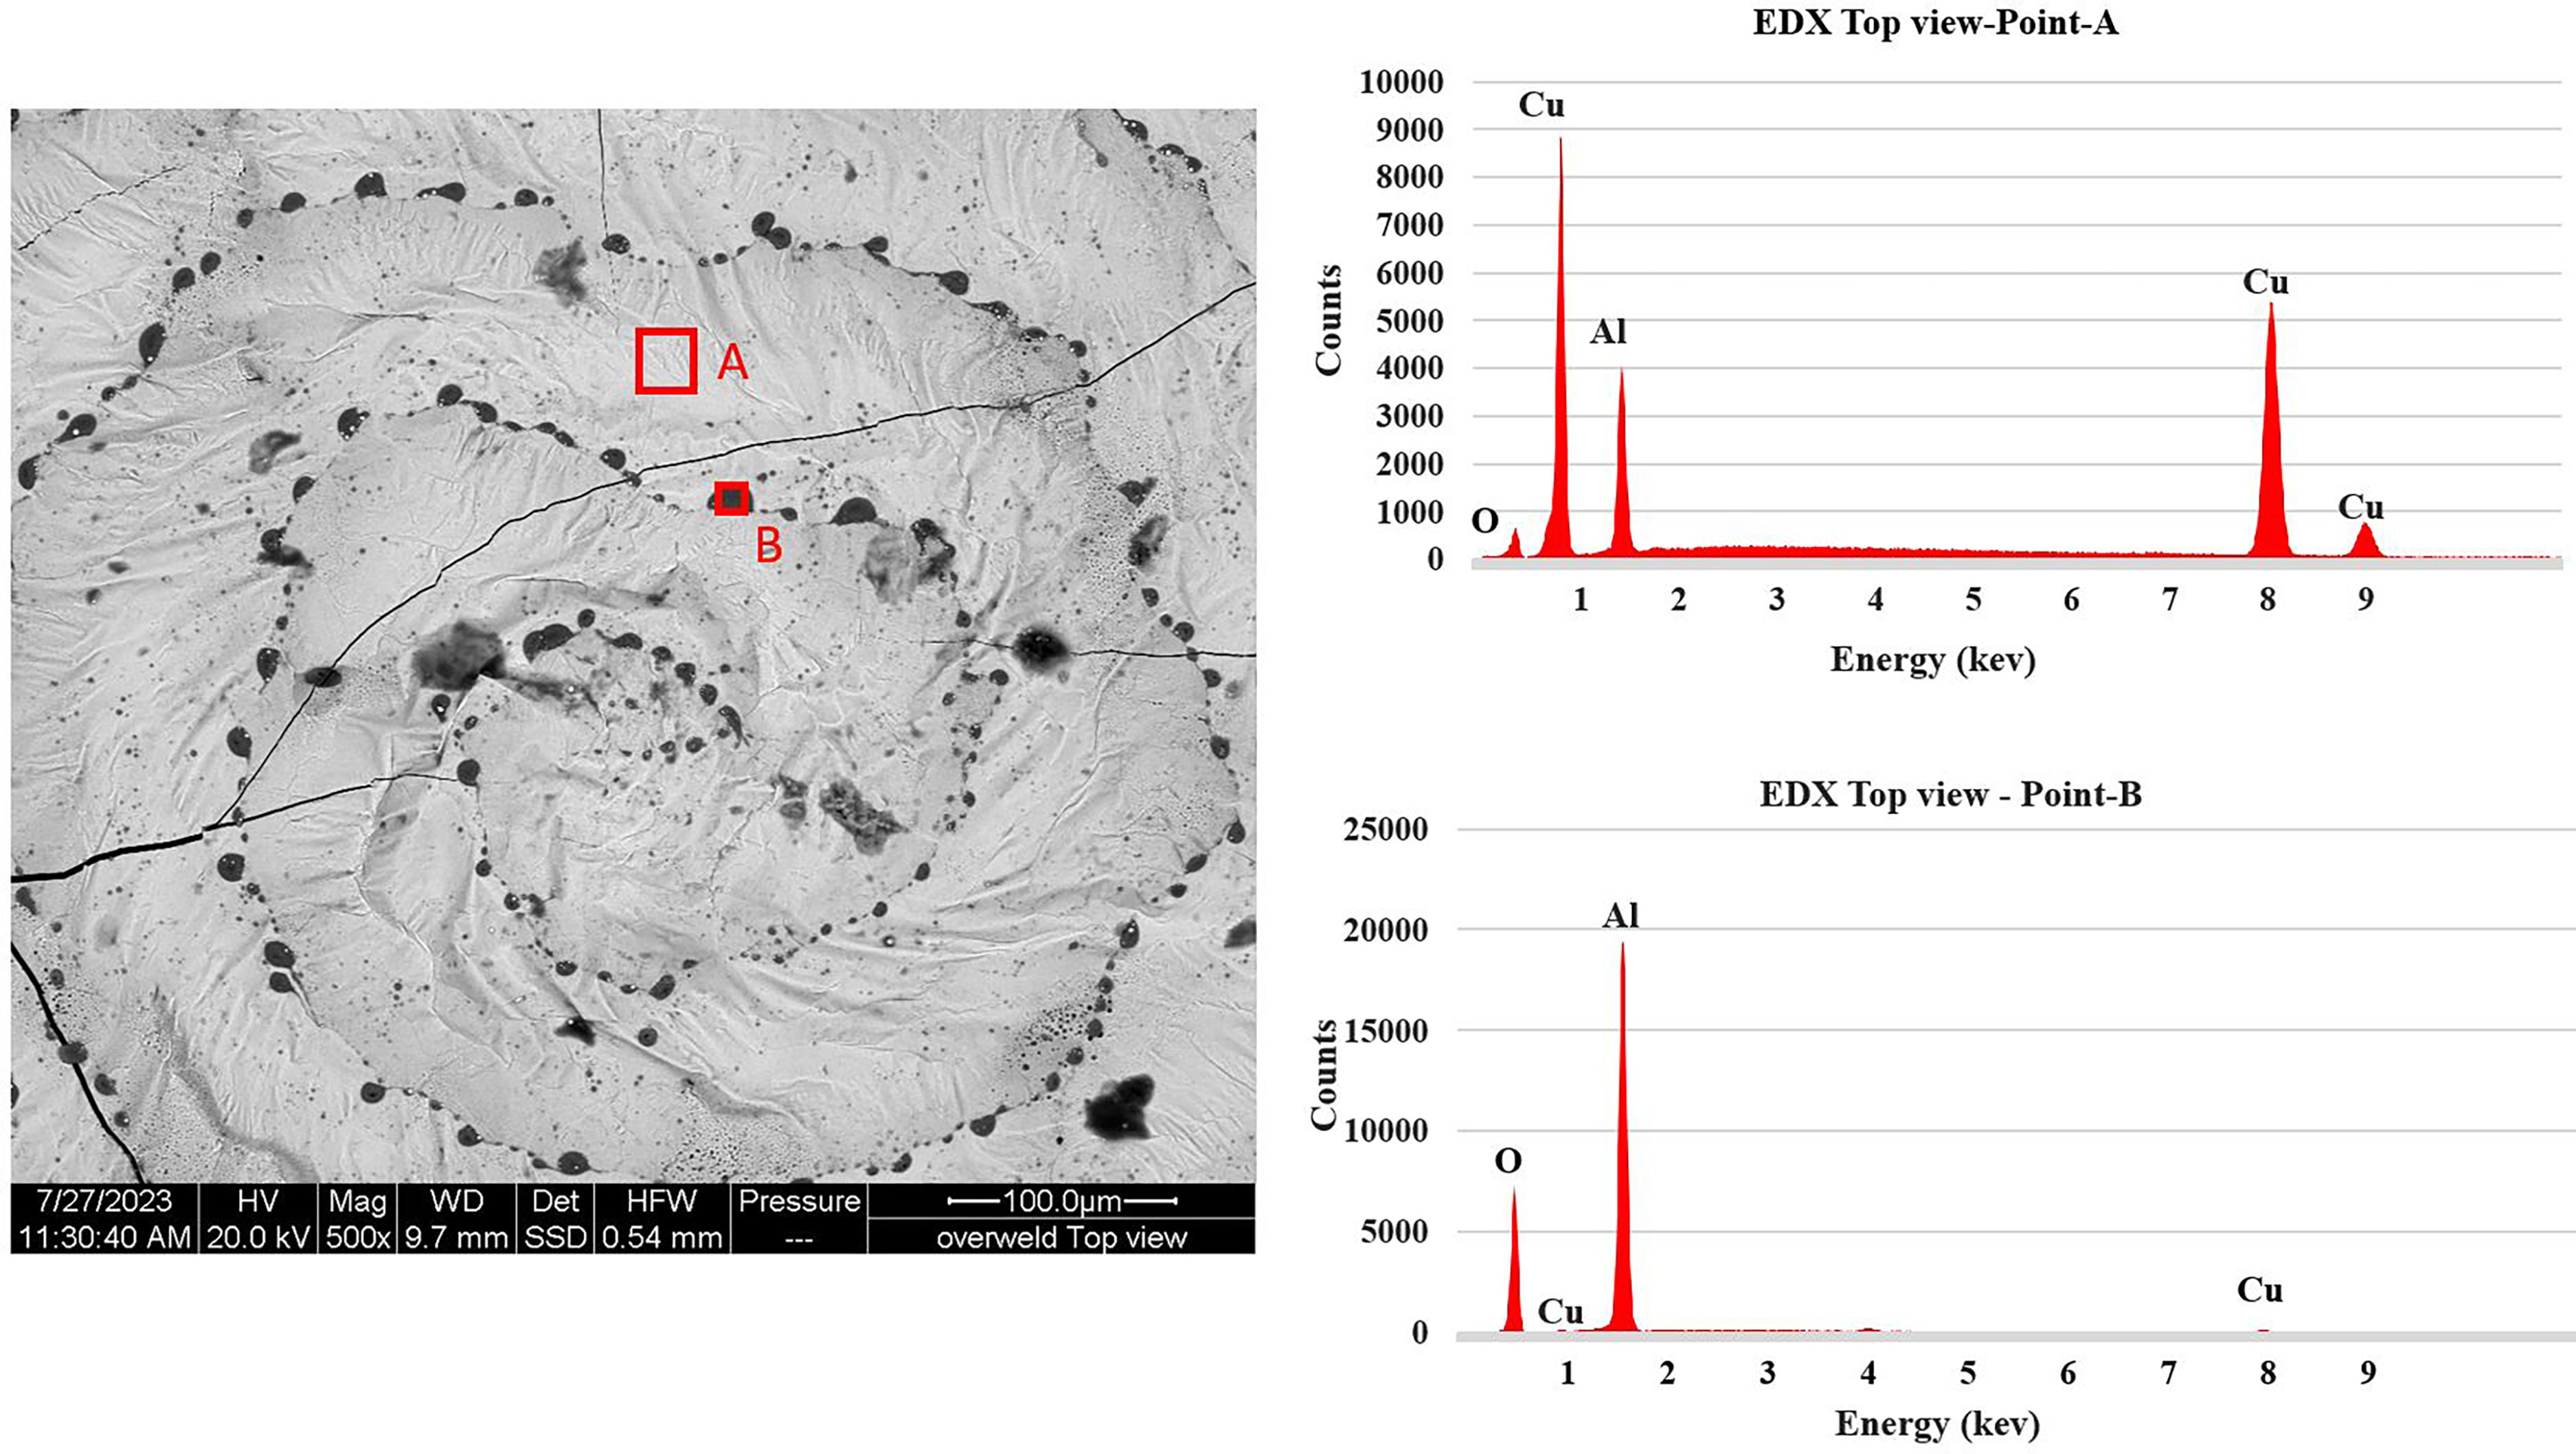
EDX analysis of over-weld Cu–Al top-view for two points A and B.
Figure 11 is the cross-section of Cu–Al weld, which has a range of structures and compounds in the aluminum interface and weld zone. Five different areas in the weld zone and the interface are selected to employ the EDX analysis to analyze better and detect the IMC phases.
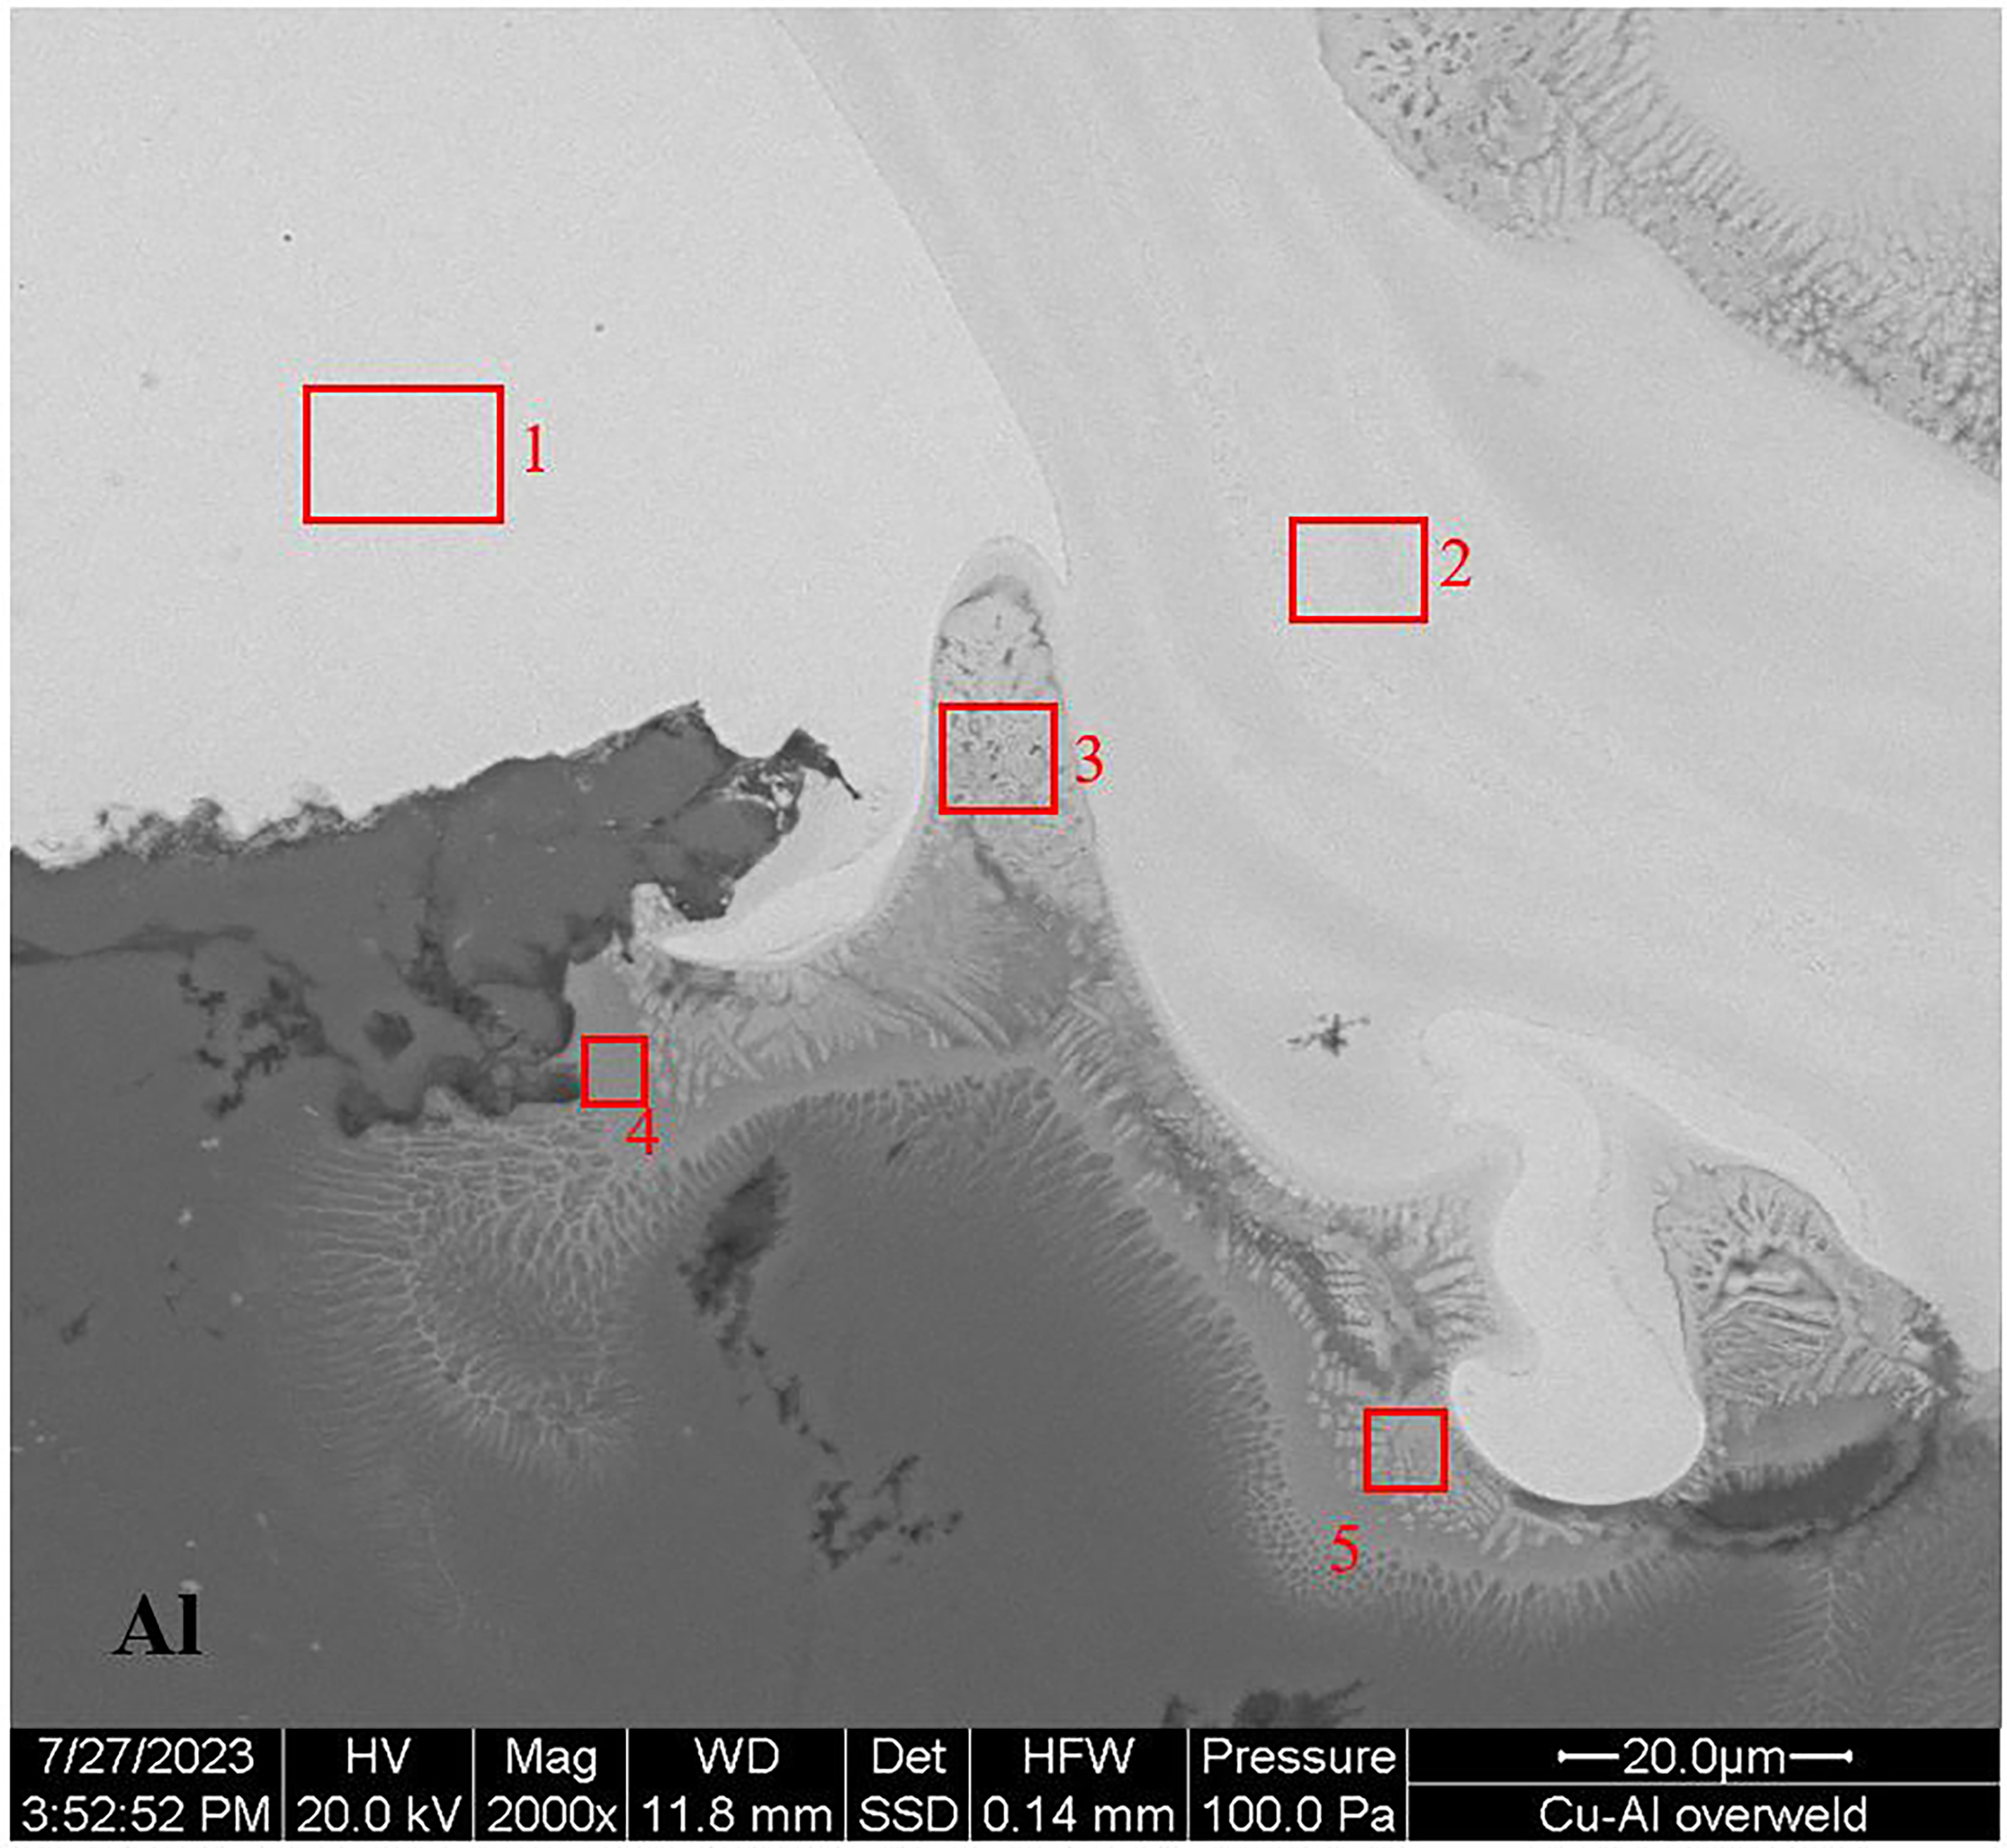
SEM over-weld cross-section Cu–Al for EDX analysis of five points.
The analysis of the EDX point-1 in Figure 12 mainly shows pure copper in addition to the oxygen due to the oxidation which is in line with the microstructure and the absence of secondary phases. However, EDX point-2 in Figure 12 depicts the presence of both copper and aluminum. The coexistence of copper and aluminum peaks in the spectrum suggests the possibility of the formation of Cu–Al IMC. This is in line with the confirmed results by Schmalen et al. 21 which state the presence of the γ-Al4Cu9. This is a copper-rich zone next to the Al–bronze.
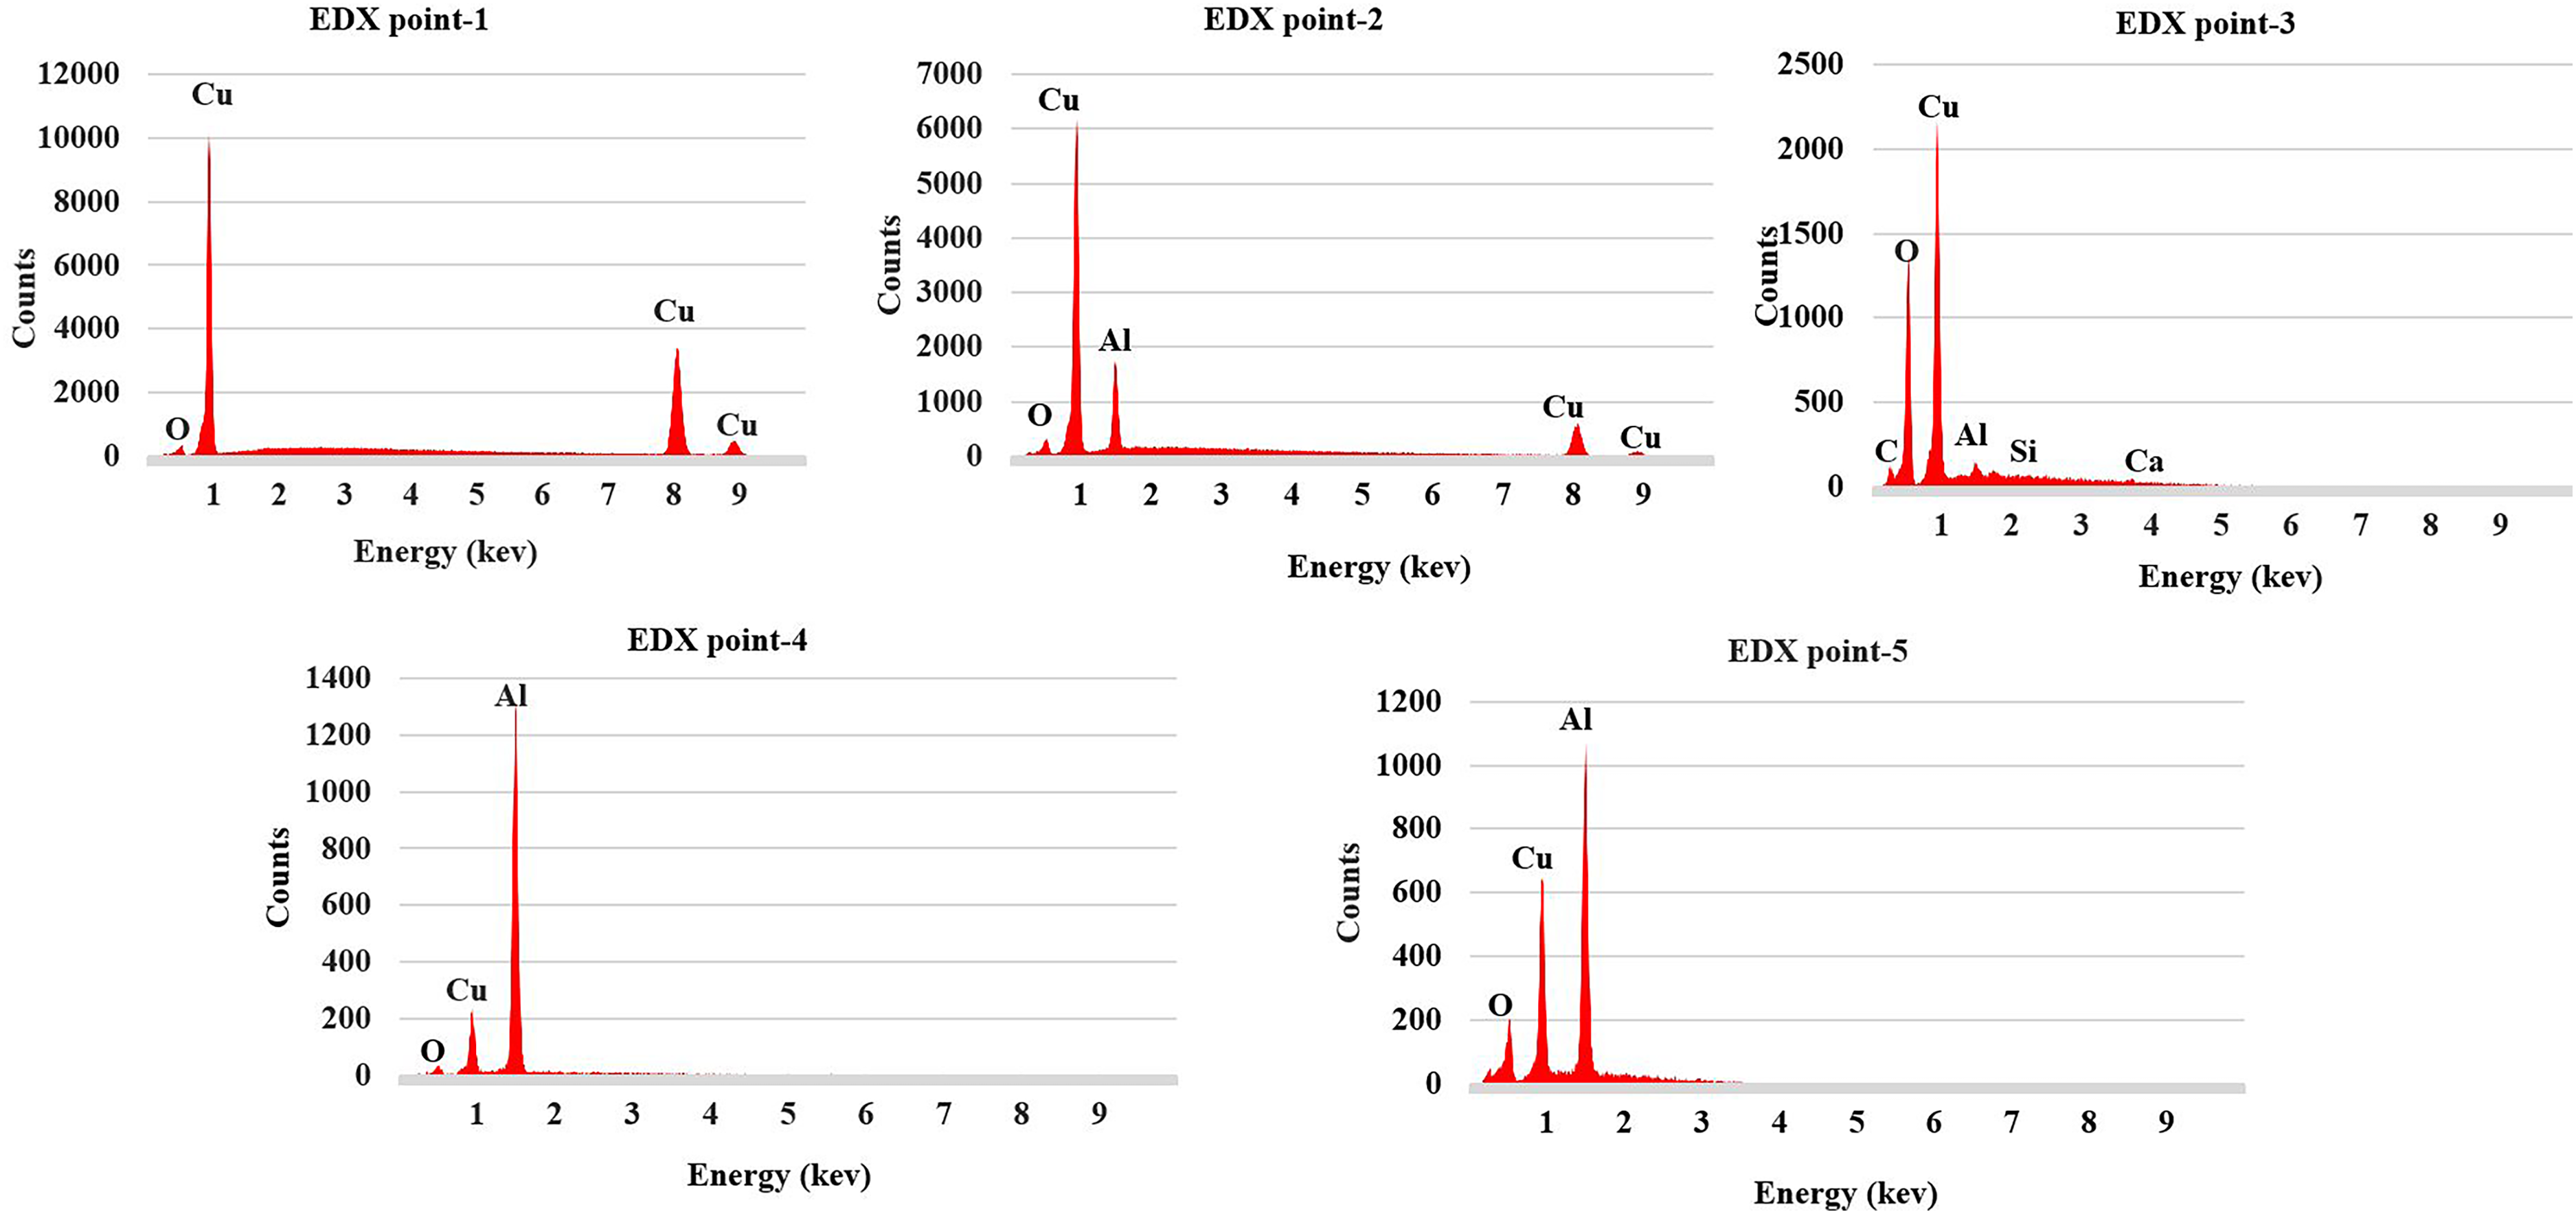
EDX analysis of five points of Cu–Al cross-section weld in the “over-weld” category.
EDX Point-3 graph in Figure 12 shows some peaks of different elements like carbon, silicon, and calcium, which may indicate potential contamination or impurities in the analyzed area. However, they are not primary components. The significant copper peak indicates a substantial amount of copper in the weld. In addition, the presence of aluminum is confirmed by the aluminum peak. The structure of the phase proposes the existence of an intermetallic phase in this area. The higher Al peak in the EDX Point-4 concludes that a transition area includes the eutectic point of Al + Θ phase Al2Cu. 21
Similar to the other points, the analysis of EDX Point-5 suggests the presence of oxygen. The Al and Cu peaks in the graph confirm the presence of an IMC. This structure represents a columnar dendritic structure and has peaks with a tower-like shape. This is the Θ phase Al2Cu. The high-energy input and the extensive melting of copper and aluminum within this weld category create an unstable weld zone characterized by numerous brittle intermetallic phases. This, in turn, constitutes the principal factor contributing to the weld structure's elevated levels of brittleness. Crack formations are predominantly associated with these phases, significantly leading to low mechanical strength of the joint. This study has achieved insights into the impacts of laser process parameters and surface roughness through metallographic analysis and hardness measurement tests. Consequently, these findings hold the potential to facilitate the adoption of a more efficient and economical tool for comprehensive quality control. One such tool is CNN, which will be explored in the following section, as it can categorize welding types based on the analysis of top-view images.
Convolutional neural networks
In this research, a robust model system is developed to address the weld classification task. The objective is to classify images into distinct weld categories, where each class represents a unique concept. Nonetheless, a new weld-type appearance emerged during the laser welding process. This is labeled “no-weld” because there is no bonding between copper and aluminum. It is primarily attributed to the low force clamping and sheet deformation resulting from high energy input. This defect originates because of the increasing temperature on the copper sheet when a sequence of spiral welds, 20 welds, occurs nearby within each sample. This defect type regularly happens when a series of welds close to each other is required in thin sheets (See Figure 14—Class 2).
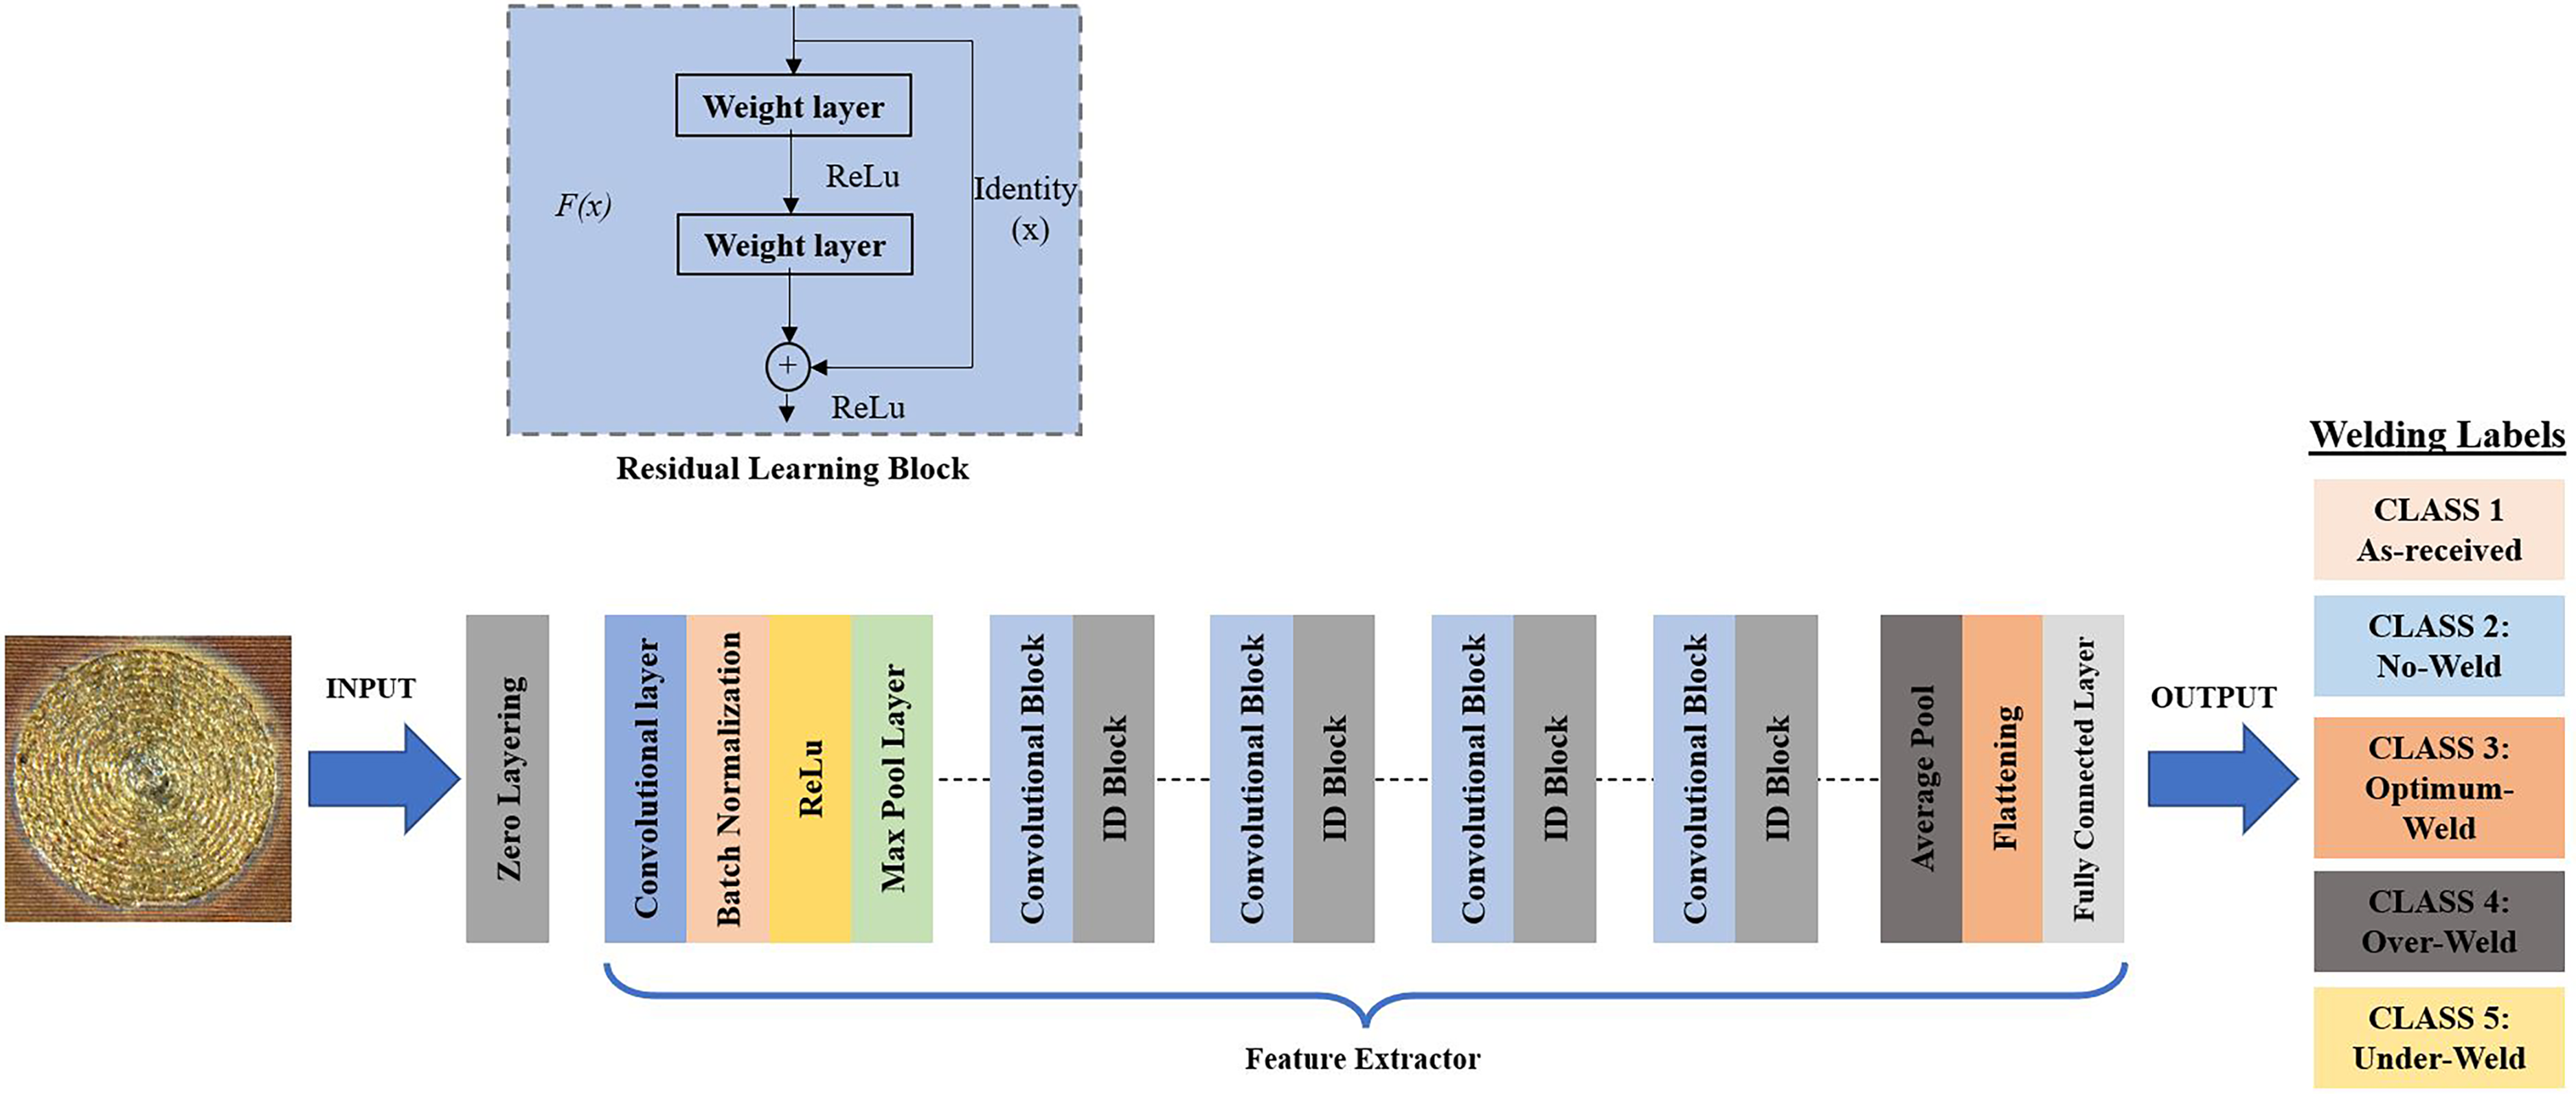
The architecture of ResNet-50 model.
Considering the No-welded type, Class 2, five categories are selected for the learning model. Figure 14 visualizes the classes’ representation, along with their respective associated images.
Weld image analysis is conducted by segmenting the image pixels into their constituent RGB (Red, Green, and Blue image pixels) components, with each of these distinct features being associated with specific weld categories. The model system's core architecture used to predict the weld category is the Residual Neural Network (ResNet-50). A widely recognized model known for its exceptional performance in various computer vision tasks. ResNet-50 distinguishes itself through its innovative use of skip connections, a technique designed to retain information from previous layers. This approach substantially increases the network's capacity to acquire knowledge and make precise predictions. 23 The ResNet-50 architecture in this study includes 177 layers, each with 192 connections (see Figure 13). This deep architecture allows the model to capture features from images, making it well-suited for complex image classification tasks.
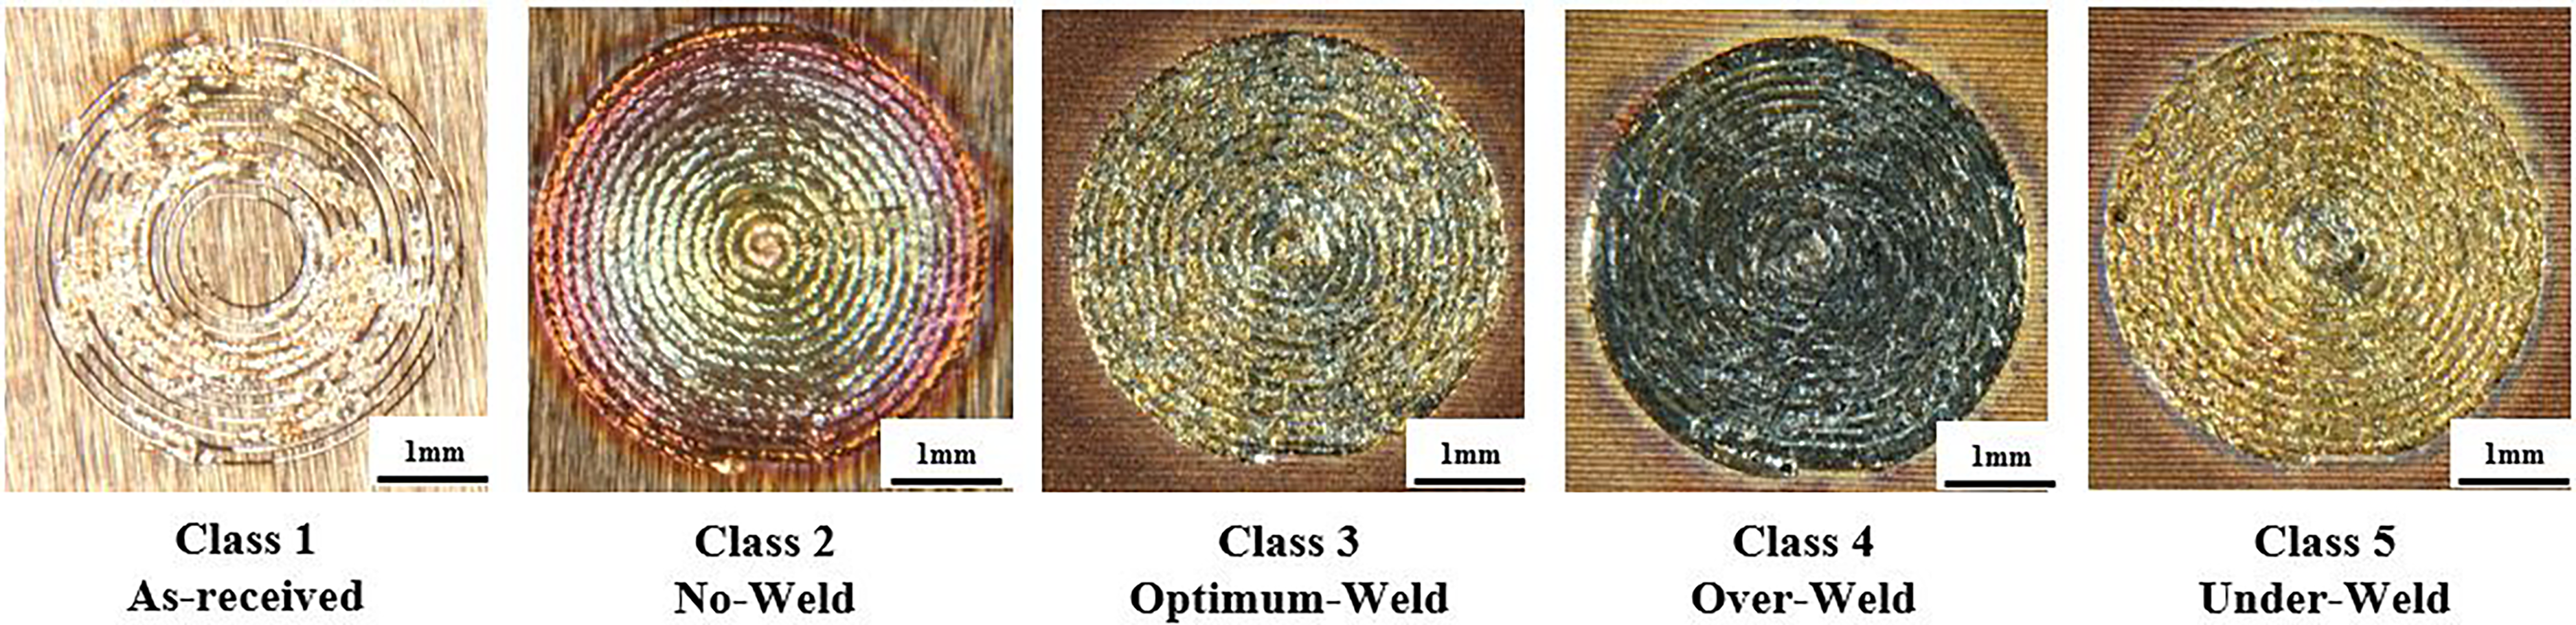
Weld classification based on weld bead categories.
Datasets are placed into five classes, and each class contains 262 images, totaling the input data of 1310 photos. Equaling the number of images for each category is necessary to avoid the risk of the model favoring any class. Image processing techniques using the ResNet-50 architecture are applied to prepare the images to a specific size. In addition, data augmentation methods are considered to increase the model's robustness. The training process includes identifying features in each image and category. This helps to classify each image within the model.
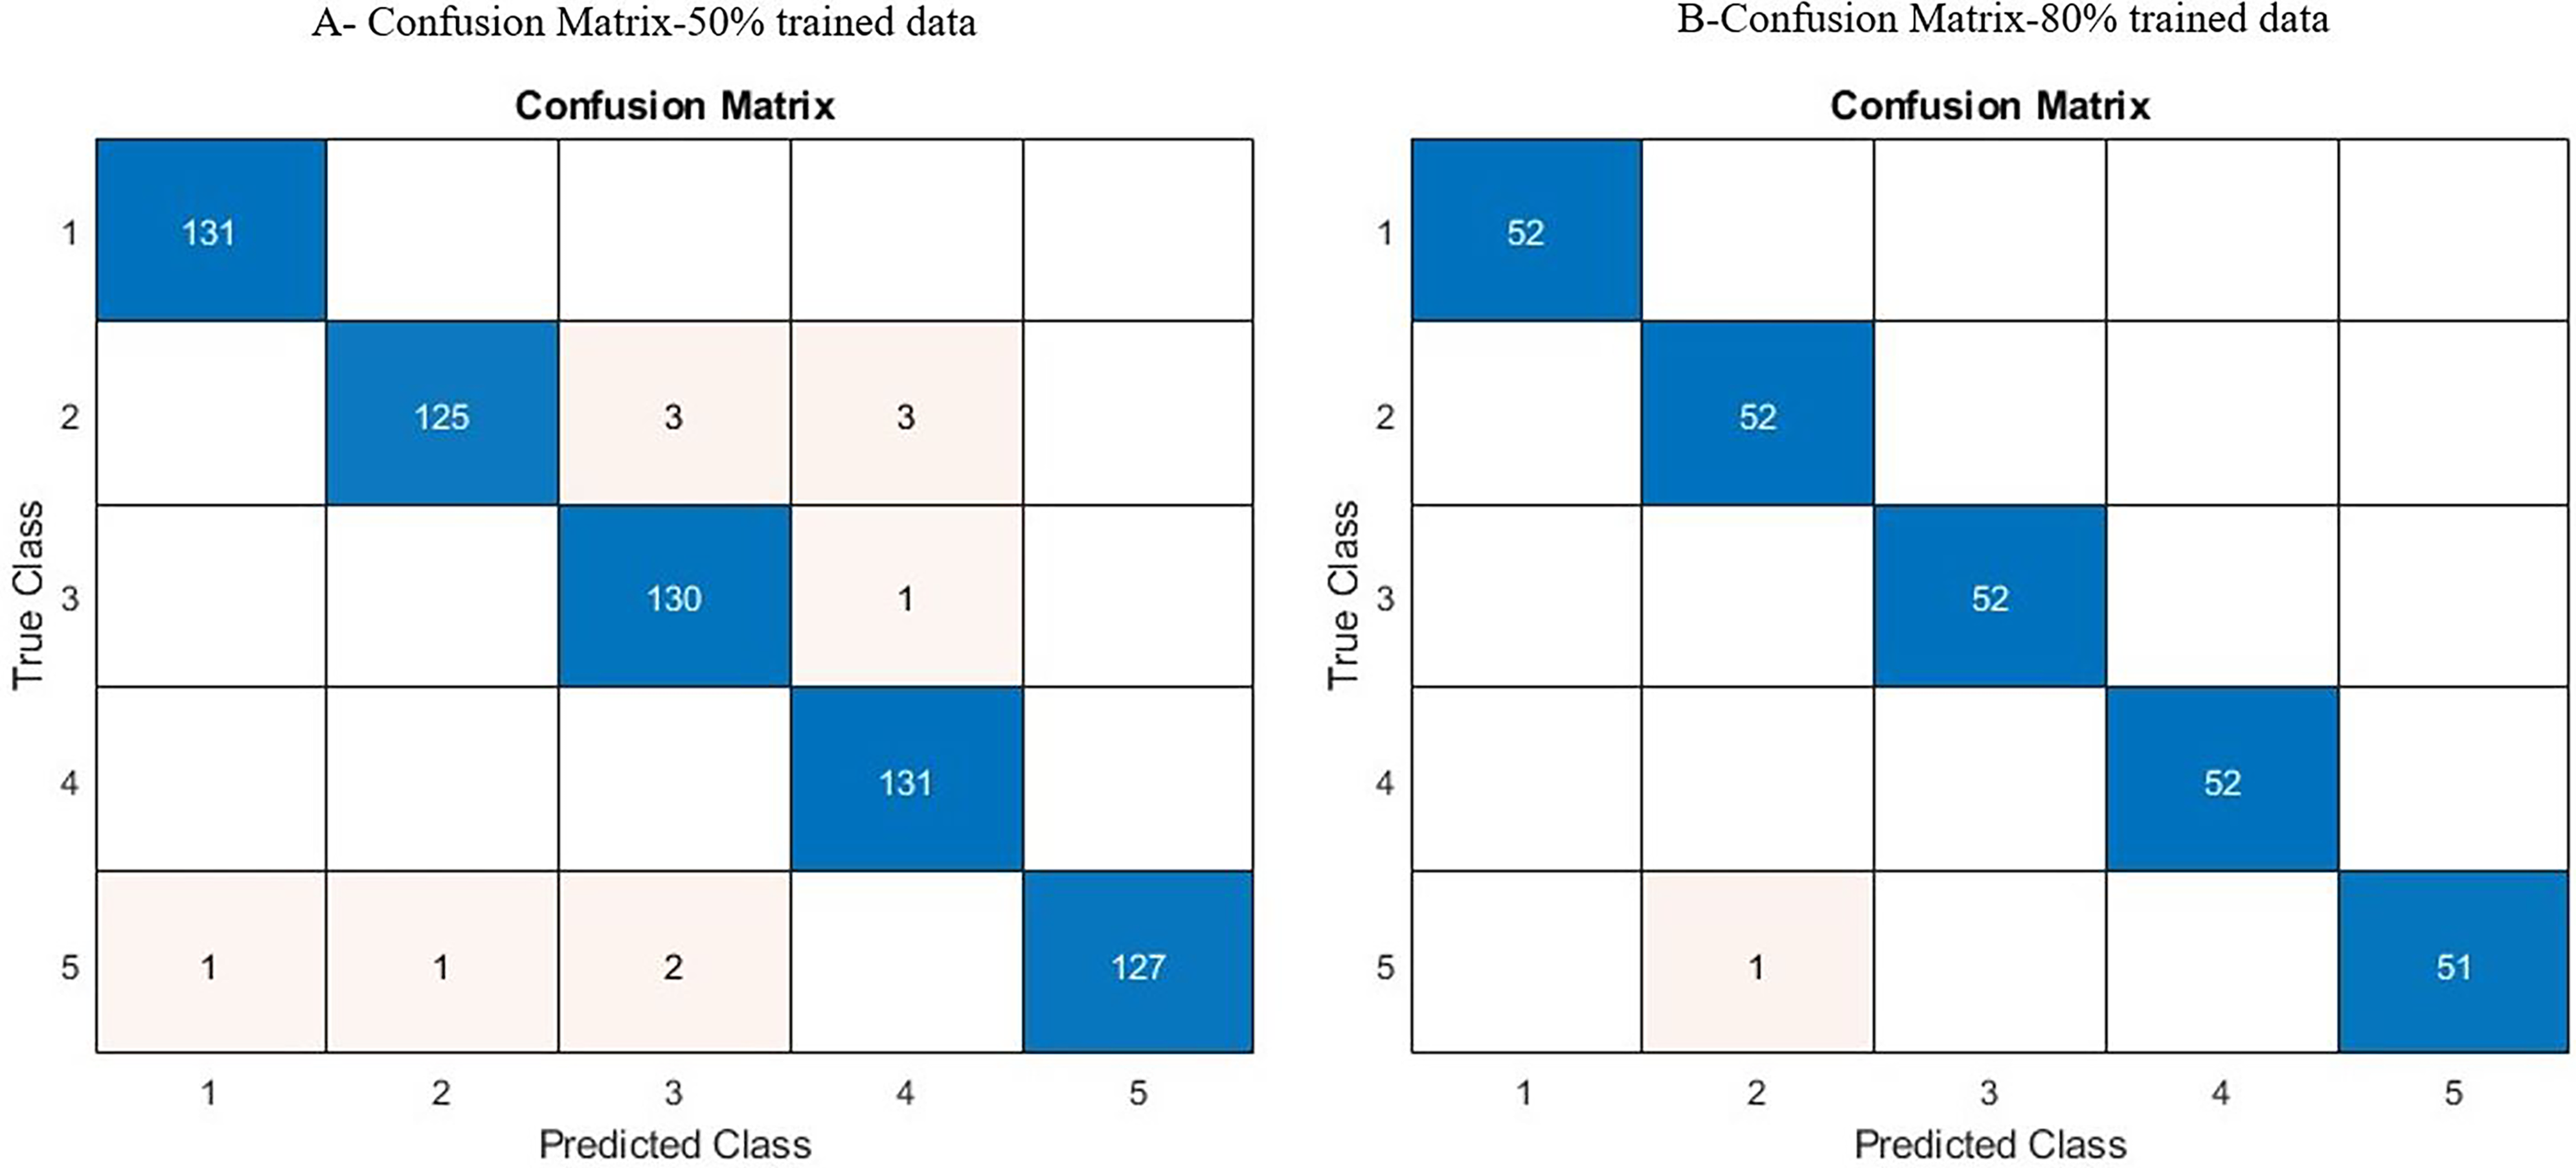
After model training, an evaluation of the model's performance is considered. This evaluation is addressed by a confusion matrix, which reveals the model's accuracy in classifying images into five categories. This matrix exhibits an understanding of the model's strengths and areas that may require further refinement. Figure 15(A) illustrates the confusion matrix derived from the 50% trained data analysis, providing insights into the relationship between the “true class” and the “predicted class.” In this model, each category contains 131 images.
Confusion matrixes (A) with 50% trained data (B) with 80% trained data.
For each class, a total of 655 photos for the test (50% of all images), making an accuracy of 98.2%. However, Figure 15(B) is a confusion matrix with 80% trained data in which only one image is not recognized in its related category, and a high accuracy of 99.6% is achieved. While the achieved accuracy is valuable, it is essential to state that even a small percentage of error can pose challenges in a production system where 100% accuracy is required.
To gain a deeper understanding of the underlying reasons for these errors, we have scrutinized the images belonging to Class 2, labeled as “no-weld” (See Figure 16(A)–(C)). Figure 16(A) exhibits characteristics indicative of welding, with portions falling within Class 2, “no-weld,” which is reddish, and no bonding occurs. However, other weld parts have the Class 3 “optimum-weld” characteristic. There is also a mixing of Class 2 with “Class 4” and “Class 1” in Figure 16(B) and (C), respectively. Considering this form of partial or half-weld constitutes a defect is essential. However, due to careless oversight in addressing this specific defect category, it remains undefined within the system and can be attributed to human error. However, Figure 16(D) and (E) are considered machine learning errors because they are categorized based on their features, and the model system cannot categorize them correctly. For example, Figure 16(D) is placed in Class 5; however, it is in Class 3. Few images have such an error, while the model is trained based on 50% data.
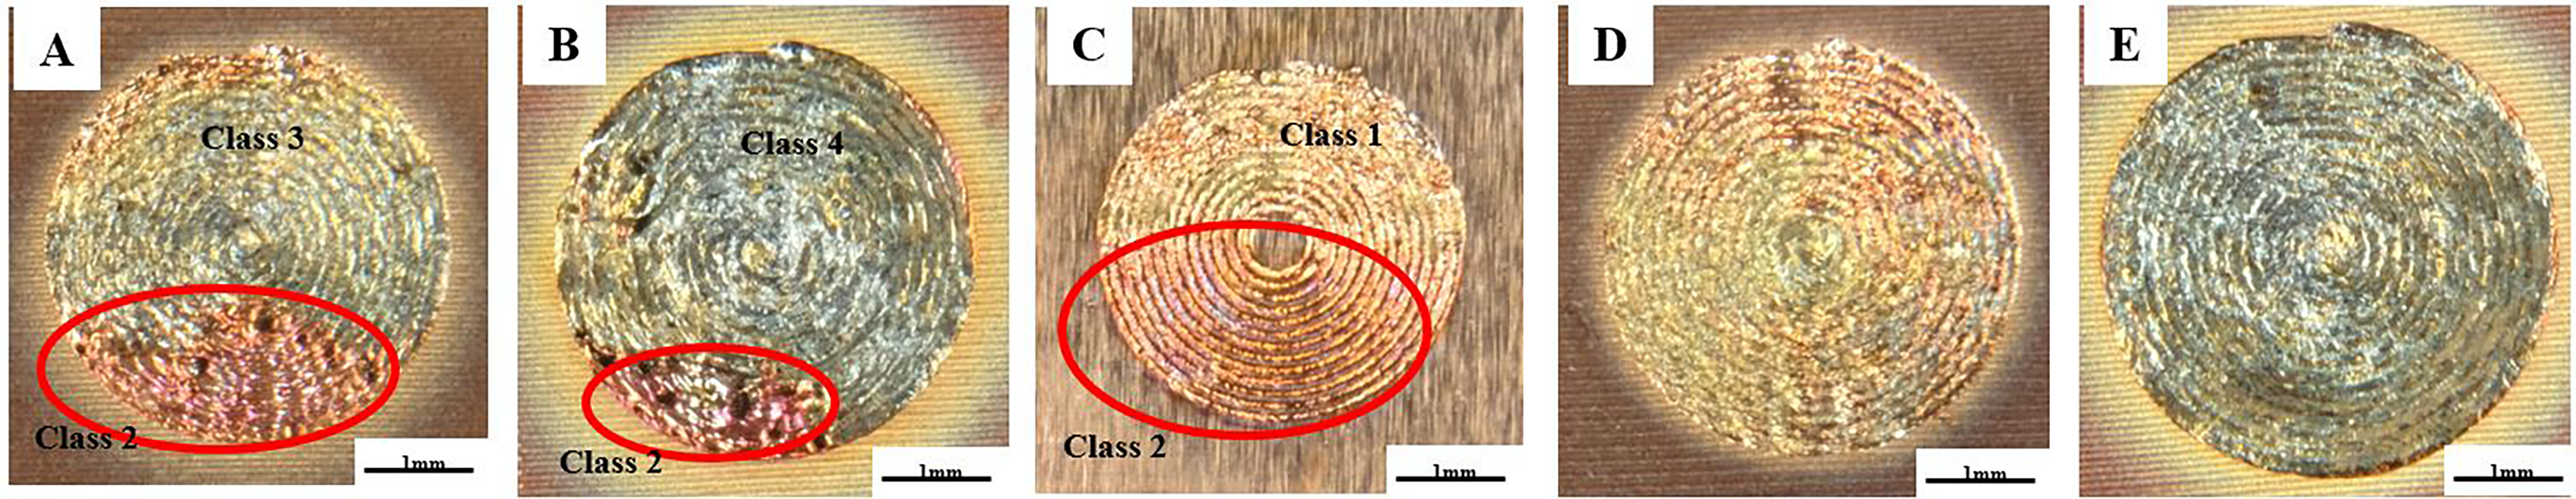
Examples of prediction error.
As depicted in Figure 17, an increase in accuracy becomes evident by using more trained data when there is a transition from 50% (655 images) to 90% (1179 images). The achievement of “100% accuracy” aligns with using 90% of the datasets for the learning process. This reaffirms that employing a more extensive dataset significantly contributes to achieving more reliable outcomes. It is essential to mention that the quality of the images used substantially impacts the accuracy of the results. As part of this study, low-quality and noisy images are deliberately used in the learning and testing phases to challenge the model's accuracy.
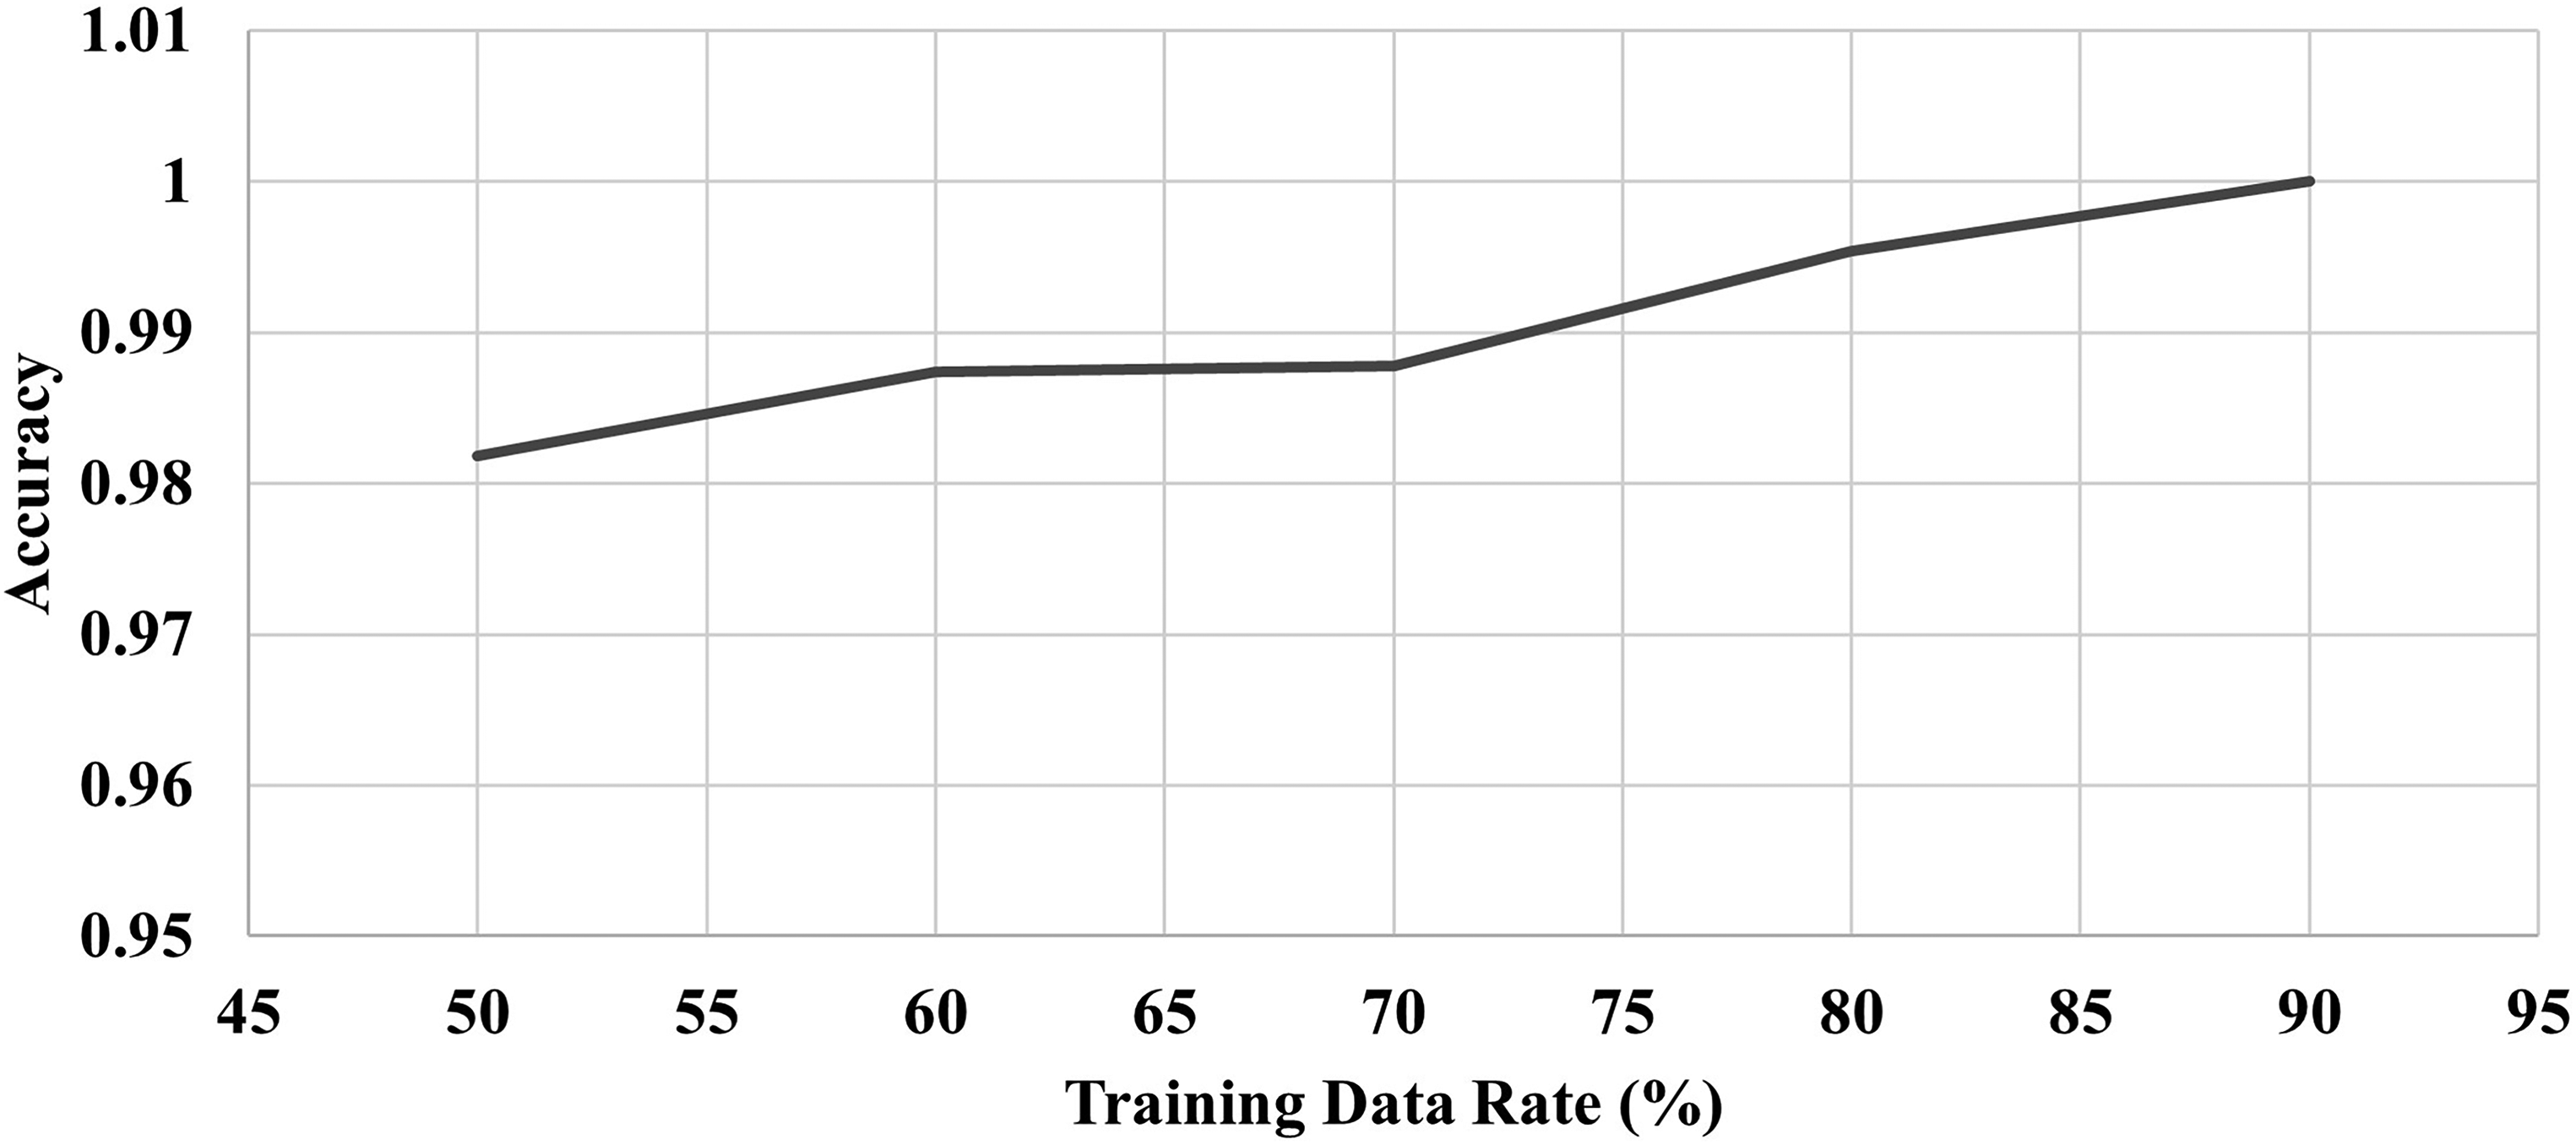
Accuracy versus training data rate.
Considering the outcomes and the high level of accuracy exhibited by the model, it can be claimed that the application of CNN in conjunction with the proposed model represents a reliable monitoring technique for scrutinizing each weld throughout the joining process. This approach can boost the final product's robustness by passing or rejecting each weld in the laser welding process.
Conclusion
Laser welding of the Cu–Al joint in an overlap configuration, with copper positioned under the laser beam, presents several challenges. Copper, characterized by its high reflectivity, often reduces laser beam absorption, affecting the Cu–Al joint's quality. In this study, a laser-based structured method is employed as a preliminary step before laser welding, involving the forming of grooves to augment laser absorption. Optimization of the laser welding process reveals a small process window, primarily attributed to the thin, 0.1 mm copper sheets. Four main Cu–Al welded categories, as-received, under-weld, optimum-weld, and over-weld, are introduced and labeled. An analysis of the Cu–Al welded specimens allows for summarizing the following key findings:
Due to the “as-received” copper surface's high reflectivity, this condition results in a keyhole instability or a complete absence of bonding. Conversely, employing a copper surface with higher roughness values offers the advantage of increased laser beam absorption. However, it is essential to consider that the heat energy input represents another influential parameter that can create an unstable weld should it surpass its designated threshold. The “over-weld” category, characterized by the R1 surface condition and the highest energy input of 0.727 J/mm, has the highest average hardness value of 617.05 HV. This weld category exhibits numerous cracks and voids. This category's wide range of hardness values presents various phases and IMCs. The presence of these phases makes this weld zone susceptible to cracking. Fluctuation in heat energy input, surface roughness, clamping force, and other factors during the laser procedure can affect the weld's quality, particularly when employing thin sheet materials. This study introduces a machine learning monitoring method, the ResNet-50 architecture within a CNN framework. This method is proposed as an advanced alternative to replace the traditional, conventional quality control system. It can help to reject or accept the Cu–Al joint. The results obtained in this study demonstrate that by training the model with 50% of the available data, including 655 images of weld zones, an accuracy level of 98.2% can be attained. However, this training model can exhibit an accuracy of up to 100% when 90% of the data is used for training.
Further investigations employing a range of sensors, such as spectrometers and optical microphones, for real-time monitoring of the Cu–Al welding process can significantly enhance control of this laser welding process.
Footnotes
Acknowledgments
The presented work is based on the “Developing and Online Monitoring of Laser Welding Between Hard Metal and Steel Based on Artificial Neural Network Feedback” project (AFR-PPP grant, Reference 16663291). The authors wish to express their gratitude for the support provided by the Luxembourg National Research Fund (FNR), and Ceratizit Luxembourg for its invaluable contribution as the project's industrial partner. Additionally, we acknowledge the Laser Team Competence Center (LTCC) of the University of Luxembourg, Campus Kirchberg, under the supervision of Professor Peter Plapper, for providing materials and machinery.
Declaration of conflicting interests
The authors declared no potential conflicts of interest with respect to the research, authorship, and/or publication of this article.
Funding
The authors disclosed receipt of the following financial support for the research, authorship, and/or publication of this article: This work was supported by the Fonds National de la Recherche Luxembourg, (grant number 16663291).