
Abstract
40Cr is a significant material in the manufacturing of gears. However, this process is plagued by uneven distribution of quenching layers and excessive residual stress, leading to a decline in the precision of the workpiece, deformation, and cracking. Relying solely on the trial-and-error method in experiments is inadequate for effectively revealing the evolution mechanism of the laser quenching process. This approach is detrimental to improving research and development efficiency. In this study, a multi-field coupled numerical model for the multi-track overlapping laser quenching of the 40Cr gear steel is established. This model quantitatively reveals the coupling evolution laws of the temperature field, stress field, and phase transformation field during the laser quenching. The focus is on calculating the size of the tempering zone under different overlapping rates and conducting correlation analysis between parameters. Based on the artificial neural networks and genetic algorithms, the width and depth of the tempering zone are selected as target values for parameter optimization. The aim is to find the nonlinear relationship between the laser power, spot diameter, scanning speed, laser overlapping rate, and the size of the tempering zone, which can accurately predict the size of the tempering zone. The material microstructure of 40Cr gear steel was characterized by the scanning electron microscope, microhardness tester and friction and wear tester. The results show that the training error and testing error of the output parameters in genetic algorithm optimized back propagation network can accurately predict the size of the tempering zone. It is found that the higher the lap rate, the more uniform the hardness of the phase transformation hardening layer surface, and the tempering softening zone becomes larger. The parts surface is easy to produce defects, which can provide a theoretical basis for optimizing the laser quenching process parameters.
Keywords
Introduction
With the rapid development of the manufacturing industry, the demands for the precision, surface roughness, and service life in machining mechanical parts gradually increase. The metal heat treatment technology can effectively enhance the surface hardness of parts, elevate their strength and wear resistance. 1 As an energy-saving and environmentally friendly high-tech, laser quenching primarily modifies the surface of parts, achieving surface hardening of the components. The laser quenching diagram is shown in Figure 1. Currently, laser quenching is widely applied in various fields, such as aerospace, automotive, marine, medical, and so on. Compared with other heat treatment technologies, the power density of the laser beam is extremely high, which can increase the surface temperature of the workpiece by about 80%. The cooling rate of the surface of the workpiece irradiated by the light spot can reach 109 °C/s, resulting in a refined martensitic structure with high dislocation density on the surface of the hardened layer. Therefore, the comprehensive mechanical properties of the parts are significantly improved. 2 Based on the above characteristics, laser quenching can effectively solve the defects of large residual stress, thermal deformation, coarse grains, and uneven structure of the workpiece, which are inevitable in other heat treatment methods. Gear is one of the most crucial mechanical components, and industrial gears usually operate under high-speed and heavy-duty conditions, which cause severe impact wear and may lead to tooth breakage and fatigue pitting failure. 3 Gear damage not only increases economic losses, but also severely affects its working efficiency. Surface strengthening of gears is a crucial step in ensuring the quality of gears. Having high surface hardness and wear resistance while maintaining great toughness in the core is a sign of qualified gears. Improving the surface quality of gears is an effective way to increase their load-bearing capacity. 4
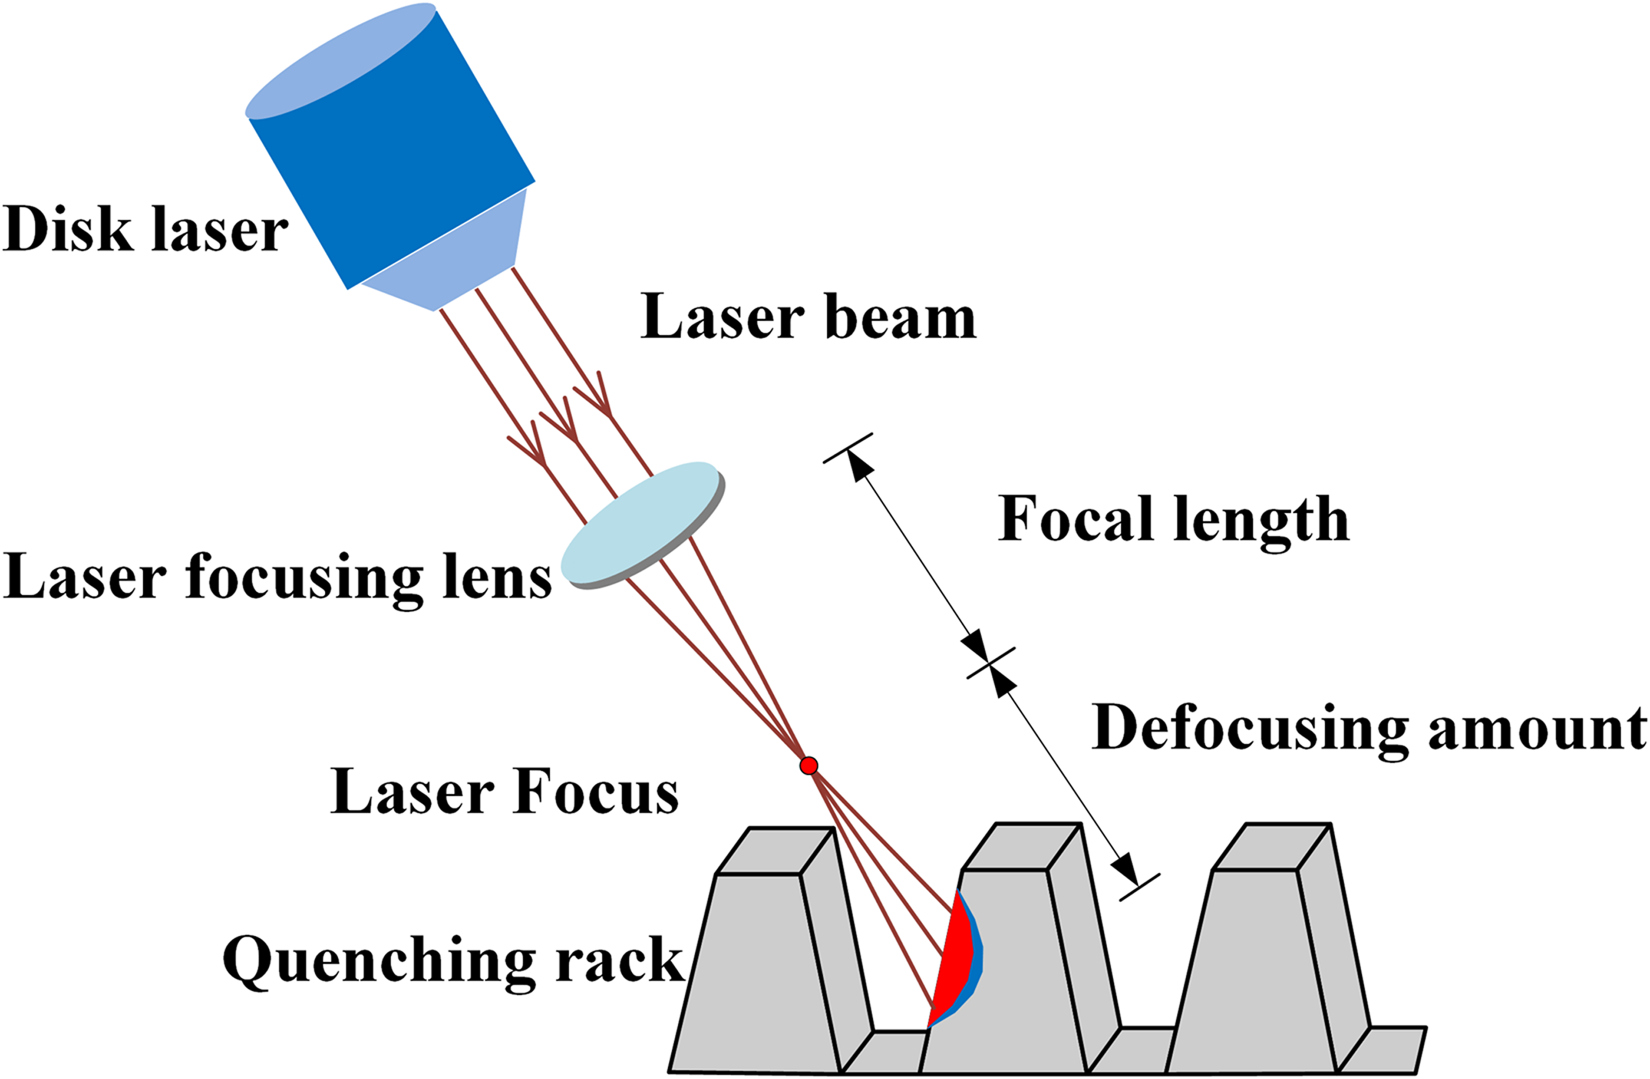
Schematic diagram of laser quenching.
In 2008, McDaniels et al. 5 from the United States conducted surface strengthening of AISI4340 alloy steel through laser quenching technology. The study showed that laser quenching affects the fatigue strength of parts and can prevent the formation for surface cracks. In 2013, Yi et al. 6 conducted a quenching experiment on GCr15 steel using a 400 W fiber laser. They discovered that the fully transformed region was composed of modest martensite and a little residual austenite. At a scanning speed of 0.6 mm/s and zero defocus amount, the quenching hardness reached 960 HV, which is 4.4 times that of the substrate. Compared with the substrate, the wear resistance is significantly improved. In 2018, Sundqvist performed single and multi-pass laser quenching experiments on the surface of a workpiece, the effects of different process parameters on the surface hardness, roughness, and size of the quenched area were compared. 7 In 2020, Li et al. 8 investigated the martensitic organization for grain refinement and proposed a combination of the double quenching and laser quenching process, whose comprehensive mechanical properties were substantially improved. In the same year, Zhen et al. 9 carried out laser quenching experiments on both sides of 40Cr steel gear strips and found that the phenomenon of tempering softening between the two quenched tracks was always unavoidable. In 2021, Han et al. 10 did a numerical simulation of the thermal–force coupling during the laser quenching for the SUS301L-HT stainless steel, and studied the effect of grain inhomogeneity on the distribution for quenching stresses. In the same year, Fischer et al. 11 established a prediction method of residual stress through multiple experiments and accurately evaluated the surface residual stress. Although a large amount of research has been conducted on laser quenching, most of them is focused on the characterization for terminal materials, and cannot obtain the coupling effects and transient laws of multiple physical fields during the quenching. Current numerical simulation studies rarely consider the influence of temperature-dependent material properties and phase transformation-induced plasticity on stress distribution. They cannot effectively reveal the evolution laws of the interaction between the temperature field, phase transformation field, and stress field during the quenching. The influence of process parameters on the laser quenching process is extremely complex, and quantitative analysis of the effects of different process parameters on the laser quenching process is the key to improve quenching quality. 12 Conducting laser quenching experiments on samples is difficult and time-consuming, making it challenging to obtain optimized process parameters. Numerical simulation can effectively compensate for the shortcomings of experimental methods and avoid the waste of energy and materials caused by repeated experiments and attempts. 13 Therefore, it is significant to construct a multi-field coupling model that interconnects the temperature, phase transition, and stress during the laser quenching, as it holds significant implications in optimizing the laser irradiation process parameters of 40Cr steel.
The laser quenching process involves the intersection of multiple disciplines, such as the heat transfer, solid-state phase transformation, solid mechanics, and phase transformation kinetics. The quenching quality is influenced by various factors, including the laser power, scanning speed, and spot diameter. 14 This study is based on the Calculation of Phase Diagram (CALPHAD) method to calculate the thermal and physical parameters of quenching materials, and to establish a multi-field coupling model between temperature-phase transformation-stress during the laser quenching. On this basis, artificial neural network and genetic algorithm are used to accurately predict the size of the backfire zone. The microstructure, hardness distribution and friction and wear properties of 40Cr steel were revealed by laser quenching experiments. Numerical simulation can provide significant theoretical basis for parameter optimization in industrial production, quantitatively revealing the transient evolution mechanism of each field, and has great significance for predicting the residual stress distribution on the tooth surface, preventing the phenomenon of excessive “soft zone” in the overlapping area, and optimizing the quenching process.
Numerical calculation of laser quenching process on 40Cr gear steel
Theoretical basis of laser quenching process modeling
Overall temperature field control equation
The laser quenching process follows the law of energy conservation, and the temperature field changes exhibit typical transient nonlinearity. The temperature conversion methods mainly include three types: the heat conduction, heat convection, and thermal radiation.
15
Assuming that the external environment temperature Text and the initial temperature T0 are both 293.15 K, the total equation for controlling the temperature field during the laser quenching is

Thermal conduction is the primary form of heat transfer, which affects the internal heat transfer and causes the phase transformation hardening during the laser quenching. Its governing equation is expressed using Fourier's law

The boundary conditions consider both convective and radiative heat transfer, and the convective heat flux is expressed using Newton's law of cooling
17

The heat transfer law of convective heat transfer coefficient in different external environments is judged using the Rayleigh number RaL. When the Rayleigh number RaL is below the critical value, the heat transfer mode is mainly thermal conduction. When the Rayleigh number RaL is above the critical value, the heat transfer mode is mainly thermal convection.
18
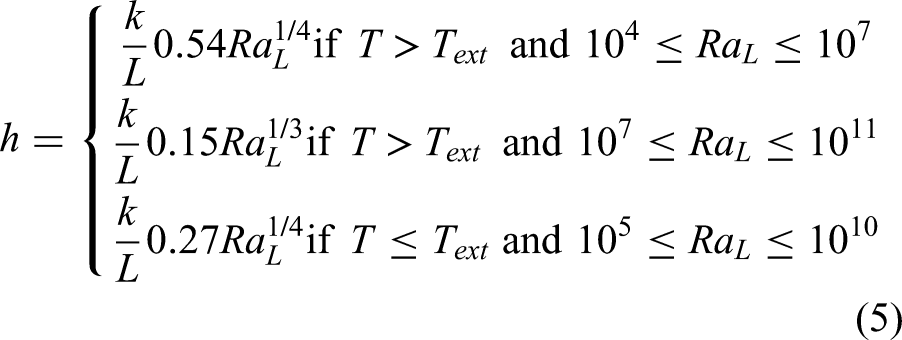
The flow pattern during natural convection is determined by the Rayleigh number RaL. When the temperature of the sample is higher than the external temperature (T > Text), the quenched surface is located directly above the sample, and the convective heat transfer coefficient h can be calculated
During the laser quenching, there is a temperature difference between the substrate and the external environment, and the outward heat radiation is described by the Stefan–Boltzmann equation

Numerical modeling of phase organization transition
After laser quenching, the surface of 40Cr steel undergoes significant phase transformation hardening, primarily due to unevenly distributed needle-shaped martensite and residual austenite.
19
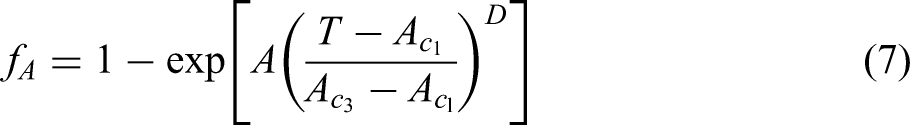
The workpiece undergoes rapid quenching and heating, and is irradiated by the laser beam, and the temperature raises to Ac1, causing austenitization and resulting in an austenite volume fraction of fA
When the workpiece is air-cooled to the martensite transformation temperature Ms, martensitic transformation occurs, and the transformation rate is proportional to the degree of undercooling. The transformation is based on the displacement shear model and is applicable to the Koistinen–Marburger rule,
20
the volume fraction of martensite is fM

Metal phase transformation involves the decomposition of austenite, with each initial phase fraction ξ0 weighted to 1, and the transformation rate is calculated using the Leblond–Devaux formula
21

The thermal, mechanical, and physical properties of the material depend not only on temperature changes, but also on the volume fraction of each phase. Different phase heat transfer and stress distribution affect the final equivalent material properties. In this study, a mixture method is used to calculate the final result by taking the weighted average for properties of each phase based on their respective volume fractions.
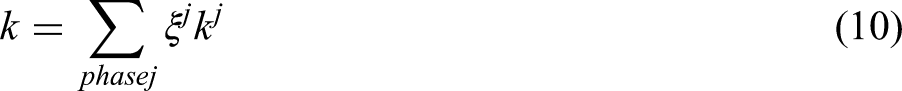
where ∑ is the average weight of the equivalent attribute, ξj is the phase attribute, and kj is the volume content of the phase.
Mechanical analysis of laser quenching process
The 40Cr steel belongs to a continuum, and the strain at a certain point can be regarded as the sum of the elastic strain, total plastic strain, microstructural strain, and thermal strain.
22
The total strain equation is

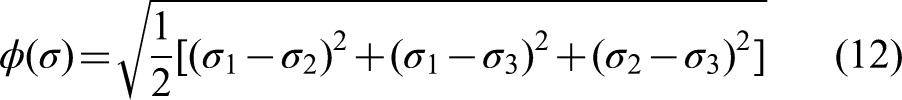
According to the fourth strength theory, yielding occurs when the unit distortion reaches the critical value. The elastic-plastic constitutive model employs the von-Mises yield criterion, the stress is
23
When the deformation is unobvious, the stress can be expressed as a linear combination with the strain, the elastic deformation is described by Hooke's law
24

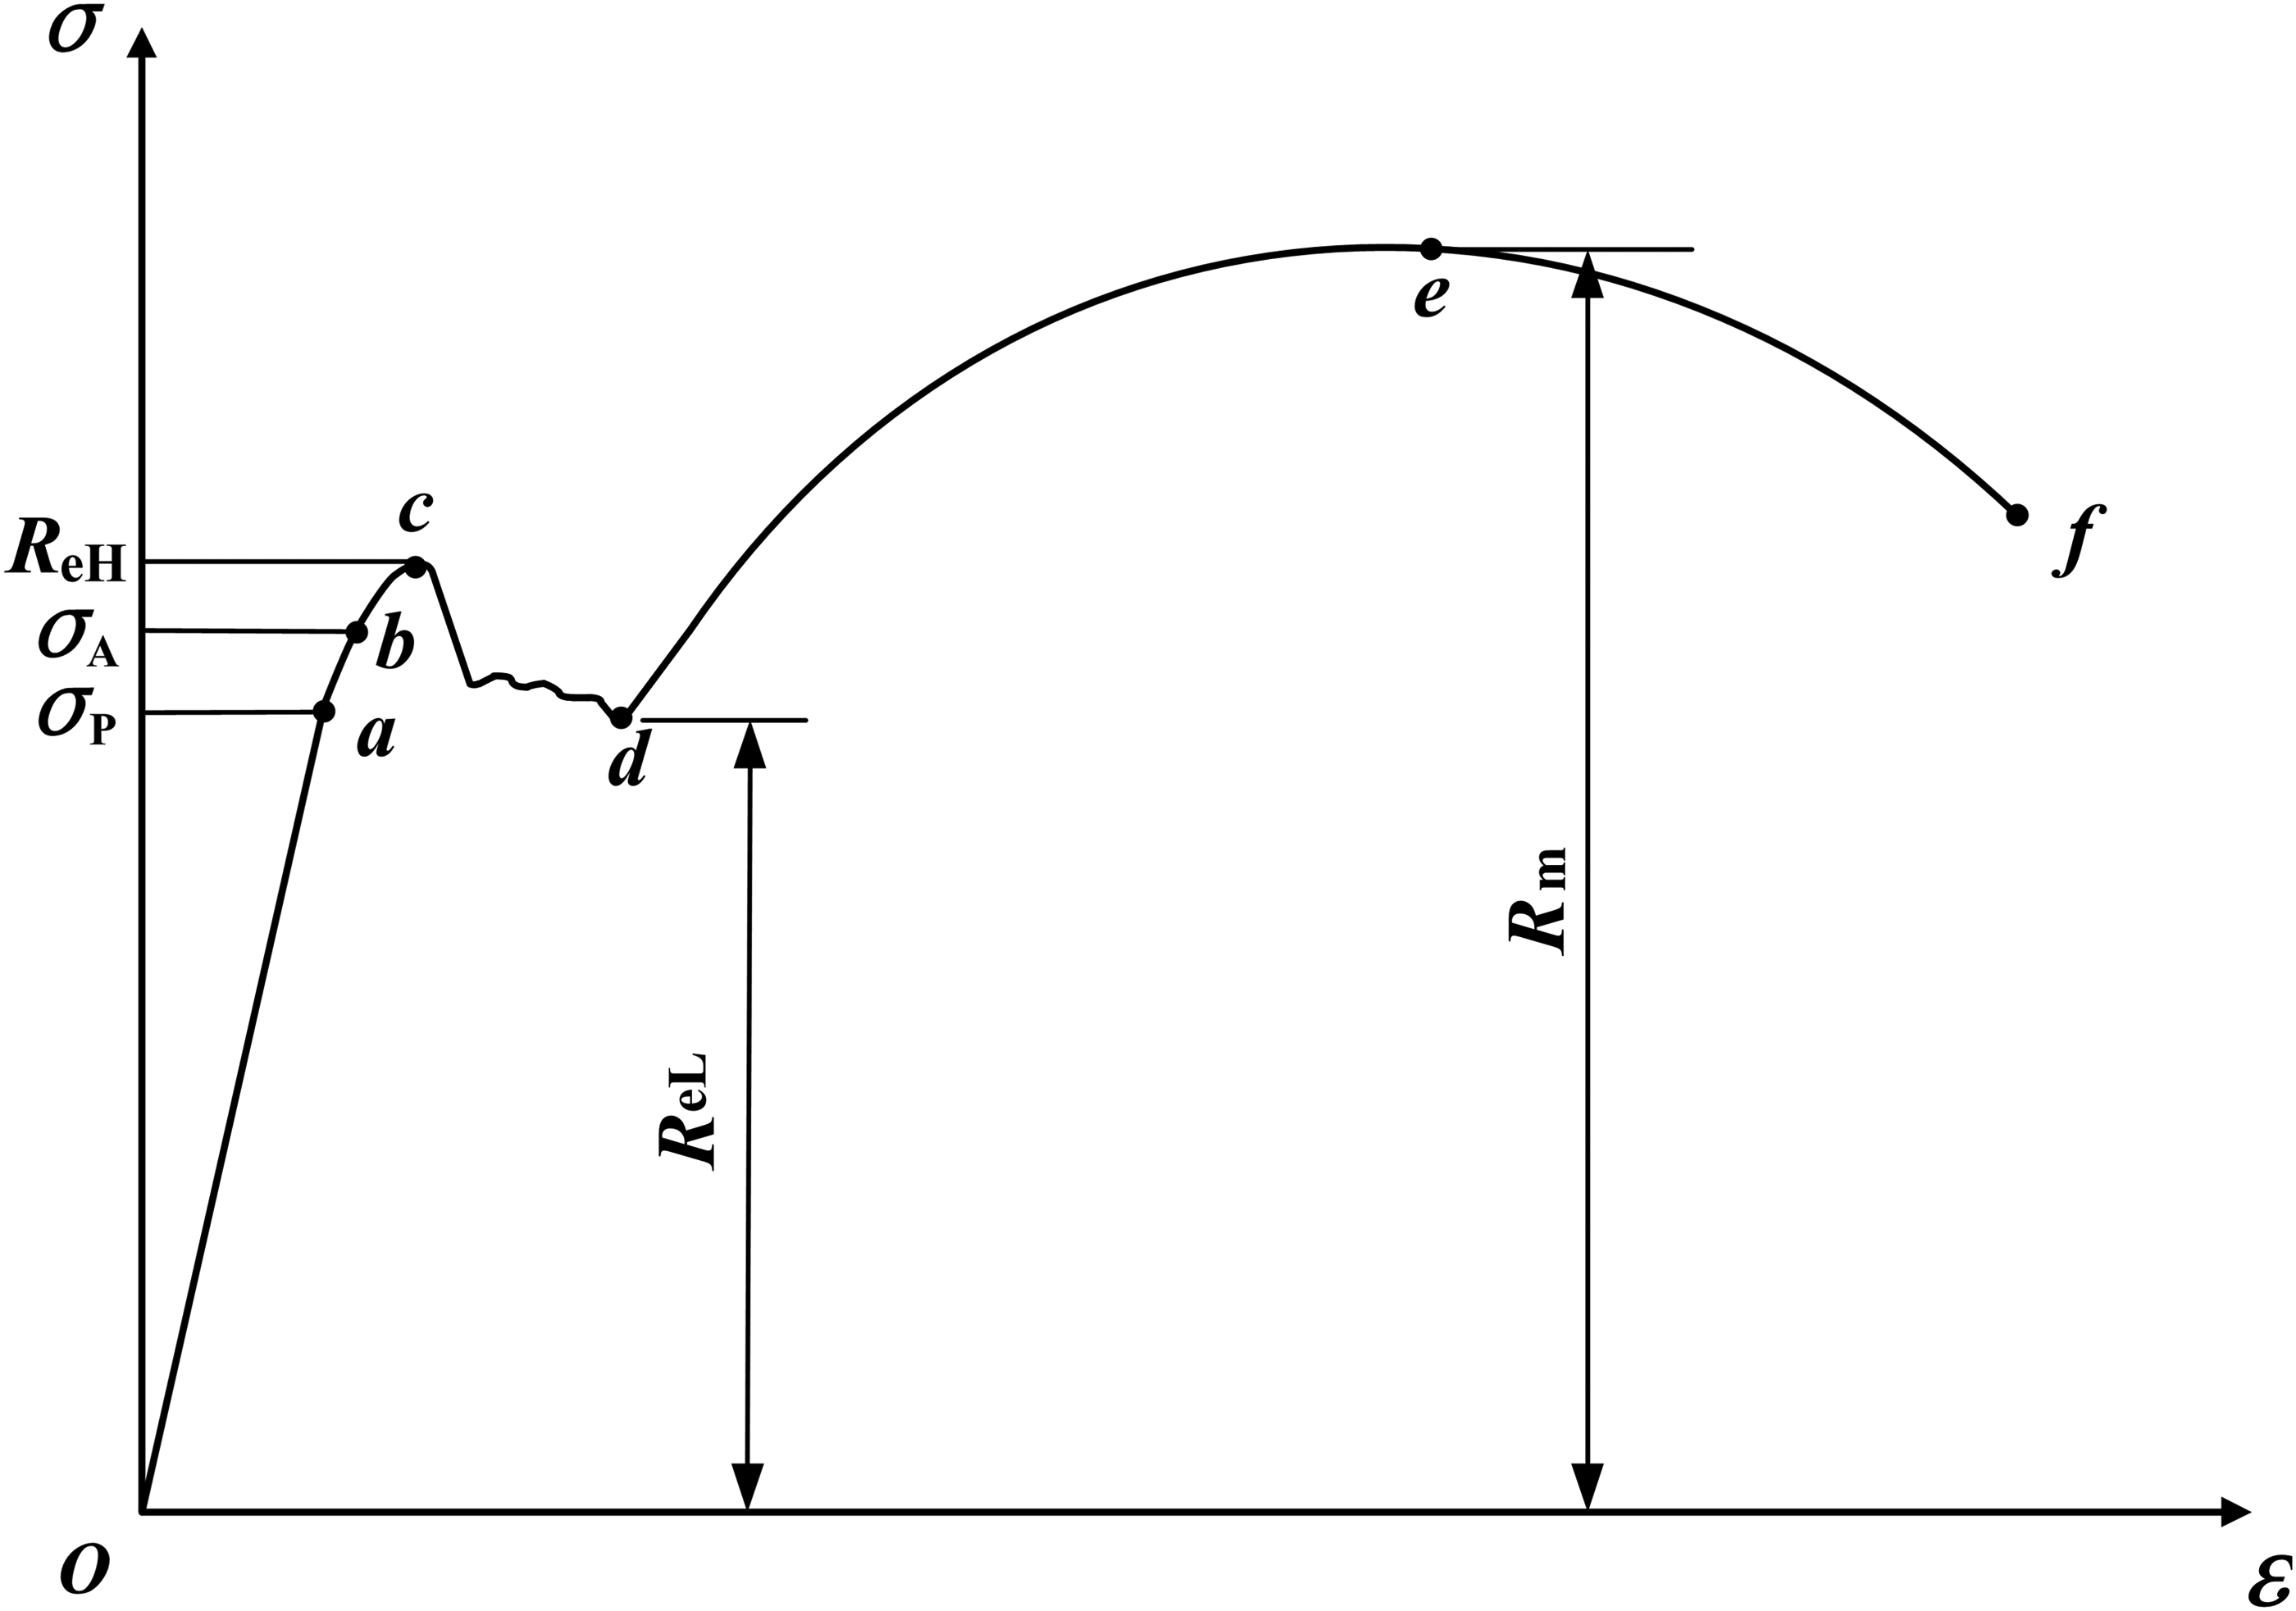
When the stress exceeds σs, significant plastic deformation of the material occurs, which is necessarily accompanied by stress elevation if the surface strain of the workpiece increases significantly. The phenomenon of increasing plastic deformation and consequent increasing plastic stress is called work hardening, where the stress–strain curve is shown in Figure 2. From o to a is the elastic deformation stage. From a to b is the elastic deformation stage and the strain energy is fully returned to the initial position. From b to c is the microplastic phase transformation stage. From c to d is the yielding stage. Point d is the yield point and d to e is the plastic hardening stage. When the stress exceeds point e the specimen is deformed, from e to f is the necking deformation stage. 25 Therefore, the hardening model is chosen to be nonlinearly isotropic.
Stress–strain curve.
In the nonlinear isotropic hardening model, the yield stress is
26


Due to the difference in cooling rates between the surface and interior of the test piece, the stress is generated within the workpiece, leading to phase transformation and transformation-induced plasticity (TRIP). 27 Therefore, the calculation of quenching stress cannot ignore the TRIP effect. The occurrence of transformation-induced plasticity can increase the hardening rate of metal processing, preventing stress relaxation, and effectively suppress the necking phenomenon. It can also alleviate concentrated stress and prevent the occurrence of cracks within the workpiece. 28
The plastic strain induced by phase transformation is a result of the continuous accumulation for plasticity, which leads to plastic deformation as the yield limit is reached. The increment of plastic strain can be expressed as follows

Where the phase tissue strain and thermal strain increments are
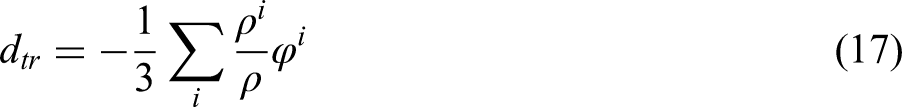
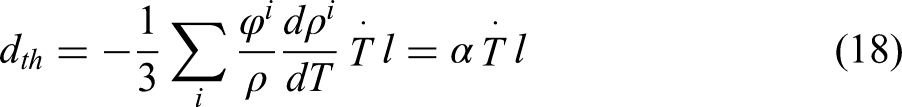
where ρ is the material density, ρi is the material density, φi is the phase fraction,
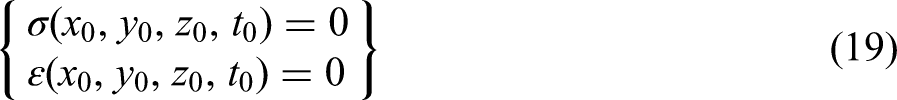
The initial stress condition is
Overlap rate setting
Figure 3 shows the schematic diagram of the overlapping for two adjacent laser spots, where the shaded area represents the laser overlapping region. The calculation method for the overlapping rate is the ratio of the overlapping width H to the diameter D of the spot, as shown in equation (19).

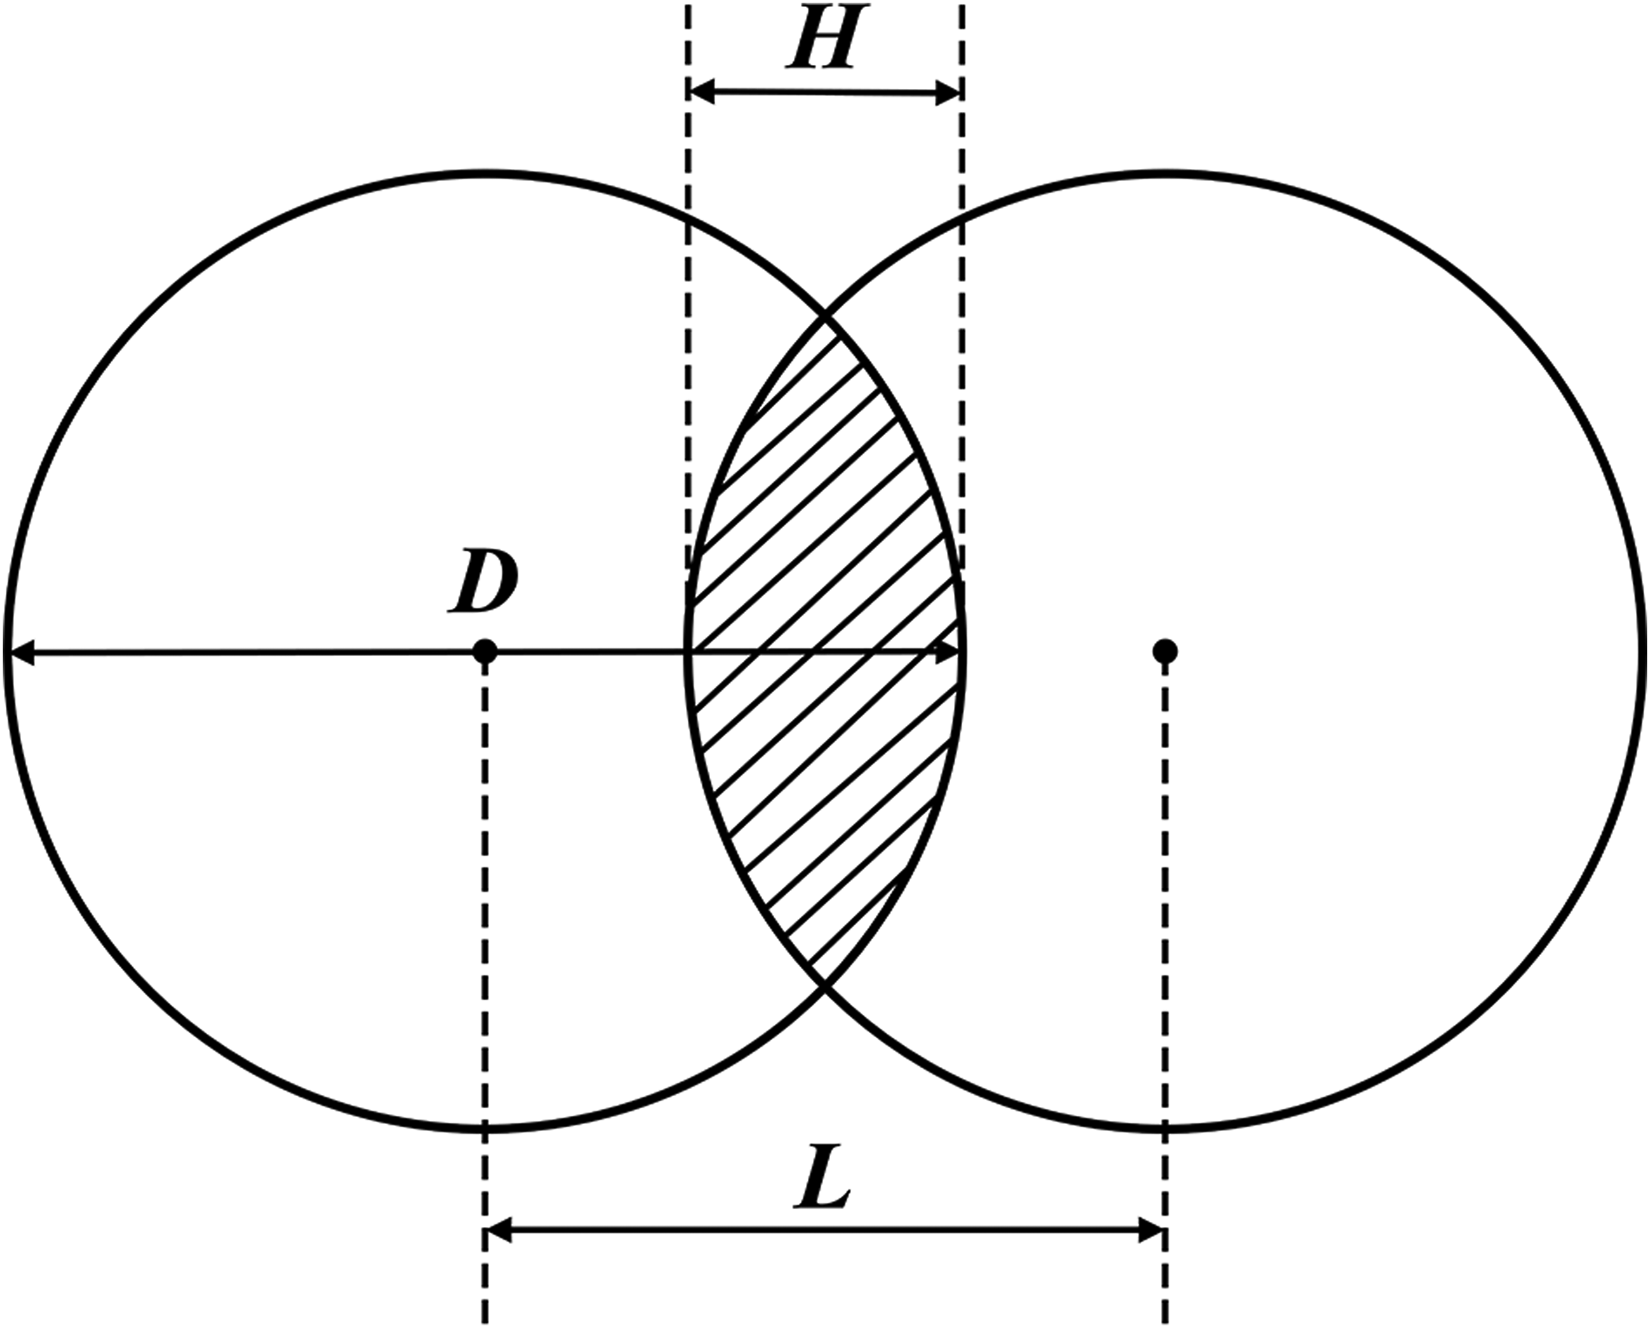
Schematic diagram of laser overlapping.
Numerical modeling of multi-field coupling for laser quenching
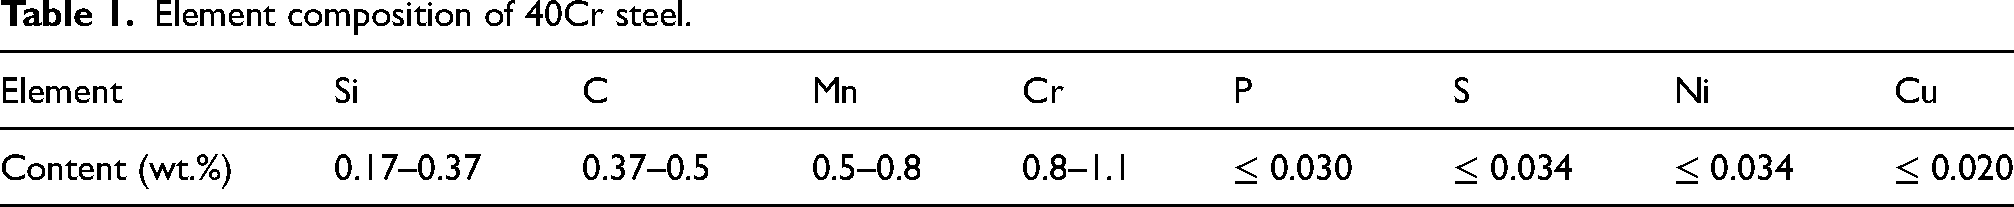
The elemental composition of 40Cr steel is shown in Table 1. The physical properties of 40Cr steel have a strong dependence on temperature, and its temperature-dependent function belongs to a complex nonlinear function. The rapid temperature change during the laser quenching has a significant impact on the physical parameters. The density, specific heat capacity, Poisson's ratio, thermal conductivity, and Young's modulus of 40Cr steel were calculated using the CALPHAD (Calculation of Phase Diagram) method, and the temperature-dependent curves and phase transition curves are shown in Figure 4. In this study, a rectangular geometry model with dimensions of 50 mm × 50 mm × 10 mm was established using nonlinear solving software. The overall geometry model adopts a free tetrahedral mesh, where the temperature rapidly changes and the temperature gradient is large near the laser spot. Local mesh refinement is required to ensure the convergence and accuracy of the calculation. The geometry model contains a total of 81,766 domain elements, 6722 boundary elements, and 265 edge elements, the curvature factor is 0.3 and the maximum element growth rate is 1.35. The 3D mesh model is shown in Figure 5. The laser spot scans along the positive y-axis from the edge of the model, and the subsequent laser scans parallel to the previous laser path at equal intervals. The scanning path of the spot is shown in Figure 6. The calculations were performed using a DELL T5600 tower workstation with 12 cores and the transient fully coupled solver configuration. The time step was set to 0.1 s, the tolerance factor was 0.1, and the relative tolerance was 0.001 s. The Jacobian substrate was updated once per time step to improve the convergence of the calculation. Multiple laser quenching numerical simulations were performed using a laser power of 3000 W, a spot diameter of 10 mm, a scanning speed of 50 mm/s, and a laser overlapping rate of 40%. The results at different time nodes during the laser quenching were exported, and the post-processing module was used to draw the temperature, stress, and phase transition curves for summary analysis.
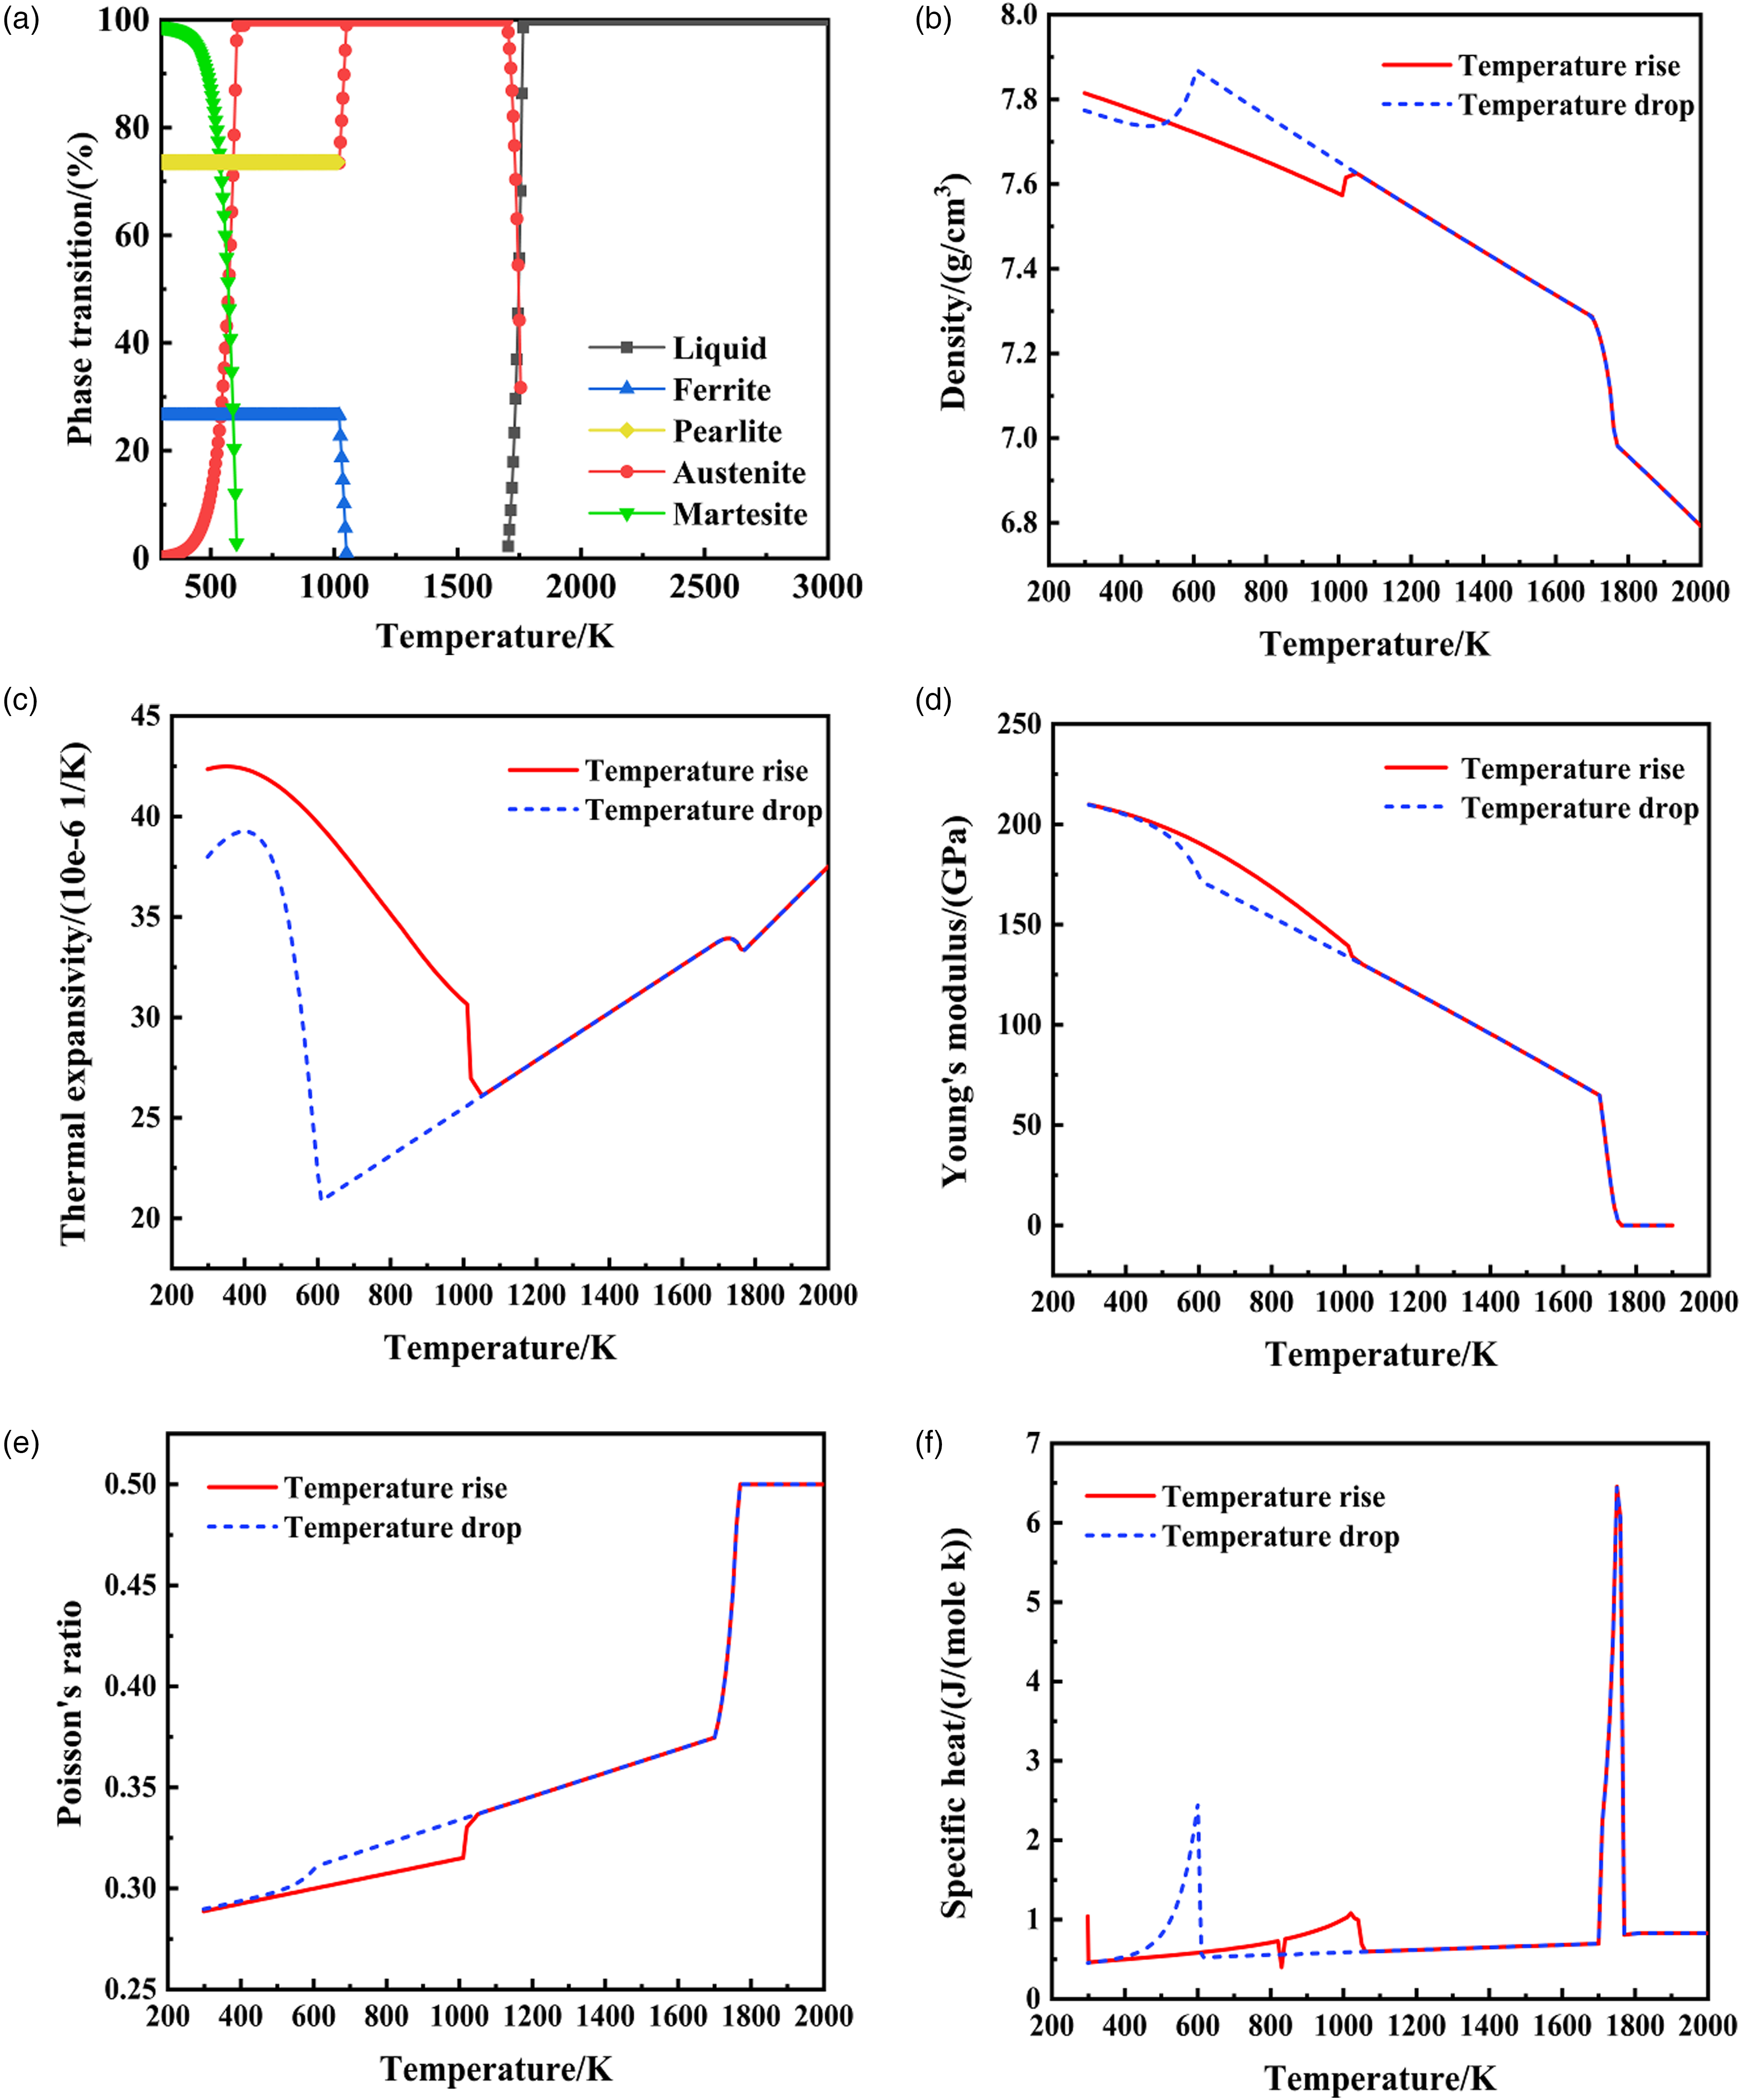
Phase transformation curve of 40Cr steel and physical property parameters with temperature: (a) phase transformation of 40Cr steel with temperature, (b) density of 40Cr steel with temperature, (c) thermal expansivity of 40Cr steel with temperature, (d) Young's modulus of 40Cr steel with temperature, (e) Poisson's ratio of 40Cr steel with temperature, and (f) specific heat of 40Cr steel with temperature.
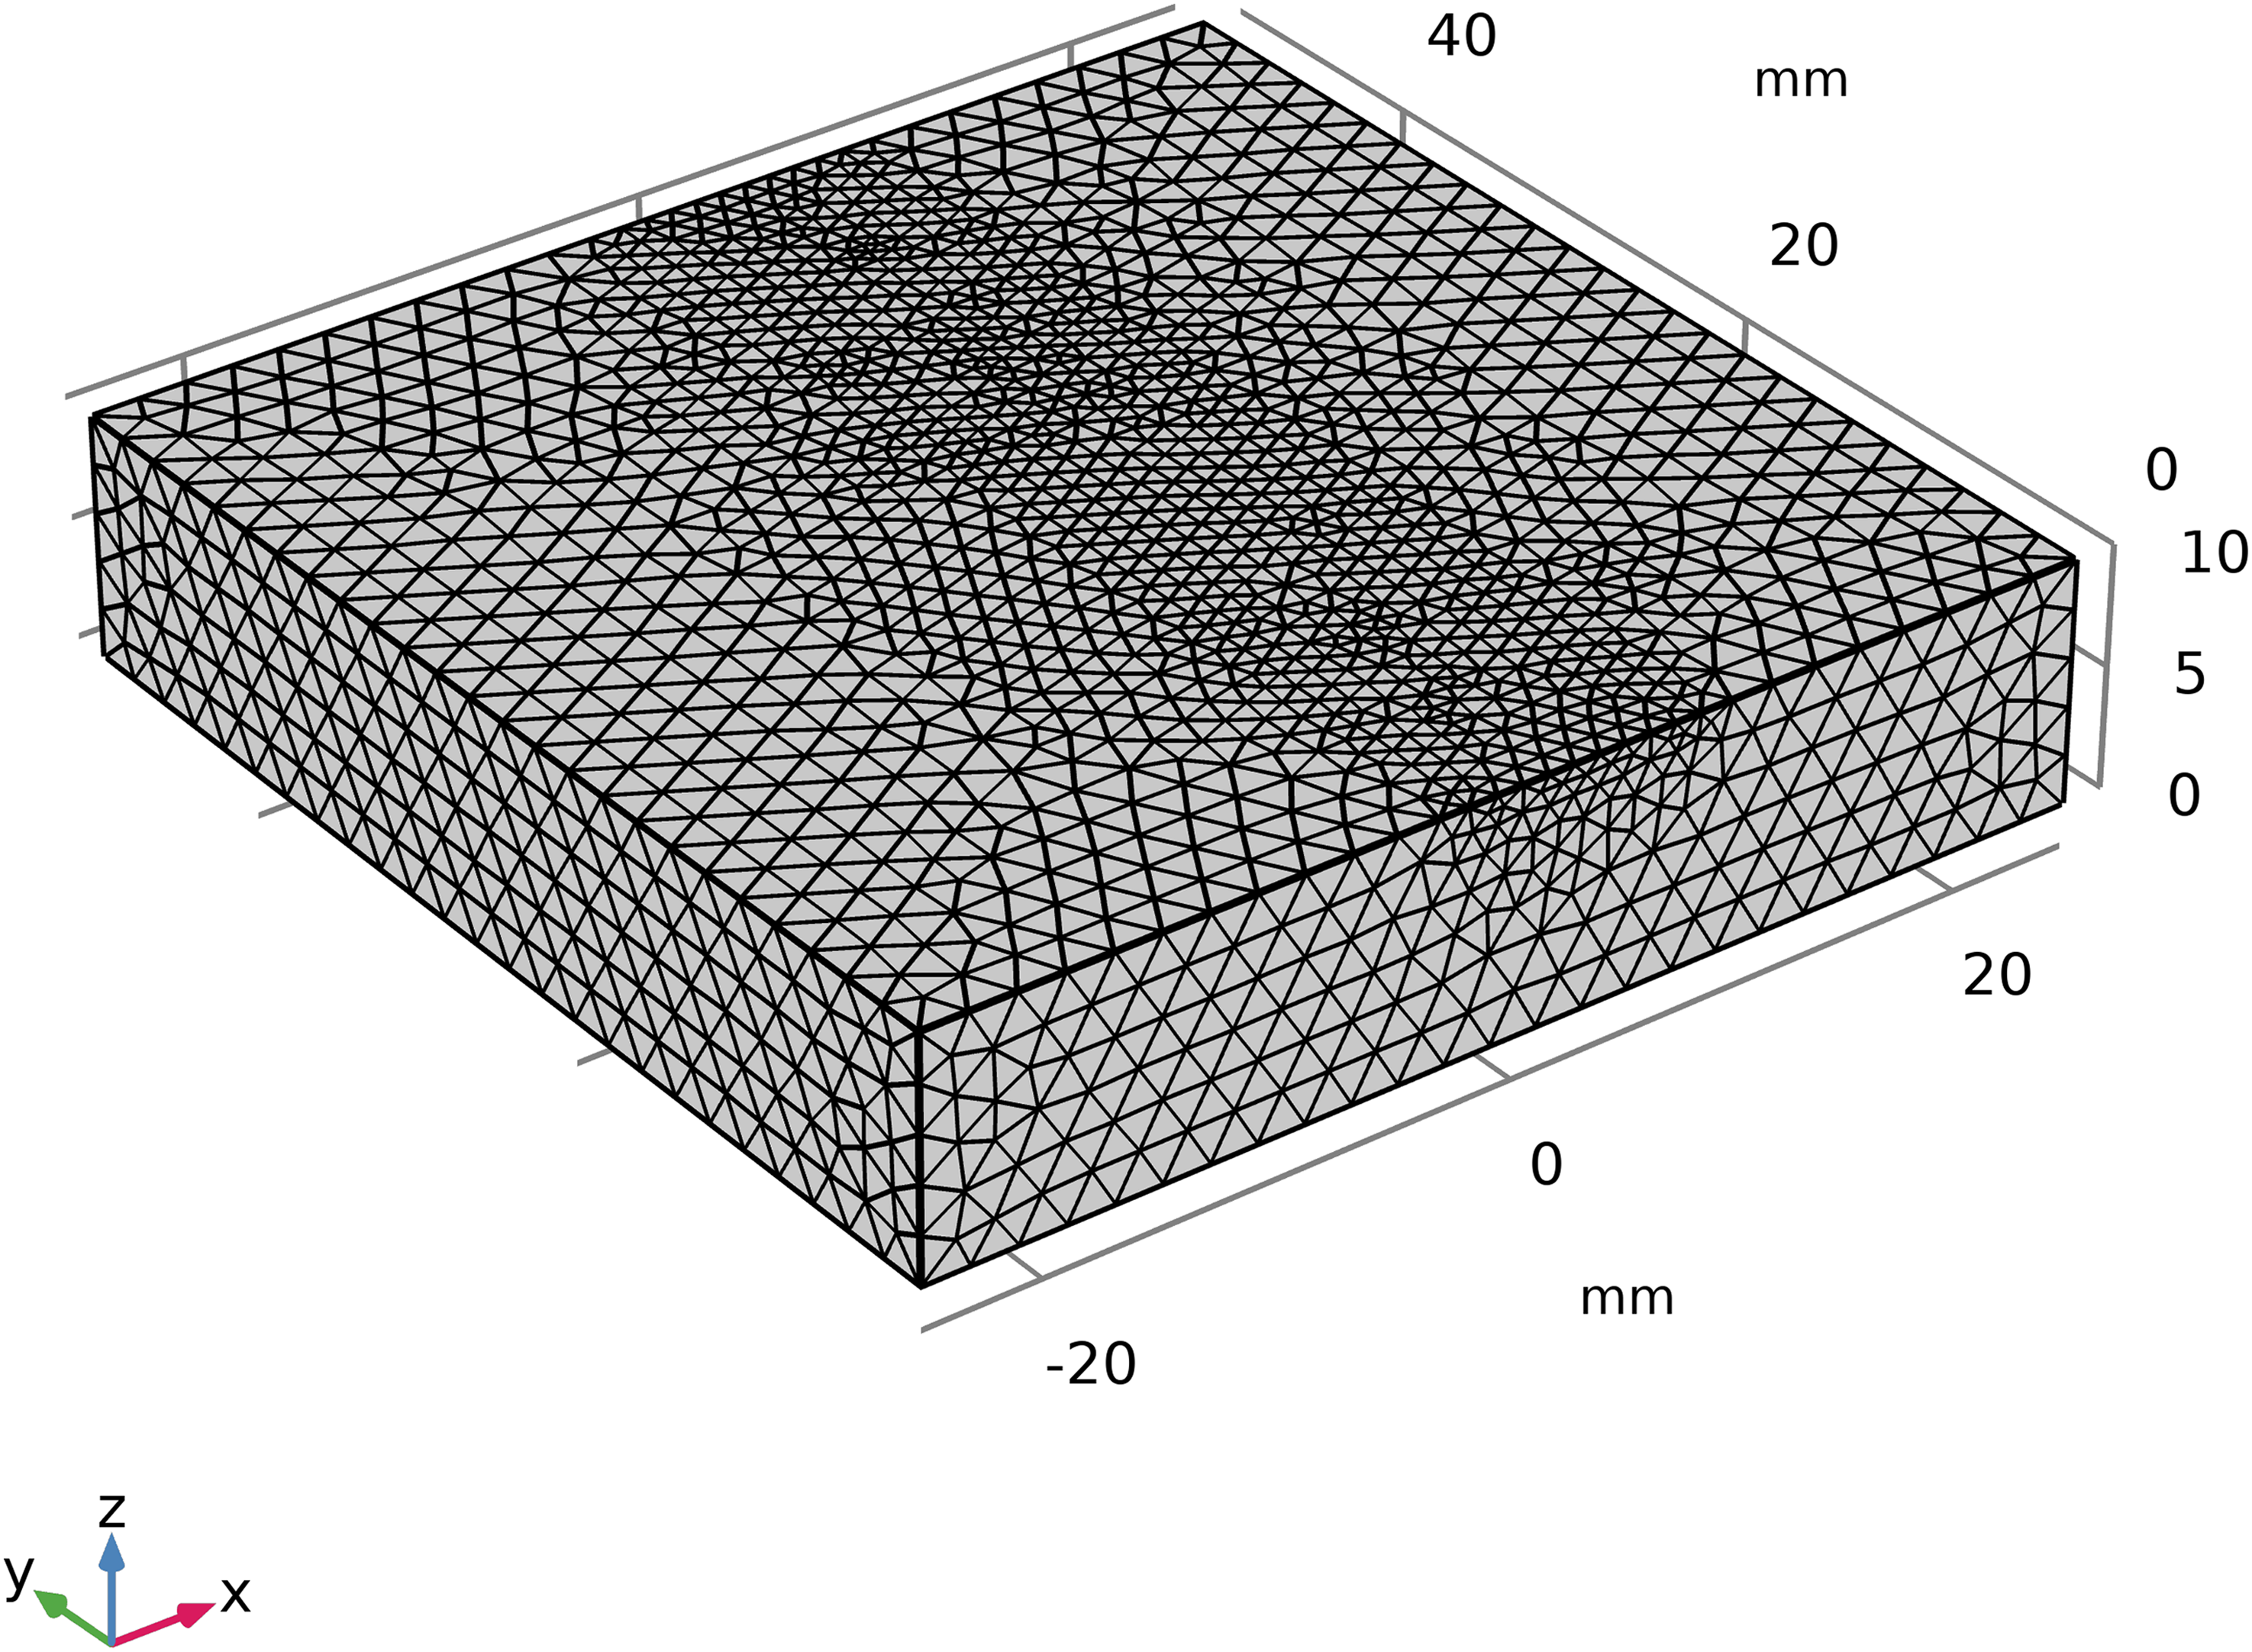
Meshing of laser quenching three-dimensional model.
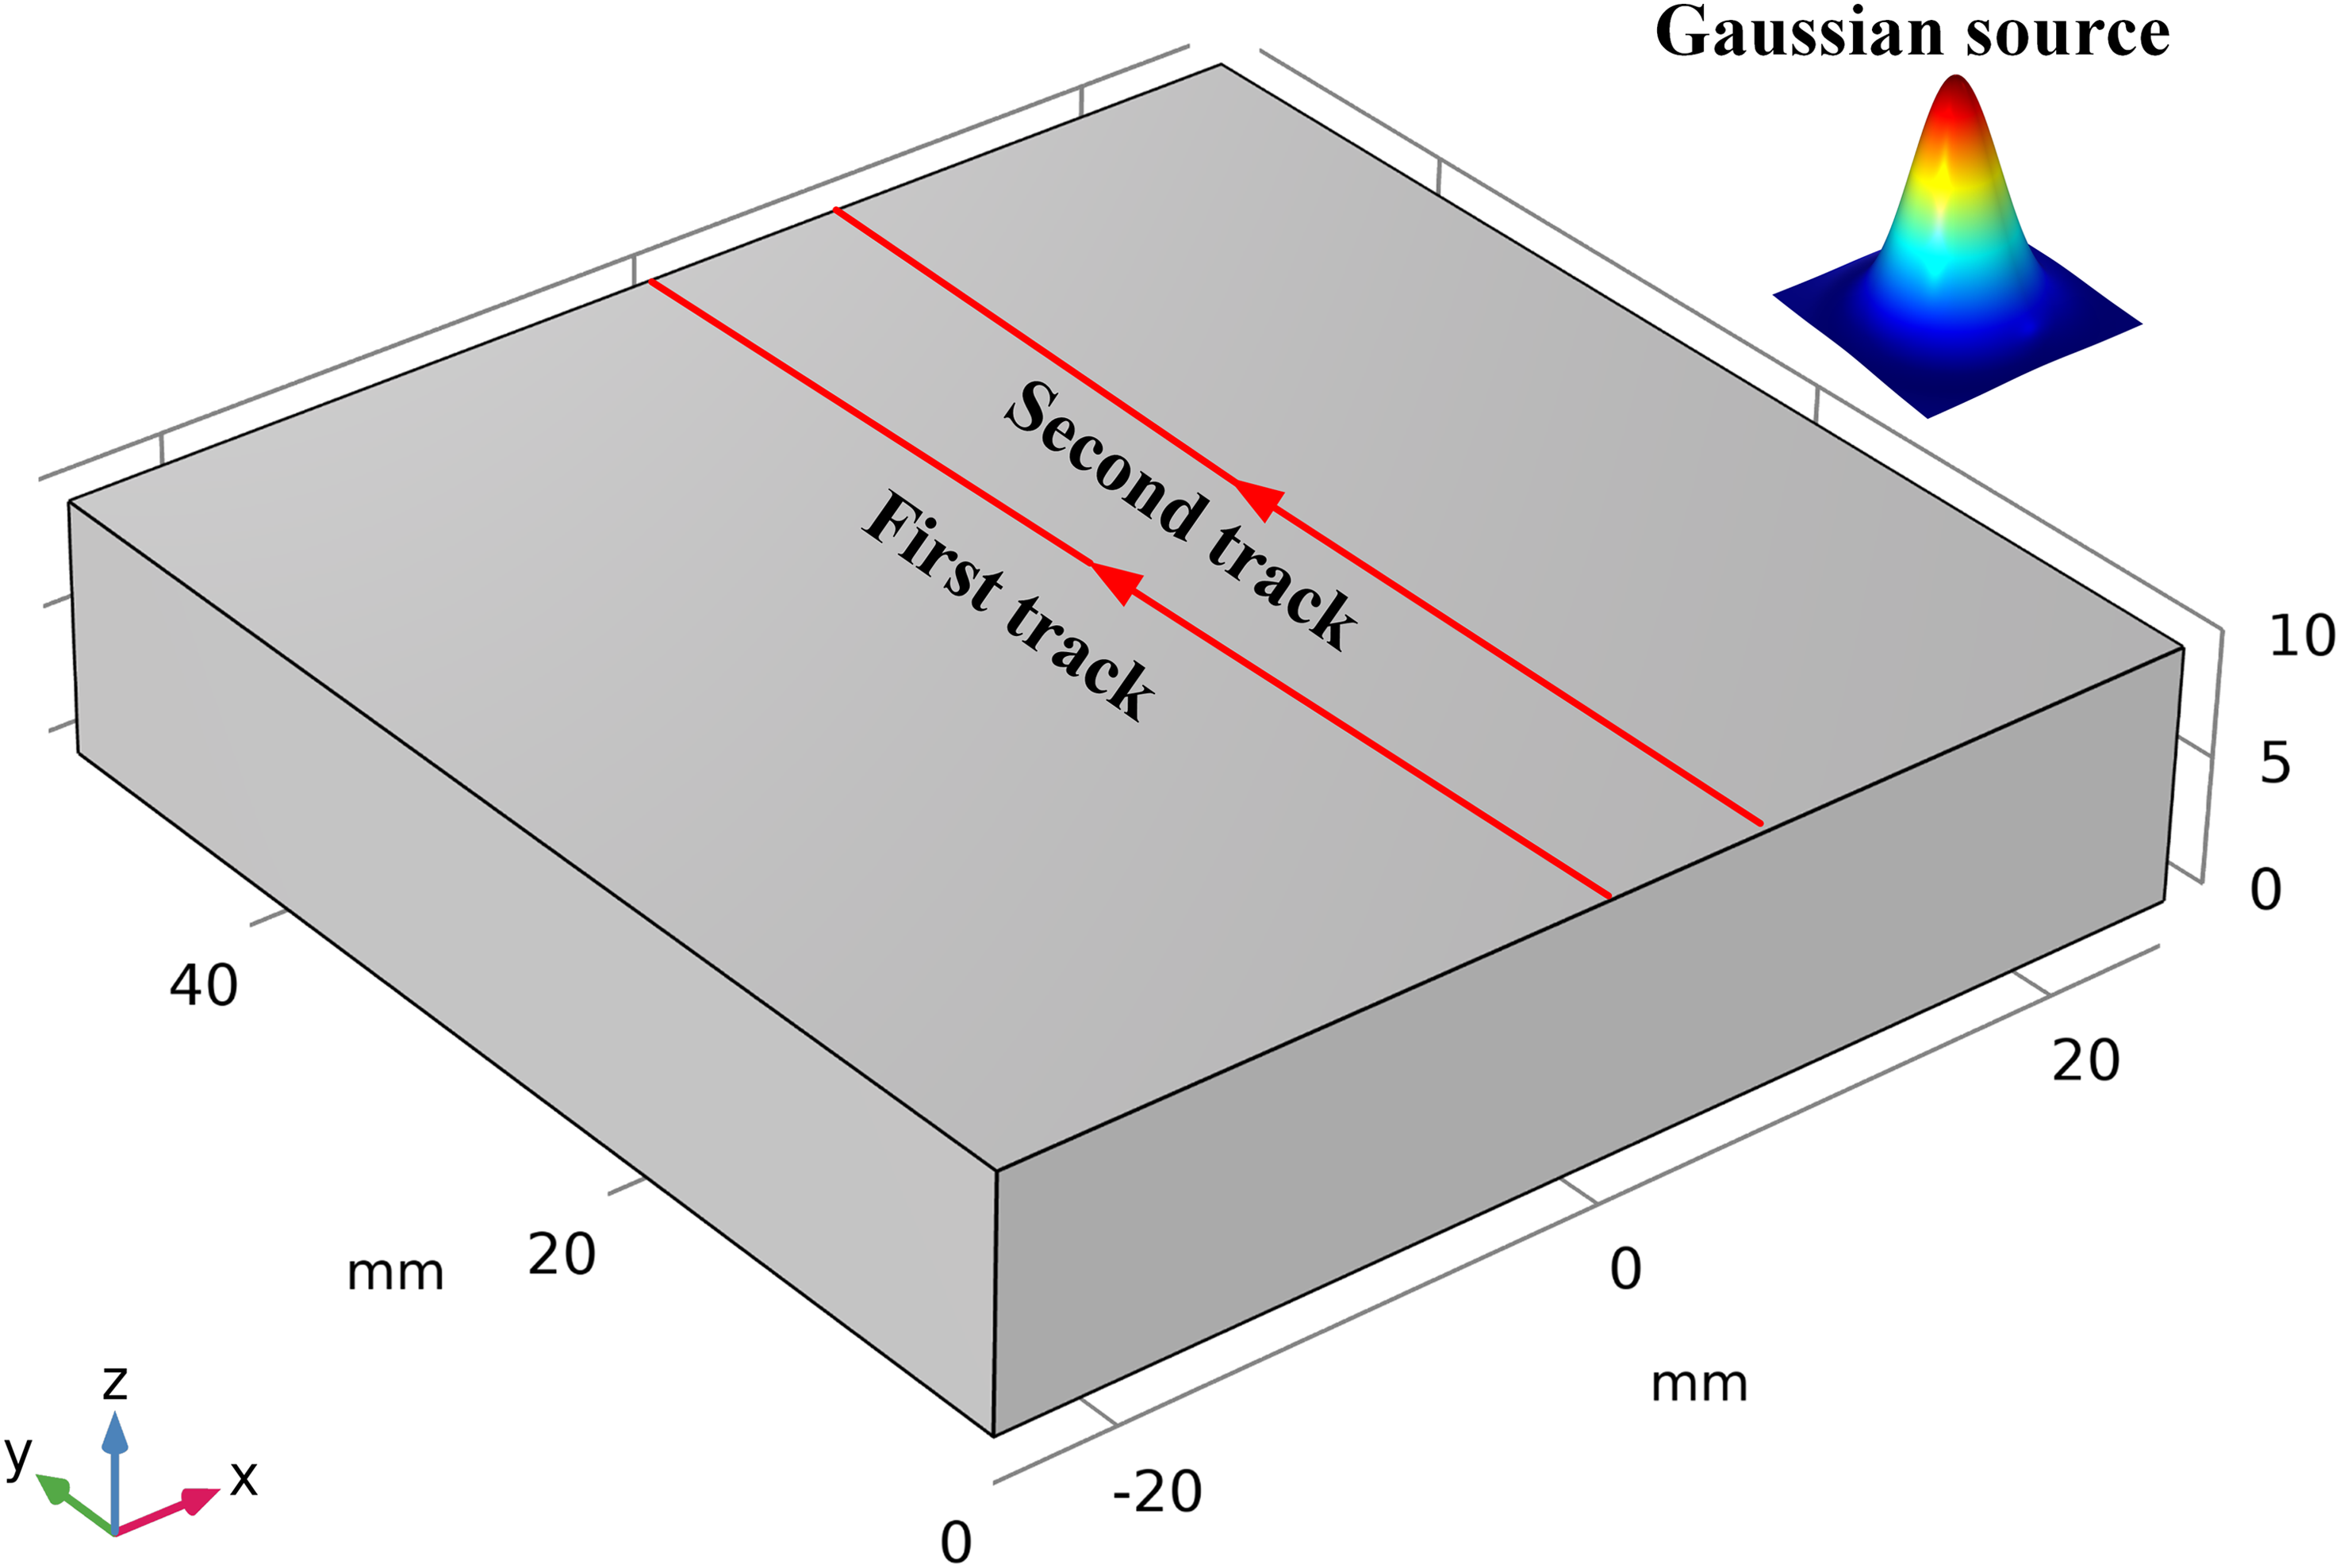
Laser quenching spot scanning path.
Element composition of 40Cr steel.
Numerical calculation of laser quenching process for 40Cr steel
Temperature field calculation results
Due to the close relationship between the laser quenching phase transformation, stress distribution, and the magnitude of the workpiece temperature, obtaining precise transient temperature distribution is of paramount significance. Taking an overlap rate of 40% as an example, the temperature field results of laser quenching at different times are calculated, as shown in Figure 7. The calculation indicates that the temperature change law of the back-end laser and the front-end laser is completely consistent. As the rear spot continuously moves forward, a significant thermal influence zone is generated on the surface of the workpiece, with the highest temperature reaching 1247 K. The isotherms form a distinct “teardrop” distribution, decreasing outwardly from the center of the spot and becoming denser along the scanning direction and sparser in the opposite direction. At t = 10 s, the rear laser begins to scan, and due to the thermal accumulation effect of the workpiece, the temperature peak of the rear laser scanning path is higher than that in the front laser scanning path. At t = 11 s, the laser leaves the surface of the workpiece, and the substrate begins to cool. At t = 11.5 s, the highest temperature of the workpiece has dropped to 454.8 K. At t = 1200 s, the temperature has cooled to 303.1 K. This indicates that the laser quenching process has a significant heating and cooling rate, and numerical simulation can quantitatively reveal the instantaneous temperature evolution process of laser quenching process.
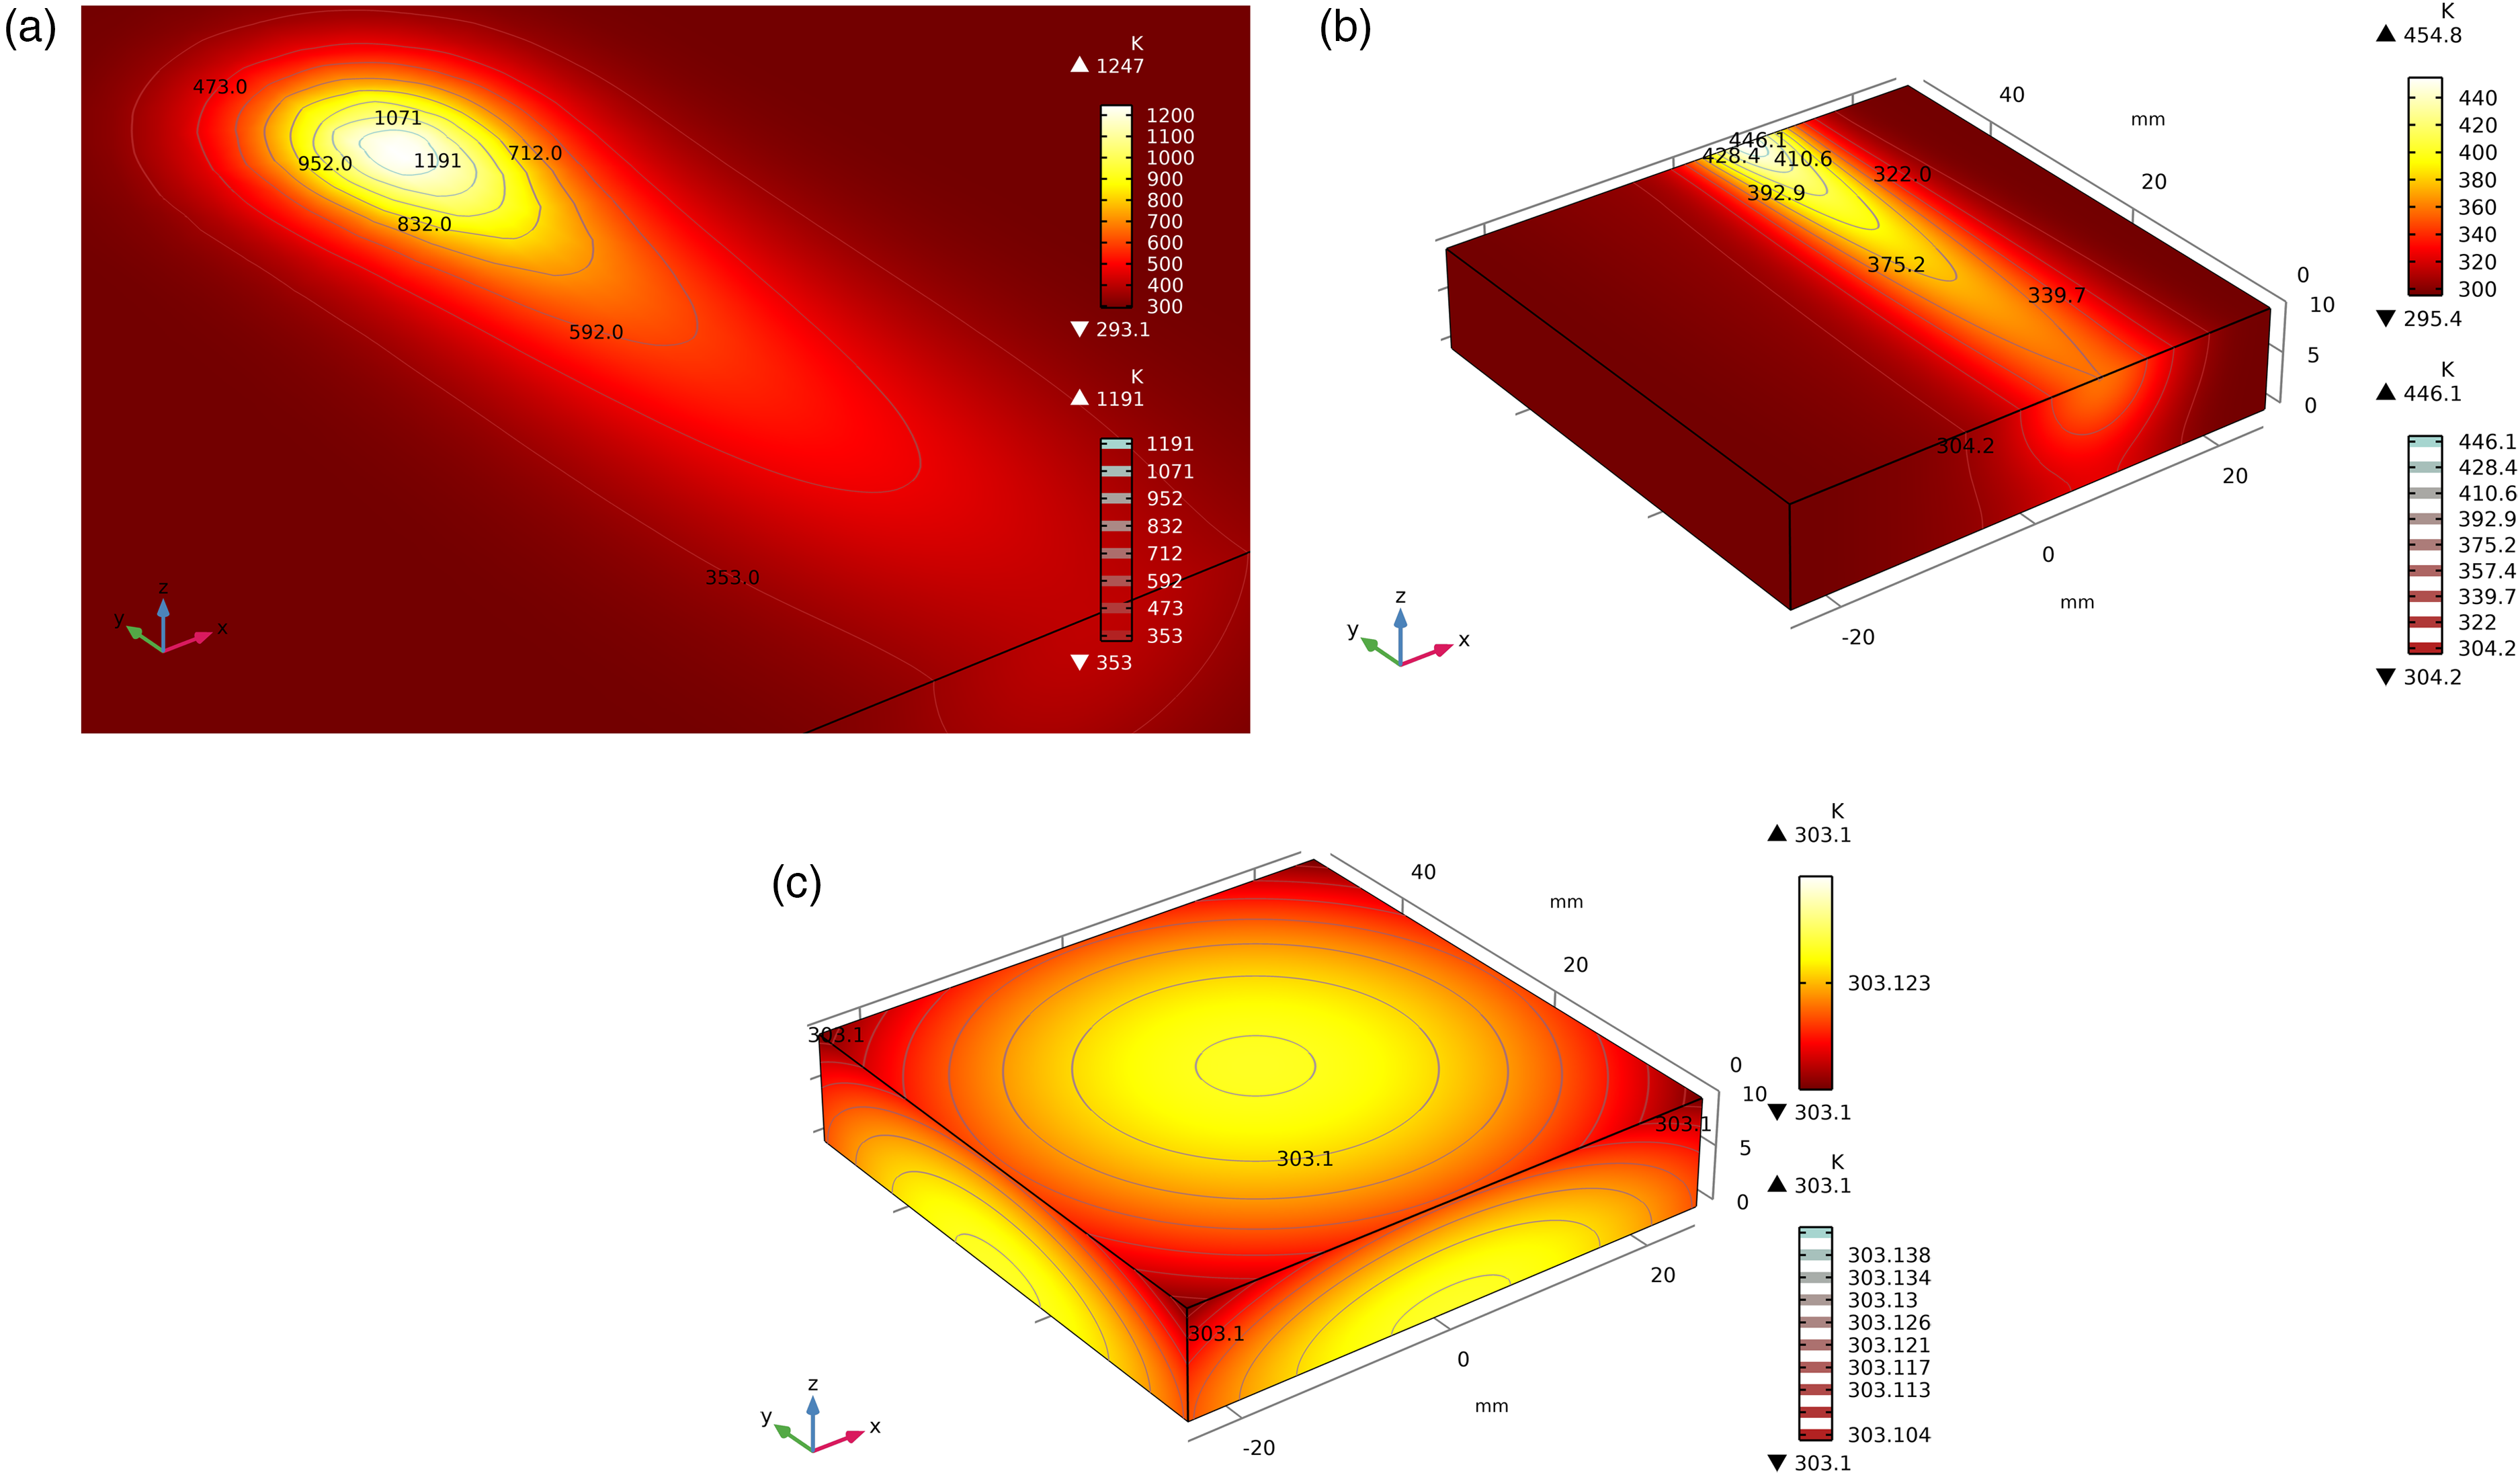
Laser quenching transient temperature change cloud diagram: (a) laser quenching temperature contour distribution at t = 0.5 s, (b) laser quenching temperature contour distribution at t = 11.5 s, and (c) laser quenching temperature contour distribution at t = 1200 s.
According to the acquisition track in Figure 8, the calculation results were extracted, temperature, stress and phase transition curves were drawn, and quantitative analysis was carried out. Collection line 1 is located at the center position of the rear laser scanning, and the temperature curve from 10 to 11 s shows a clear unimodal distribution with a greater heating gradient than cooling gradient, as shown in Figure 9(a). Among them, the surface temperature is slightly larger than the temperature over the previous laser sweep, and the peak increases gradually with time, which is due to the thermal accumulation effect of the higher temperature retained at the position swept by the laser. Figure 9(b) shows the temperature variation curve along collection line 3 at different overlap ratios. The calculation indicates that the temperature distribution along the center position of the spot is obvious Gaussian. The surface temperature of the substrate gradually increases with the increase of the overlap ratio. Due to the influence of the latter laser, new peak points appear on the already cooled surface, and the substrate experiences two sudden temperature rise and fall processes on the laser lap, which has a great impact on the substrate tissue change and residual stress.
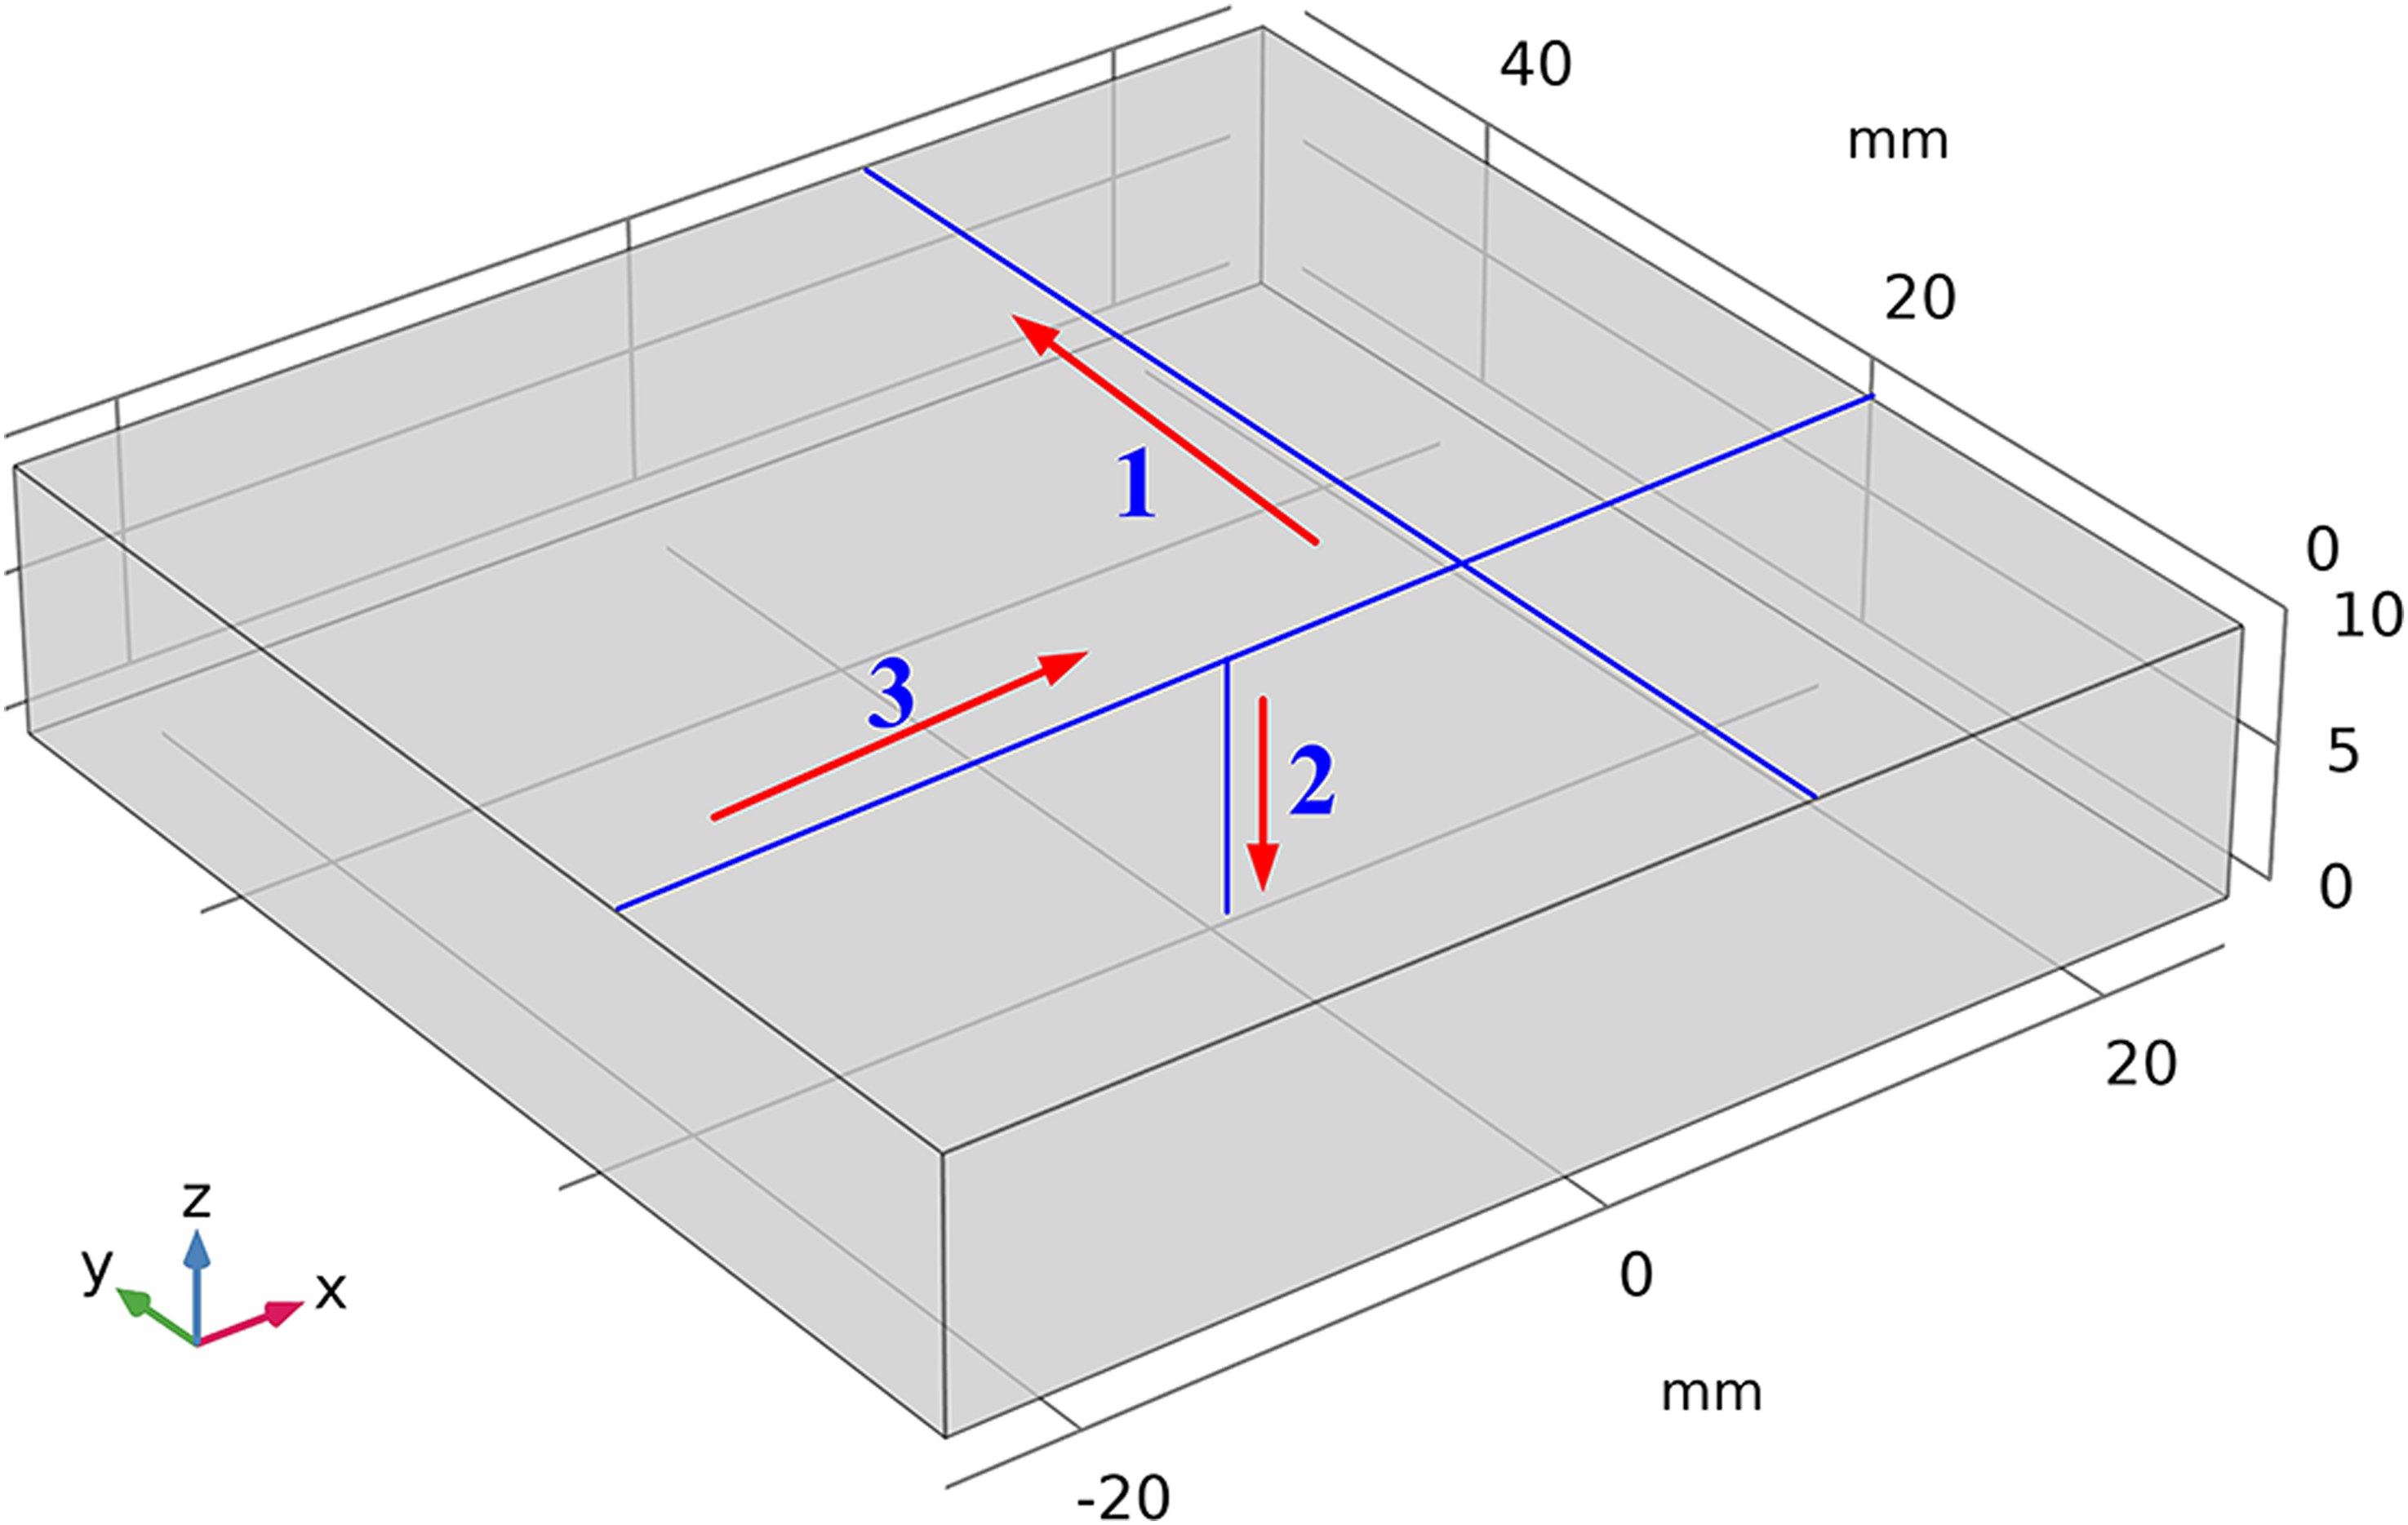
Data collection line.
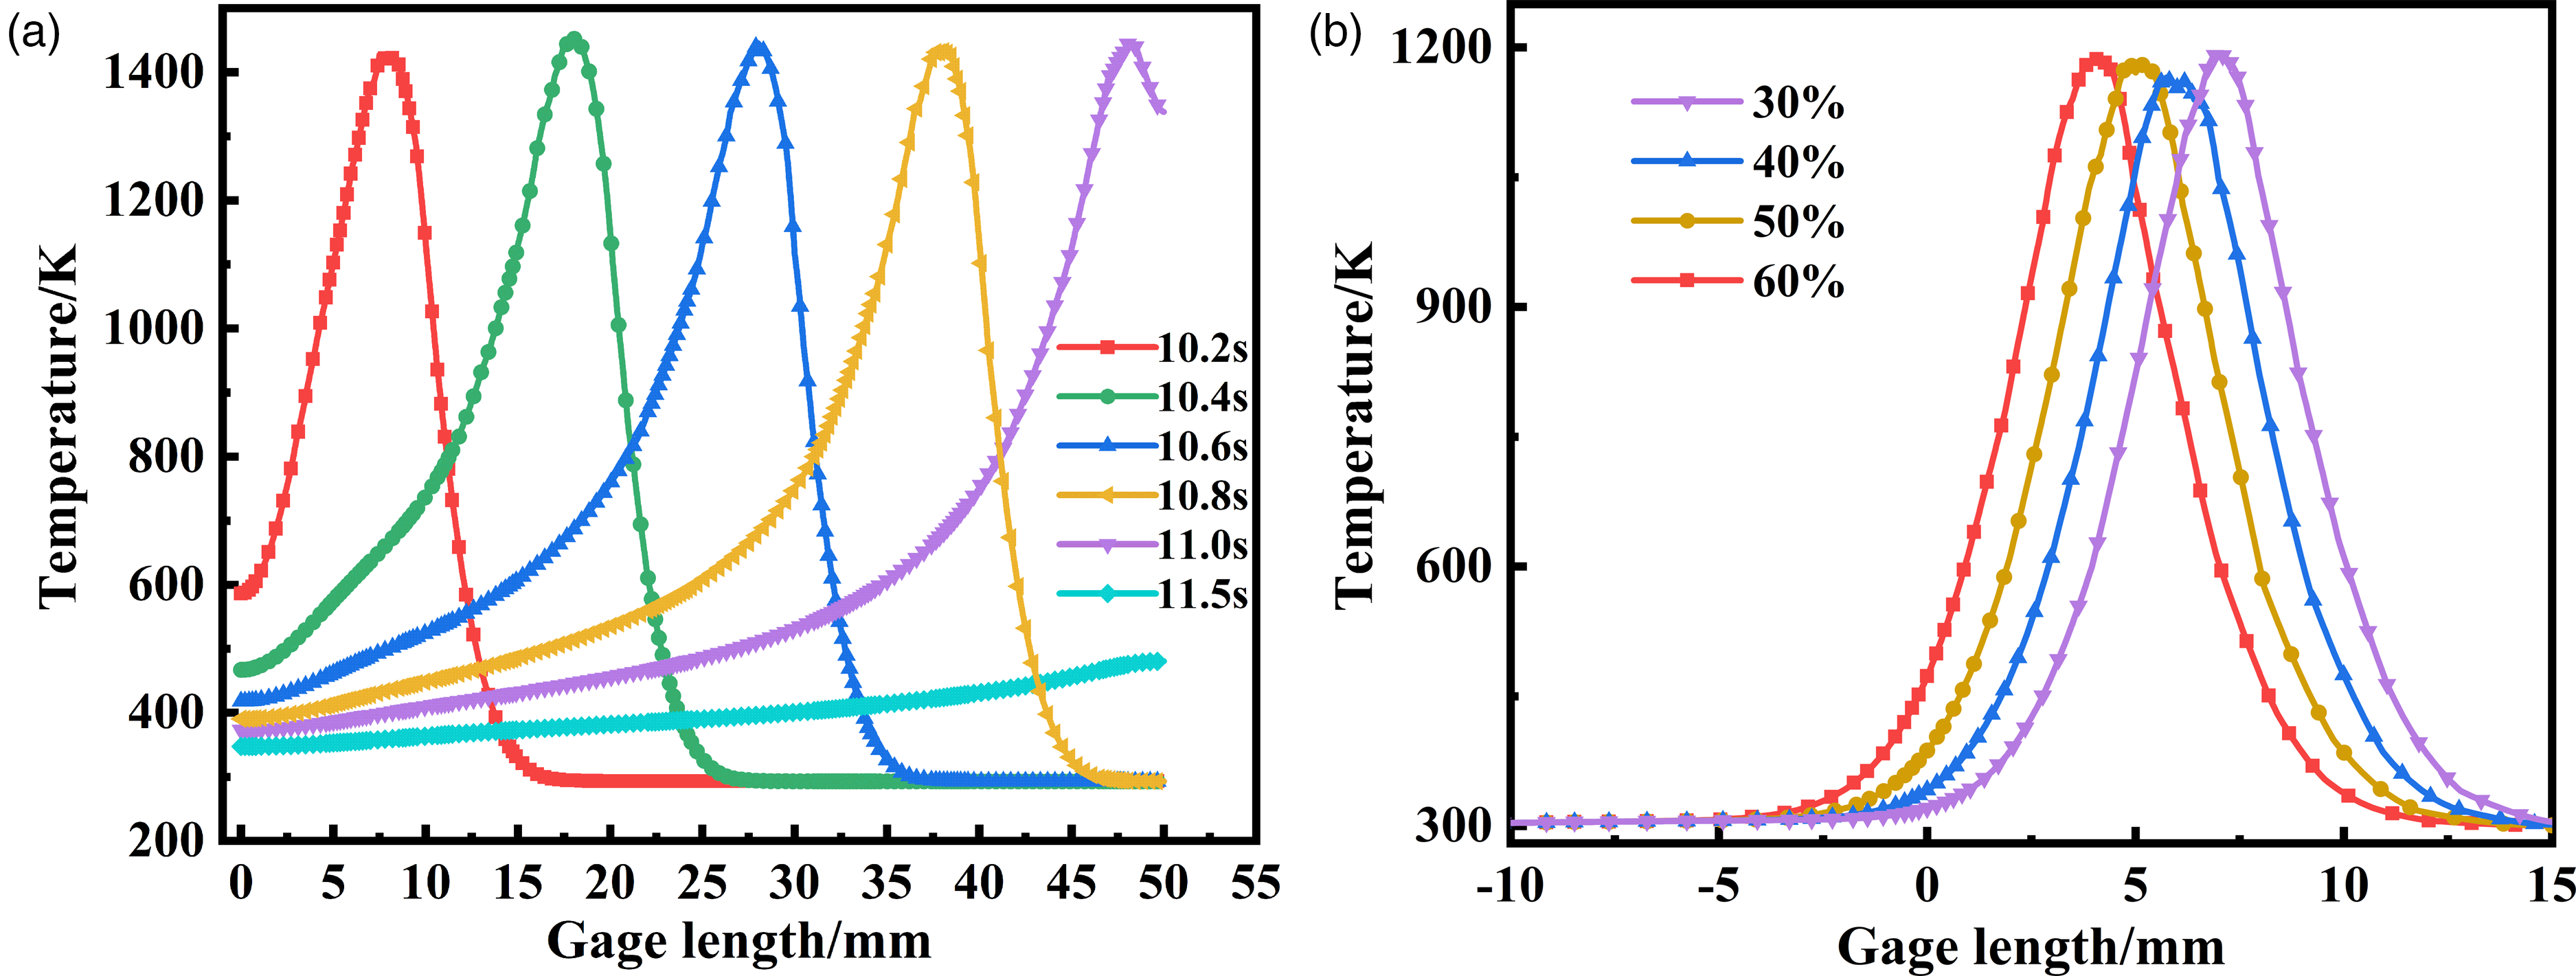
Temperature change curve during quenching of the workpiece: (a) temperature variation curve along acquisition line 1 and (b) temperature variation curve along collection line 3.
Stress field calculation results
The stress transient cloud diagram during the laser quenching can be calculated, as shown in Figure 10. Due to the thermal expansion, plastic strain increases with temperature when the laser scans the surface of the workpiece. This causes the stress around the spot to instantly rise, forming an obvious annular stress zone in the center of spot. The annular stress zone gradually expands outward, forming an ellipsoidal plastic stress influence zone, which continuously advances forward with the movement of laser. The stress at the post-laser scan position is relatively low because the yield stress is gradually released as the temperature of workpiece decreases, resulting in the stress in the center of the quench channel remaining at about 420 MPa after scanning. As laser scanning in the subsequent pass progresses, the stress distribution in the non-overlapping area is similar to that in the previous pass, while there is a significant stress accumulation phenomenon in the laser overlapping area. At t = 1200 s, the temperature decreased to room temperature, forming two distinct parallel residual stress bands on the surface of workpiece. The residual stress in the overlap area was relatively concentrated, with a stress peak increasing to 825 MPa. The distribution of residual stress indicates a high level for stress accumulation in the temperature overlap area, while the stress variation in the non-overlap area is consistent with the previous process, and the stress at the laser center position in the subsequent process is higher. This is due to the high cooling rate of laser quenching, which produces a refined martensitic structure in the quenched layer, causing atomic volume expansion and generating significant internal stress, resulting in residual stress reaching 90% of the material's yield strength.
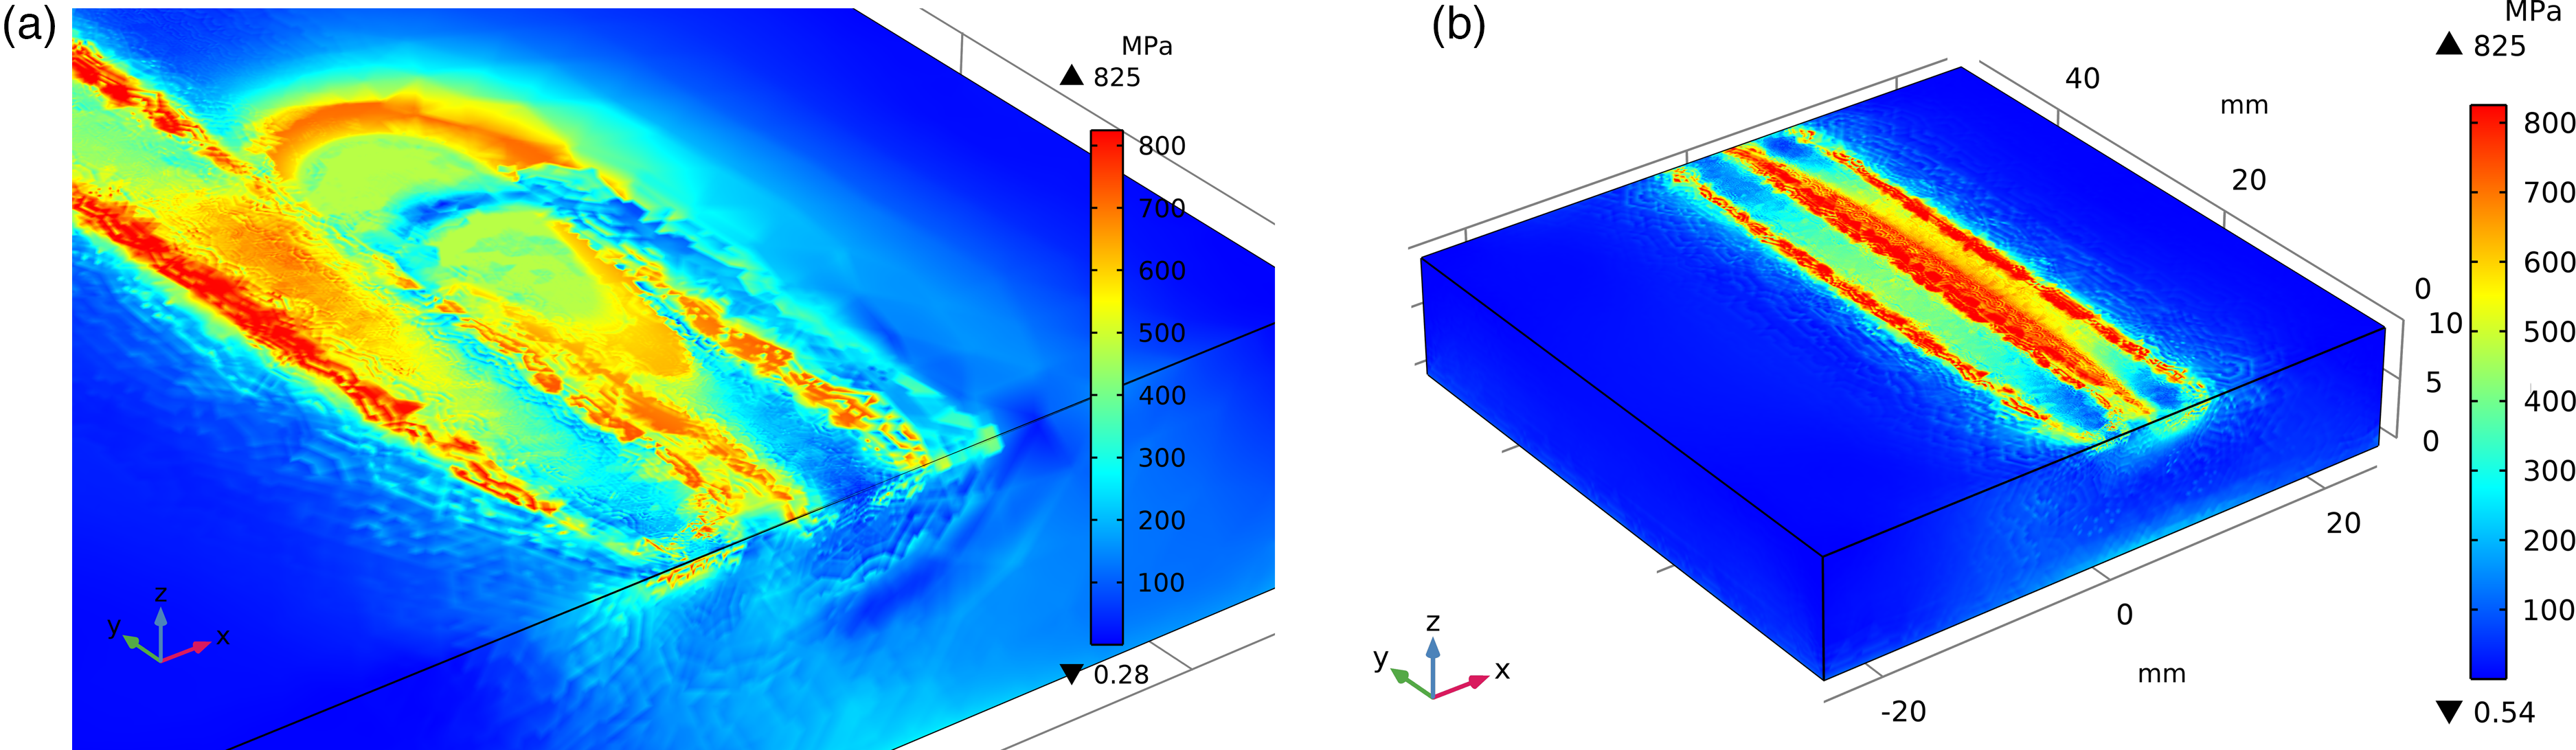
Stress distribution clouds of multi-lap laser quenching at different moments: (a) t = 10.5 s multi-track overlapping laser quenching stress distribution and (b) t = 1200 s multi-track overlapping laser quenching stress distribution.
Correlation analysis of phase transformation processes
The phase transformation hardening law of workpiece surface after laser quenching at different times was calculated and shown in Figure 11. Figure 11(a) shows the distribution map of the phase transformation layer at t = 1.0 s. The calculation indicates that when the temperature is higher than the critical temperature of the phase transition point, the surface layer will undergo significant phase transition hardening. As the laser spot continuously moves forward, a “comet tail” shape similar to the thermal influence zone in the temperature map will form at the front end of the substrate. The laser scanning part forms a uniform strip distribution, and there is a thermal influence zone at the edge of the strip that has not completely undergone phase transformation. Figure 11(b) shows the distribution map of the phase transformation layer at t = 12 s. The calculation indicates that during the laser scanning on the workpiece surface in the subsequent process, the shape of the phase transformation layer in the non-overlap area is similar to that in the previous process. Due to the secondary heating of the workpiece surface, a secondary tempering phenomenon occurs in the overlap area.
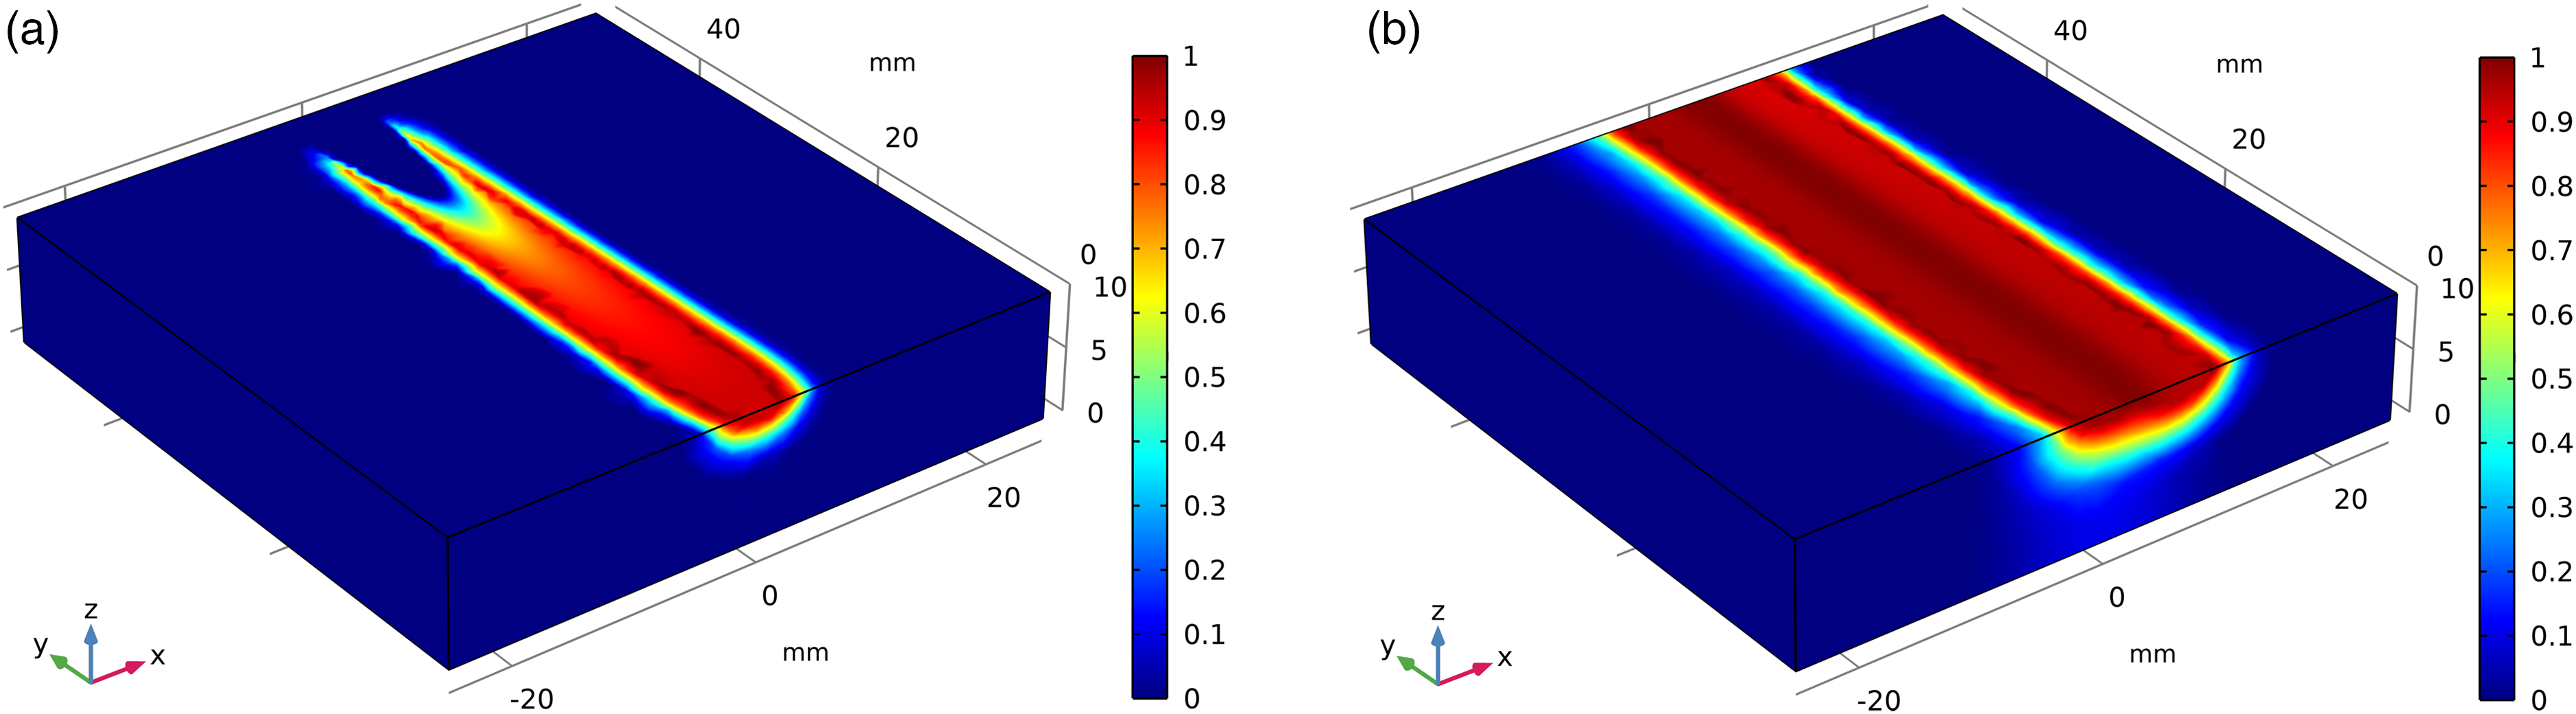
Fraction of martensite phase at different moments during the laser quenching: (a) phase distribution of laser quenched martensite at t = 1.0 s and (b) phase distribution of laser quenched martensite at t = 12 s.
Figure 12 shows the cloud diagram of the transverse section distribution for the laser quenched phase transformation layer. The transverse section of the phase transformation layer presents a crescent-shaped distribution, while the longitudinal section shows a uniform strip-shaped distribution of phase transformation. When the first laser is scanned, the substrate begins to heat up, forming austenite structure, and transforms from austenite to martensite through air cooling. The second laser is scanned parallel to the first laser, and a secondary heating process occurs in the laser overlap area. High temperature can activate the carbon diffusion mechanism in martensite, causing tempering effect on the substrate. The position of the tempering zone is determined by judging whether there is a tempering softening phenomenon in the overlap area, and the tempering zone temperature is set to 450 K. Here, n represents the width of the tempering zone, and m represents the depth of the tempering zone. The depth of the phase transformation layer is uneven, and the depth of the phase transformation layer in the subsequent process is greater than that in the previous process. Due to the first laser has a certain preheating effect on the substrate, which leads to a larger thermal influence zone after the second laser scanning, resulting in a greater depth of phase transformation in the subsequent process. This is consistent with the actual experimental results. By simulating the phase transition field of laser quenching, the phase distribution of multi-laser quenching process can be reflected.
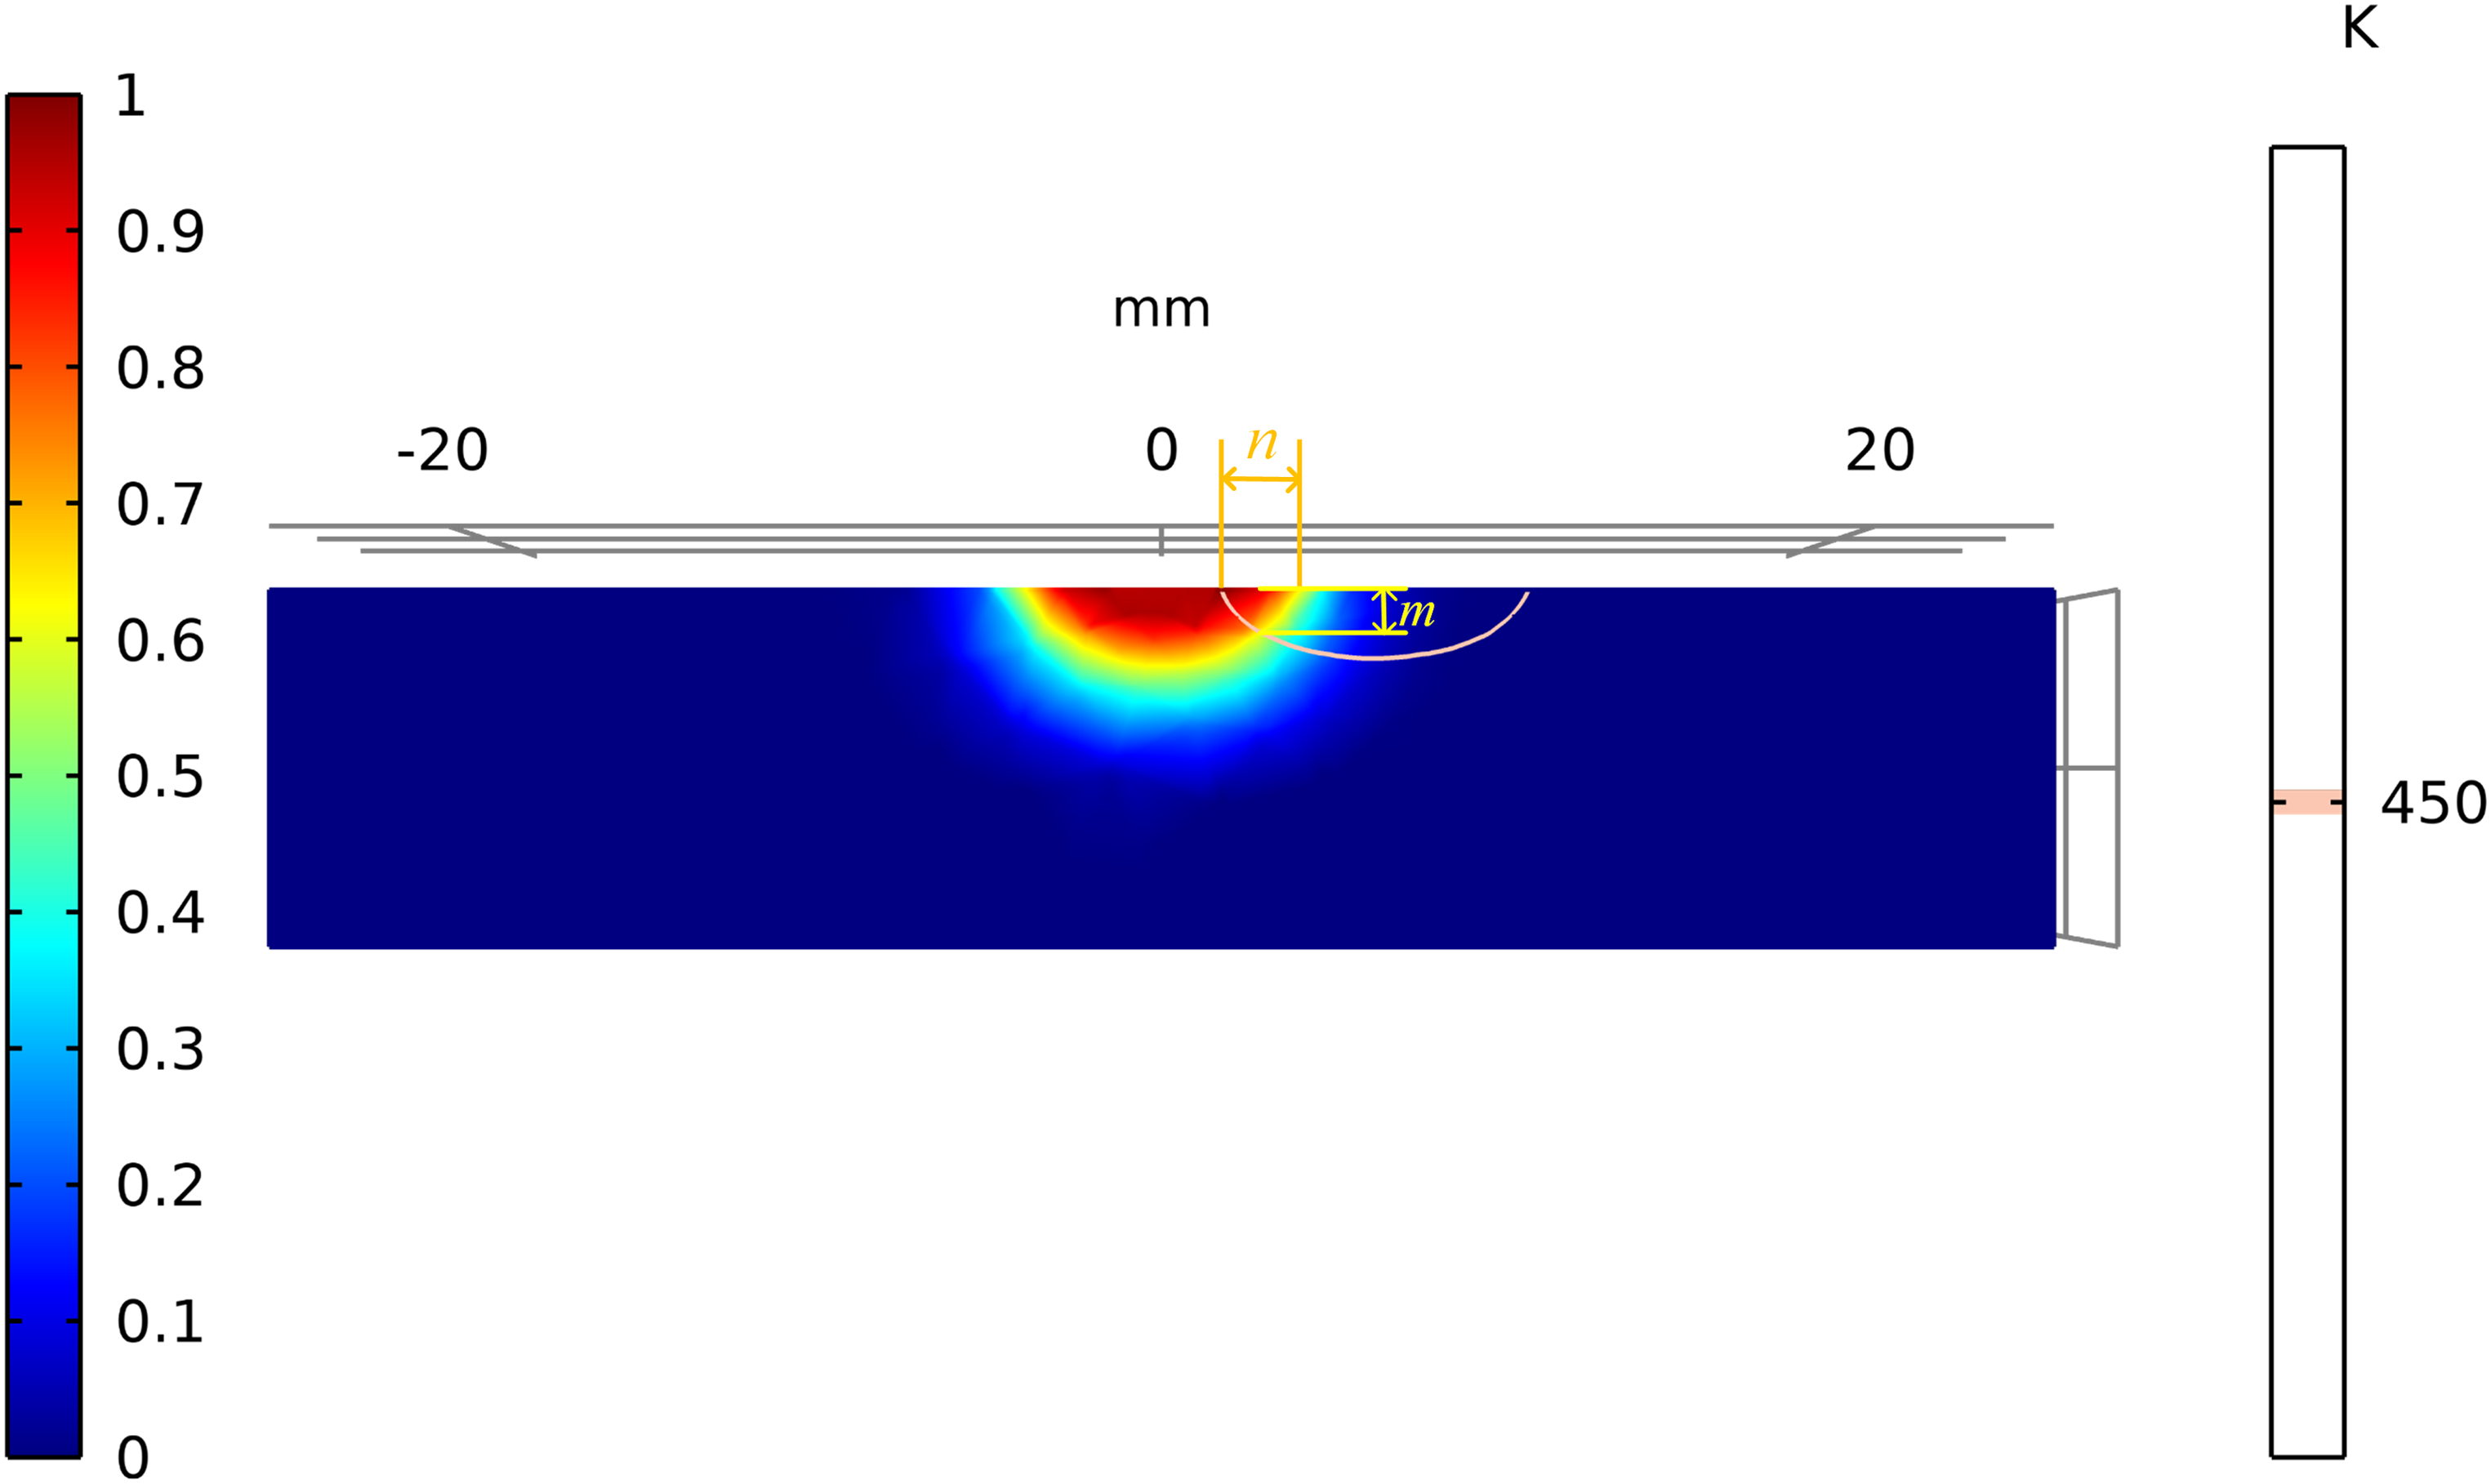
Laser quenching phase transition layer transverse section cloud diagram.
Optimization of parameters in laser quenching process based on back propagation neural network and genetic algorithm
Genetic algorithm optimization of back propagation neural network modeling
The artificial neural network (ANN) is a complex artificial intelligence optimization model composed of multiple interconnected neurons, mainly used to analyze the nonlinear relationship between multiple input and output variables. It has solved many problems with advantages such as the high nonlinear mapping ability, high self-learning ability, and non-limitation, which are difficult to solve in optimization models and has become a hot topic in the field of artificial intelligence. 29 ANNs have overcome the limitations of traditional optimization algorithms, such as the structural constraints and poor fitting with possess characteristics of self-organization, adaptability, and self-learning. 30 In recent years, researchers have effectively employed this methodology to solve nonlinear problems and continuously optimized its algorithms. It has found widespread application in fields such as the intelligent robotics, automation, biology, and medicine. Figure 13 shows a schematic diagram of a three-layer back propagation (BP) neural network model, which has a network topology consisting of an input layer, a hidden layer and an output layer. The input layer parameters are composed of the laser power P, scanning diameter D, scanning speed V, and laser overlap rate S. These four different parameters are transmitted forward from the input layer, passing through the hidden layer, and finally, reaching the output layer, where the output layer width and depth of the hardened zone are n and m, respectively. If the output results are unsatisfactory, the calculation error is backpropagated, and the network values are adjusted for a second calculation until the calculated output results within an ideal expected range.
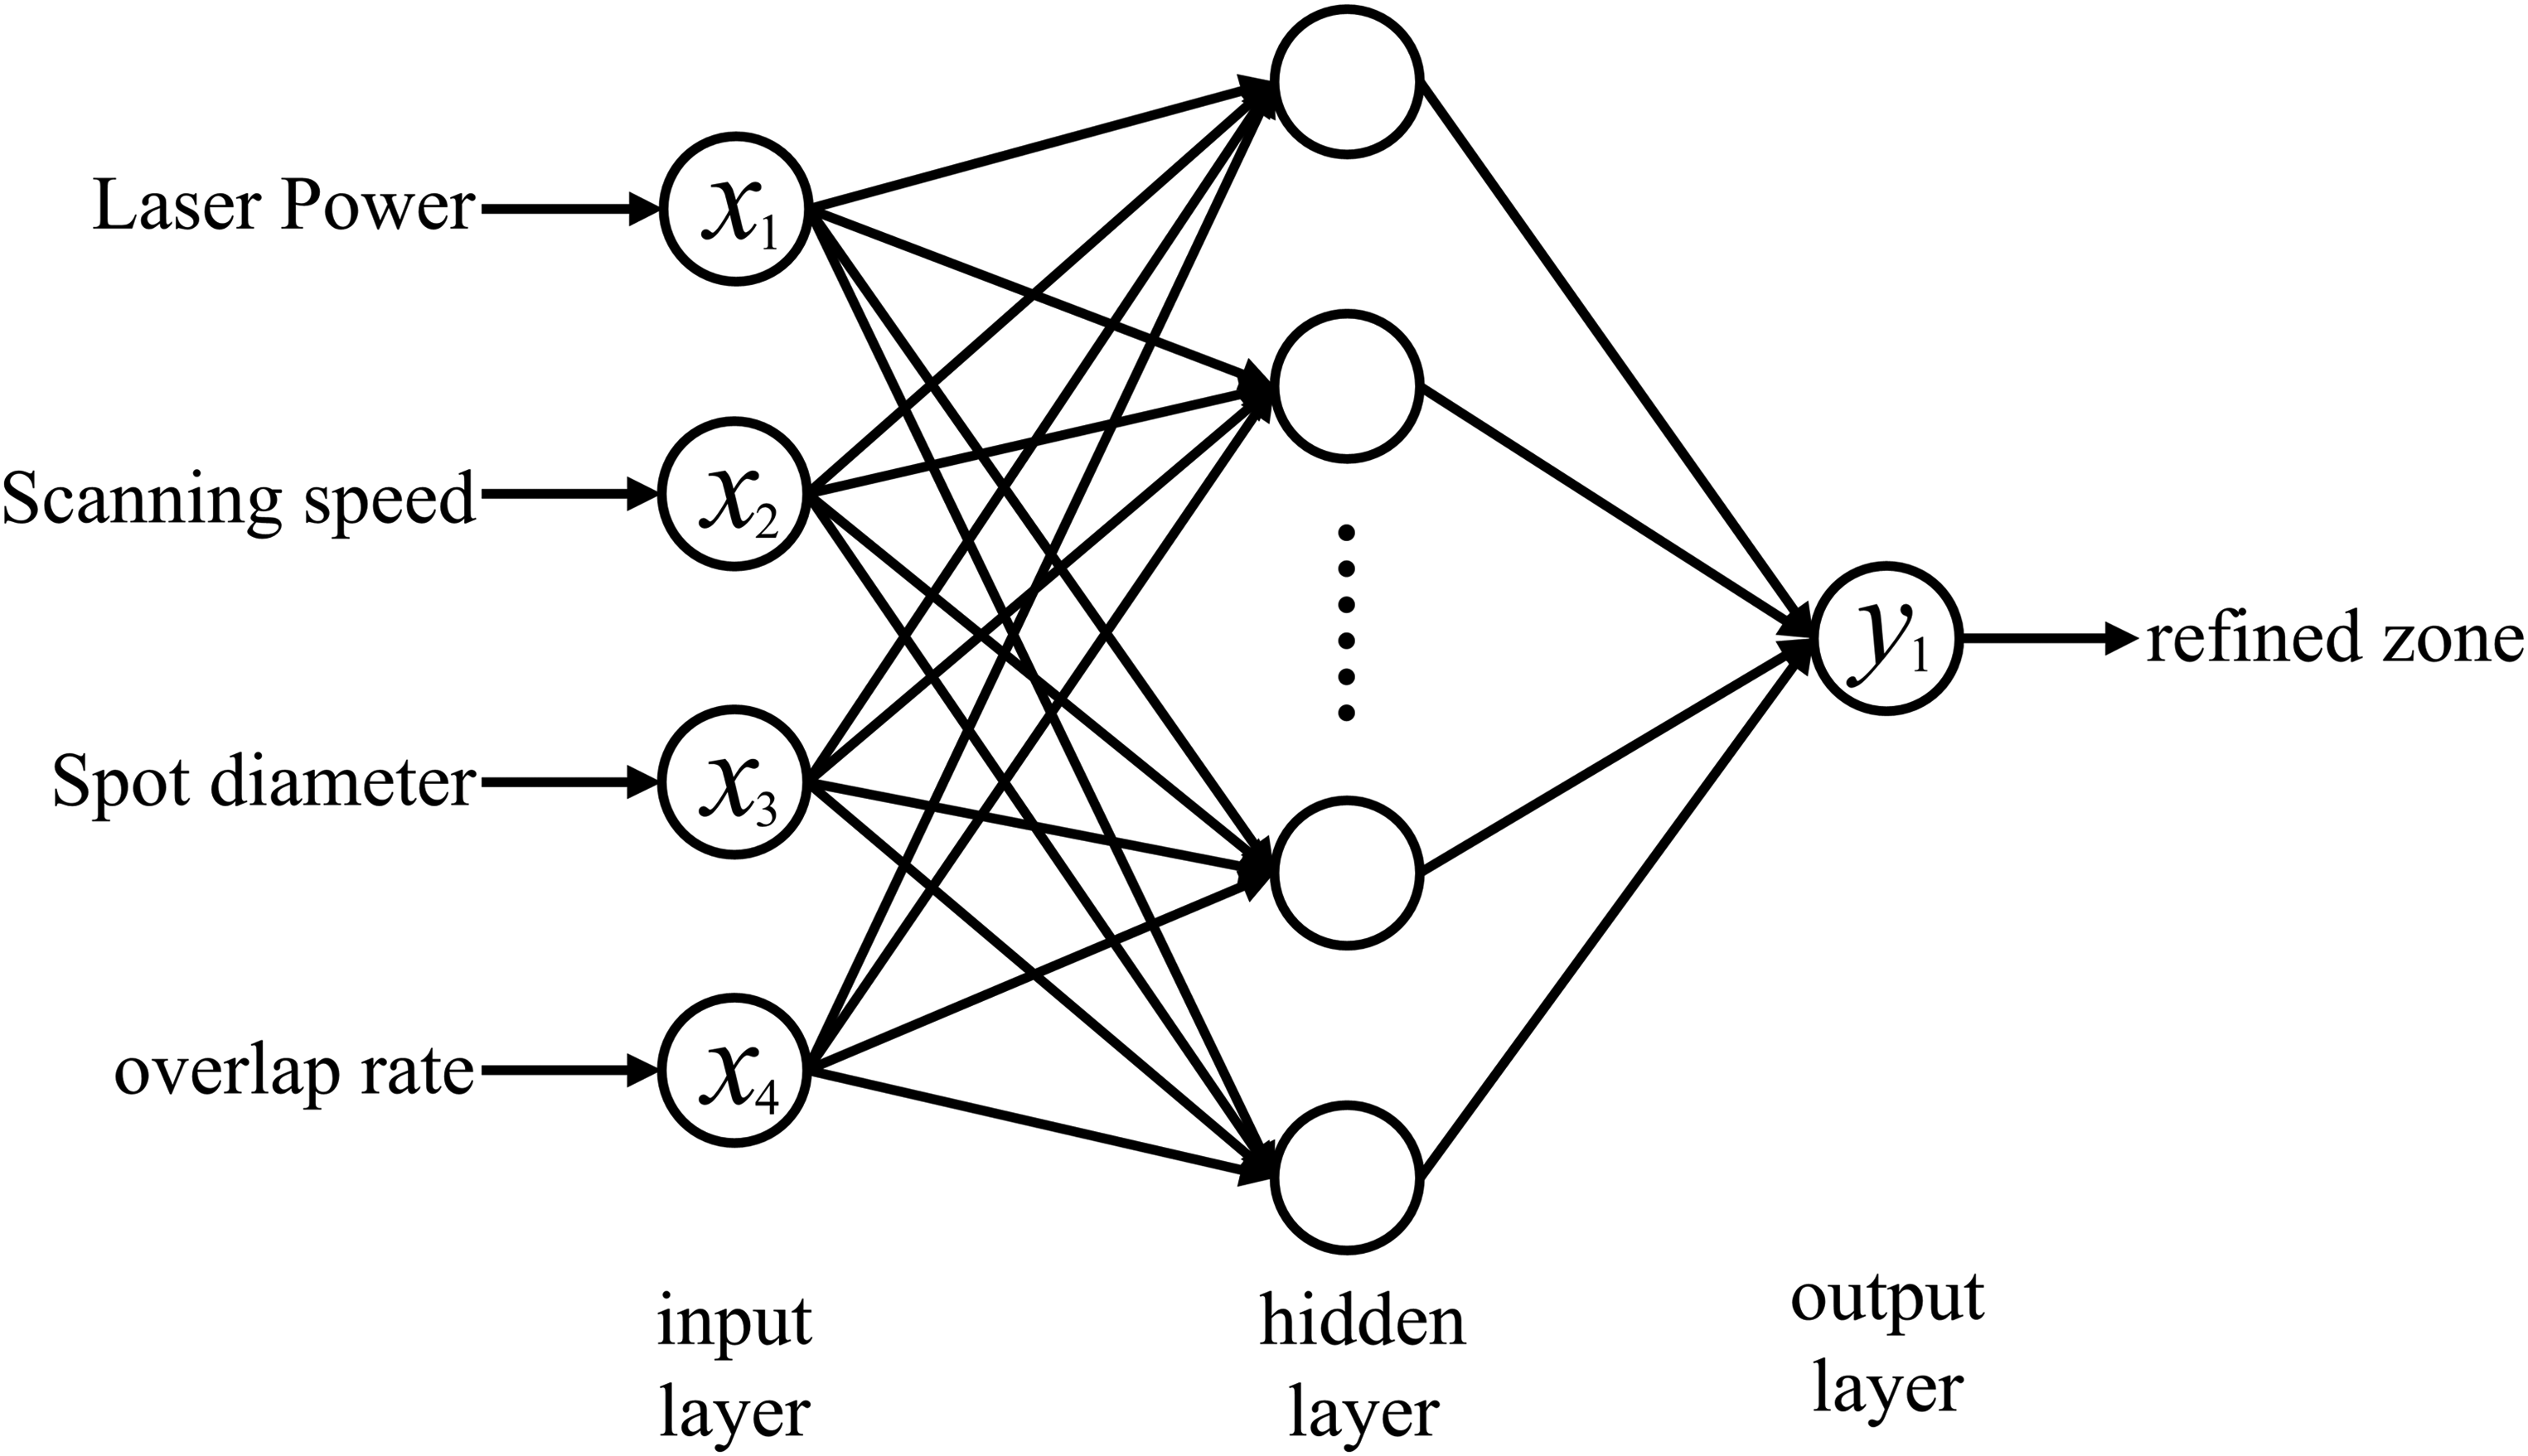
Schematic diagram of three-layer back propagation (BP) neural network model.
To overcome the limitations of traditional ANN models and improve data optimization capabilities, genetic algorithms are used as a non-deterministic, nature-inspired algorithm to optimize laser hardening process parameters. 31 A BP neural network model was established based on the genetic algorithm optimization. A new error function and training method were employed to improve the BP neural network model, and genetic algorithms were used to re-optimize the initial weight and threshold values. 32
Sample data collection
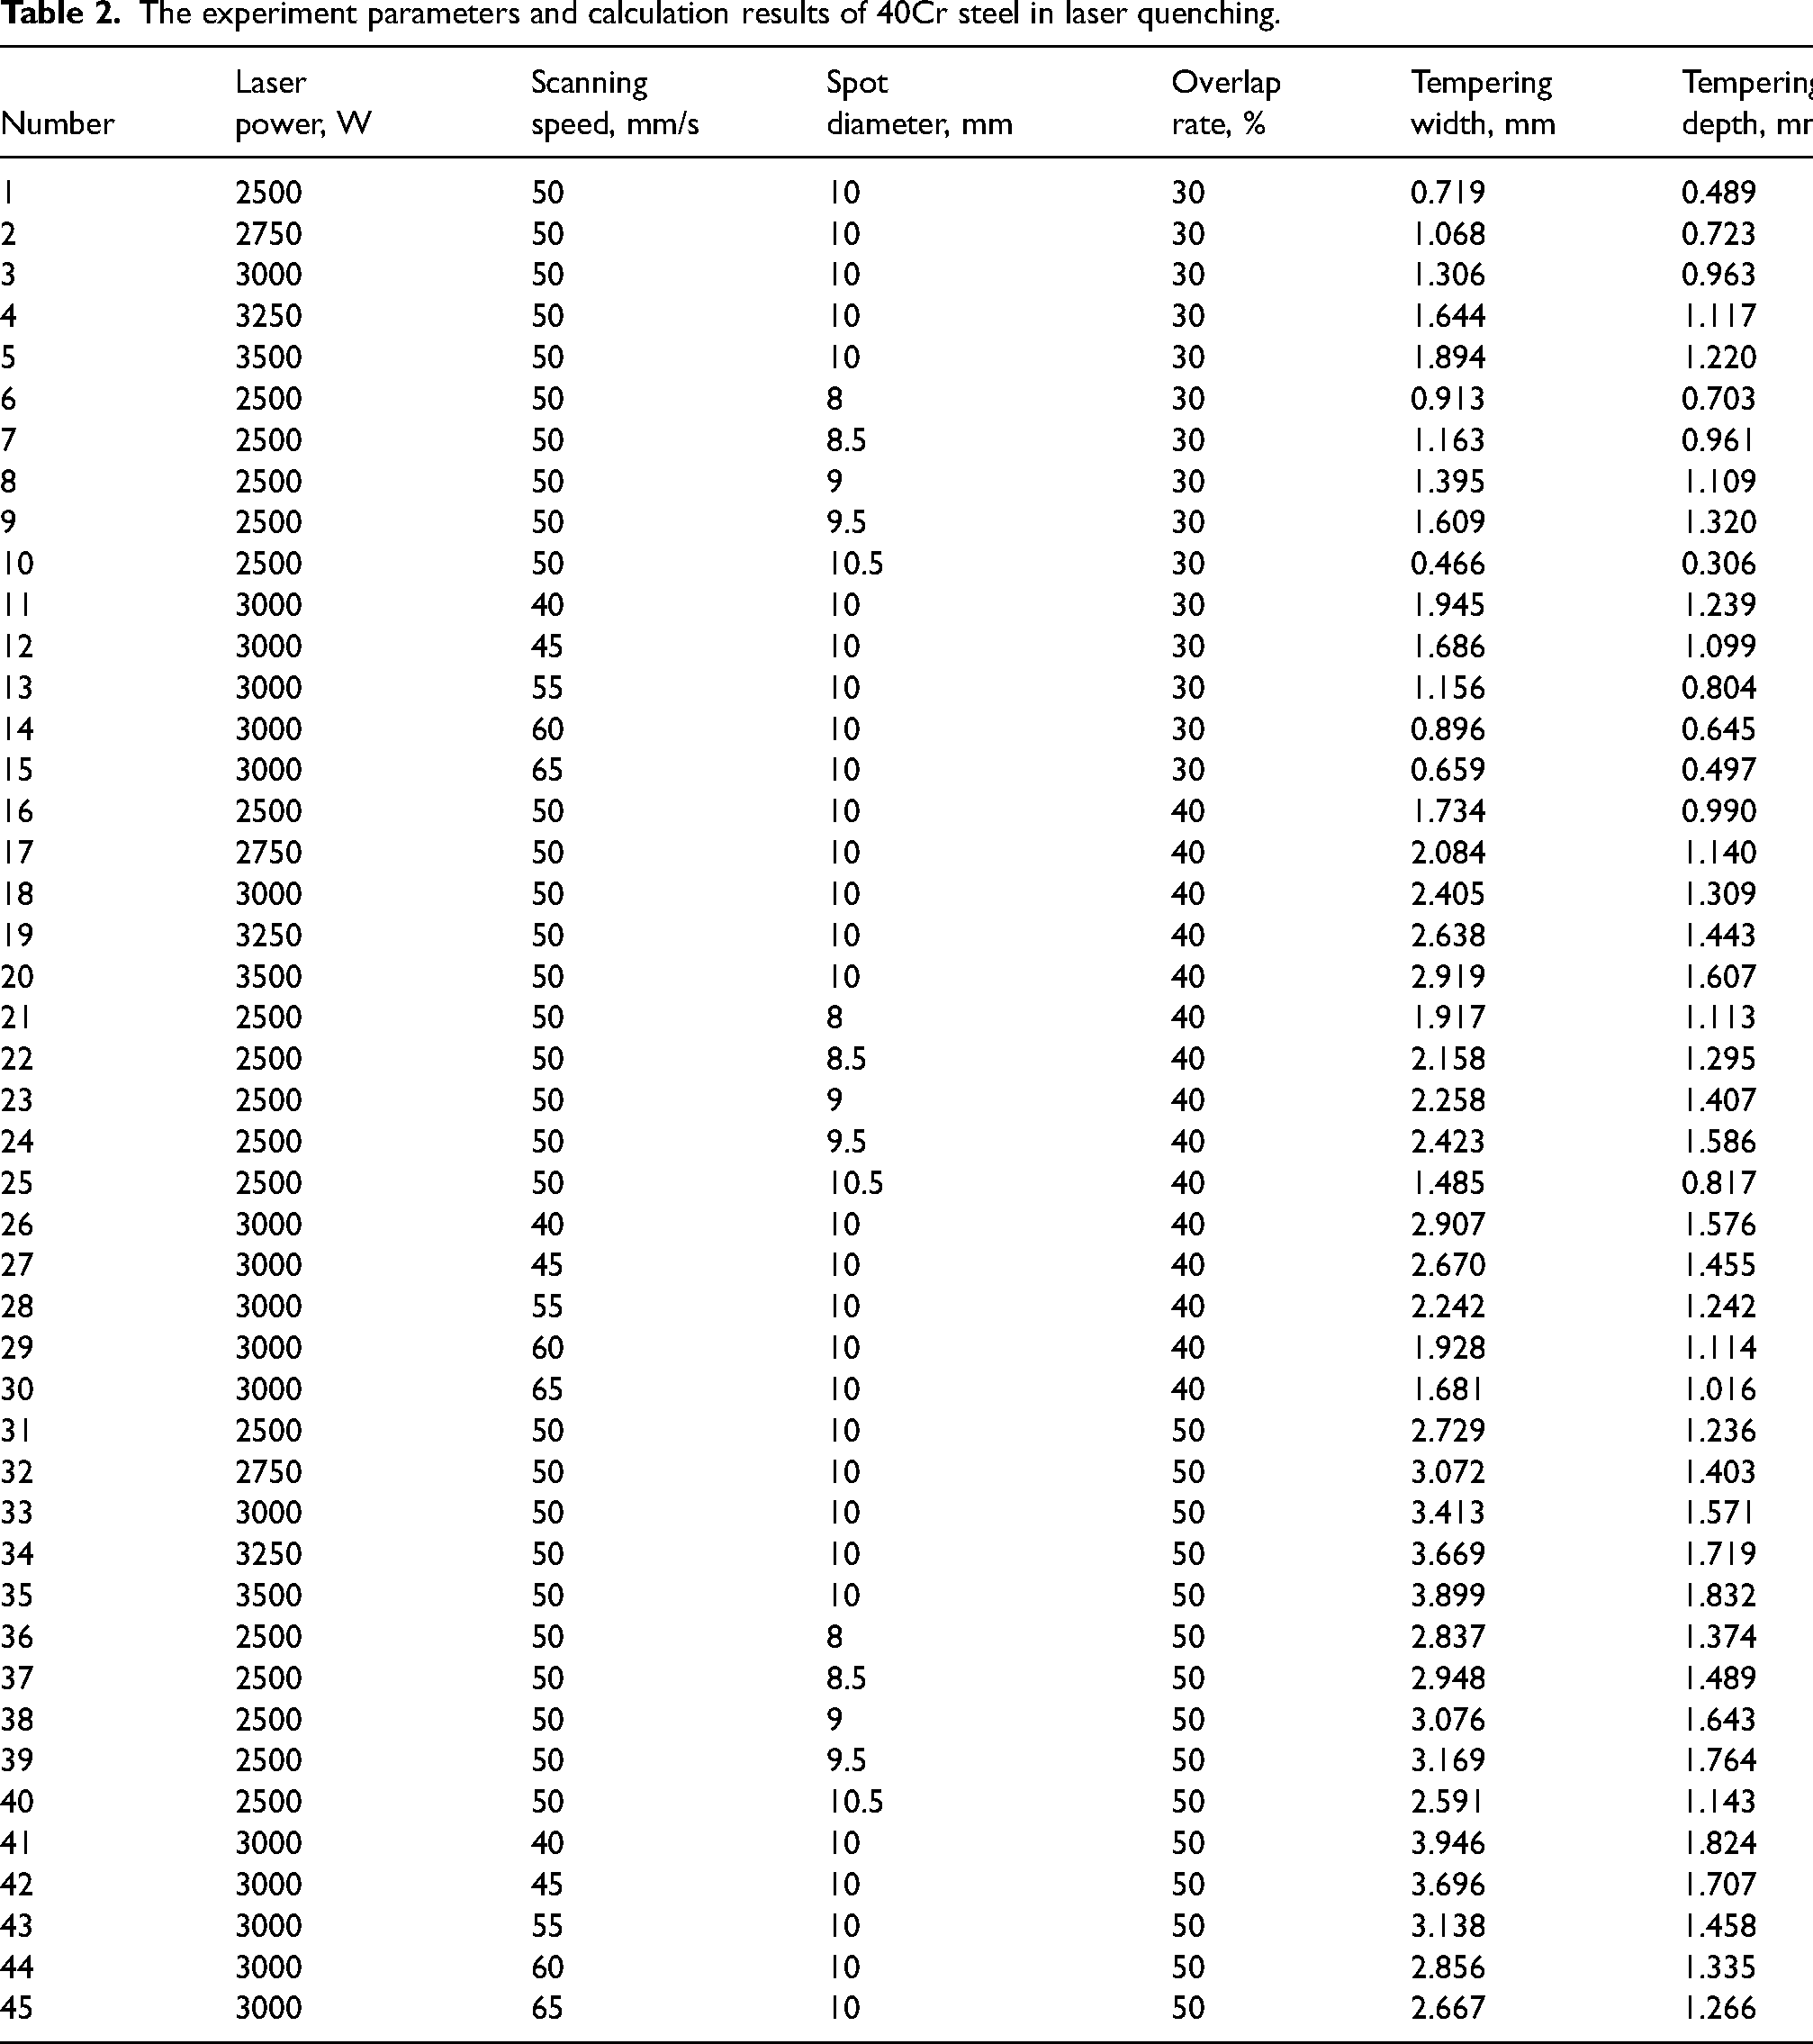
Table 2 shows the experimental results of laser quenching on 40Cr steel, where the width and depth of the hardened zone were calculated by changing different process parameters. Since the training of artificial neural network requires plentiful sample data, a total of 45 experiments were conducted in this study, where a portion of the data was used to train the BP neural network, and the remaining samples were used to test the accuracy of the trained network.
The experiment parameters and calculation results of 40Cr steel in laser quenching.
Model training and result analysis
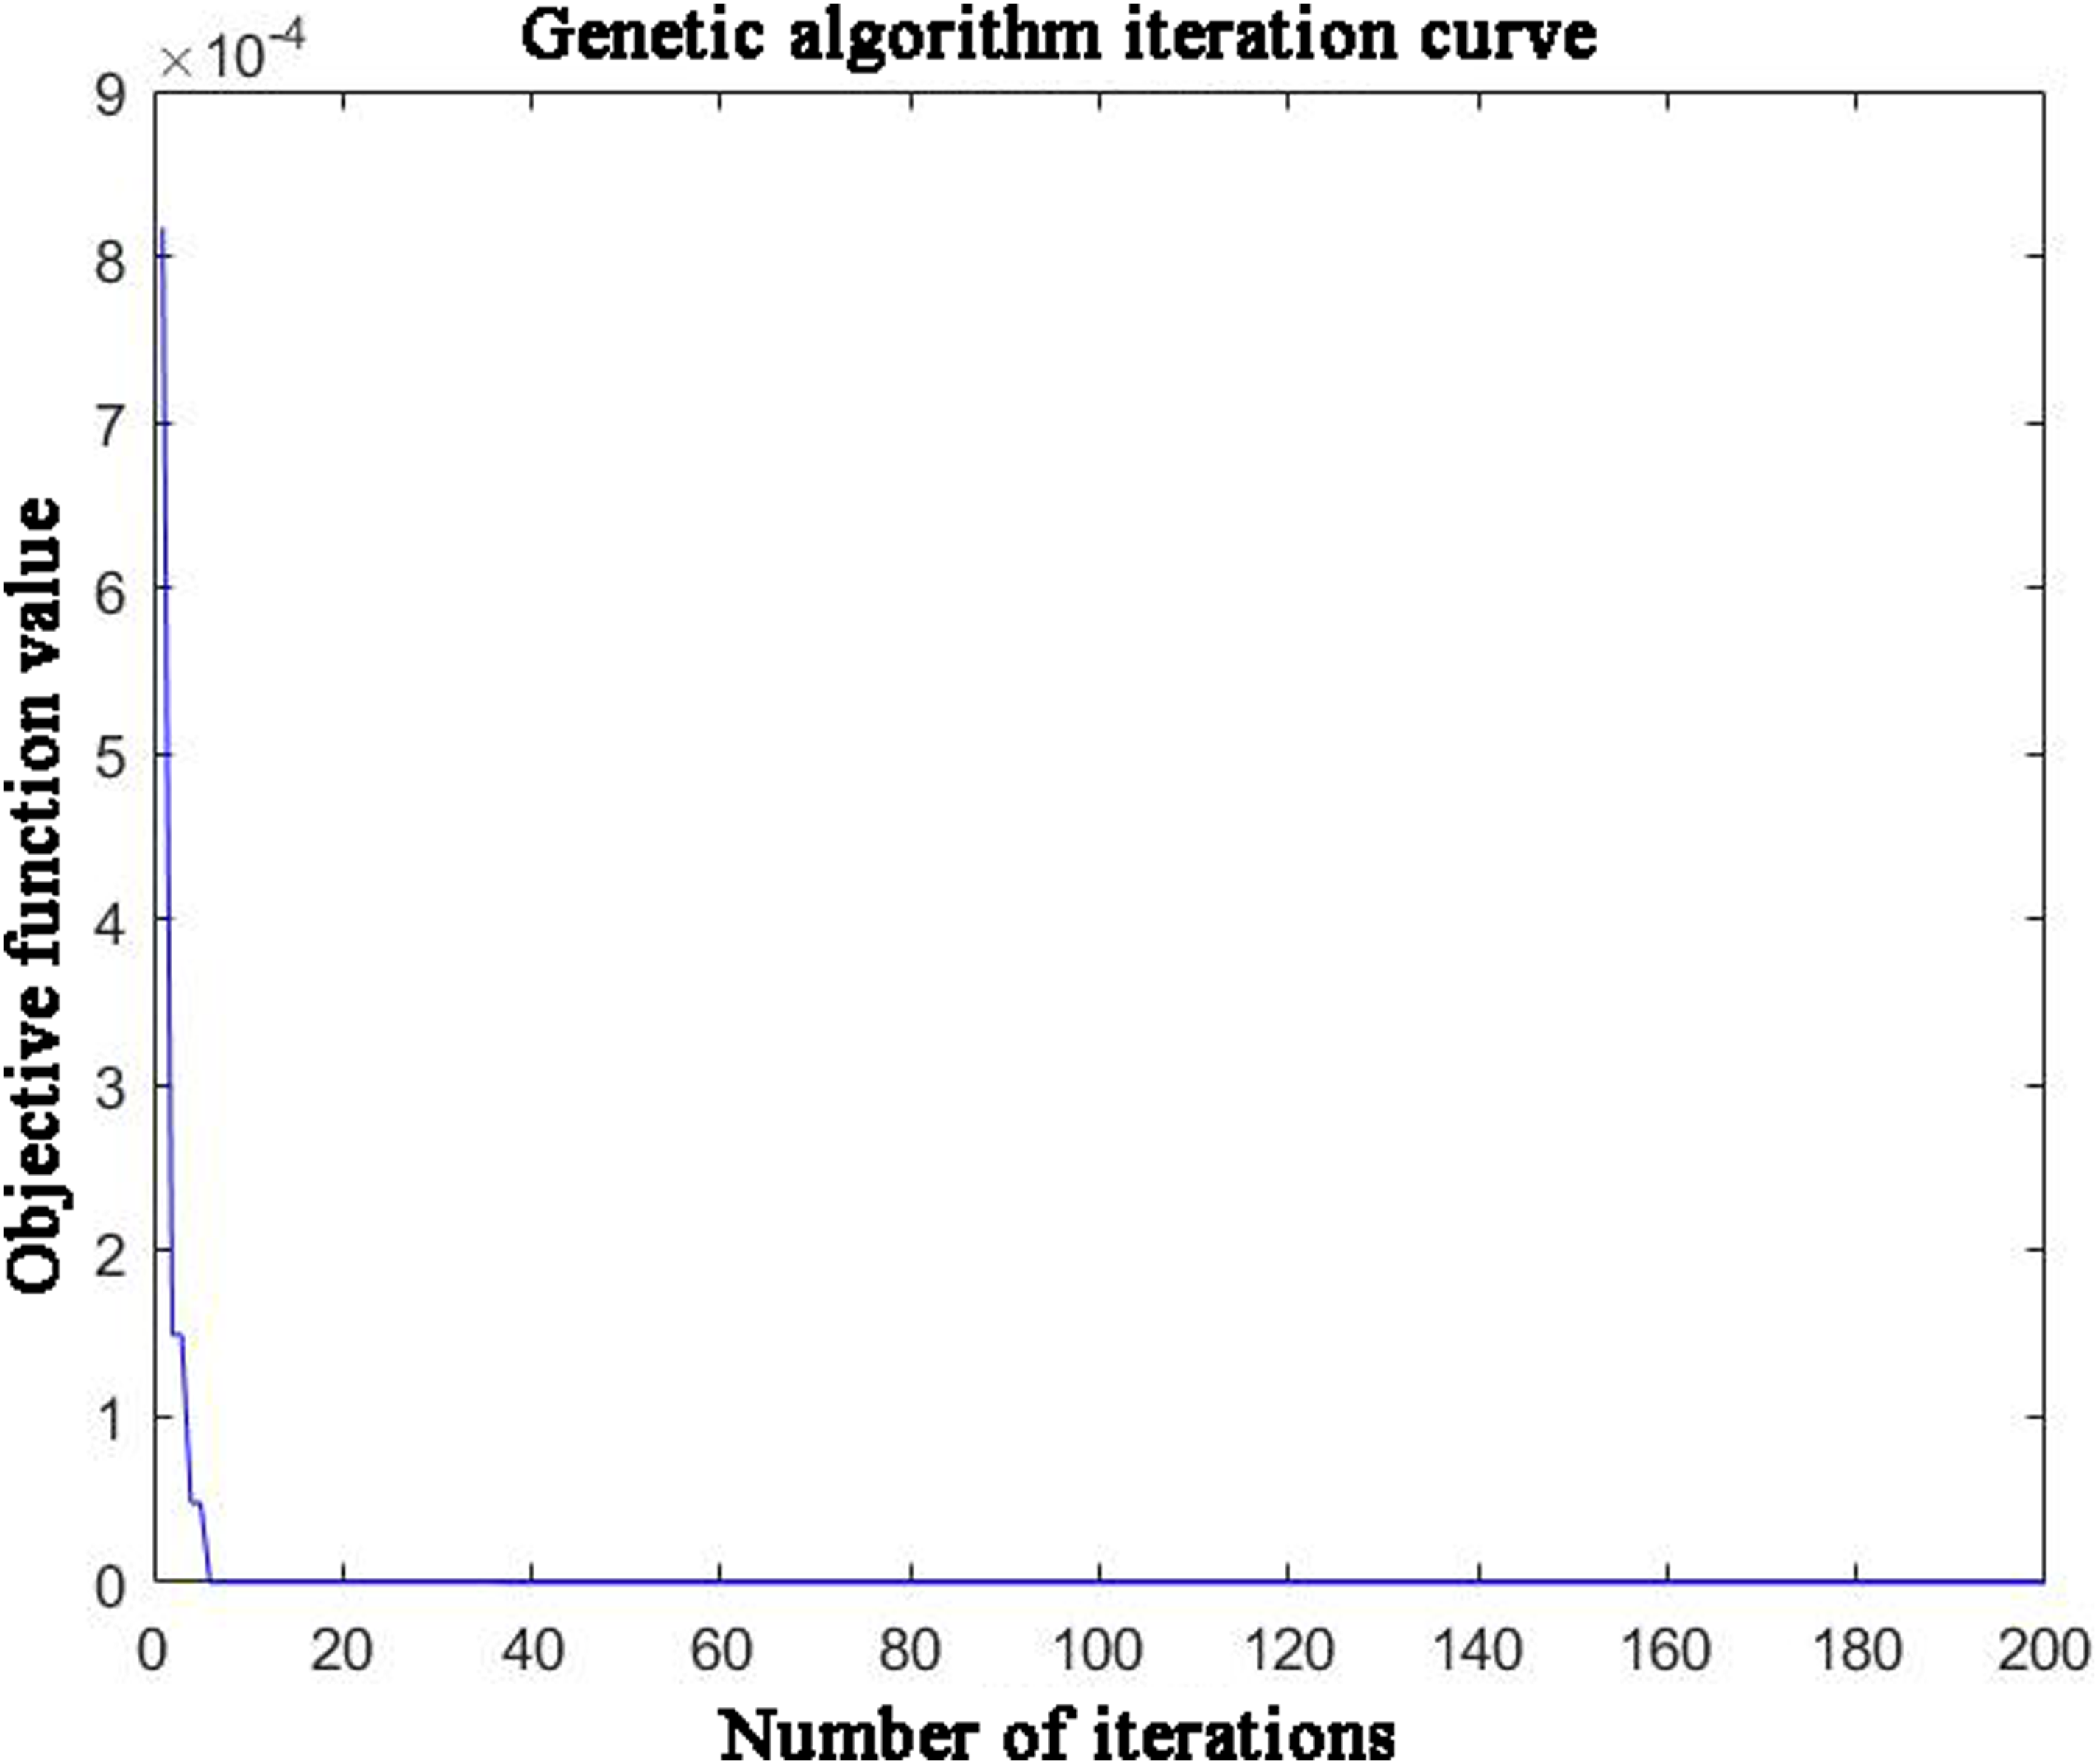
The neural network toolbox was used in MATLAB software, and a laser hardening prediction model was established. The training was set to 1000 iterations, a learning rate of 0.1, and an error accuracy of 1 × 10⁻⁴. When the global error fell within the ideal error range, the training was considered complete, and the network values were saved for the next calculation. The iterative training process curve is shown in Figure 14, where the horizontal axis represents the number of iterations, and the vertical axis represents the mean square error of each output result. The curve shows that the error accuracy can reach 1 × 10⁻⁴ at the end of the training, indicating that the network training has ultimately converged. After 200 iterations of population, the calculation concludes that the fitness value gradually decreases with the increase of iterations. This indicates that the individuals in the population are constantly updating, and the training results of the network model are quite excellent, with high reliability. The genetic algorithm iteration curve is shown in Figure 15.
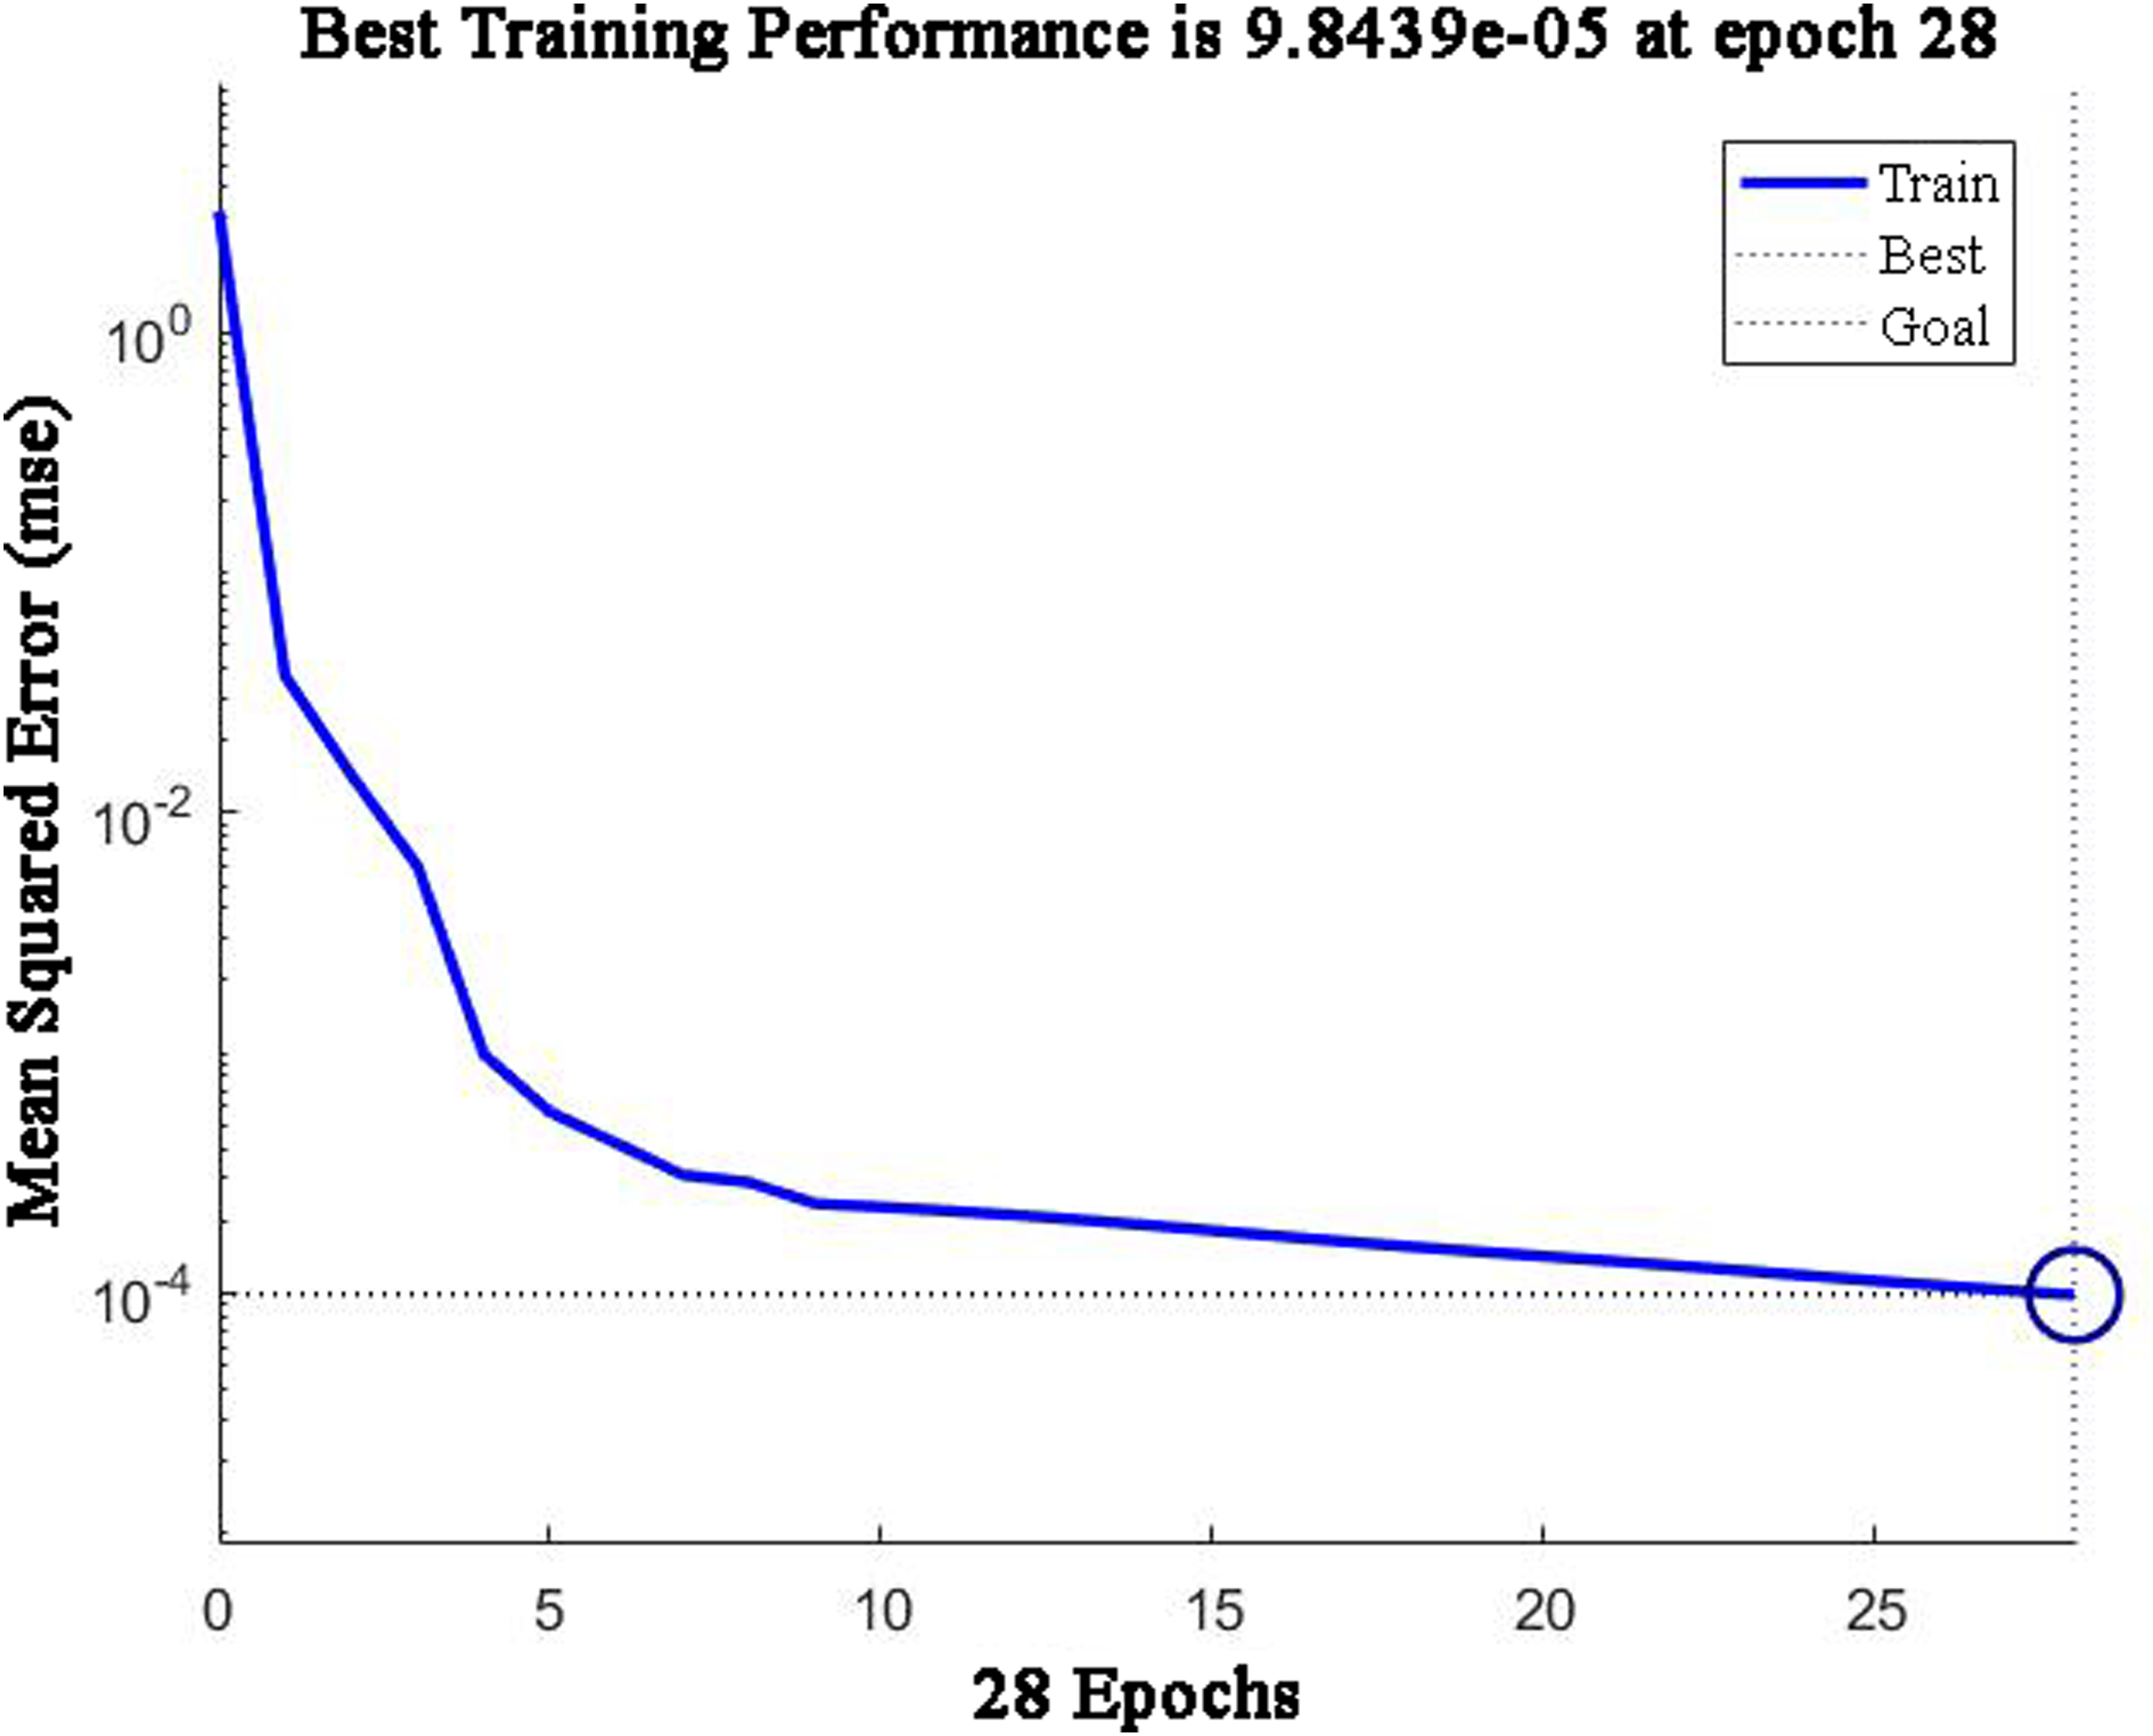
Iterative training process curve.
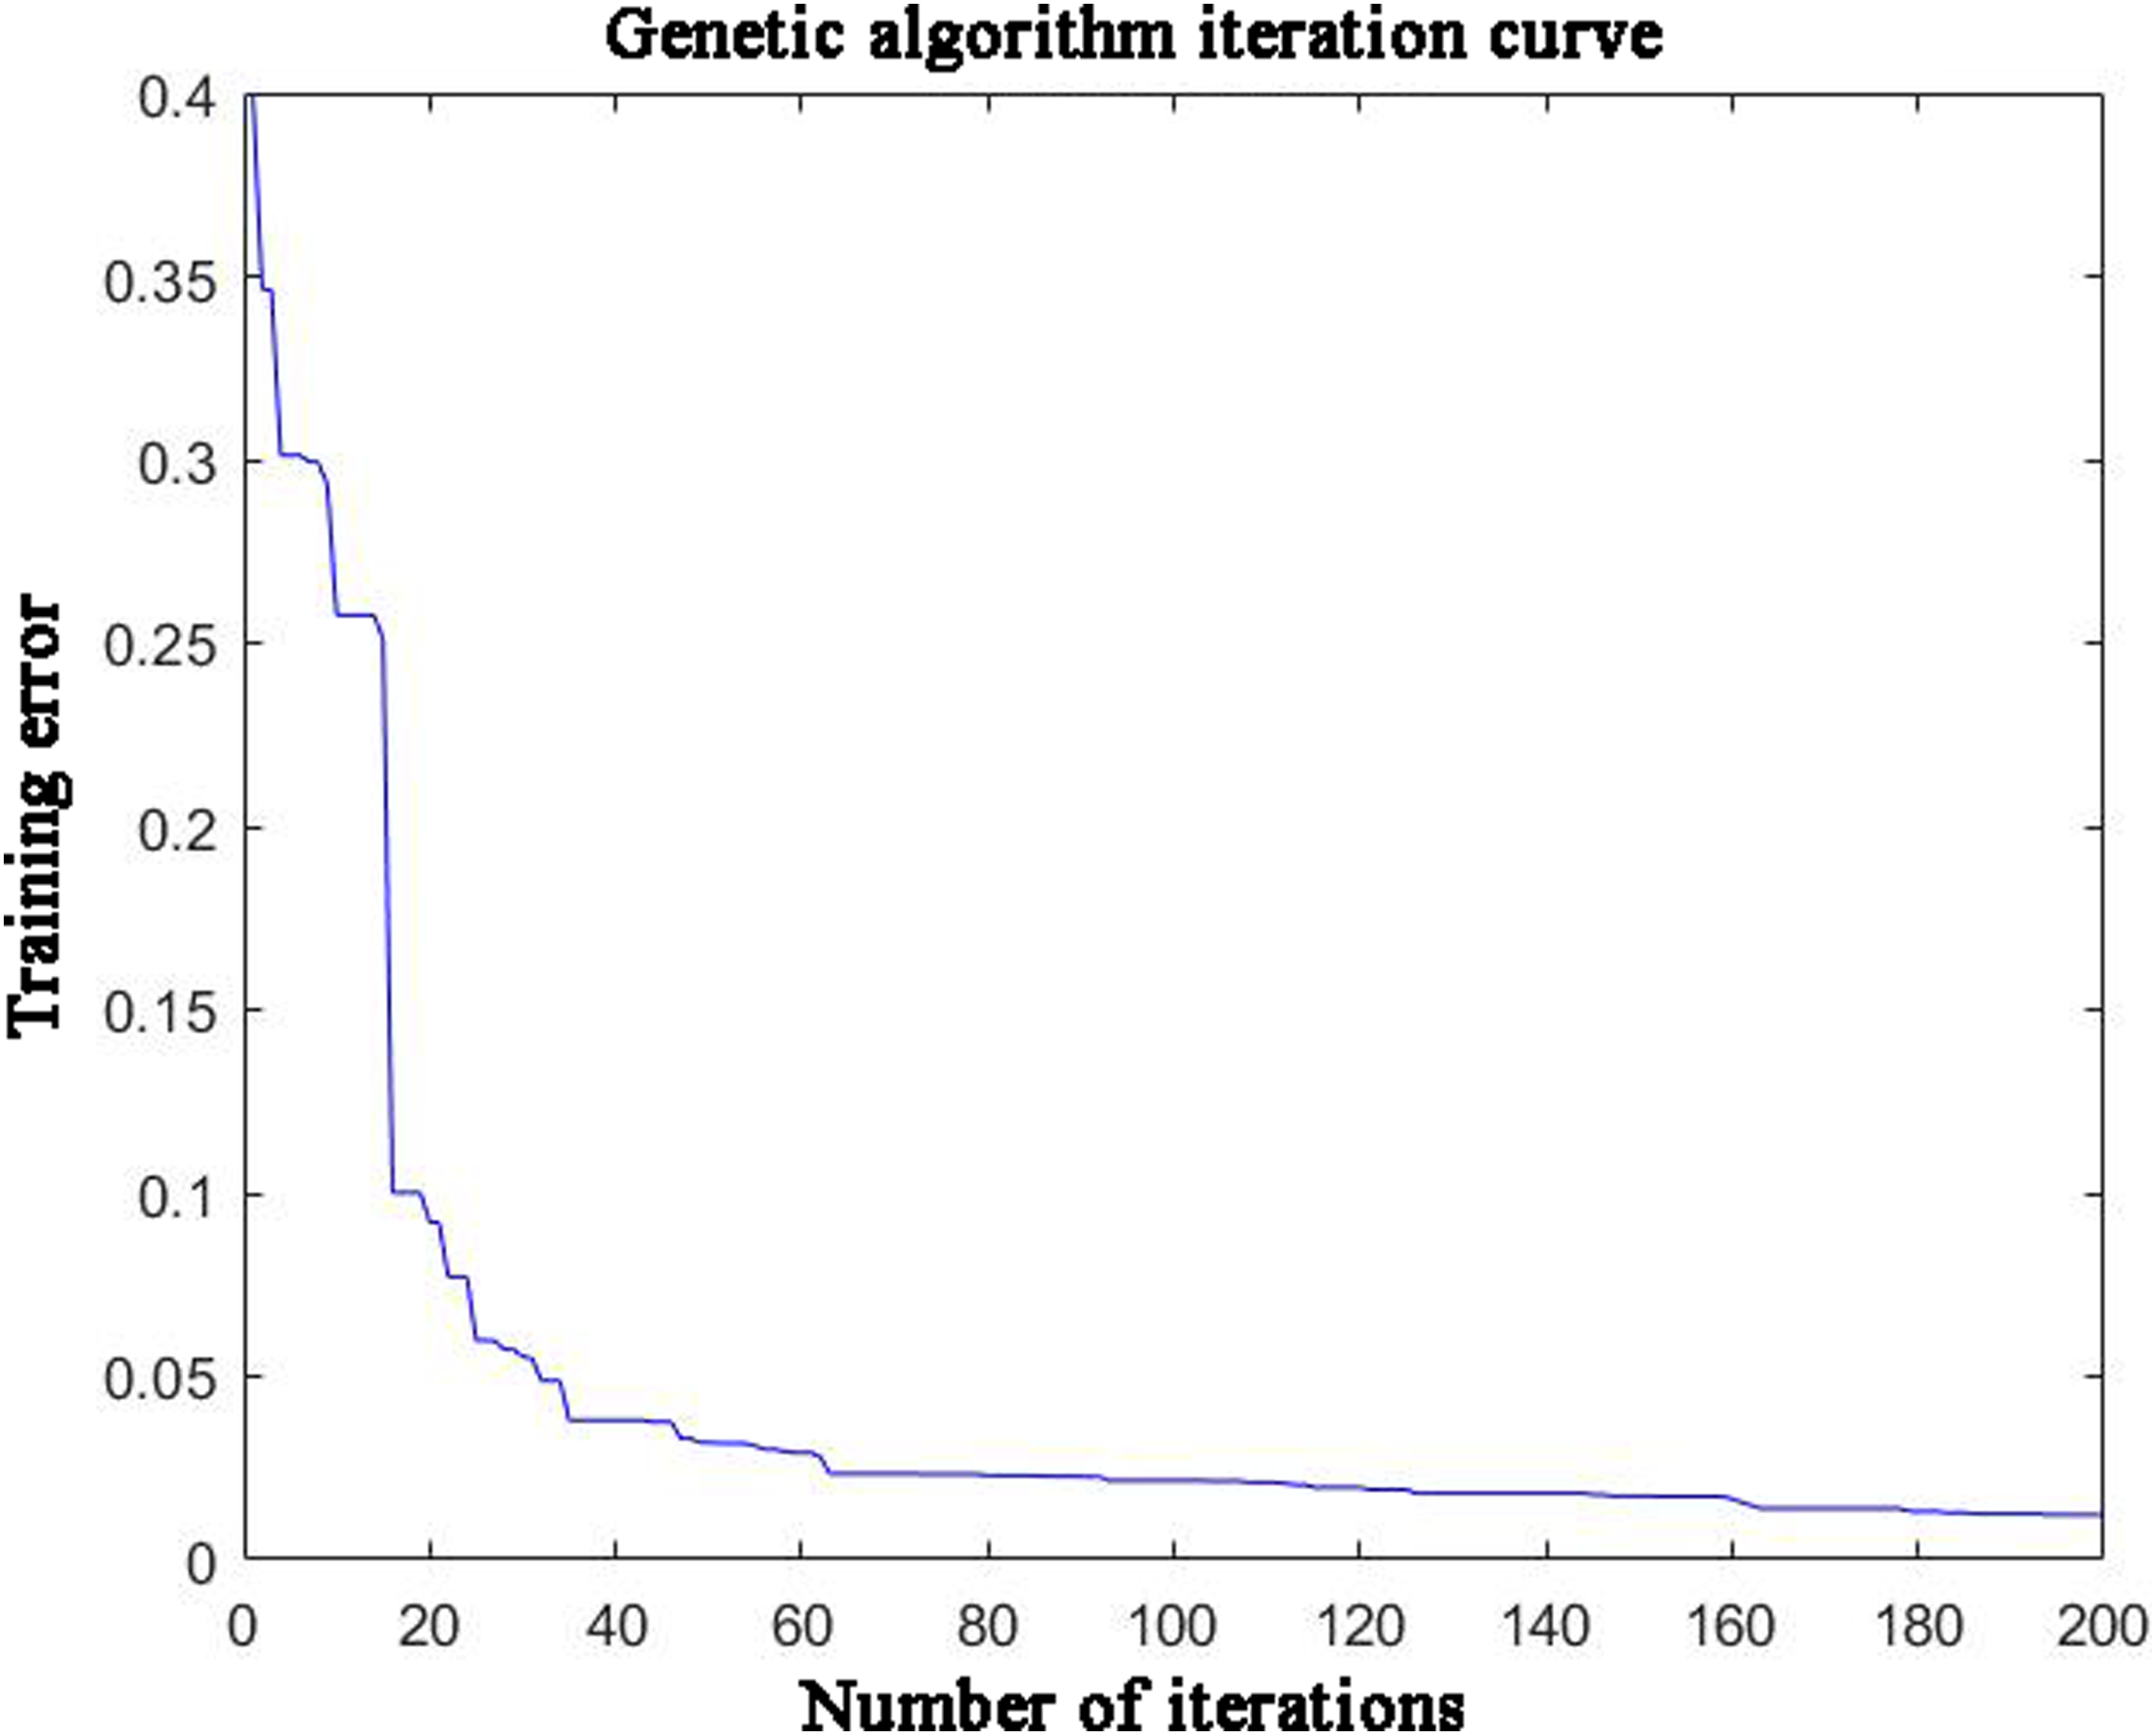
Genetic algorithm iteration curve.
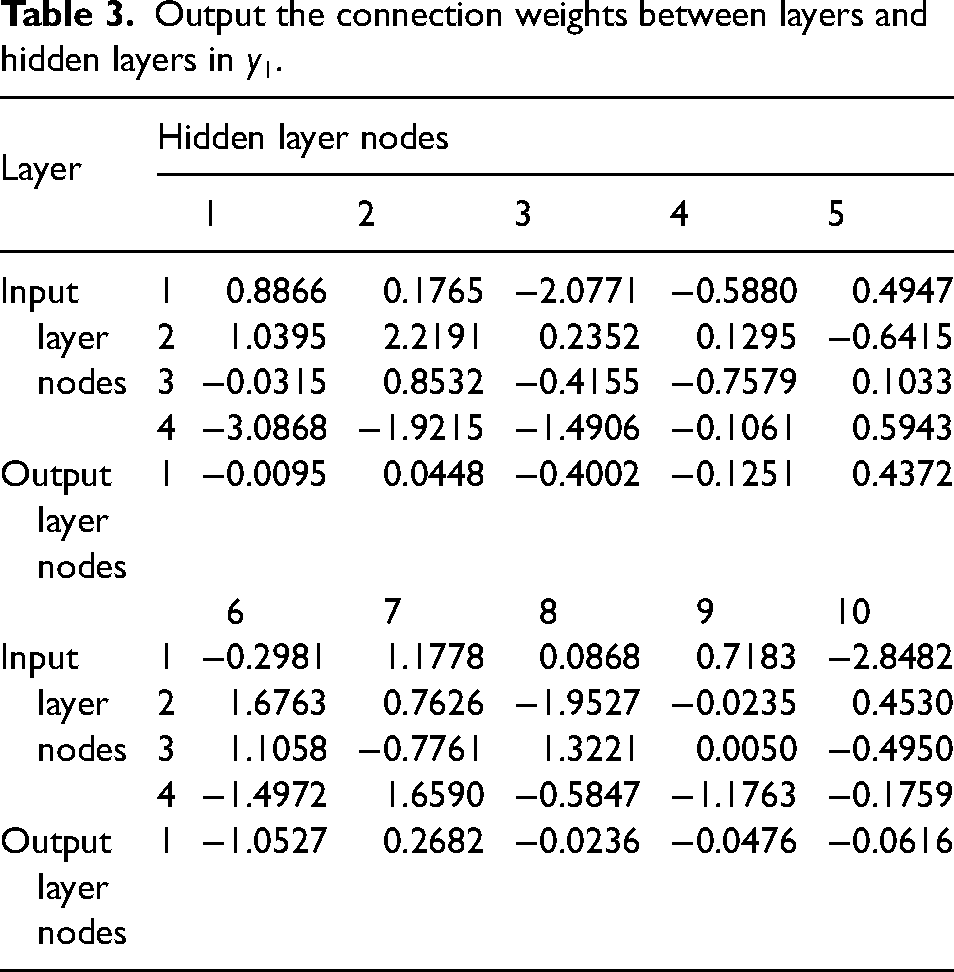
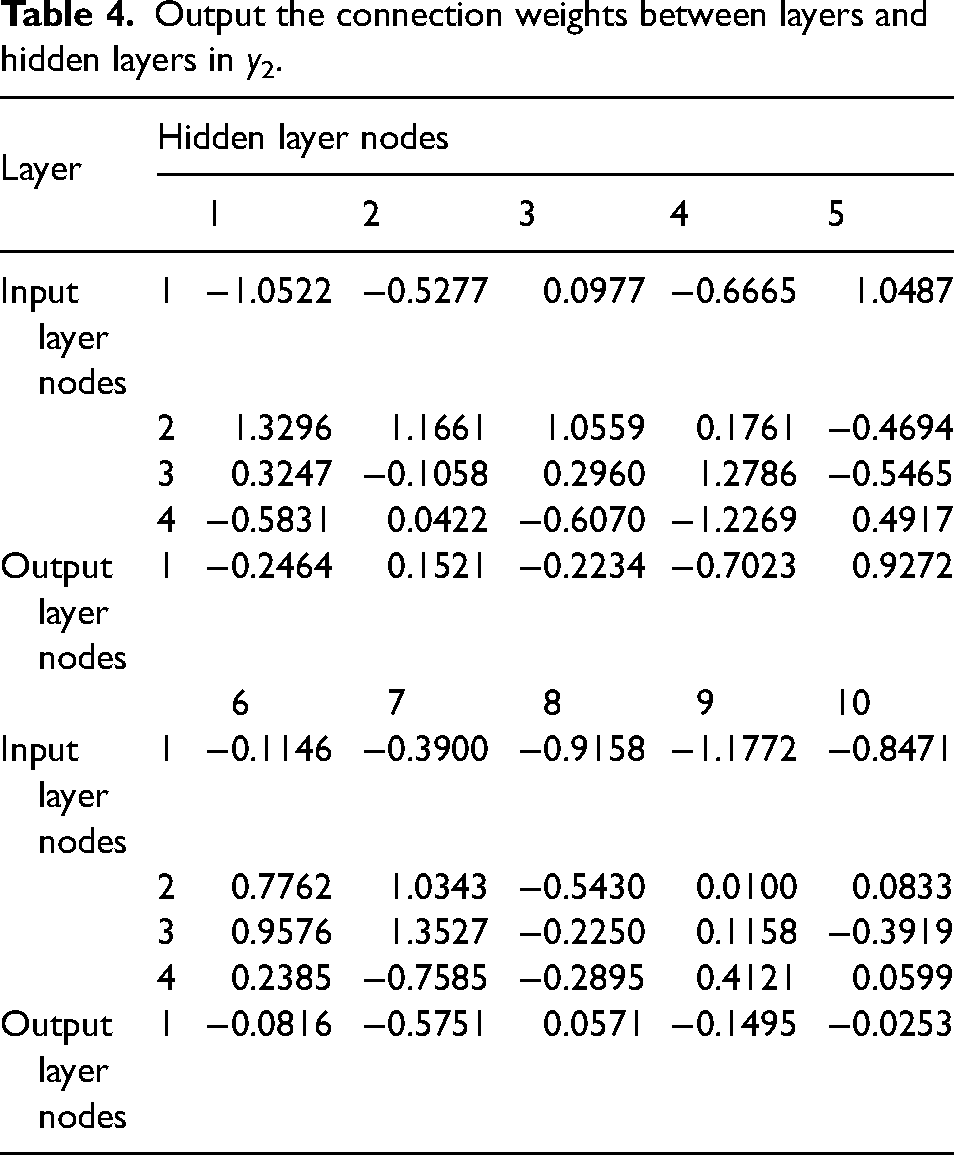
To verify the predictive ability of the trained genetic algorithm optimized back propagation (GA-BP) neural network model, this section mainly uses the network model to predict and analyze the sample values. Figures 16 and 17 show the difference between the sample values and the predicted values of tempering zone width and tempering zone depth in the laser quenching, respectively. The results show that the error between the sample and predicted values is modest, and the degree of agreement is high, indicating that the GA-BP neural network model has strong generalization ability and great prediction effect. The connection weights of the output parameters y1 and y2 obtained after training the BP neural network are shown in Tables 3 and 4. The training error of output parameter y1 is 0.0122, and the test error is 0.0179. The training error of output parameter y2 is 0.0033, and the test error is 0.0061.
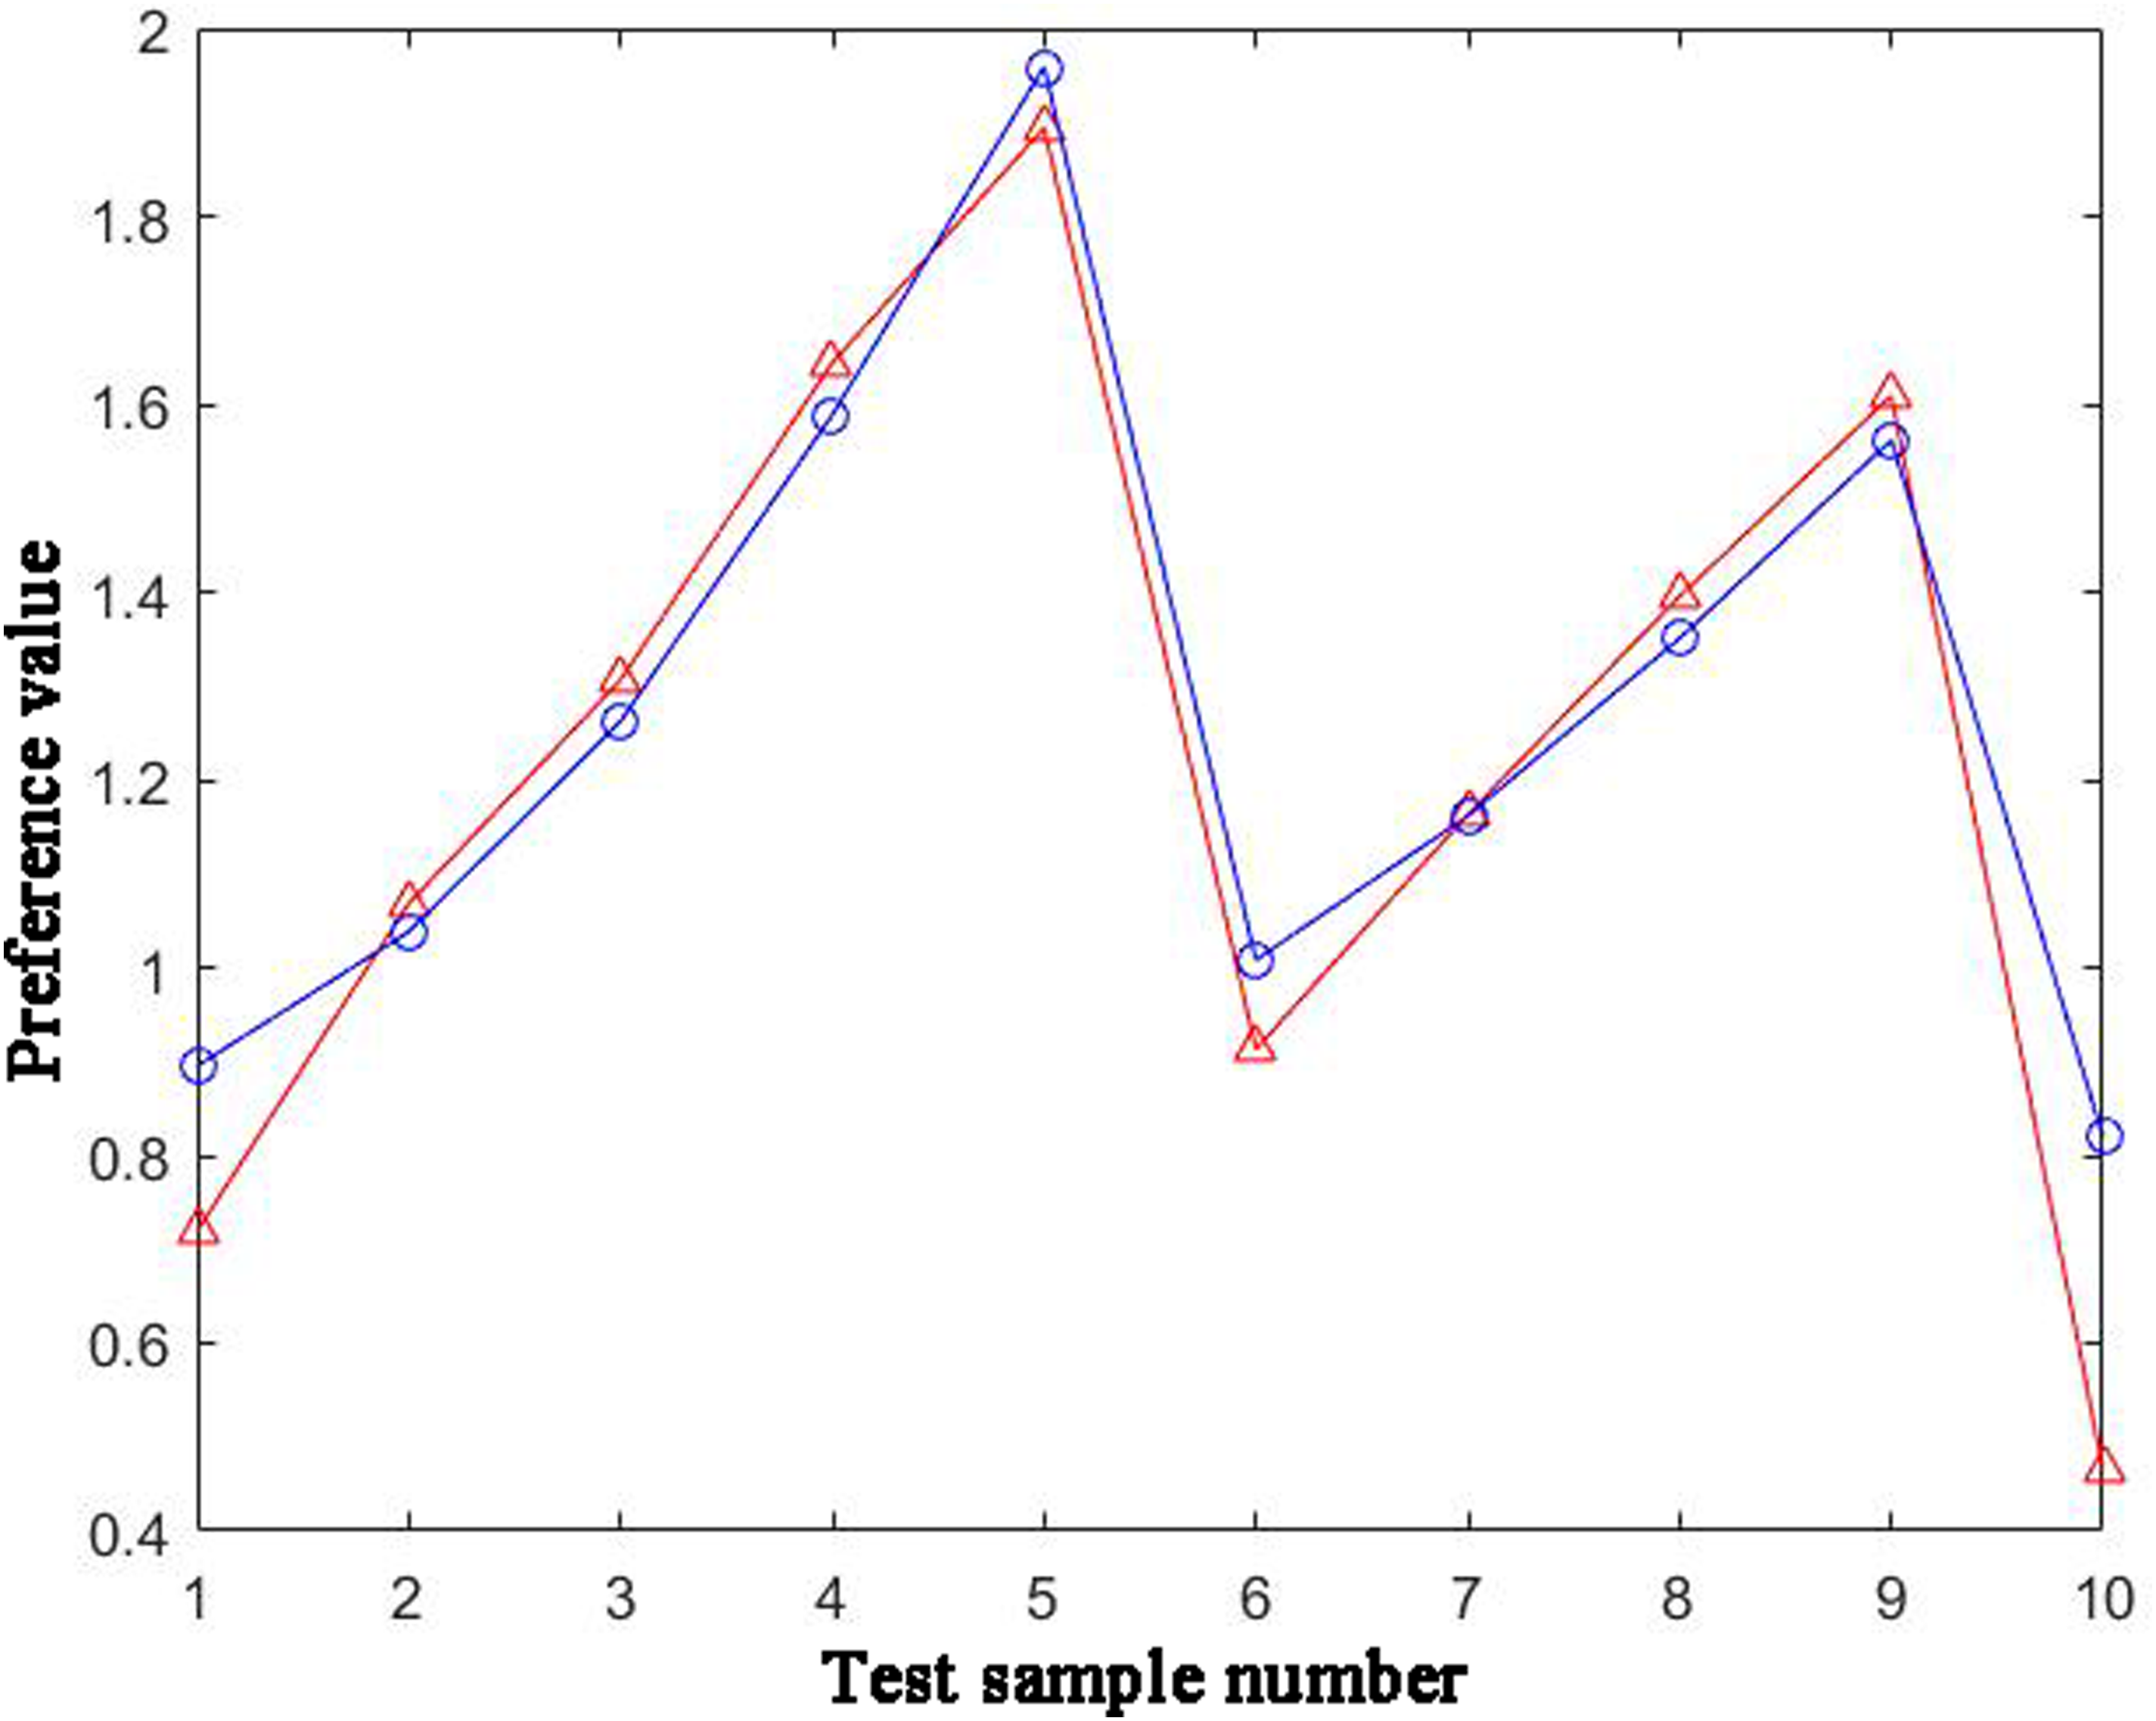
Comparison of sample value and predicted value for tempering zone width.
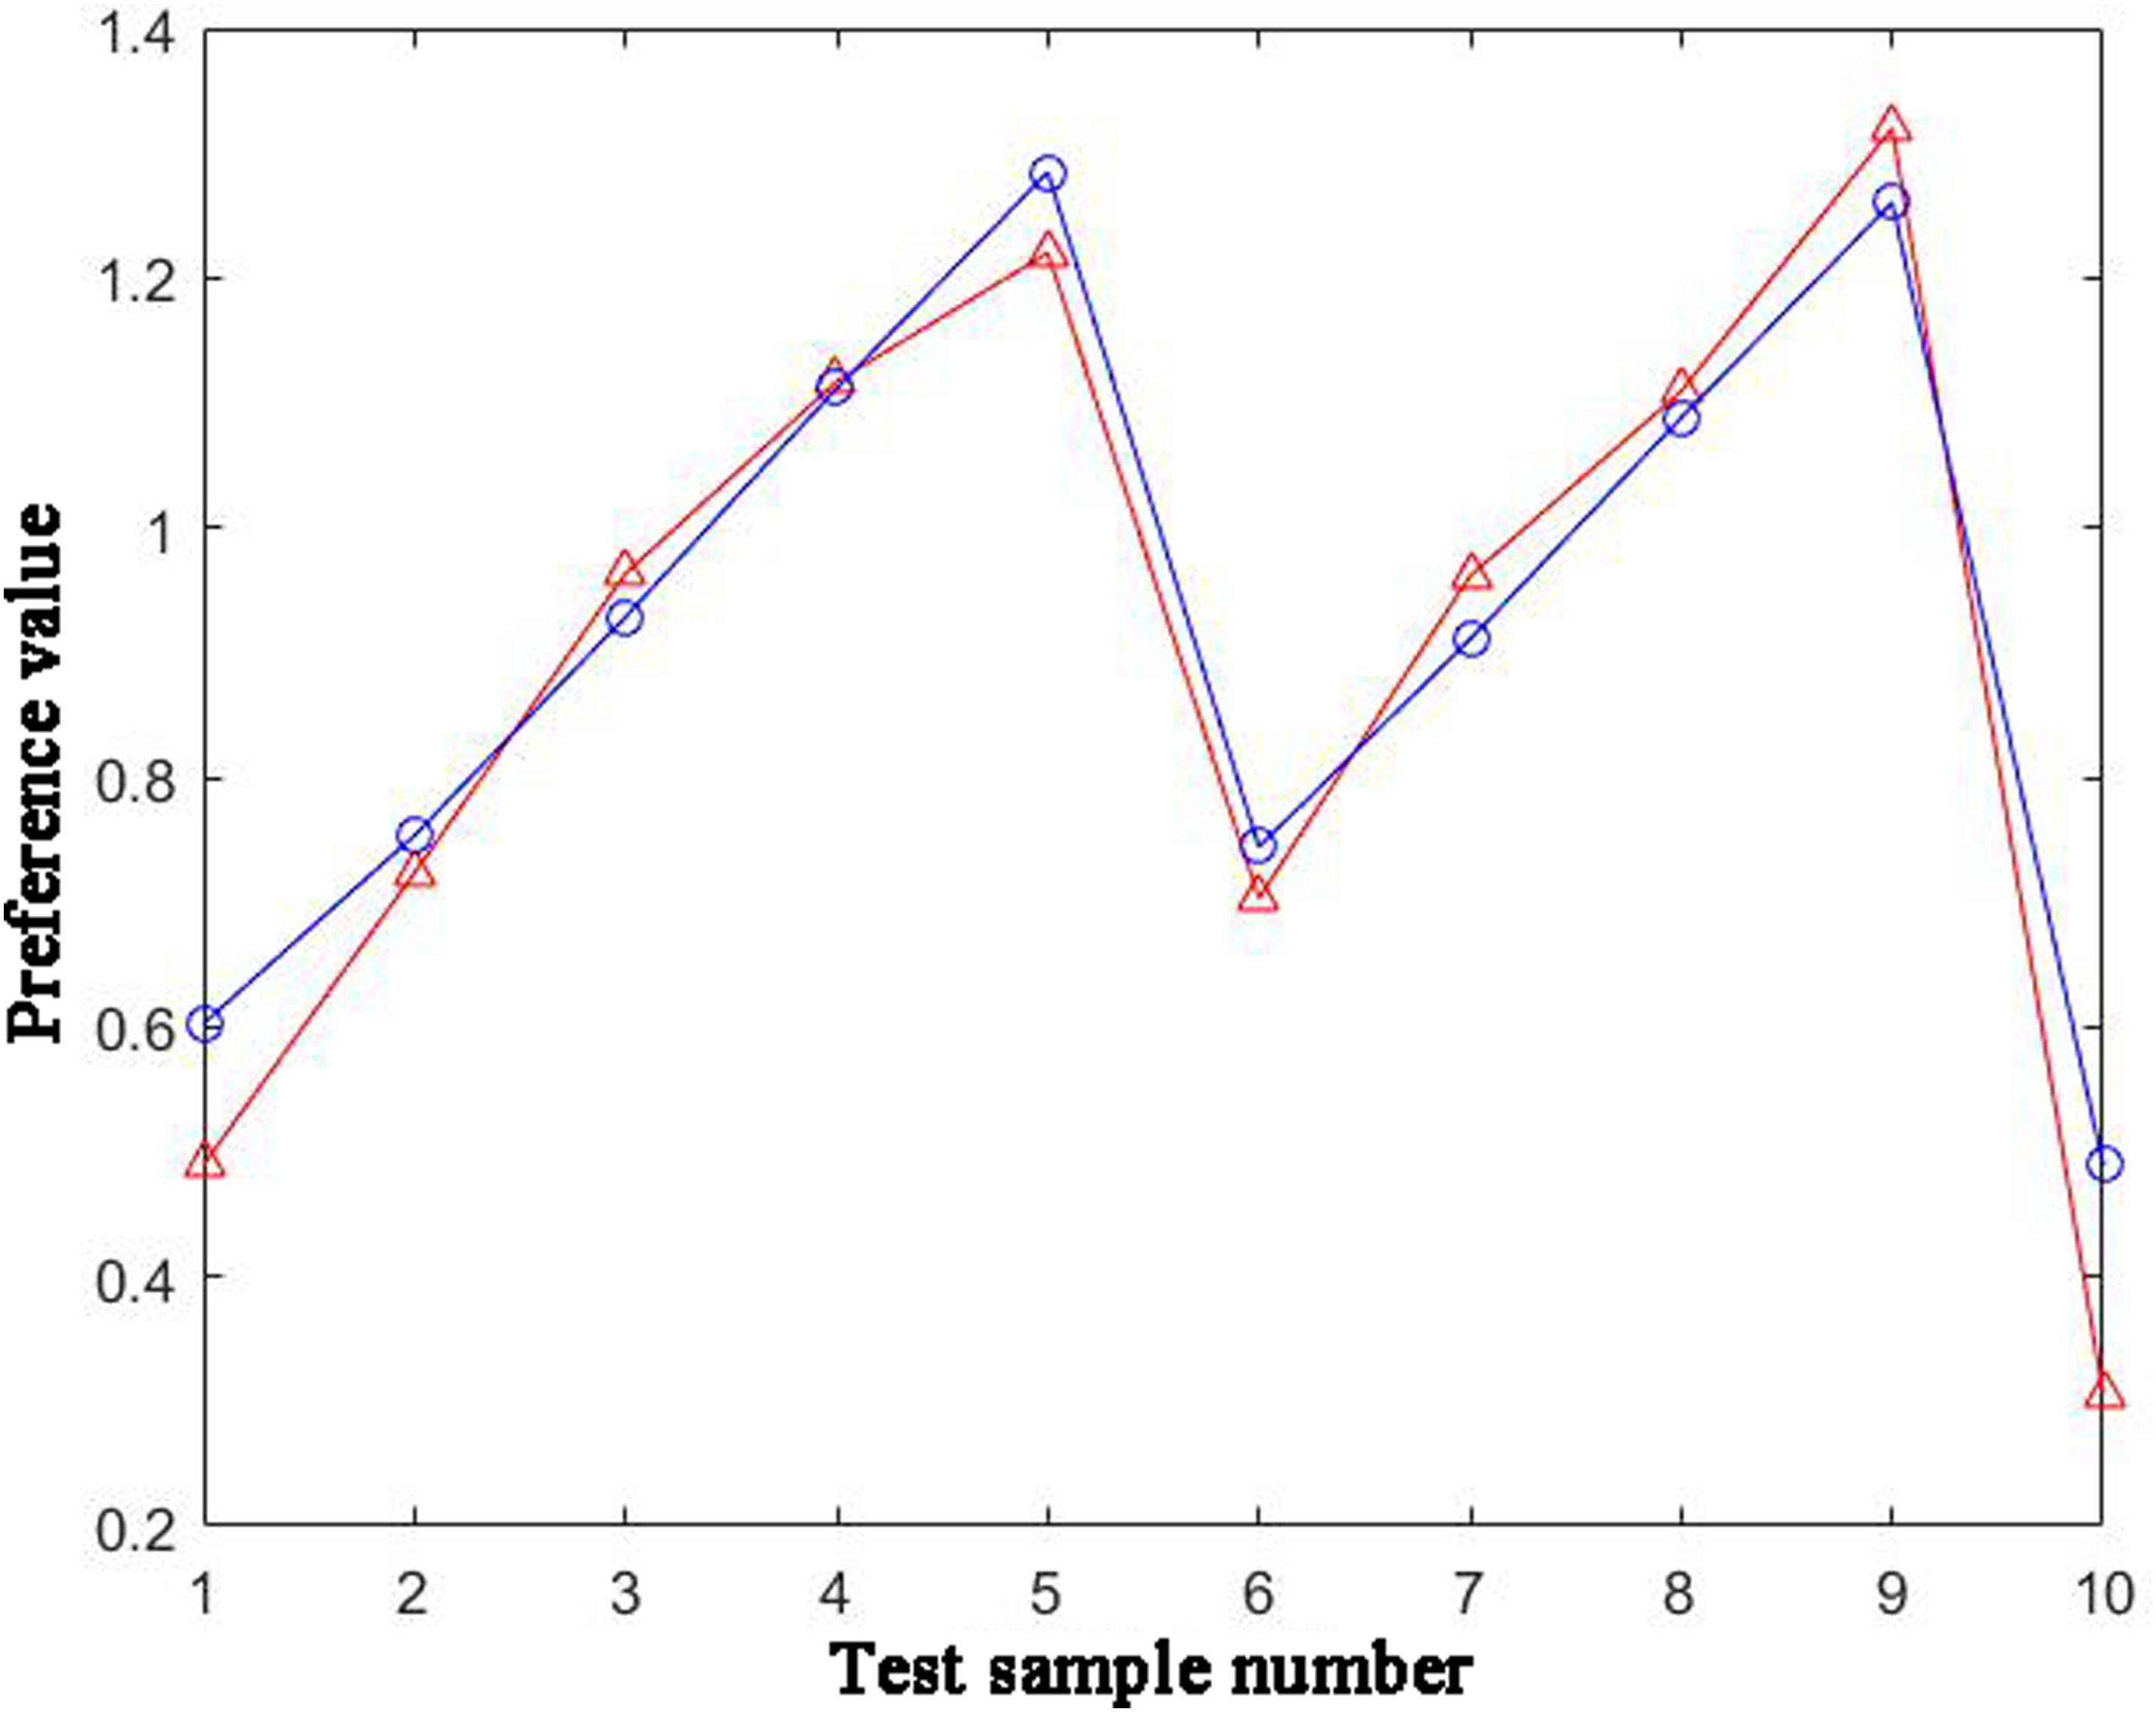
Comparison of sample value and predicted value for tempering zone depth.
Output the connection weights between layers and hidden layers in y1.
Output the connection weights between layers and hidden layers in y2.
By examining the fitness value as the termination condition for iteration, when the fitness value infinitely approaches to zero, the output results are better. Figure 18 shows that when the number of iterations reaches 200 times, the output results approach to the sample values. The optimal parameters of laser quenching process were obtained as follows: laser spot power of 2848 W, scanning speed of 58 mm/s, spot diameter of 9.7 mm, and laser overlap rate of 0.43, the width of the tempering zone is 2.206 mm, and the depth of the tempering zone is 1.069 mm. By using the optimal process parameters for multi-pass laser quenching experiments on gears, a finer martensitic structure, a deeper hardened layer, and a more uniform surface of the parts can be obtained.
Optimization iteration curve.
Laser quenching experiments based on disc lasers
Experimental blocks of 40Cr steel were selected for laser hardening experiments with single and multiple overlays respectively, as shown in Figure 19. A disc laser was used for laser quenching of 40Cr steel in the experiment. The disc is thin and has a large diameter-to-thickness ratio, which enables timely and effective cooling, resulting in a uniform temperature distribution within the crystal, improving beam quality and conversion efficiency. Therefore, the output power is relatively stable. The samples were prepared by corroding with a 4% nitric acid ethanol solution, and the microstructure characteristics of the samples were analyzed using an Axioskop 2 scanning electron microscope. A QNESS-Q10 M Vickers microhardness tester was used to press a point every 0.1 mm along the surface and depth direction of the hardened layer, as shown in Figure 20. To reduce measurement errors and ensure accuracy of the results, the weighted averaging for five points at the same horizontal position was took as the final measurement value. The MS-T300 ball-disc friction and wear tester were used to analyze the wear resistance of the quenched layer and substrate, as shown in Figure 21.
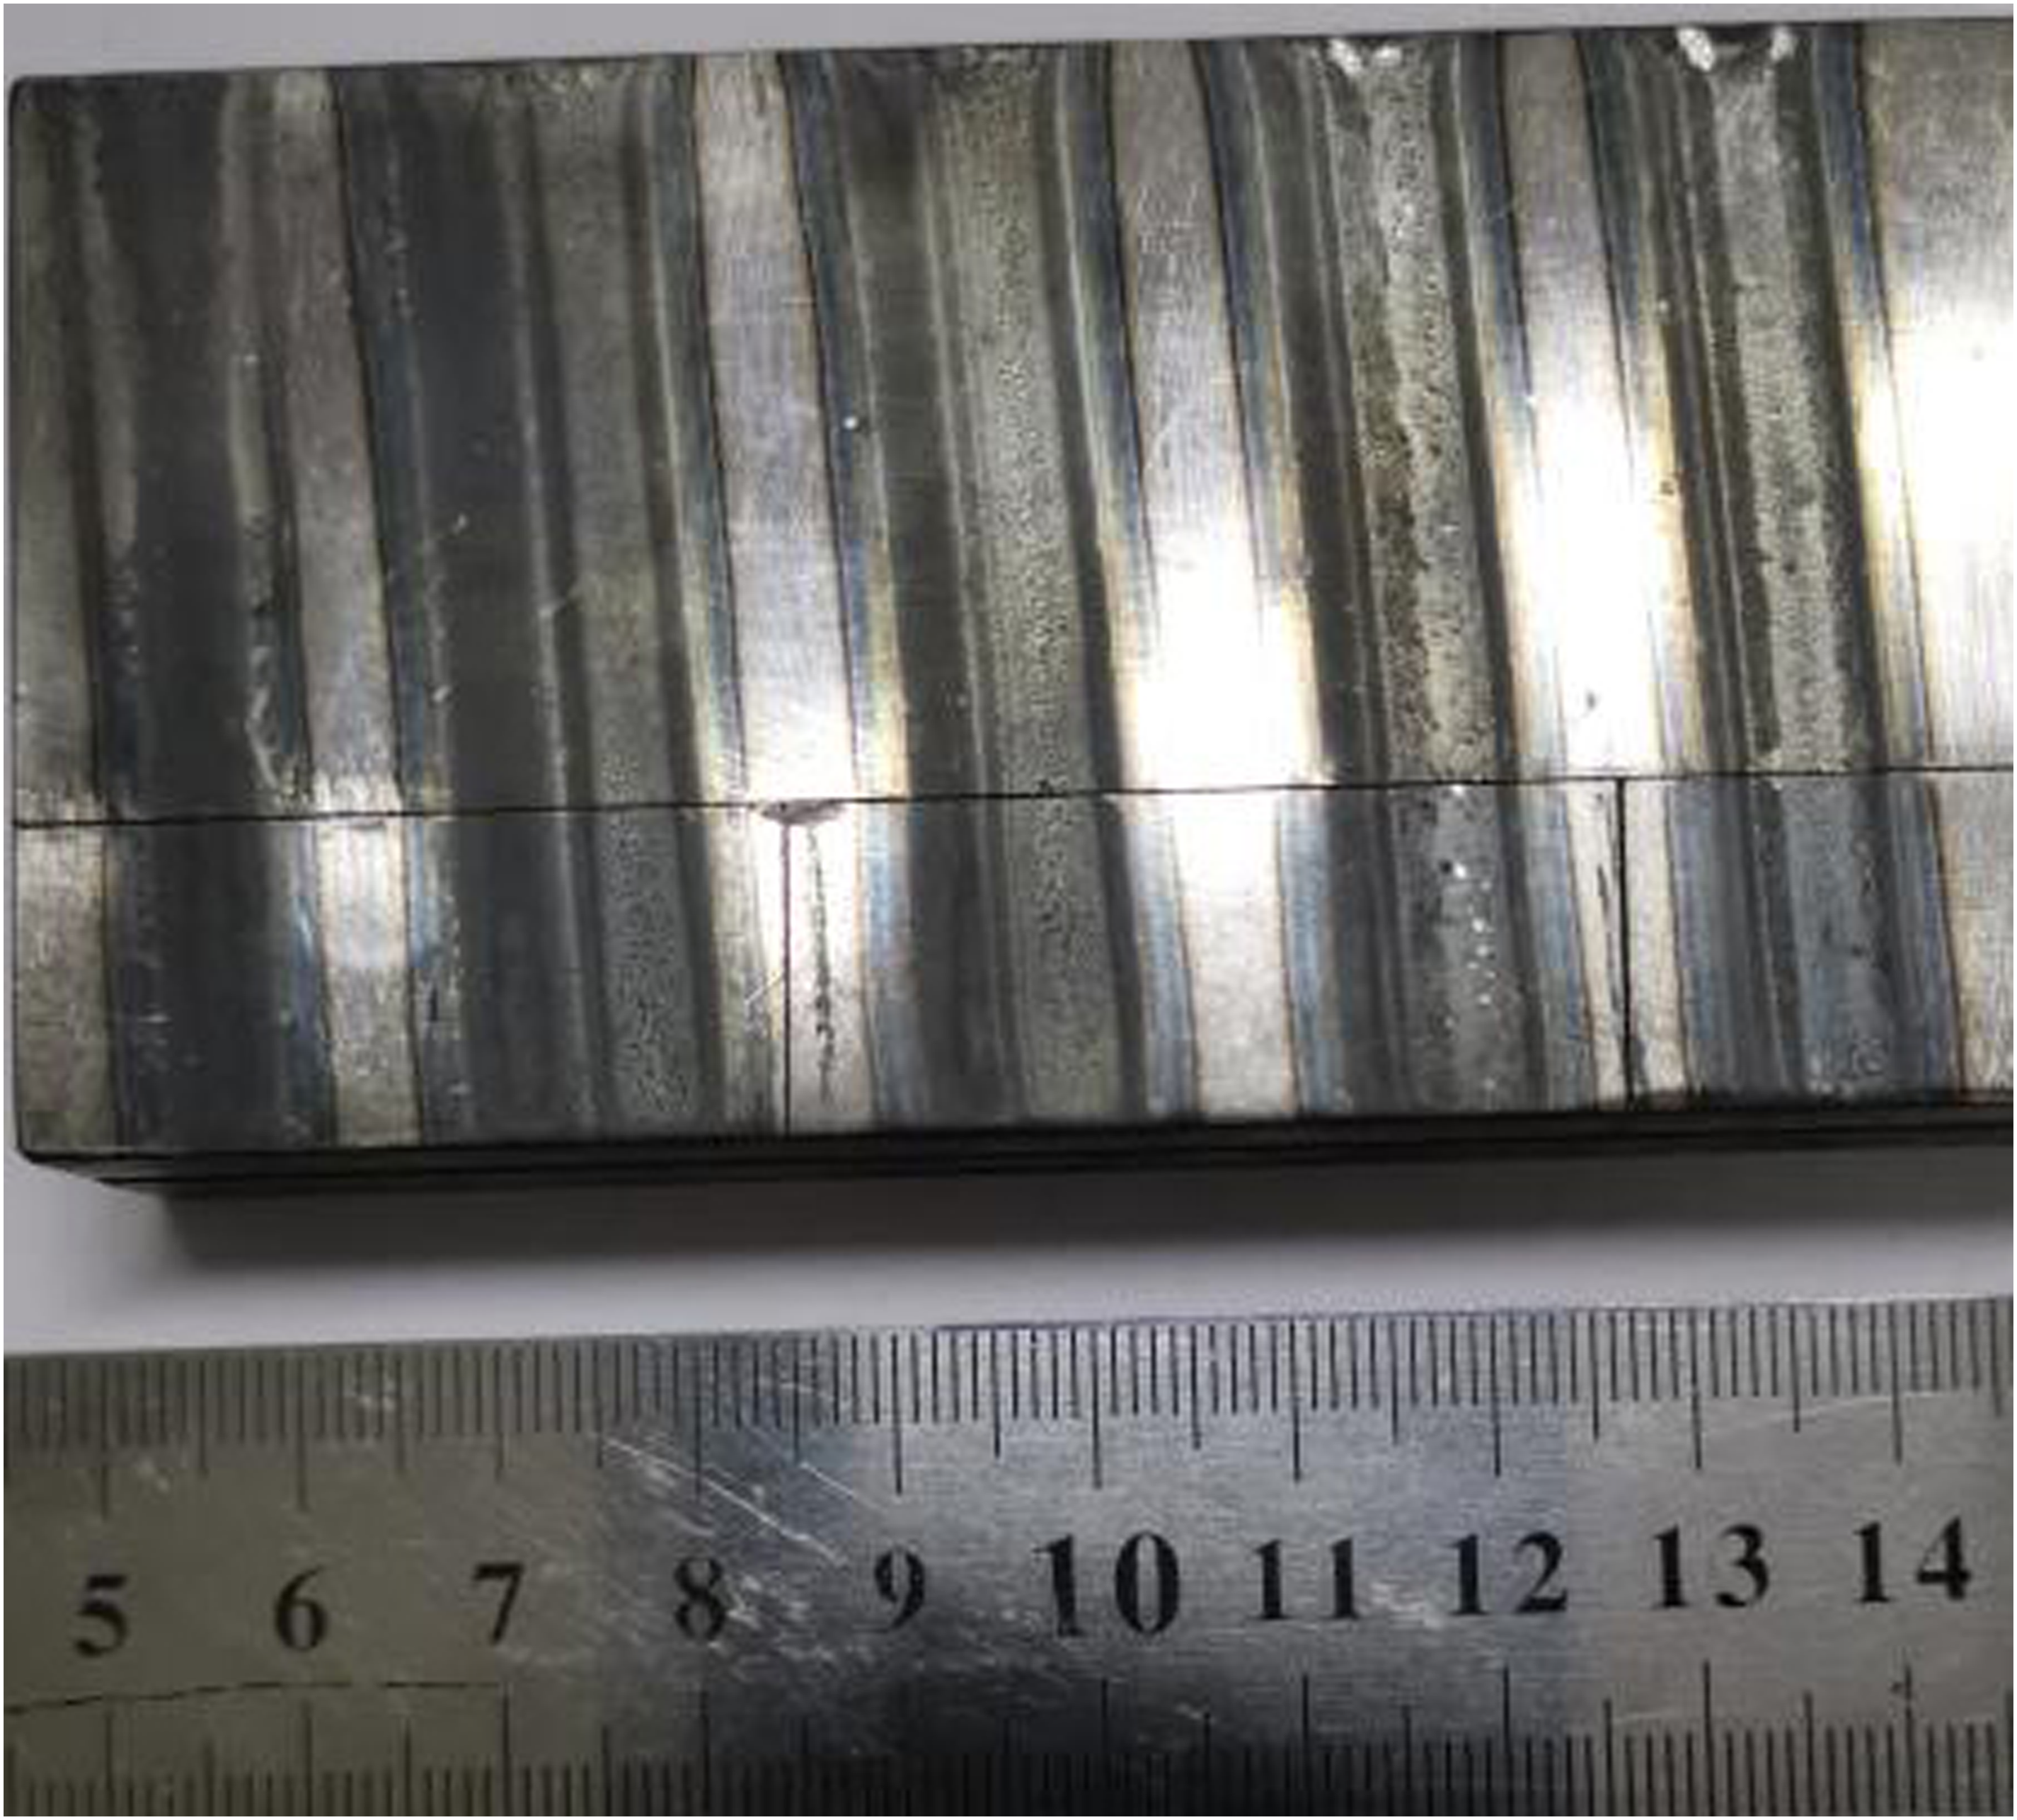
The laser quenched sample of multi-track overlapping40Cr steel.
Hardness indentation along the longitudinal depth of the hardened layer.
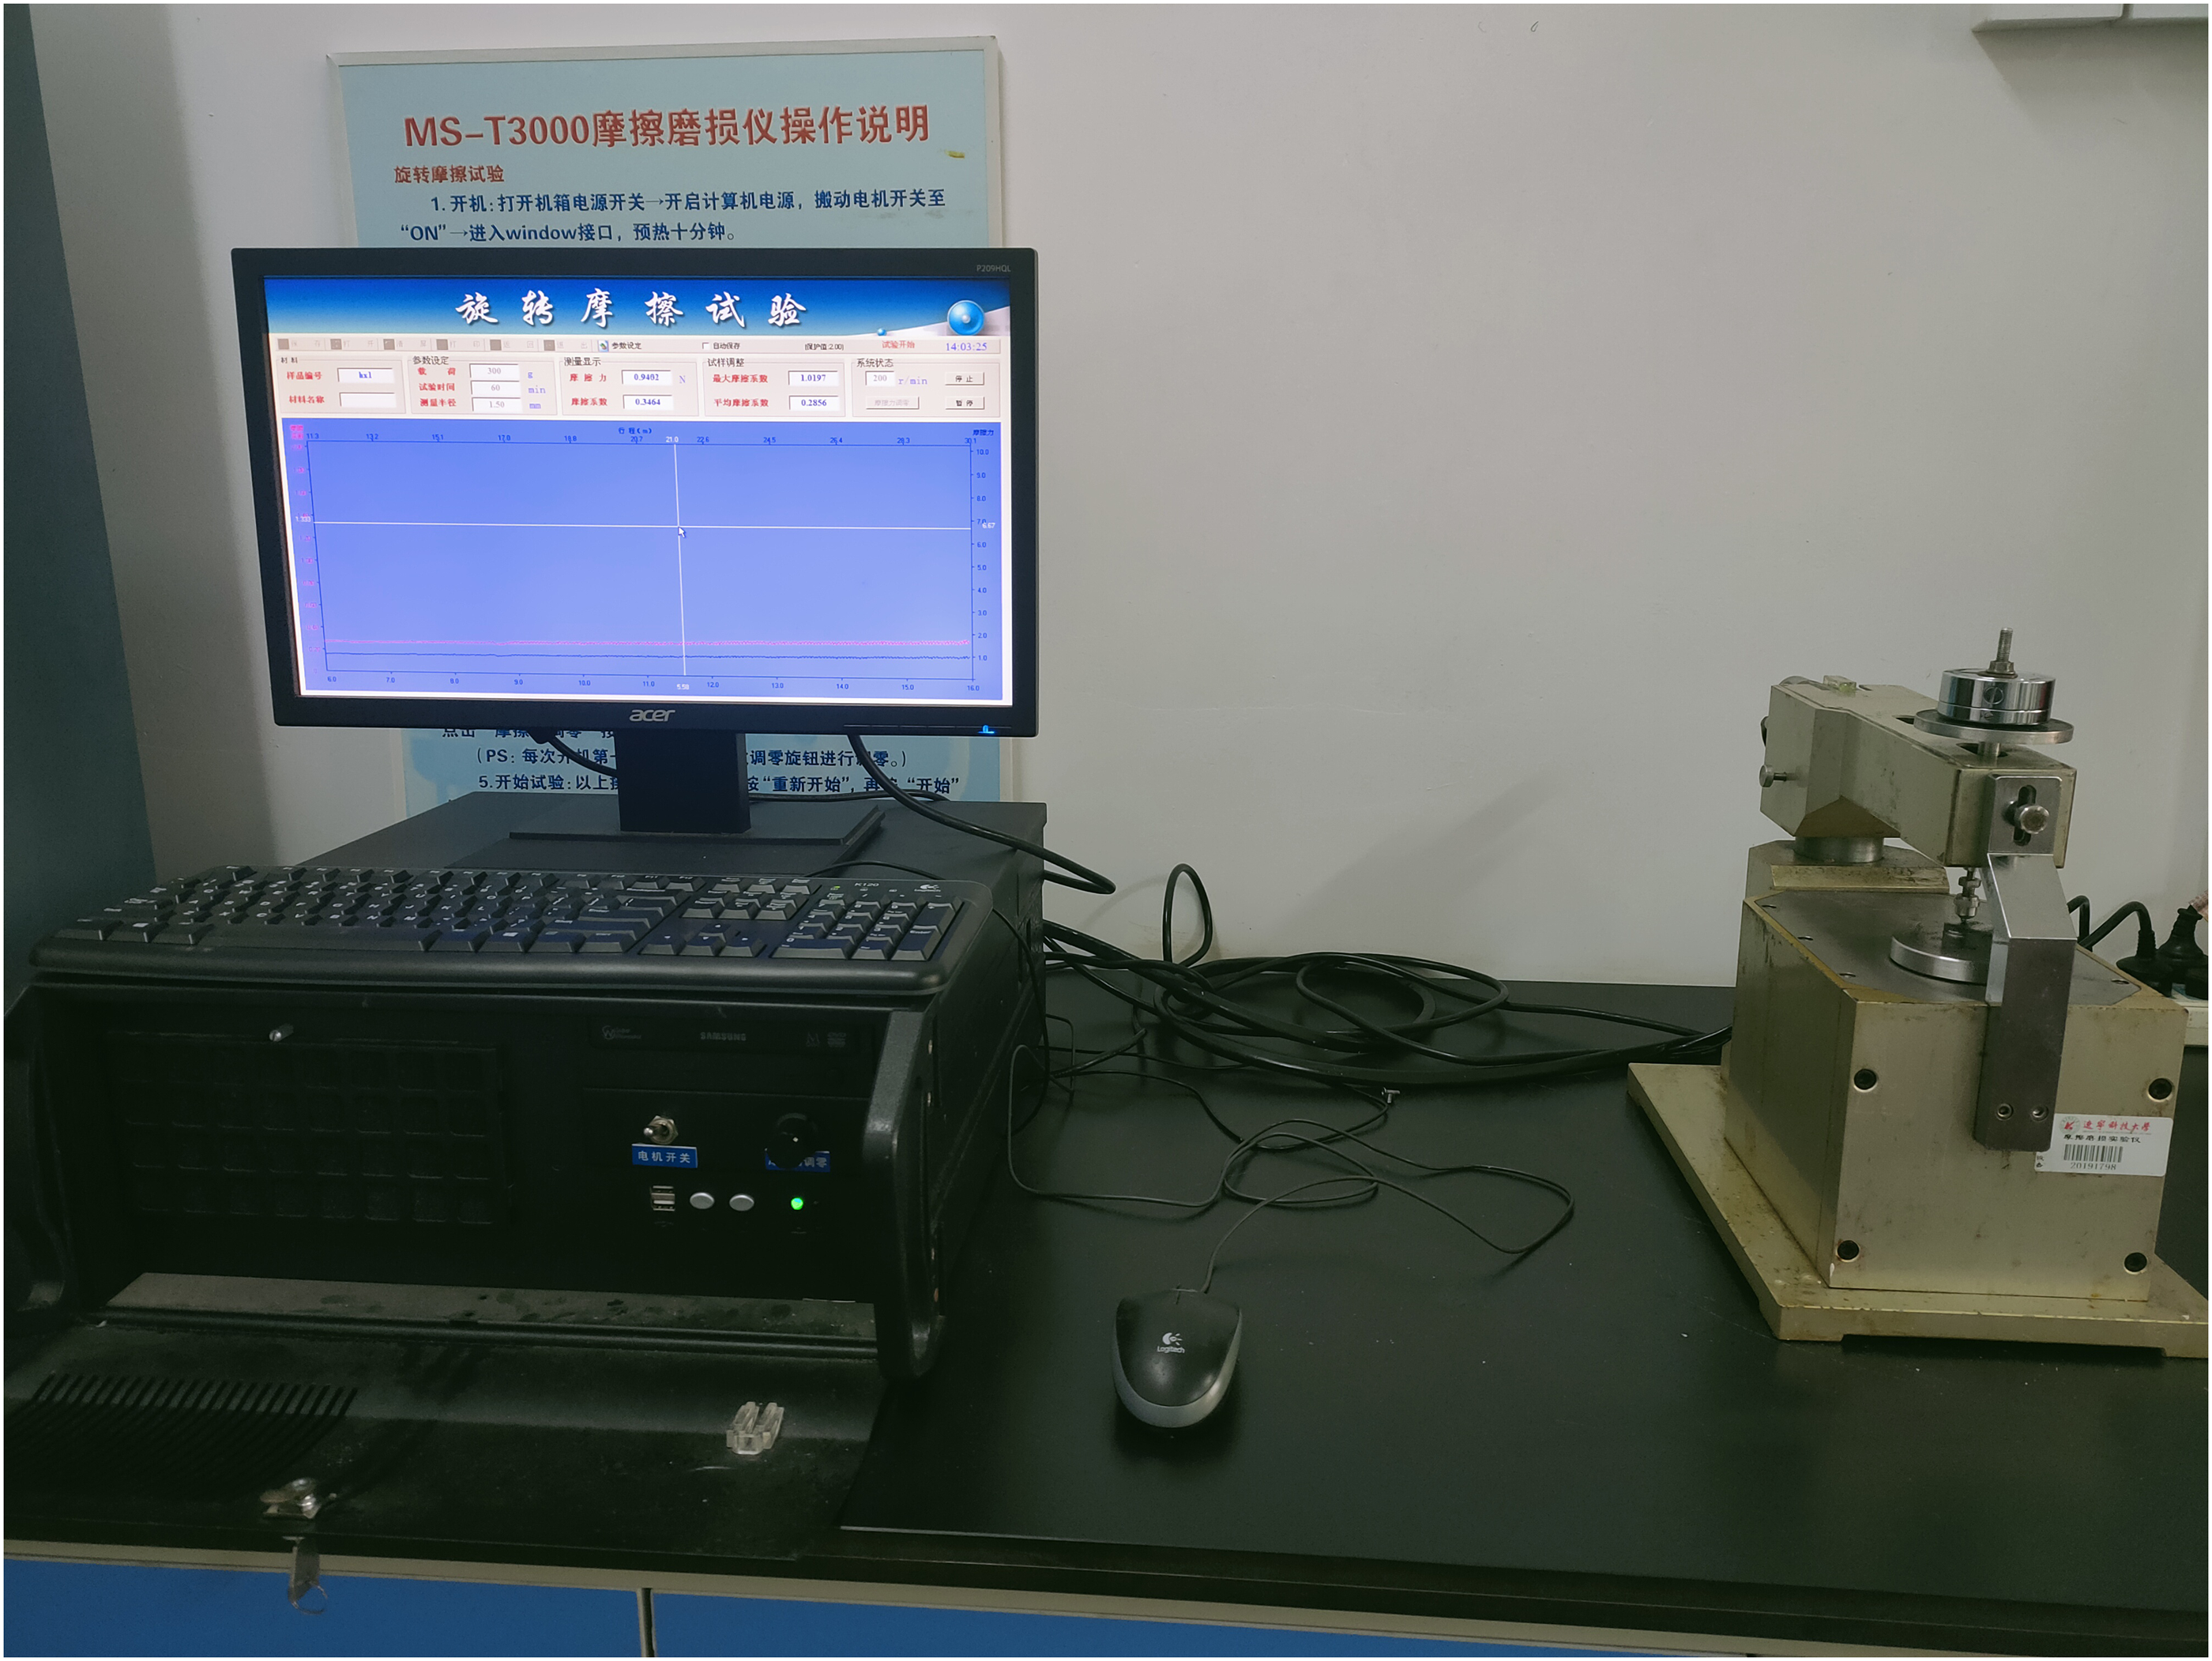
MS-T300 friction and wear tester.
Laser quenching microstructure
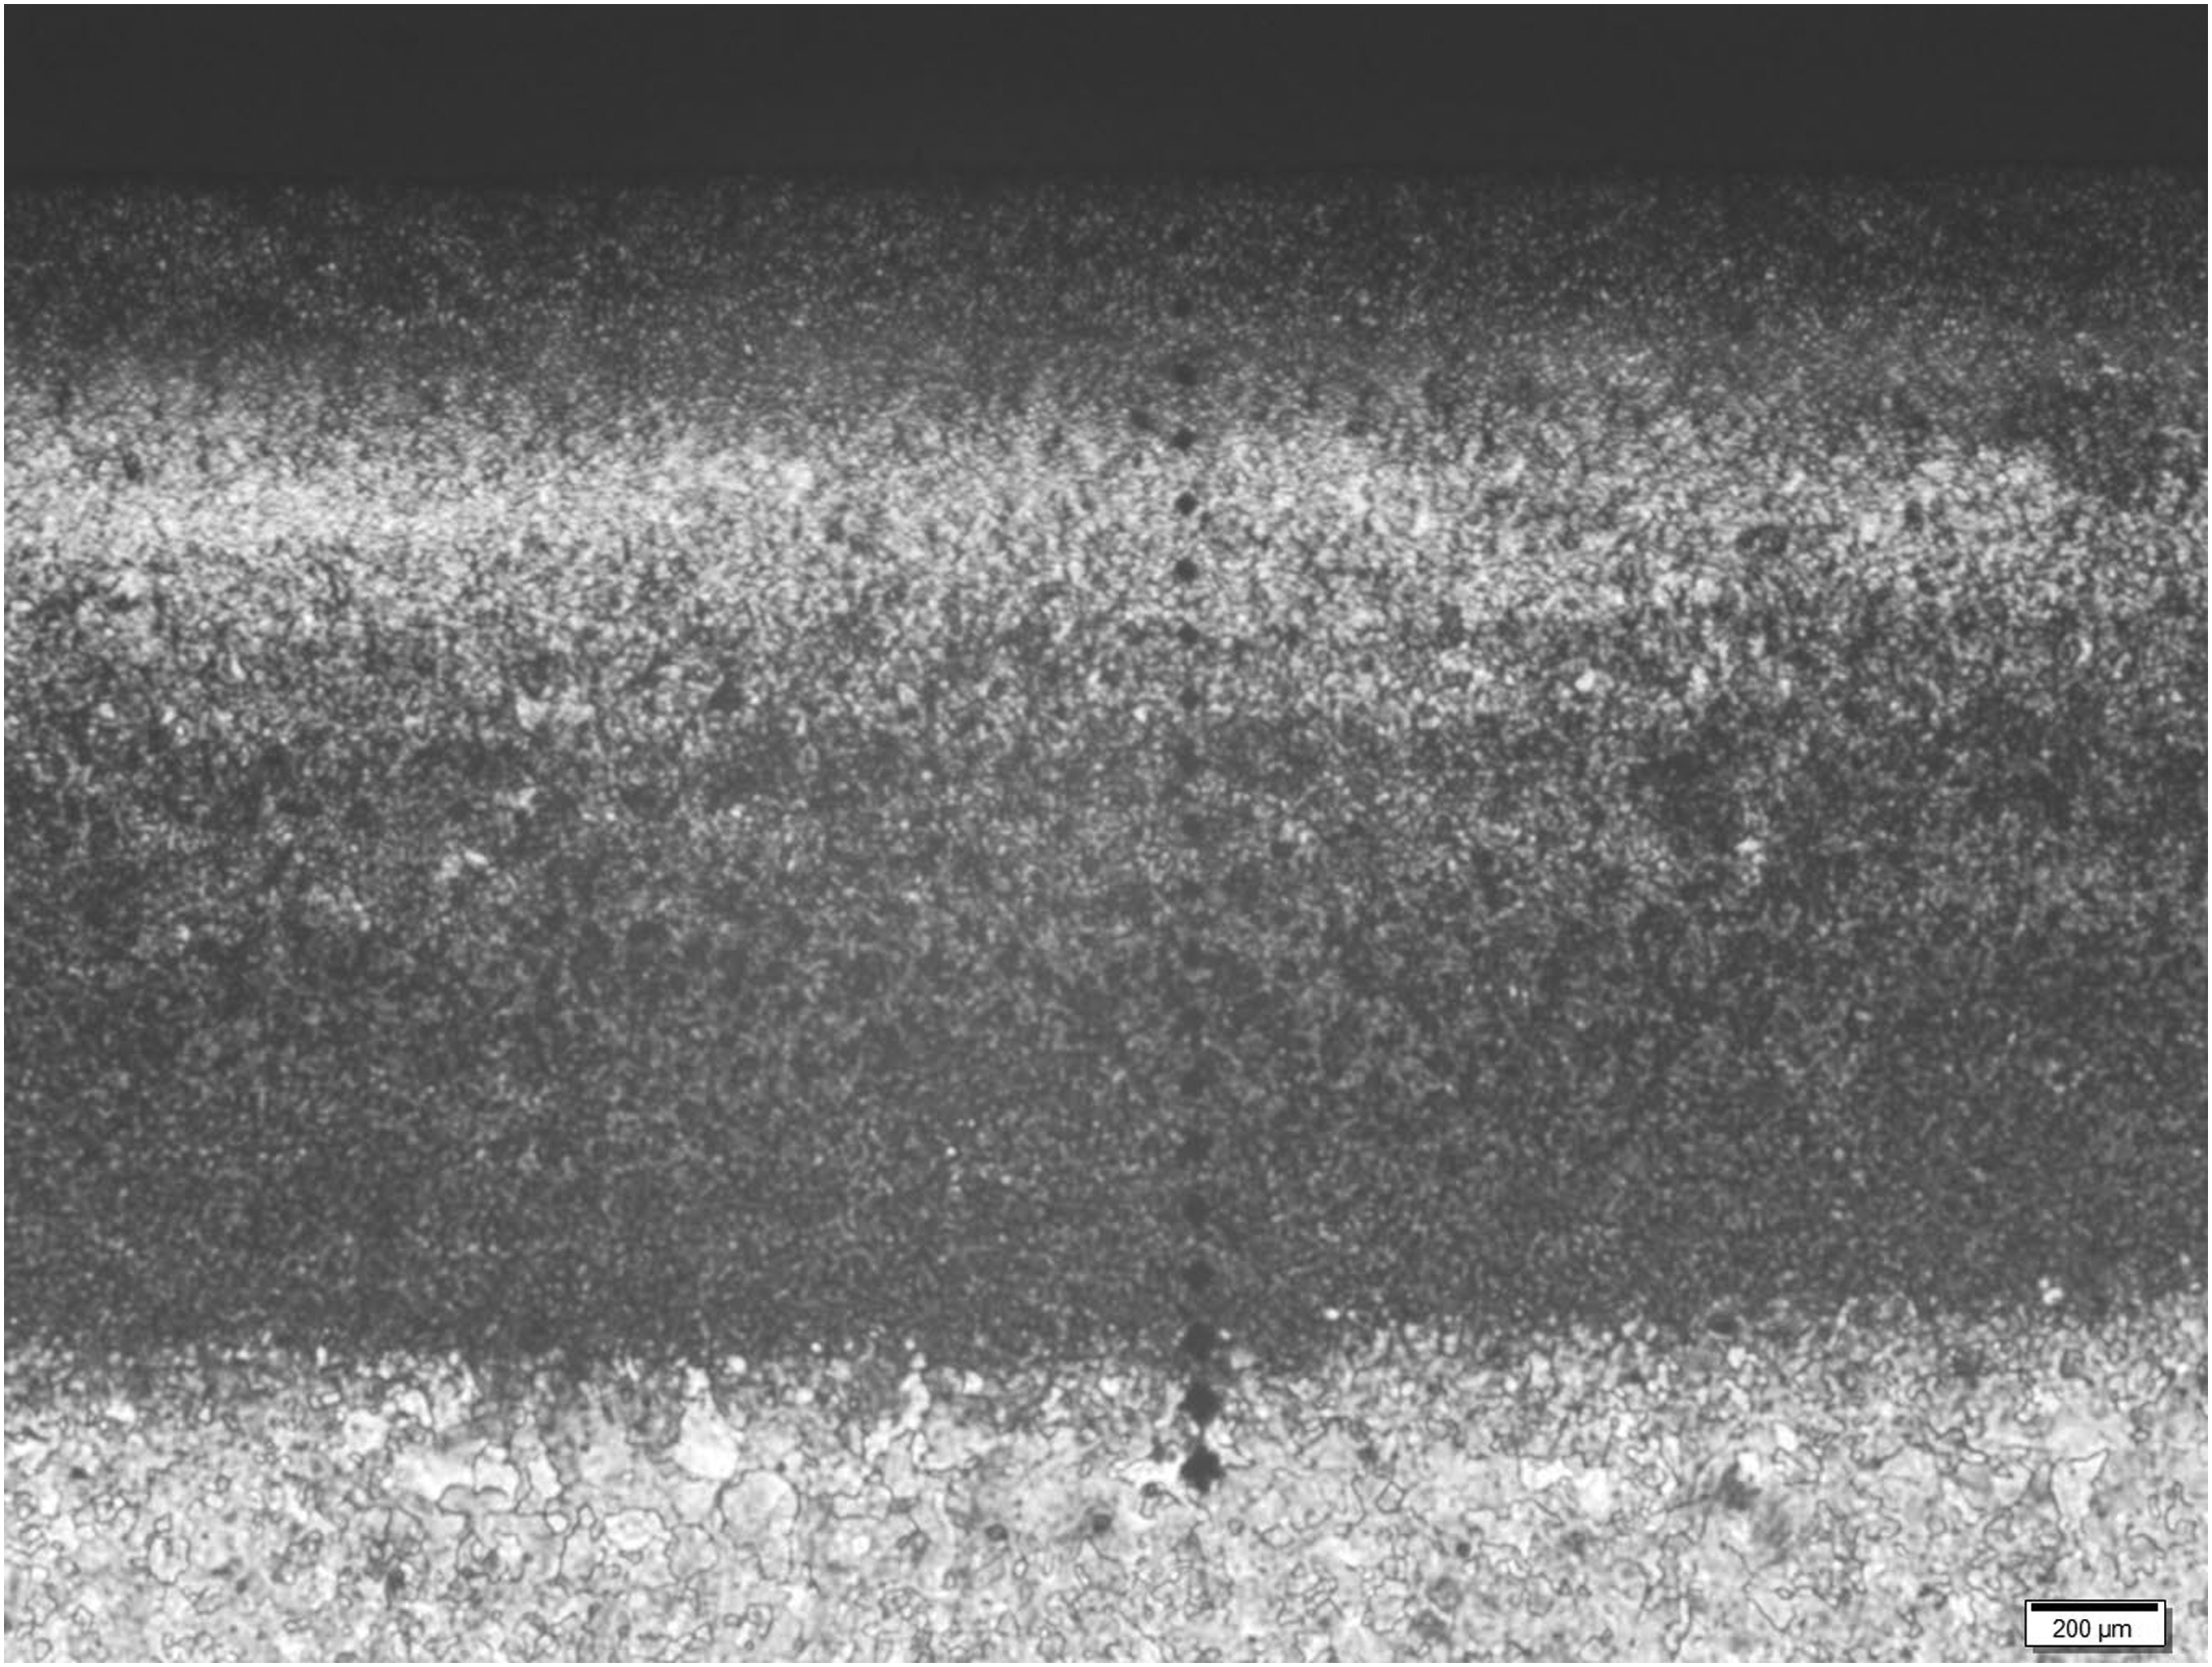
The microstructure of 40Cr steel laser quenched hardened layer profile is shown in Figure 22. SEM (scanning electron microscope) was used to characterize the microstructure of 40Cr steel in the tempering zone. The specimen has obvious phase transformation hardening phenomenon, from the surface to the inside, there are complete phase transformation zone, heat affected zone and substrate. The complete phase transformation zone is a mixture of martensite and a modest amount of residual austenite. During the sample heating, when the temperature exceeds Ac3, the substrate immediately undergoes austenitization, and the austenitization degree is relatively high in the areas with high temperature. The resulting martensitic structure exhibits better stability, as shown in Figure 22(a). The heat-affected zone has a slightly lower temperature than the complete transformation zone, with the temperature ranging from Ac1 to Ac3 during heating and a shorter heating time. This results in incomplete transformation of ferrite to austenite, leading to a mixed structure of the bainite, ferrite, and pearlite. The SEM characterization of the heat-affected zone for the 40Cr steel sample, finding feather-like bainite, a modest amount of pearlite and ferrite, as shown in Figure 22(b). As the temperature of the substrate always remains below Ac1, atomic diffusion and migration are not significant, and no phase transformation occurs. Therefore, the microstructure remains in its original state, consisting of pearlite and ferrite, as shown in Figure 22(c). The latter laser greatly influences the tissue changes in the overlap zone, and a part of the overlap zone will leave a tempering softening zone, whose tissue transforms into tempered martensite, as shown in Figure 22(d). The shape of tempered martensite is similar to that of fully quenched martensite zone, with a lamellar structure. The tempered martensite exhibits inferior comprehensive properties, with lower hardness and greater susceptibility to corrosion.
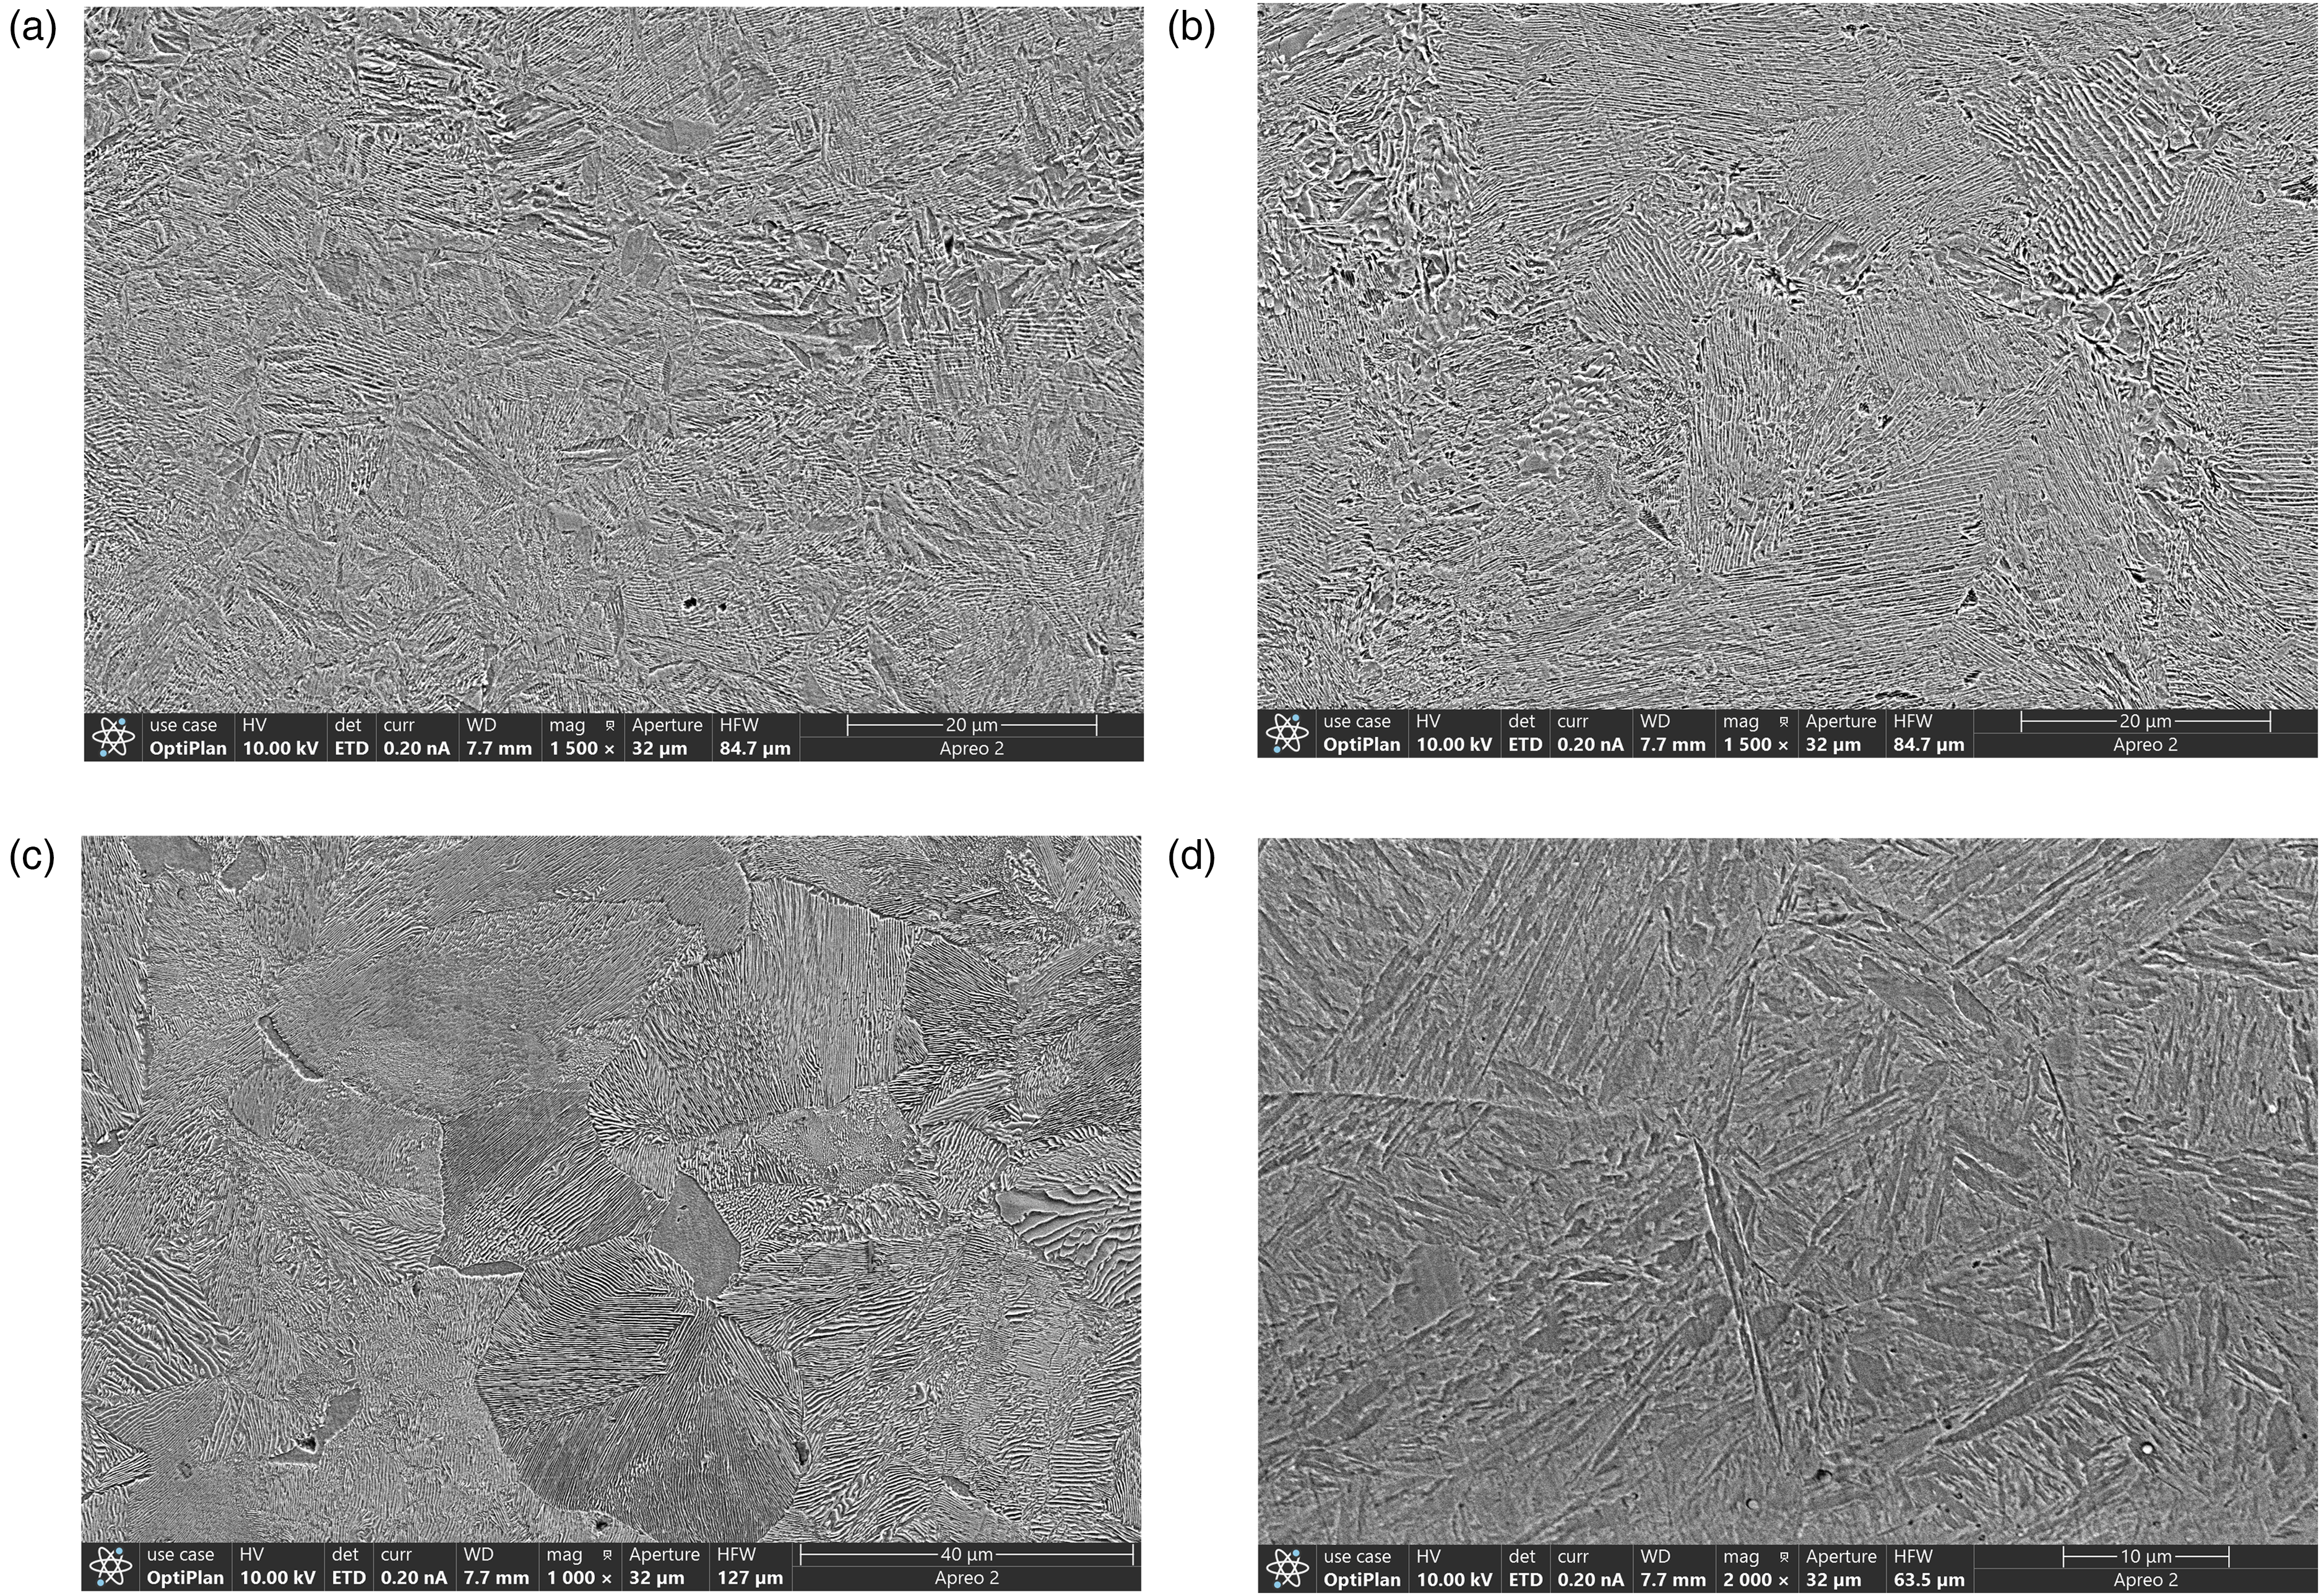
Microstructure of 40Cr steel multi-pass laser quenching section: (a) complete phase transformation zone, (b) heat affected zone, (c) substrate, and (d) tempering zone.
Quenching hardness distribution
The microhardness distribution on the surface of the laser quenched hardened layer is shown in Figure 23(a). Upon the first laser scan, the hardness curve exhibits a peak value above 900 HV. In the laser overlap region, complete and incomplete tempering phenomena occur, resulting in a stepwise decrease in the hardness curve, which reaches its minimum value of approximately 424 HV in the high-temperature tempering zone. The microhardness distribution in the depth direction of the tempering zone is shown in Figure 23(b). As the overlap rate increases, the width and depth of the tempering zone increase with the increase in laser overlap rate. After the tempering zone, the part enters the rear quenching zone. Due to the certain preheating effect of the first laser scan on the substrate, the second laser scan has a large thermal influence zone, which further increases the surface hardness of the second laser quenched layer. Therefore, a second peak value appears on the hardness curve, which is slightly higher than the first peak value. The analysis indicates that the higher the overlap rate, the more uniform the surface hardness of the phase transformation hardened layer, but the larger the tempering softening zone, which leads to defects on the part surface. Conversely, the hardness overlap rate is too low, the tempering softening zone decreases, and affecting the uniformity of the part surface hardness.
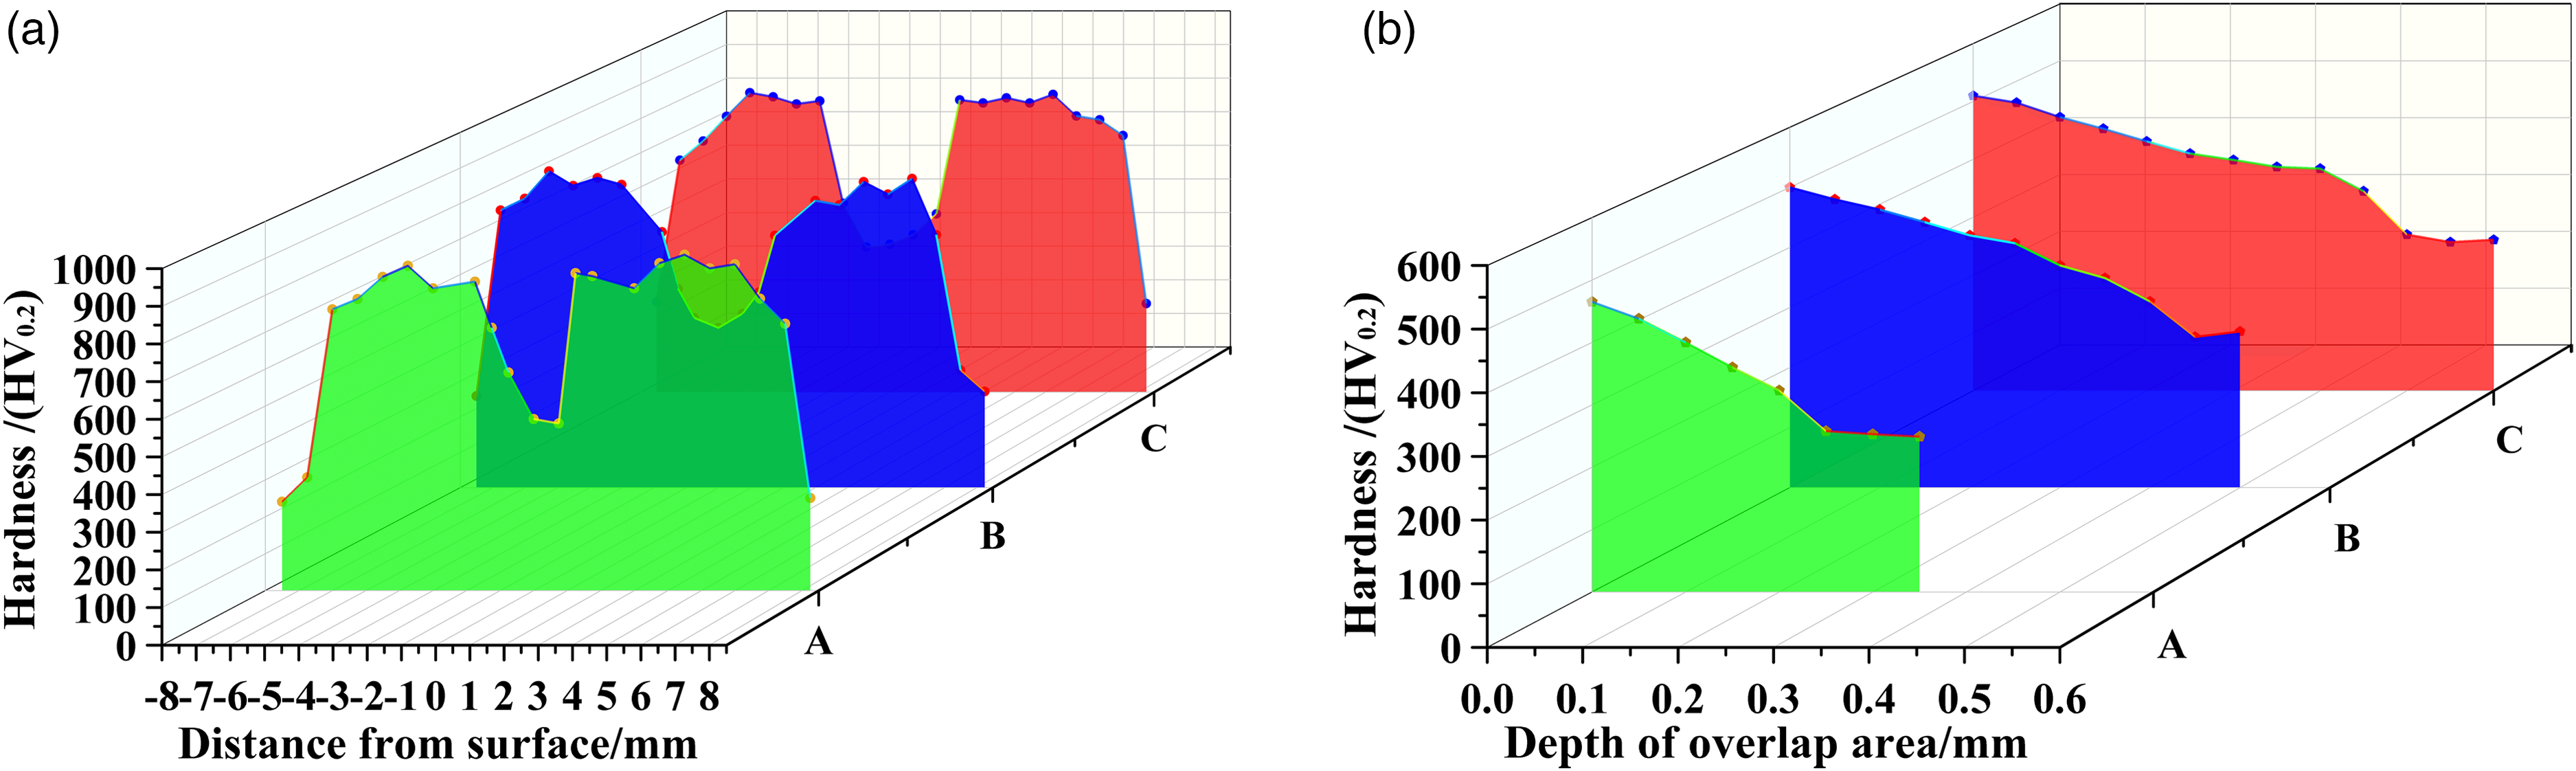
40Cr steel laser quenching microhardness at different positions: (a) microhardness distribution on the surface of the hardened layer and (b) microhardness distribution in the longitudinal direction of the tempering zone.
Wear resistance analysis
The friction coefficient of the quenched layer and the base layer varies with time is shown in Figure 24. The friction coefficient of the quenched layer starts off low and stabilizes after 30 min, with a final value of 0.549. This is due to the high surface temperature of the specimen when it is laser quenched, and an oxide film adheres to the surface of the part after it is cooled. The friction coefficient of the substrate layer fluctuates, which is due to the random motion of the abrasive chips on the material surface during the frictional wear, resulting in the constant change of the contact state between the small ball and the substrate. The friction coefficient of the substrate is relatively high, with a maximum value of 0.625. The wear resistance of the 40Cr sample is significantly improved after laser quenching. The surface quality of the quenched layer is better, the wear amount is less, and the wear amount is 19.6 mg. The surface quality of the substrate layer is poorer, and the wear amount is more, which is 21.8 mg.
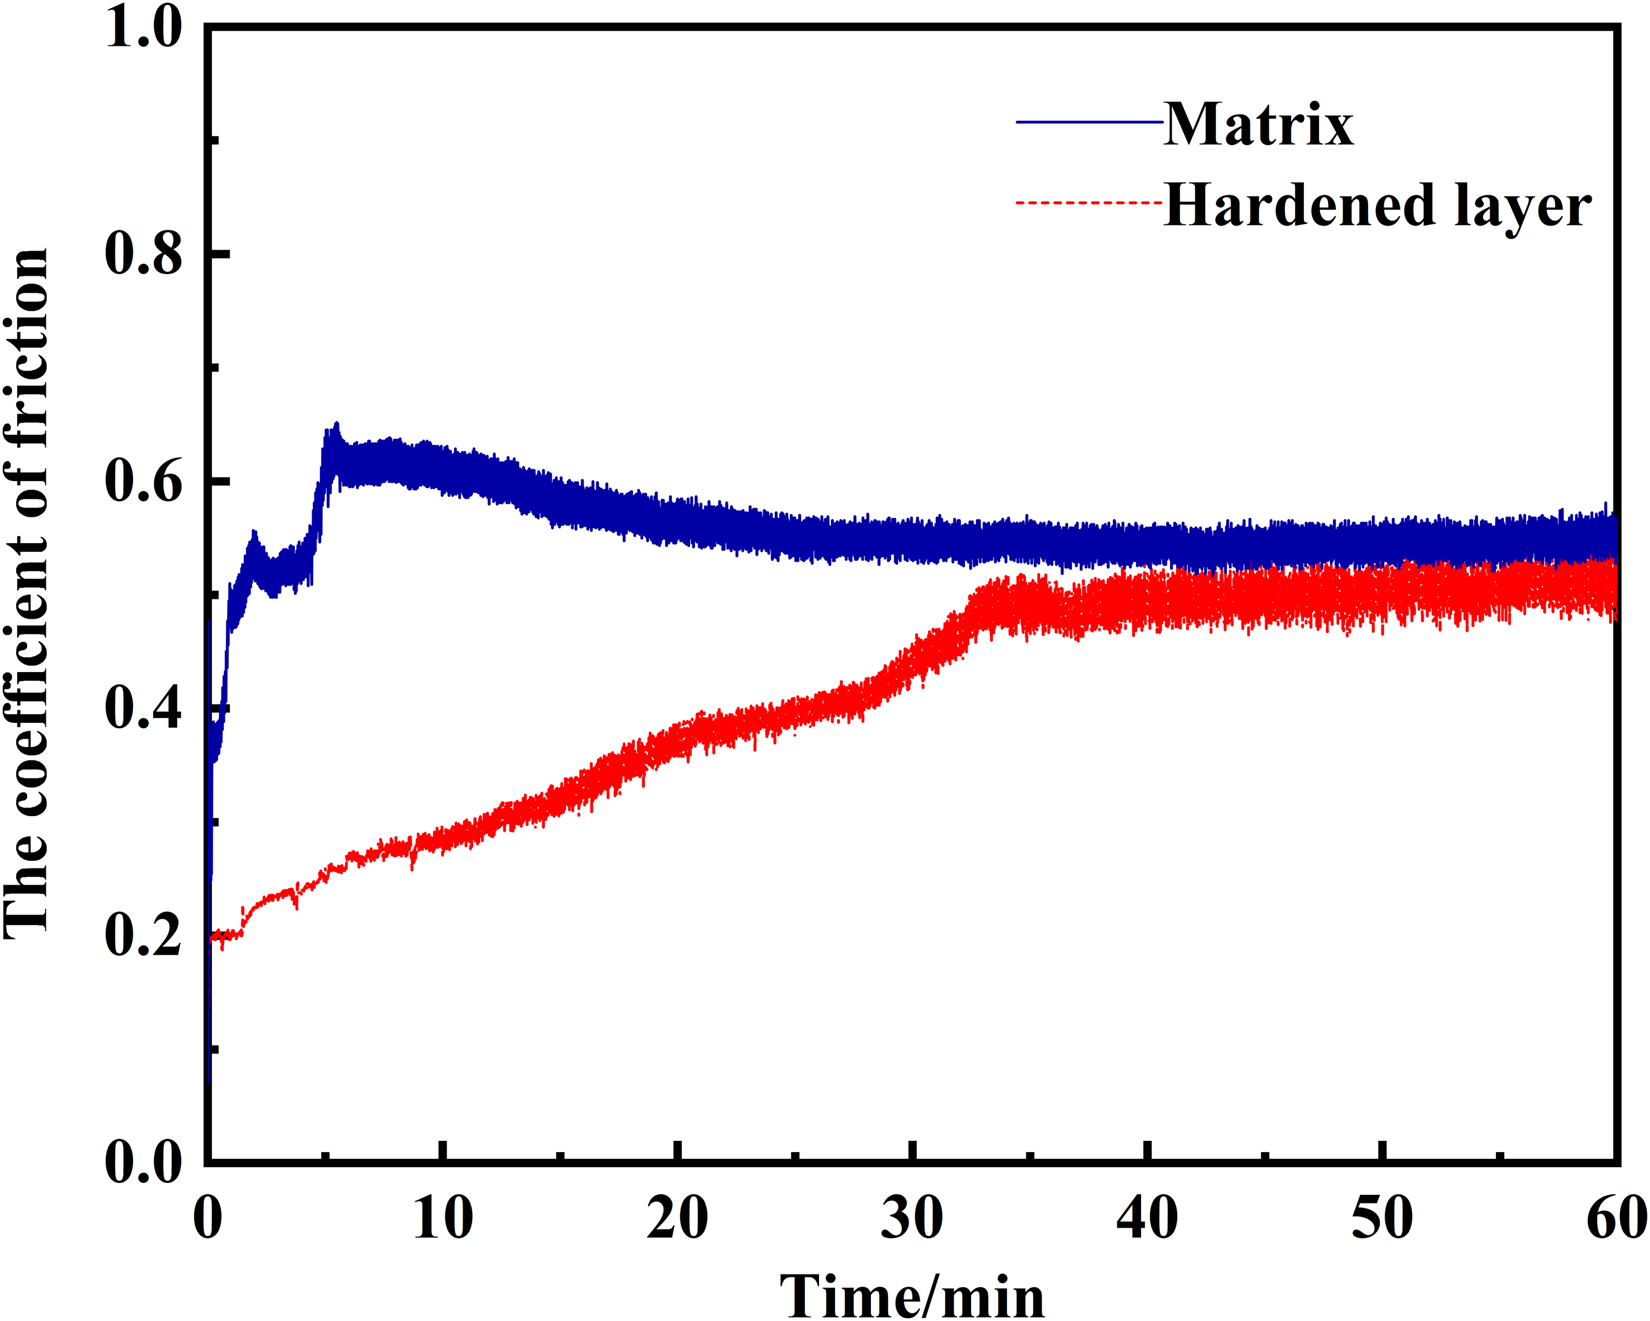
Friction coefficient variation curve at different positions of 40Cr steel laser quenching with time.
To further reveal the friction and wear mechanism of the laser-quenched phase transformation hardened layer, the surface morphology for the wear scars on the laser-quenched phase transformation hardened layer and the substrate layer were observed using a VH-Z100R super-depth 3D microscope, as shown in Figure 25. There were obvious plow furrows on the surface of the phase transformation hardened layer, and the wear form was abrasive wear. There were shallow scratches and more adhered debris on the surface, indicating that the damage form was typical plastic deformation wear, as shown in Figure 25(a) and (b).
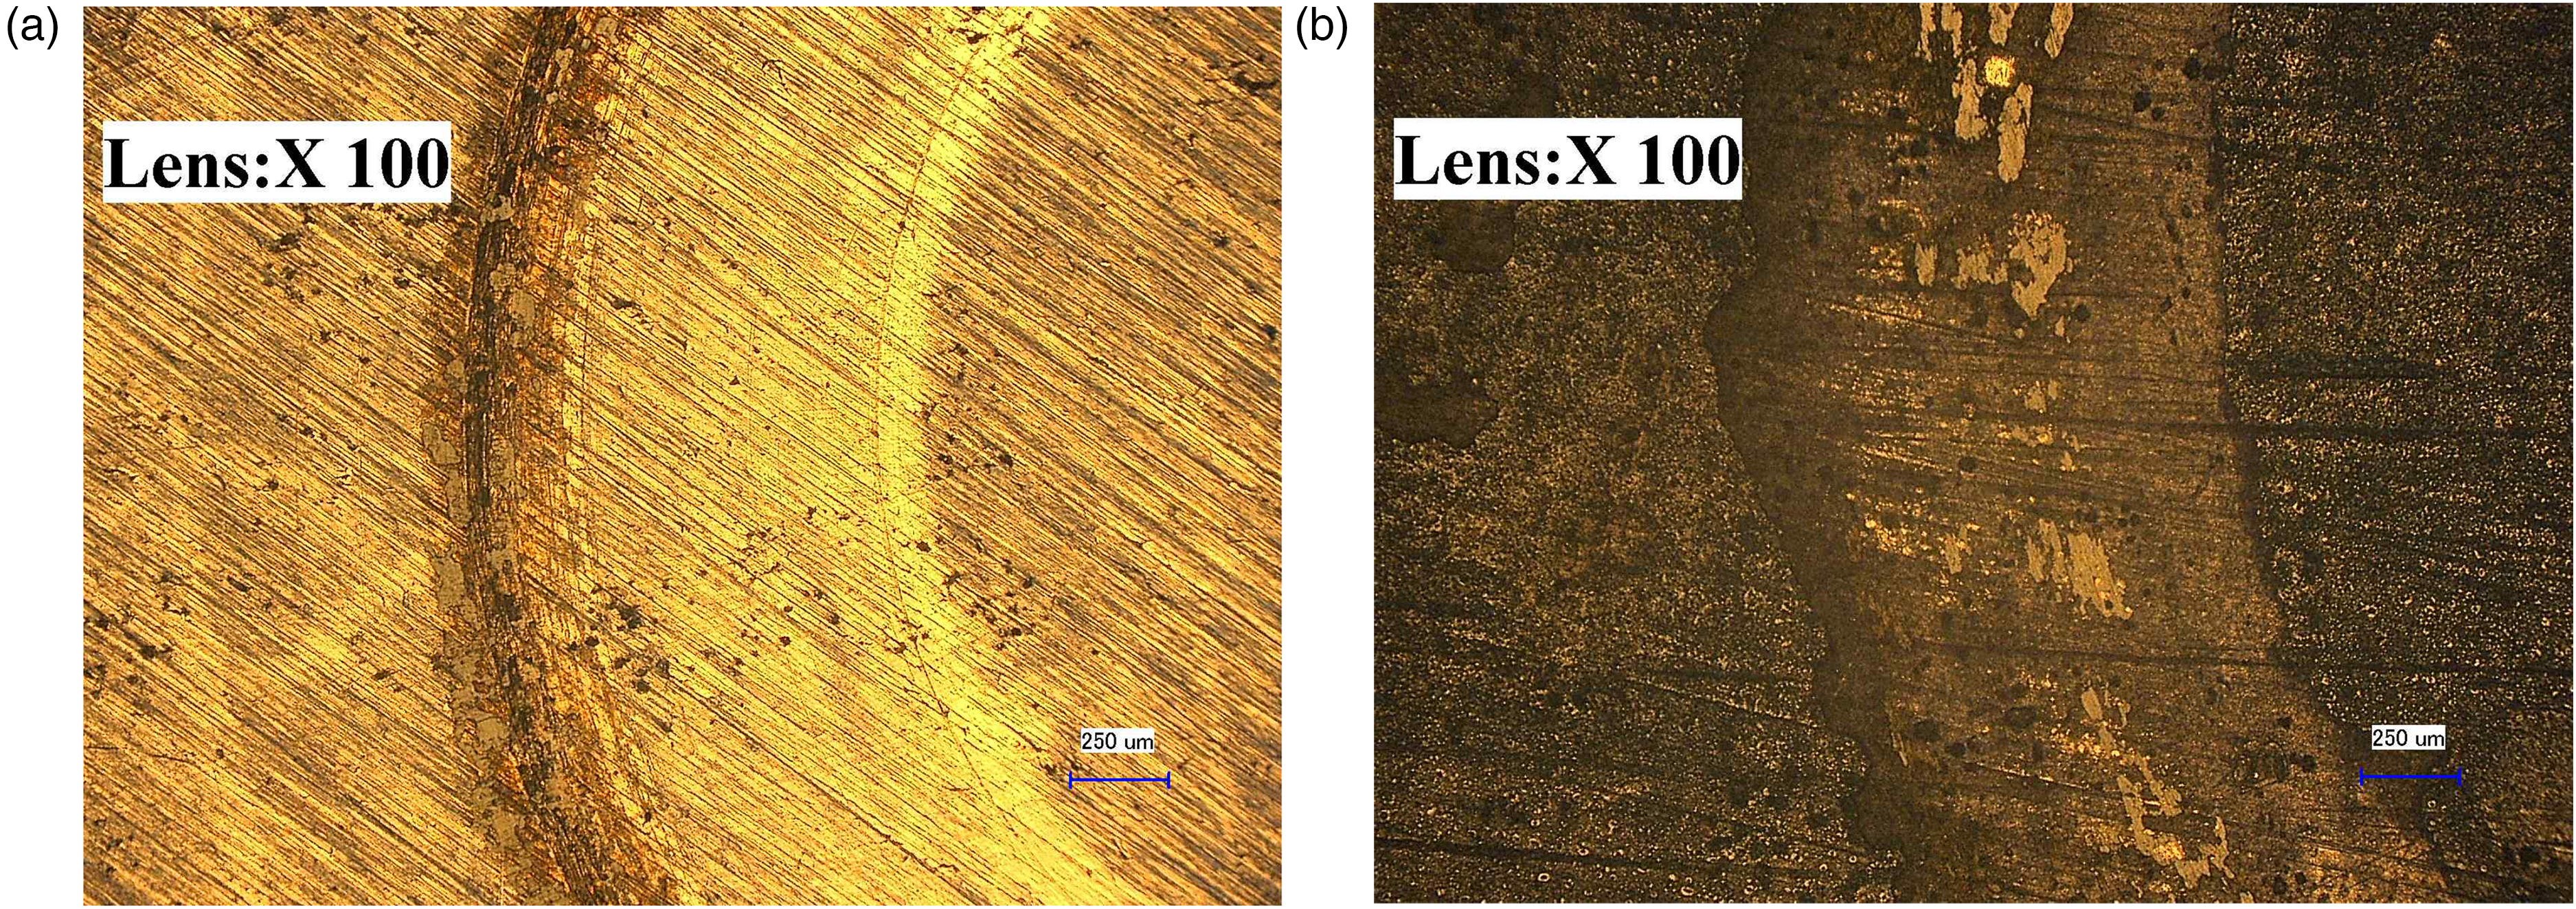
Surface morphology of 40Cr steel laser quenching wear scars at different positions: (a) two-dimensional super depth-of-field view of substrate layer wear marks and (b) two-dimensional depth-of-field view of quenched layer wear marks.
Conclusions
A thermal-elastic-plastic multi-field coupling model was established in multi-track overlapping laser quenching process, numerical calculations were performed on the transient temperature, phase distribution, and stress evolution process, revealing the temperature changes, residual stress distribution, and phase transformation hardening layer formation mechanism of the multi-track overlapping laser quenching process.
A GA-BP network model was established, which can accurately reflect the complex nonlinear relationship between the laser process parameters and tempering zone size. The results indicate that the GA-BP network can accurately predict the width and depth of the tempering zone. The training error of output parameter y1 is 0.0122, and the testing error is 0.0179. The training error of output parameter y2 is 0.0033, and the testing error is 0.0061. The network model has certain generalization ability and accuracy, which is suitable for simulating and predicting the tempering zone size.
The experiment on 40Cr steel showed that the fully transformed zone consists of strip and needle-like martensite, with residual austenite present in small amounts. The heat-affected zone is a mixture of the bainite, ferrite, and pearlite, while the substrate is composed of ferrite and pearlite. The tempering zone is made up of the tempered martensite. The hardness distribution of hardened layer was analyzed by Vickers microhardness tester. The higher the bond rate, the more uniform the hardness of phase transformation hardened layer surface, the larger the tempering softening zone, resulting in defects on the surface of parts. Conversely, if the hardness overlapping rate is too low, the tempering softening zone will be reduced, which affects the surface hardness uniformity of the part. The wear resistance of the quenched layer is improved after laser quenching, as analyzed using a friction and wear testing machine.
Footnotes
Authors’ note
All analyses were based on previously published studies.
Authors’ contribution
All authors contributed to the study conception and design. All authors read and approved the final manuscript.
Declaration of conflicting interests
The author(s) declared no potential conflicts of interest with respect to the research, authorship, and/or publication of this article.
Ethical approval
No ethical approval and patient consent are required. All authors agree with the participation and publication of this study.
Funding
The author(s) disclosed receipt of the following financial support for the research, authorship, and/or publication of this article: This work was supported by the Applied Basic Research Project of Liaoning Province (2023JH2/101300226).