
Abstract
This work is aimed at exploring the feasibility of ultrasonic welding (USW) of a composite laminate made of polycarbonate reinforced with continuous glass fibers, with and without the addition of an energy director (ED) in the form of a neat polycarbonate wire. Welding has been done by varying one factor at a time in order to highlight the dependence of joint strength on each welding parameter. The material has been tested with dynamic mechanical analysis in order to characterize the viscoelastic behavior and temperature dependence. The results in terms of strength show that it is possible to weld also without an ED, but the results using this latter are much better in terms of both average value and standard deviation. The USW joint strength has also been compared with that of adhesive joints, resulting better than this latter when employing the ED, which makes USW a convenient technology for joining this type of composite material.
Keywords
Introduction
Fiber-reinforced thermoplastic polymers (FRTPs) are receiving an increasing attention in a wide variety of industrial applications, especially showing the great potential in the manufacturing of automobiles, airplanes, building materials, and wind blades because of their superior characteristics of high specific tensile strength and stiffness, low weight, and high fatigue resistance.1–4 The fibers more widely used are carbon (CF) and glass fiber (GF), whereas the matrices include mostly polyetherimide, polypropylene (PP), polyphenylene sulfide, polyamide (PA) 1 and also methylmethacrylate, polyethersulfone, and polysulfone. 2 Attempts have been made also on bioplastics polylactic acid (PLA). 3
A successful application of FRTP requires the assembly of FRTP either to other fiber-reinforced polymers, to metal or to plastics in general, using a suitable joining technique (e.g. adhesive bonding, 4 mechanical fastening, 5 or welding 6 ).
Among the various joining techniques, UltraSonic Welding (USW) offers several advantages in joining thermoplastic composites, such as low welding time, cleanliness, and reliability and safety for the environment and operators.7,8 USW is a widely used technology for the assembly of parts made of a thermoplastic material. 1
Generally, a USW system is made of four major components sequentially assembled (generator, transducer, booster, and horn or sonotrode); the stacking is built up to generate a vibration, to amplify it and to apply it to the surface of one part, while the other placed on an anvil. The sonotrode frequencies are typically between 20 and 50 kHz and an amplitude of vibration to be chosen according to the material to be welded. The fundamental mechanism underlying this technique is the exploitation of the oscillation impressed on a sonotrode to transfer energy to the plastic parts.
The orientation of the mechanical vibrations with respect to the welding interface, characterizes the use of USW: for plastics, the vibrations are transverse to the welding interface, while for metals they are introduced parallel to the welding interface.
9
USW of thermoplastic composites is generally done alike plastics. The extension and contraction of the sonotrode gives rise to a deformation of the material in the thickness direction and the rubbing of the surfaces of the parts in contact. Surface friction as well as internal friction of the material heat the resin until the melting temperature is reached. The USW process is controlled by determining the amount of energy transferred to the surface to be welded, therefore, ultimately, by defining the power and the processing time. Given the oscillation A (equation (1)) and the force F (equation (2)) aligned to the oscillation, the instantaneous power Wist and the cyclic average power


Another typical feature of USW is the presence of energy directors (ED), that is, triangular/pyramidal protrusions made or applied on the surface of one of the two parts to be welded. In this way the energy is applied starting from the tip of the protrusion, reaching a very high energy density which causes the rapid melting. This makes the welding process more efficient and successful. An example of an ED is shown in Figure 1.
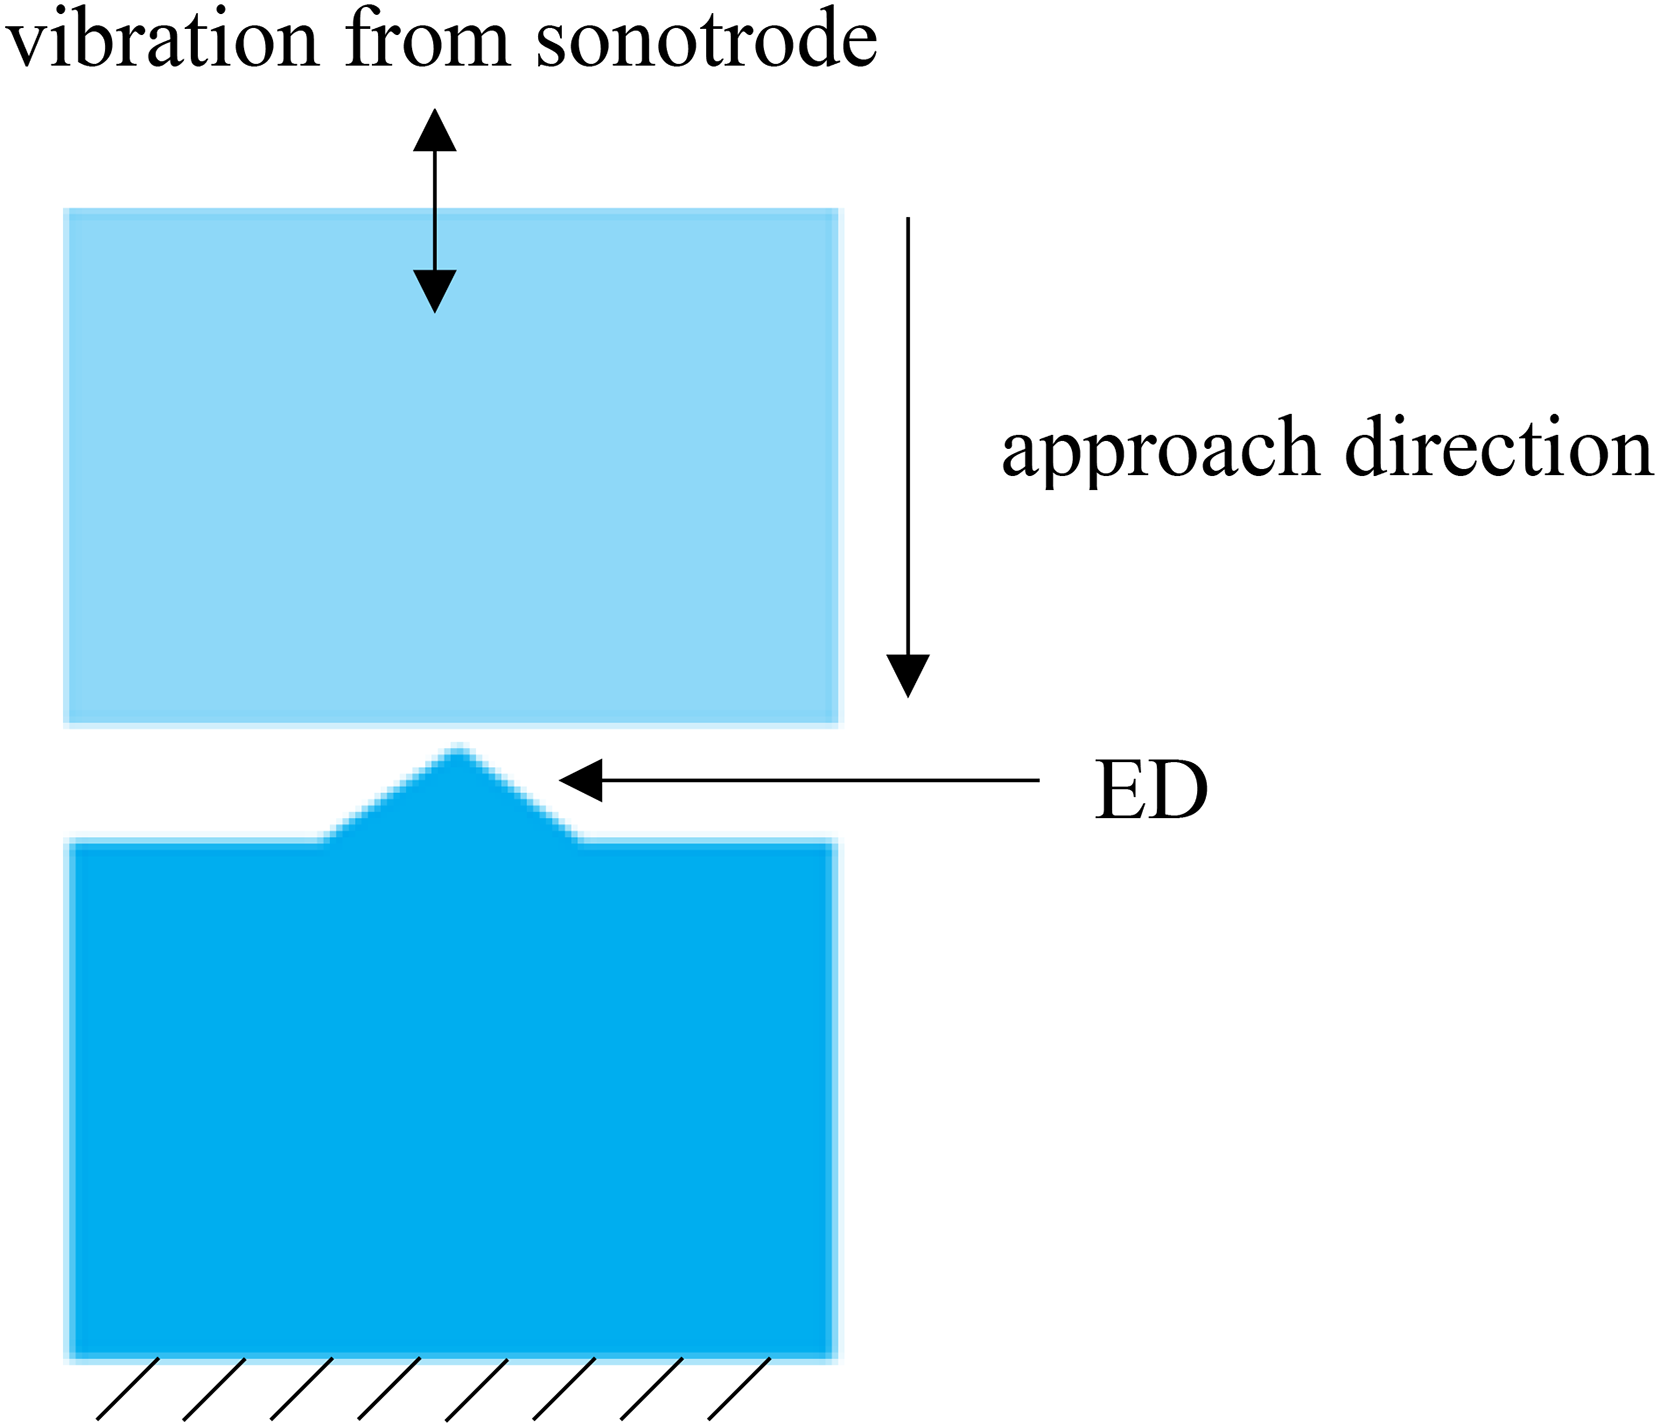
Example of energy director (ED) for a butt joint.
Traditional EDs such as the one in Figure 1 can be successfully used at the expense, however, of one additional manufacturing step that consists in the molding of EDs on top of an already consolidated thermoplastic composite laminate. Flat EDs in the form of a neat thermoplastic resin layer placed at the welding interface is also successful in favoring the USW. 10
The welding without EDs, which should be the easiest possible procedure, has been explored in the case of spot welds.11,12 However, the absence of an ED brings in the difficulty to control the heating at the interface. 13
Another effect to be considered carefully is the influence of environment, because moisture reduces the stiffness of the matrix material, thus increasing the acoustic impedance to the ultrasound waves. As reported in Li et al.’s 2 study for example, when the moisture content in CF-PA6 exceeds 1.0 wt.%, the welding strength is significantly weakened. Therefore, it is a good practice to dry the materials before USW. Moreover, studies have been recently performed 14 on underwater USW of polyvinylchloride and PP, demonstrating how the presence of water adversely affects weld strength with respect to USW performed in air.
Coming to specific studies on USW of polymers and composites, Benatar and Gutowski 15 introduced USW in polyether ether ketone (PEEK)-graphite composites. They identified five distinct highly coupled subprocesses: (i) mechanics and vibration of the parts; (ii) viscoelastic heating of the thermoplastic resin; (iii) heat transfer; (iv) flow and wetting; and (v) intermolecular diffusion. Later, an attempt of order-of-magnitude theoretical modeling of the heat generation, material deformation, and viscous flow during the first stage of the USW process was done, 16 finding a correlation with practical guidelines on USW. An L18 experimental matrix design based on the Taguchi method was used by Liu et al. 17 to optimize the joint strength of ultrasonically welded thermoplastics. The outcome was a weldability diagram based on the statistical results to give first guidelines for system optimization. In Liu et al., 18 the authors worked on USW of neat PP in comparison with PP with 10% and 30% vol. of short GF. They found that, in general, the higher the WE the higher the joint strength. However, the results also showed that PP-GF required less energy to be successfully joined than neat PP. The PP-GF in fact has a higher stiffness and therefore a higher storage modulus E’ and a lower loss modulus E”. It then vibrates more in phase with the horn, thus more energy is transferred to the ED by vibration and dissipated internally in the material. Joint strength of welded parts was found to increase with the fiber content in the composites, and under optimum processing conditions welded composite exhibited the highest joint strength. The effect of the filler type and filler percentage on the weld strength was investigated. 19 In particular, the GF was added at 10 and 20 wt % concentrations, respectively. In this case, welding parameters were those optimal for the neat PP. Under these conditions, the PP-GF showed lower strength than neat PP, with a higher decrease for the higher GF content. This result, which apparently contradicts the statement of Liu et al., 18 but in fact confirms their idea that the process optimization has to be conducted case-by-case depending on the filler content. Fernandez Villegas and Bersee, 20 alike also Liu et al., 18 pointed out the importance of ED shape in order to obtain a good joint strength. Triangular, rectangular, and semicircular shapes were tested in Liu et al. 18 for welding neat PP, PP + 10% GF, and PP + 20% GF, respectively. The triangular shape has 60° angle, the rectangular one keeps the same height and section surface of the triangular one while the semicircular radius is half the triangle base. Results demontrate the higher efficacy of the triangular ED for all the materials tested A triangular shape with 90° tip angle was adopted for all the tests, but varying the size (small, intermediate, and standard), the number of EDs and their orientation with respect to the load. The results showed that a combination of two small ED on one side and one intermediate ED on the other may produce a higher joint strength.
However, because of the difficulties related to applying EDs on sheet components, the possibility of welding continous fiber reinforced thermoplastic polymers without EDs was already investigated by Taylor et al. and Silverman and Griese.21,22 In Fernandez Villegas and Palardy’s study, 23 the ideas of a flat ED with the necessity to concentrate WE in the junction were put together. The authors placed a neat thermoplastic resin film between the parts to be joined prior to the welding; this heats up preferentially due to its lower compressive stiffness relative to the composite substrates, avoiding molding or sticking of resin protrusions on the surfaces.
Polycarbonate (PC) is a strong and tough polymer that can be easily worked, molded, and thermoformed. Besides, it has a quite high glass transition temperature, Tg, (about 147°C) compared to the flow point (about 155°C). That means that PC preserve its mechanical properties almost up to flowing, making it a good candidate for high-performance thermoplastic composites. Yet, PC-based composites did not find attention regarding USW, possibly because its physical behavior with Tg close to the flow point, may not facilitate the process control.
This work is therefore aimed at exploring the feasibility of USW of a composite laminate made of PC reinforced with continous GFs (PC-GF). Welding will be done by varying one factor at a time in order to highlight the dependence of joint strength on each welding parameter and to find the optimal process parameters. USW will be done both without and with ED and the addition of an ED in the form of a neat PC wire. Additionally, adhesively bonded joints (hereinafter called simply bonded joints) will be manufactured and tested with the same joint area as the USW ones for comparison of the strength between the two technologies.
Materials and experimental metodologies
PC-GF laminate
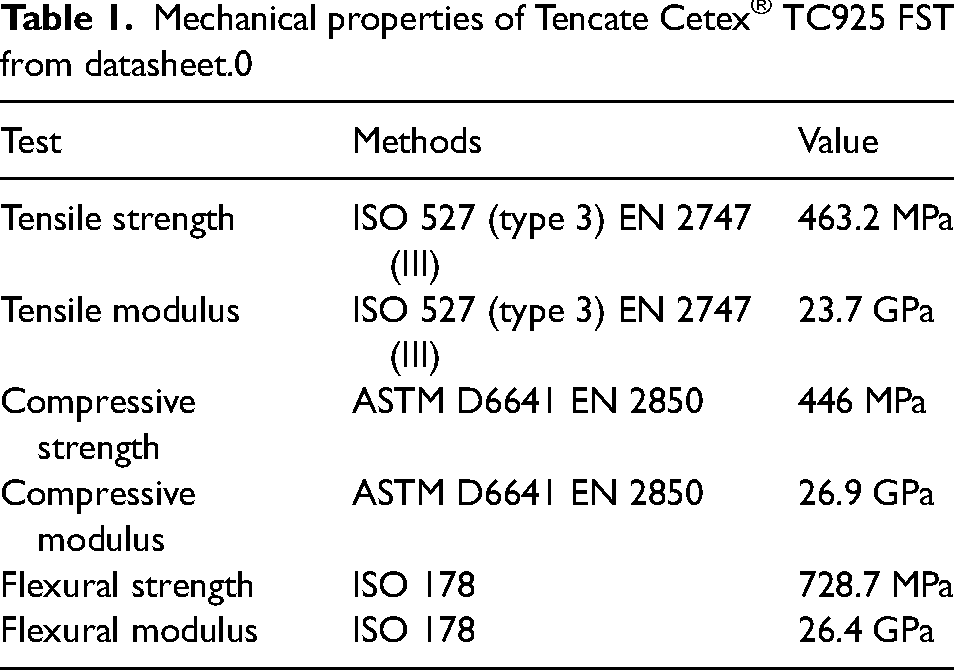
The composite material under study is a composite laminate made of PC matrix reinforced with long GFs. The pre-impregnated ply is Cetex® TC925 FST—glass 7581 from Tencate (Njiverdal, NL), composed of 8H satin weave GF and PC with equal fractions in volume. The glass transition temperature of the prepreg is Tg = 153°C from datasheet. The mechanical properties of the ply at ambient temperature are reported in Table 1. The laminate under test has a stacking sequence [0/45/-45/45/0 ̅]s, for a total nominal thickness of 2.04 mm.
Mechanical properties of Tencate Cetex® TC925 FST from datasheet.0
Adhesive for bonded joints
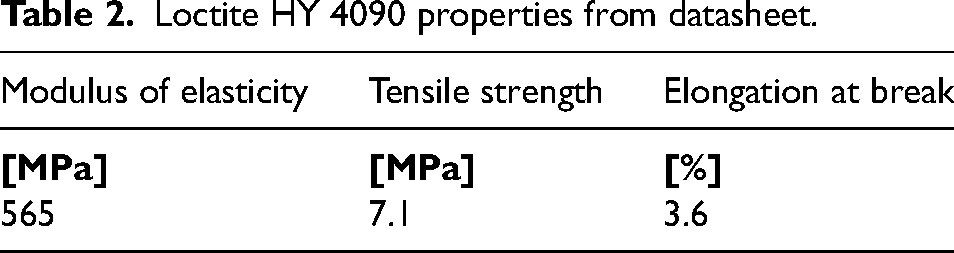
The PC matrix can be bonded using several different types of adhesive, such as instant adhesives, UV-curing, polyurethanes, acrylics, silicones, modified-silane (MS), epoxies, and hybrid adhesives. 24 In this case, it has also been accounted for that the addition of GF yields quite a stiff composite, therefore inherently brittle adhesives such as instant adhesives typically are, would not be the best choice. In order to compare with USW, a flexible adhesive, such as silicones and MS, also would not be very suitable. UV-curing adhesives, often used for bonding transparent PC, cannot be used this time since the addition of GF makes the composite opaque. Epoxy adhesives typically fulfill those requirements being stiff but not too brittle and environmentally stable. On the other hand, they may not achieve the best strength on PC with respect to other types of adhesive and also have a longer cure time than instant adhesives. For these reasons HY 4090, a two-component hybrid cyanoacrilate/epoxy adhesive from Loctite (Henkel Italia, Milano, Italy) has been chosen, since it brings toghether the advantages of epoxies and instant adhesives, especially the short fixing time (< 180 s) that fills partly the gap with the very rapid USW process. Full strength is instead developed in 3 days to 1 week, depending on the adherend material. The expected shear strength on PC is 6.9 MPa from supplier datasheet. The main mechanical properties of the adhesive system are shown in Table 2.
Loctite HY 4090 properties from datasheet.
USW single-lap joint manufacturing
The joint is of the single overlap type shown in Figure 2. The tabs at the ends are bonded after welding, to allow alignment of the joint in the tensile testing machine.
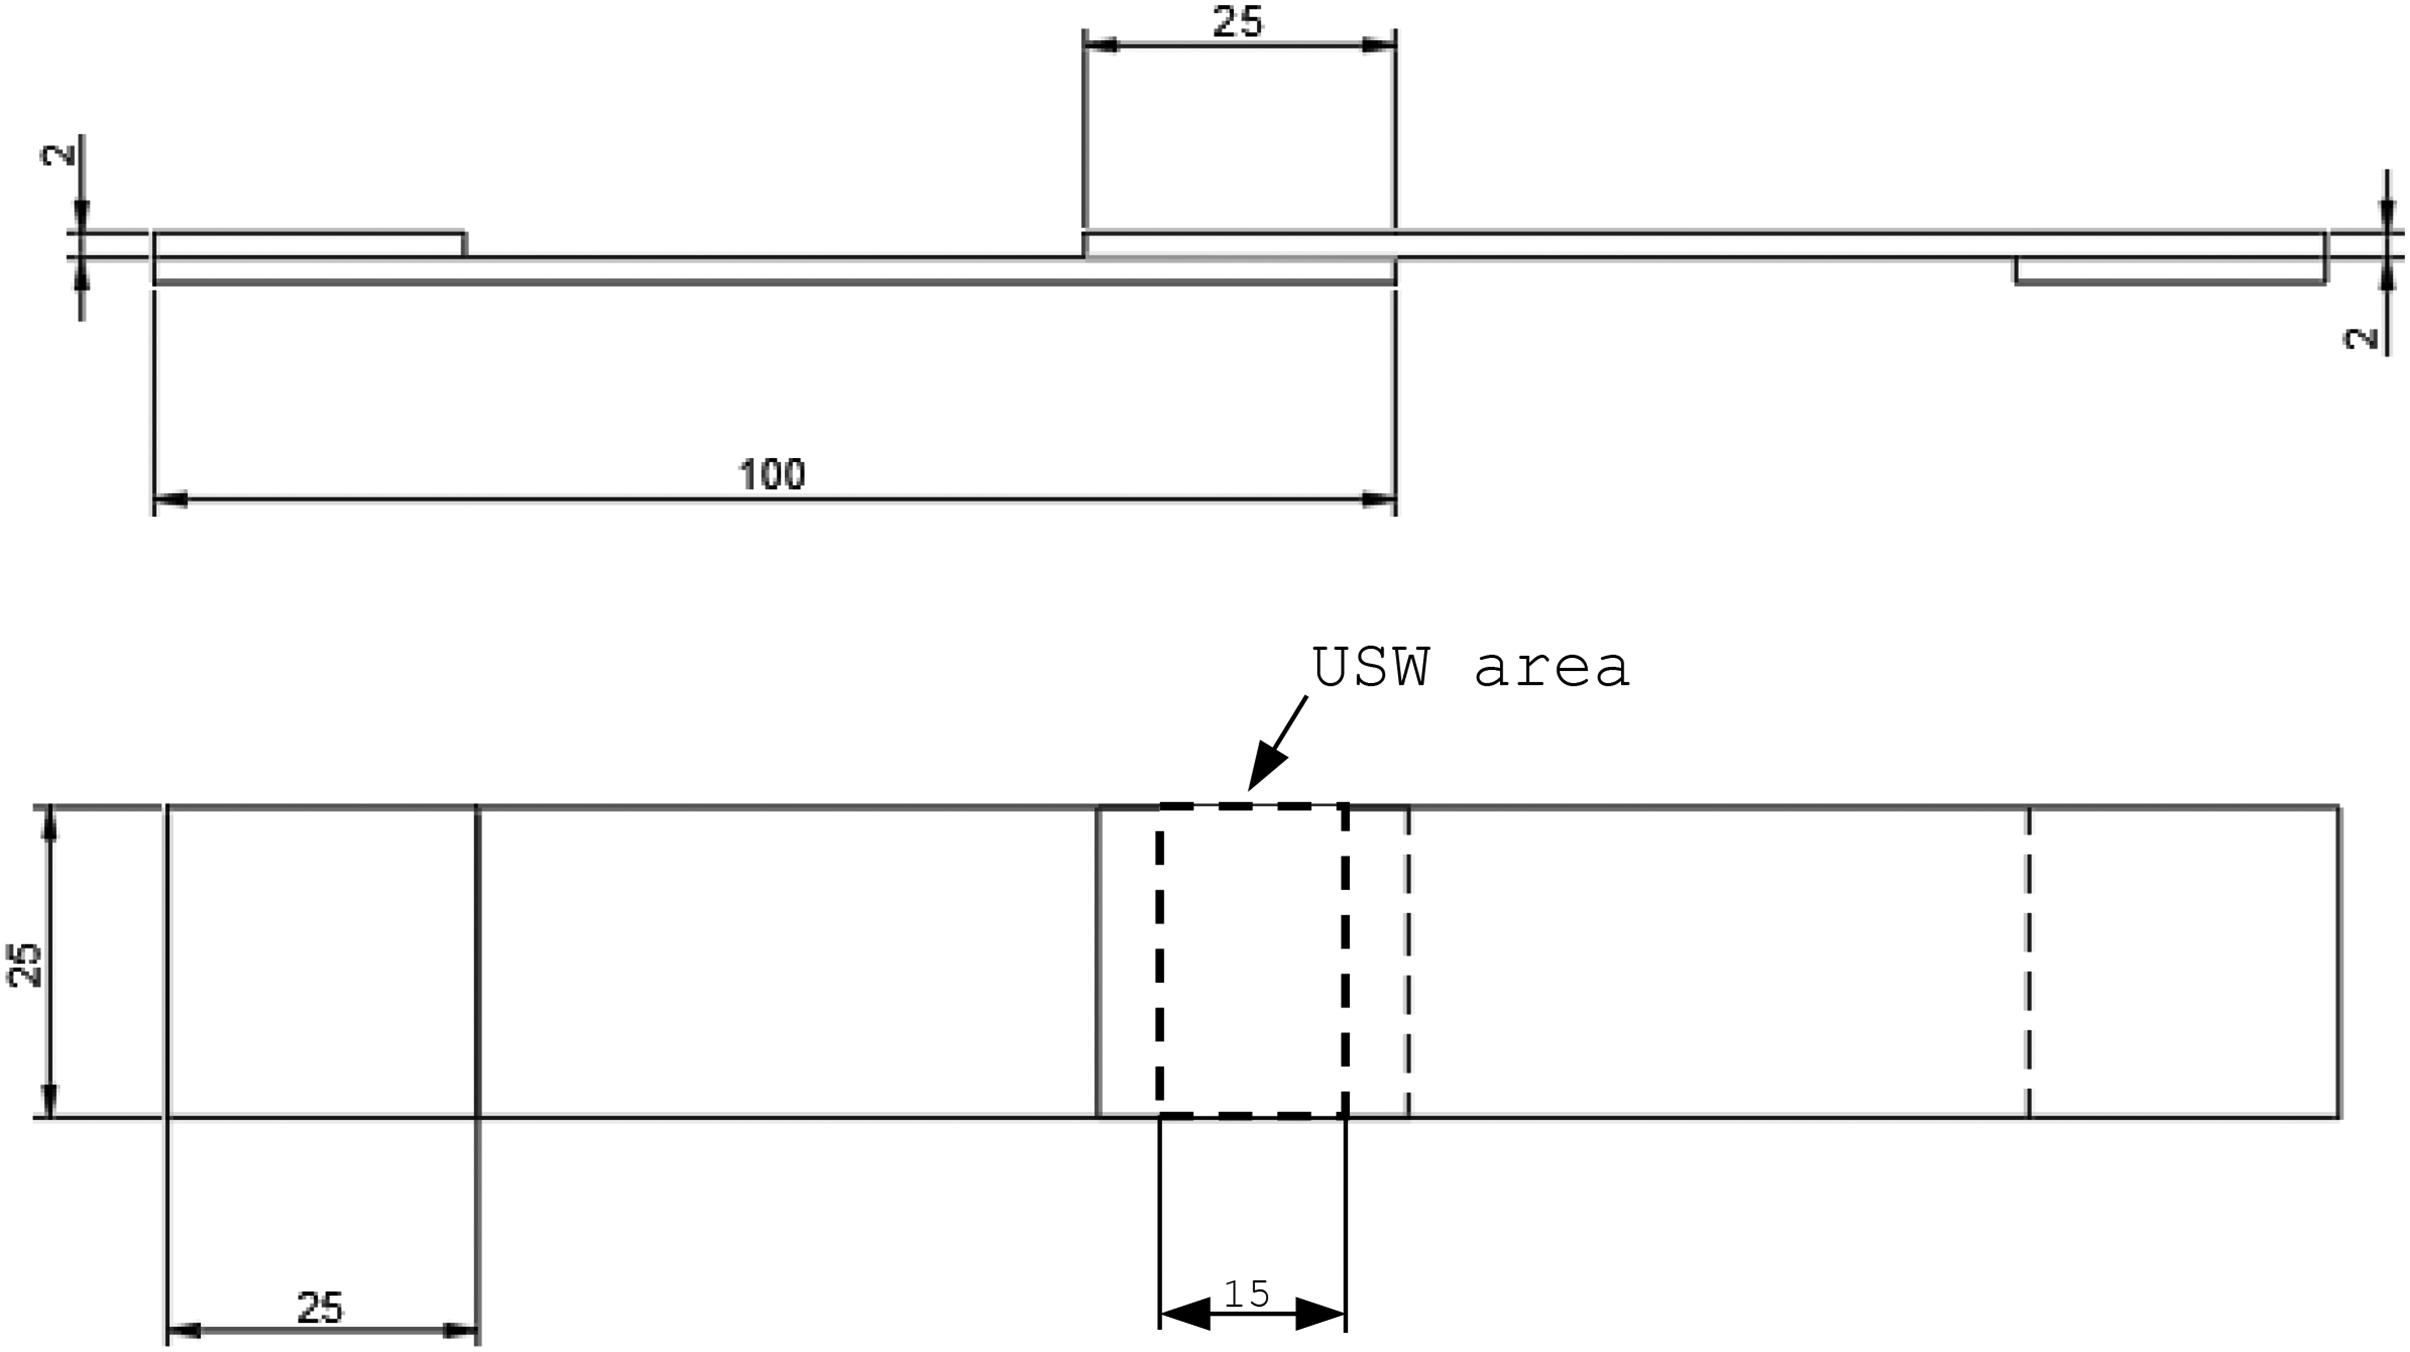
Sketch of the overlap joint. USW: ultrasonic welding.
The faces to be joined have a finish as in production, therefore with low roughness. It was decided not to roughen to evaluate the result in conditions of minimal surface preparation (degreasing only), therefore of minimal additional cost.
The junction was made both without and with the presence of an ED; in the latter case, the ED is a PC wire with a diameter of 1.75 mm, placed transversely to the junction area inside the sonotrode footprint.
To carry out the welding tests using ultrasounds, the Herrmann model HiQ DIALOG machine with generator type ULTRAPLAST digital 6200 DIA (Figure 3(a)) was kindly made available by Herrmann Ultrasuoni Srl (Modena, Italy), with minimum frequency and maximum respectively equal to 19,500 and 22,000 Hz and with amplitude (nominal) equal to 45 μm.
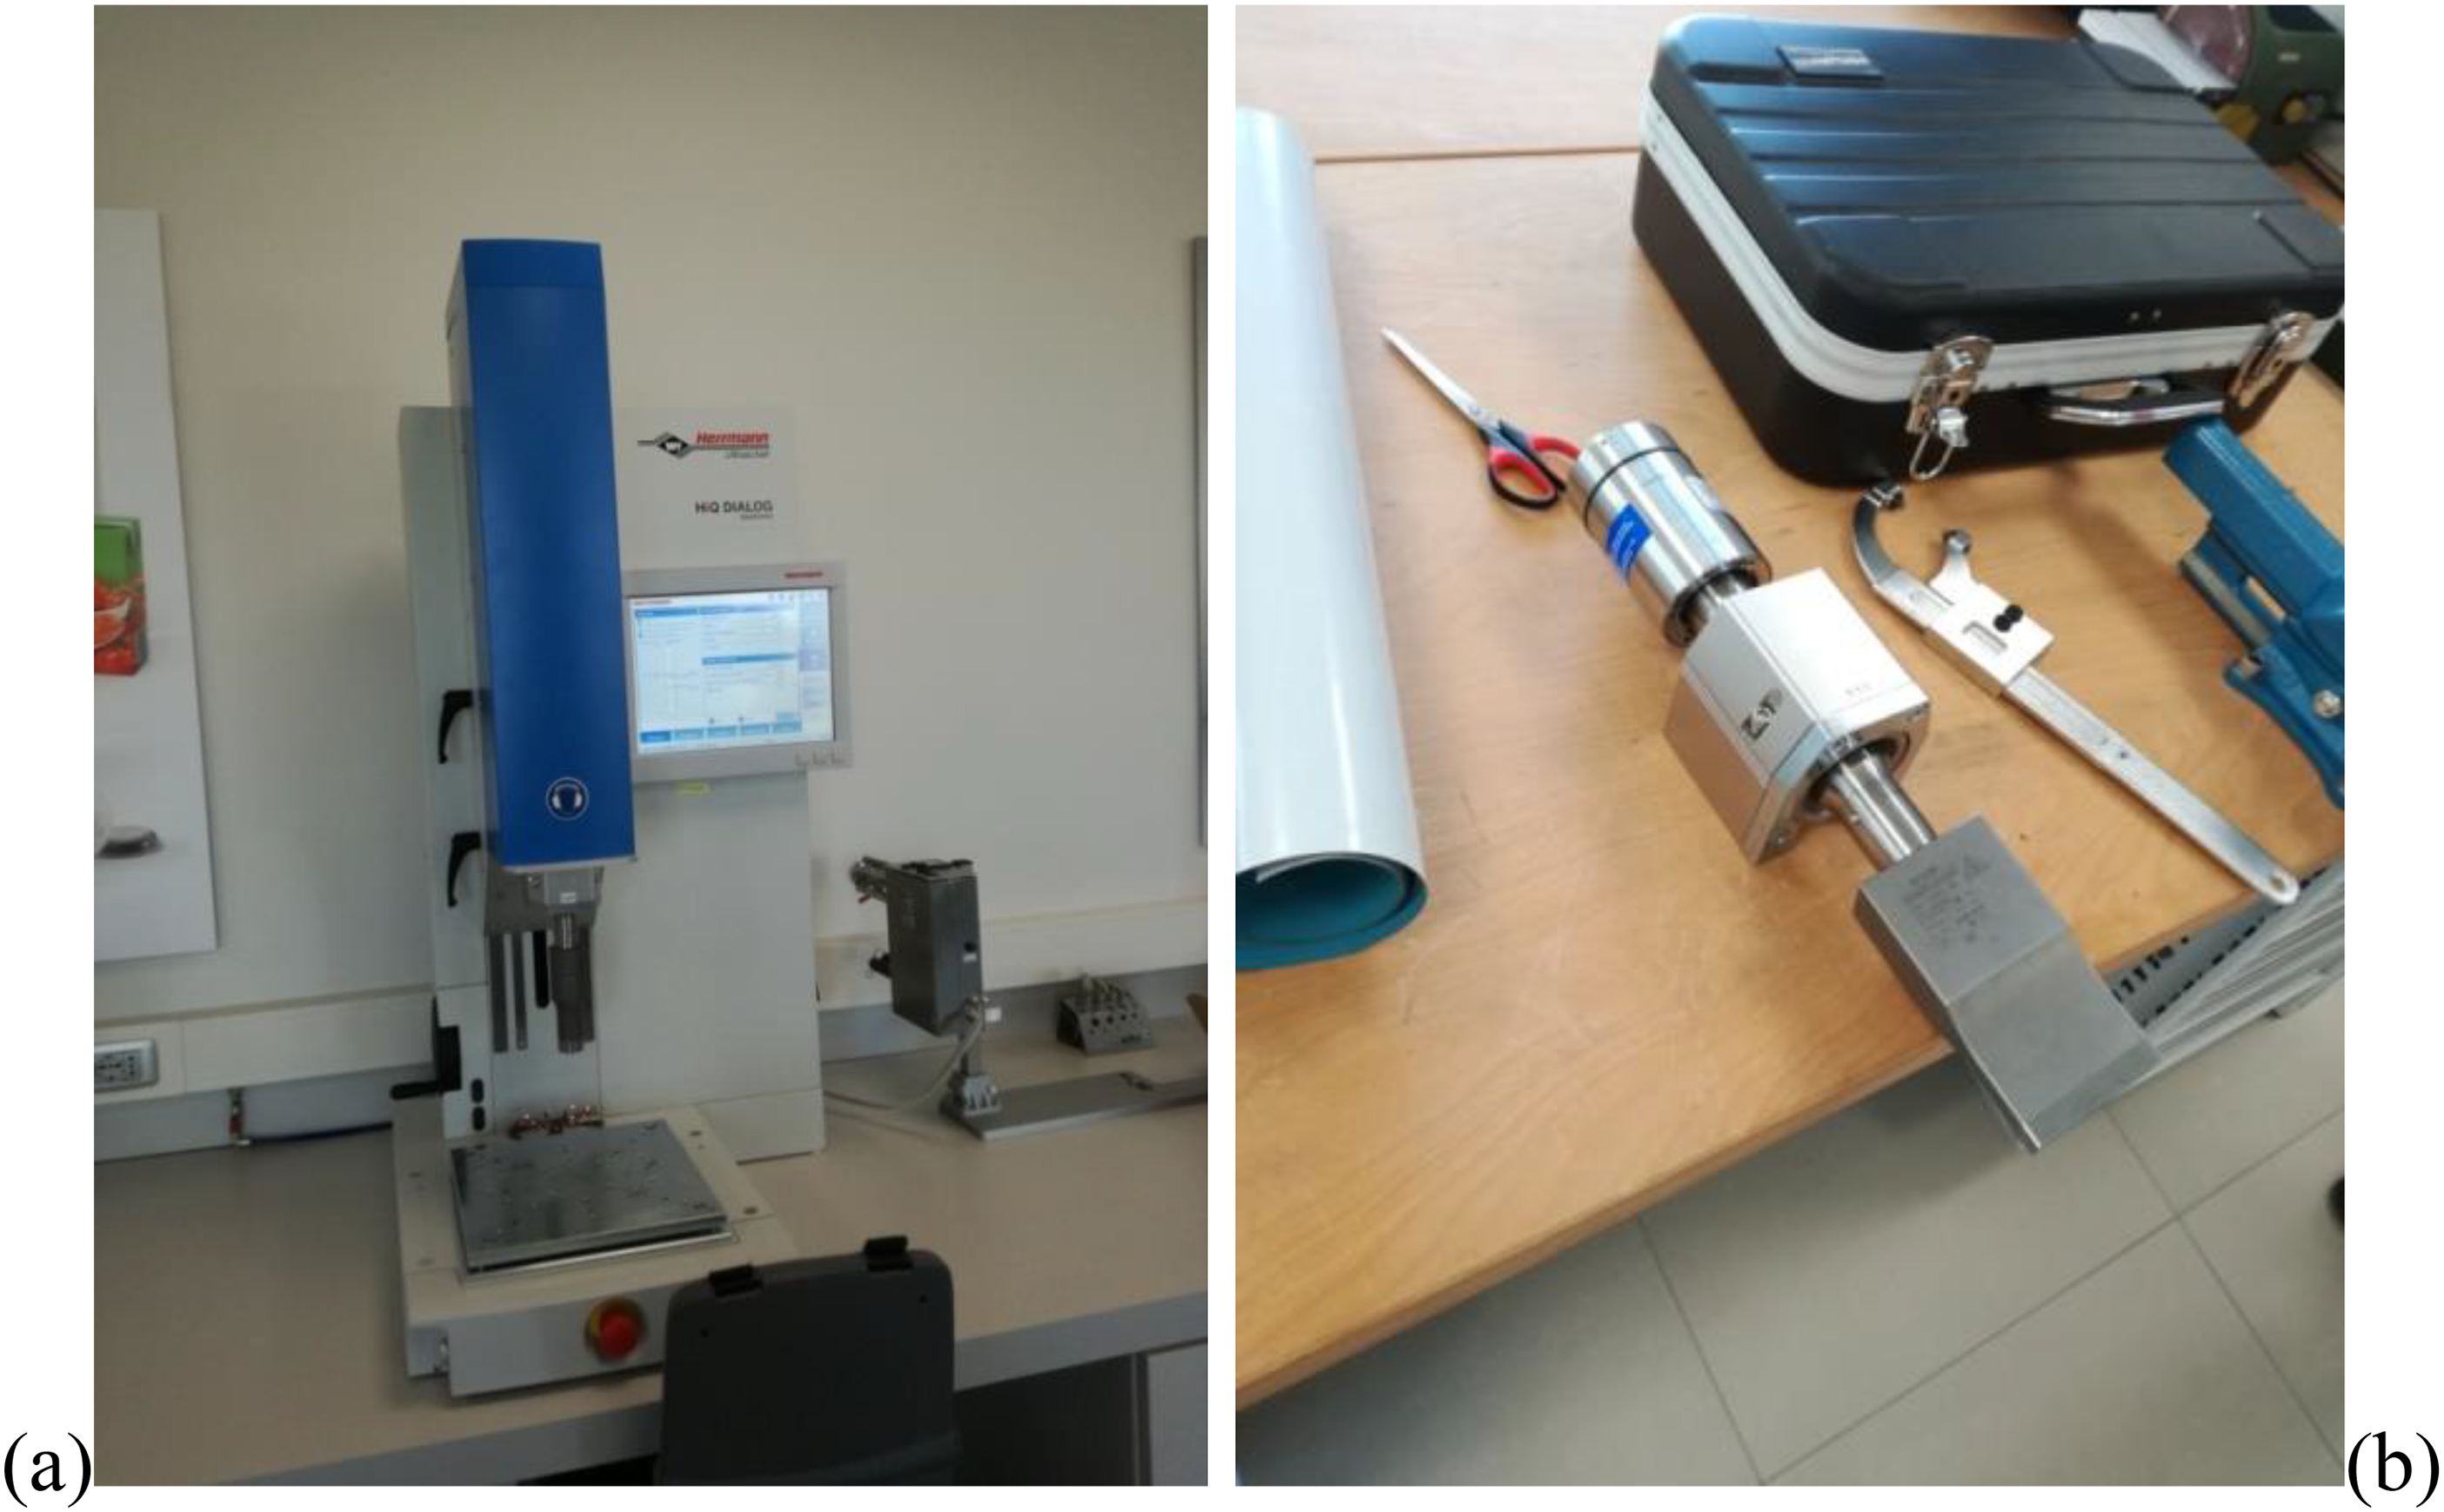
(a) Herrmann USW machine model HiQ DIALOG and (b) sonotrode mounted on the converter-amplifier assembly. USW: ultrasonic welding.
The amplifier-converter-sonotrode unit is mounted on the machine (Figure 3(b)); the latter has a rectangular shape 15 × 85 mm2 and during welding is oriented transversely to the sample. In this way the welding length turns out to be shorter than the overlap length, since the realization of a full overlap welding would have required an energy and a force not achievable with the available equipment. The sonotrode width is much greater than that of the joint but a smaller one was not available for this preliminary study phase.
The welding support and locking equipment is shown in Figure 4. It consists of two blocks of aluminum milled to accommodate the two composite plates to be welded, keeping them aligned and partially overlapping. Below the overlap area, between the two blocks, a steel support is placed which acts as a contrast to the force exerted by the machine during welding.
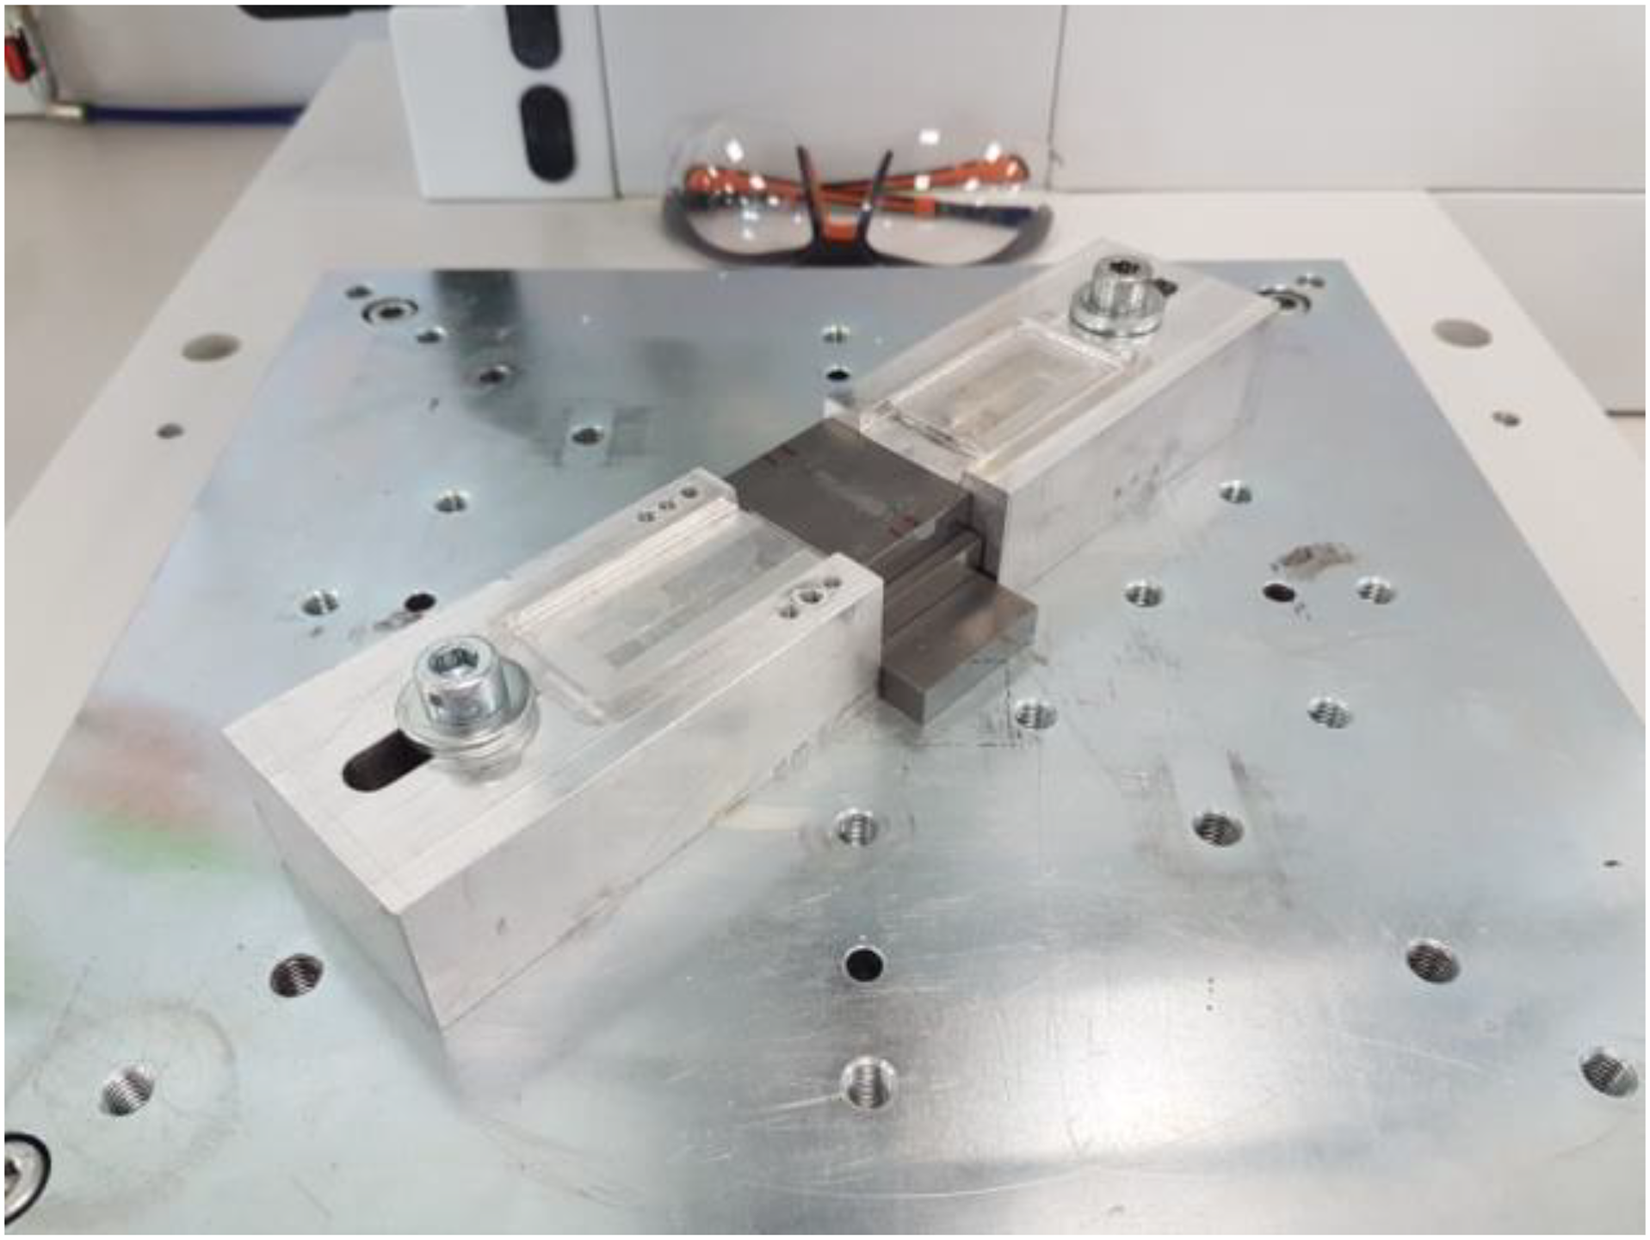
Welding support and locking equipment.
The parameters that have been varied for the execution of the USW tests are the WF, that is, the force that the sonotrode applies on the parts to be welded, and the WE, that is, the mechanical energy supplied during the welding cycle. In particular, they are varied one factor at a time according to Table 3, where the values were chosen on the basis of the empirical results of a preliminary investigation.
Welding parameters used in this work.
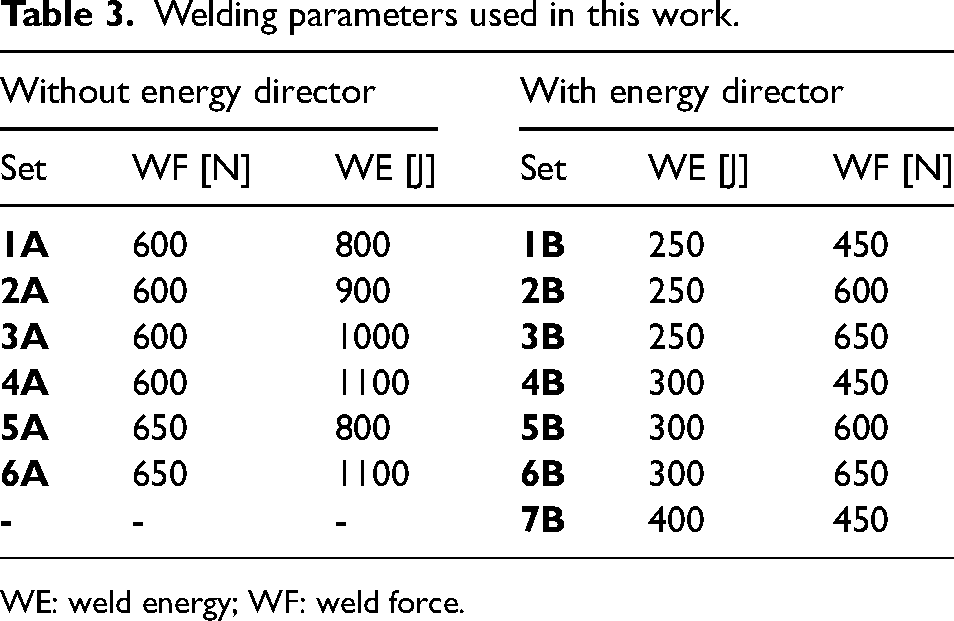
WE: weld energy; WF: weld force.
Bonded single-lap joint manufacturing
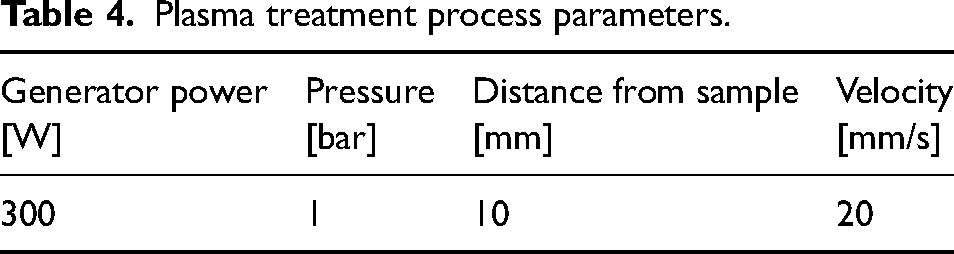
For the sake of comparision with USW, a single-lap joint such as that in Figure 2 has been manufactured with a superposition of 15 mm, that is equal to the USW area. The adherends have been cleaned and degreased with water and alkaline soap, then soaked and prepared for bonding. Two types of surface preparation have been done: (i) cleaned with Loctite 7063 multipurpose degreaser and (ii) treated with atmospheric plasma with Diener Electronic PlasmaBeam (Figure 5). The process parameters were chosen accordingly to the literature25,26 for atmospheric air plasma treatments with similar generator power on PC substrates, and are shown in Table 4. The evaluation of the surface energy by, for example, the sessile drop technique, was not undertaken as it was outside the scope of the paper. The adhesive is then poured onto the adherend surface and the other adherend is pressed onto it while keeping the alignment. Since for hybrid adhesives, the lower the thickness, the higher the strength, a control on minimum adhesive thickness by calibrated wires or else has not been used, that enforces also the similarity with the manufacturing cycle of USW. A clamp is applied across the overlap to keep the adherends tightly while the adhesive cures. Tests have been done at least 72 h after bonding as per the adhesive supplier prescriptions on PC.
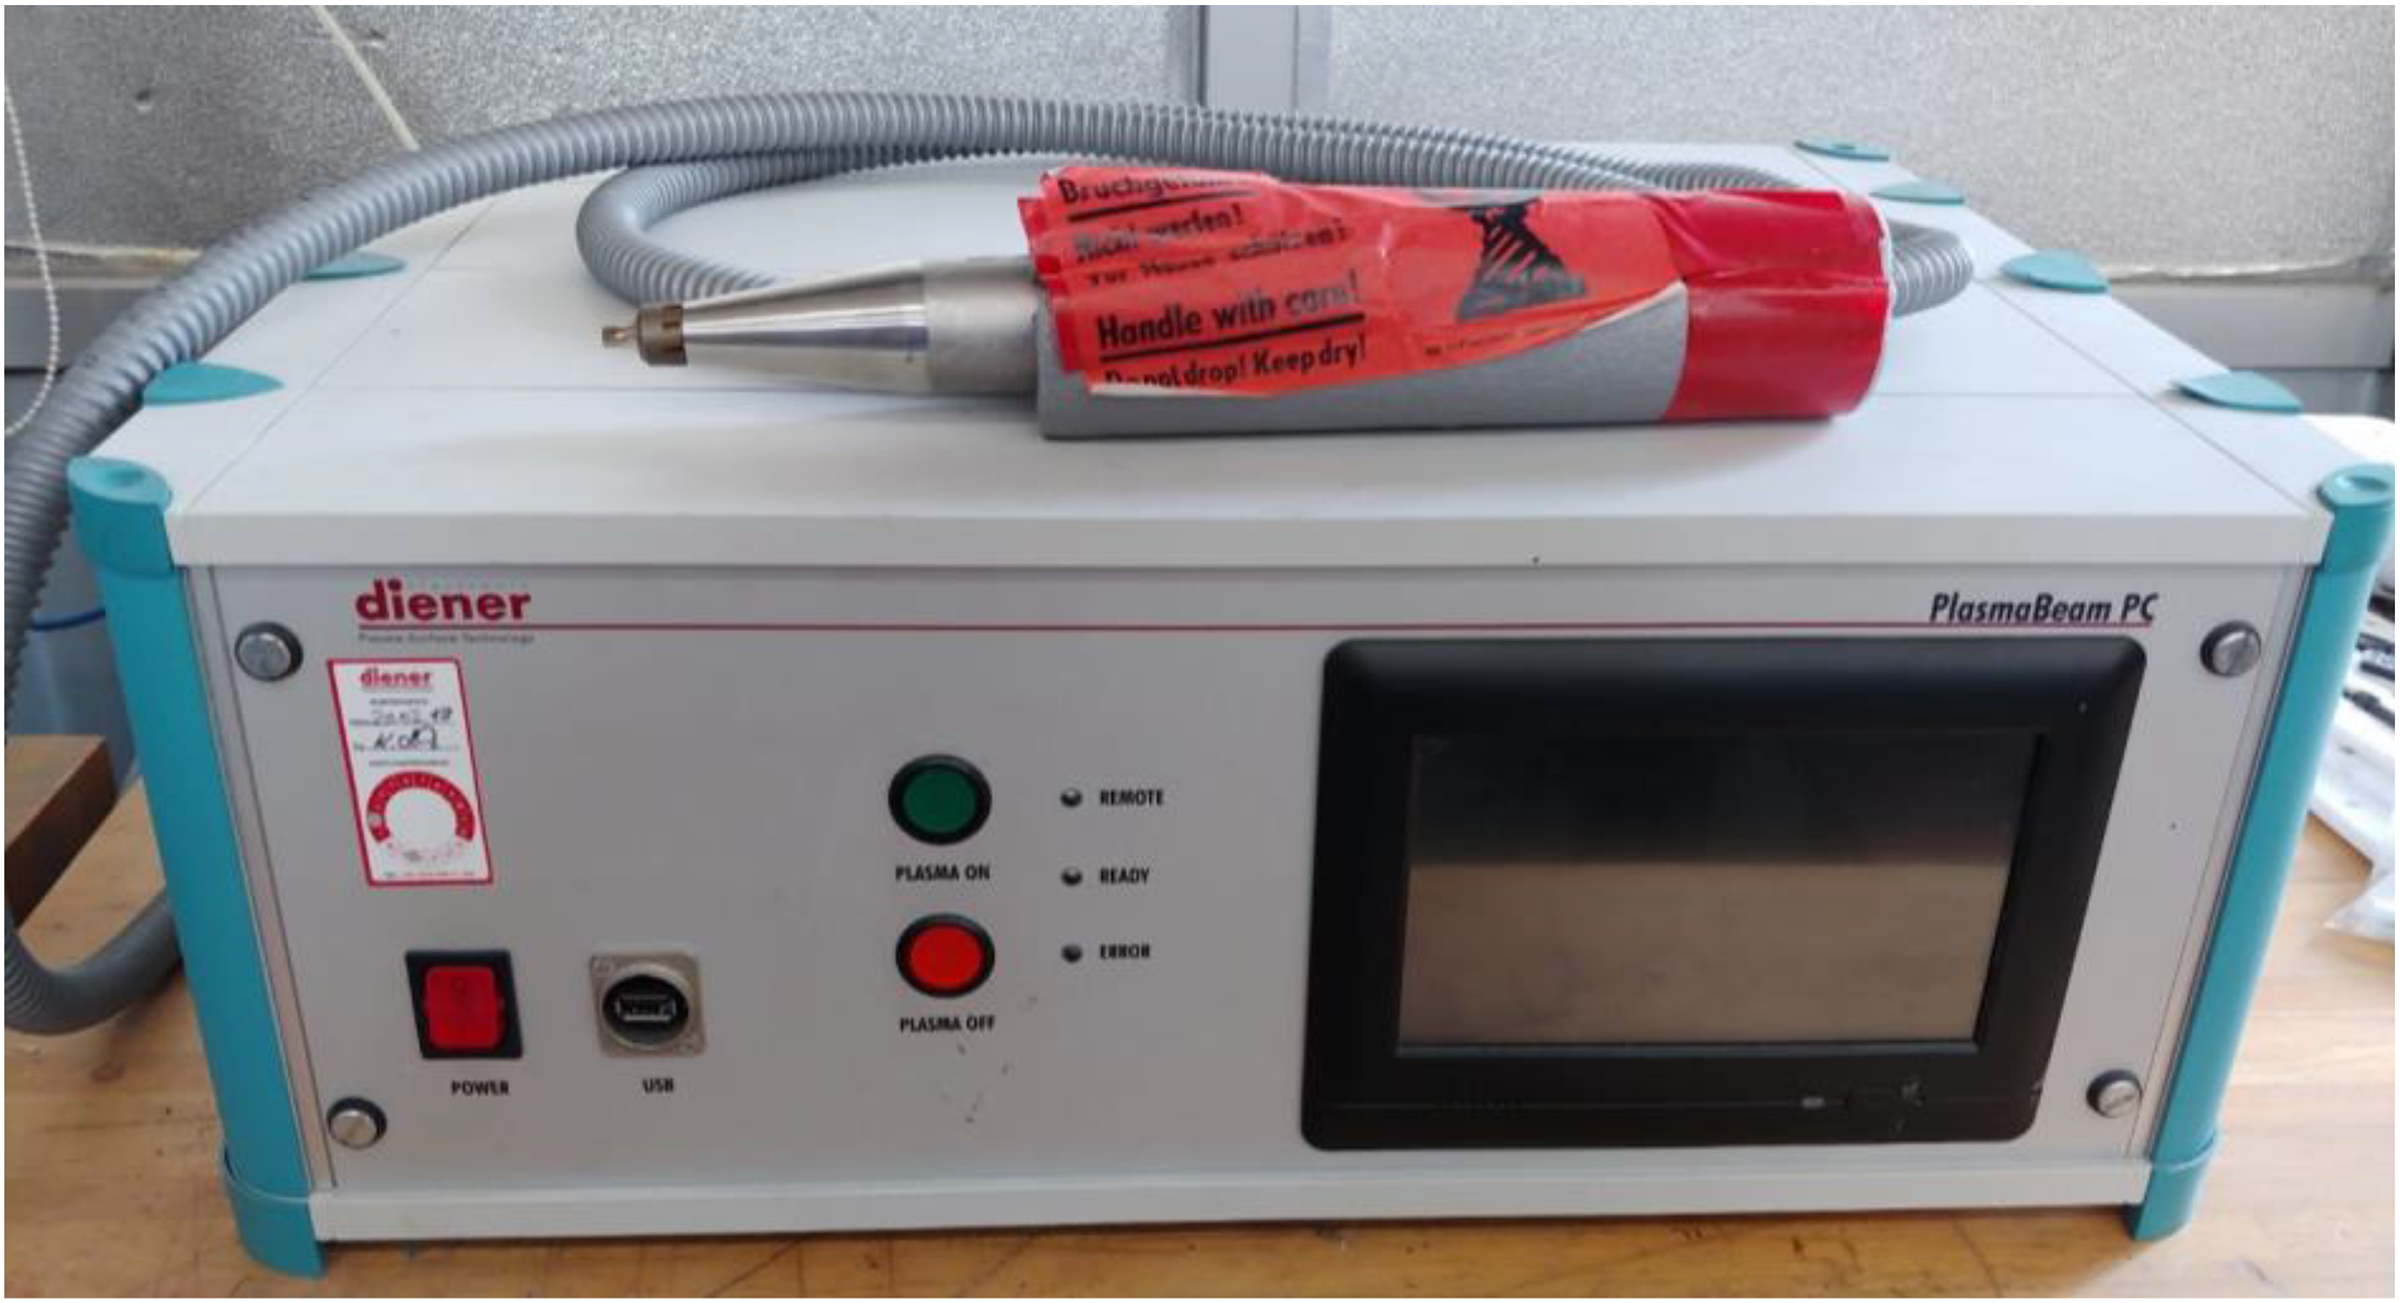
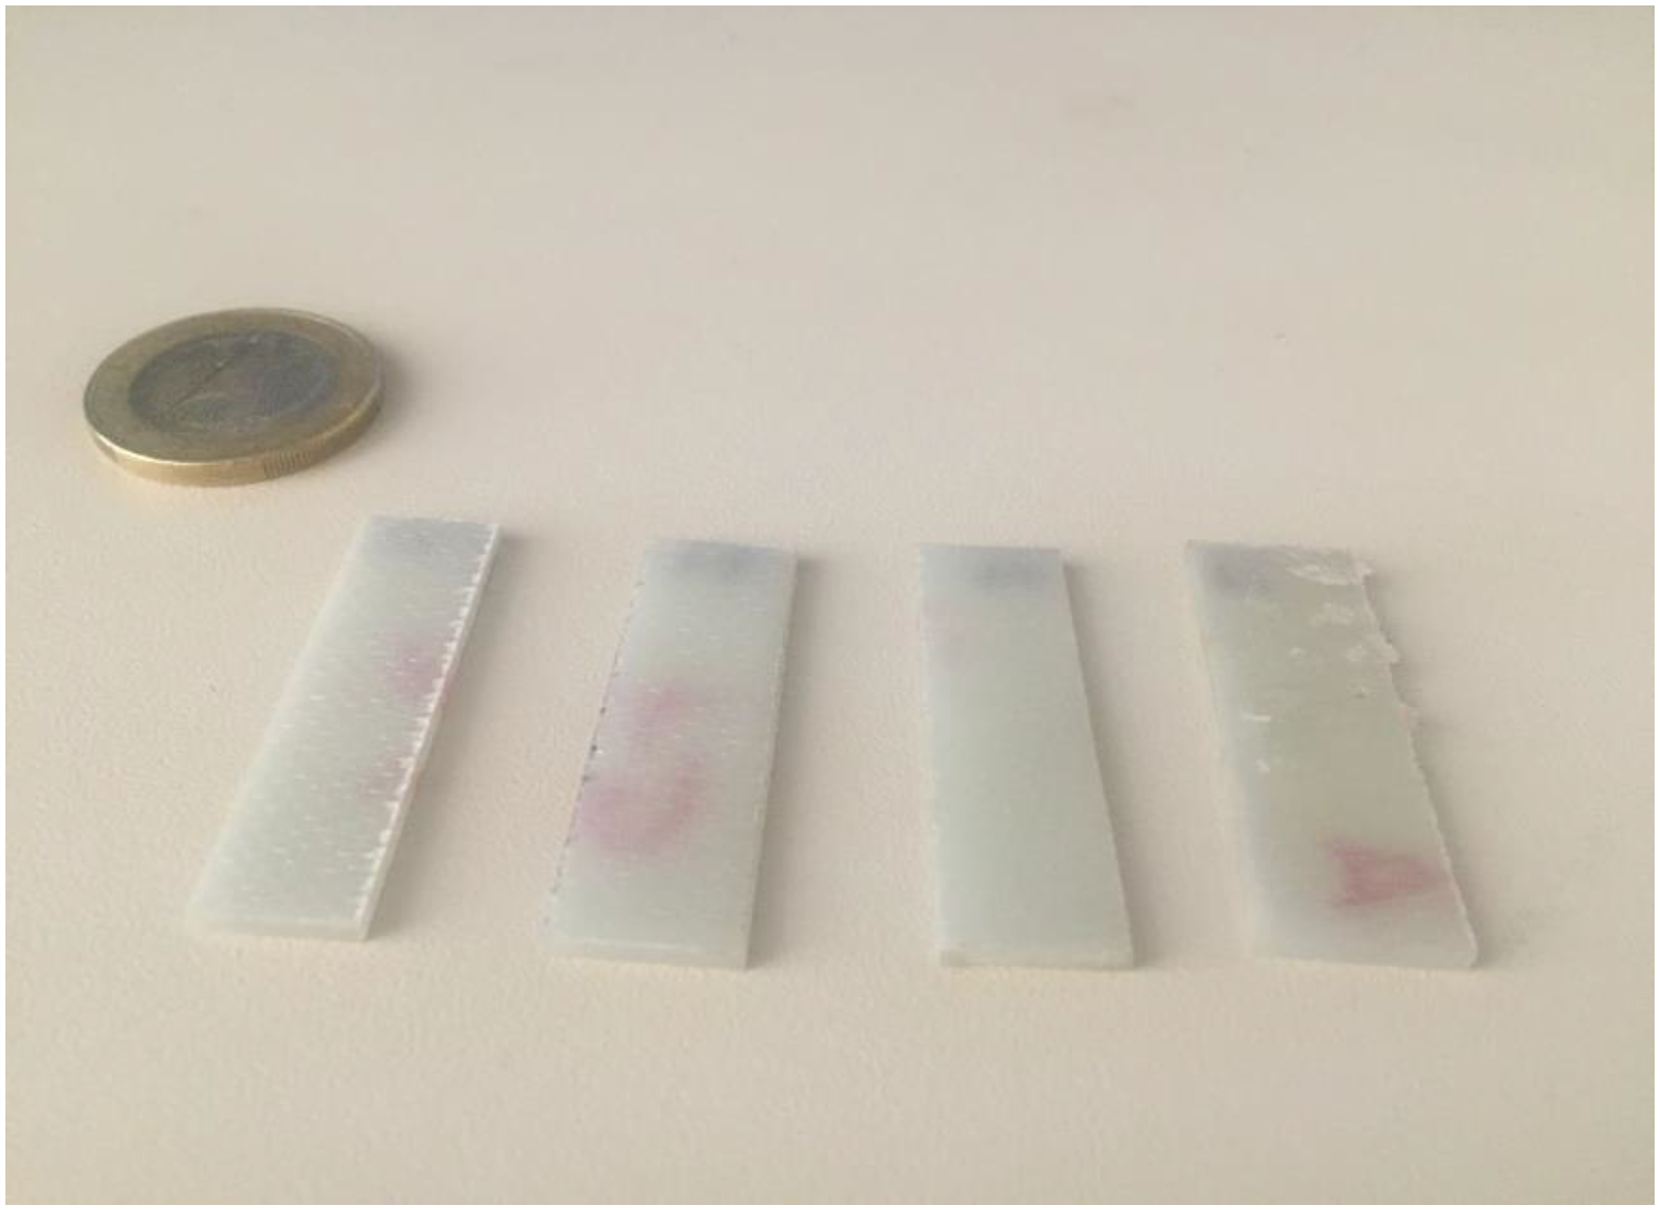
Diener Electronic PlasmaBeam Atmpospheric pressure plasma generator.
Plasma treatment process parameters.
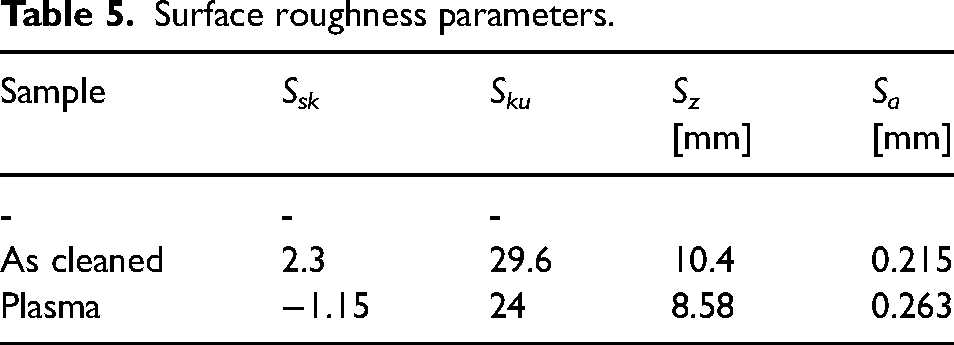
Optical profilometry scans were performed with Coherence Correlation Interferometry (CCI) Taylor Hobson noncontact three-dimensional (3D) optical profilometer to assess the topography of both the as cleaned and plasma-treated surfaces. The 3D scans are shown in Figure 6, while the main surface roughness parameters are shown in Table 5, where, with respect to the surface heights distribution, Ssk the skewness, Sku the kurtosis, Sz the maximum height of the surface, and Sa the arithmetic mean height. Although the surface topography of the plasma-treated samples has a pattern of marks left by the interaction between the plasma and the substrate, the overall difference with as-cleaned situation in terms of surface parameters is not substantial. Further optimization of the plasma process parameters could lead to a grater difference in surface topography, thus exploiting the full potential of the treatment on the joint strength.
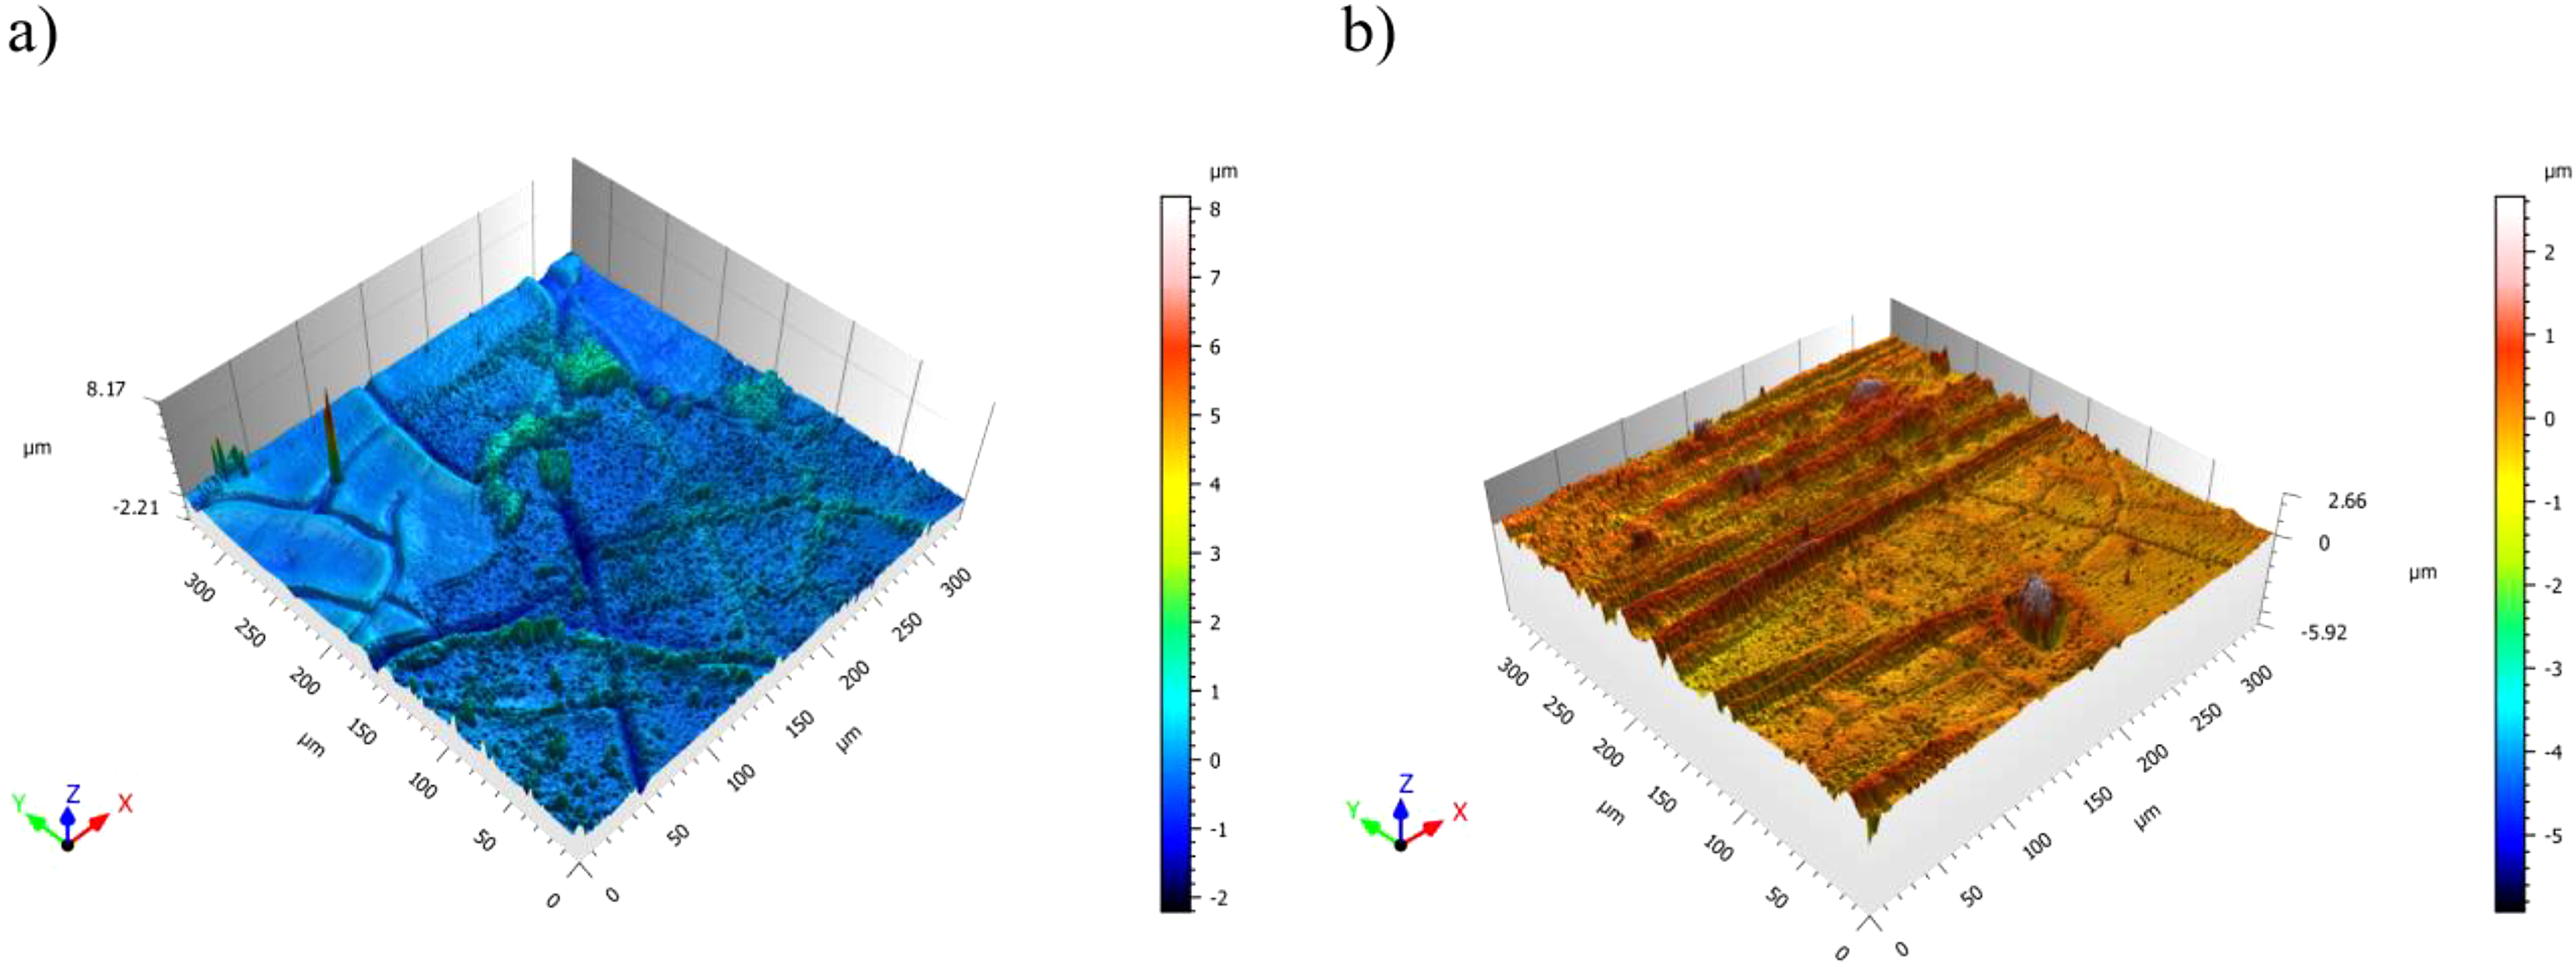
Profilometry scans for (a) the as cleaned samples and (b) the plasma-treated samples.
Surface roughness parameters.
Dynamic mechanical analysis
This analysis was carried out to characterize the viscoelastic behavior for the purpose of the subsequent finite element simulation of the heating transient of the joint subjected to the action of the sonotrode. The analyzes were carried out on rectangular GF reinforced PC specimens (dimensions
Specimens for the dynamic mechanical analysis.
The mechanical characterizations were performed with a TA Q800 dynamic mechanical analyzer. Single cantilever cyclic bending tests were performed at varying temperatures and for different frequencies, as described in detail below.
Test in oscillatory regime in deformation control at constant frequency and variable temperature (temperature sweep):
Frequency: 1 and 10 Hz; Deformation: 0.1%; Temperature: from 5°C to 150°C. Test in oscillatory regime in deformation control at constant temperature and variable frequency (frequency sweep):
Frequency range: 0.1 to 10 Hz (logarithmic variation with 5 points per decade); Deformation: 0.1%; Temperature: 30°C, 20°C, 10°C, 0°C, −10°C, −20 ° C.
The principle of time (frequency) − temperature superposition was applied to the raw data obtained in test b in order to generate a master curve at the reference temperature of 20°C.
Tensile test
To characterize the mechanical strength of the joints, both USW and adhesively bonded, tensile tests were carried out on an INSTRON 4467 servomechanical machine, making reference to the D 5868 standard (Standard Test Method for Lap Shear Adhesion for Fiber Reinforced Plastic Bonding), a travel speed of
Micrographic analysis
A USW sample for each set of parameters was left available for subsequent micrographic analysis. For each of these samples, only the overlapping area was taken and the cross-section was carried out in order to observe the surface. The parts obtained from each sample were incorporated (Figure 8) and subsequently observed under the microscope.
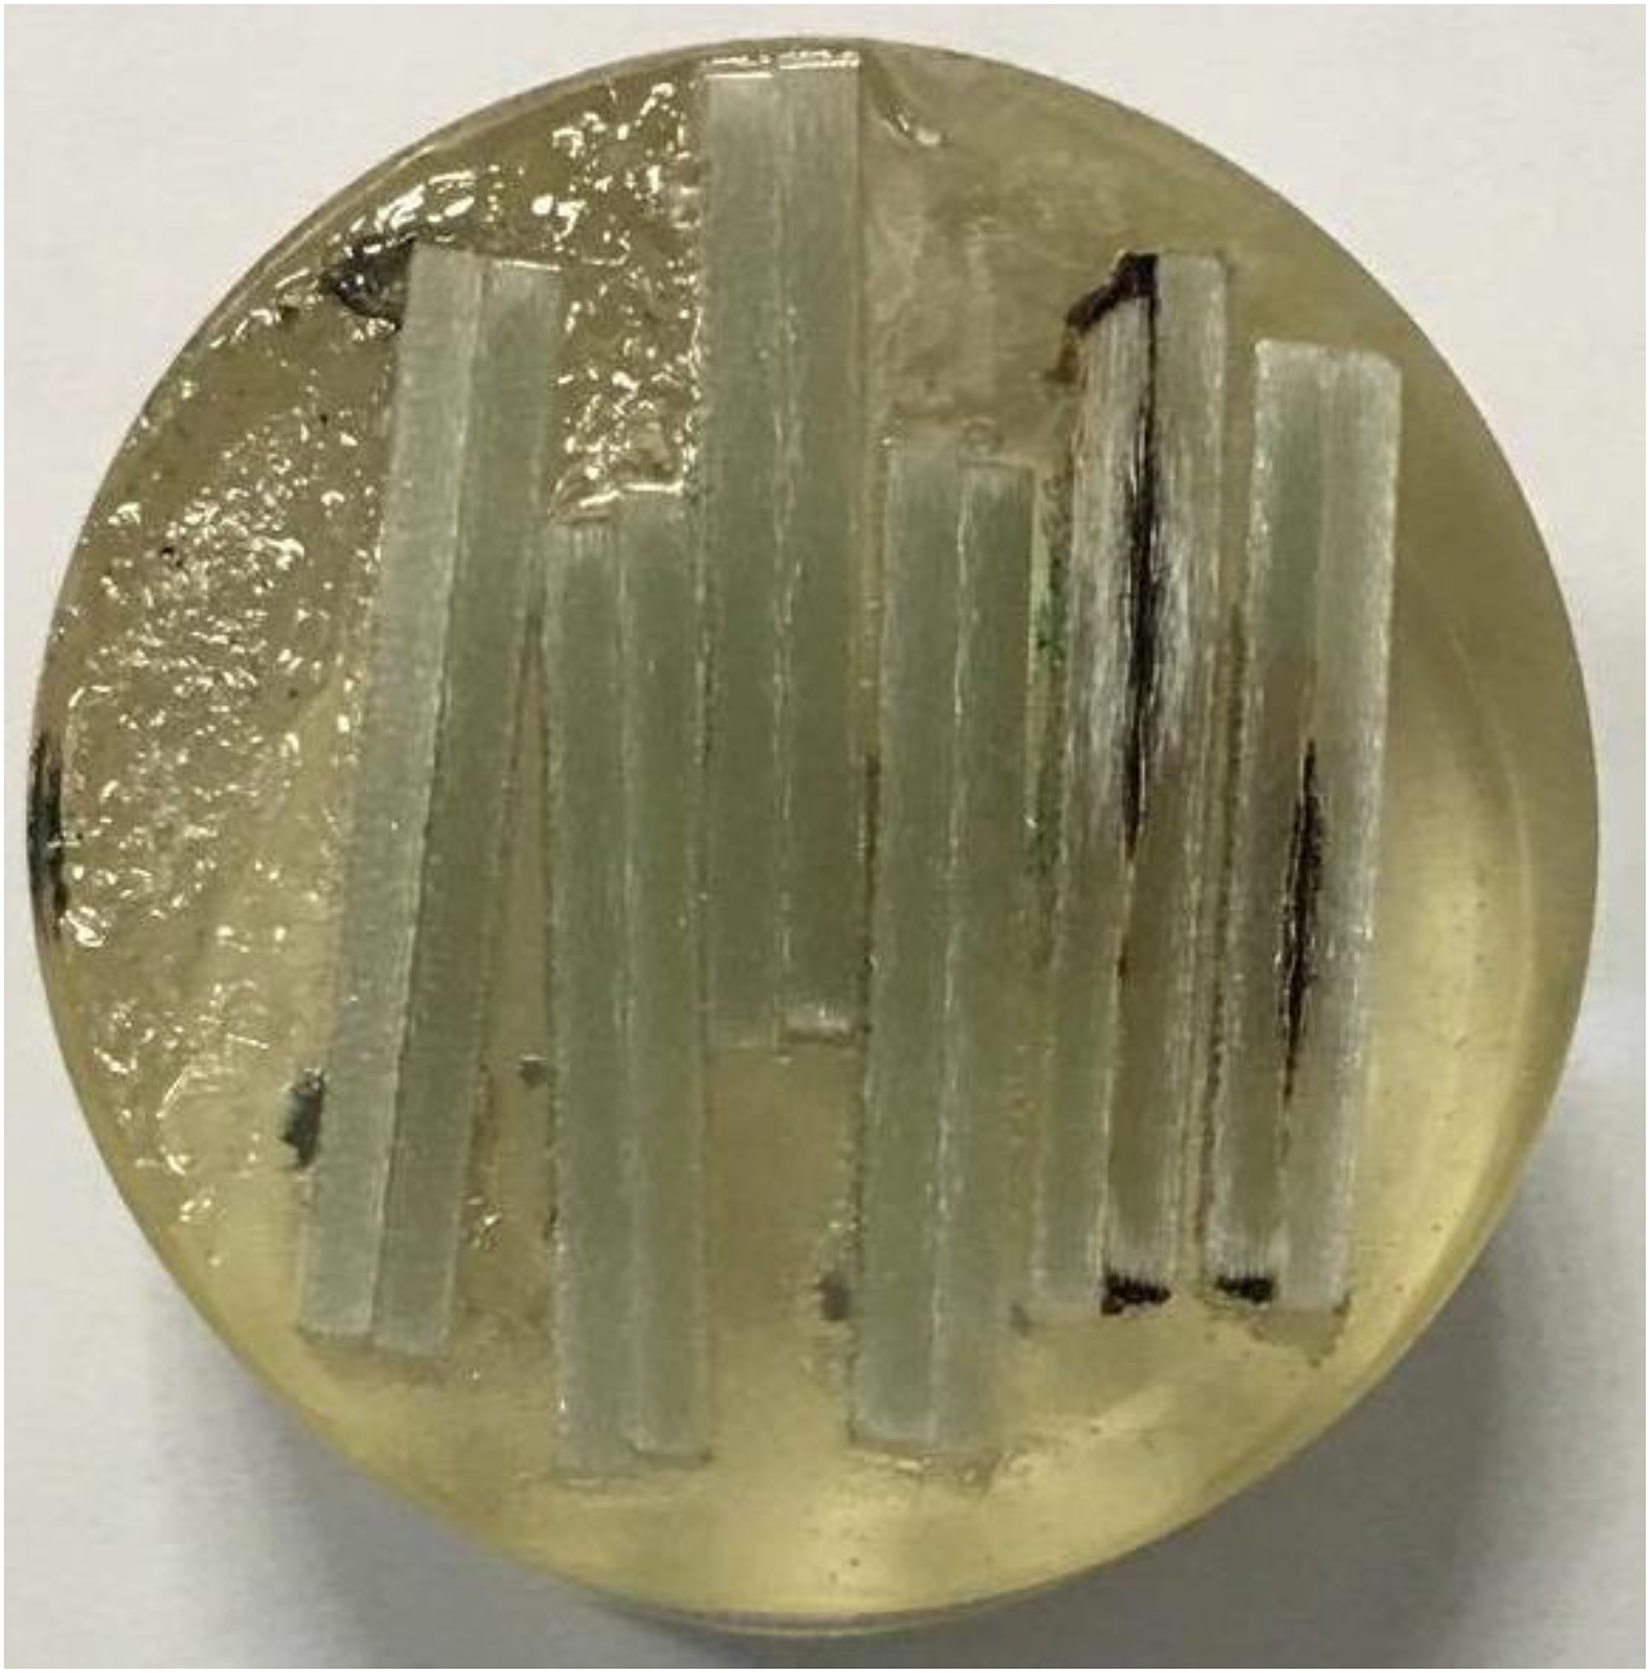
Joint section incorporated in the resin to carry out the micrographic analysis.
Results and discussion
Dynamic mechanical analysis
The dynamic mechanical analysis (DMA) tests have identified properties in the plane of the laminate, in the longitudinal direction, which will be identified with the subscript 11. Figures 9 and 10 show the storage (E11’) and loss (E11”) modulus, respectively, as a function of the temperature for the two isofrequency tests (1 and 10 Hz).
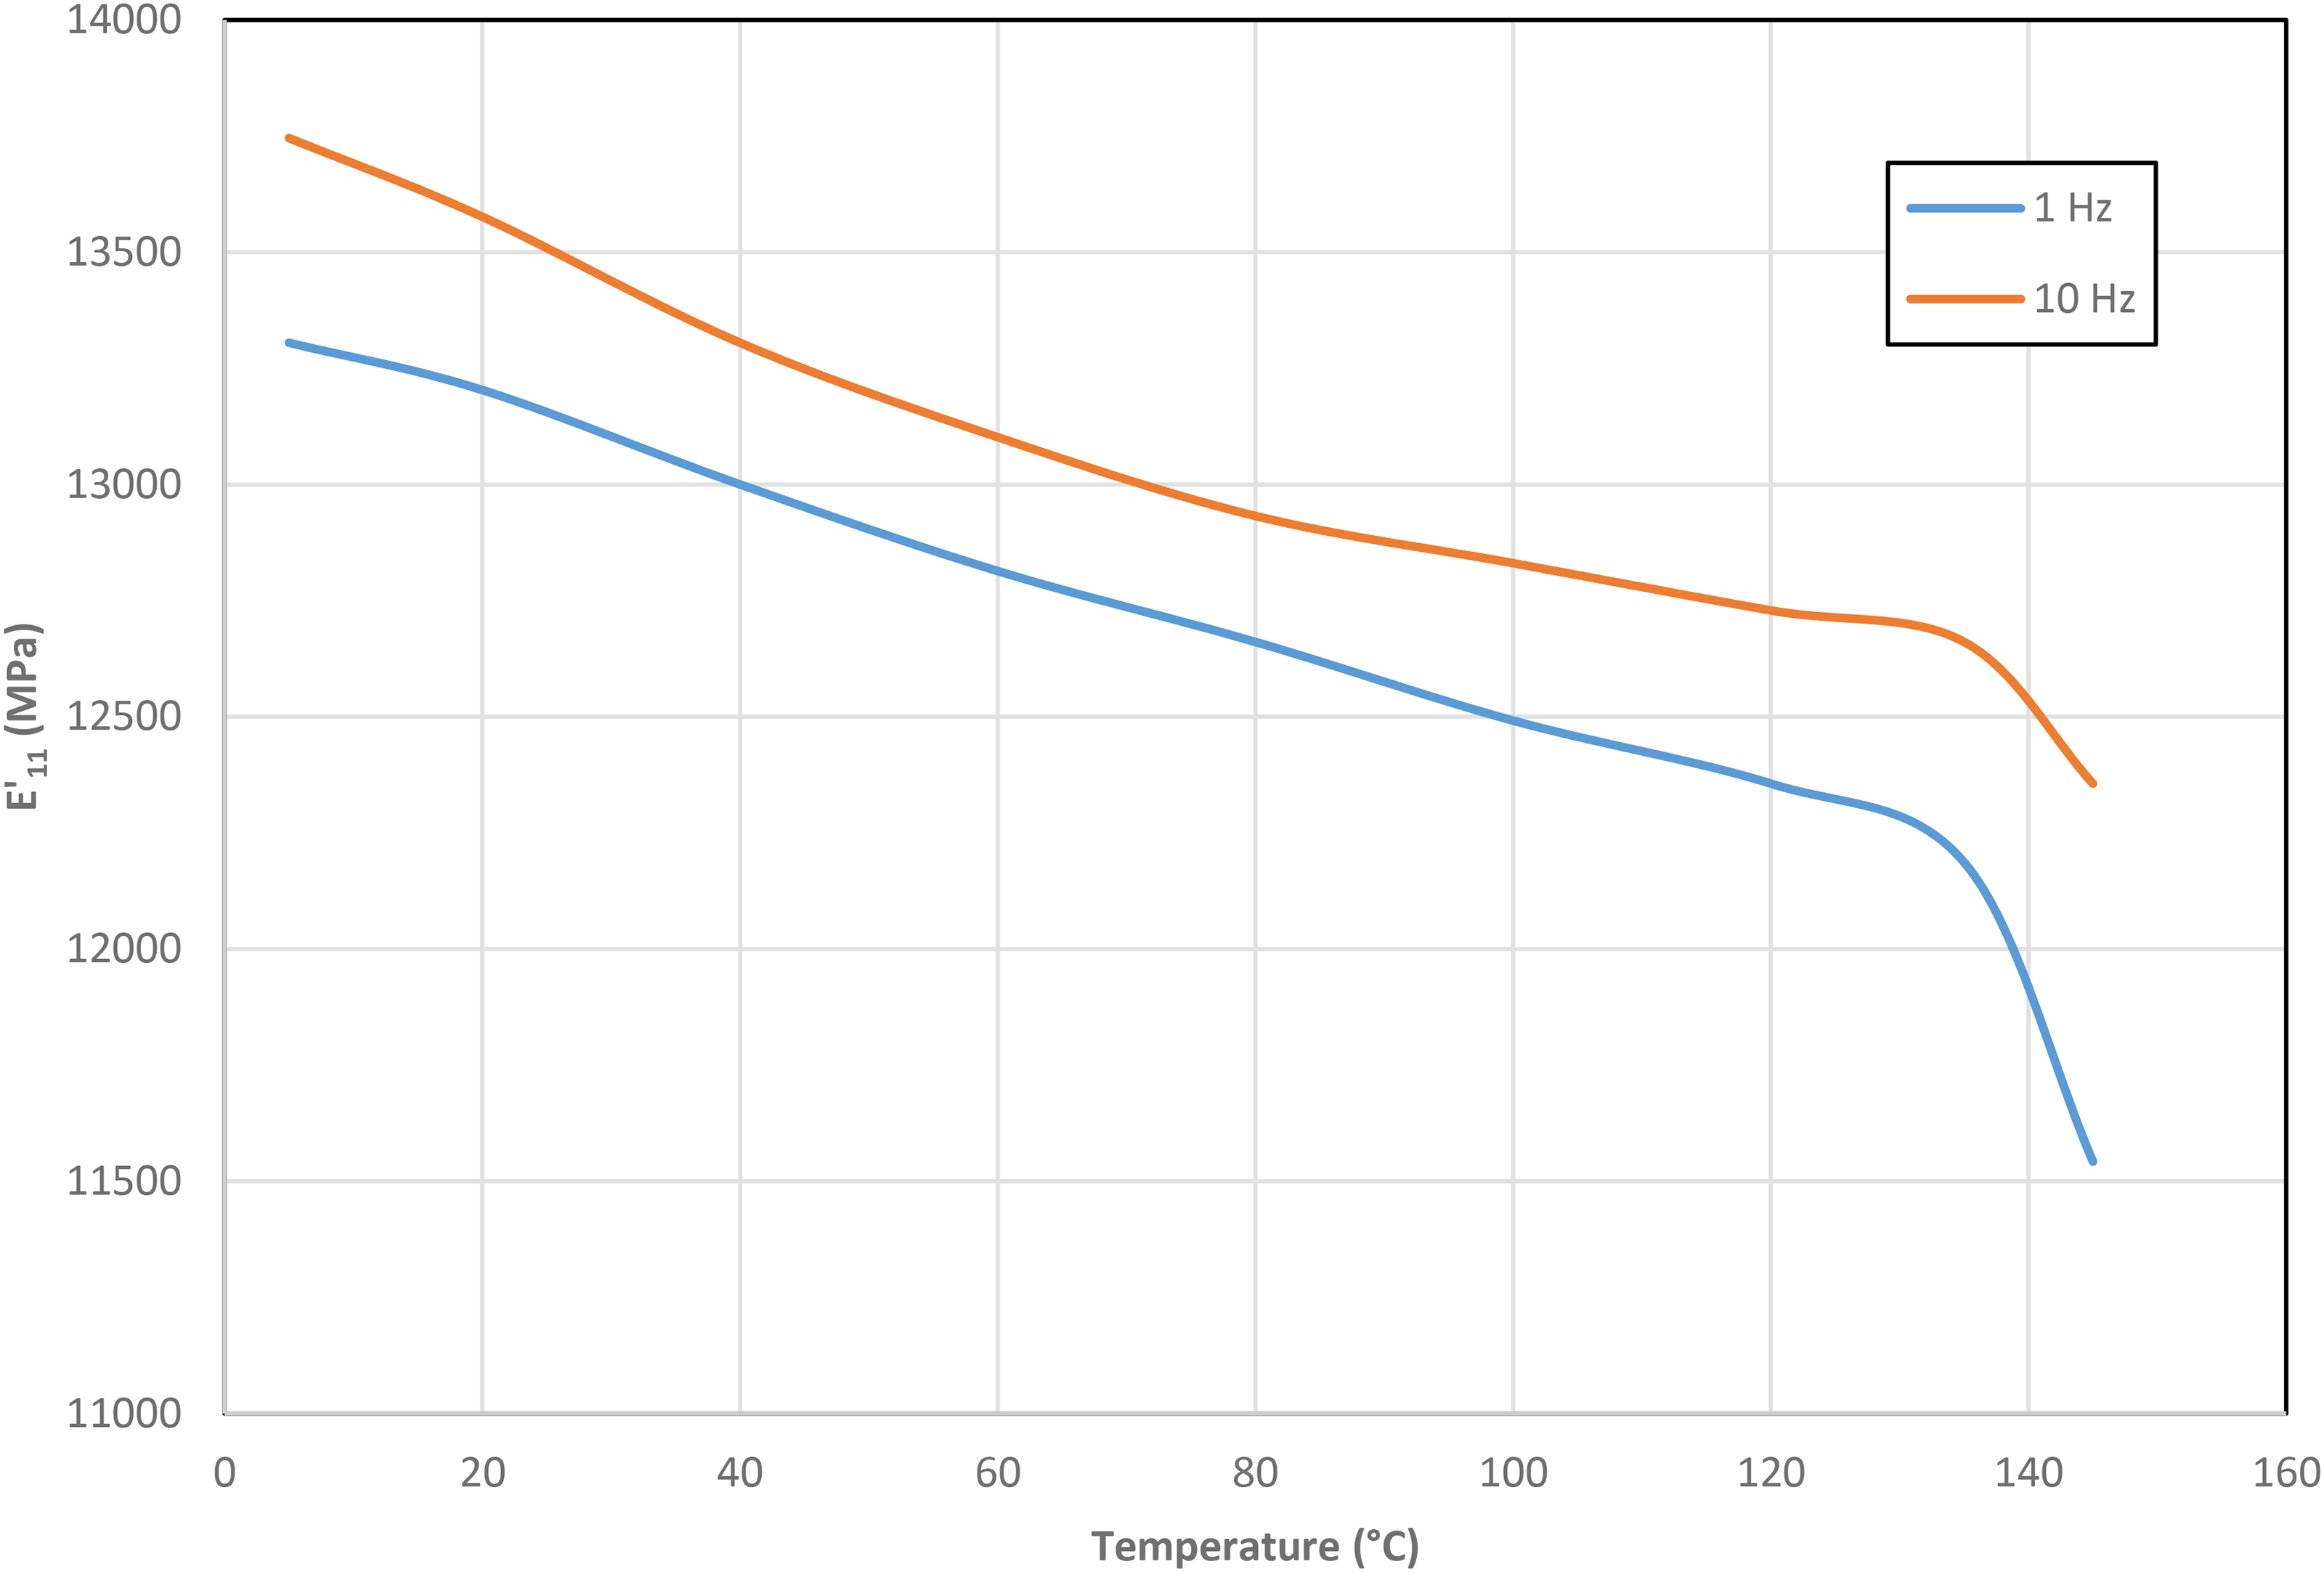
Storage modulus E11’ of the laminate as a function of the temperature at 1 and 10 Hz.
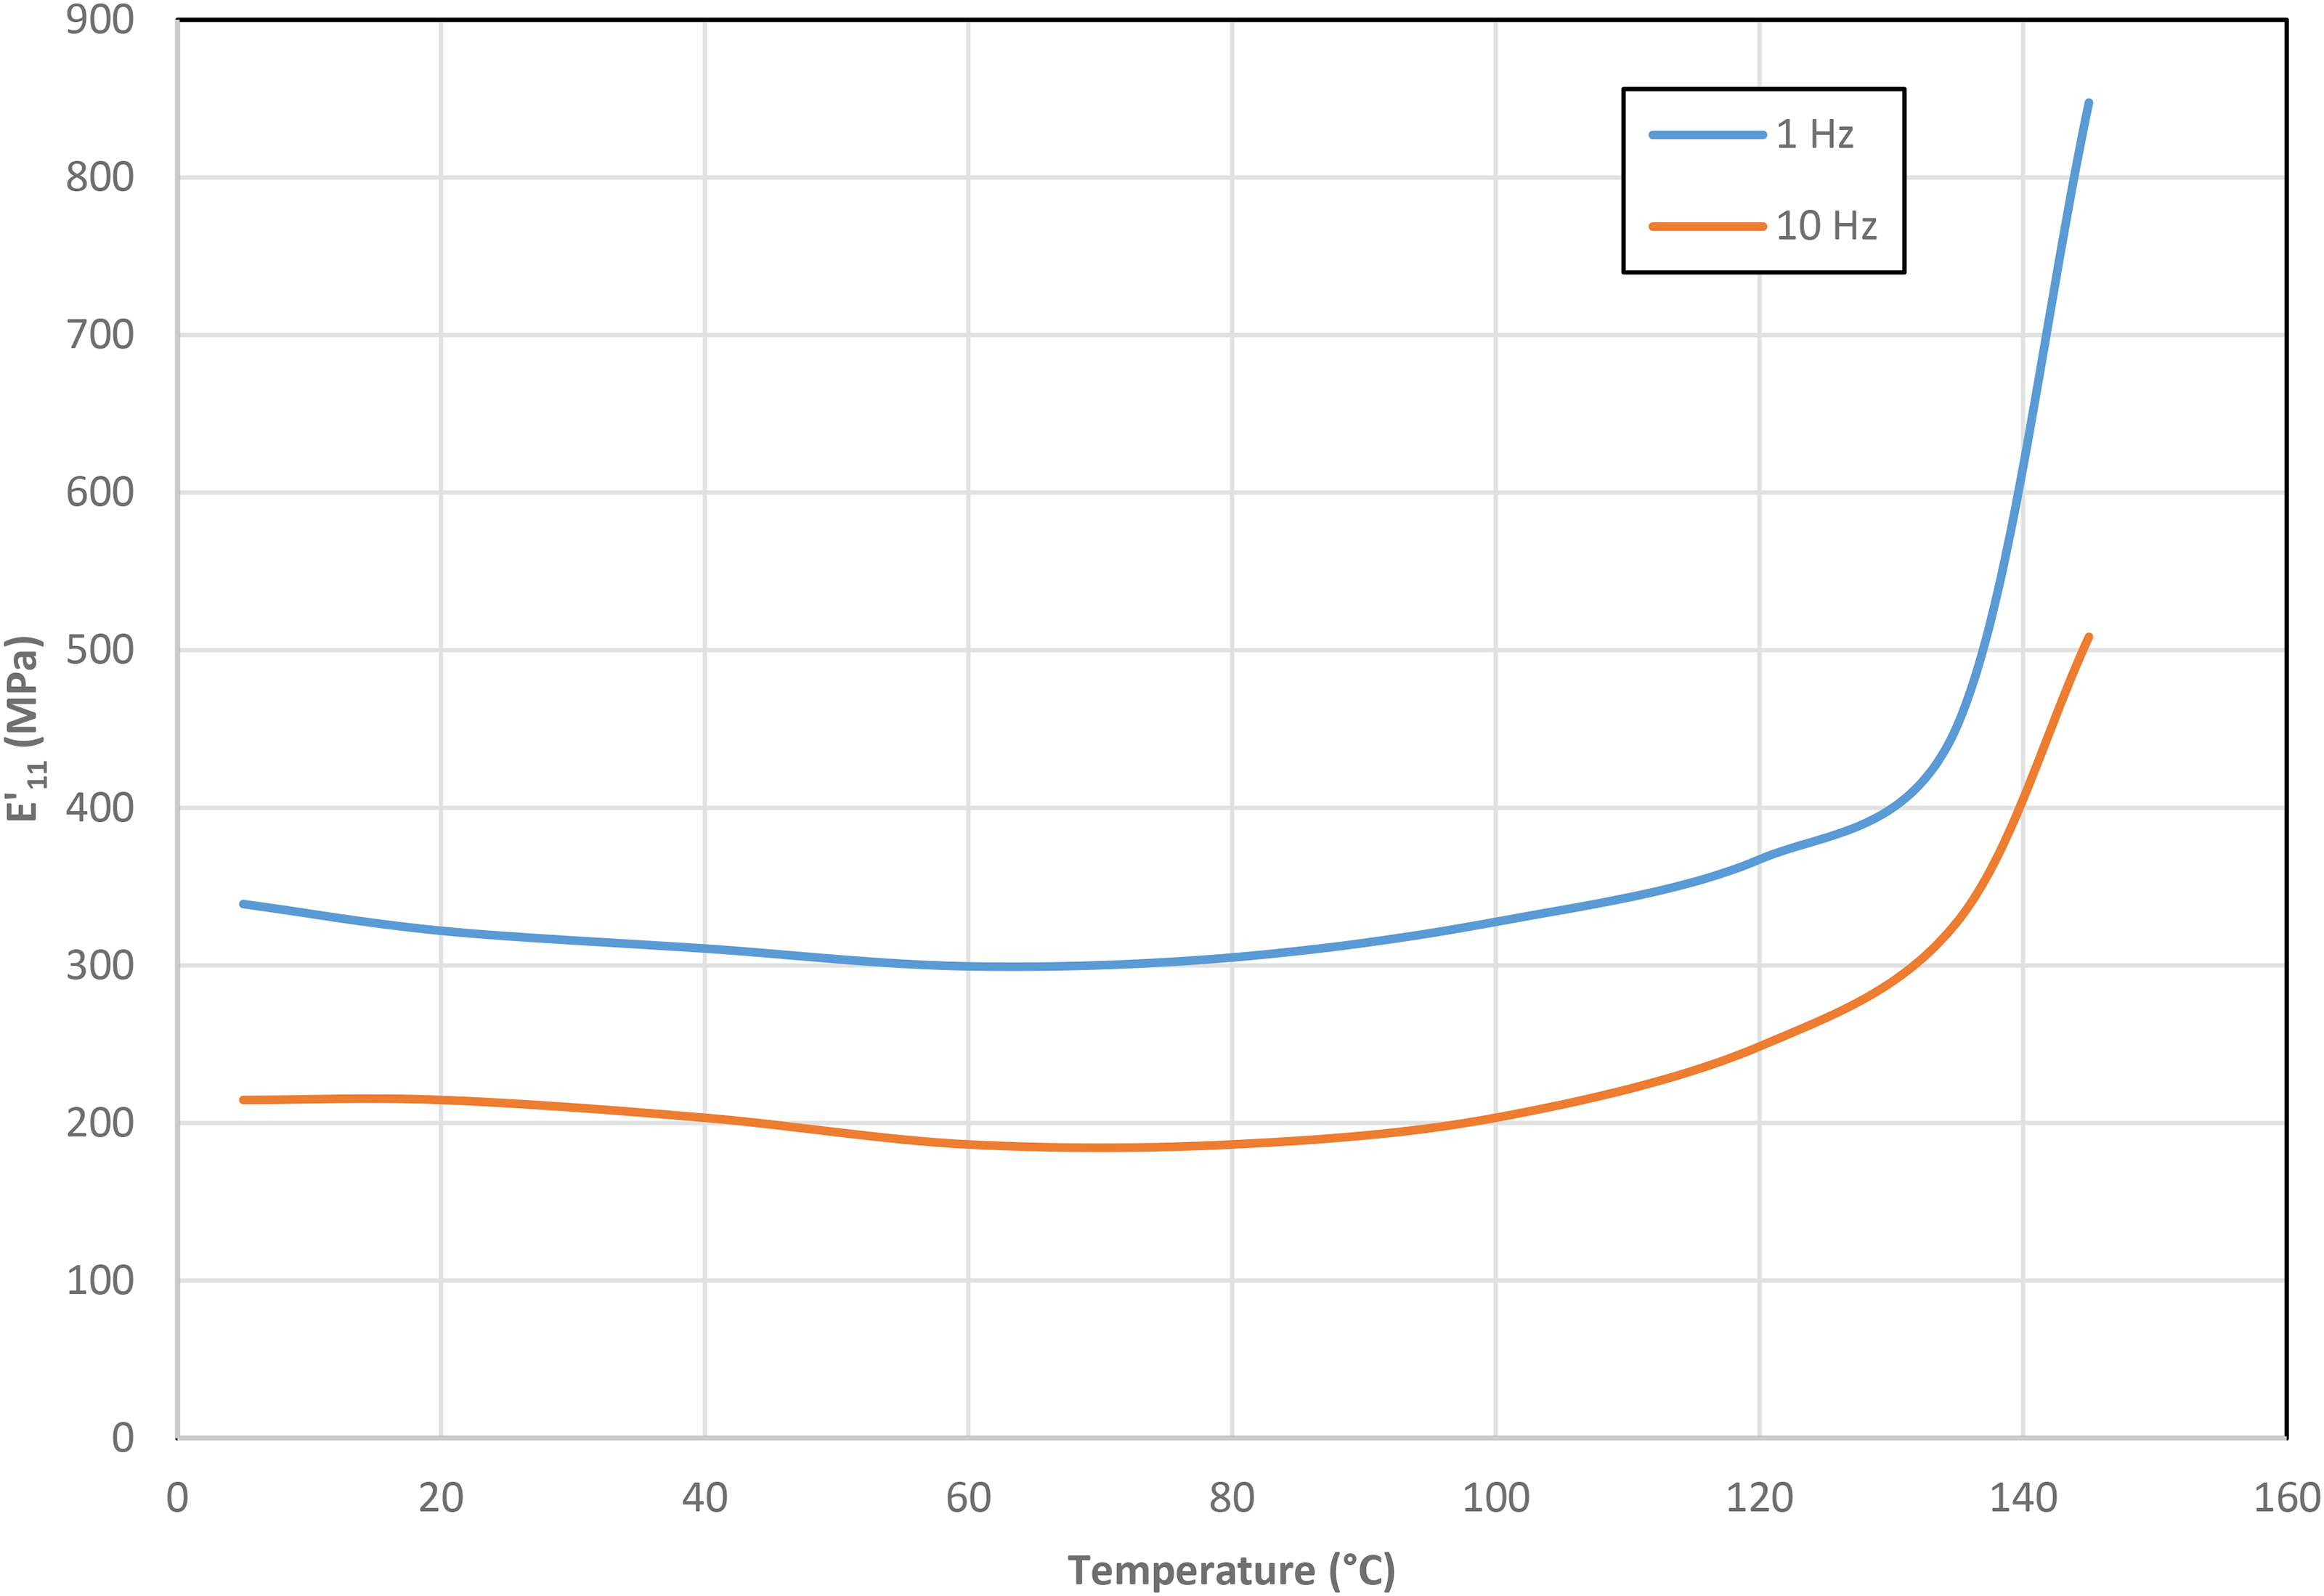
Loss modulus E11’’ as a function of the temperature.
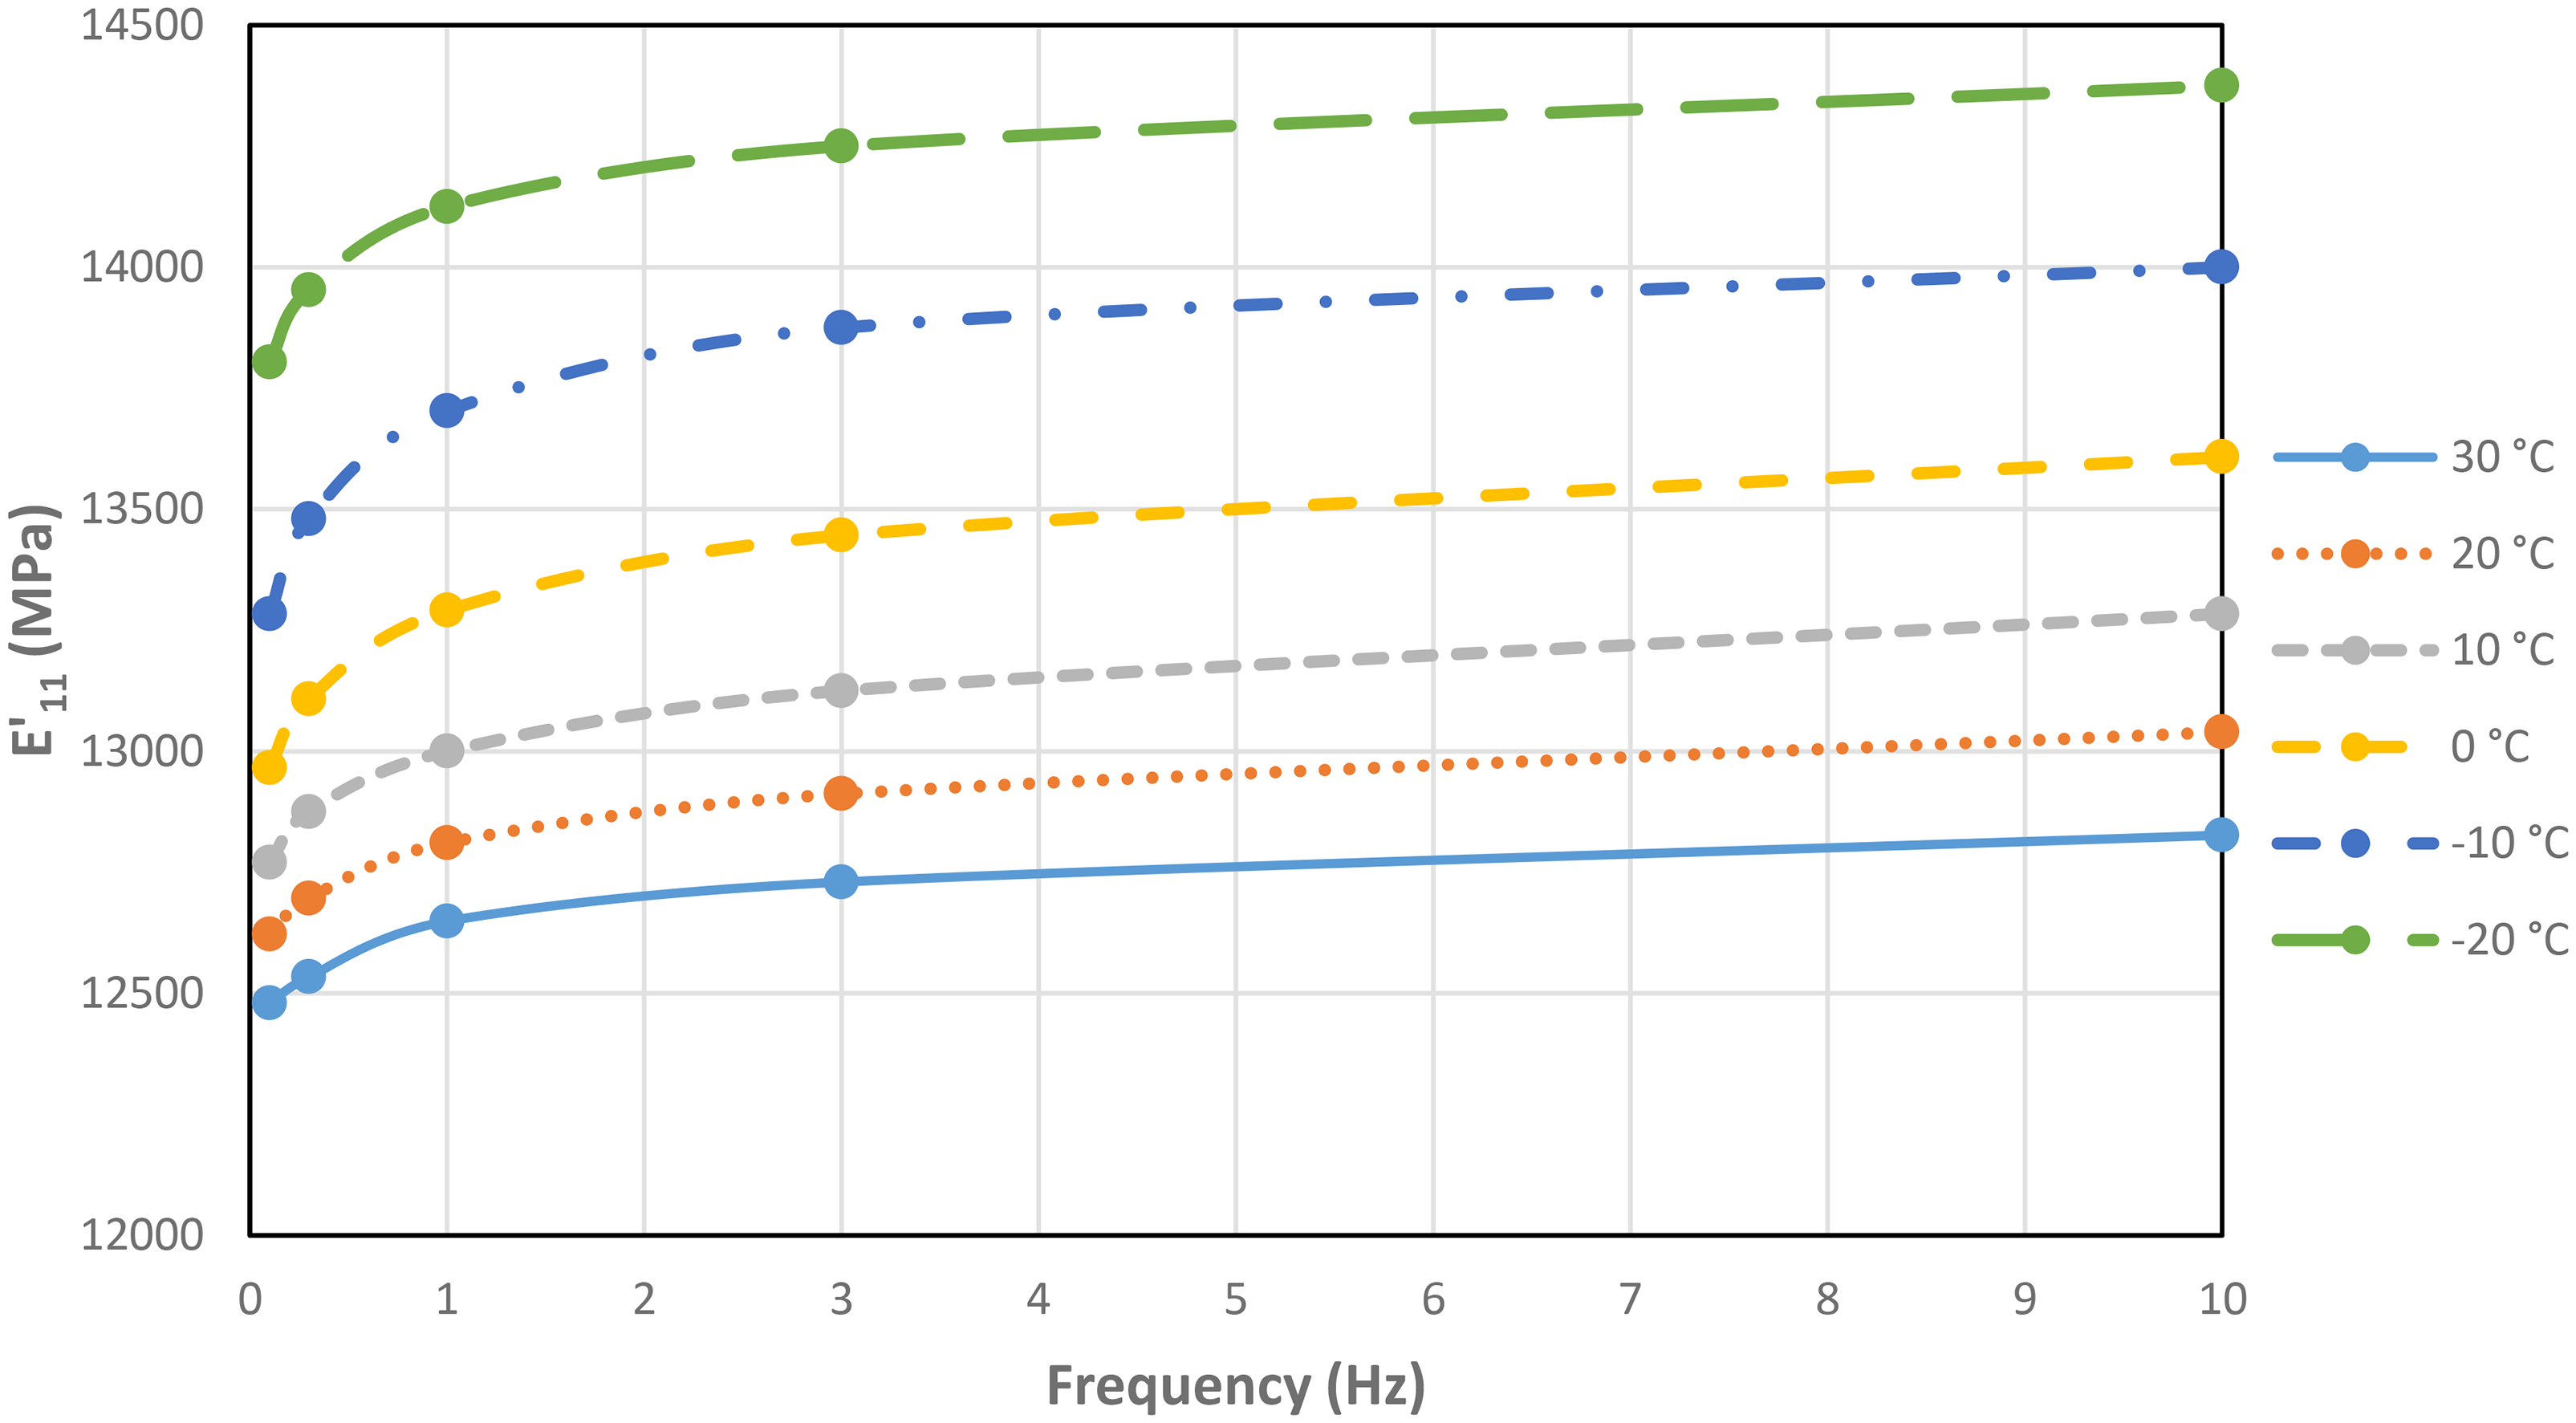
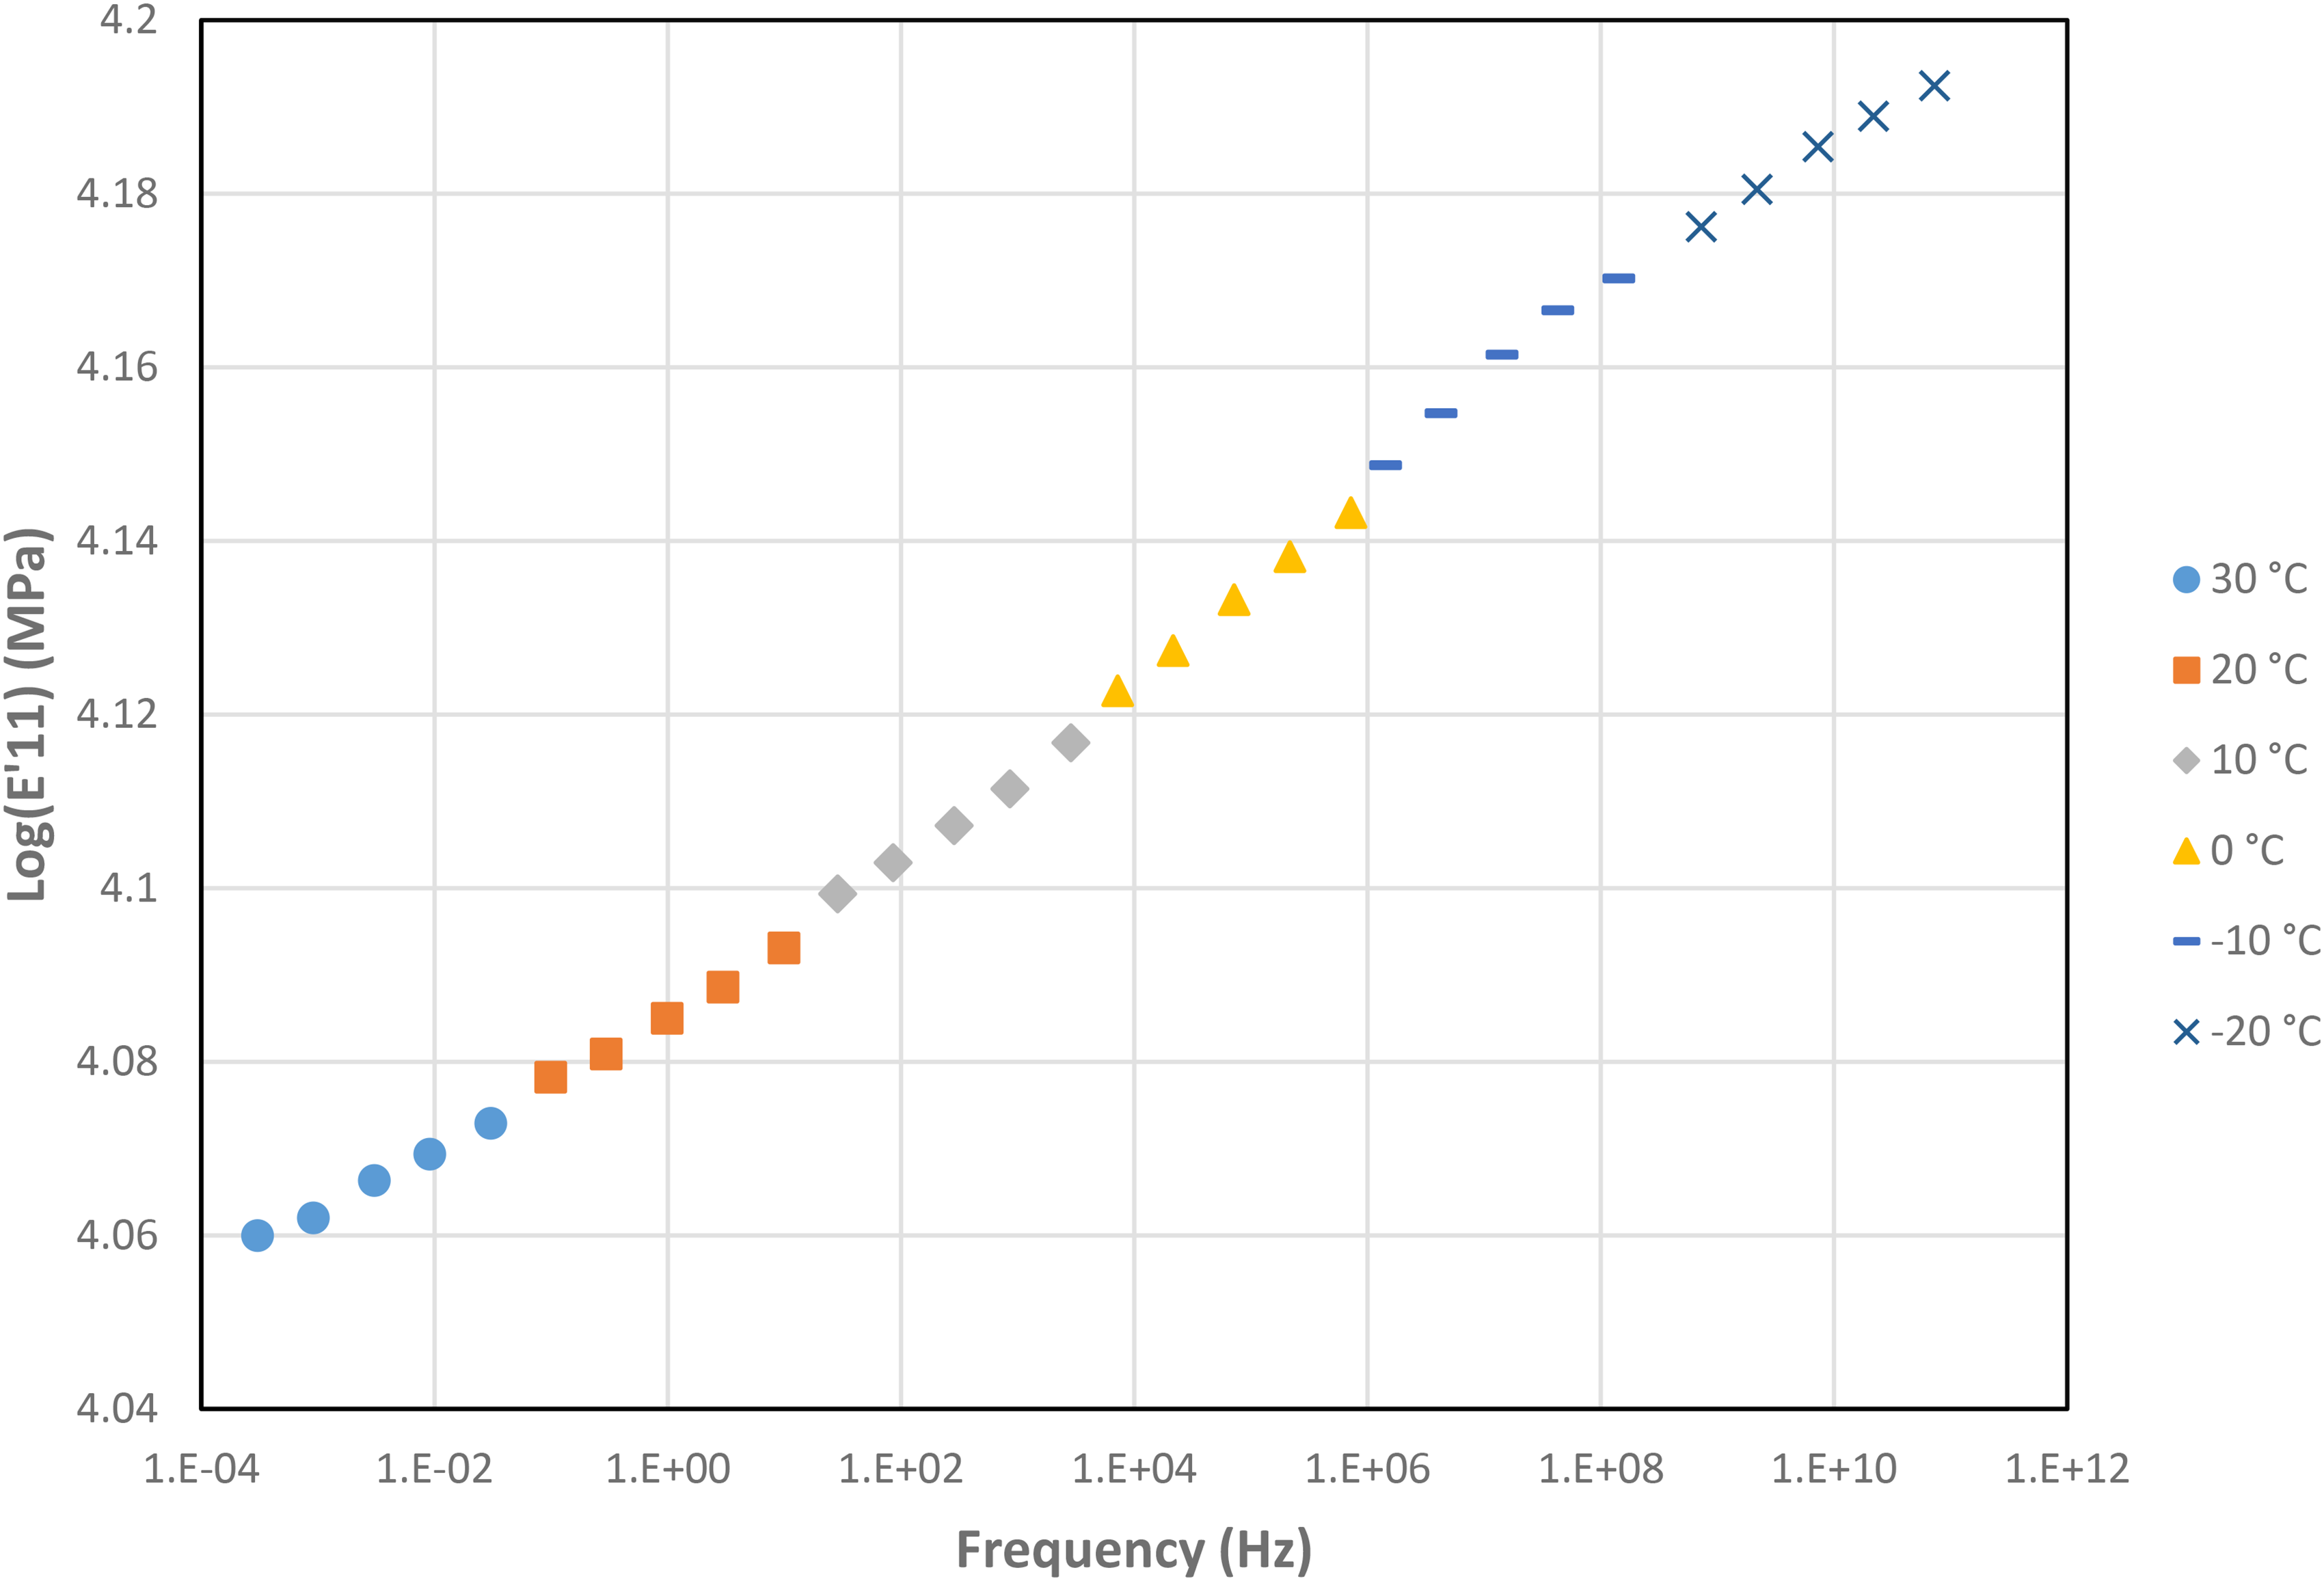
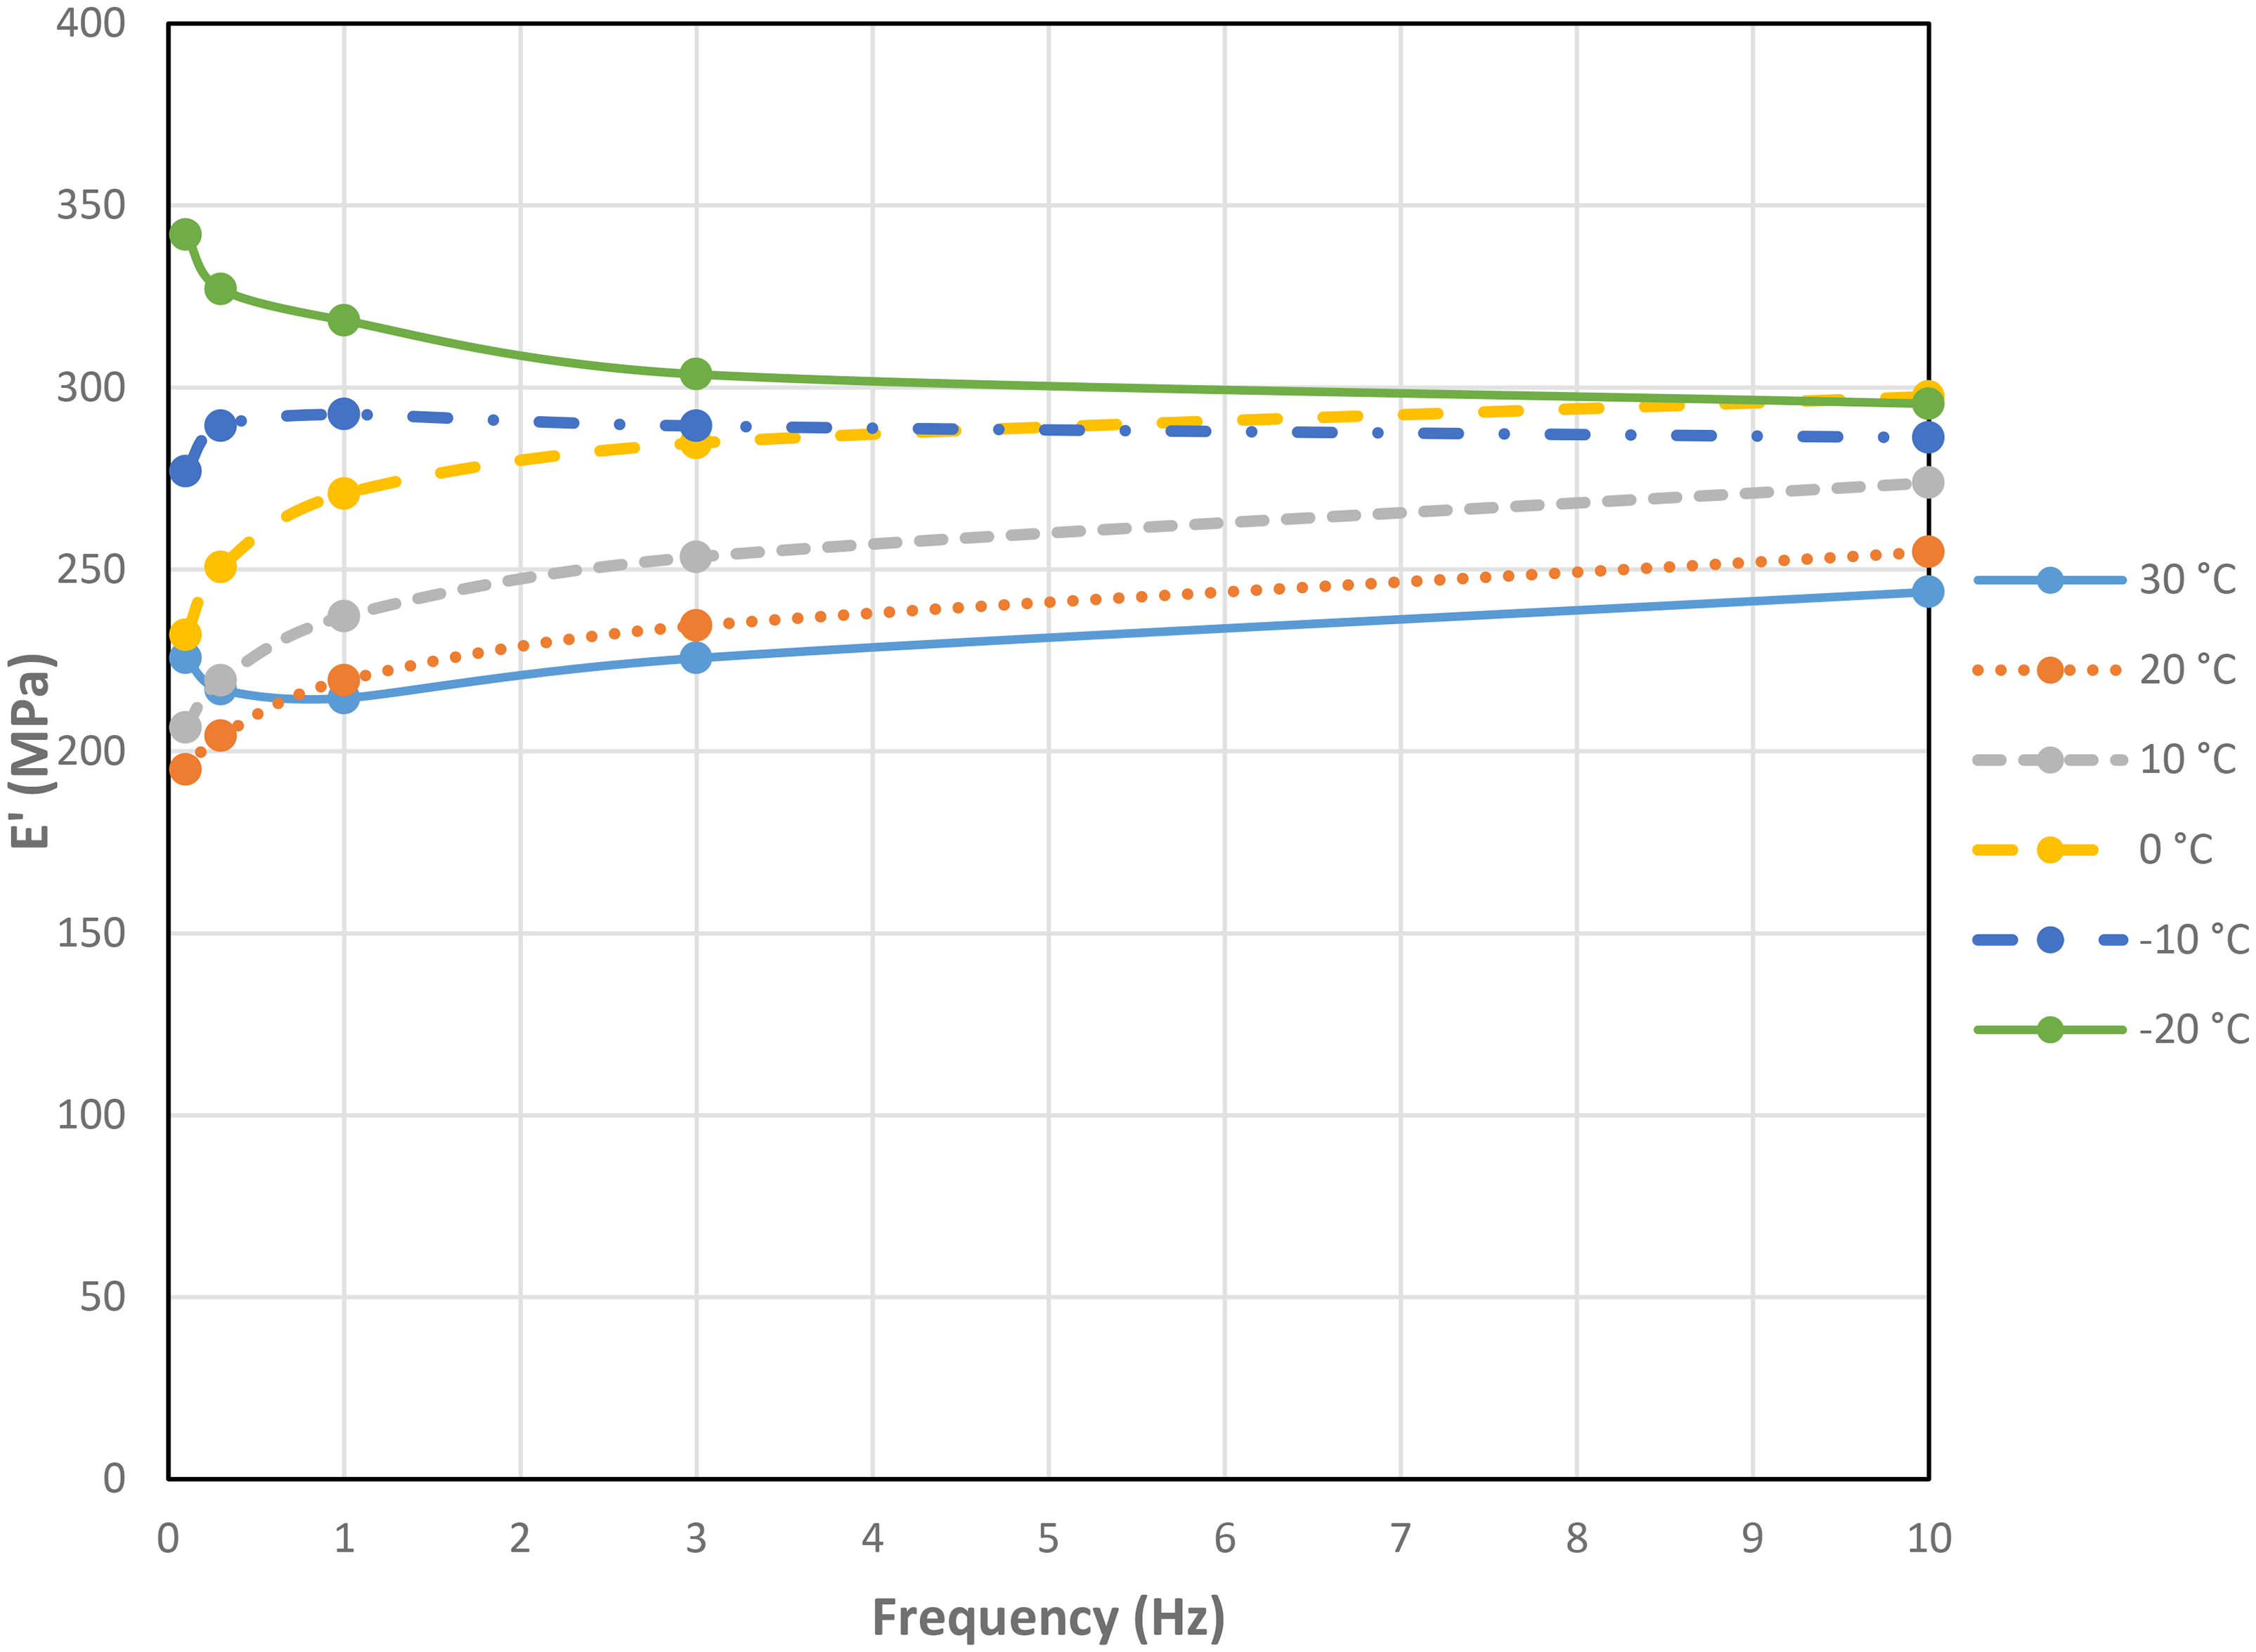
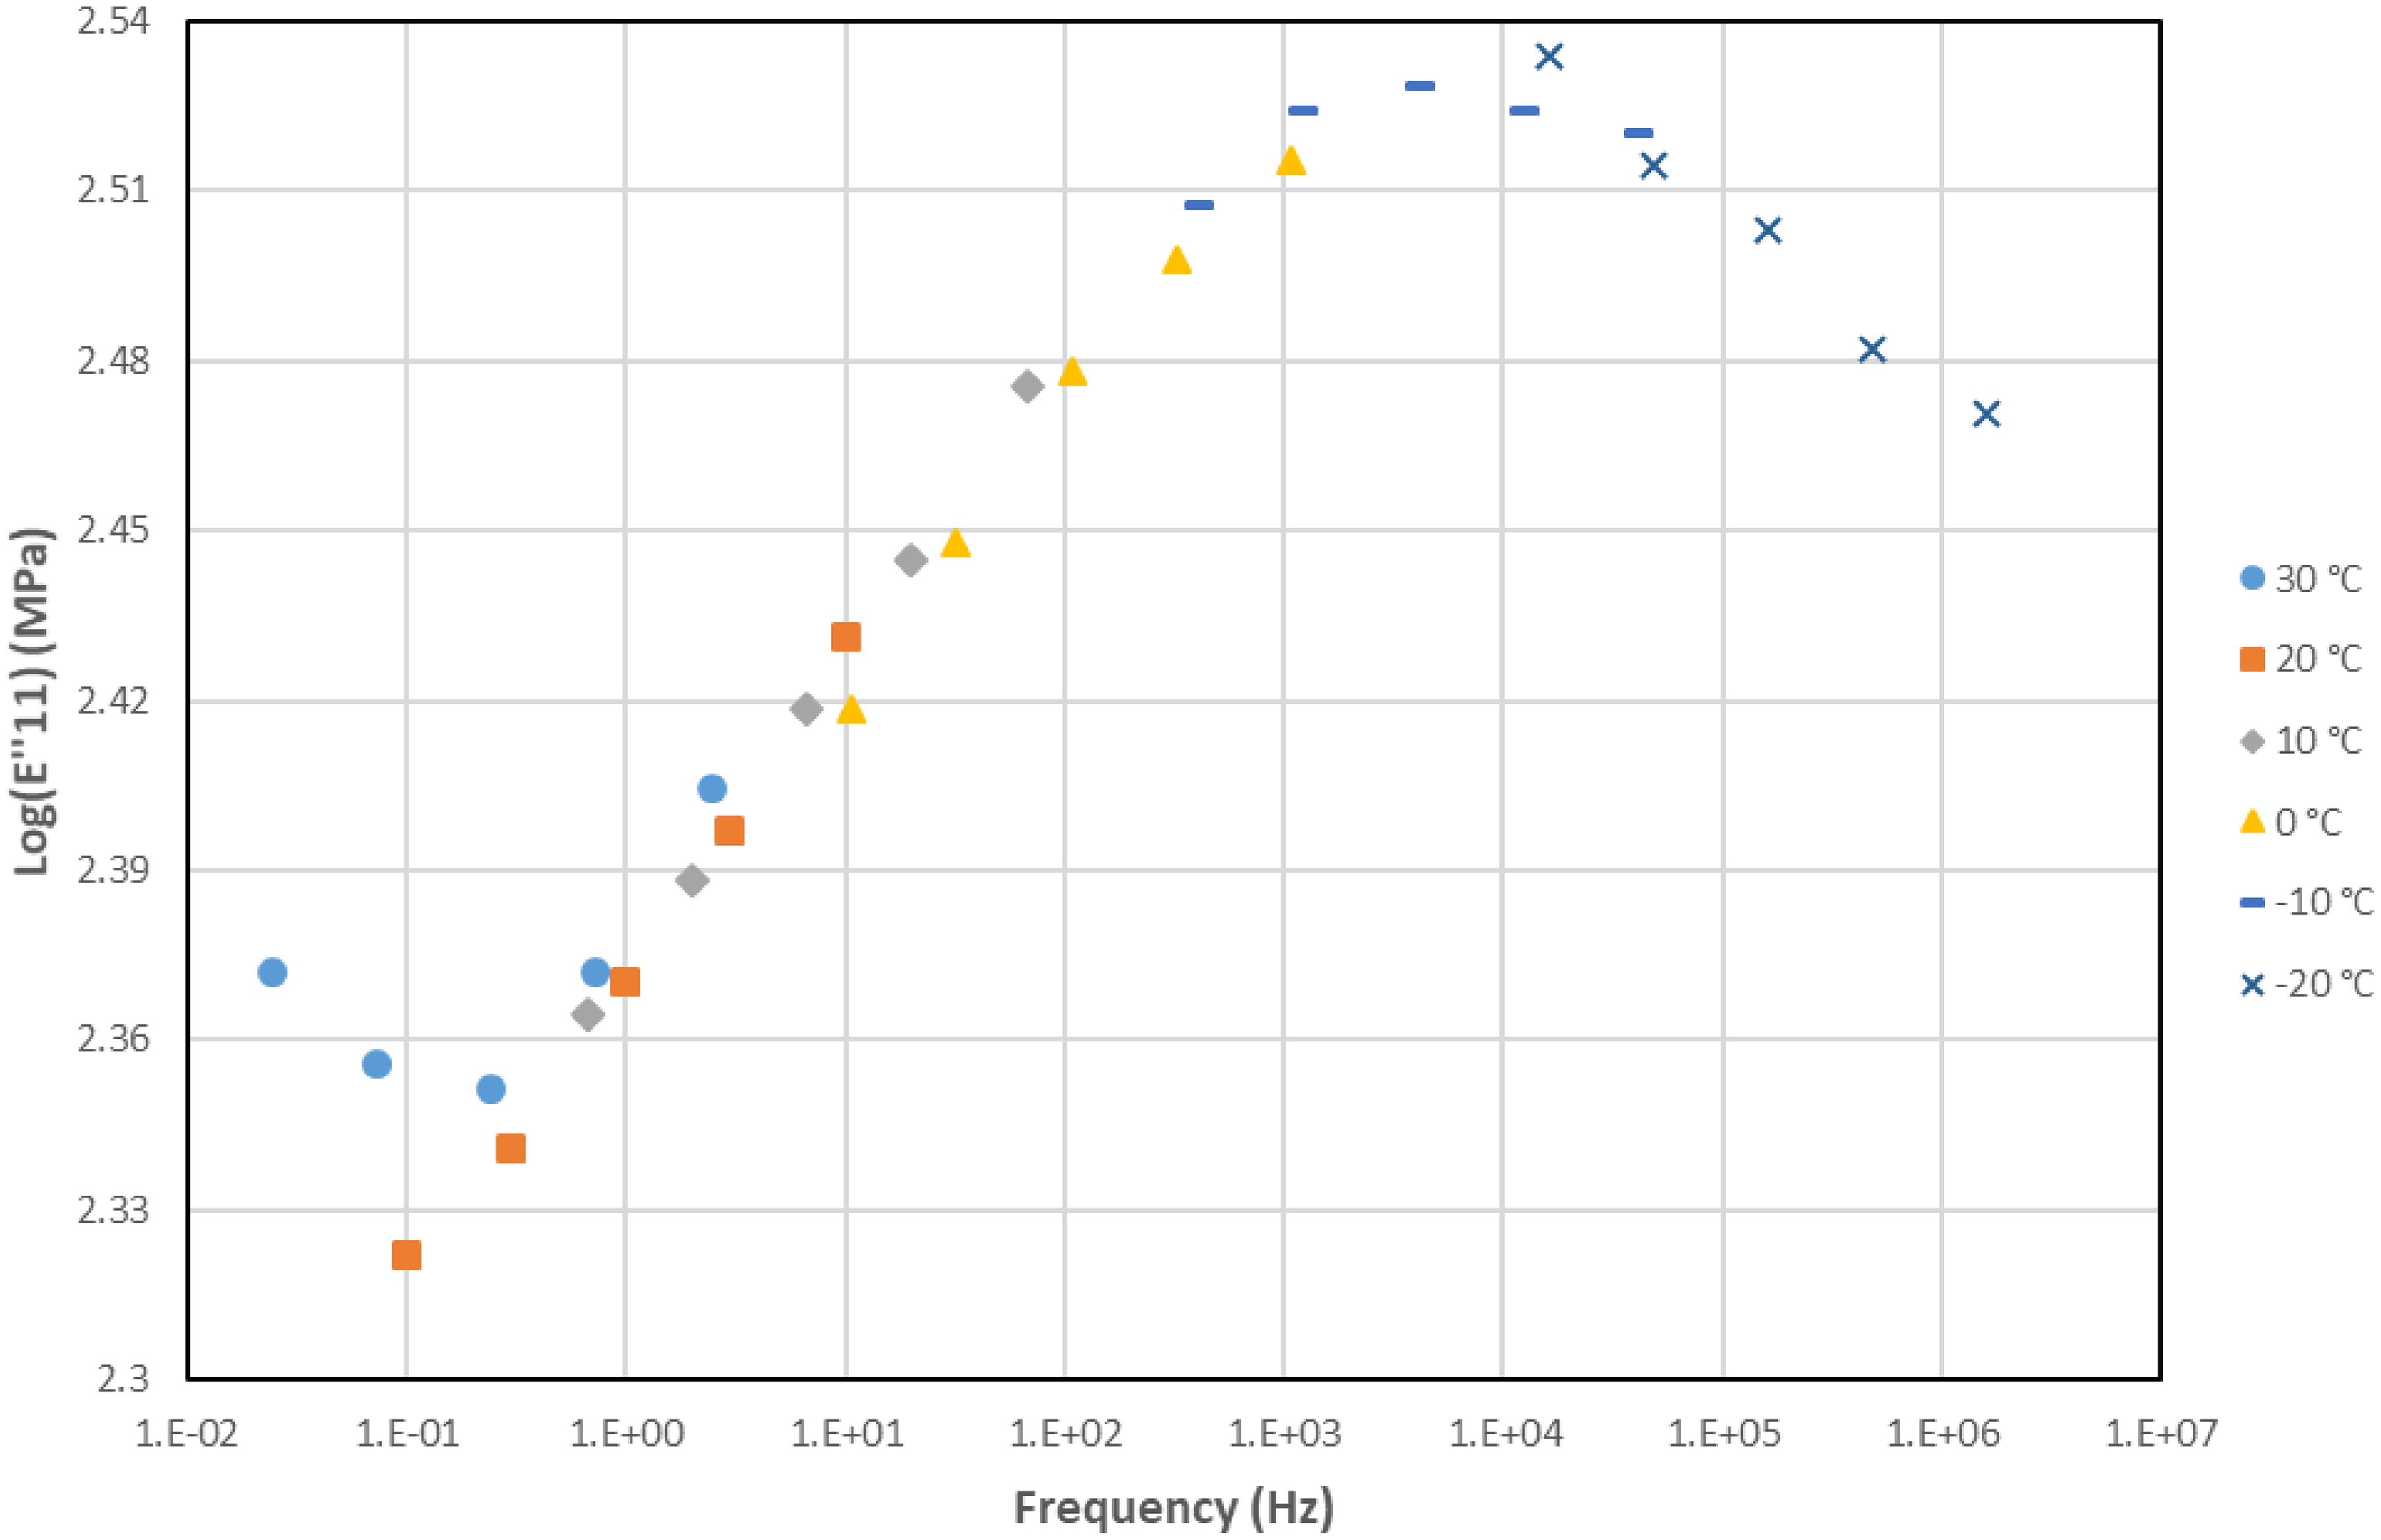
The results of the isothermal DMA tests with frequency sweep are shown in the diagrams of Figures 11 to 13 for E11’ and Figures 14 to 16 for E11’’. Performing the test with frequency-temperature sweep (Figures 11 and 14) made it possible to determine the master curve of the behavior of the material in frequency (Figures 12 and 15), over a range from 10−4 to 1011 Hz, where the frequency used in welding (2*105 Hz) is included. Finally, Figures 13 and 16 represent the temperature-frequency shift factor used for the construction of the master curve starting from the frequency-temperature sweep. The coefficients C1 and C2 in the figures refer to the Williams-Landel-Ferry equation: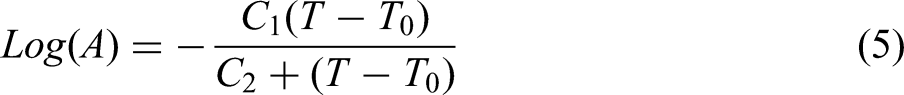
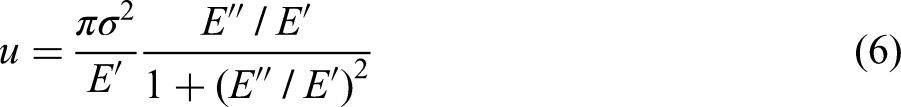
Storage modulus E11’ as a function of the frequency at different temperatures.
Master curve at the reference temperature of 20°C of storage modulus E11’.
Storage modulus shift factor.
Loss modulus E11” as a function of the frequency at different temperatures.
Master curve at the reference temperature of 20°C of storage modulus E11”.
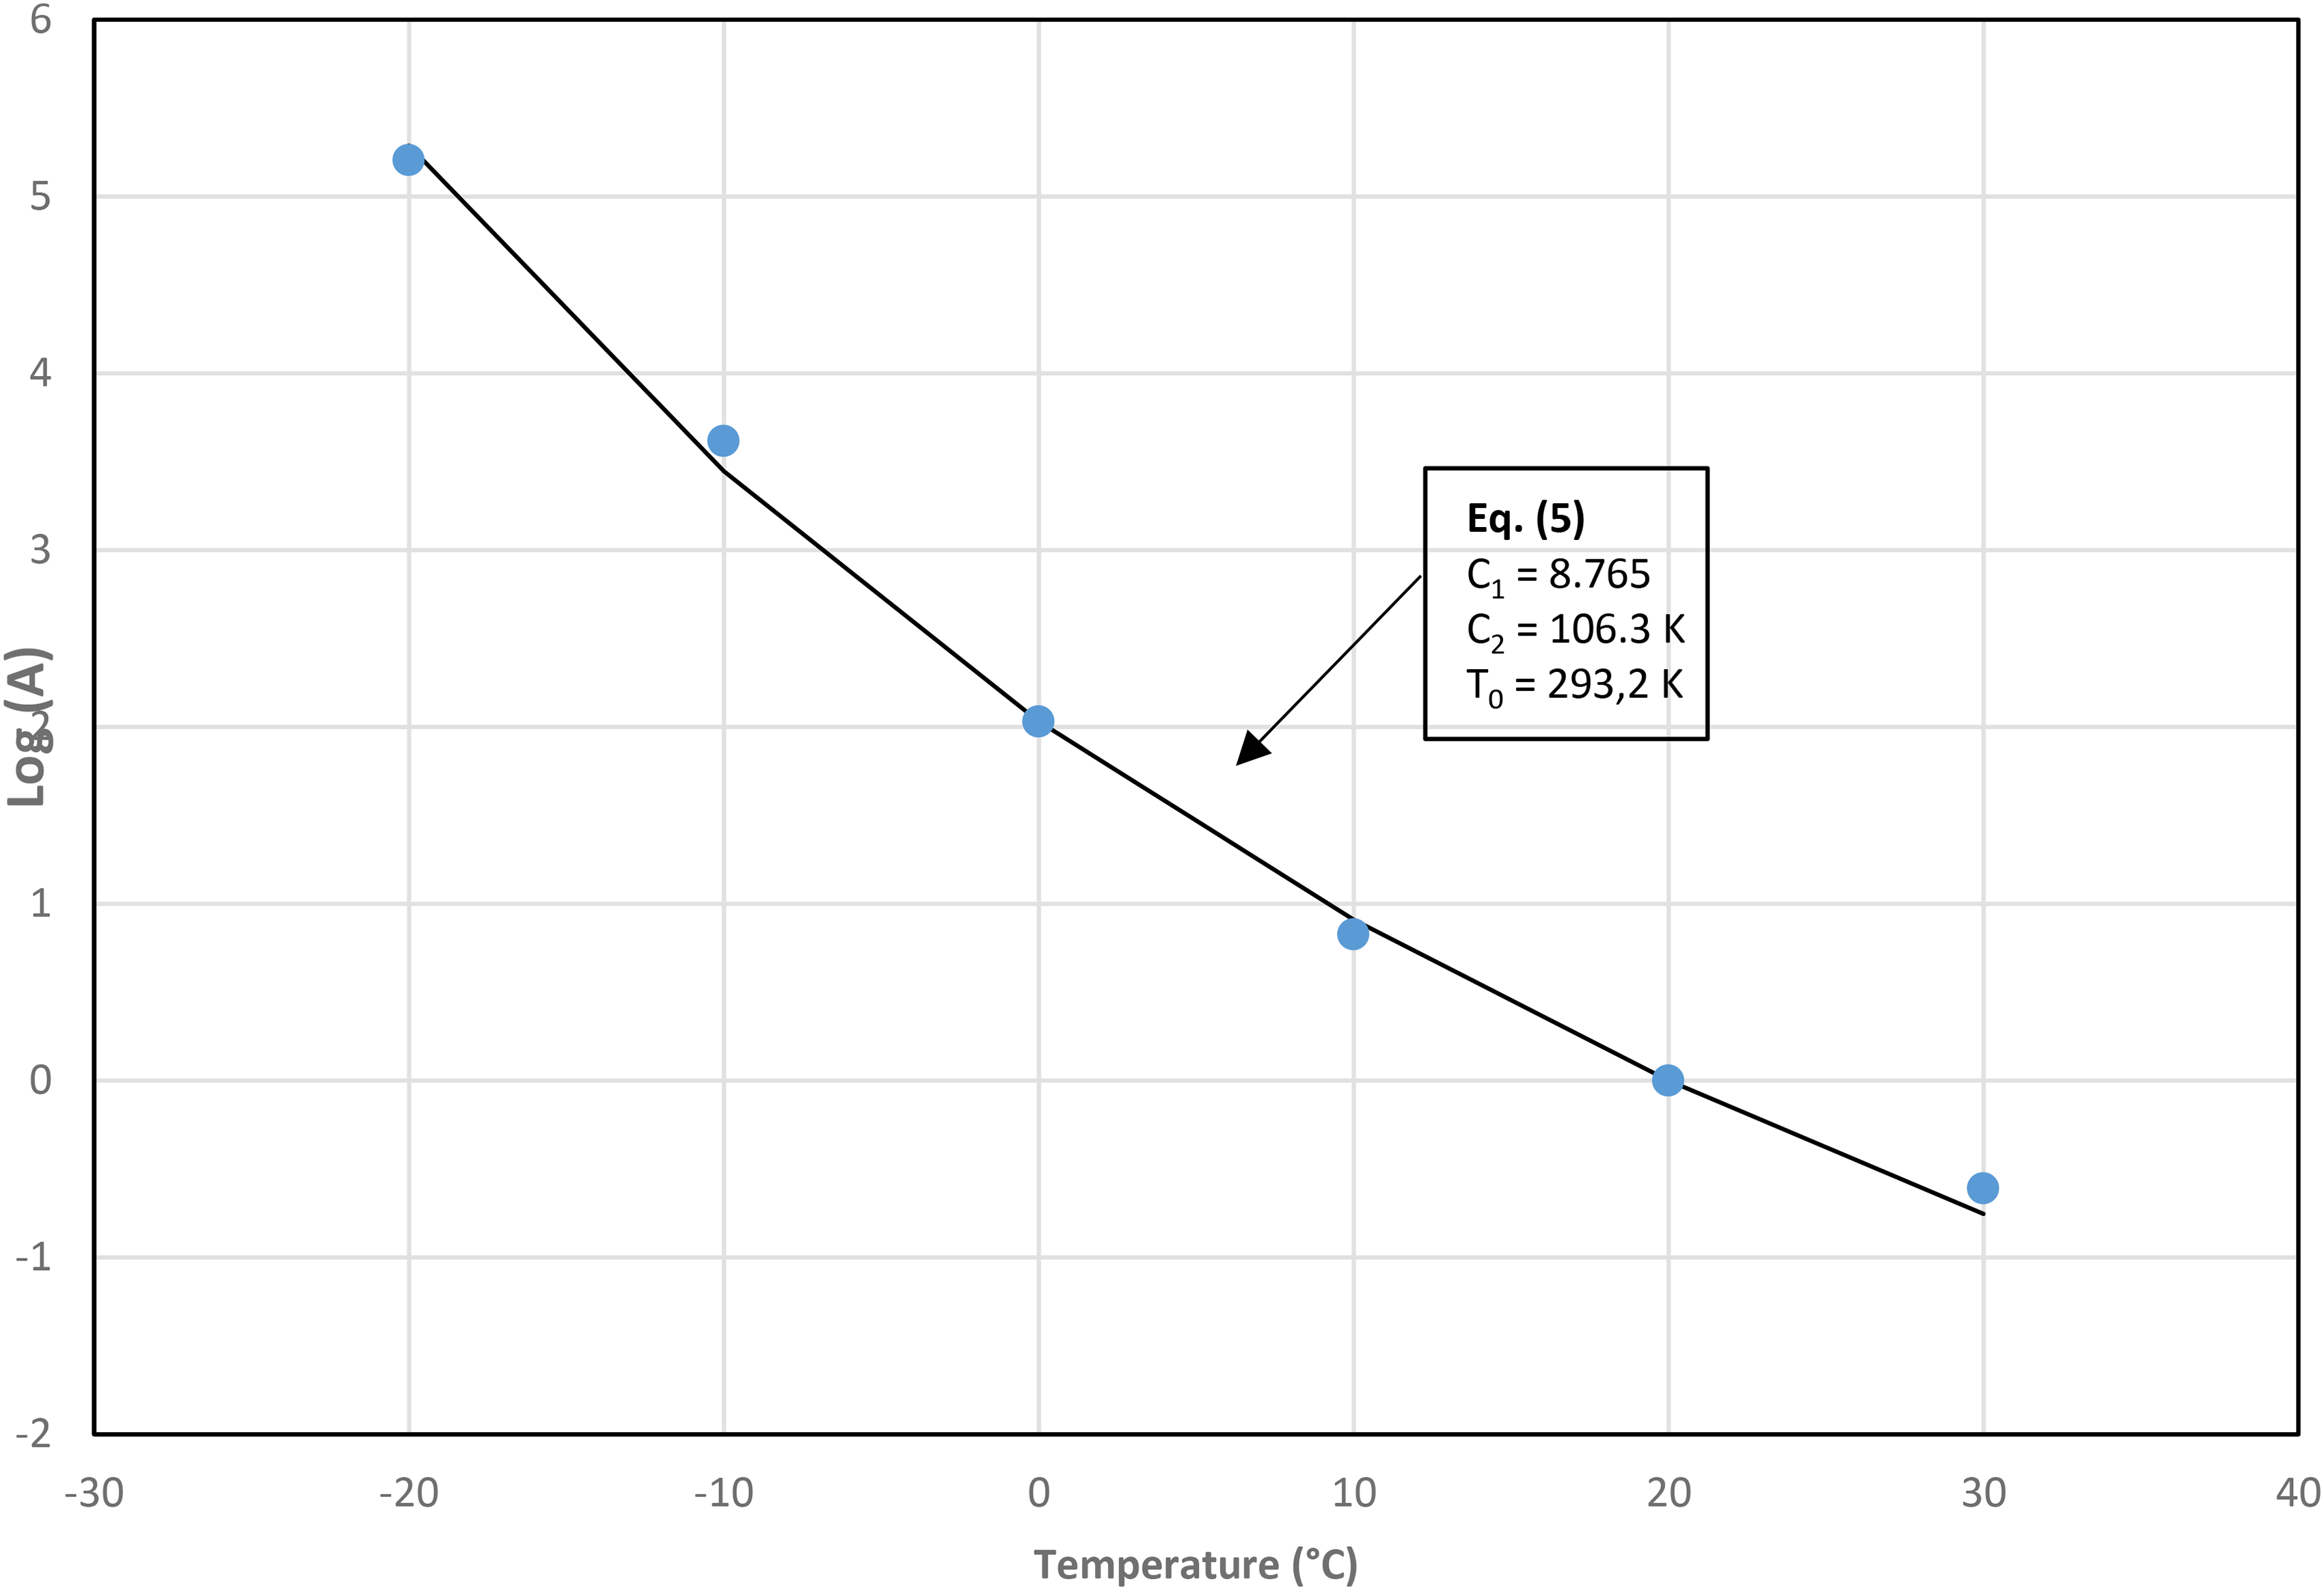
Loss modulus shift factor.
USW joints without ED
Tensile test
The results are illustrated in Figure 17. Despite the high scatter of data in the sets 1A to 3A in Table 3, no sample was found to be an outlier according to the Chauvenet criterion. Moreover, the small number of tests, due to the limited material available, does not allow to draw a statistically significant difference between the various sets. However, a trend clearly emerges whereby, by increasing the WE with the same WF, passing from the first to the fourth series there was a clear improvement in repeatability, characterized by the reduction of the variation coefficient (standard deviation/average ratio) and an increase of the average value. The two tests carried out in the 6A series, having WF greater than the previous ones, also provided strength values close to each other and higher on average than the other sets. The best condition, relative to the tested sample, would therefore seem to be characterized by the highest values of WF and WE among those tested (set 6A).
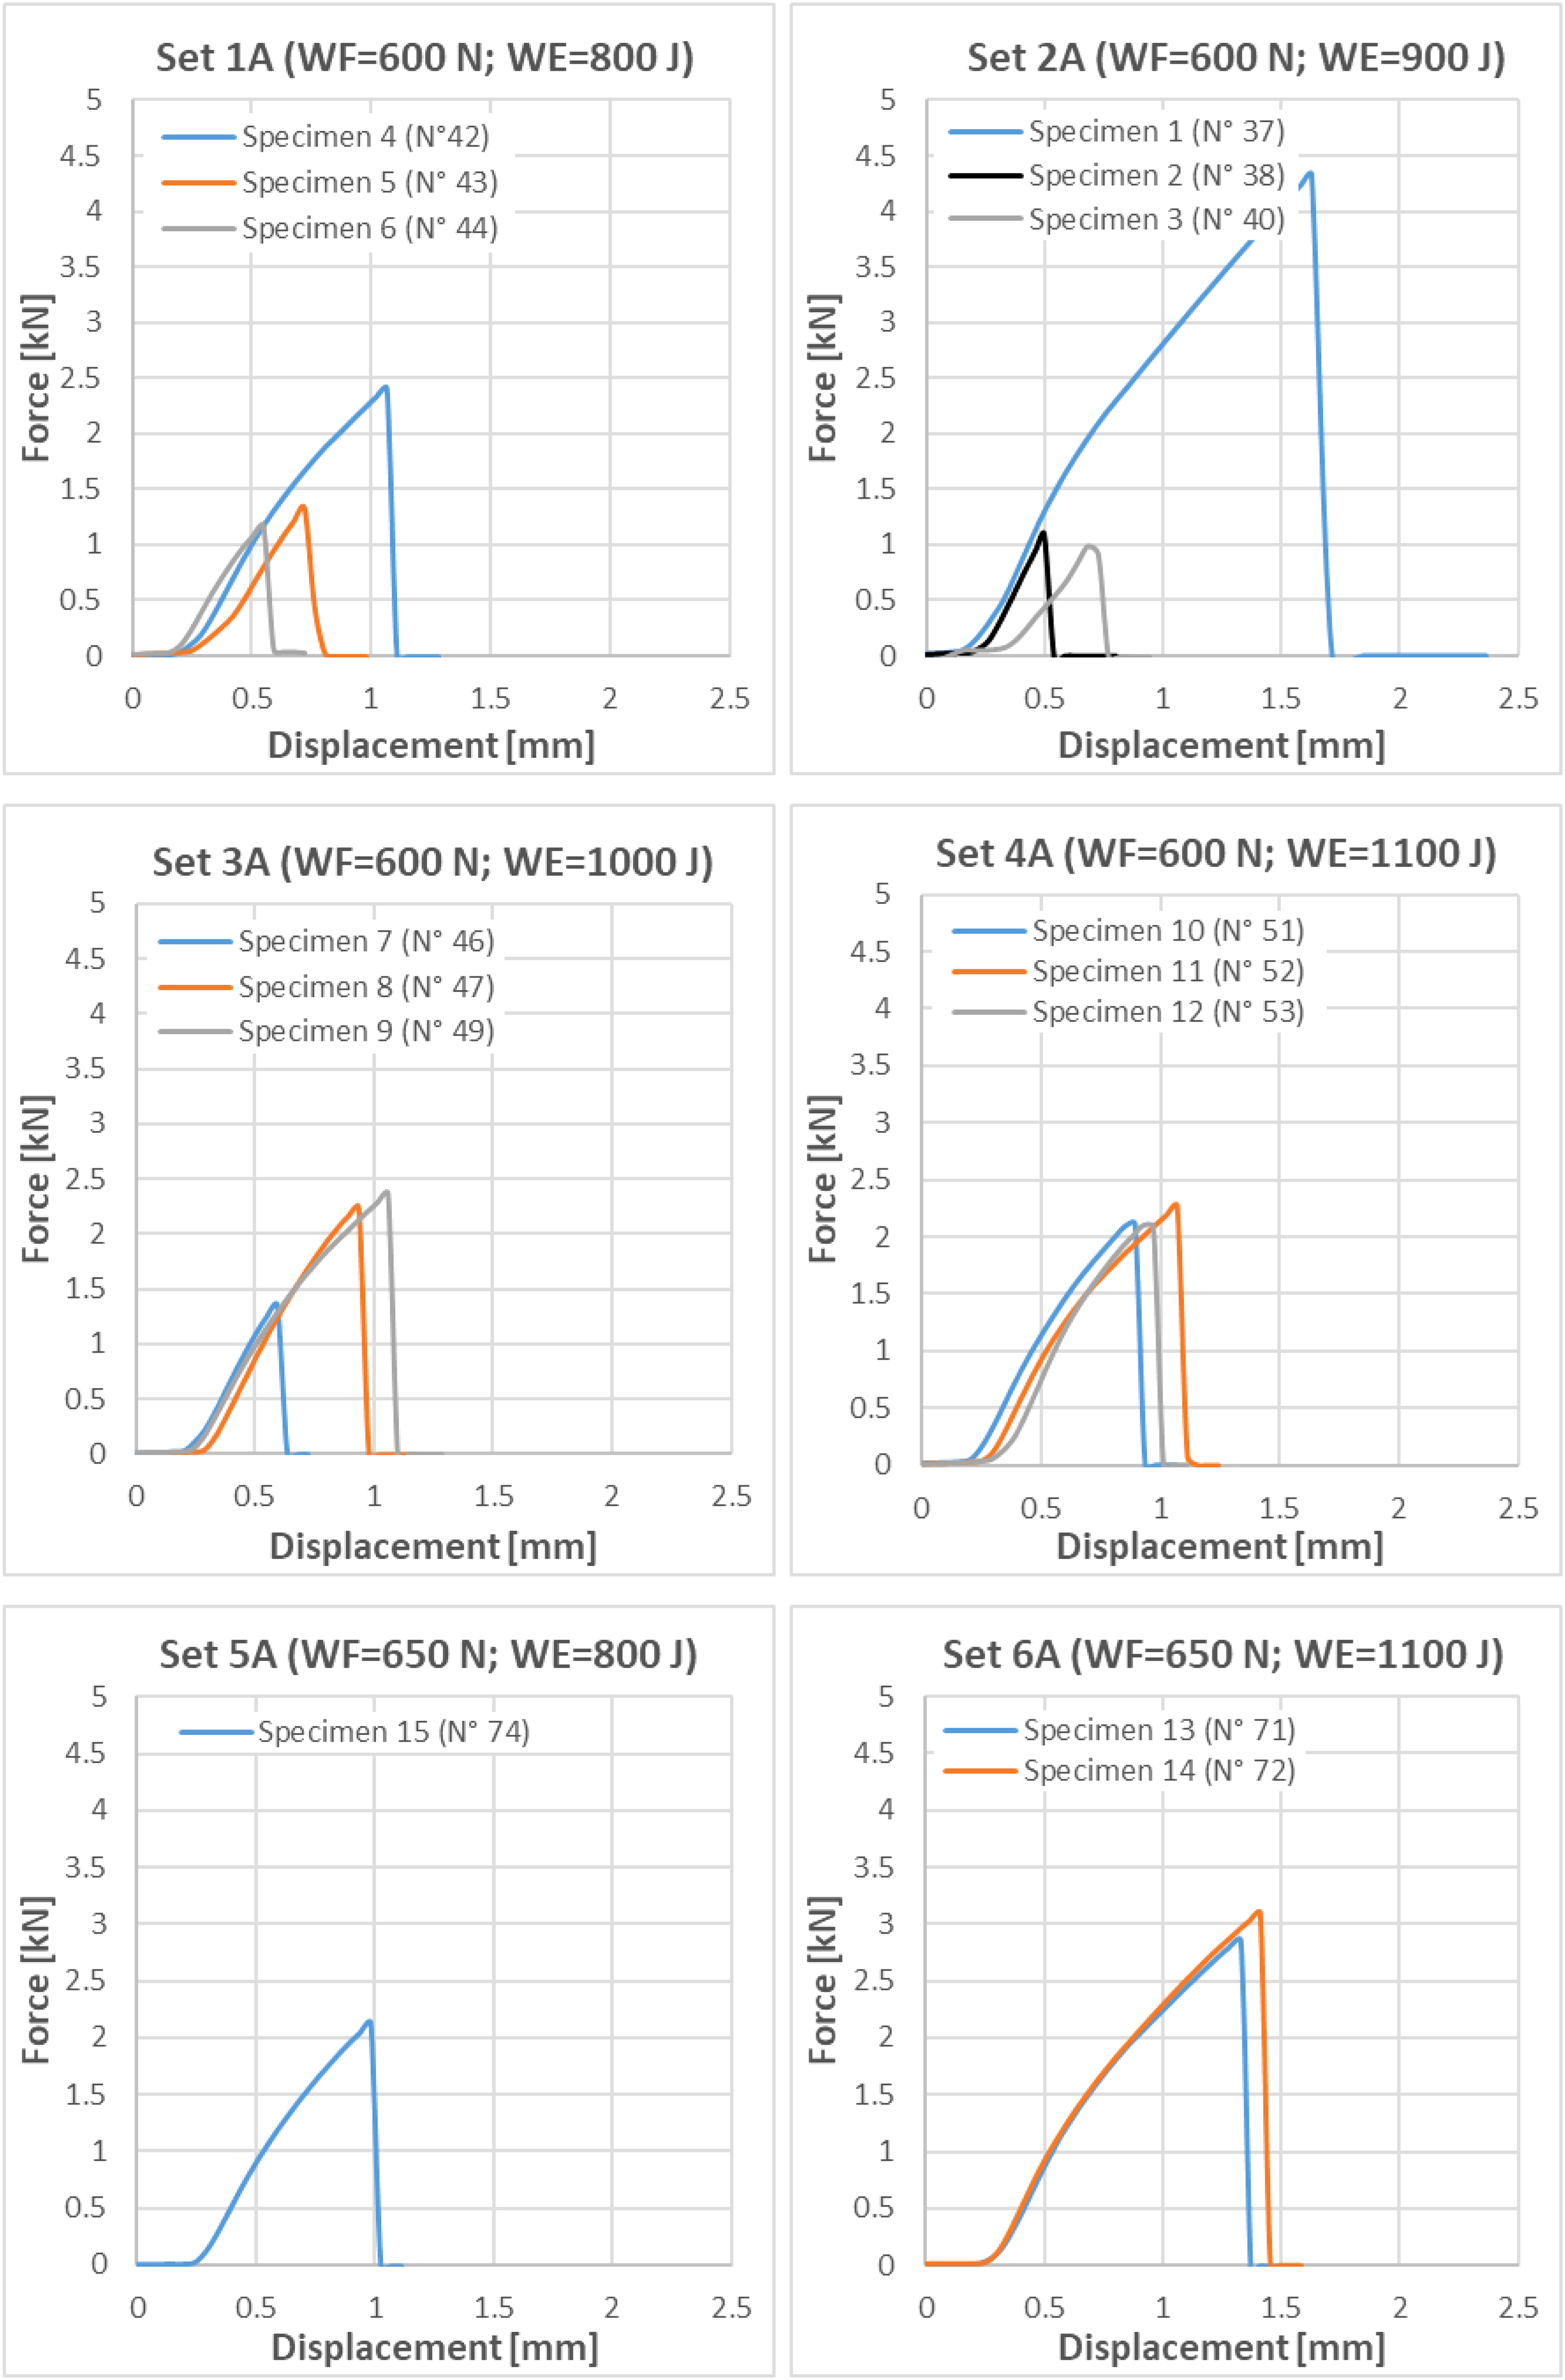
Force-displacement diagrams of the joints without energy director. WE: weld energy; WF: weld force.
Table 6 reports the maximum force values as a function of WF and WE, together with its mean and standard deviation. Also reported is the average shear stress at break, τR, corresponding to the ratio between the maximum force and the nominal surface of the weld, that is, the footprint of the sonotrode (15 × 25 = 375 mm2). It can be noted that, on the tests of the first three sets, the variation coefficient is unrealistically high, a sign that the process is not properly tuned, hence repeatable, while remembering that the small number of tests results in a low statistical reliability of the data. In any case, the τR assumes values that can be considered interesting with respect to the type of material in the case of set 6A.
Summary of results of tensile test of sets A (without energy director).
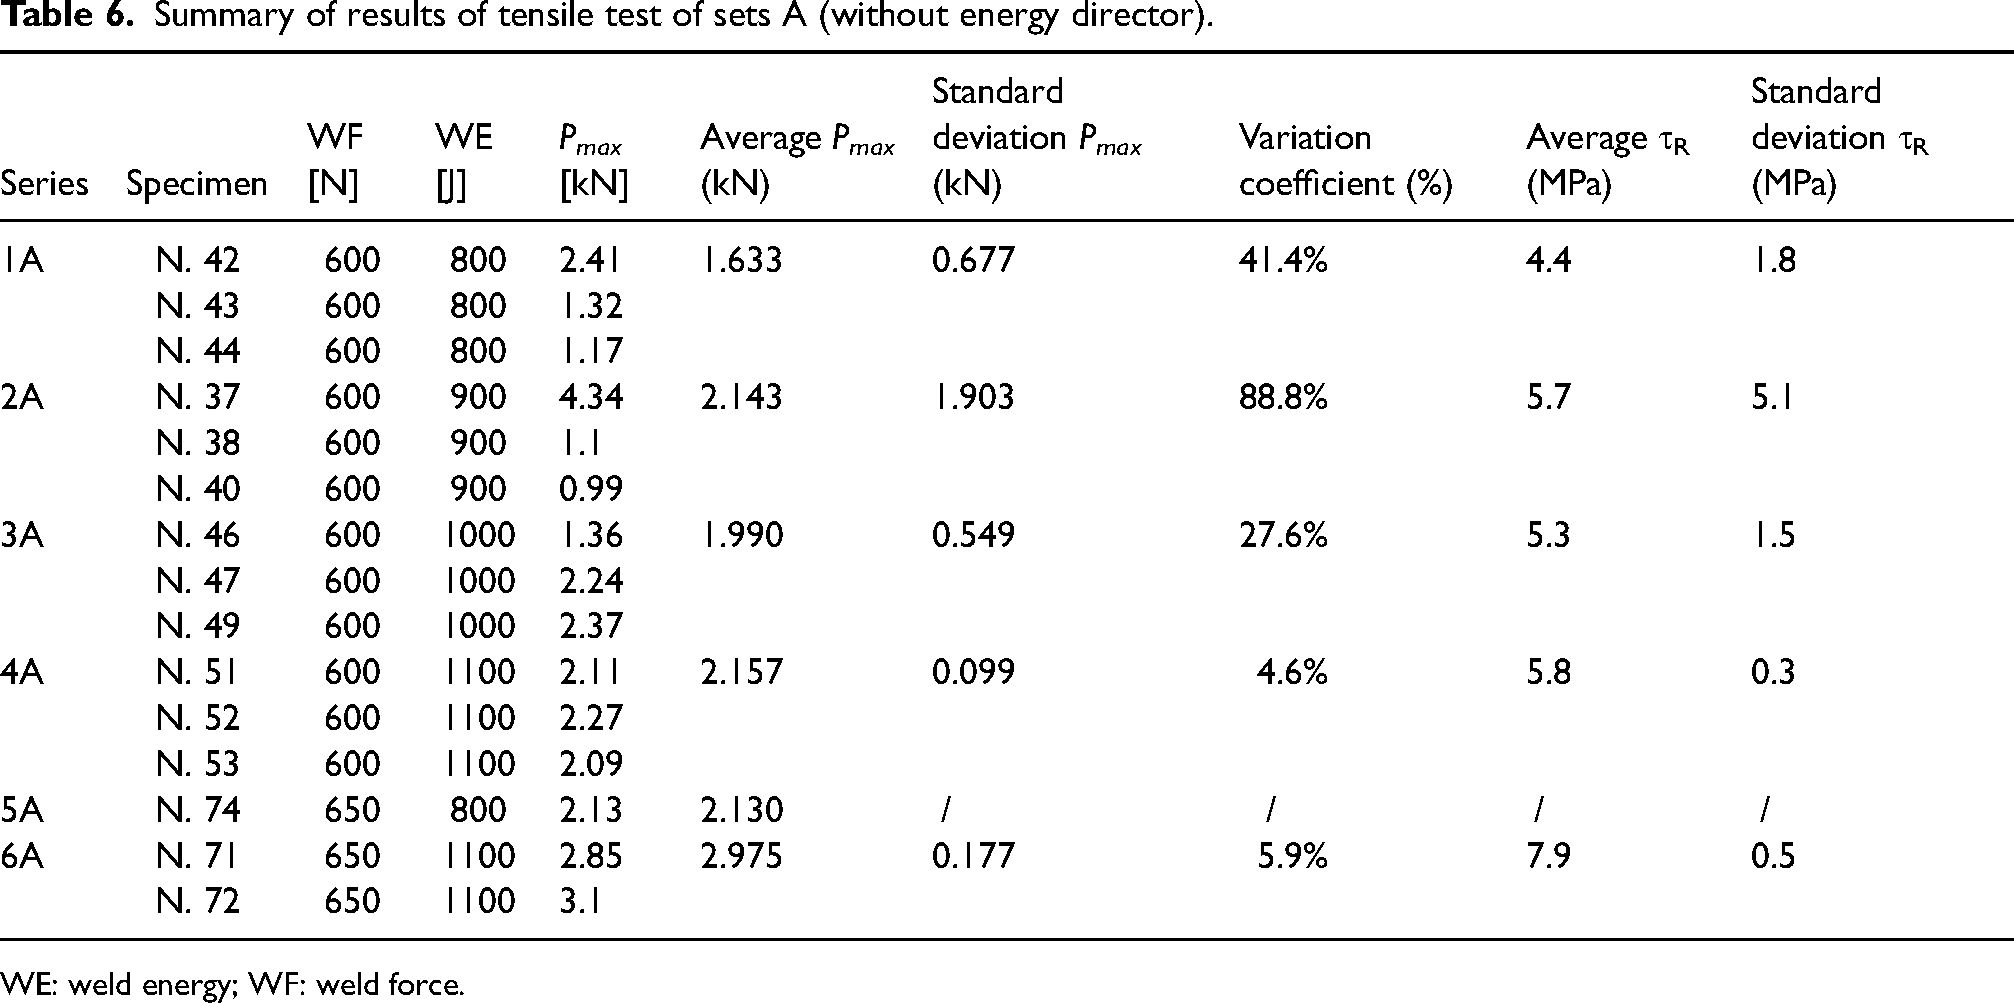
WE: weld energy; WF: weld force.
The experimental data were approximated with a response surface represented by the equation: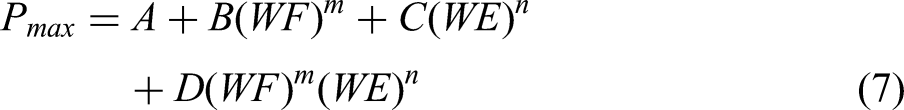
Response surface of the experimental data in Table 6.
Micrographic analysis
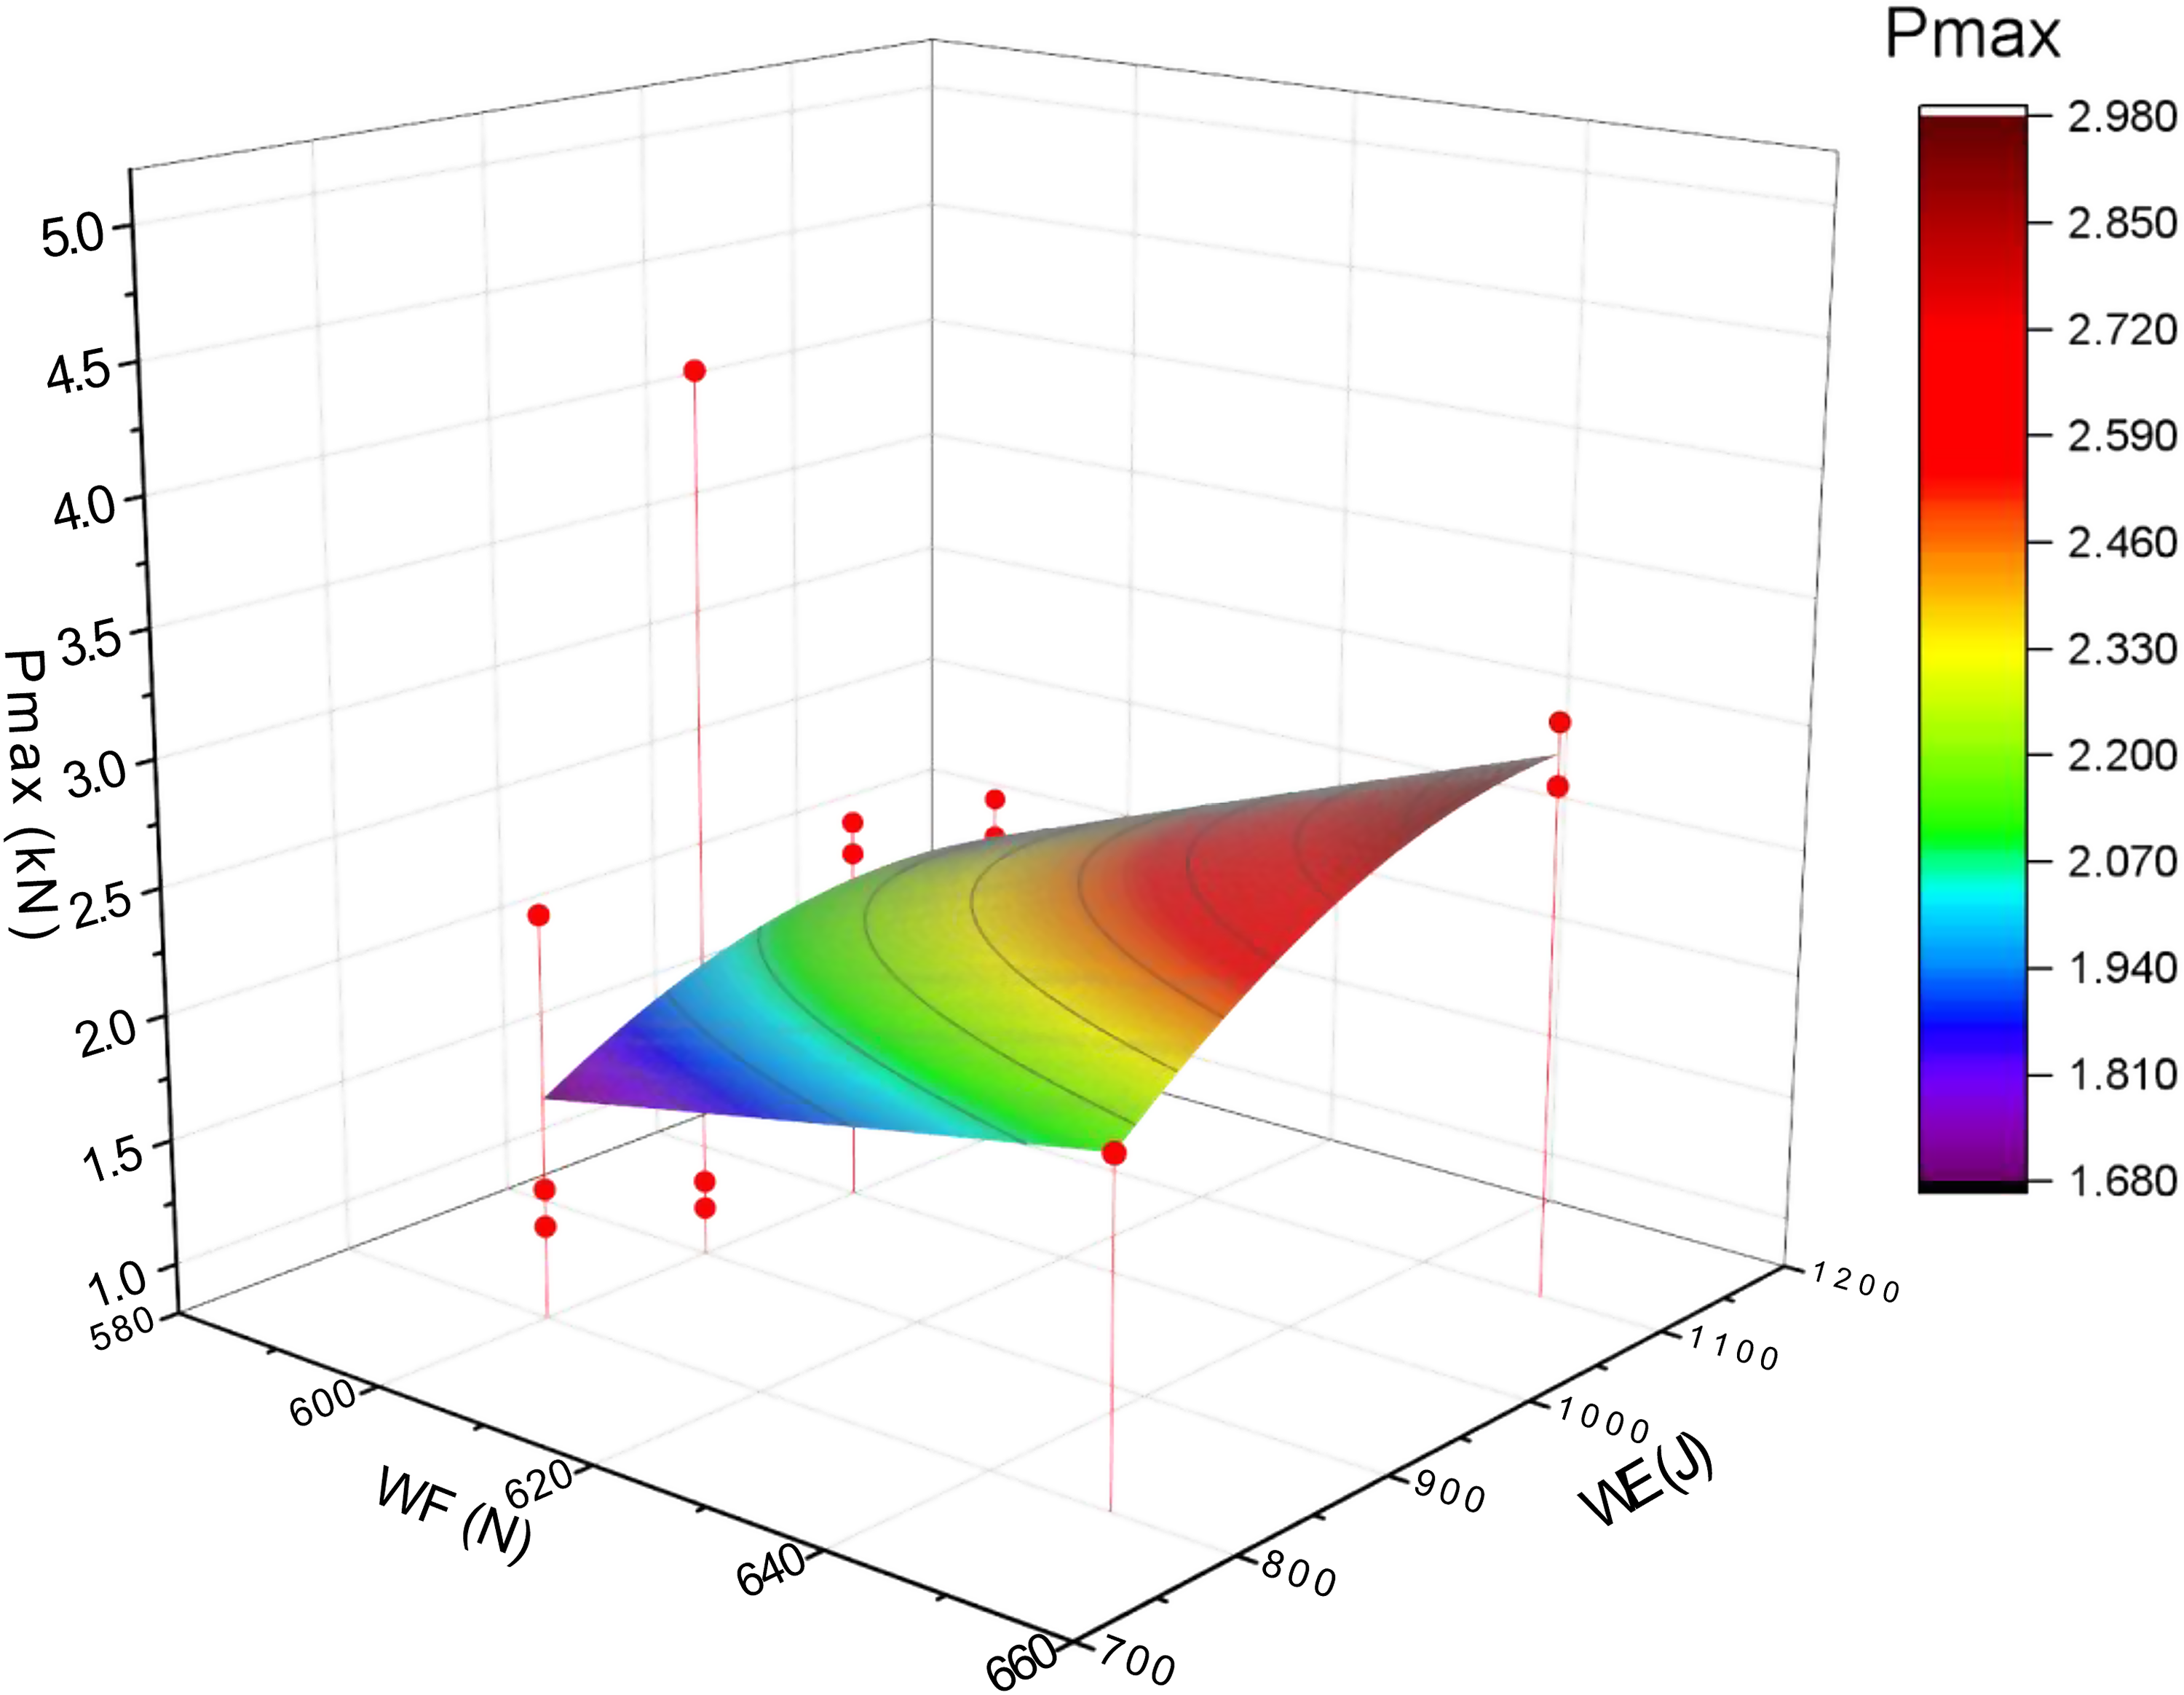
The micrographic analysis is shown in Figure 19. It is interesting to note that in the 1A to 4A series there are no dark areas attributable to a carbonization of the resin due to local overheating. At the lowest values of WF and WE it is likely that the adhesion between the parts is only partially achieved, generating a higher dispersion of the mechanical strength results and a lower average value compared to sets 5A and 6A. It should be noted that both have an area in which the resin becomes dark in color and there is the presence of bubbles, which most likely indicate a carbonization of the resin itself and the corresponding release of gas; the zone is wider in set 6A, in line with the greater WE compared to set 4A with the same WF. However, it is also true that the tests performed on these sets did not give poor results despite the carbonized areas, on the contrary the resistance appears on average equal to or better than the sets with lower WF. Evidently, the degradation of the matrix is compensated by a more intimate bond between the parts and a greater joint area. However, both for the esthetic result and for the uncertainty related to the degradation of the polymer, it would be necessary to further refine the investigation in terms of the level of WF and WE to ensure that the result is repeatable and the degradation of the matrix is contained. The result was certainly affected by the absence of EDs, in the form of cusps of polymeric material made during the production of the sheet or nonreinforced PC wires interposed between the parts in order to facilitate the initiation of the weld.
Micrographic analysis Sets 1A–6A.
USW joints with ED
Tensile test
The force-displacement diagrams of all the type B sets are shown in Figure 20. The first observation that is qualitatively inferred is the lower dispersion of the maximum force data compared to the type A sets (without ED), quantitatively testified by the absence of outliers according to the Chauvenet criterion.
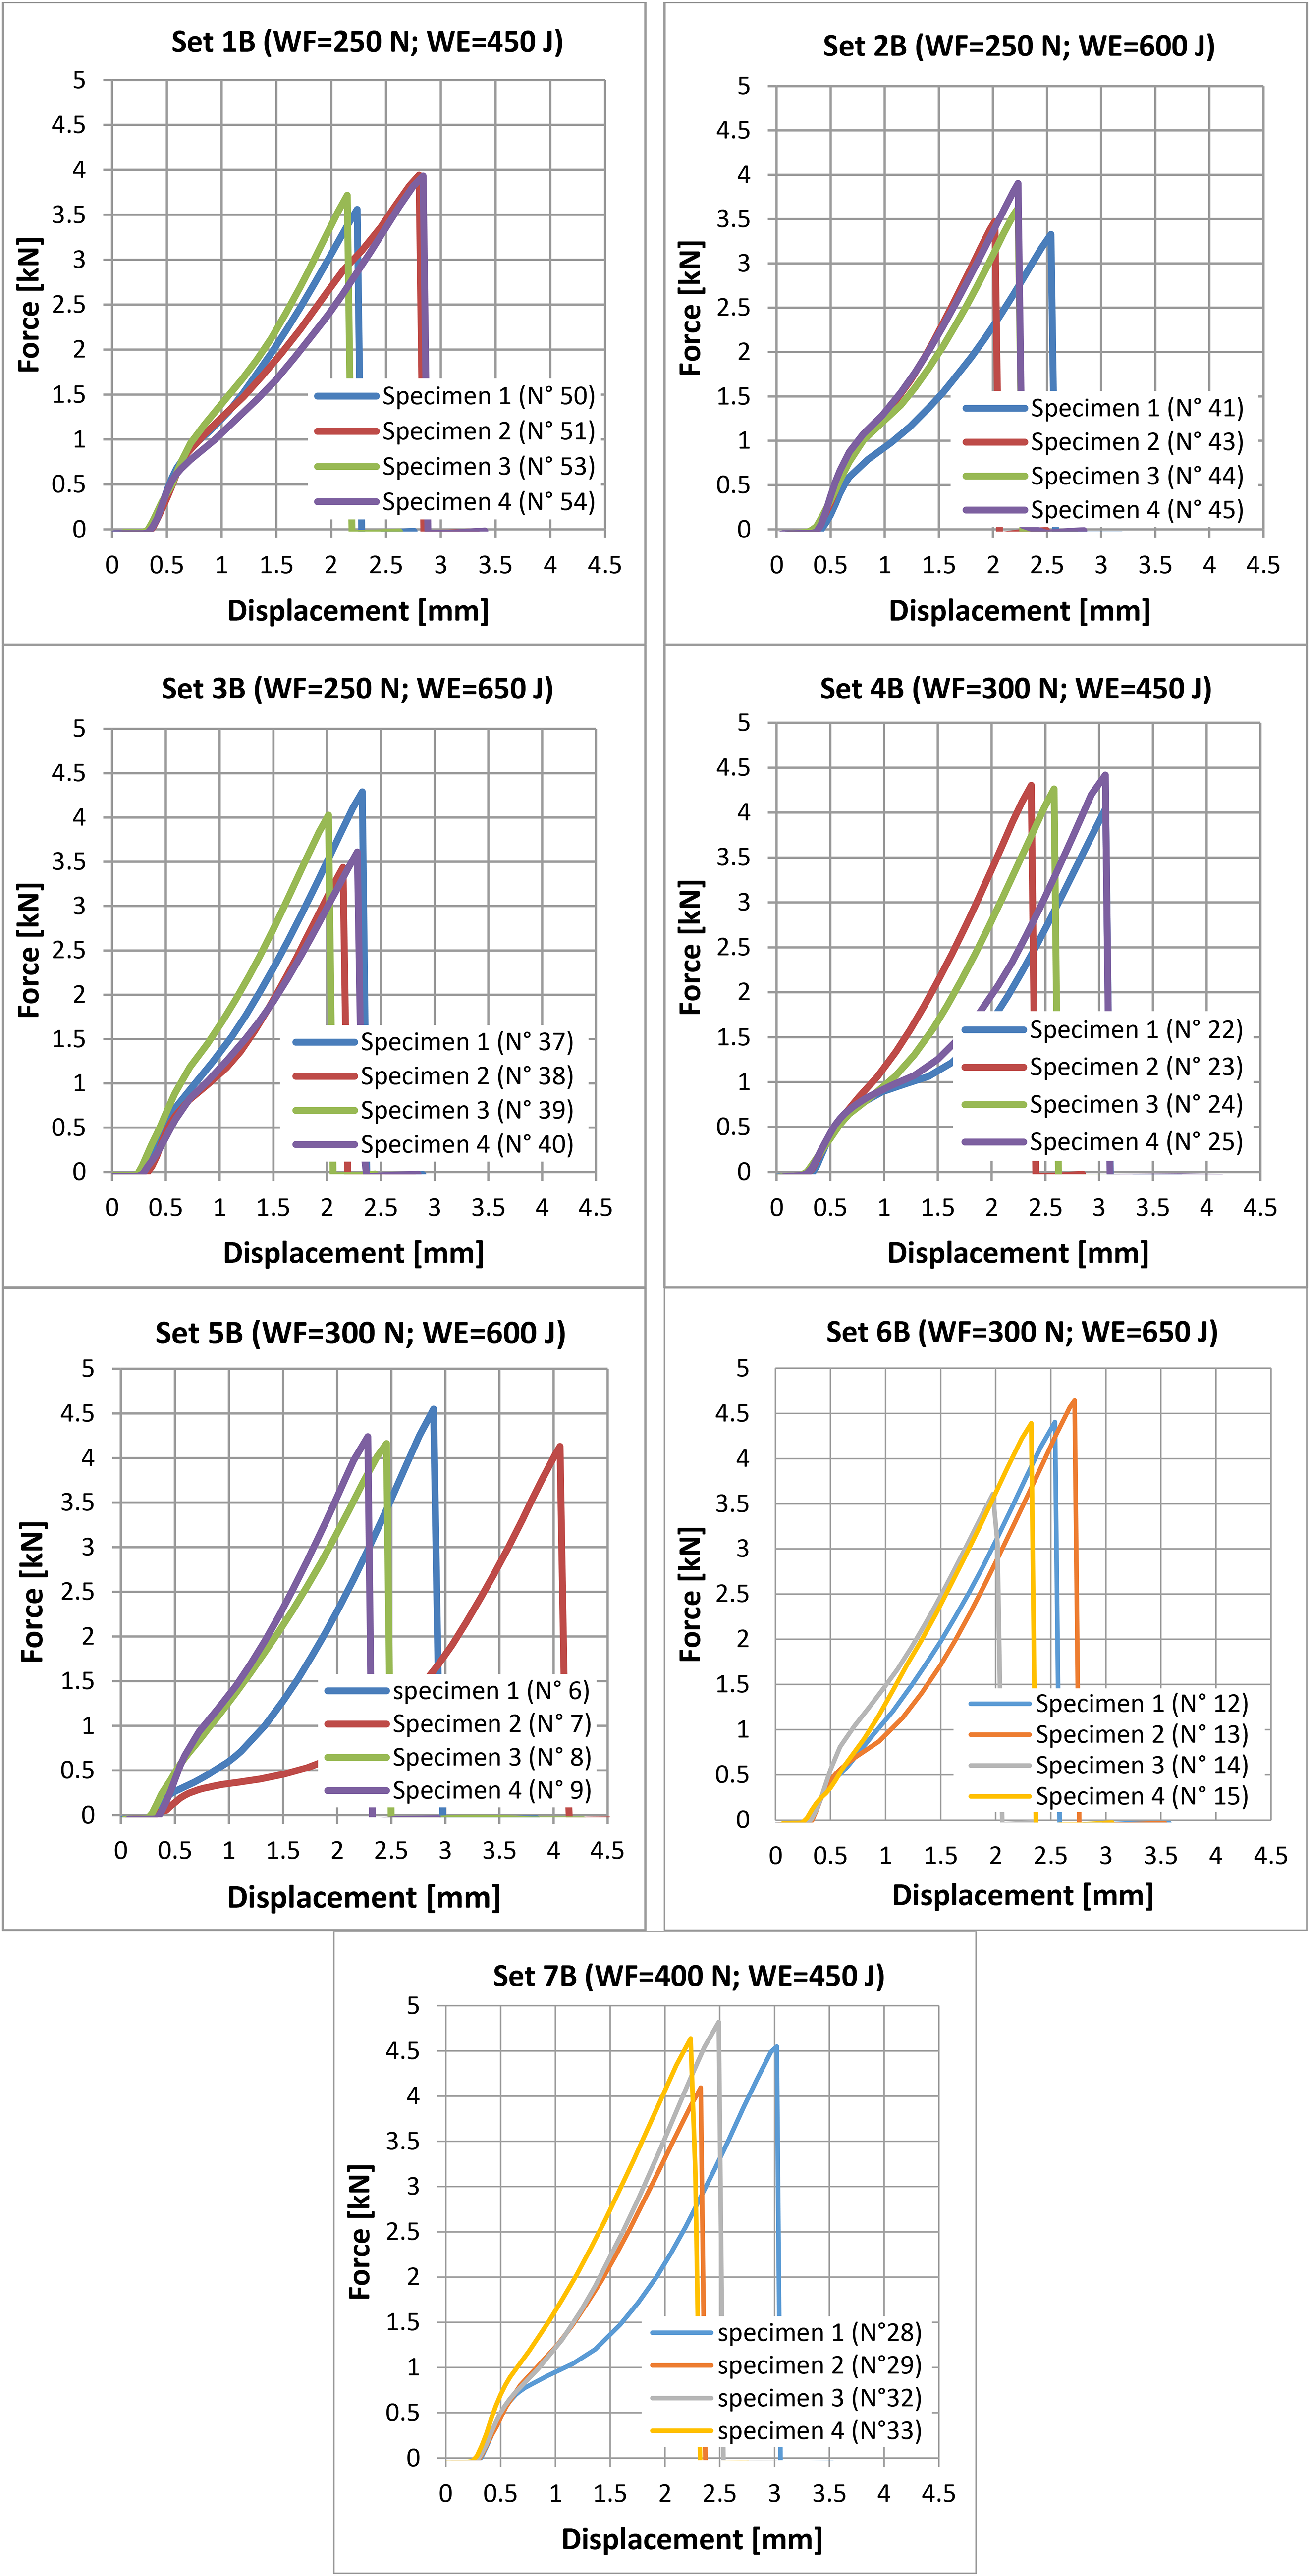
Force-displacement diagrams of the joints with energy director. WE: weld energy; WF: weld force.
The maximum force values are also generally higher than those of the A sets, indicating that the presence of the PC wire as an ED, although not optimal as a solution, allows to create better adhesion and continuity between the two adherents compared to welding, obtained without help.
Compared to set A, in this case it is more difficult to understand a trend compared to WF and WE since, taking into account the dispersion of the data, the results appear rather overlapping. The test data are reported in Table 7, with the same fields of Table 6 for comparison. It is noted that in this case the variation coefficient is reasonably contained and comparable between the various sets, indicating that the process is substantially stable and repeatable. Going into more detail of the resistance values and relative standard deviation, the significantly better data are concentrated in sets 4B to 7B, with the latter being on average better, although not statistically distinguishable from the others. The sets 1B to 3B, carried out with the same WE range of the sets 4B to 7B but lower WF, return instead a lower resistance. Overall, WF of at least 300 N is required, while WE of 450 J yields already the same higher WE values.
Summary of results of tensile test of sets B (with energy director).
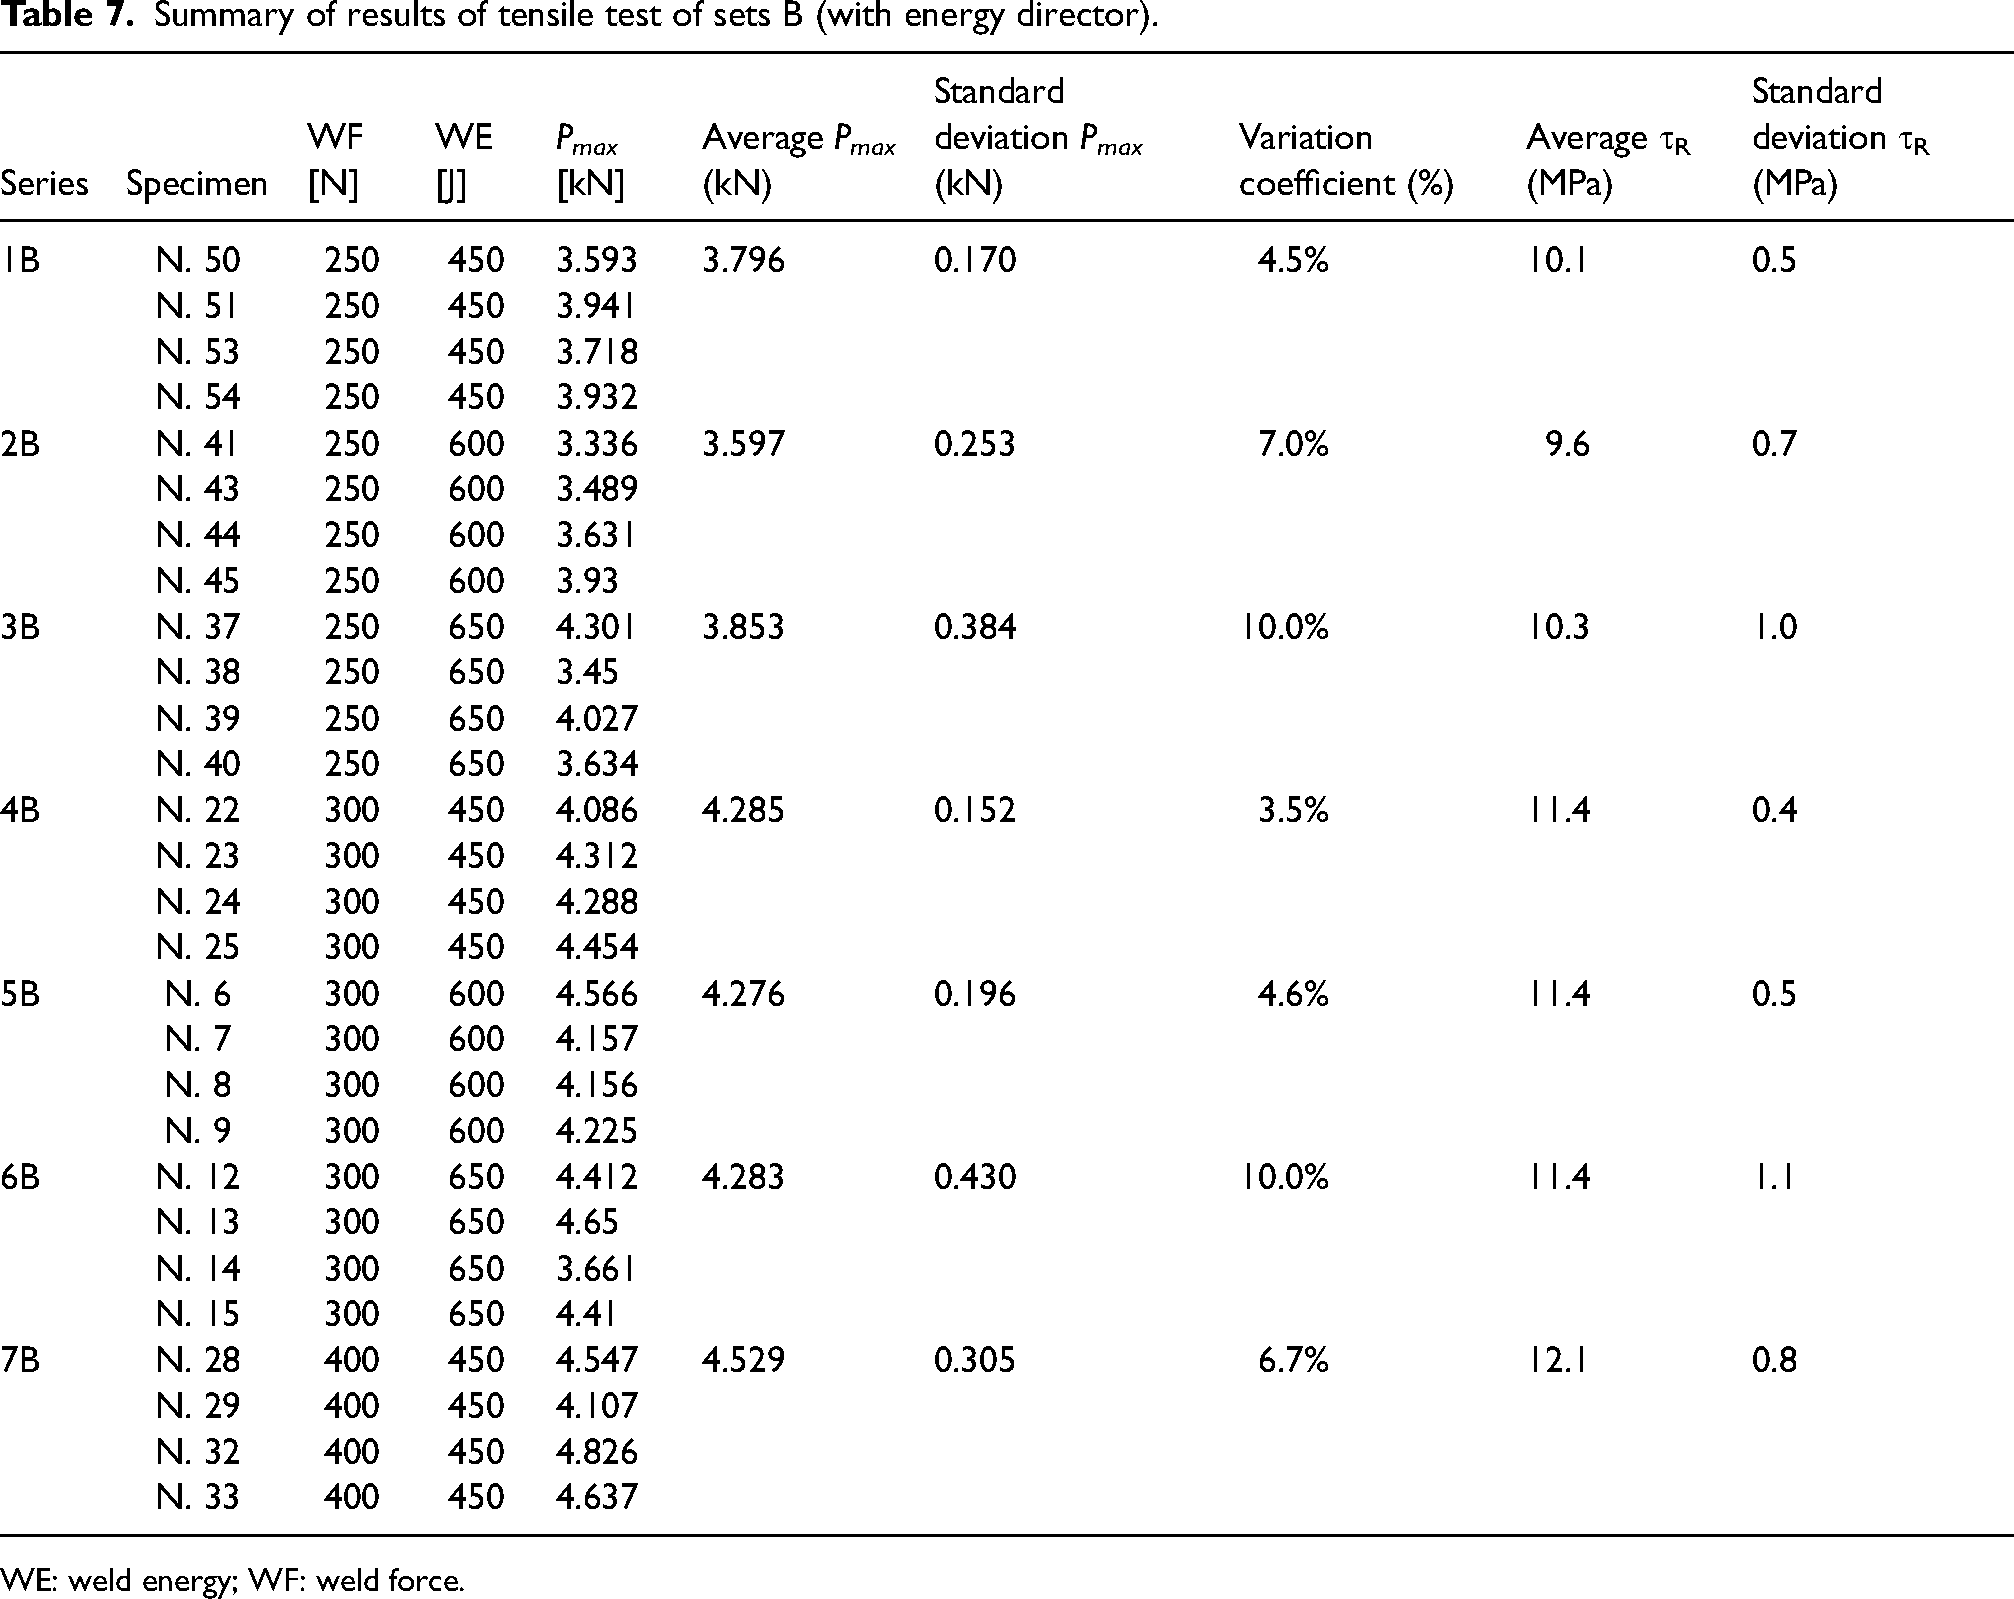
WE: weld energy; WF: weld force.
The results in Table 7 have been approximated, for comparison purposes, with the same equation (7) used in the case without ED (coefficients A–D are of course different from those of sets A). The result is shown in Figure 21, where a positive trend of Pmax with WF is evident, while the contribution of WE is less sensitive. Unfortunately, the absence of experimental data with high WF and WE (e.g. WF = 400 N and WE = 650 J) does not allow definitive conclusions to be drawn if the optimal value lies within the tested domain or can be located outside.
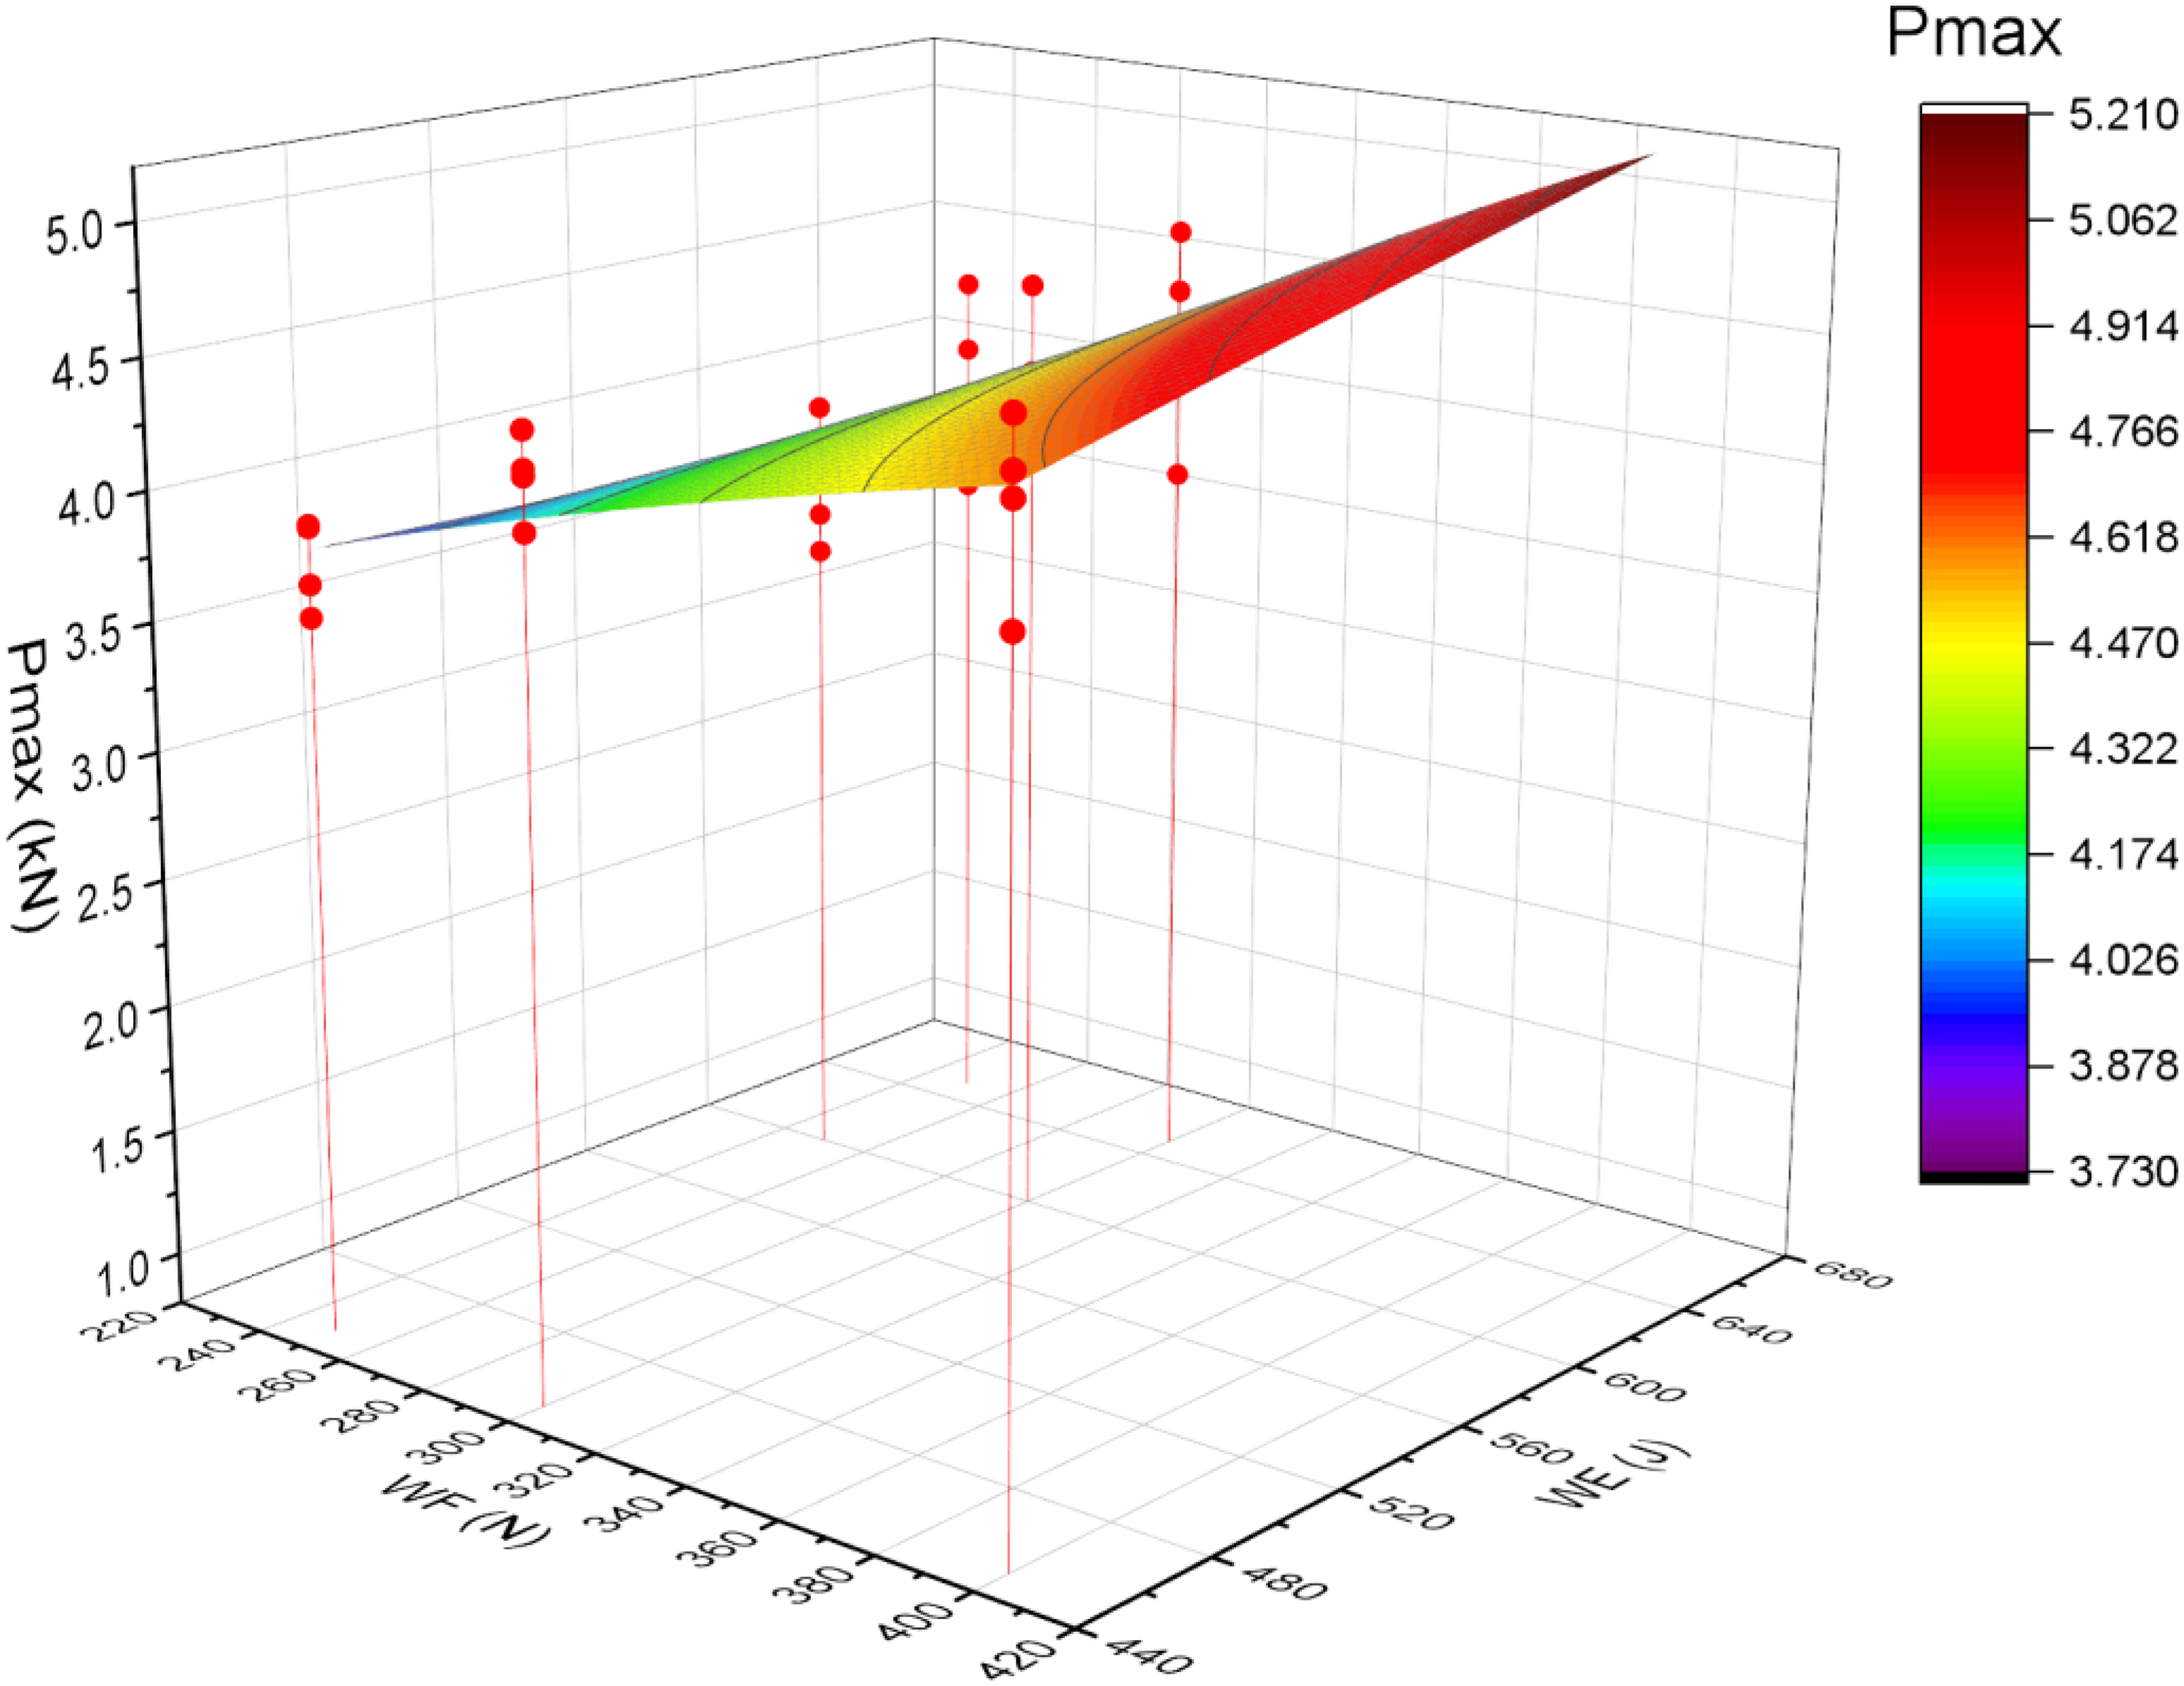
Response surface of the experimental data in Table 7.
Micrographic analysis
The micrographic analysis of the samples joined with the presence of EDs are shown in Figure 22.
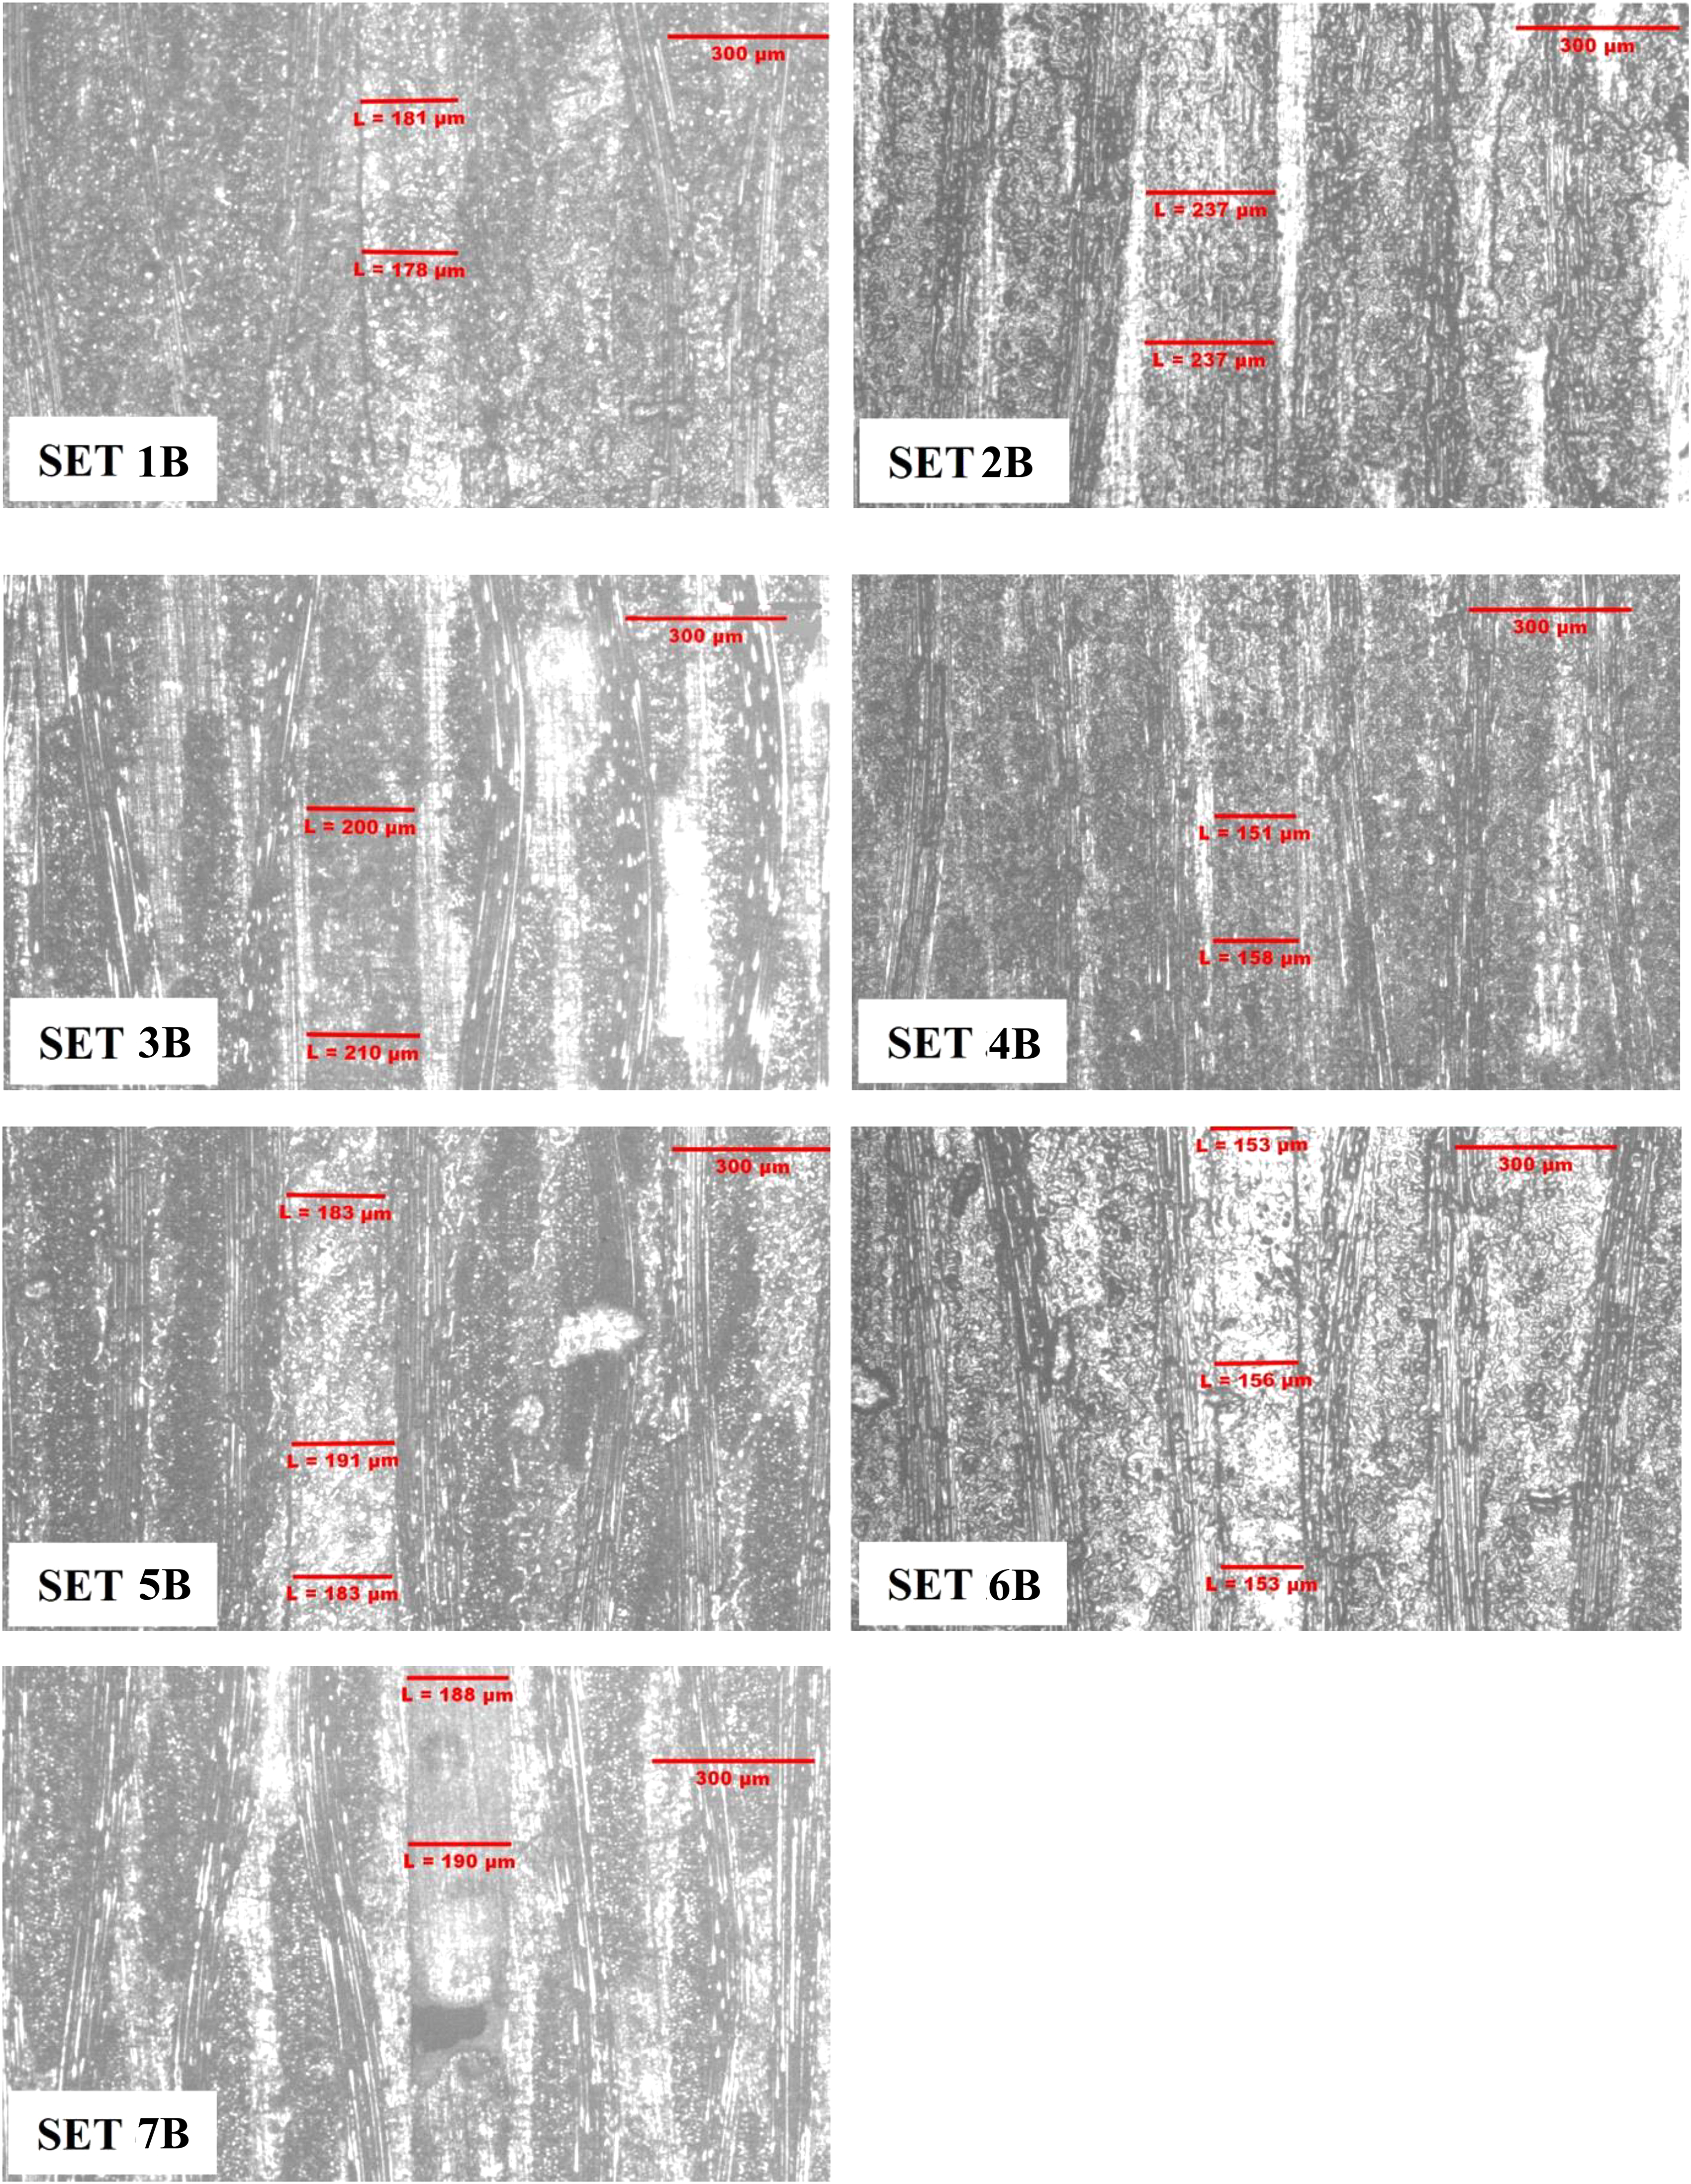
Weld line micrograph with indication of thickness.
Unlike joints without the ED, there are no dark areas due to carbonization of the PC, and the number of bubbles is overall very limited. The samples show fairly constant weld line thickness, with little vartiation between the sets (Table 8). No clear correlation between WF, WE and the bondline thickness can be safely inferred comparing the obtained data.
Weld line thickness of ED joints.
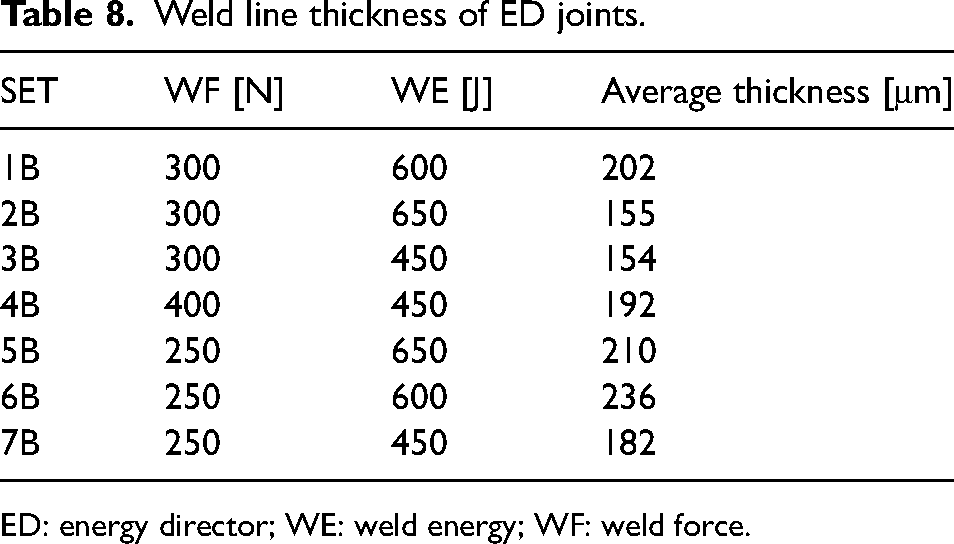
ED: energy director; WE: weld energy; WF: weld force.
Bonded joints
Tensile test
The force-displacement diagrams of all the sets are shown in Figure 23. The joints just degreased before bonding have an averge Pmax = 3.02 kN and standard deviation s = 0.94 kN; specimen 4 has been checked for being an outlier according to the Chauvenet criterion, and it has been retained. The joints degreased and treated with atmospheric plasma show, as expected, a bit higher averge Pmax = 3.42 kN and a lower standard deviation s = 0.53 kN, though the overlapping of the two sets is too high to discriminate them statistically.
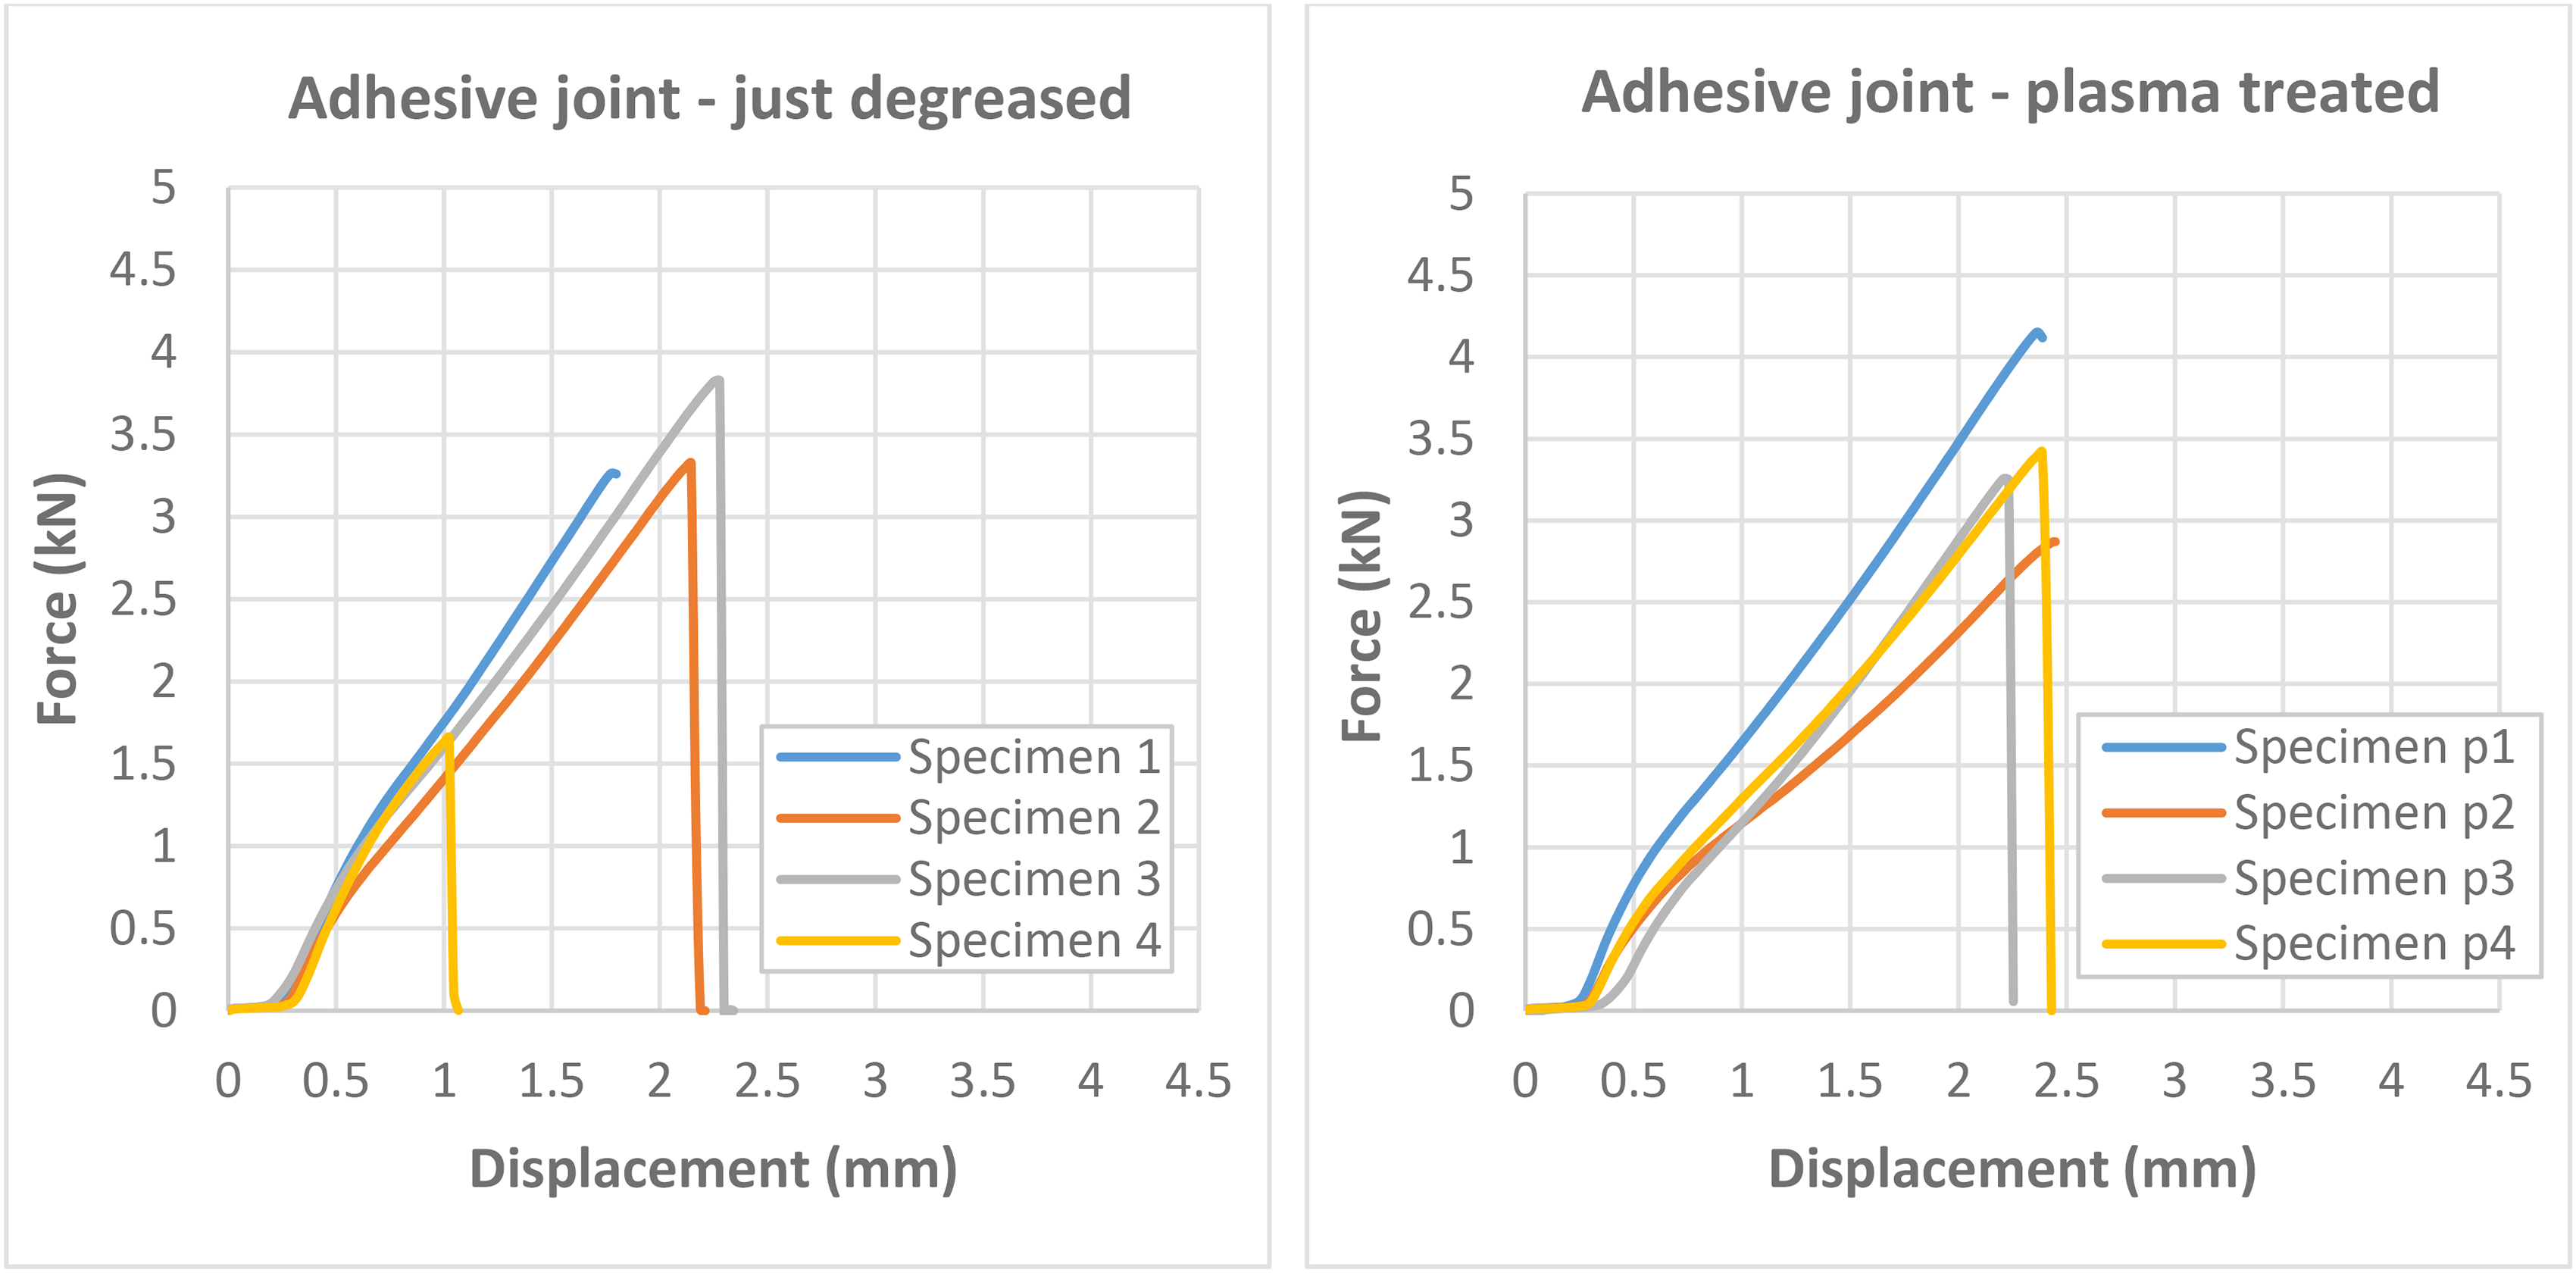
Force-displacement diagrams of the adhesive joints.
The bondline thickness has been assessed with a gage as the difference of the total joint thickness minus twice the adherends thickness. The results are shown in Table 9. It is interesting to note that the absence of calibration has led to significant differences in thicknesses between the samples.
Specimen bondline thicknesses.
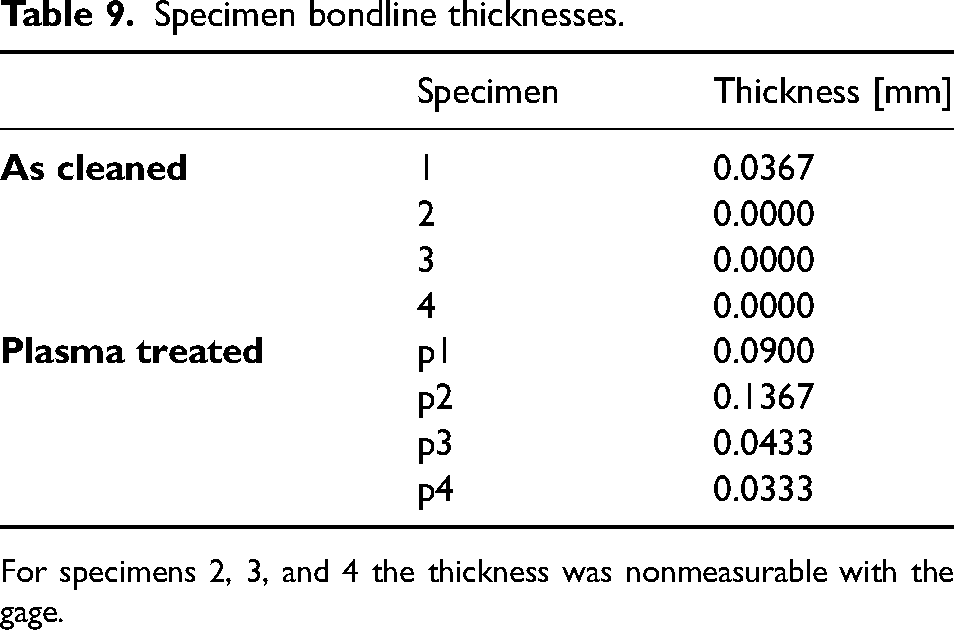
For specimens 2, 3, and 4 the thickness was nonmeasurable with the gage.
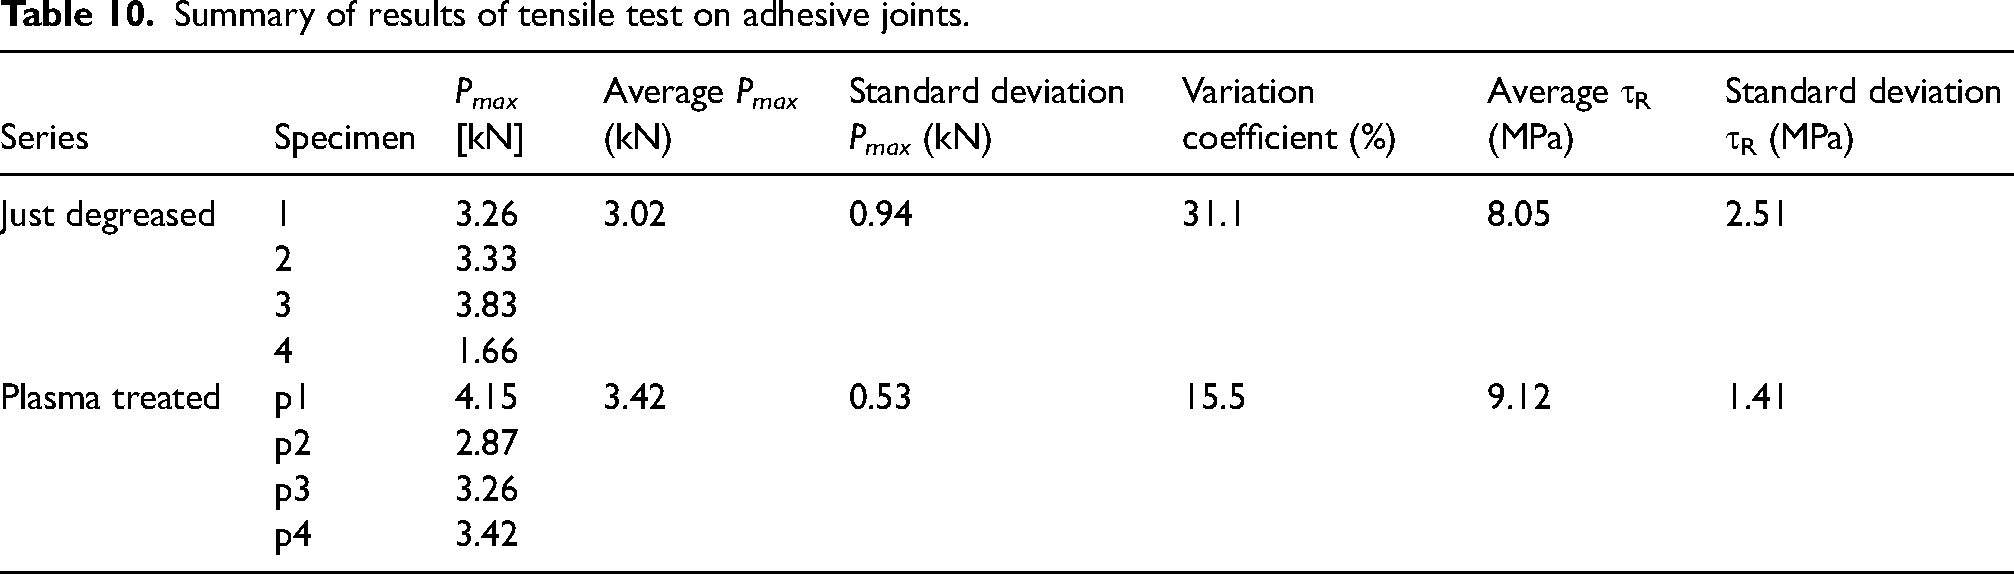
The scale of the diagrams has been set equal to Figure 20 in order to highlight the similarity of the mechanical behavior with USW joints with an ED, but this latter score better than adheisve joints concerning Pmax. Also the coefficient of variation of USW joints with ED is better than that of adhesive joints, meaning that it is a reliable process. The summary of the test results in terms of failure load and shear strength are reported in Table 10.
Summary of results of tensile test on adhesive joints.
Failure surface analysis
After the testing of the bonded joints, the fracture surfaces have been visually inspected to determine the failure modes (Figure 24). In the case of as-cleaned joints, in specimens 1 and 4 the adhesive is located entirely in one adherend. On the other hand, for specimens 2 and 3 there are traces of adhesive left in both the adherends, which is sign of a partially cohesive fracture. That could be part of the reason why those specimens have reached the highest values of ultimate load, although the difference with specimen 1 is too small to properly validate this hypothesis. For the plasma treated joints, as expected, all specimens show partial traces of adhesive on both the adherends, apart from specimen p2, in which the adhesive remained mostly in one adherend. This could be the reason why its failure load was the lowest (2.87 kN) among the plasma-treated joints, while the presence of adhesive on both adherends in all the other case justifies the higher average failure load with respect to the as-cleaned joints.
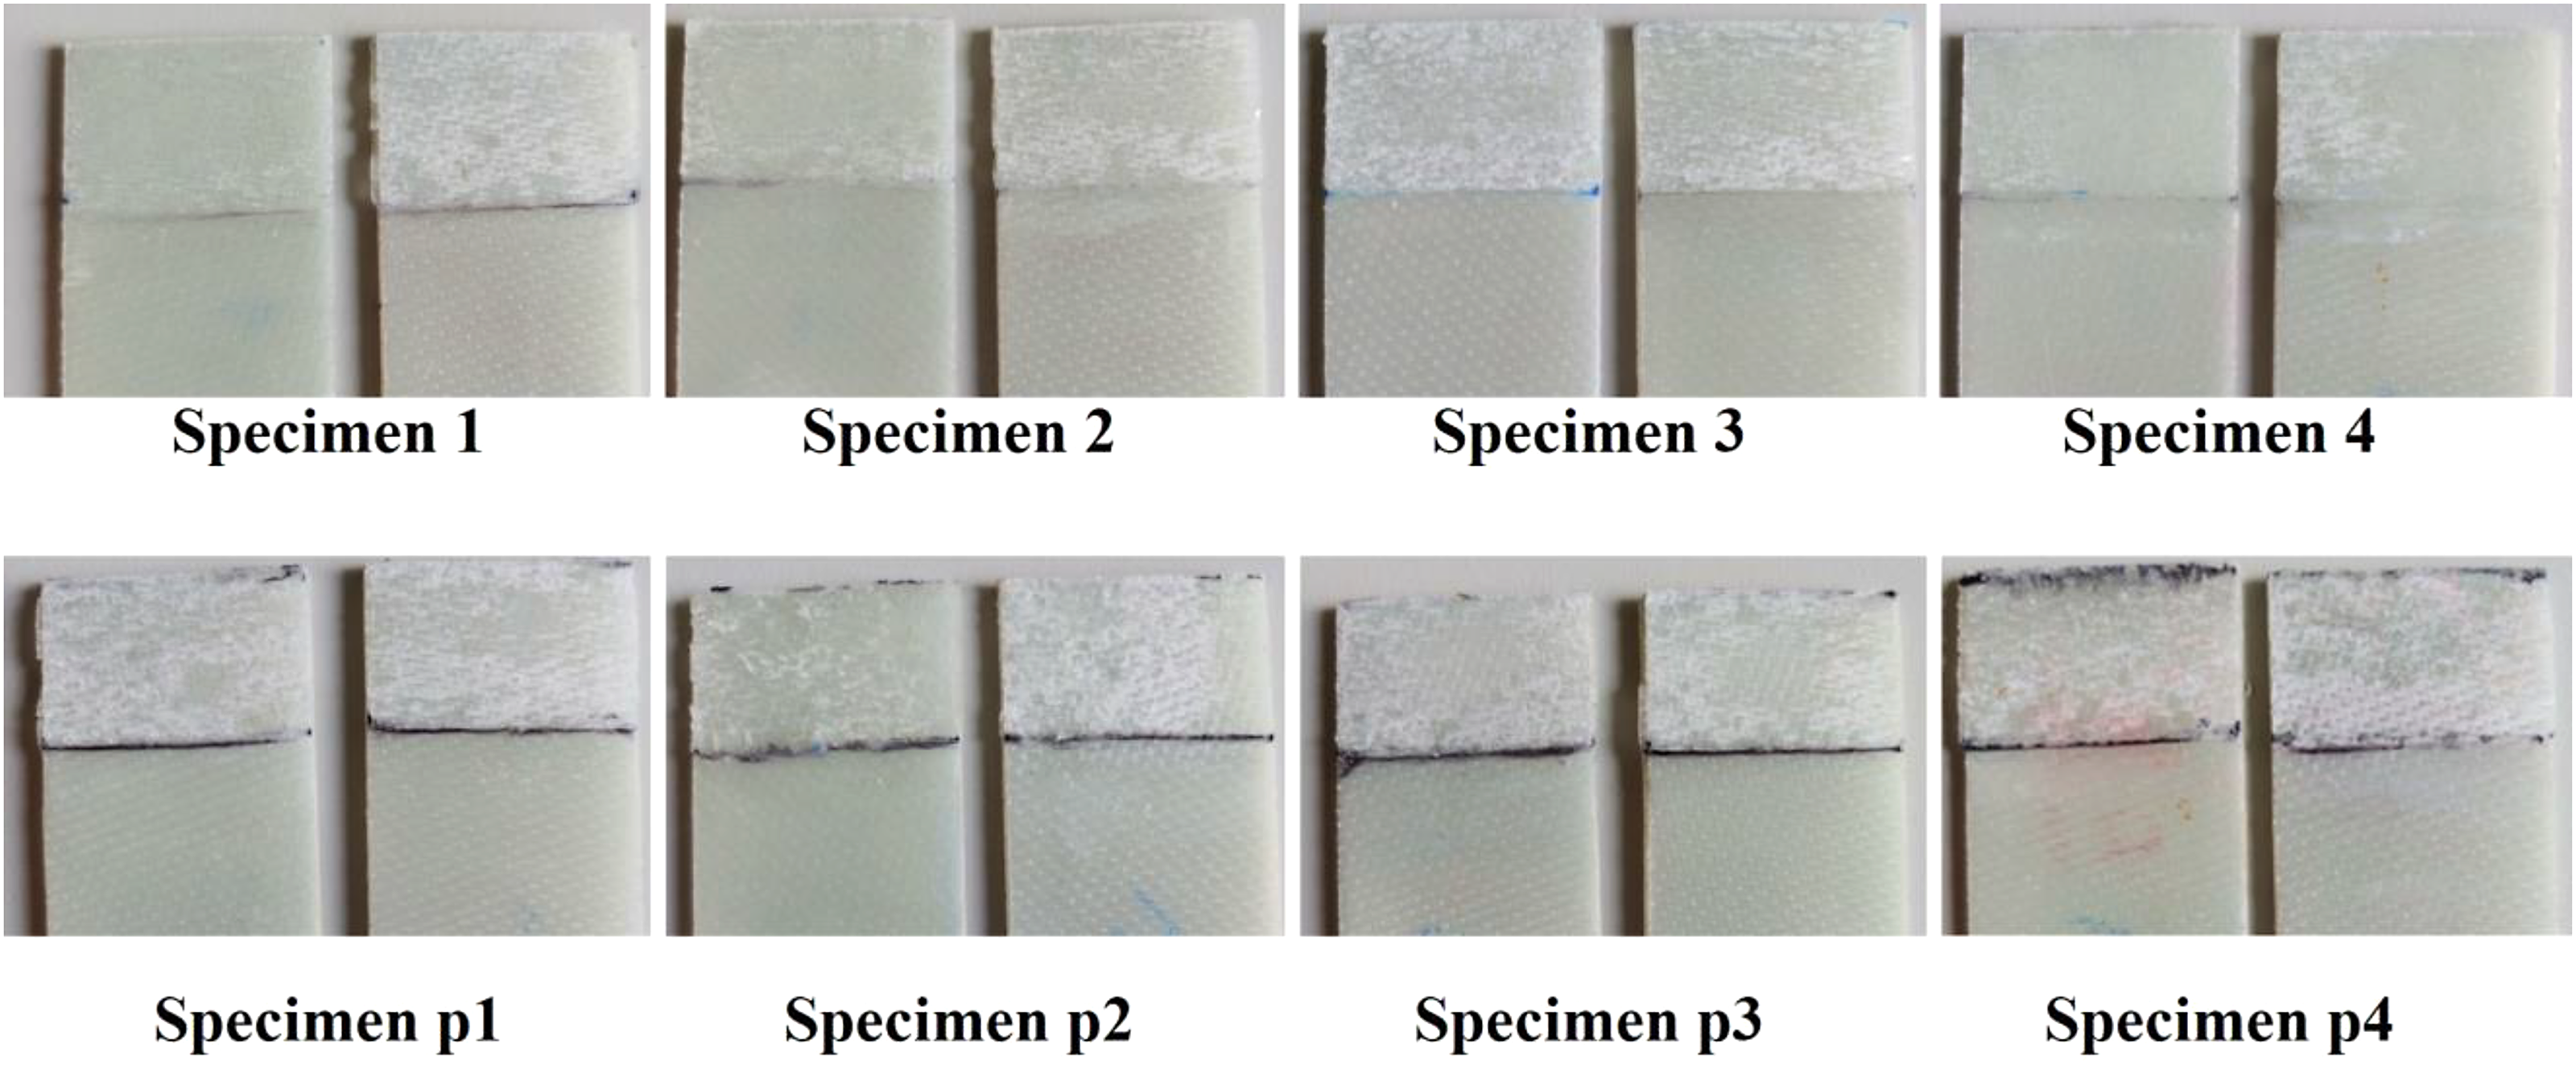
Failure surfaces for the bonded specimens.
Comparison between USW and adhesive bonding
The mechanical resistance results of the simple lap joint are summarized in Figure 25 for the two cases treated, without and with ED consisting of an unreinforced PC wire. It is clearly seen how the two cases are profoundly different, both in terms of process parameter ranges, and in terms of resistance obtained, in any case in favor of the use of an ED although this complicates the procedure. It should also be noted that without an ED, the increase in Pmax is reduced as the WF and WE increase and this is caused by the triggering of a local burn-out of the PC due to overheating.
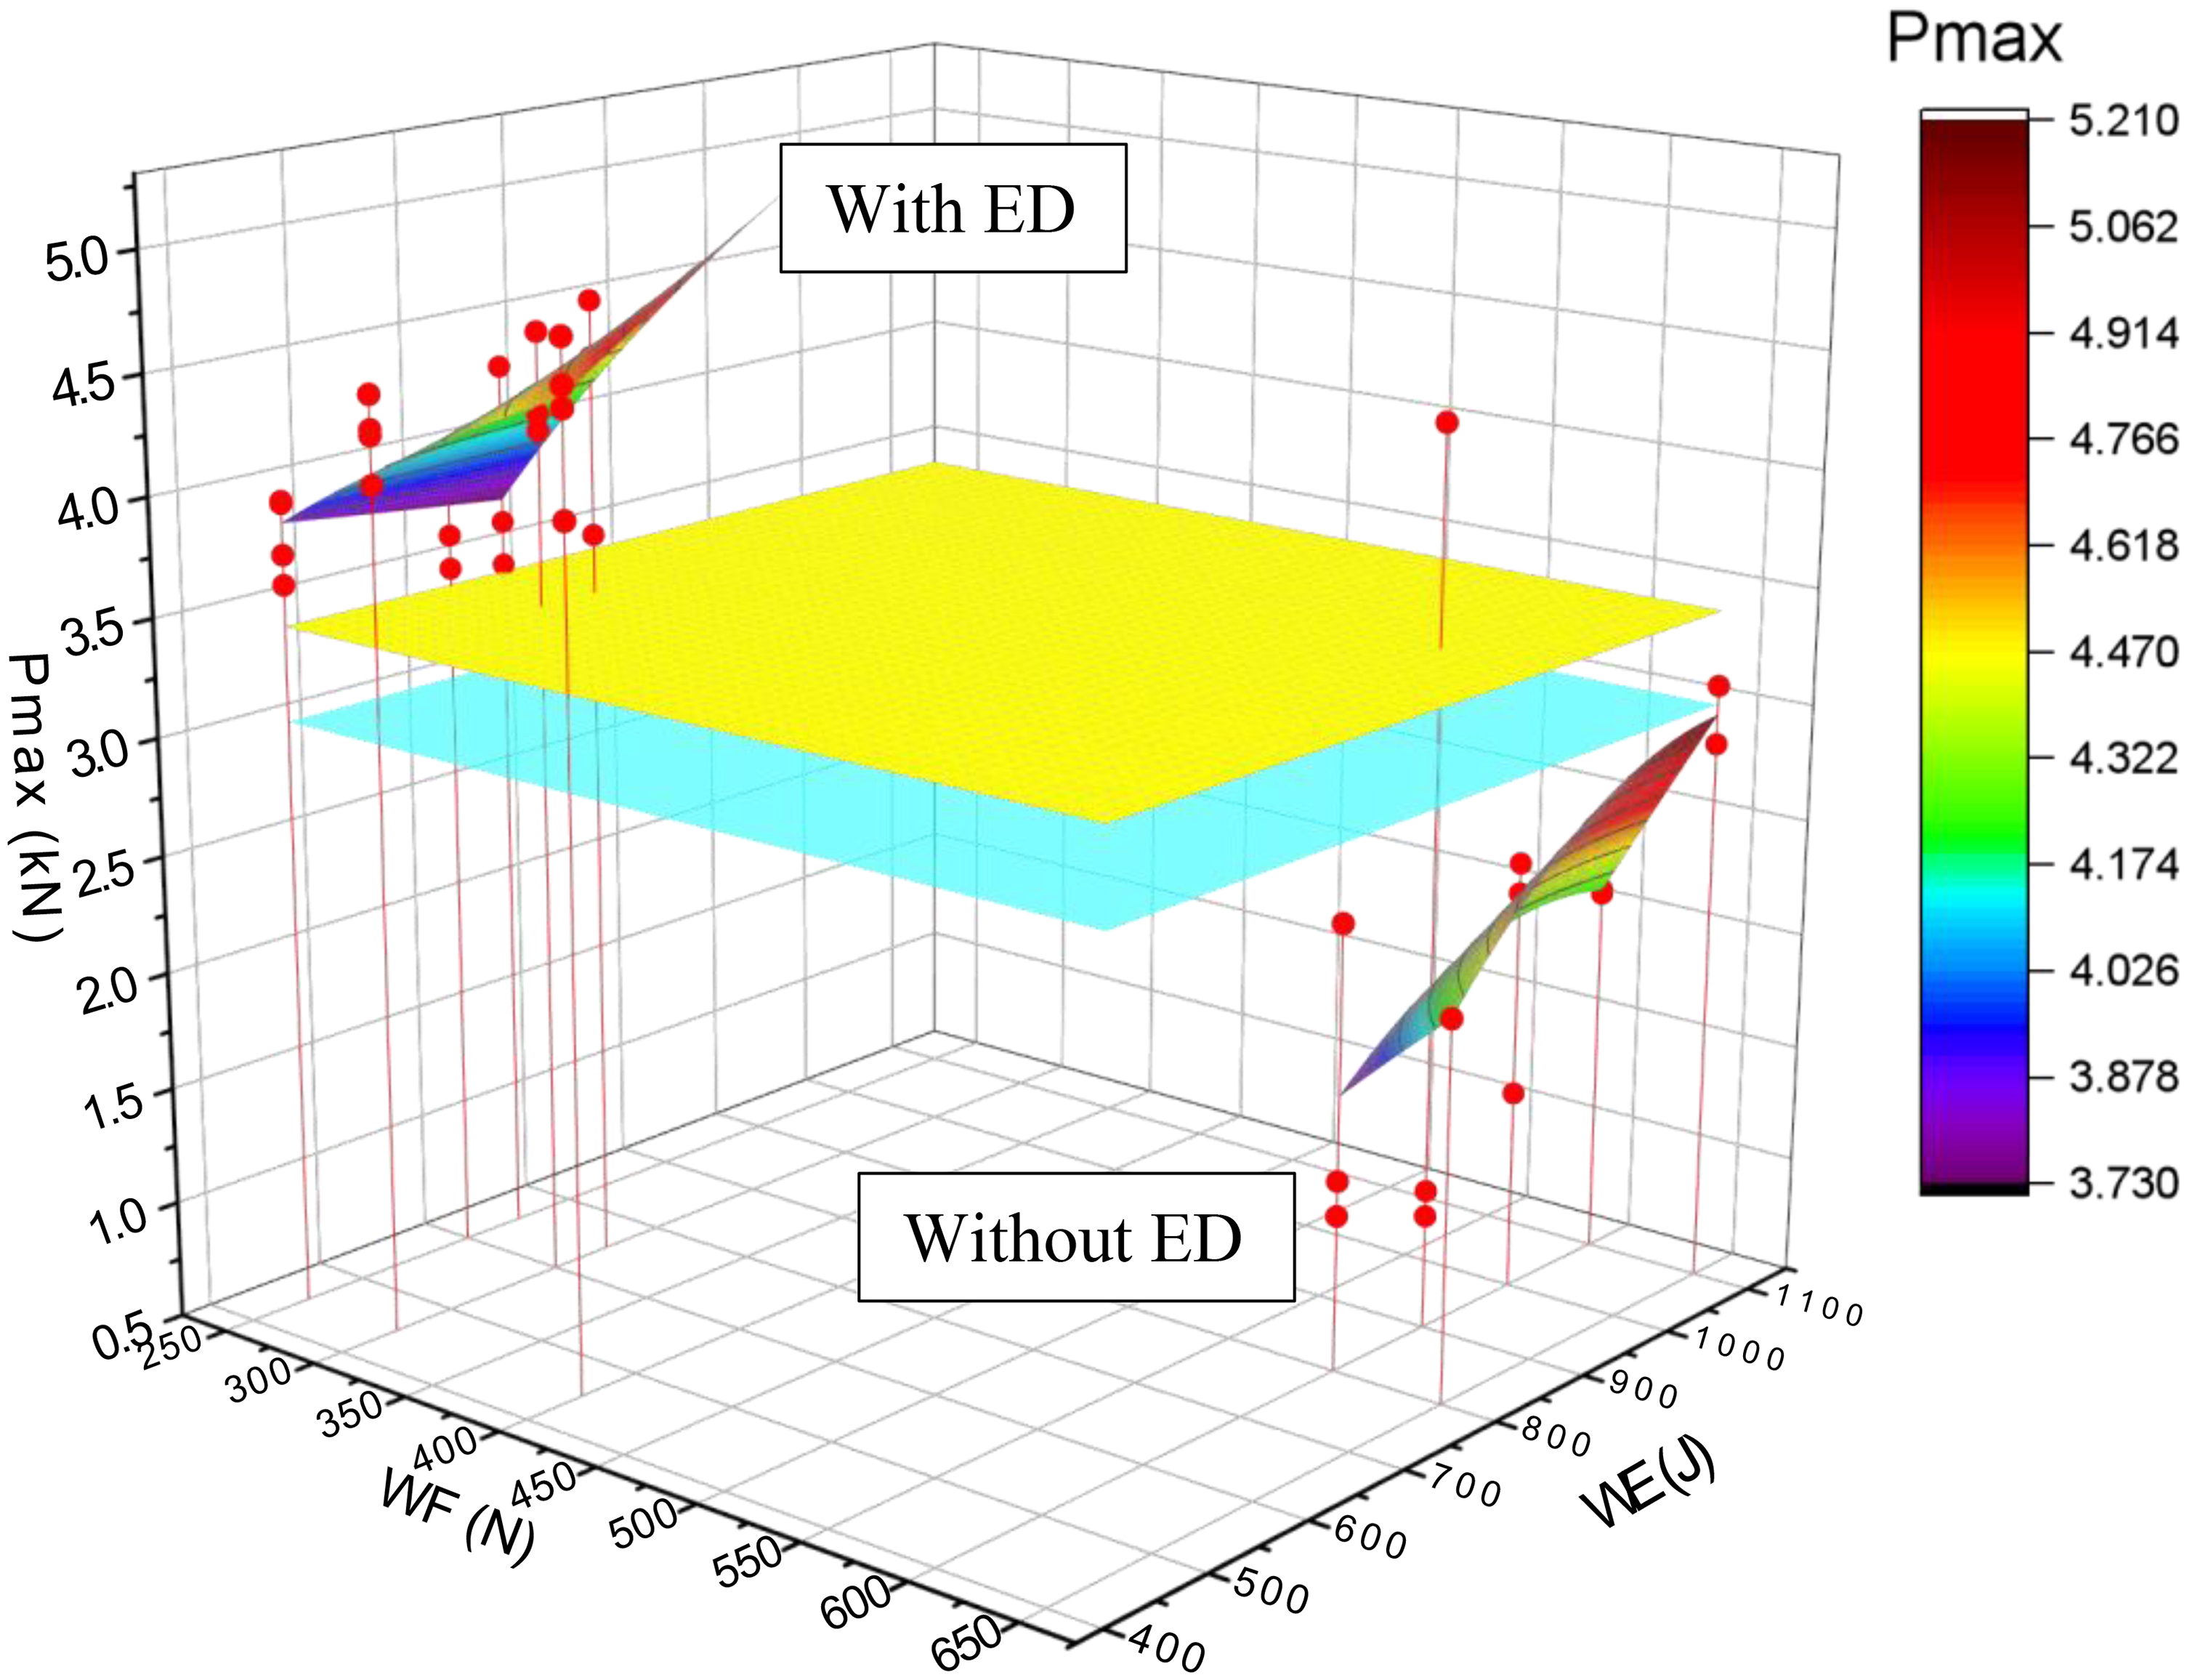
Comparison of the response surfaces of USW joint strength withouth and with ED and adhesive joints (cyan: only degreased; yellow: degreased and plasma treated). ED: energy director; USW: ultrasonic welding.
The value of overlap shear strength of bonded joints is also shown in Figure 25. The strength values are, in the case of using an ED, higher than those obtained with a structural adhesive. USW is therefore a convenient joining method for this type of thermoplastic composite.
Conclusions
In this article, USW of a PC-GF laminate composite has been examined by tensile testing of single-lap joints. USW parameters have been varied one at a time in order to highlight the trend of the joint strength, both with and without ED in the form of a neat PC wire. Adhesive joints, just degreased and plasma treated, have also been manfactured and tested for comparison. The results showed that it is possible to weld without using ED, but when this latter is present it increases much the strength, that becomes higher than the adhesive joint. USW has therefore demonstrated to be feasible also for this type of material.
Footnotes
Acknowledgements
The contribution of Professor Massimo Messori (University of Medena and Reggio E. at the time of activities) on DMA tests, Professor. Emanuela Cerri (University of Oarma, Italy) on micrographic examinations and Hermann Ultrasuoni srl (Modena, Italia) on manufacturing of USW joints is gratefully acknowledged.
Declaration of conflicting interests
The authors declared no potential conflicts of interest with respect to the research, authorship, and/or publication of this article.
Funding
The authors disclosed receipt of the following financial support for the research, authorship, and/or publication of this article: This work was supported by the Ministero dell'Università e della Ricerca (grant number “Programma Operativo Nazionale” (PON), Action IV.4).