
Abstract
In this article, Ni–Cr–Mo-based functionally graded material with a designed composition is successfully fabricated using the wire arc additive manufacturing process. The effect of the gradual variation of Ni, Cr and Mo concentration and the effect of high-temperature high-pressure deformation (HTHPD) in the different cooling environments on the morphology, microstructure, and mechanical properties along the gradient direction of the manufactured functionally graded materials (FGMs) have been investigated. With increasing Cr and Mo content from the bottom to the top, the FGM exhibits a gradual increase in tensile strength and microhardness. The hardness varies from 114 to 230, 130 to 205 and 164 to 256 HV for as-deposited, HTHPD with air-cooled (HTHPD-A) and HTHPD with water-cooled (HTHPD-W) samples, respectively, from bottom to top. Similarly, the average tensile strength is achieved at 793, 715 and 875 MPa in as-deposited, HTHPD-A and HTHPD-W samples, respectively. The microstructural examination of fabricated samples shows the columnar grain produced in as-deposited samples, deformed during the HTHPD process and recrystallized grains with orientation along the deformation direction has been formed.
Keywords
Introduction
In material science, functionally graded materials (FGMs) are materials characterized by gradual variability in properties over volume. 1 It undergoes gradual changes in composition, constituents or microstructure (e.g. grain size, texture, or porosity) in at least one direction, resulting in functional changes in at least one property. 2 FGMs continuously change the macroscopic properties, such as hardness, corrosion resistance, and thermal conductivity, due to the gradual change in volume fraction of the composition and inhomogeneous structure. 3 Due to their superior thermal gradient resistance, FGMs can be used in high-stress structures, including space plane bodies. 4 In addition, they can also provide crack prevention and are helpful for penetration-resistant materials in defence applications, such as armour plates and bullet-proof vests. 5 Moreover, FGMs are ideal for biomedical applications where designed mechanical properties are necessary to make patient-specific implants perform biomechanically. 6 These materials can also be used in medicine, energy, cutting tools, insert coatings, automobile engine components, turbine blades, and heat exchangers. 7
In recent years, more investigations have been carried out on FGMs with metal and ceramic constituents3,5 and conventional metal-based FGMs, such as titanium alloys,2,6–7 stainless steels, 8 and nickel-based superalloys. 9 The majority of studies on FGMs are either ceramic or metallic-based, while limited studies can be found in the literature for intermetallic-based FGMs. In addition, a variety of fabricating methods have been developed to synthesize FGMs, such as chemical and physical vapour deposition techniques, centrifugal method, powder metallurgy, electron beam direct manufacturing, selective laser sintering, selective laser melting, 3D printing, etc. 8 Compared with the above-mentioned manufacturing methods, additive manufacturing (AM) technologies offer advantages for overcoming fabrication challenges such as shape complexities, material complexities, hierarchical complexities, and functional complexities. 10 Due to the higher deposition rate 11 and lower material waste, 12 researchers have focused on wire arc AM (WAAM). WAAM is a wire-based, direct energy deposition approach that uses an electric arc as a source of heat to melt the wire feedstock and deposit a part preform, layer by layer, as shown in Figure 1.
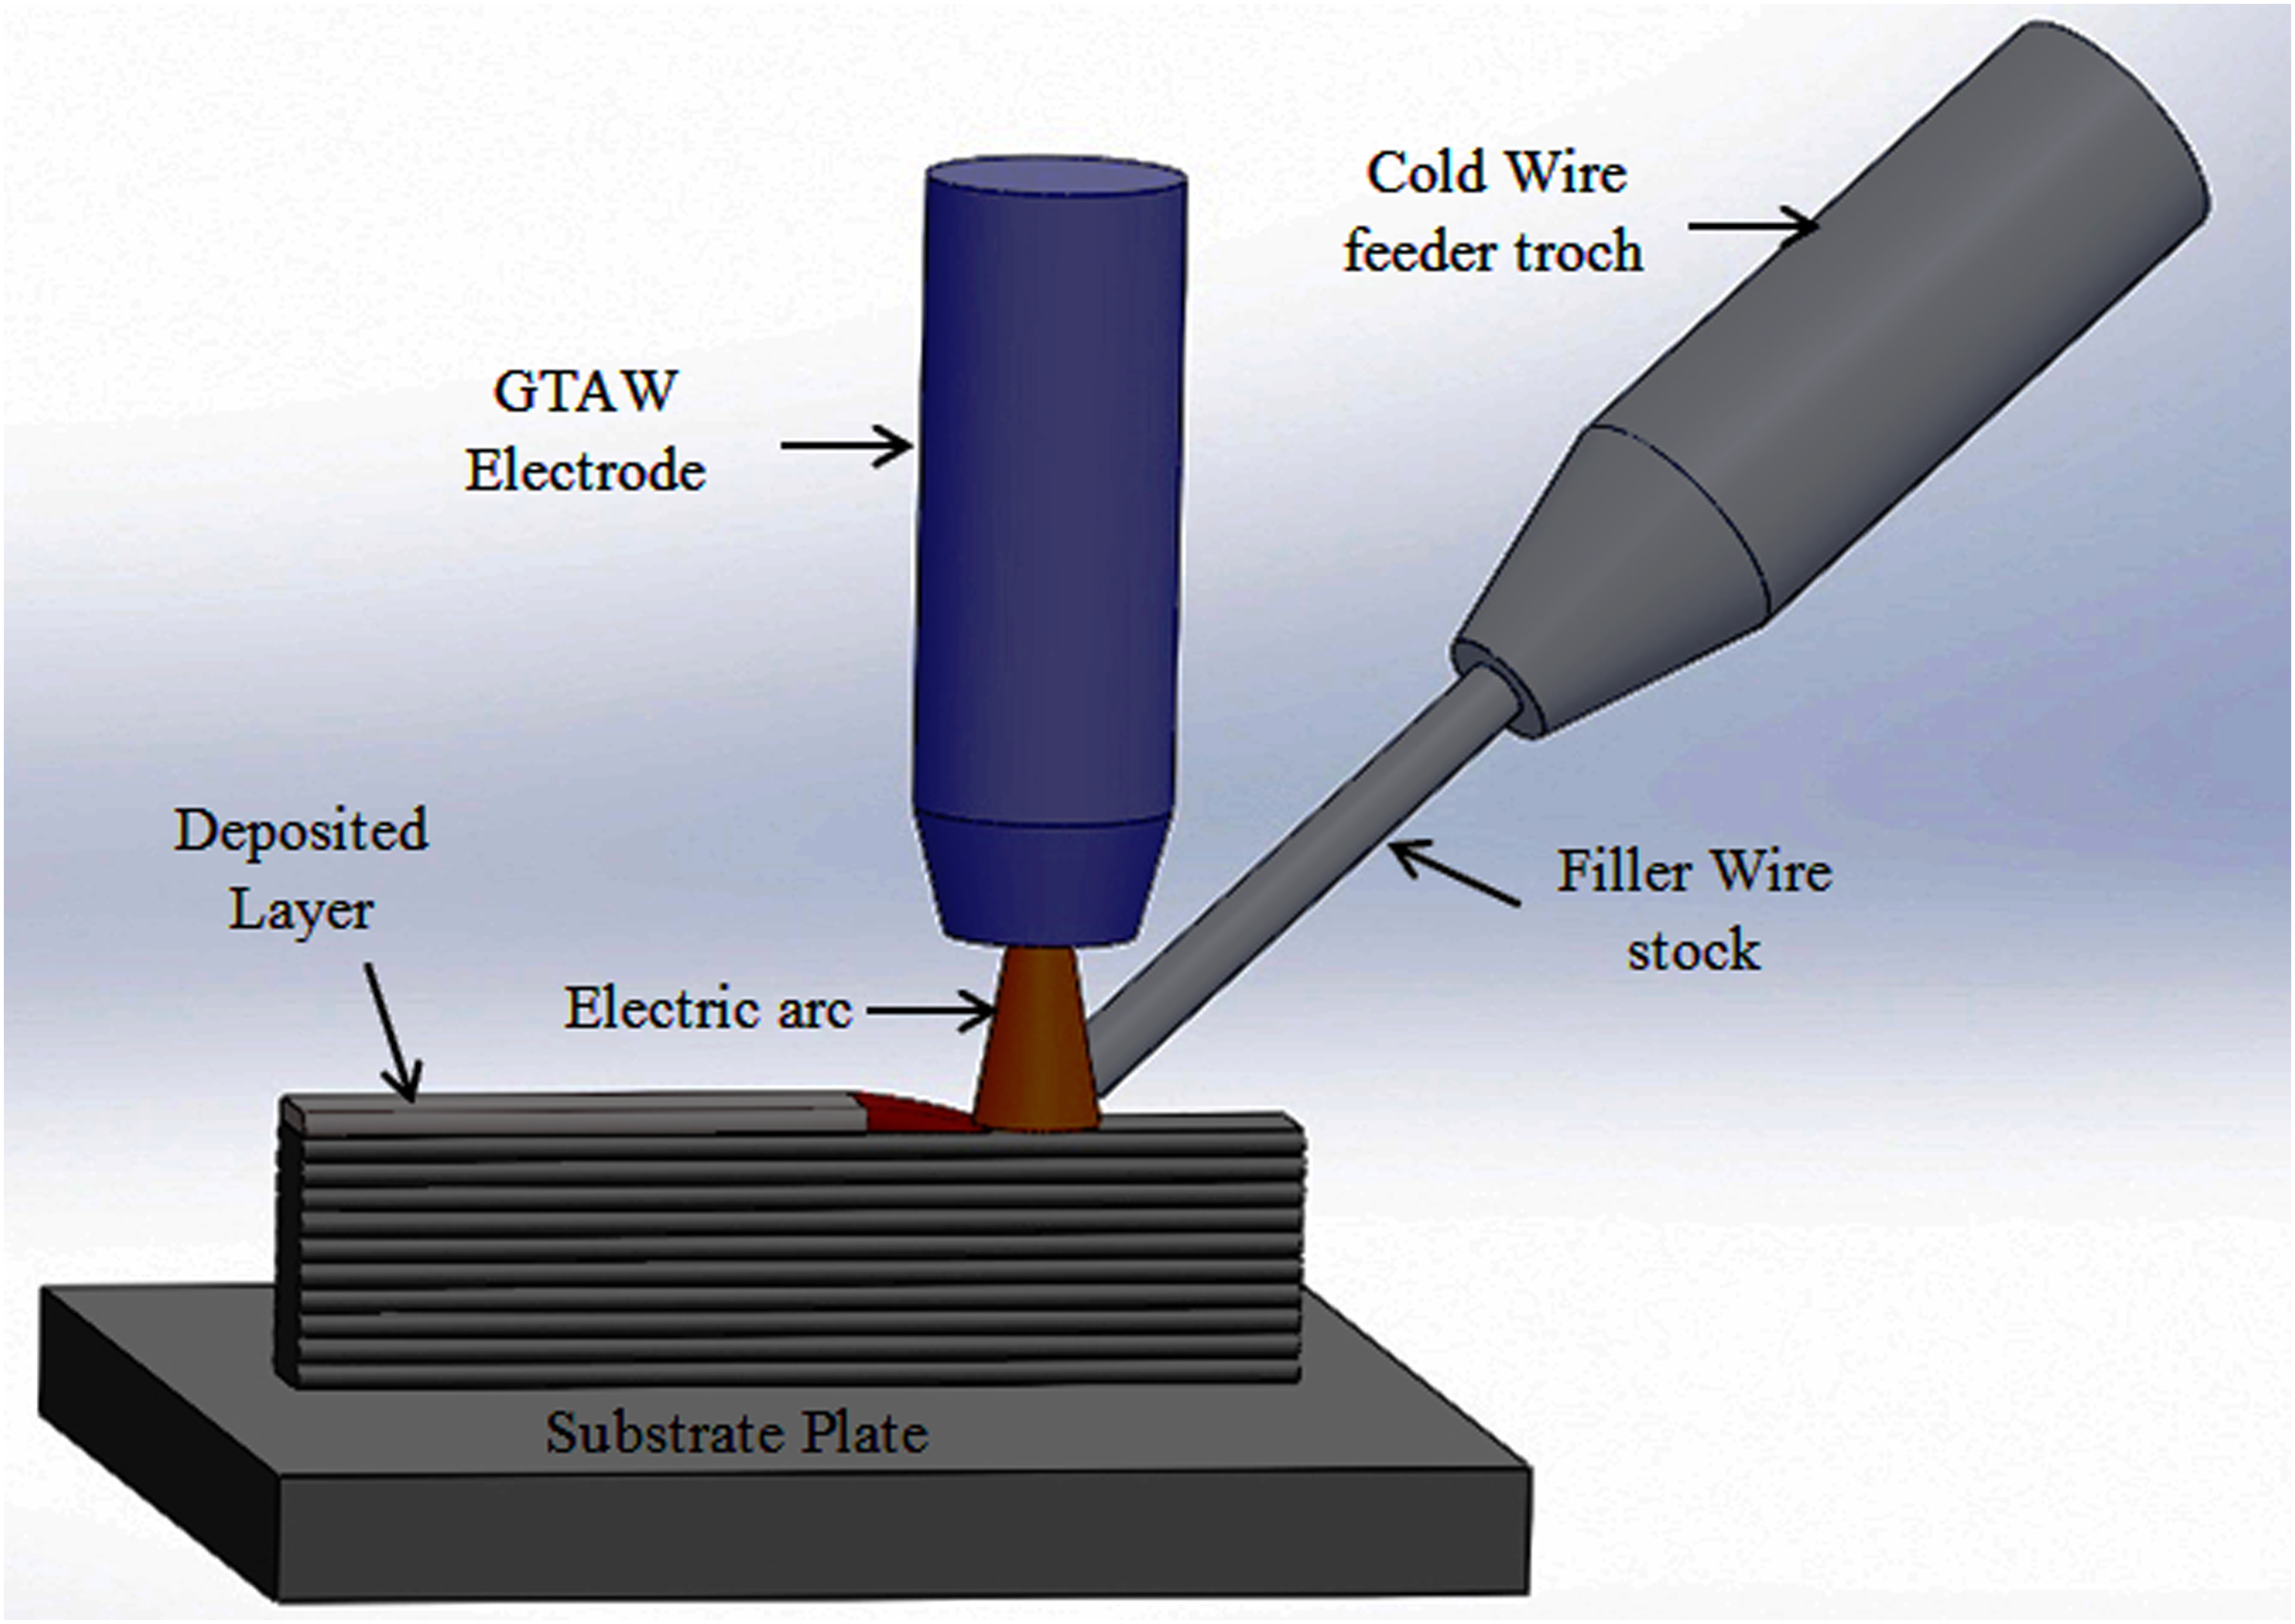
Wire arc additive manufacturing (WAAM) process.
For melting feedstock wire and constructing a 3D component layer by layer, WAAM employs different welding sources such as gas metal arc welding (GMAW), gas tungsten arc welding (GTAW), plasma arc welding, and cold metal transfer (CMT) welding. 13 Due to a higher deposition rate and lower material wastage, WAAM can be used directly to produce complex metallic components with high density in a shorter time and at a lower cost than powder-based AM. A lack of spatter and the formation of a stable molten melt weld pool during WAAM's operation enable it to deposit constituent material with the desired chemical composition. Due to the many advantages of WAAM, a lot of work has been done in this field. The details studies in the field of WAAM are presented in Table 1.
Research work carried out in the field of WAAM.
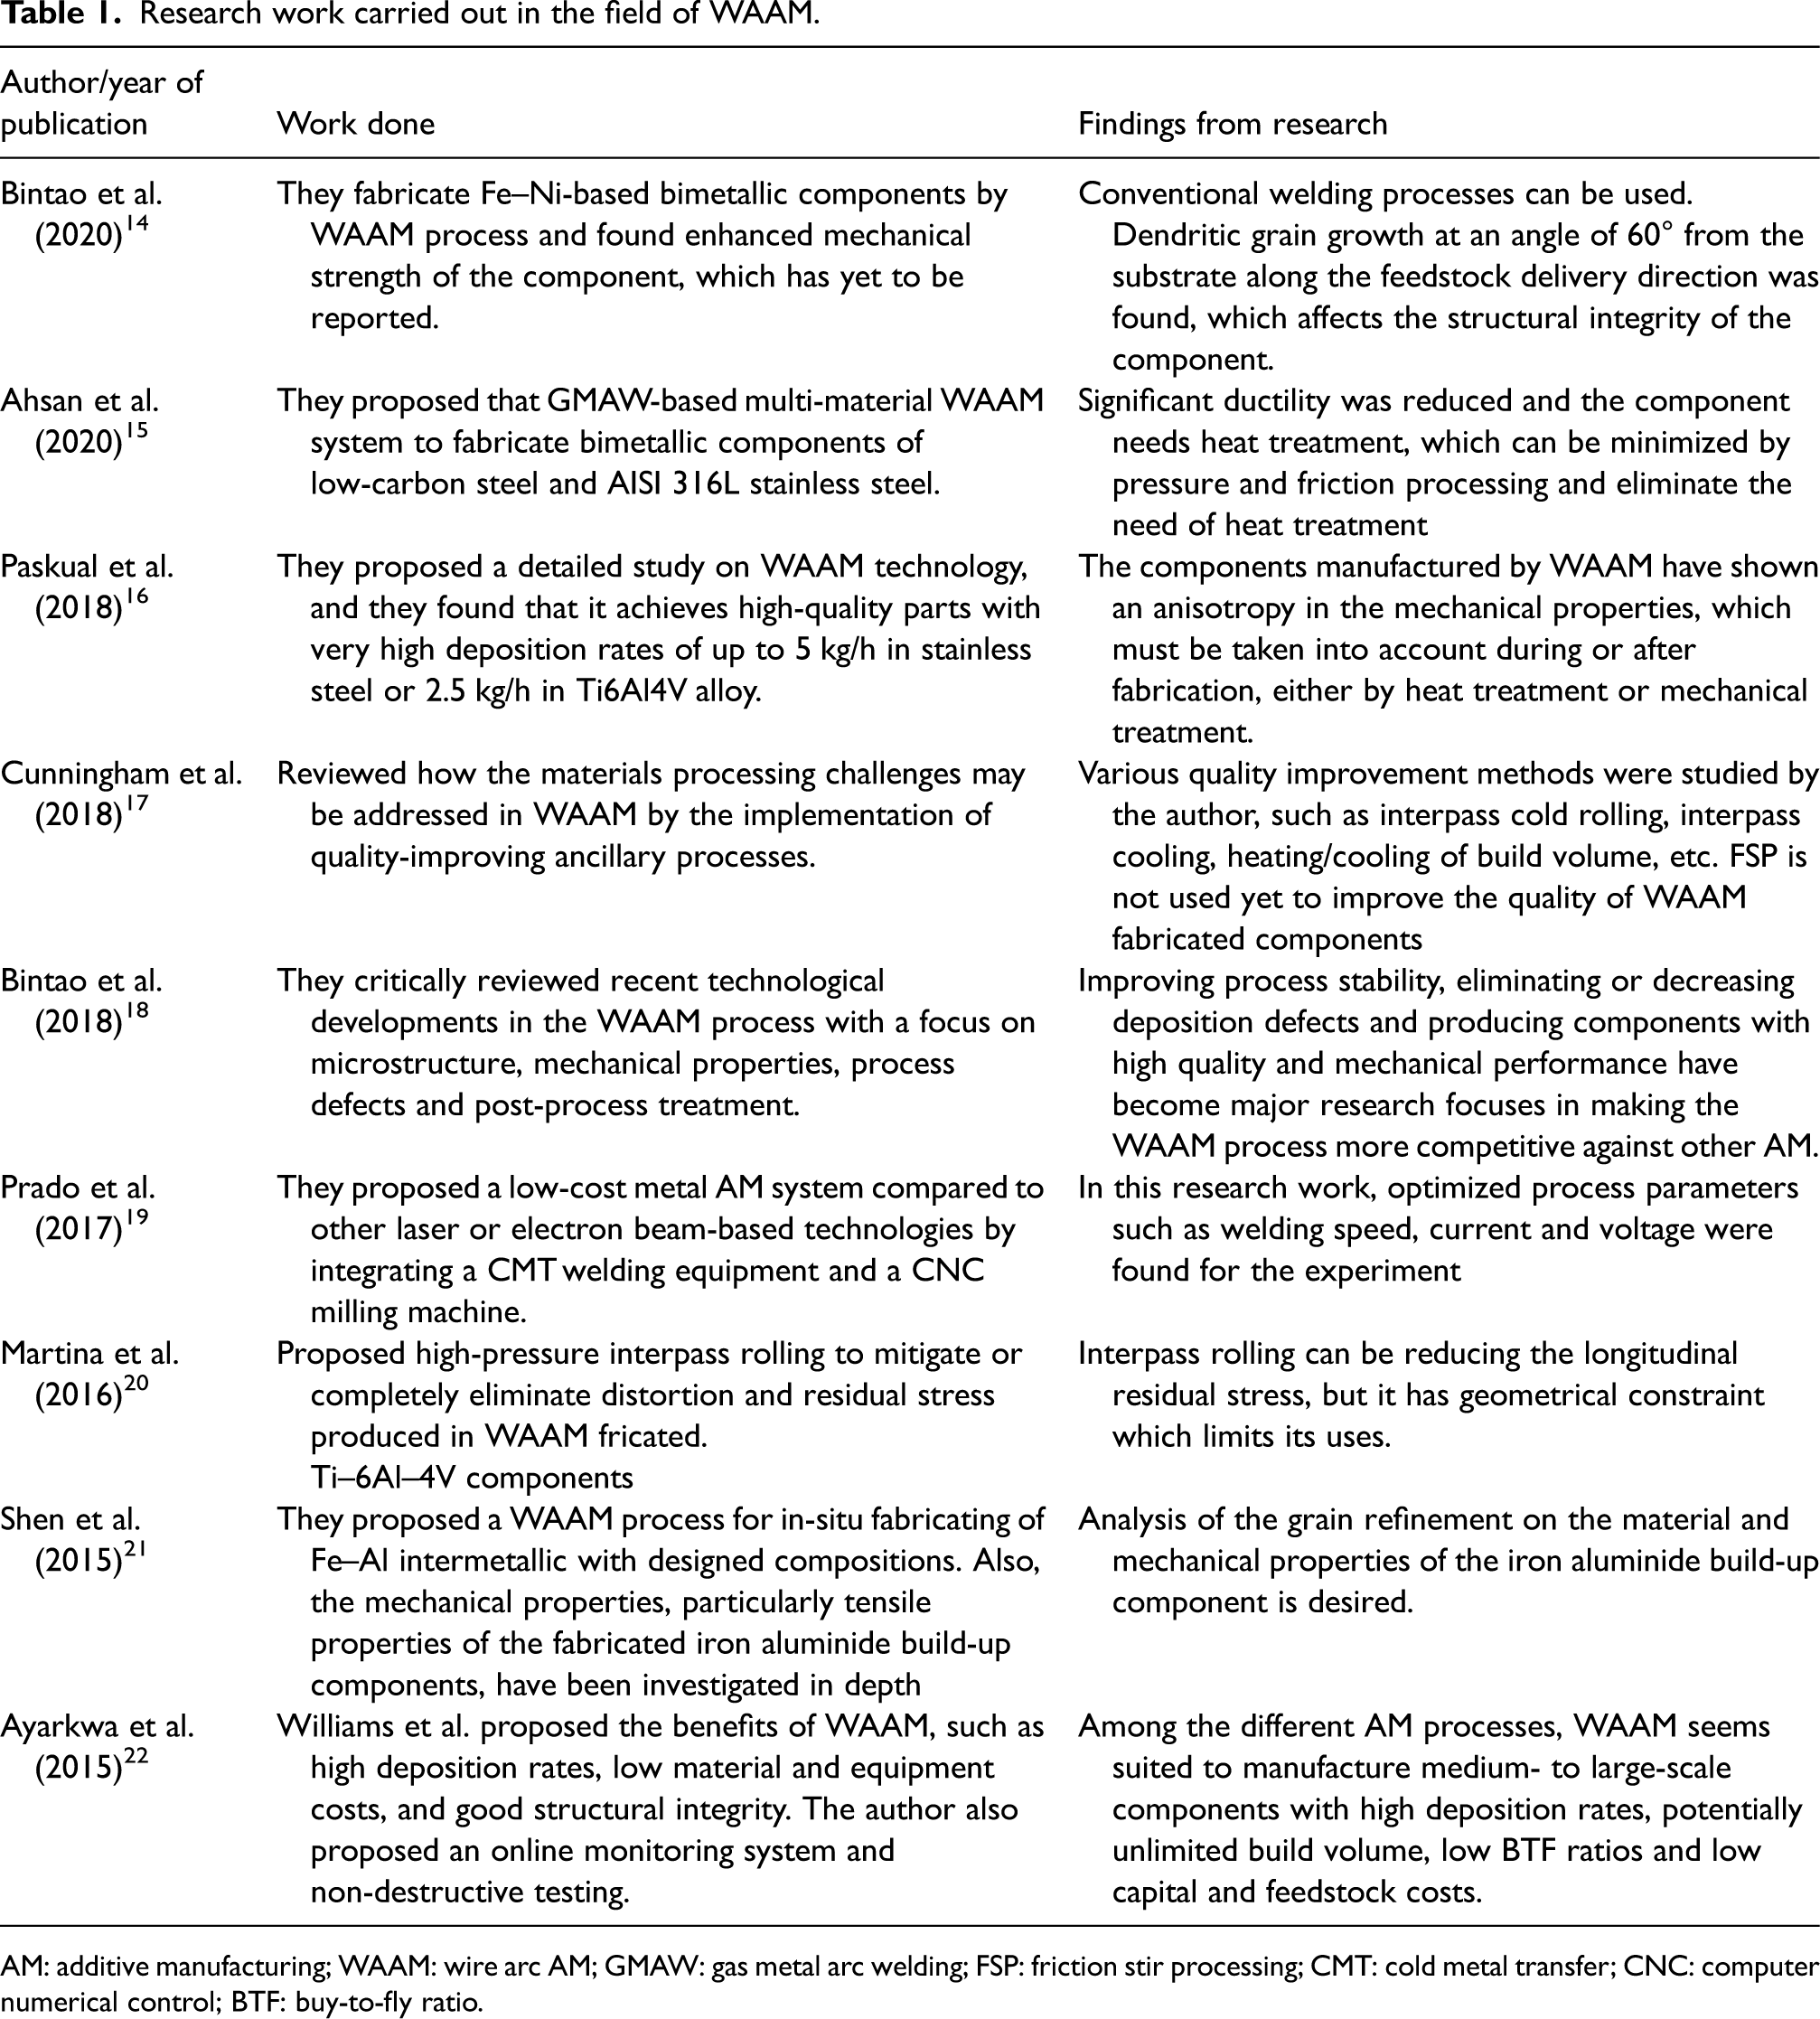
AM: additive manufacturing; WAAM: wire arc AM; GMAW: gas metal arc welding; FSP: friction stir processing; CMT: cold metal transfer; CNC: computer numerical control; BTF: buy-to-fly ratio.
Apart from the many advantages of WAAM, the higher heat input leads to high residual stress and distortion. 23 Because of this, many researchers are attracted to mitigate this issue. For this, various techniques have been investigated to reduce residual stress, such as ultrasonic impact treatment, 24 post-process heat treatment, 25 forced interpass cooling, 26 and interpass cold rolling. 27 These techniques are successful with linear welds or simple geometries, and the equipment is large and heavy. However, manufacturing asymmetric and complicated components cannot avoid distortion, residual stresses, and deterioration of metallurgical and mechanical properties with the methods mentioned above. So, in this study, in order to mitigate this issue, the friction stir processing (FSP) technique is employed for high-temperature high-pressure deformation (HTHPD) during WAAM. The concept is to use deformation to recrystallize large columnar grains formed in the WAAM process and enhance the metallurgical and mechanical properties of the deposited material.
Ni-based superalloys are the most popular material studied by the AM research community, mainly due to their high strengths at elevated temperatures and high fabrication cost using traditional methods. 18 Ni-based superalloys exhibit superior mechanical properties, oxidation resistance, and microstructural characteristics at high temperatures. 28 Because of their remarkable strength and oxidation resistance at temperatures above 550°C, nickel-based superalloys are widely used in the aerospace, aeronautical, petrochemical, chemical, and marine industries. 29 In recent years, various nickel-based superalloys, such as Inconel 718, 625 have been studied and utilized in the WAAM process. Inconel 625 is a nickel-based superalloy that derives its strength mainly from the solid-solution hardening effect of the refractory metals, niobium and molybdenum, in a nickel–chromium matrix. 30 The characteristics of Inconel 625 that make it appealing to the aerospace industry include high tensile, creep, and rupture strength, unusual fatigue and thermal-fatigue strength, oxidation resistance, and excellent weldability and brazeability. 31 The higher hardness, low thermal conductivity, and high work hardening rate of IN625 make it difficult to machine or process by subtractive means. 32 Ni-based superalloys are susceptible to solidification cracking during fusion welding due to a wide solidification temperature range which is also a common problem during WAAM.
So, this study aims to fabricate Ni-based FGMs with a designed composition gradient using the WAAM process and investigate the variation of microstructure and mechanical properties with the change of composition. Furthermore, the effect of HTHPD with and without cooling is also studied on the metallurgical and mechanical properties of deposited FGM.
Experimental procedures
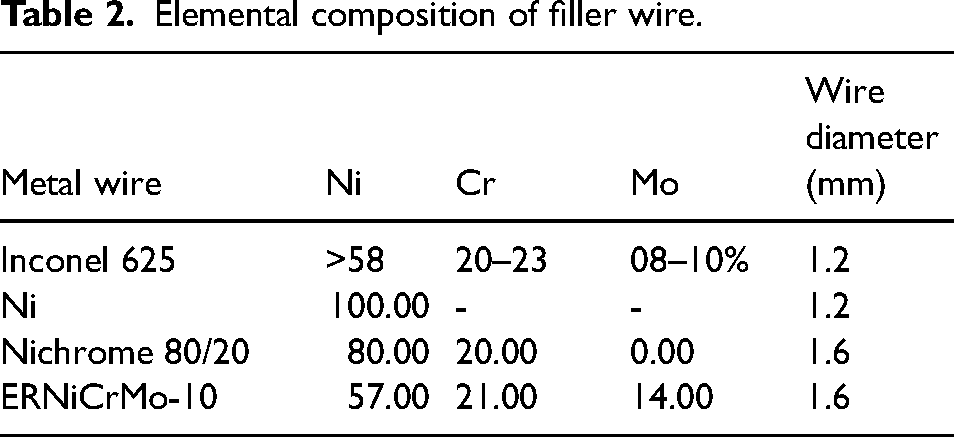
In this experiment, different grades of wires were used to prepare the FGM sample. The chemical composition of feedstock wires and wire diameters are presented in Table 2. The chemical composition of wires is found in the prescribed range of standards. The three straight-wall structures have been fabricated using the WAAM system. Welding grade argon with 99.99% purity and a flow rate of 15 l/min is used as a shielding gas during deposition.
Elemental composition of filler wire.
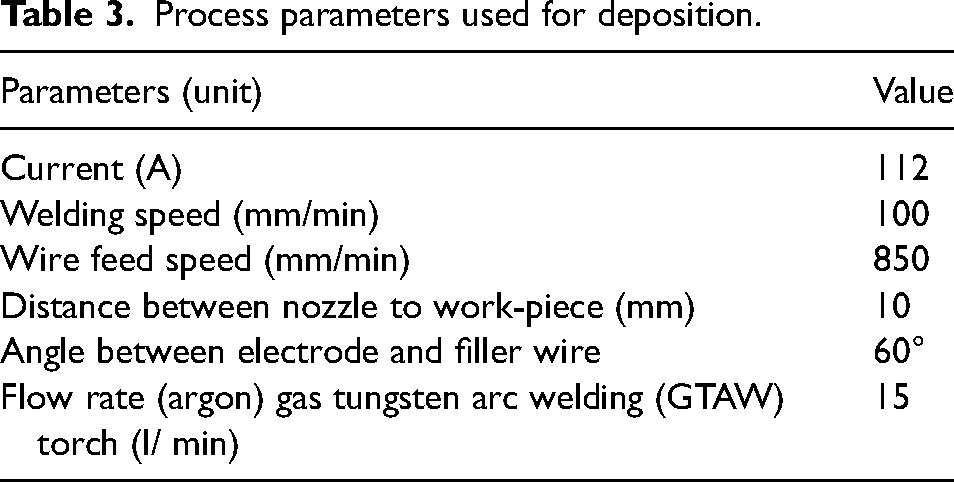
The GTAW is used as the heat source to form a weld pool with the wiring combination, as shown in Figure 2. The main process parameters are listed in Table 3. The deposition path and fabricated bulk samples with different compositions along the deposition direction (Z-axis) as shown in Figure 3. The % volume compositions are obtained using equation (1):
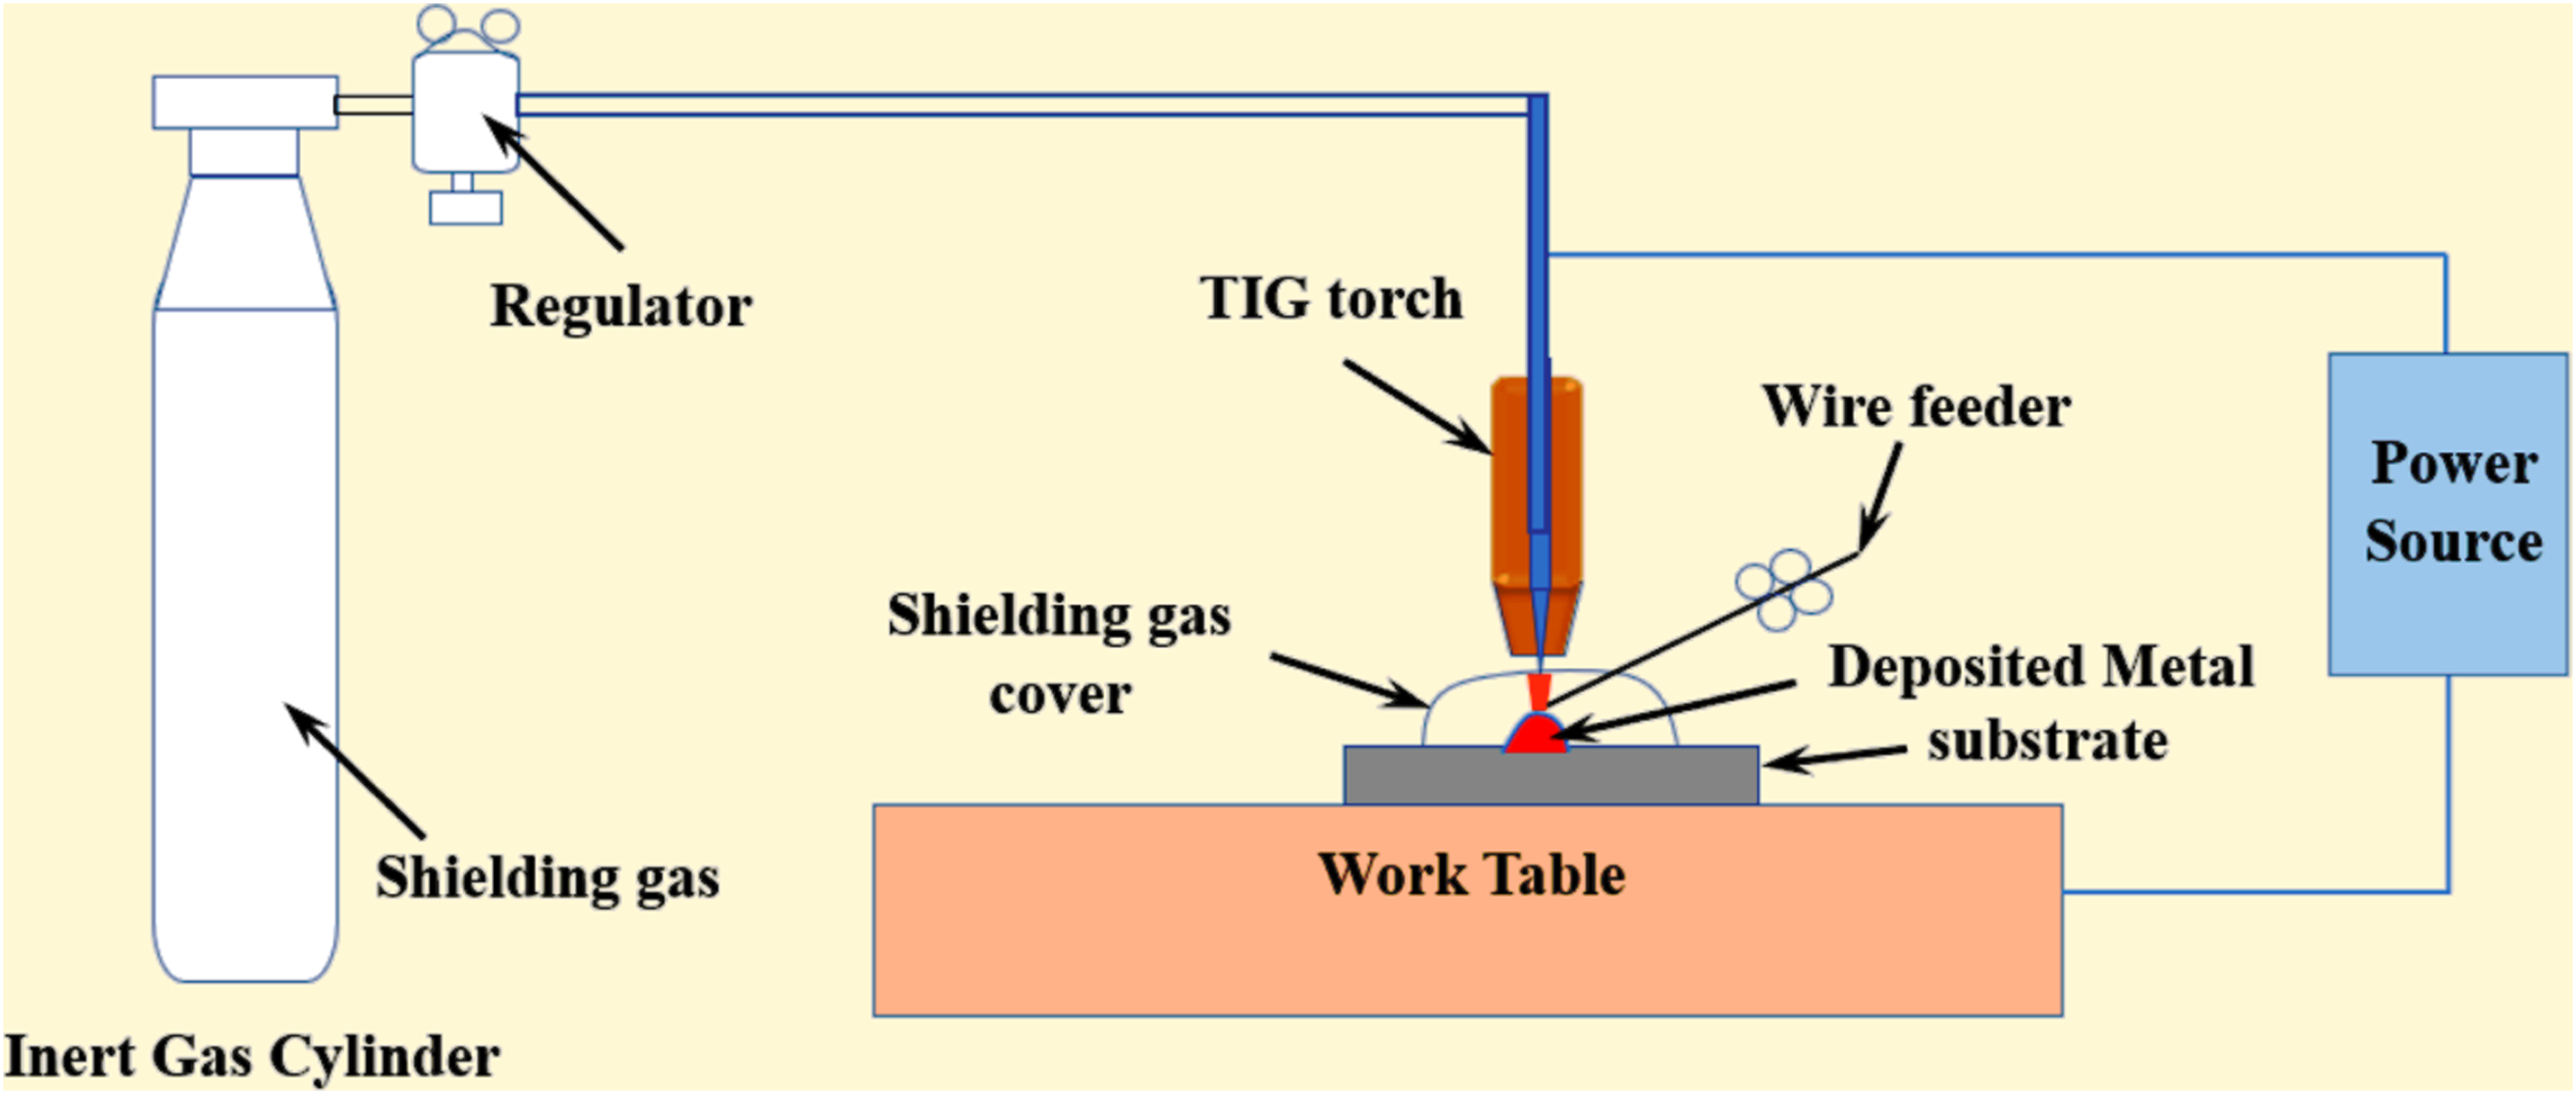
Schematic illustration of wire arc additive manufacturing (WAAM) process with wire feeding.

(a) Schematics of metal deposition pattern, (b) composition variation pattern layer over layer along the Z-direction, (c) dimension of tool used for friction stir processing (FSP) and (d) schematics of FSP.
Process parameters used for deposition.
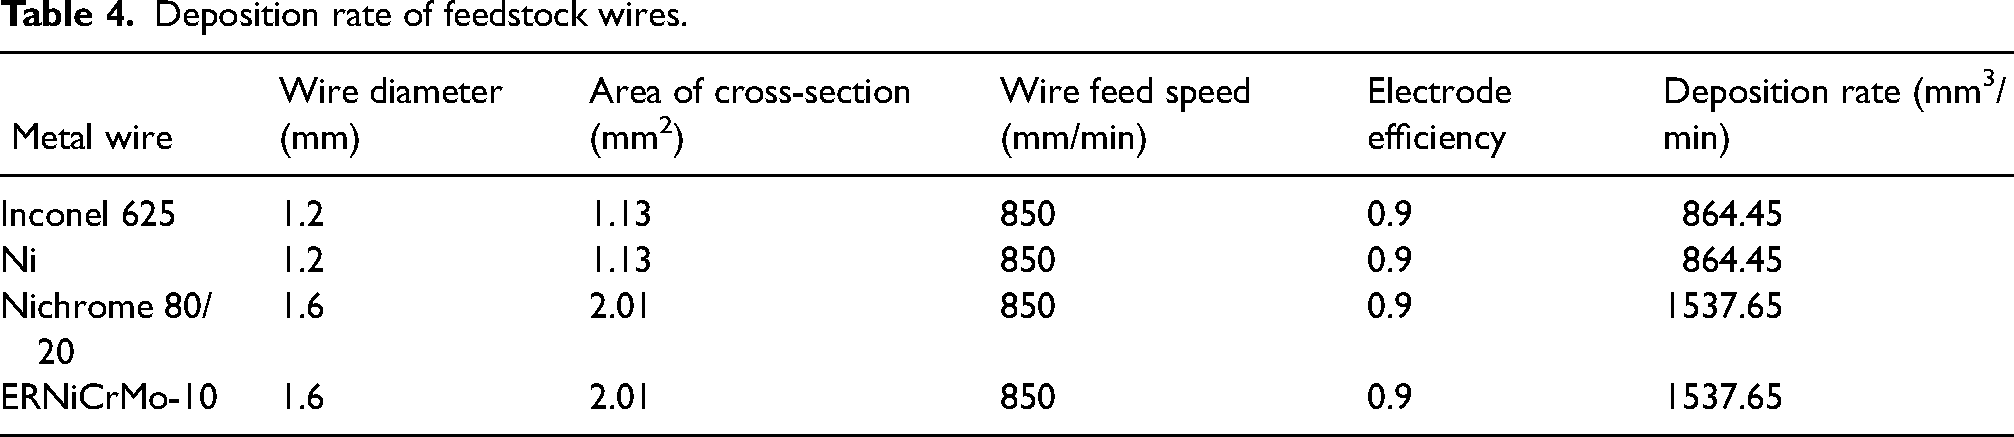
The deposition rate of the fabricated material is calculated by the formula given in equation (2):
The detailed deposition rate of the material is presented in Table 4.
Deposition rate of feedstock wires.
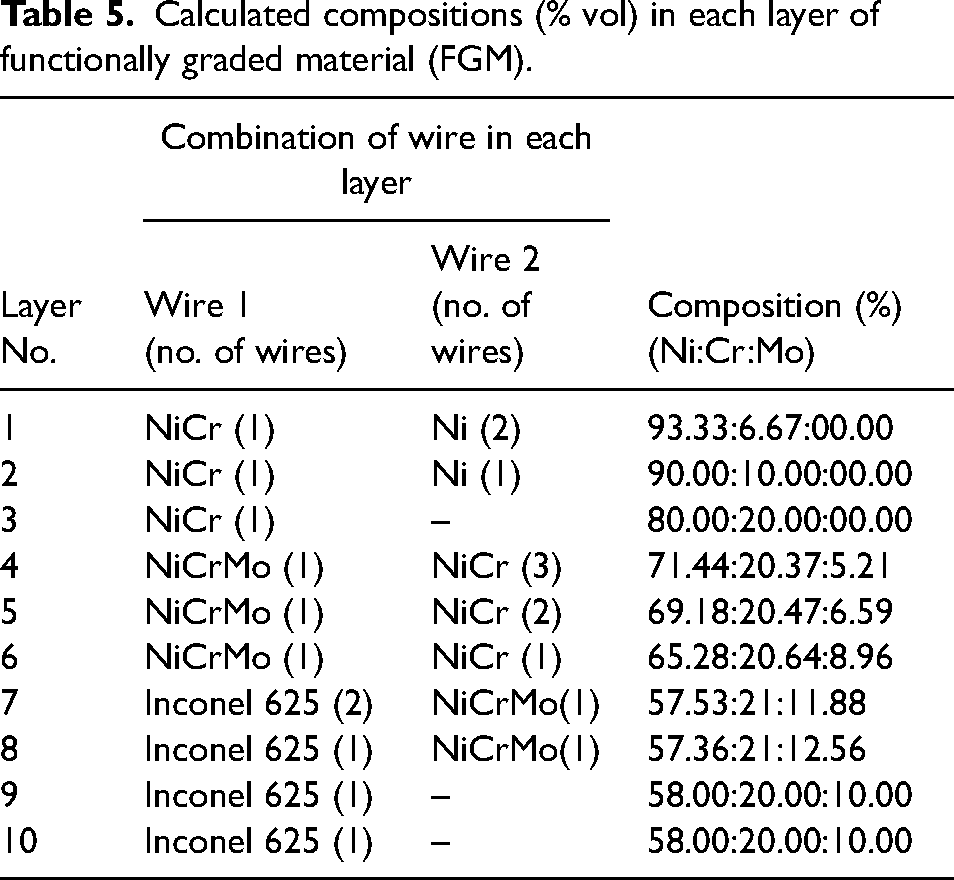
The theoretical compositions of each layer are presented in Table 5. All the experiments are performed on the selected parameters, which are based on the prior trial experiments.
Calculated compositions (% vol) in each layer of functionally graded material (FGM).
During deposition, HTHPD has been performed on a custom-built FSP setup. HTHPD is performed under two different cooling conditions, that is, stagnant air and flooded water supply. Samples deposited in different conditions are shown in Figure 4(a) to (c). HTHPD is performed after every three layers of deposition, and the same process is repeated until the desired number of layers, and compositional variation is achieved (Figure 4(d)). The selection of FSP parameters has been made through rigorous trial experiments. The selected FSP parameters, such as r/min, travel speed and depth of plunge of the pinless shoulder, along with their best-suited value, are presented in Table 6. FSP is done after three layers of successive deposition based on rigorous metallurgical observation and discussed in the microstructure section. From Figure 4(b), it was observed that HTHPD with air cooling (HTHPD-A) shows a burnt-like texture due to excessive heat, whereas HTHPD with water-cooled (HTHPD-W) samples show a smooth surface as shown in Figure 4(c).
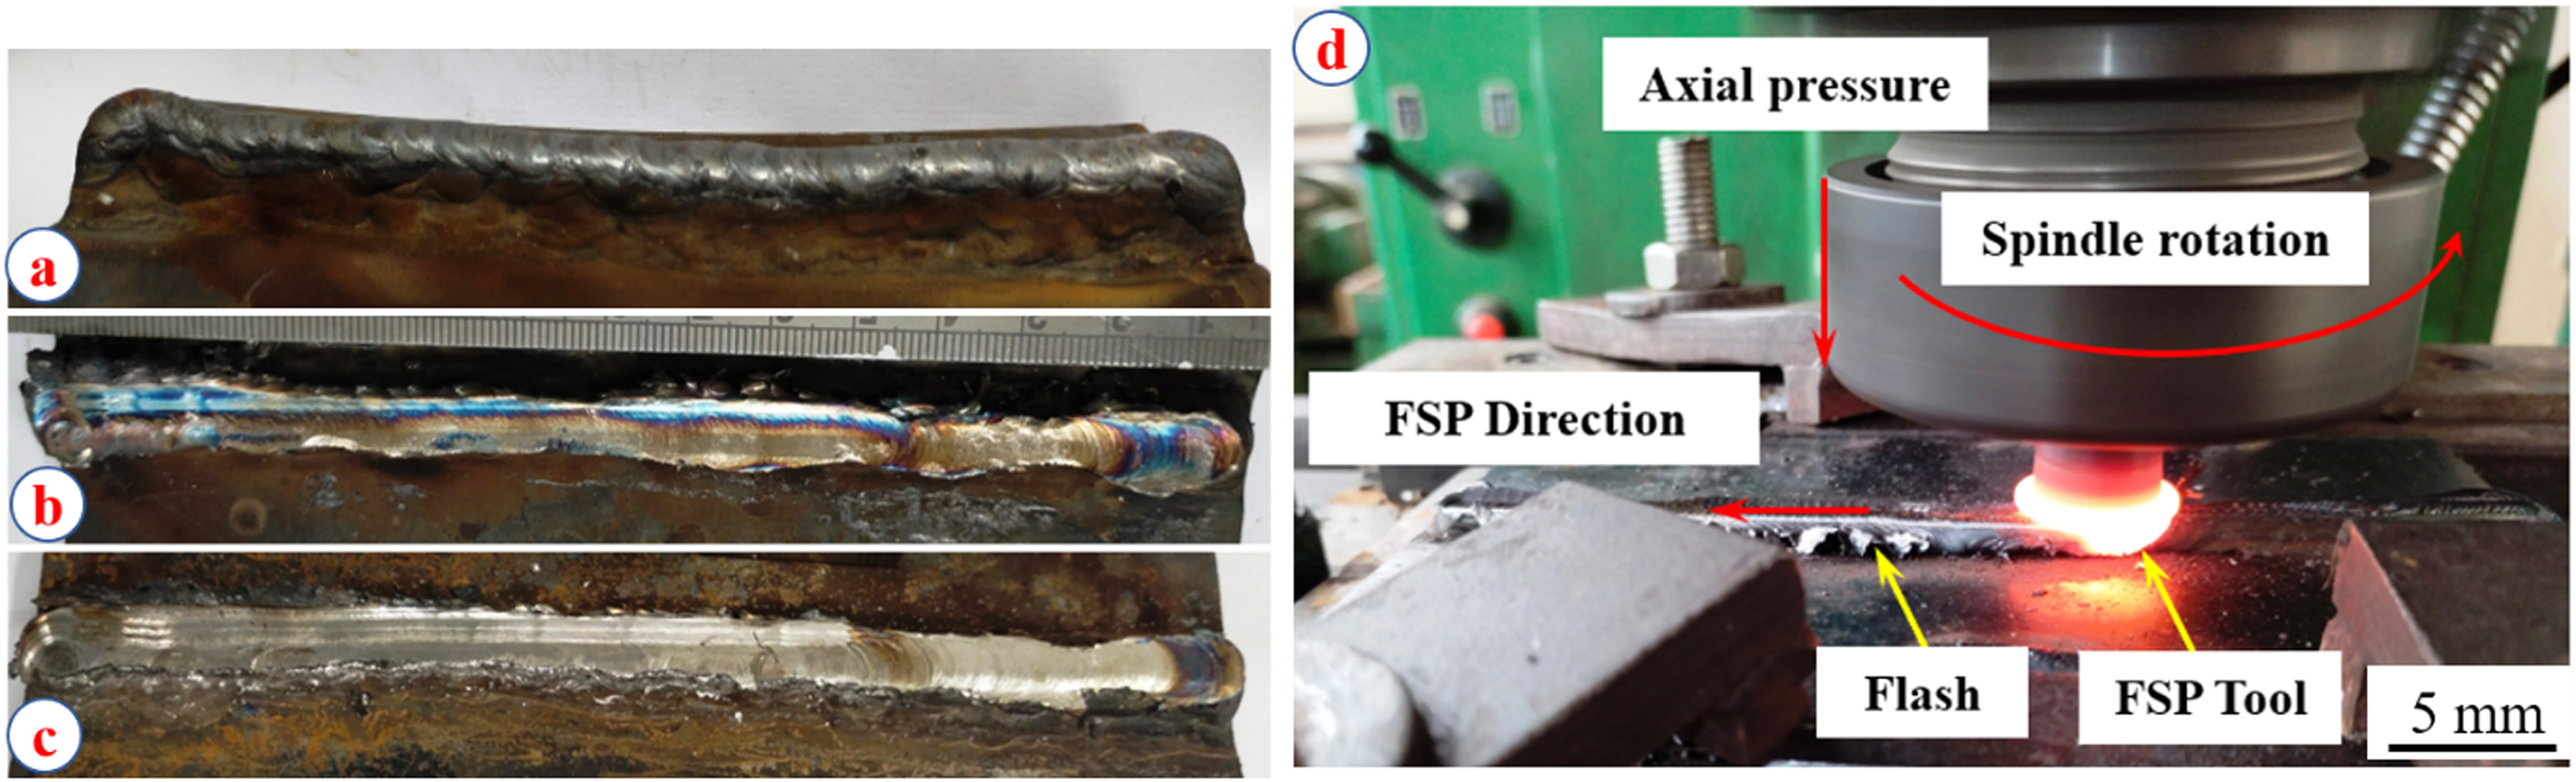
WAAM fabricated thin-walled FGM sample (a) as a deposited sample, (b) sample after FSP, (c) sample after FSP with water cooling and (d) FSP of the deposited sample.
HTHPD parameters.
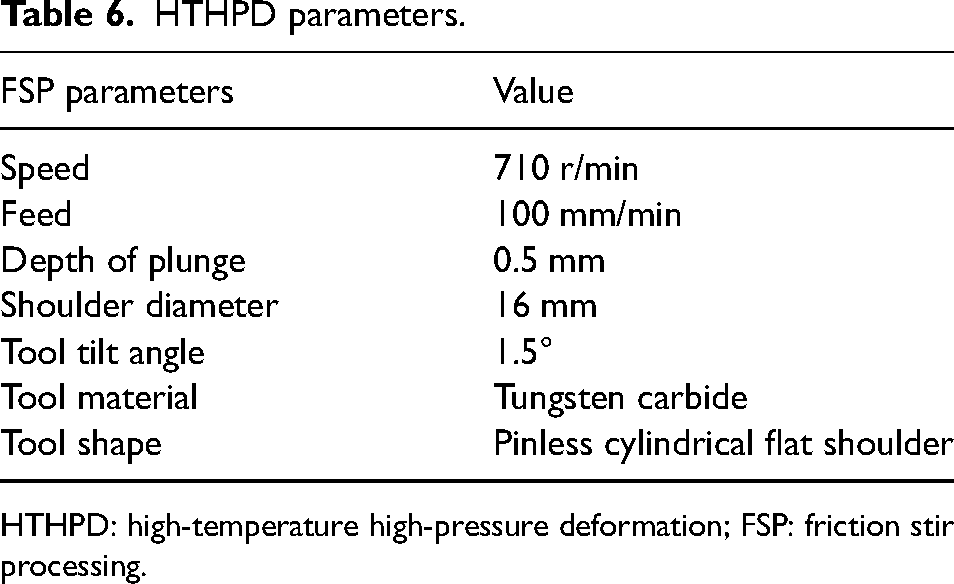
HTHPD: high-temperature high-pressure deformation; FSP: friction stir processing.
Sample extraction and characterization
Metallographic and mechanical test samples are extracted from the fabricated FGM wall sample for further investigation. Metallographic samples are ground and polished according to standard procedures, then etched by a reagent containing 70% volume of HCl and 30% volume of HNO3. The microstructure has been examined by optical micrography and scanning electron microscopy (SEM). The elemental distribution in different regions of the samples has been determined by energy-dispersive X-ray spectroscopy (EDS). An X-ray diffractometer (XRD) is used to identify phase formation. The compositional variation of the deposited sample is shown in Figure 5(a). To observe the effect of compositional variation on strength, three tensile specimens are extracted from each FGM wall sample at three different locations (1, 2, and 3), as shown in Figure 5(b). The miniature tensile samples are prepared 33 and the dimensions are presented in Figure 5(c). The prepared tensile sample by wire electric discharge machining is presented in Figure 5(d). The Vickers microhardness profile of the fabricated samples has also been measured using a microhardness tester (BHV1000) at a load of 200 g and a dwell time of 15 s Indentations are made at the weld pool centre line at 1 mm intervals from the fusion line to the top layer, as shown in Figure 6. The hardness of each FGM sample has been measured.
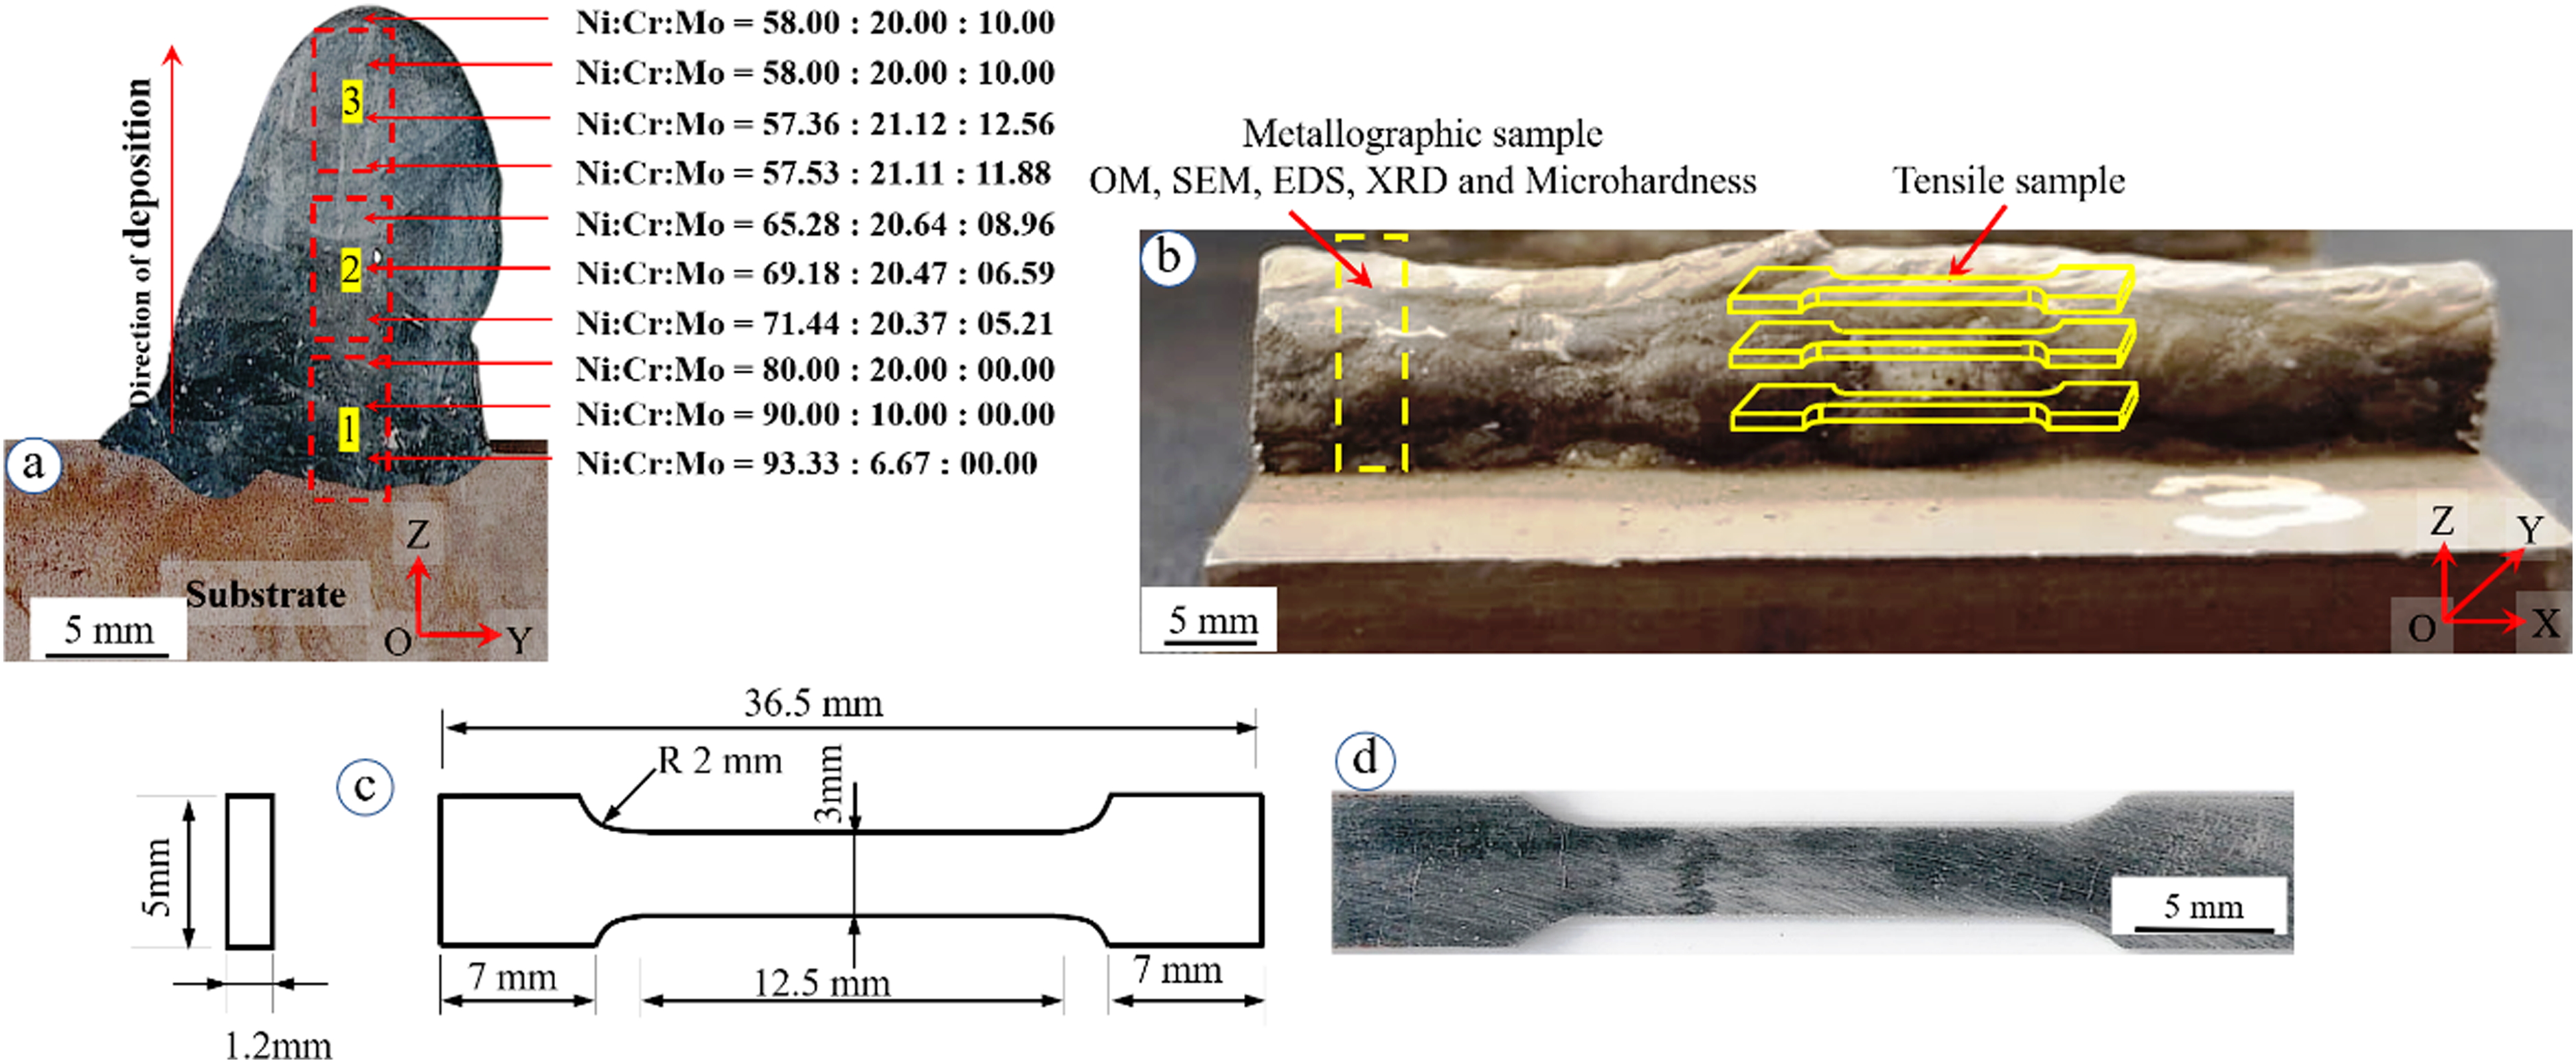
(a) Approximate representation of composition, (b) schematic representations of sample extraction, (c) tensile sample and (d) prepared tensile sample.
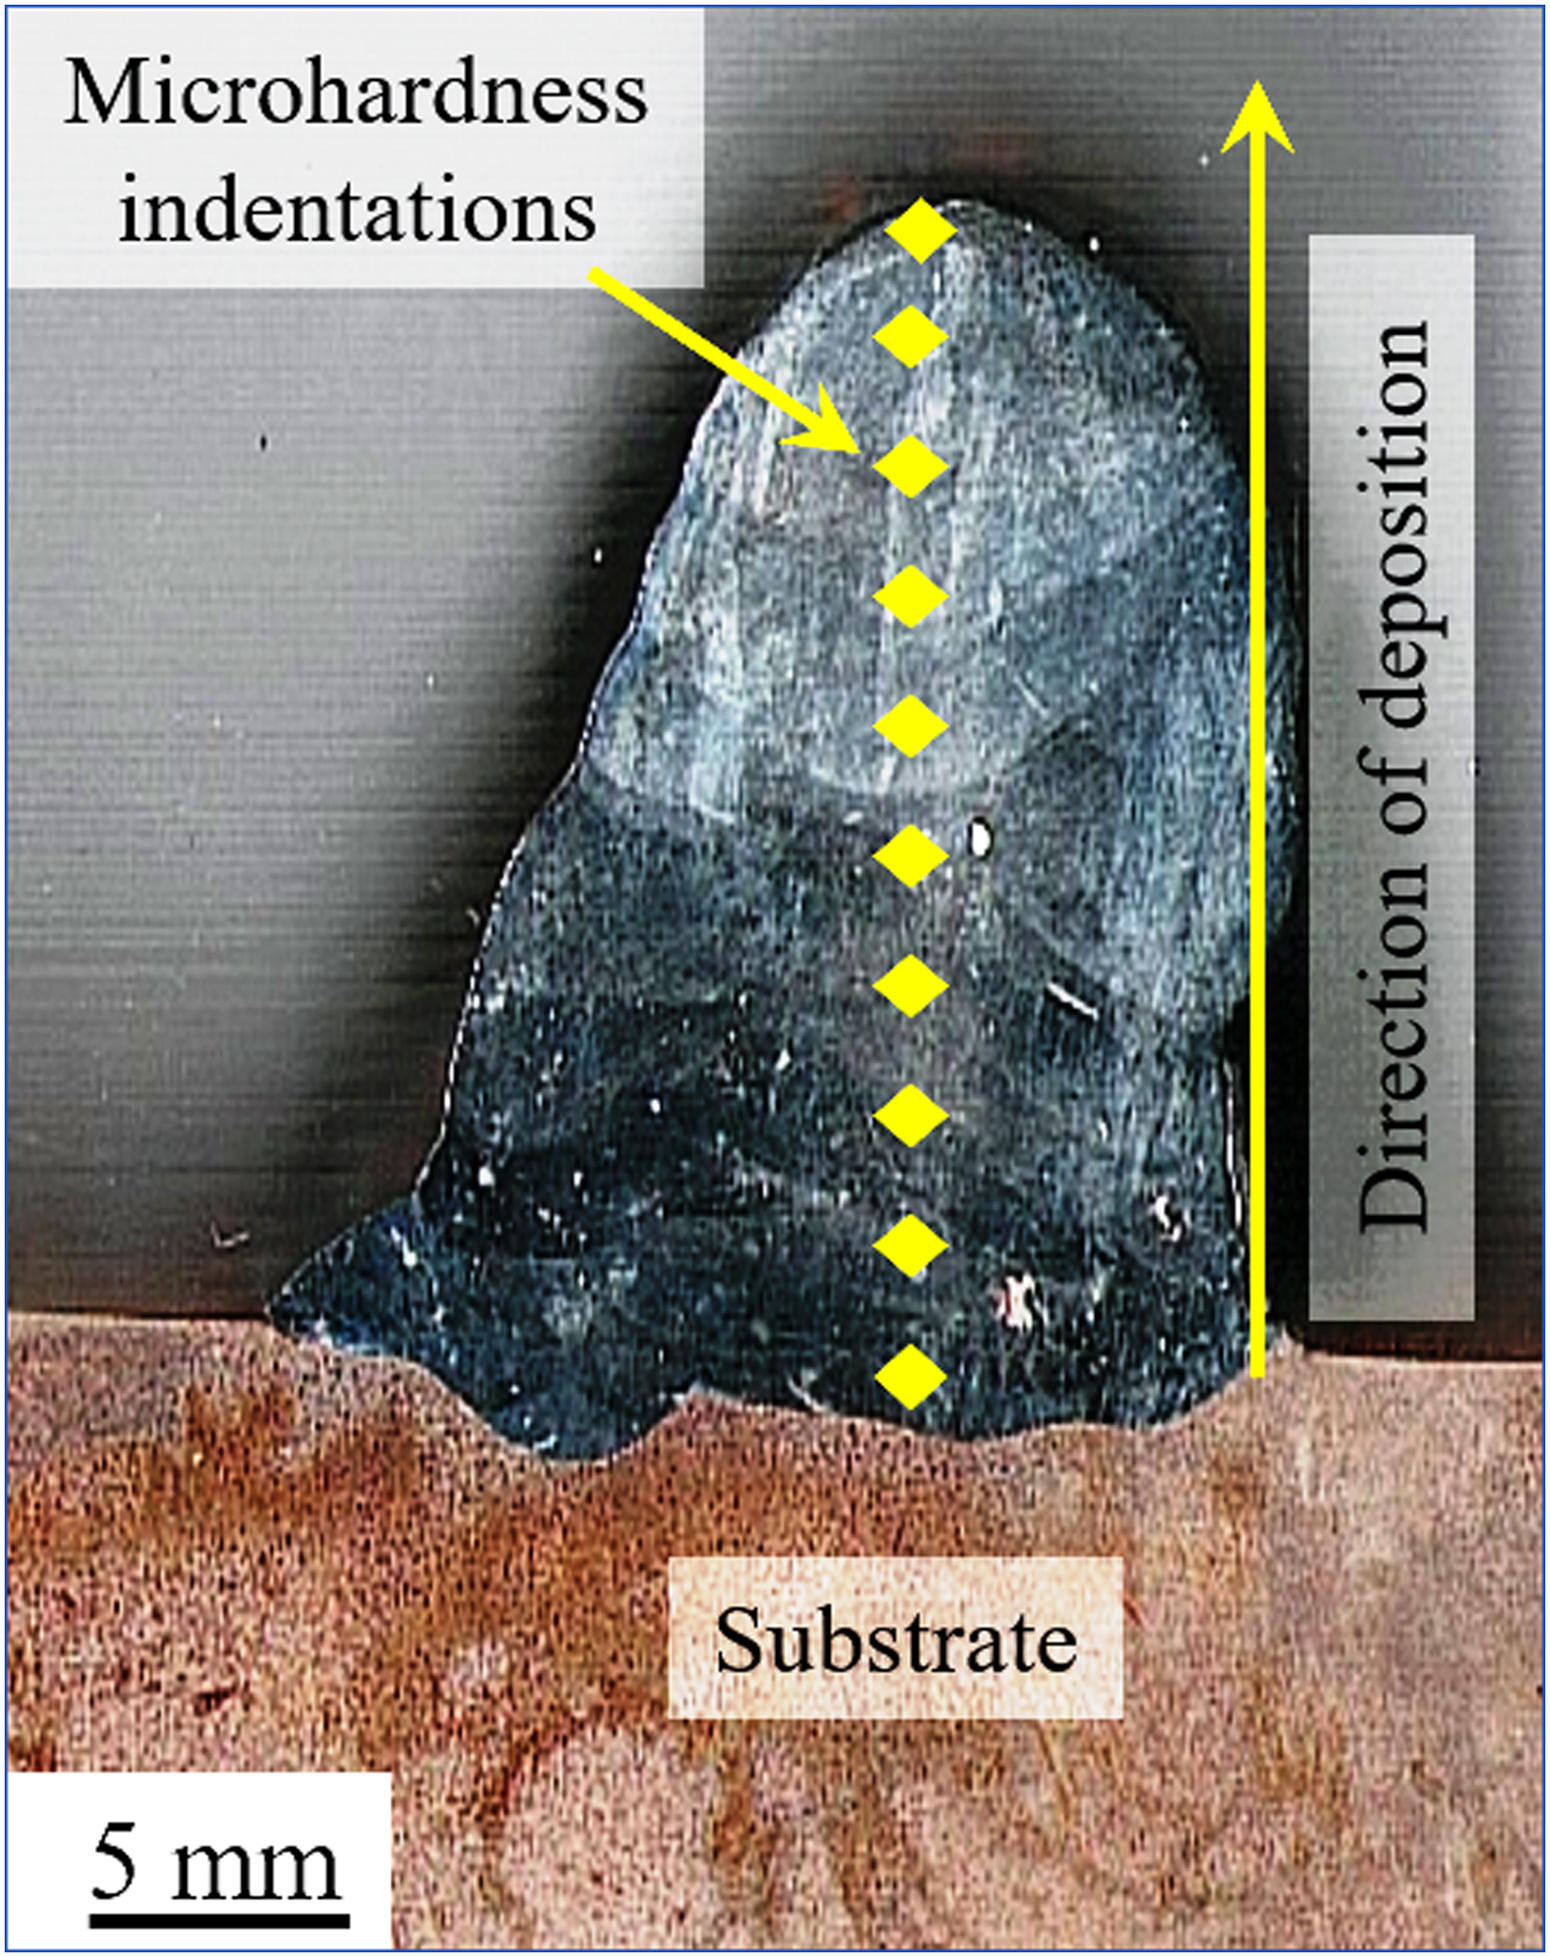
Illustration of hardness measurement along the deposition height.
Results and discussion
Microstructural characterization
The WAAM deposited FGM sample has been subjected to macro and microscopic examination. Figure 7(a) to (c) shows the microstructure of as-deposited, HTHPD-A and HTHPD-W samples, respectively, at three different locations (1, 2, and 3). As-deposited walls exhibit dendrites and columnar grains as a result of varying solidification patterns within the layers. 34 In this sample, near to substrate, course columnar grains are first observed, and then their size gradually decreases at location 2 and as they approach the top layer, the grain sizes increase again at location 3 and the dendrite structure has been observed, as shown in Figure 7(a). However, in the HTHPD-A, little large columnar and equiaxed grains appeared due to recrystallization caused by high-temperature frictional deformation in an air-cooled environment, as shown in Figure 7(b). The small columnar and equiaxed grains have been observed in HTHPD-W samples due to recrystallization and quenching effect during frictional deformation in the water-cooled environment, as shown in Figure 7(c). Figure 7(d) shows the average grain size distribution along the deposition height in all samples. From this figure, it is observed that the size of grain along the deposition height in the as-deposited sample initially decreases and then slightly increases while HTHPD-A and HTHPD-W show continuous increases in grain size. This variation in grain size occurred due to a variation in cooling rate which decreases as the distance from the substrate increases. The grain size also depends on the post-deposition processing and it is observed that in the HTHPD-A condition grain size is higher than in deposited and HTHPD-W samples.
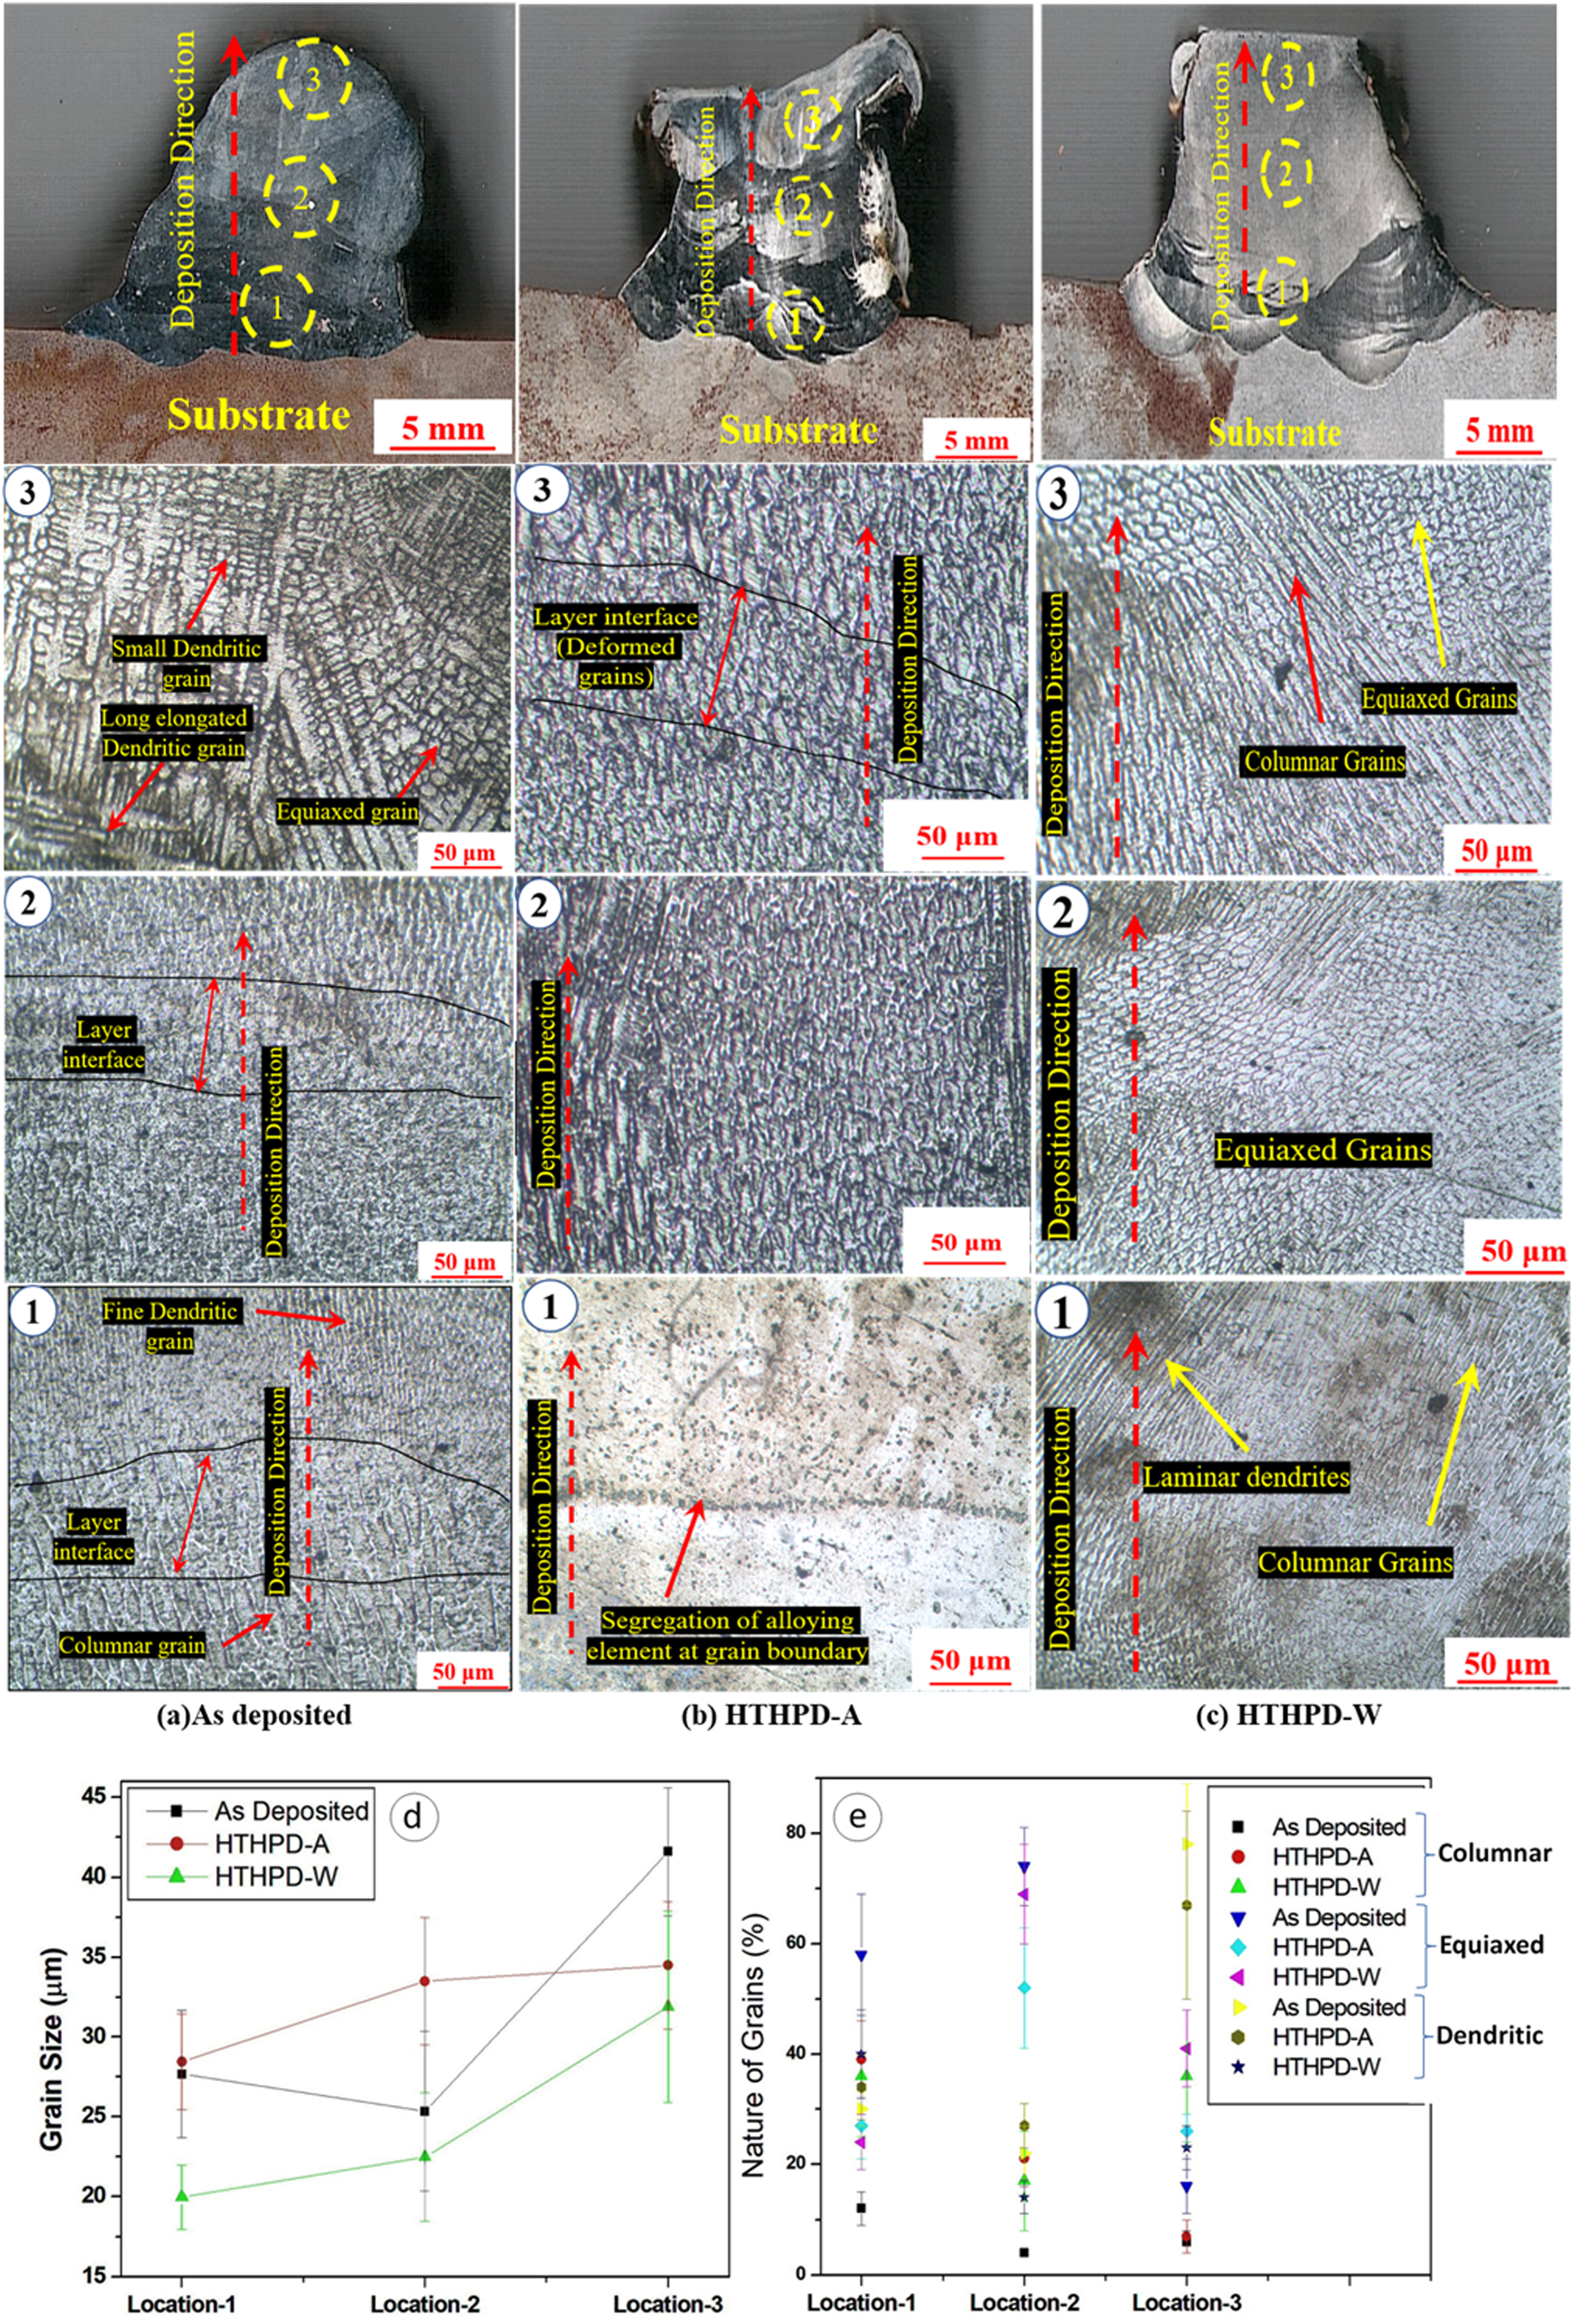
Macro and microstructure evolution of (a) as-deposited, (b) HTHPD-A and (c) HTHPD-W; (d) average grain size distribution and (e) distribution of grains (%).
It happens because the deformation of material takes place at high temperatures and pressures. However, at the same time, the frictional heat, along with the deposition of the next layer, causes excessive reheating of the deposited sample. Thus, the overall heat HTHPD-A process is higher, which enriches the formation of columnar grains. Nevertheless, in the case of HTHPD-W, the heat extraction is speedy; thus, smaller grain size formation occurs. When the next layer is deposited, grain growth will take place, but it is lower than in the case of the HTHPD-A sample.
It is also observed that the grain structure is different at different spots of the deposited material. This variation in the grain structure occurred due to different cooling rates. This cooling rate causes the formation of a mixture of grain structures during deposition. So far to obtain a proper understanding of the nature of grain structure at different spots, the percentage of different grain structures has been measured along the deposition height for all samples. This percentage has been calculated with the help of multiple micrographs taken from optical microscopy at three different locations (i.e. location 1, location 2 and location 3) and their average is presented in Figure 7(e). It is observed that columnar grains increase from bottom to top in all samples due to larger heat accumulation and lower cooling rates. But the largest columnar grain is observed in HTHPD-A samples.
EDS analysis
In order to obtain a clear indication of compositional gradient and deformation behaviour in the fabricated wall, the composition analysis has been carried out in all conditions. Figure 8(a) shows an as-deposited sample along which EDS mapping has been done from the substrate to the top layer. Figure 8(b) shows a low-magnification SEM image of the sample used for EDS mapping. Figure 8(c) shows variations in the concentration of different alloying elements in the deposited sample along the deposition height. It is clear from this image that the variation of elements is there in different layers. This elemental variation is obvious because of the variation in the concentration of alloying elements during deposition. The EDS analysis also shows that the micro-segregation of alloying elements is not present in the deposited sample. However, the concentration gradient of different elements is present during different layers of the deposited sample. The concentration of each element is also mapped with EDS analysis. Figure 8(d) shows that the concentration gradient of Ni is decreasing along the height, along with that, Ni-rich bands also appeared in EDS mapping, which may be due to dilution and macro segregation in between layers due to remelting of the deposited layer. But other alloying elements such as chromium and molybdenum gradually increase along the height of the fabricated sample, as shown in Figure 8(e) and (f), respectively. The segregation of these elements is not visible much by EDS analysis.
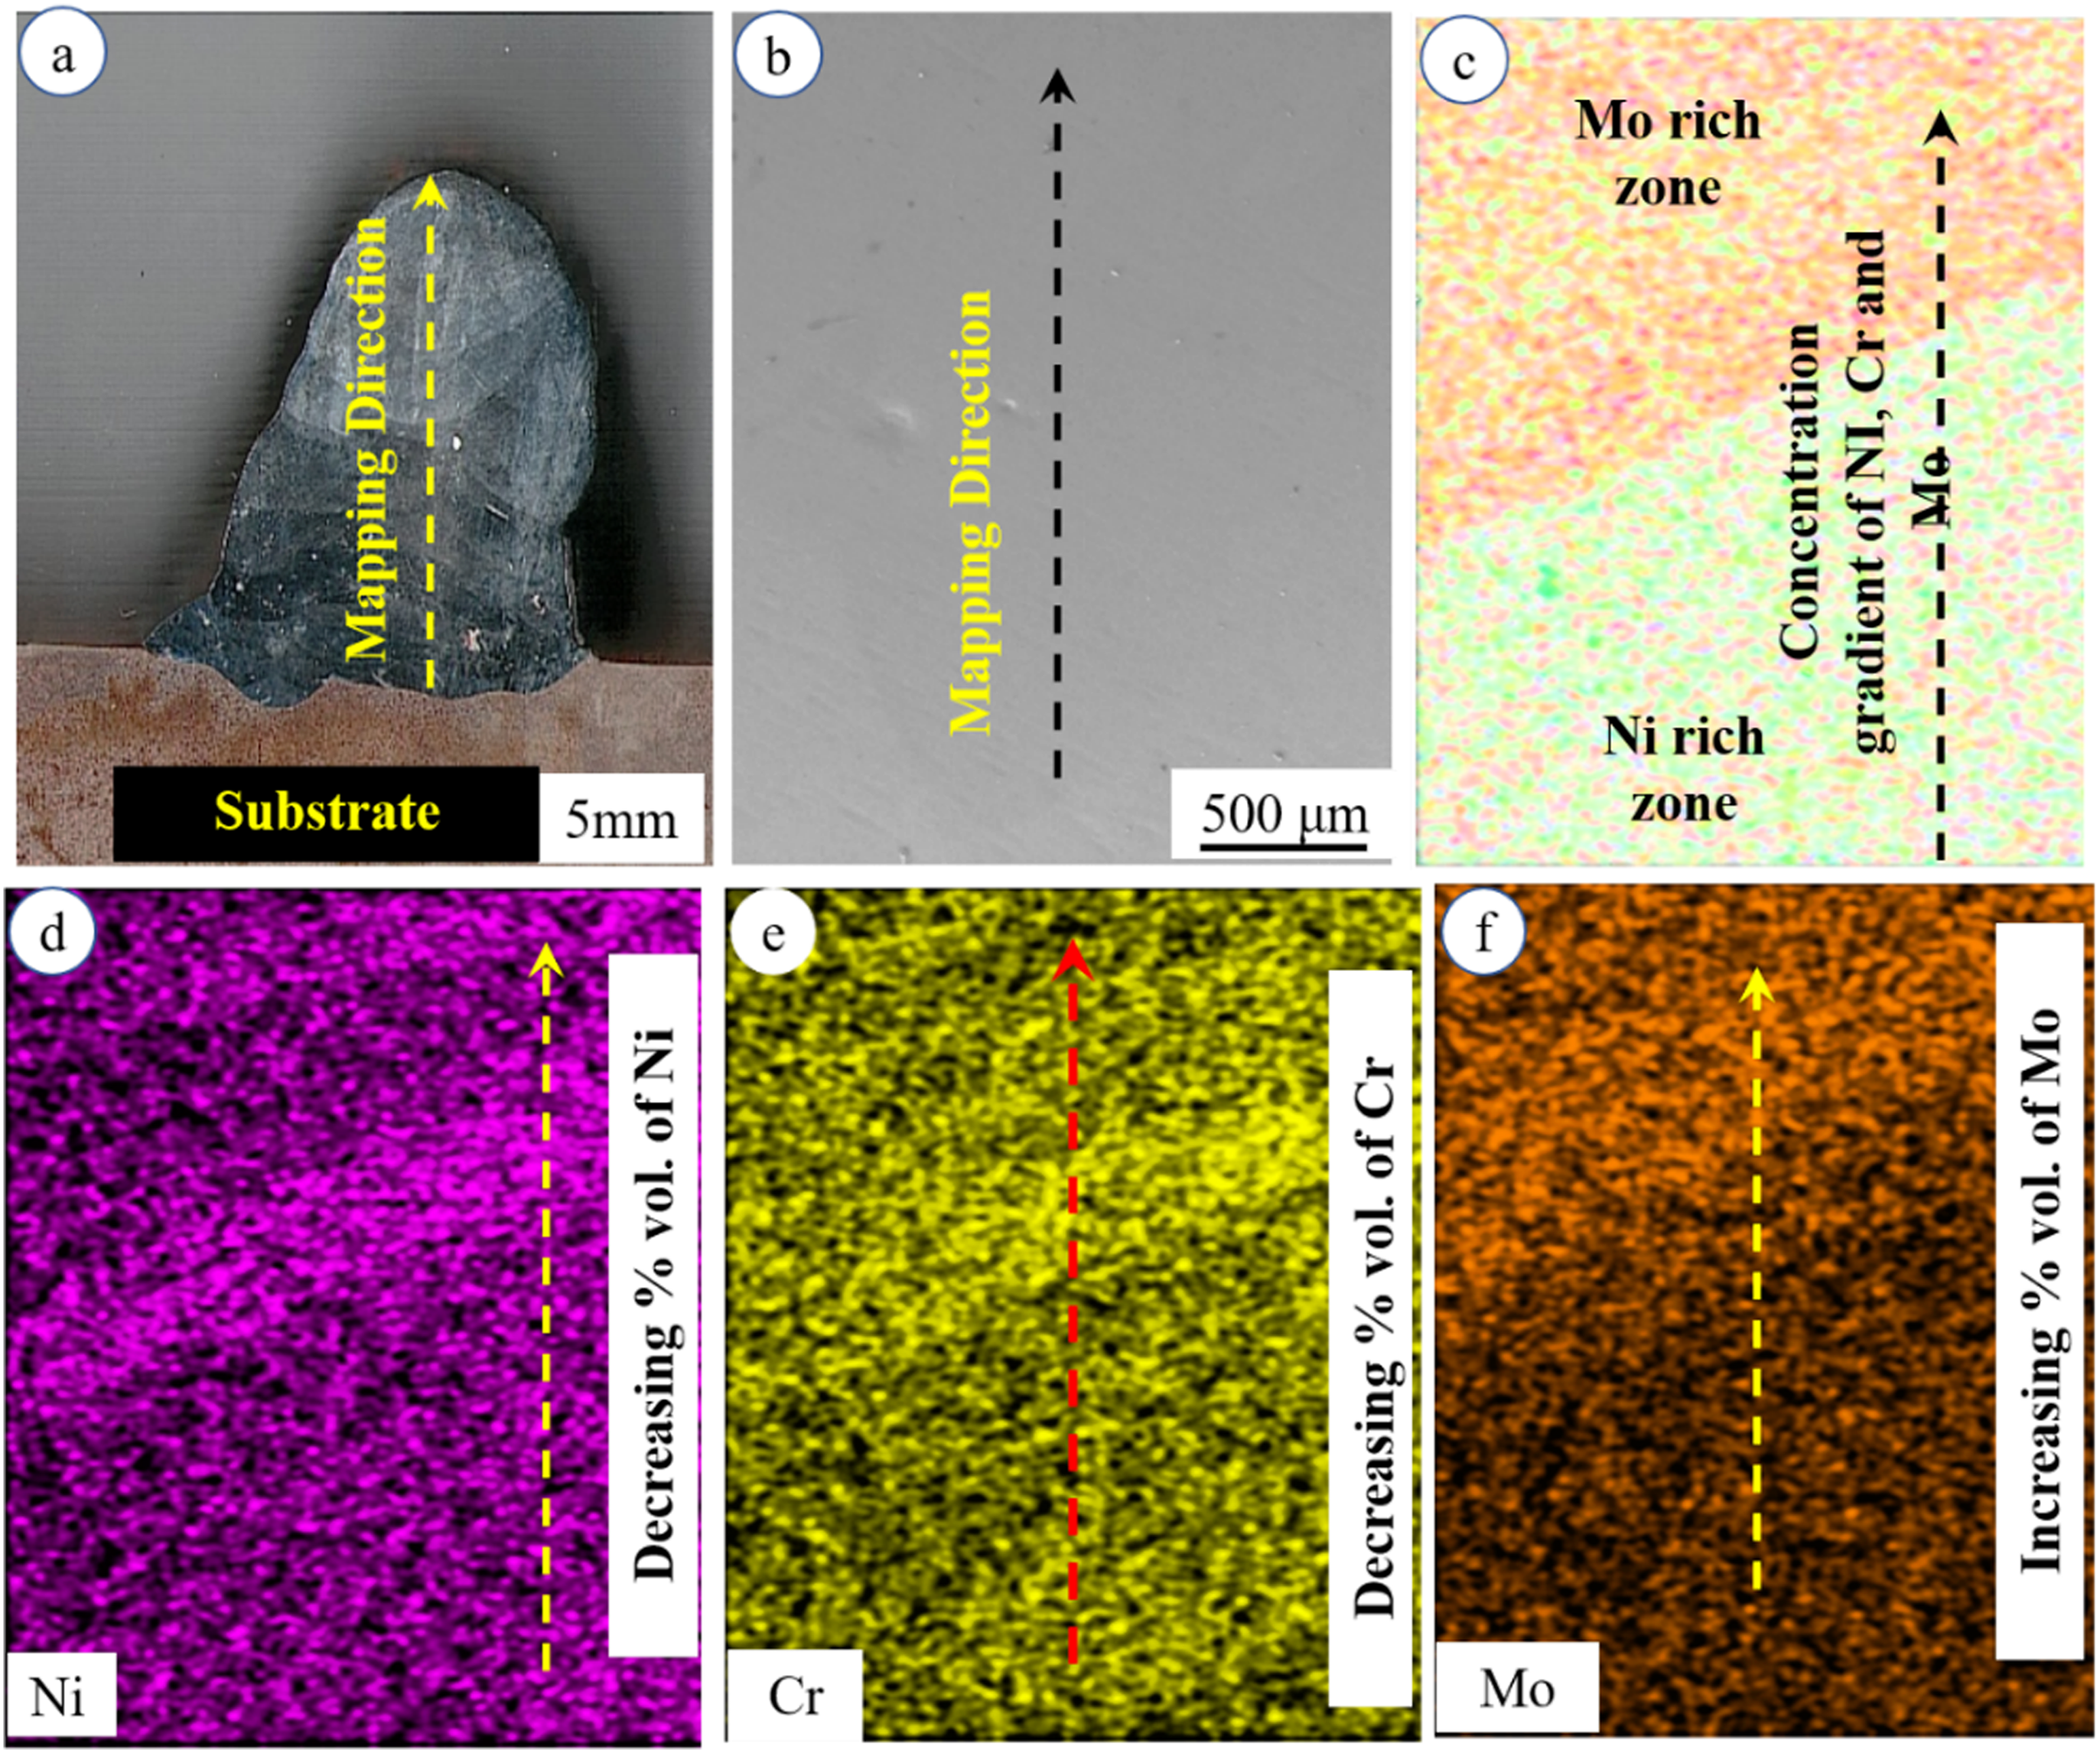
(a) Macrostructure of the deposited sample, (b) SEM of the deposited sample (c) EDS mapping, (d) variation of Ni, (e) variation of Cr and (f) variation of Mo.
Figure 9(a) shows the HTHPD sample in air cooing condition shows different bands of deposited layers. In this sample, due to friction and pressure, deformation occurred on the deposited material. The deformation regions are properly visualized and represented by the red dotted line. The EDS mapping has been done along the height of the deposited sample (Figure 9(b)) to identify the effect of high temperature and pressure deformation on the distribution of alloying elements in an air-cooling environment. Figure 9(c) shows the EDS mapping alloying of different alloying elements such as Ni, Cr and Mo along the height. Nickel percentage towards deposition direction decreases, but the variation is more uniform due to reheating while high-temperature deformation as compared to the as-deposited sample as shown in Figure 9(d). A similar pattern is correspondingly observed in the case of the distribution of Cr and Mo elements as shown in Figure 9(e) and (f), respectively.
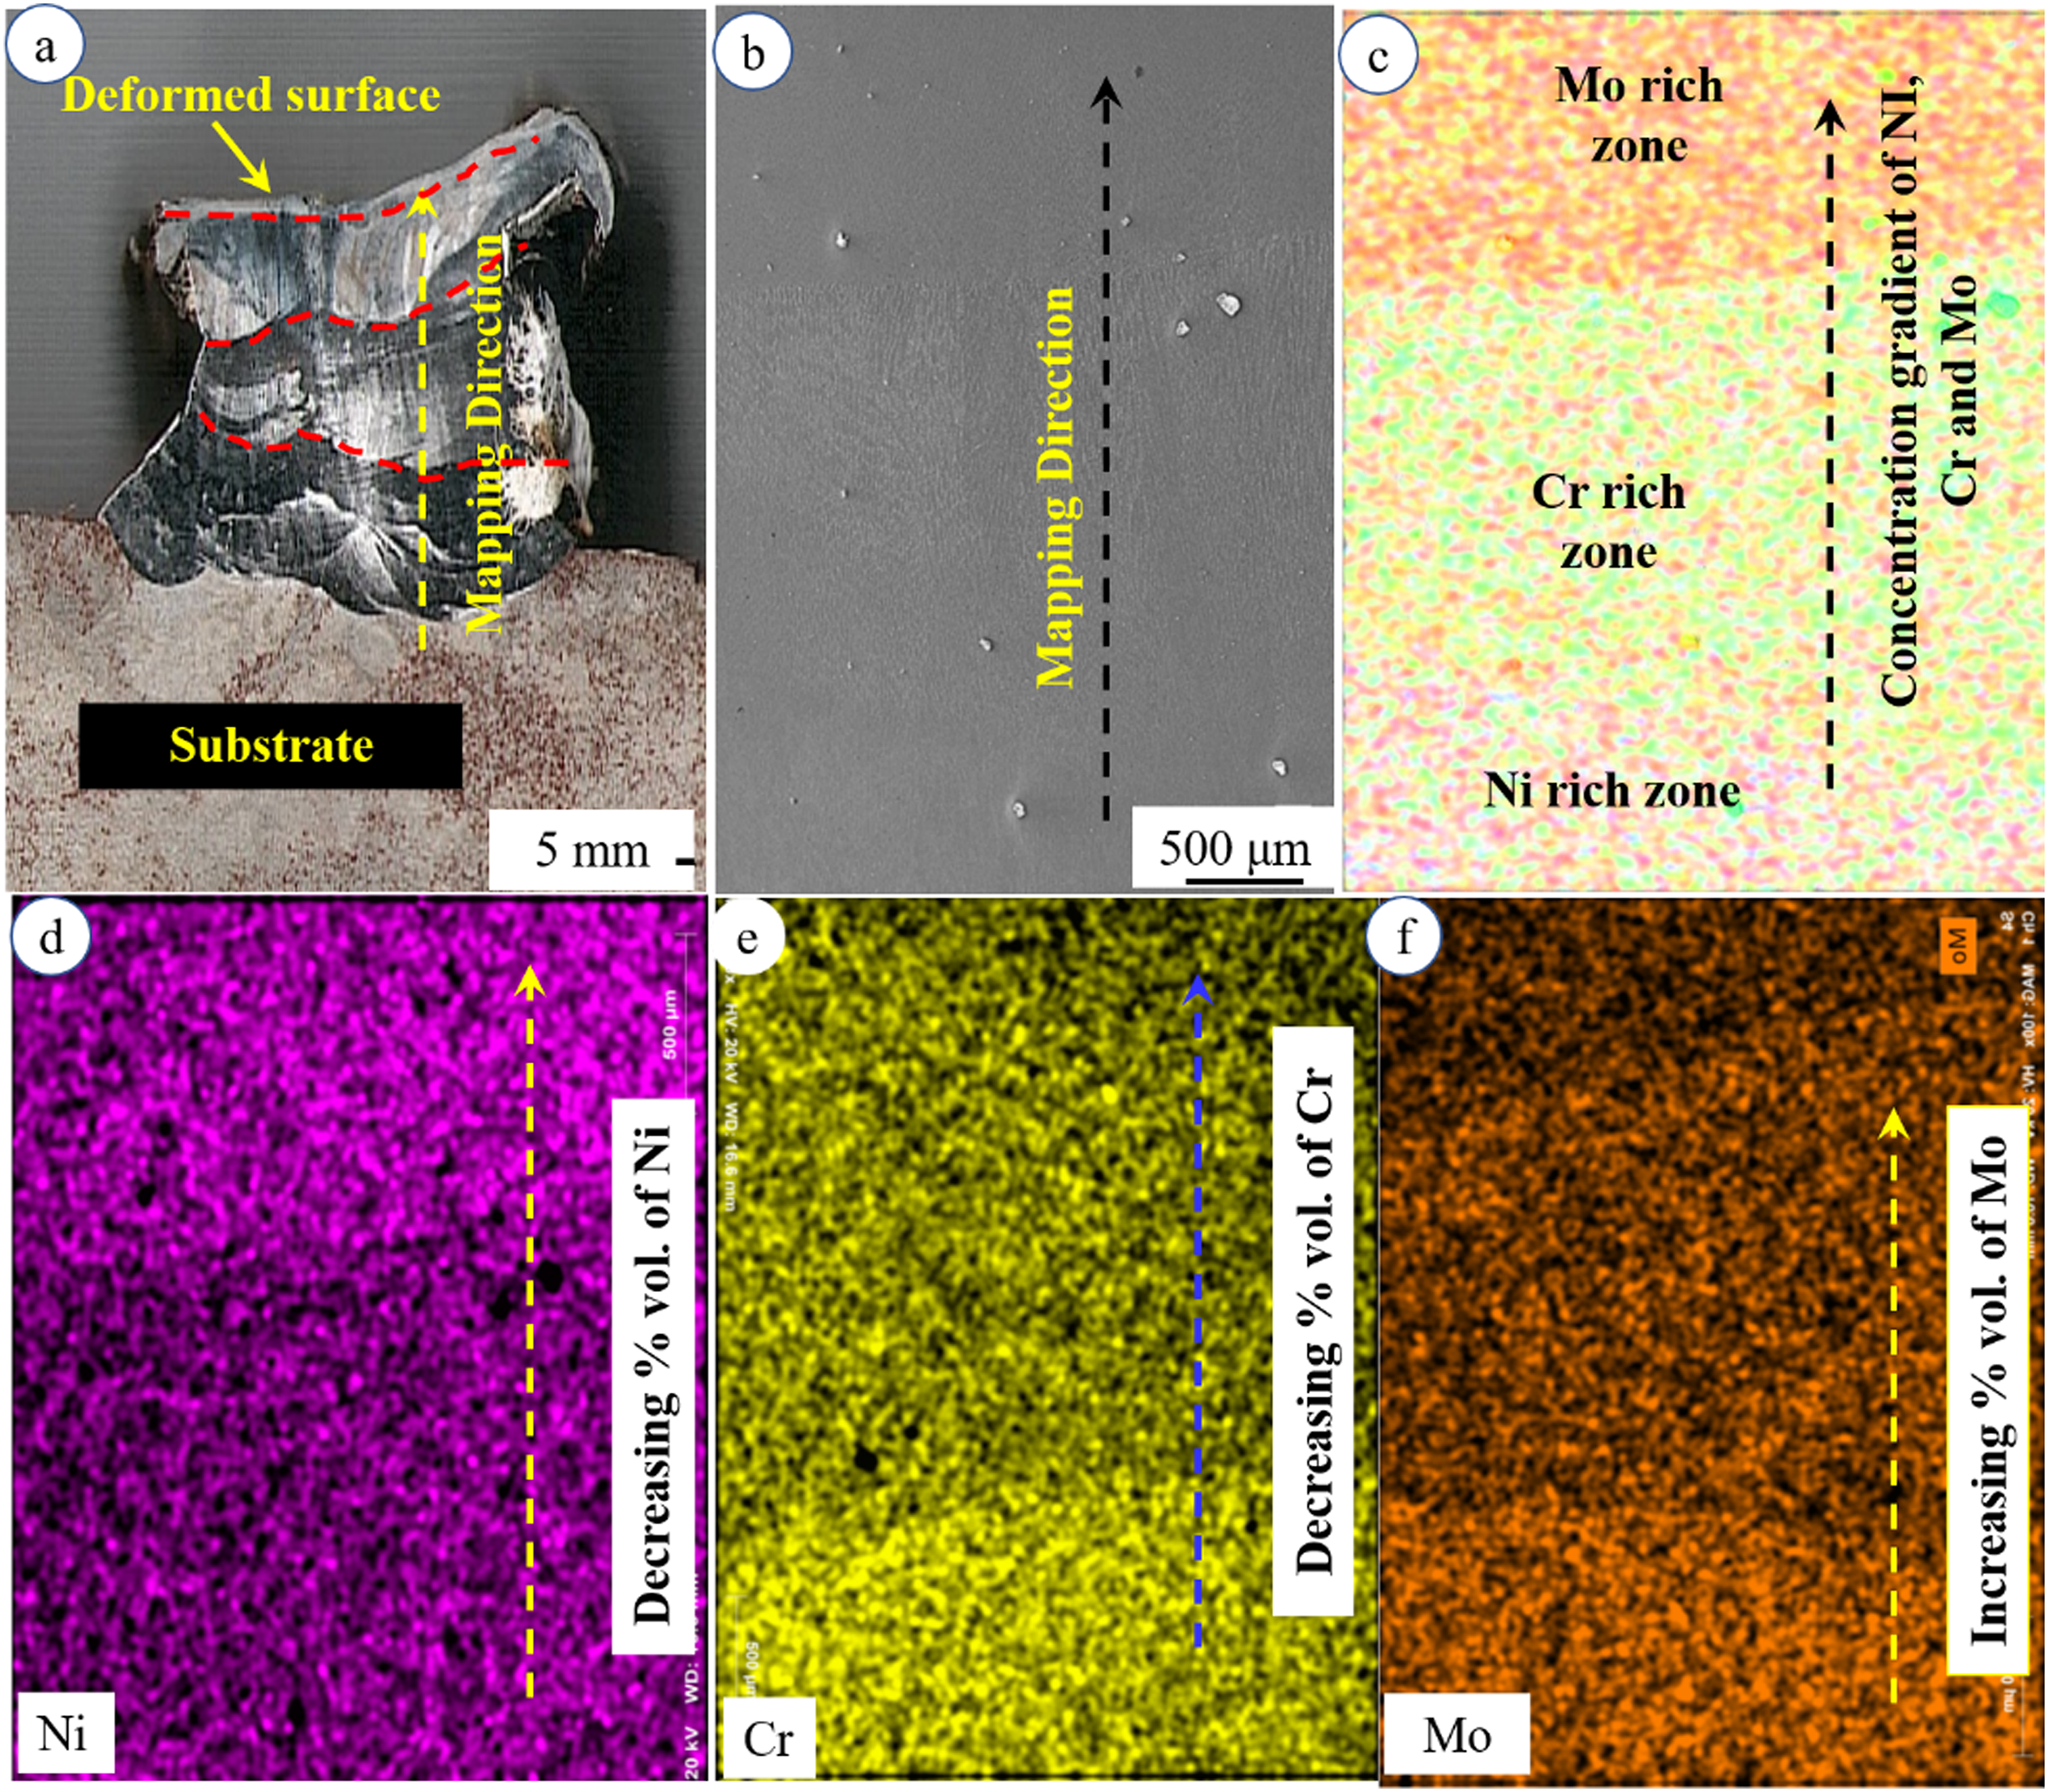
(a) Macrostructure of HTHPD-A sample, (b) SEM of HTHPD-A sample, (c) EDS mapping, (d) variation of Ni, (e) variation of Cr and (f) variation of Mo.
Figure 10(a) shows the deposited sample at HTHPD with water-cooling conditions. The EDS mapping (Figure 10(b)) reveals the distribution of the constituent alloying elements (Ni, Cr and Mo) along the deposition height, as shown in Figure 10(c). Nickel percentage along the deposition height decreases similarly to other samples. Nevertheless, the variation is more uniform as compared to as-deposited and HTHPD-A samples as shown in Figure 10(d), and is also true with other alloying elements such as Cr and Mo, as shown in Figure 10(e) and (f).
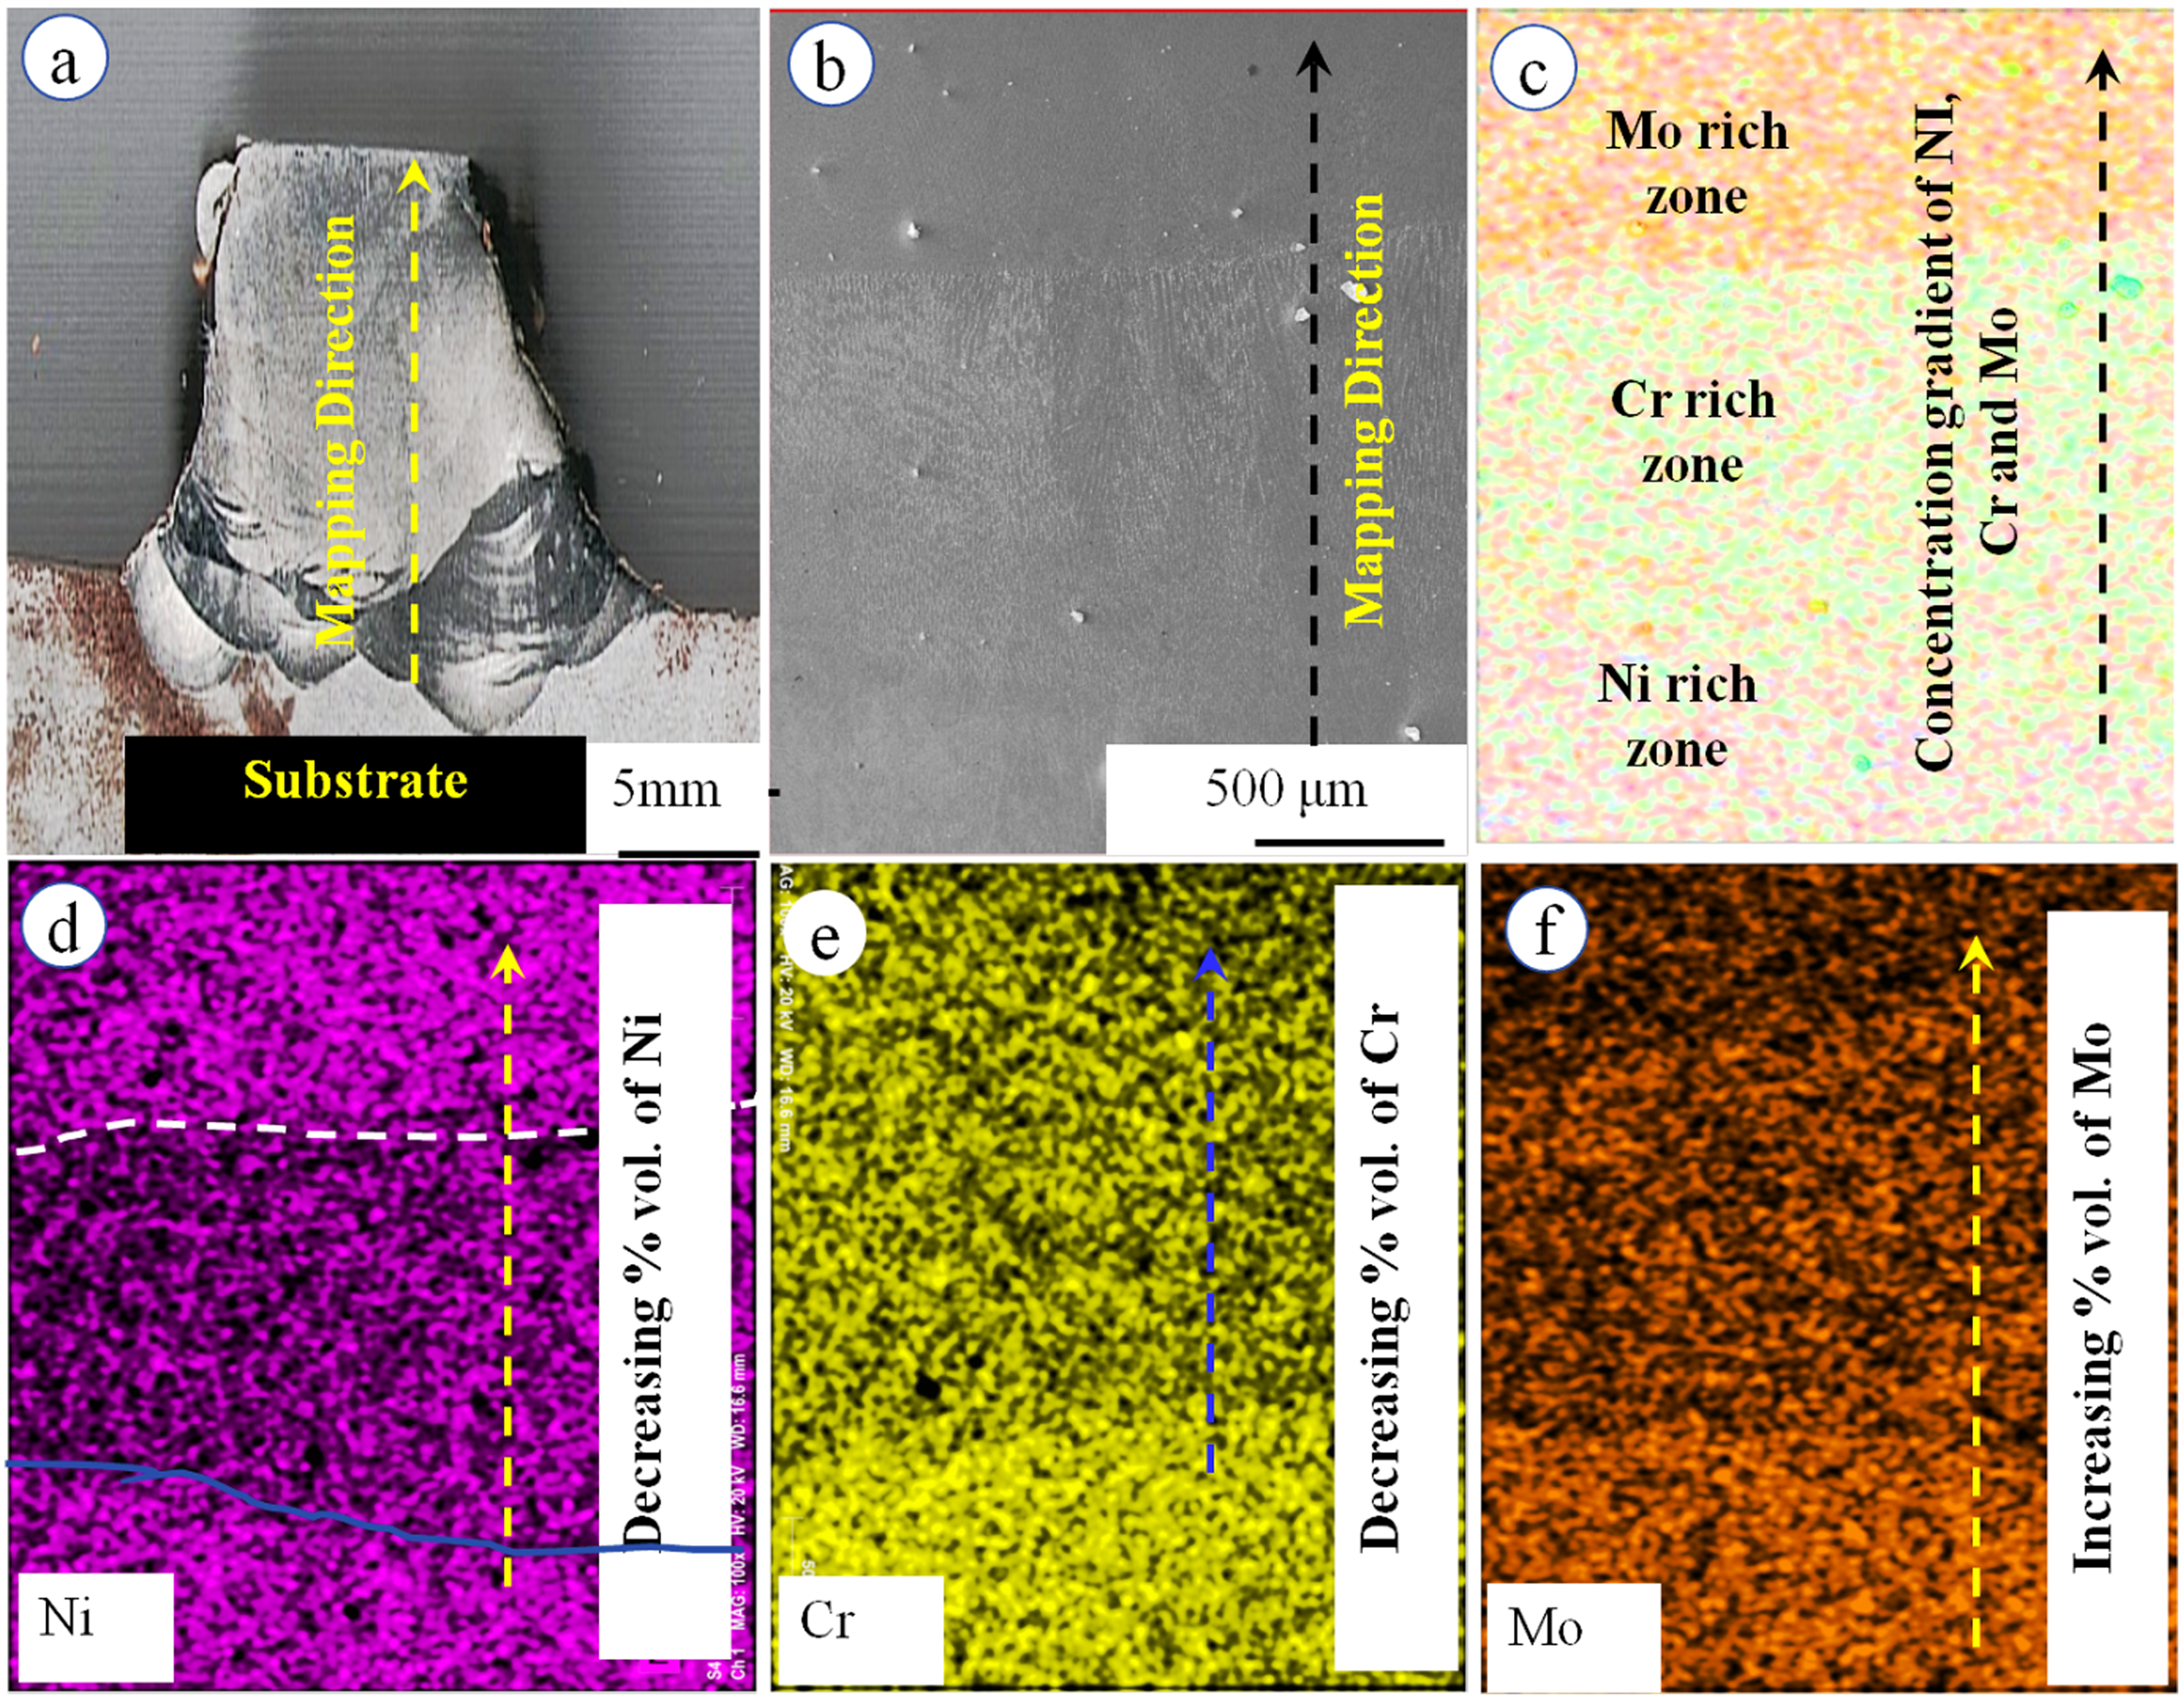
(a) Macrostructure of HTHPD-W sample, (b) SEM of HTHPD-W sample, (c) EDS mapping, (d) variation of Ni, (e) variation of Cr and (f) variation of Mo.
SEM analysis
The SEM microstructural evolution of the deposited FGM with different processing conditions is shown in Figure 11. Figure 11(a) shows the microstructure of the as-deposited sample. This image shows a clear distinct boundary between two grain patterns. The bottom region shows large columnar grains, formed due to one-direction heat transfer in the deposited wall. The grain structure varies on top having similar grain but lower in size. This grain structure is observed because of the next layer deposition of material on the previous layer, and the bottom zone of this newly deposited layer cools fast which shows smaller columnar grains. In between these two grain structures, a small region of the partially melted zone is observed where defused grain structure has been observed. In the case of WAAM with post-deformation processing, new grains formation occurred with orientation along the processing direction as shown in Figure 11(b). The change in the orientation of the new grains was observed due to plastic deformation and recrystallization of the material at elevated temperatures. The grain size of newly formed deformed dendrites is smaller in the case of water-cooling media over air-cooling media due to faster cooling (Figure 11(c)).
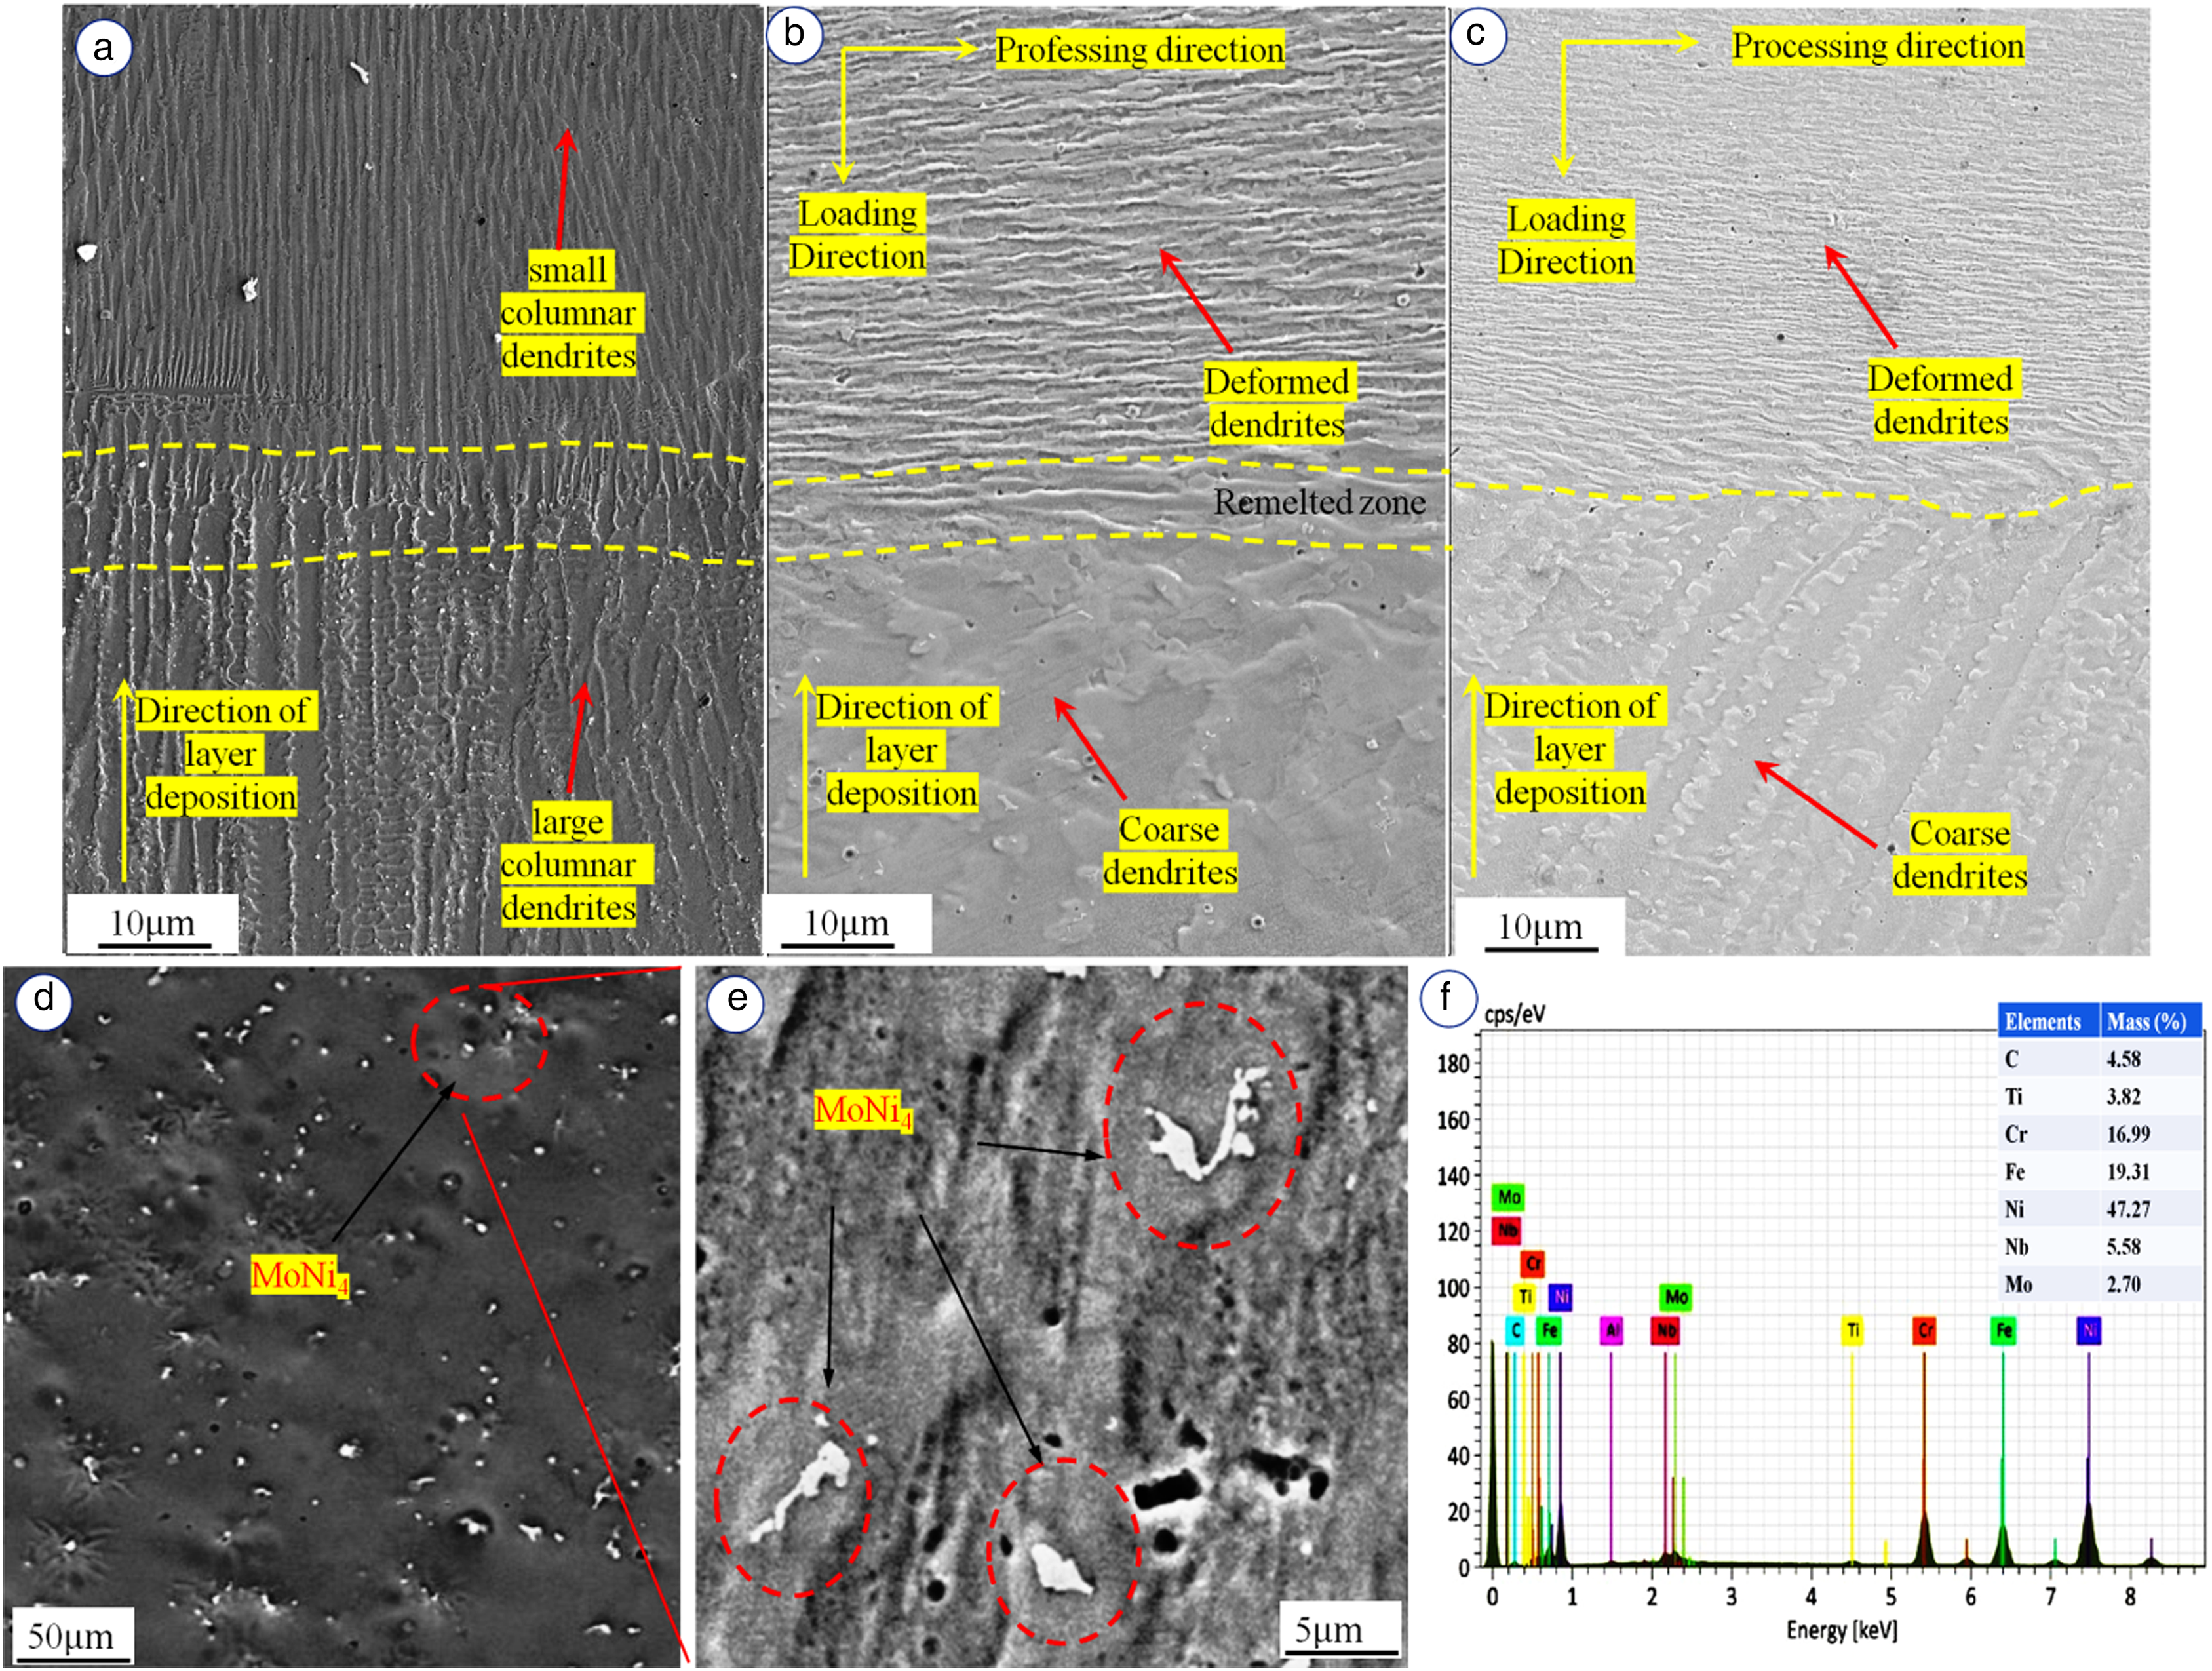
Microstructure of (a) as-deposited, (b) HTHPD-A, (c) HTHPD-W samples, (d) precipitates distribution in deposited material, (e) precipitates at higher magnification and (f) elemental mapping.
Figure 11(d) shows the irregular precipitate distributed in the deposited sample. The higher magnification images of these precipitates are presented in Figure 11(e). The elemental mapping of these precipitates by EDS analysis (Figure 11(f)) shows the A2B type Laves phase. The EDS mapping indicates that principal elements such as Cr, Mo, and Ti are abundant in Laves phase. Laves particles have been identified as Ni + Mo and Ni + Ti, which aligns with the AmBn (A: Ni, Cr and B: Mo, Ti,) such as the Ni4Mo form of Laves phase. 35
Composition and phase analysis
The X-ray diffraction (XRD) analysis has been performed for phase analysis in all deposited samples. The XRD analysis for as-deposited, HTHPD-A and HTHPD-W samples is shown in Figure 12. The XRD peaks in the case of the as-deposited sample appear due to the presence of MoNi4, Ni3.28Ti0.72 and Ni in (111), (022) and (002) crystal plane, but the intensity of peak along (002) is more as compared to (111) and (022). In the case of HTHPD, peaks appeared due to the presence of Mo0.4Ni3.6, Cr1Ni3 and Ni3.28Ti0.72 in (111), (022) and (002) crystal planes. The maximum intensity peak is present in the (002) plane but this peek is much larger than the as-deposited sample, which might be due to high deformation at elevated temperatures. In the case of the HTHPD-W sample, the peaks appeared due to the existence of Cr0.4Ni0.6, Ni0.906Ti0.094 in (111), (022) and (002) crystal planes. In this case, maximum peak intensity appeared at the (111) crystal plane, and it is more significant than as-deposited and HTHPD-A samples while a relatively lower peek appears at the (002) and (022) crystal plane.
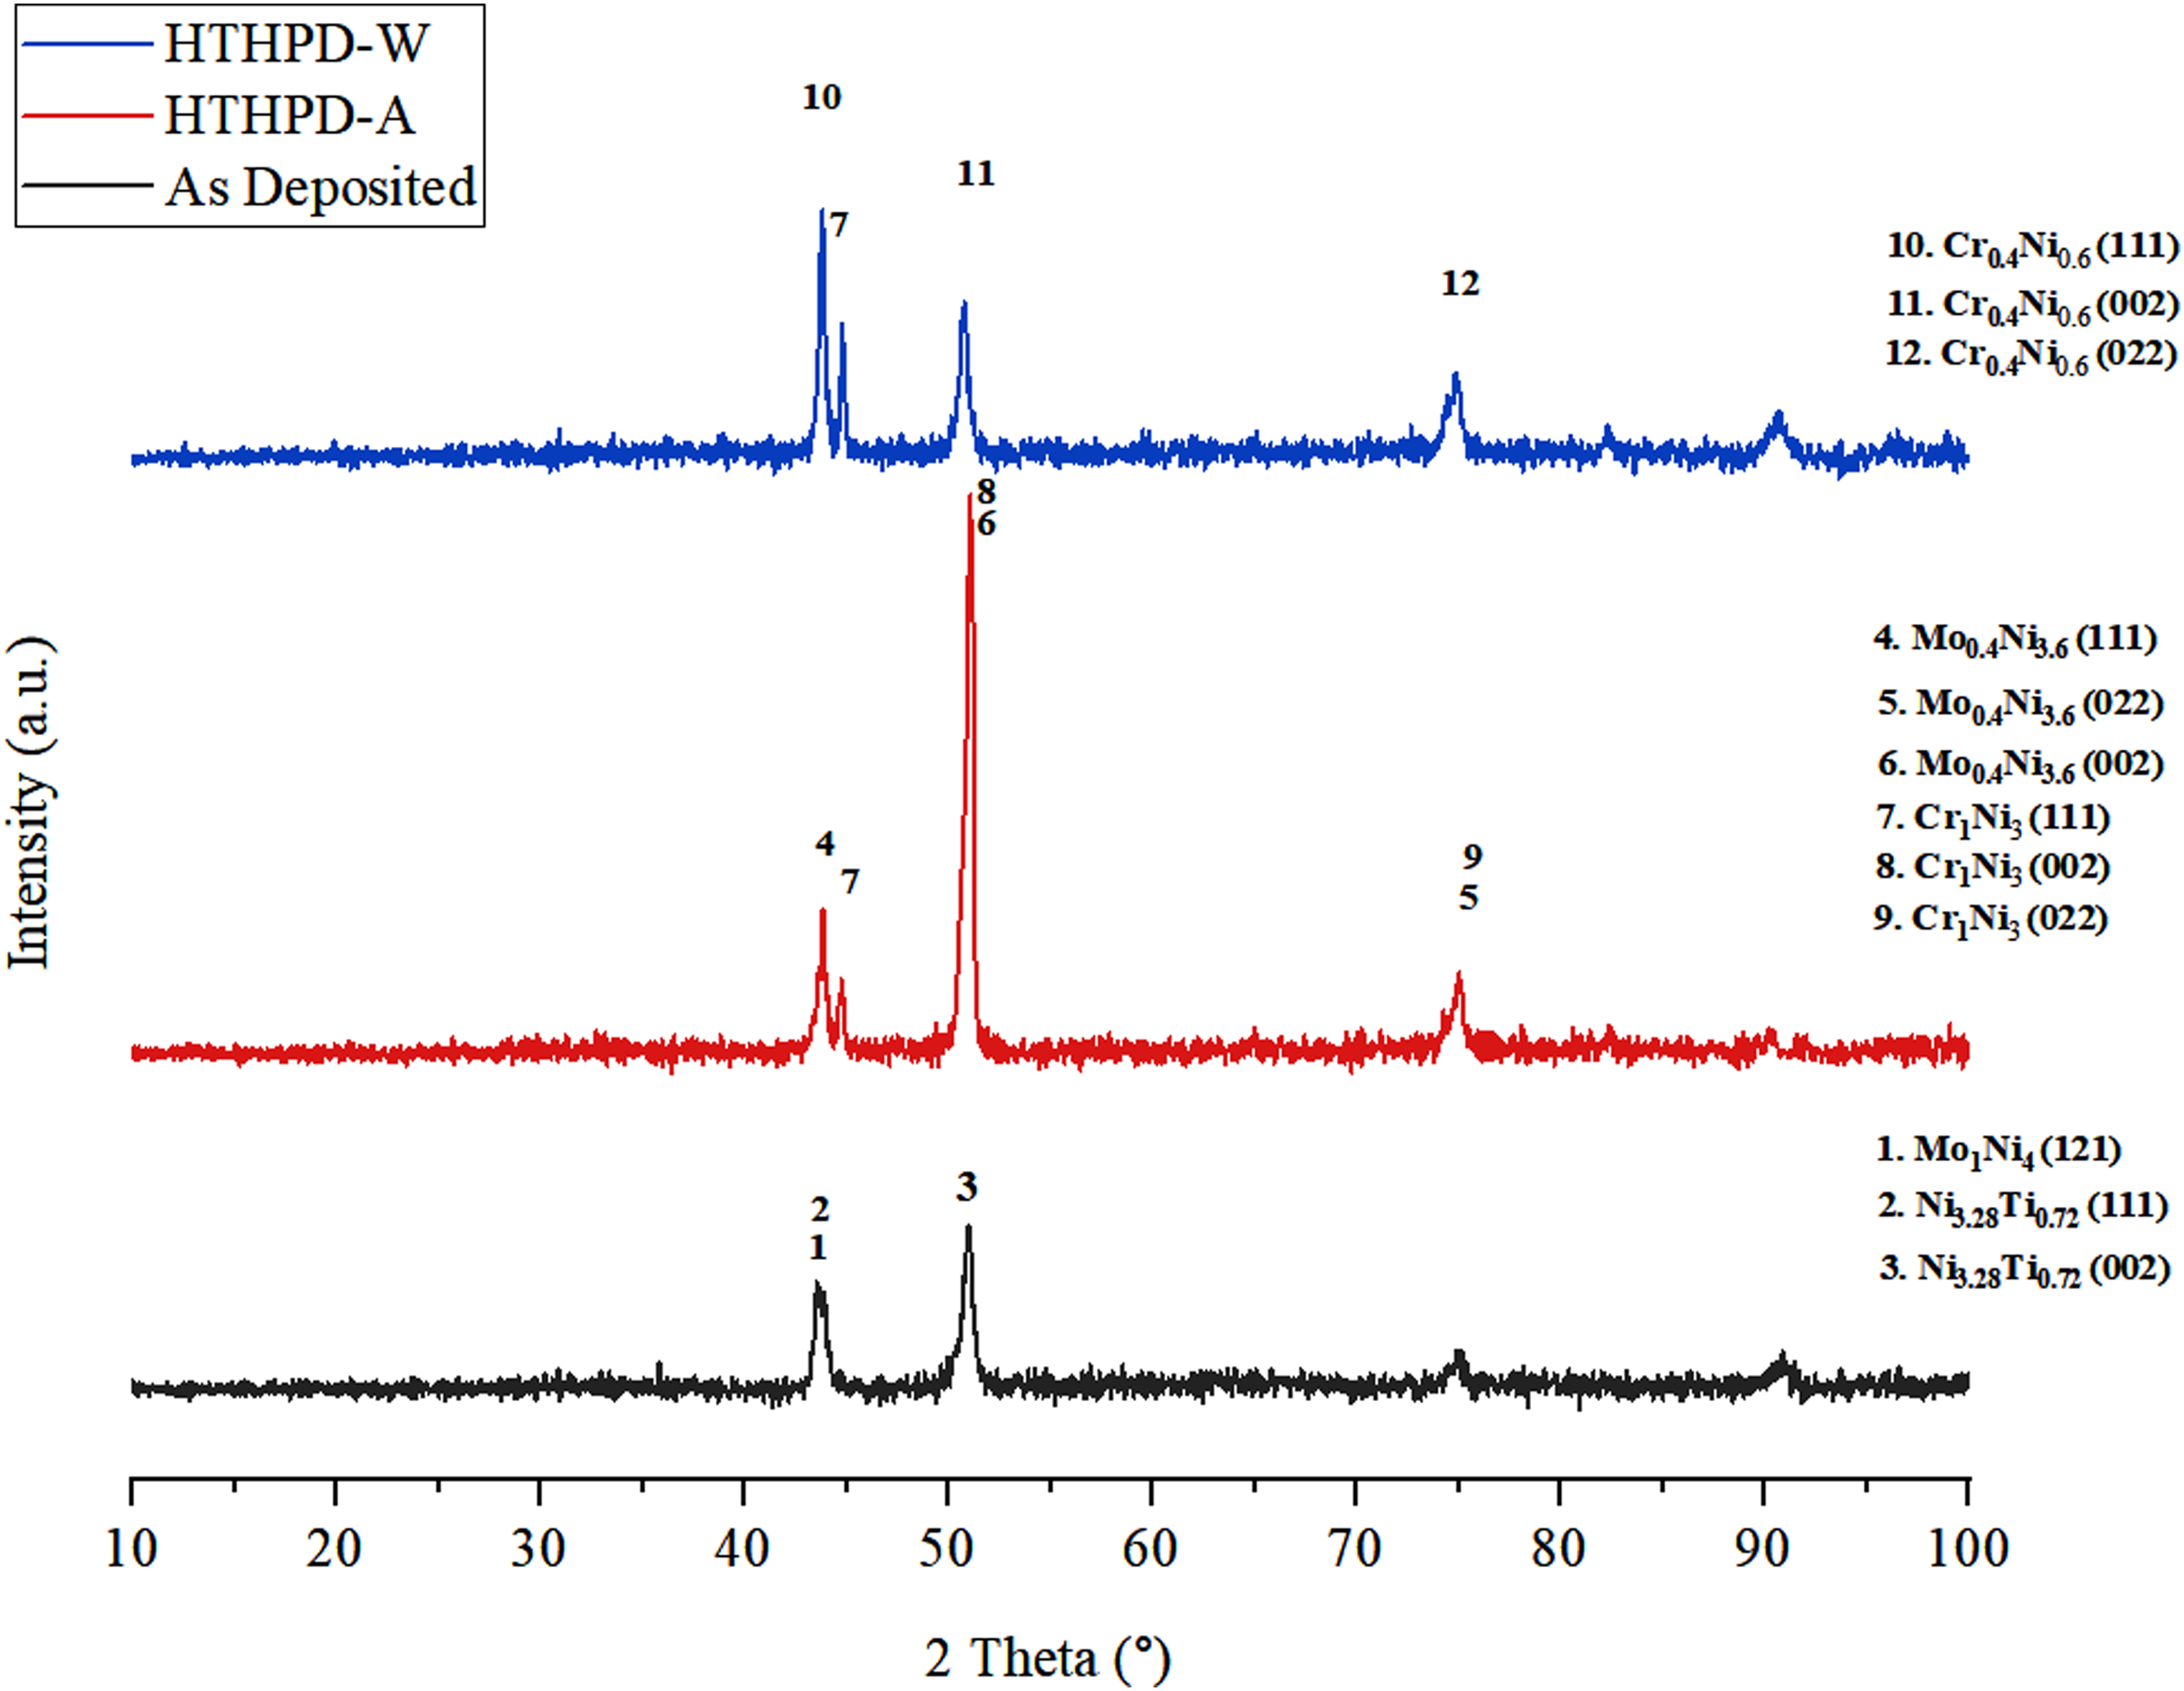
XRD spectra for WAAM-built FGM samples at different processing conditions.
Microhardness
The hardness distribution of the deposited samples along the deposition direction from the substrate to the top layer has been measured and presented in Figure 13(a) to (c). From these microhardness profiles of the deposited sample, it is observed that the microhardness increases from the substrate to the top layer in as-deposited and HTHPD-W samples. At the same time, HTHPD-A shows a decrease in microhardness from substrate to top. This increase in hardness in the as-deposited sample along the deposition direction (Figure 13(a)) occurred due to a decrease in the concentration of Ni and an increased concentration of Cr and Mo. The HTHPD-A sample exhibits similar hardness trends (Figure 13(b)), but its hardness is not as high as the as-deposited sample. This is the result of frictional deformation at high temperatures that relieves stress through recrystallization, and also due to slow colling large columnar and dendritic grains form. But the hardness HTHPD-W sample (Figure 13(c)) exhibits the highest amongst all deposited samples across the deposition height. This increase in hardness is because of frictional deformation in the presence of water cooling causes a quenching effect in the deformation zone, which causes higher grain refinement as observed from a microstructural analysis and hence higher hardness achieved as compared to other processing conditions.
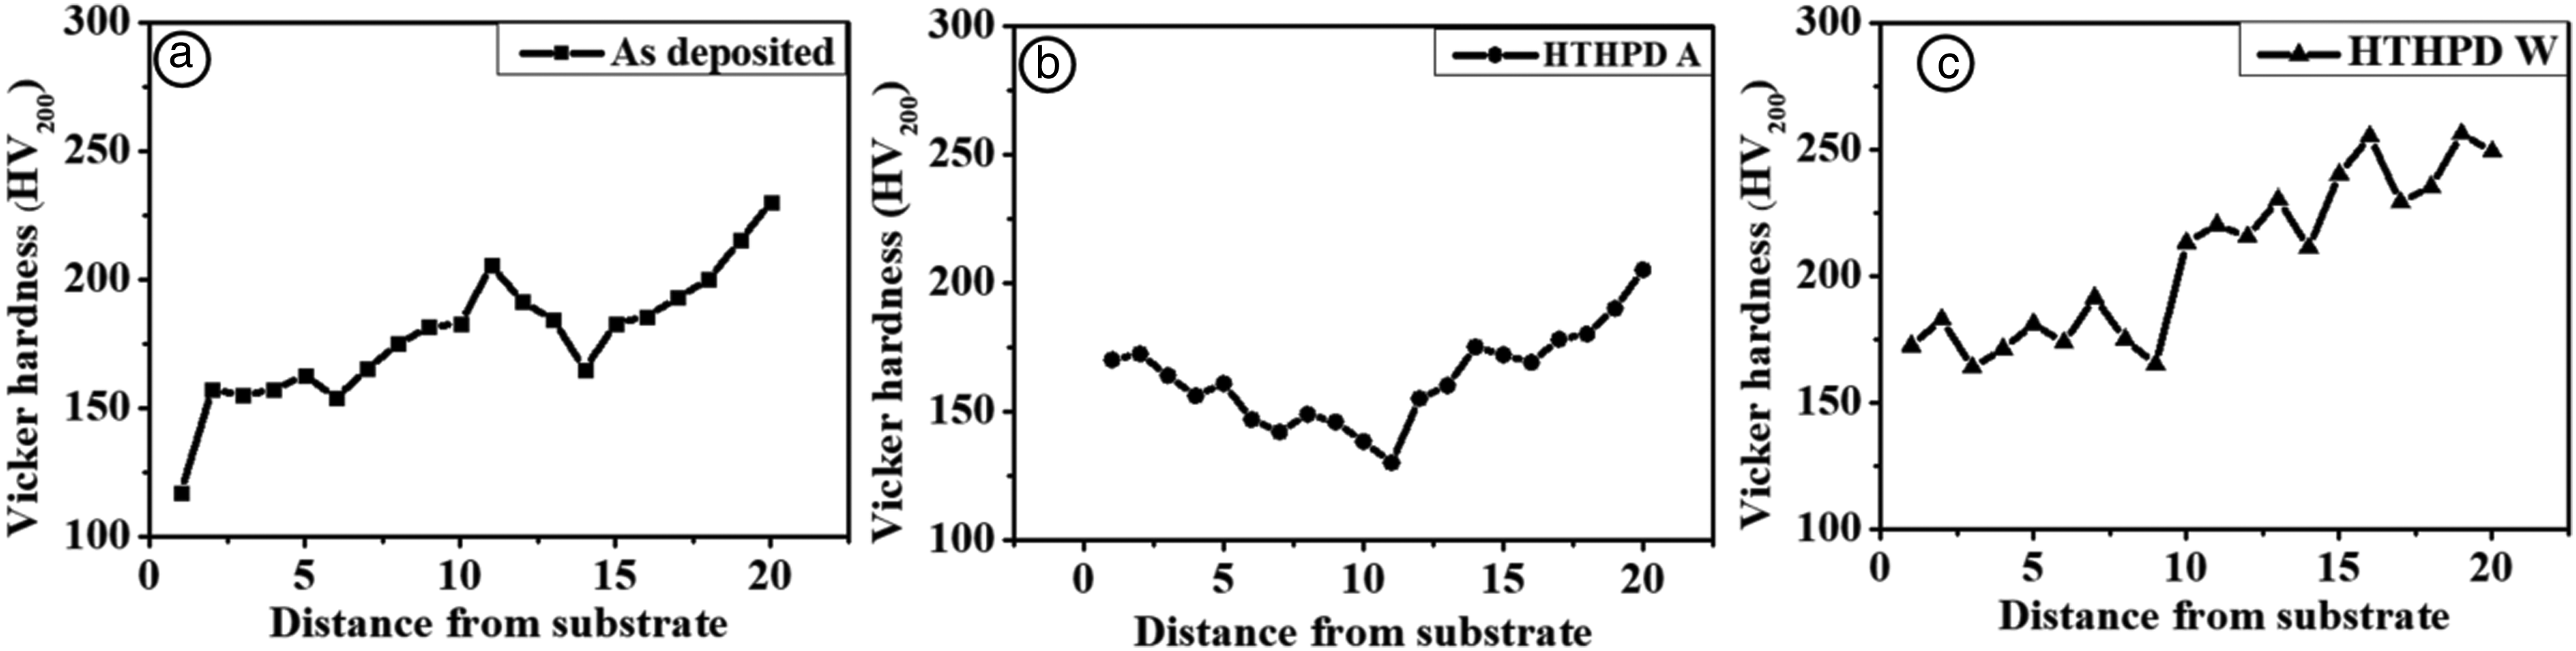
Microhardness distribution along the deposition direction from the substrate to the top layer: (a) as-deposited, (b) HTHPD-A and (c) HTHPD-W.
To observe actual variation in the hardness, average hardness at different locations of the sample has also been measured. Figure 14 shows the average hardness at three different locations of the deposited sample. These locations are schematically shown in Figure 6. Figure 14(a) shows the average hardness at location 1 for all samples. The hardness of as-deposited and HTHPD-A shows a similar hardness trend but HTHPD-W shows higher hardness. However, at location 2, the hardness is much lower in the HTHPD-A sample as compared to the as-deposited and HTHPD-W sample (Figure 14(b)). This is because high-temperature frictional deformation in an air-cooled environment can result in a slow cooling rate which leads to grain coarsening, resulting in a reduction in hardness. A similar hardness trend is also observed at location 3 (Figure 14(c)).
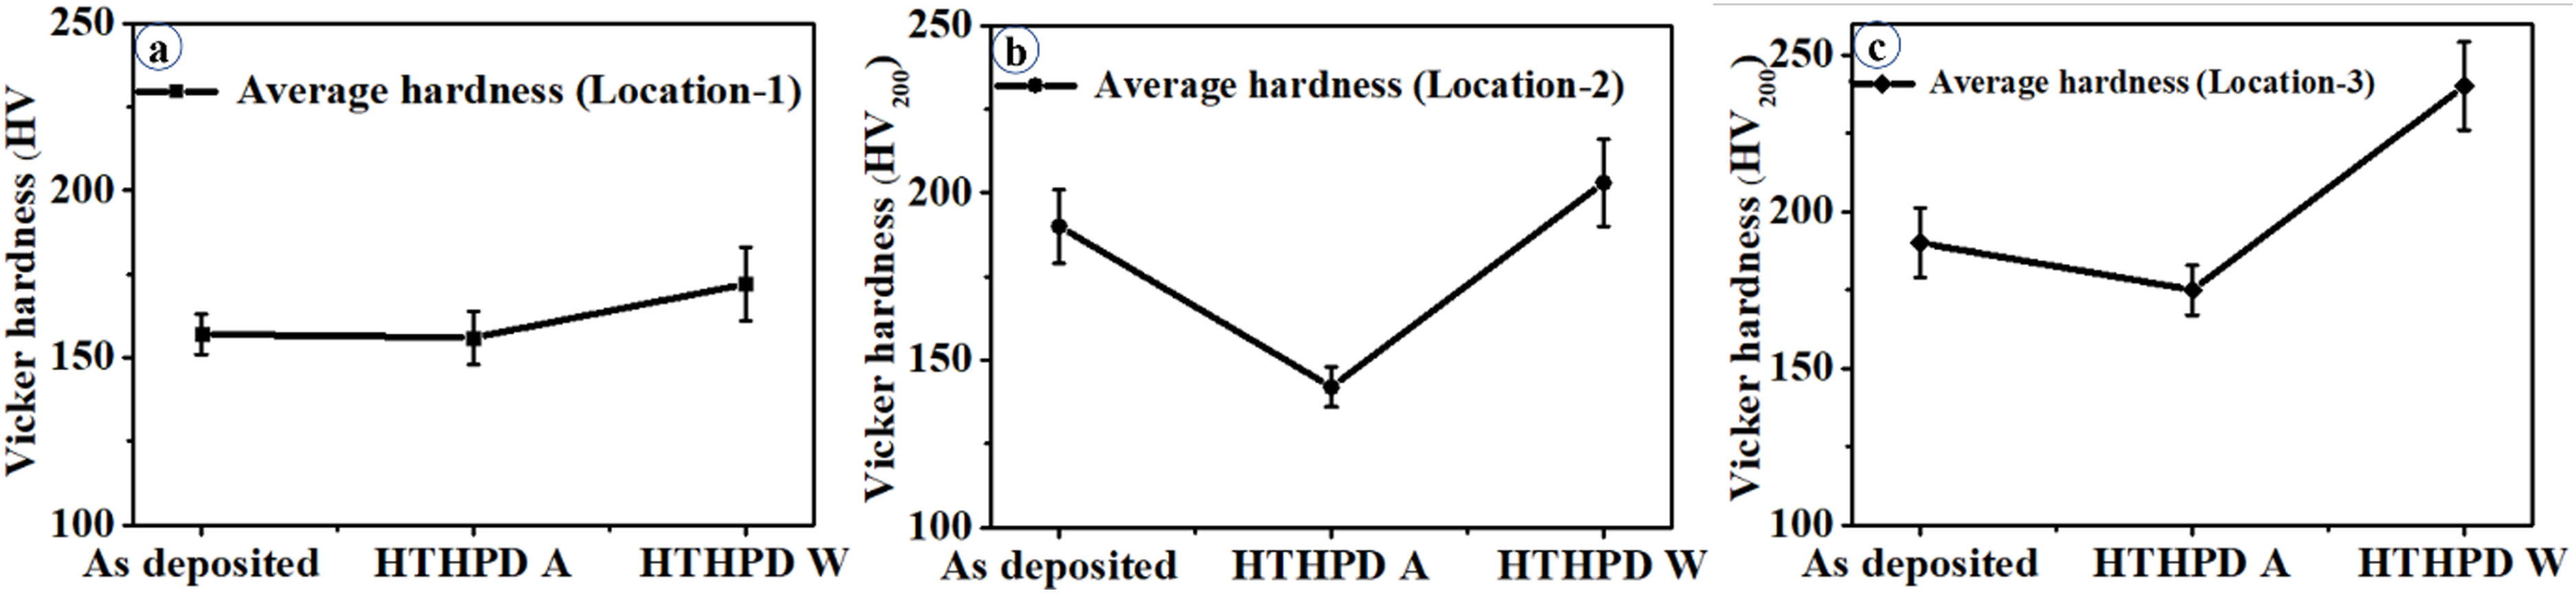
Average microhardness at (a) location 1, (b) location 2 and (c) location 3.
Tensile strength
Figure 15(a) to (c) shows the stress–strain diagram for as-deposited, HTHPD-A and HTHPD-W samples, respectively. These images clearly show that the stress–strain behaviour varies at different locations of the deposited samples. It is due to the compositional variation of the alloying elements and the post-deposition processing conditions. Figure 15(a) shows that the ultimate tensile strength (UTS) and percentage elongation increase along the deposition height (i.e. from location 1 to location 3) in the case of the as-deposited sample. In the HTHPD-A sample, location 1 exhibits higher UTS; however, due to frictional deformation, location 3 exhibits higher percentage elongation than all three locations, as shown in Figure 15(b). Figure 15(c) shows that at location 3, the highest UTS is observed compared to other locations. At the same time, during high-temperature fractional deformation, water cooling causes grain refinement, which causes decreased percentage elongation from location 1 to location 3. Similarly, Figure 16(a) to (c) shows the average UTS and percentage elongation at locations 1, location 2 and location 3, respectively, under all processing conditions. The HTHPD-W sample shows the highest strength, while HTHPD-A exhibits the highest percentage of elongation. The tensile properties are also linked with hardness properties and a similar kind of behaviour has been observed in the microhardness analysis.
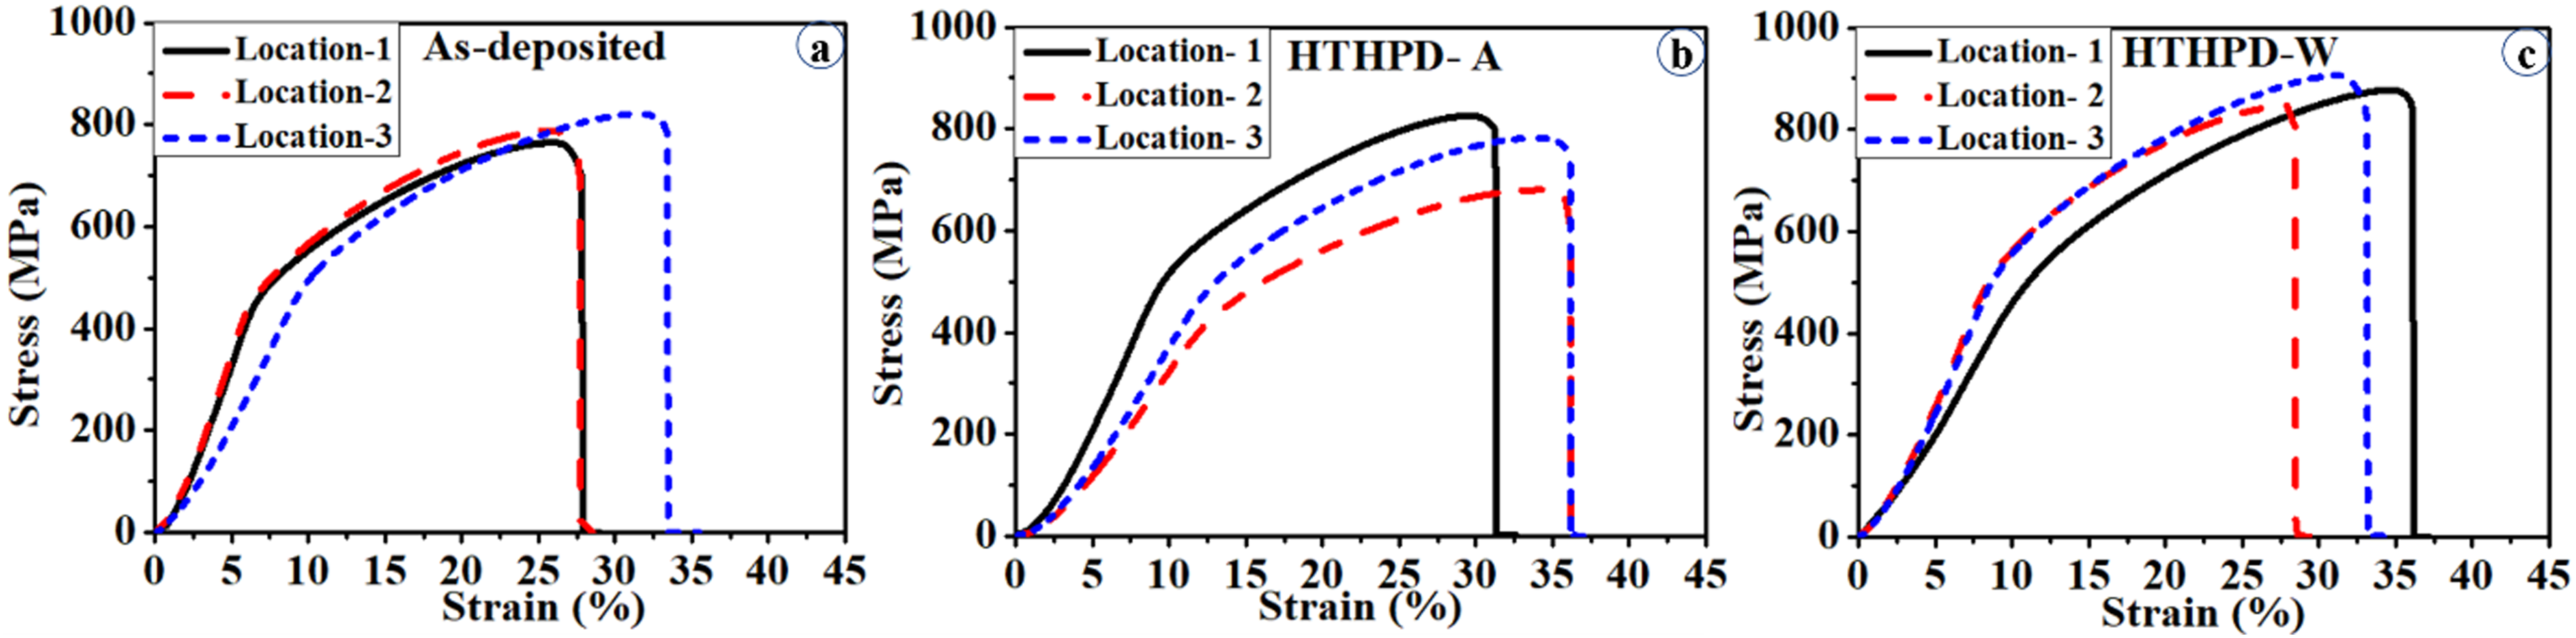
Stress–strain diagram along the deposition direction from the substrate to the top layer: (a) as-deposited, (b) HTHPD-A and (c) HTHPD-W.
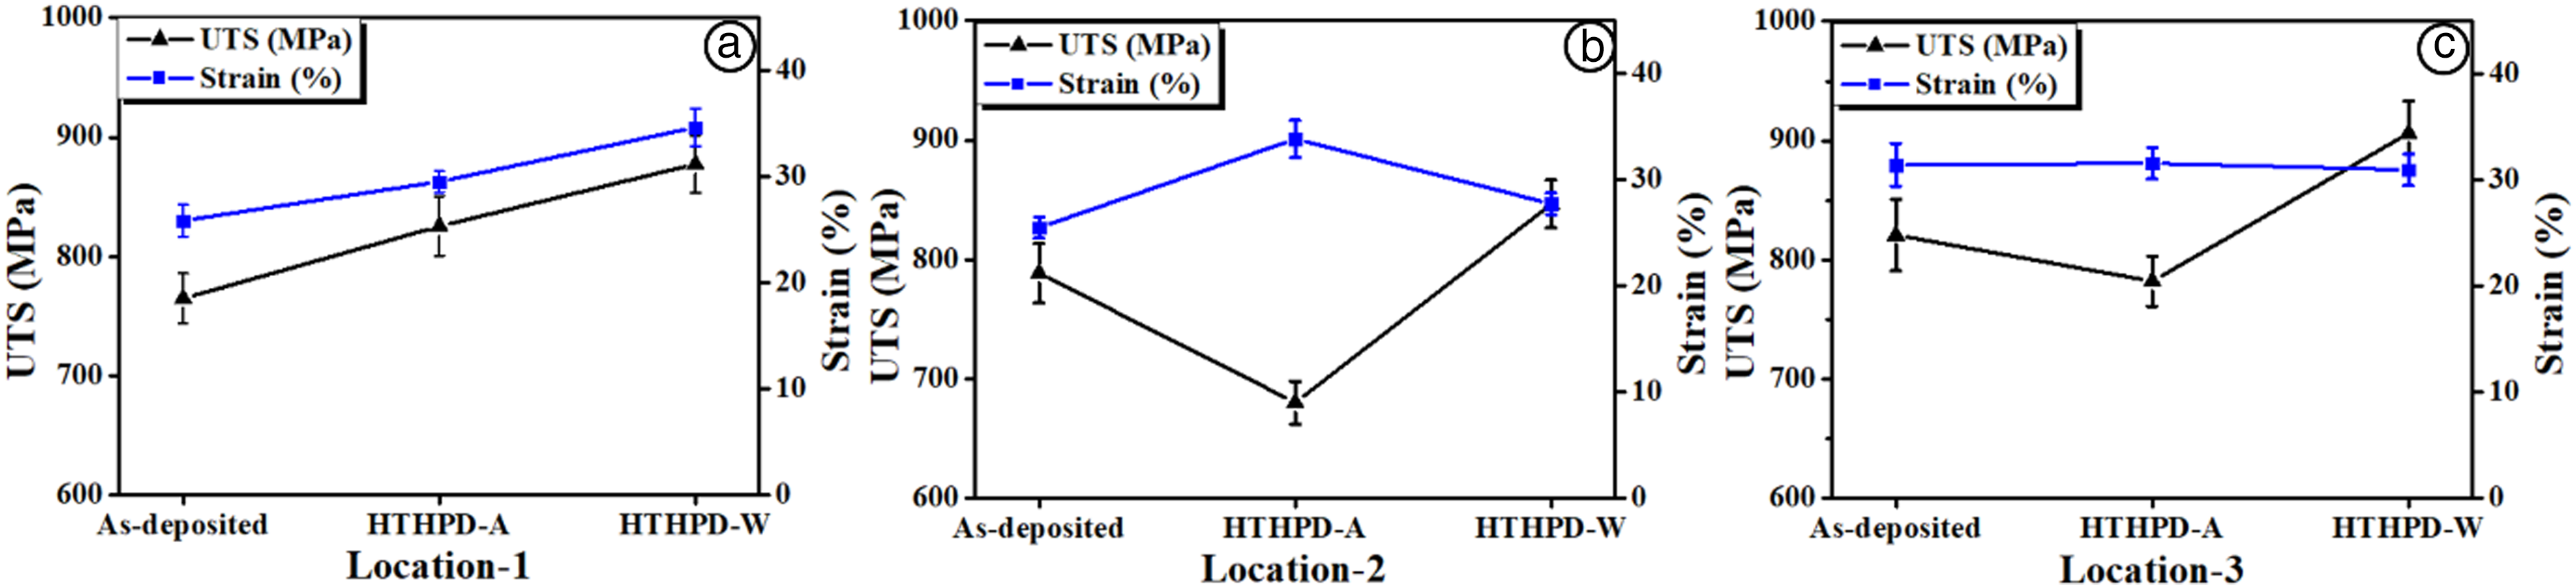
Average ultimate tensile strength (UTS) and strain (%) at (a) location 1, (b) location 2 and (c) location 3.
Conclusions
In this investigation, a wall with a combination of nickel, chromium and molybdenum-based functionally graded material has been fabricated successfully by the WAAM technique using GTAW as a heat source. Designed variation in the composition of the proposed FGM has been achieved by feeding different combinations of wire. The effect of high-temperature and high-pressure deformation with different cooling conditions on the metallurgical and mechanical properties has been analysed on the developed FGM. The following conclusions can be drawn from the results of this work:
A gradual compositional gradient of nickel from 93.33% (bottom layer) to 58.20% (top layer) and molybdenum from zero to 12.5% with an almost constant chromium percentage is achieved along the height of the deposited wall. The microhardness gradually increases from bottom to top in all cases due to the increase in molybdenum composition. The hardness values range from 114 to 230, 130 to 205 and 164 to 256 HV for as-deposited, HTHPD-A and HTHPD-W samples, respectively. The hardness is found lower in the case of as-deposited and high-temperature deformation samples in air-cooled conditions due to long elongated grains in the deposited regions. The hardness is found more in the case of water-cooled samples in all locations due to the refined grain structure. The average UTS of the sample at the bottom (location 1), where molybdenum is almost negligible, is found at 793, 715 and 875 MPa, respectively, for as-deposited, HTHPD-A and HTHPD-W samples. As moving upward at location 2 where the molybdenum percentage is in the range of 5% to 9%, the UTS decreases by 3.25% and 3.5% in the case of as-deposited and HTHPD-A samples while it increases in HTHPD-W samples by 3.67%. At location 3 (with 10% to 12.5% Mo), the UTS increases by 3%, 12.56% and 3.42% for as-deposited, HTHPD-A and HTHPD-W samples, respectively.
Footnotes
Declaration of conflicting interests
The author(s) declared no potential conflicts of interest with respect to the research, authorship, and/or publication of this article.
Funding
The author(s) received no financial support for the research, authorship, and/or publication of this article.