
Abstract
Constant Velocity Joint (CVJ) mechanisms enable torque transmission between two shafts at a fixed or variable angle. Cross groove CVJs are typically used in high performance automotive applications due to their versatility and light weight. Critical failure modes, such as pitting or abrasive wear, occur due to the harsh tribological conditions at ball reversals. In this research, an existing mathematical model is developed further for the case of cross groove CVJs including an accurate contact mechanics model. The developed model is validated against a published data set from literature. Surface topography of worn raceways are experimentally measured and the results from the developed model are corroborated with the measured surface parameters. This improved model shows the correlations between predicted contact force variation and wear scar depths during ball reversals, hitherto not reported in the literature.
Introduction
Universal joints are classified as nonconstant (nonuniform), constant (uniform) and near constant velocity joint mechanisms based on their kinematic characteristics. 1 Constant velocity joints (CVJs) transmit rotational motion between two shafts meeting at an opposed angle. The angular velocity ratio between the input and output of CVJs equals unity at any shaft angles. CVJs are largely utilised in automotive drivelines to transmit power from the gearbox to the wheels whilst allowing for suspension and steering. Ball type joints are the most common type of CVJs and are made in various forms. 2 Cross groove CVJ mechanisms (Figure 1) are a particular type of ball joint, which are radially supported. 1 They consist of two sets of helical or straight grooves with alternating pitch angles upon the inner and outer raceways. An intermediary set of balls transfers power between each pair of raceways. A cage ensures the containment of the balls to a constant plane. Cross groove CVJs offer a relatively high range of inclination angles and the ability to plunge axially. 1 Hence, they are a desirable alternative to tripod joints at the ends of a half shaft where plunging motion is anticipated. Cross groove CVJs are also relatively lighter than other joint types and are therefore preferable for high performance automotive applications.
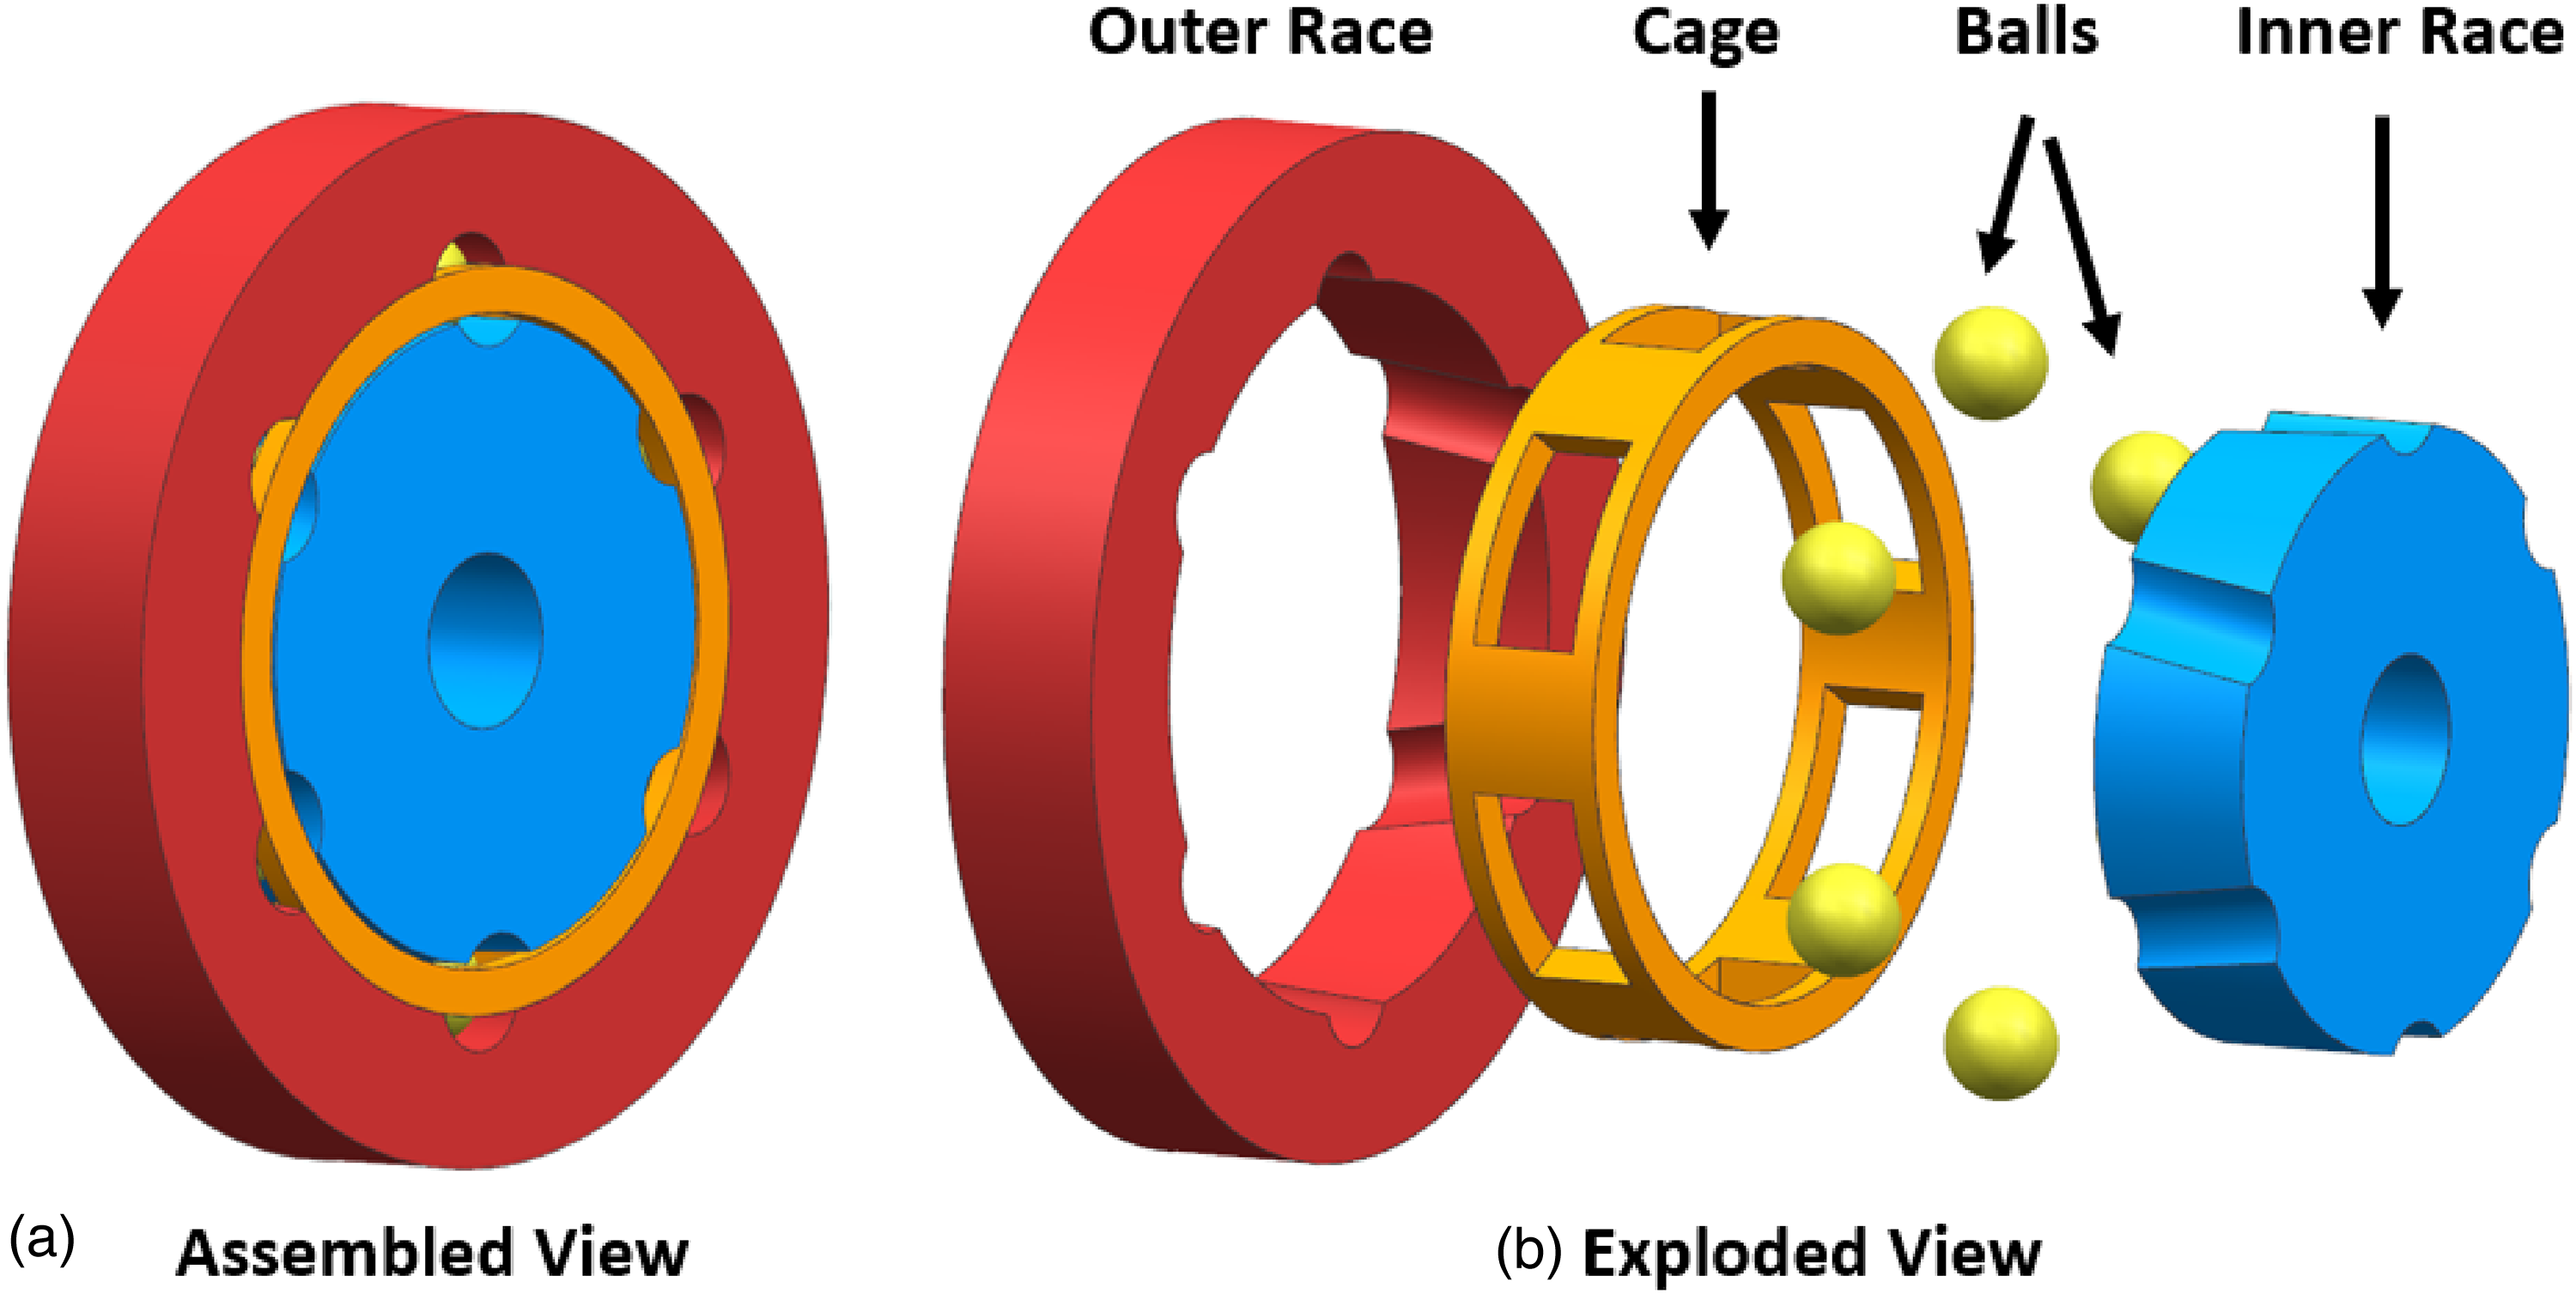
Cross groove constant velocity joint, (a) assembled joint, and (b) exploded view.
The failure of constant velocity joints typically occurs within the ball-raceway contacts. The raceways wear and eventually undergo fatigue failure due to the high frequency reciprocal motion imparted upon them. In most commercial cases these failure modes can be avoided by designing the joint with a suitable factor of safety. For high performance racing applications, the mitigation of these problems must be balanced against the need for a lightweight joint. Thus, the development of design tools which allow for effective design choices to be made is key.
Ball CVJ mechanisms have been investigated both analytically and numerically using a series of static and dynamic models. Bauer 3 presented a static model for the case of a cross groove CVJ. The model was utilised to investigate wear in a commercial joint. Kimata 4 proposed a generalised static model for CVJs. This analytical model provides the capability to input a range of CVJ designs, including both curved and straight track profiles. Shin et al. 5 developed a static model to investigate contact force variations for a Rzeppa type CVJ. They presented explanations for the asymmetry observed in the typical Rzeppa contact force variation. The use of a contact ratio was suggested. This contact ratio is based on a similar term used for gear systems, where the contact ratio represents the average number of teeth in contact. In this case the contact ratio instead represents the number of balls that are actively transmitting torque. A relationship is demonstrated between the peak force and this contact ratio. Kimata et al. 6 expanded on their previous static model Kimata 4 by proposing a dynamic framework. The dynamic model considers the time dependant behaviour of various components of the joint. It also provides a more detailed consideration of some contact calculations. Their results show good agreement between the static and dynamic models, with slight reductions in peak magnitudes and generally extended contact times. They also carried out in-situ experimental contact force measurements within a double offset joint raceway. The findings from the experimental tests effectively validate the findings of their models.
Several studies have adopted multibody dynamics software to investigate behaviour of CVJs. Serveto et al. 7 developed a model using MSC ADAMS simulation software. They studied the secondary torque acting on the driven side of the joint and the impact of friction upon this torque. Lim et al. 8 developed a complete half shaft dynamic model comprising a ball joint and tripod joint. They used the model to investigate vibrational modes present within the joint. They carried out a dynamic stress analysis highlighting regions of high stress within the tripod spider and contacting housing. Valentini 9 used a rigid body multi-body dynamic model to study a Rzeppa type CVJ. They investigated the impact of three types of manufacturing errors upon the dynamic performance of the joint: the flatness of the cage window surface, the radius of an inner race circumference, and the angling of a track centreline. They found that even within manufacturing tolerances these errors can introduce potentially harmful vibrational frequencies to the system. Marter et al. 10 developed a combined numerical and multibody based dynamic model for the case of a cross groove CVJ. The extensive results from this model detail the dynamic motions of components in the joint. Results from the model demonstrate a high dependency of contact force upon the friction coefficient, with peak magnitude increasing by more than 100% between friction coefficients of 0 and 0.05. Feng et al. 11 proposed an MSC ADAMS model to predict the contact forces and efficiency of a Rzeppa type joint. Their model demonstrated a good agreement with experimental results. They investigated the sensitivity of the transmission efficiency to a range of design parameters. It was found that the inclination angle, friction coefficient, and force exponent (used in their stiffness calculation) all had a significant impact on efficiency. The contact forces in the ball-inner race contact (P1) were also shown to be significantly lower than the ball-outer race contact forces (P3). This seems to be in contrast with the findings of others (e.g., Serveto et al. 7 Kimata et al., 12 Shen, 13 who have found that P1 and P3 are generally equal in peak force magnitude. Yu et al. 14 developed a multibody dynamics model based on commercially available MSC ADAMS software for an 8-ball variation of a fixed ball joint. The model is validated using an experimental test rig. The test rig involves the motoring of the joint, whilst measuring the output torque and hence efficiency. The model appears to predict the joint efficiency with good accuracy. The effect of several design parameters upon the torque loss are investigated. The pitch circle radius and inner/outer raceway centre offset are both shown to be highly impactful. A parametric optimisation is carried out, achieving an overall efficiency gain of 0.01%, equivalent to a 4% relative improvement.
Due to the complexity involved, few experimental studies have been carried out investigating CVJs. Okamoto and Ooba 15 developed an in-situ measurement method for a Rzeppa-type CVJ. Utilising piezoelectric sensors, they measured the contact forces in the outer raceways and the spherical cage-race contacting surfaces. The measured ball-race contact forces demonstrate the familiar two peak profile commonly seen in the results from computational models reported in the literature. Onuki and Sugimara 16 developed a test rig to replicate the complex reciprocating rolling/sliding motion between the ball and raceway. They investigated the pitting/spalling failure mode, a result of rolling contact fatigue. Characteristic cracks were found for a range of conditions. The growth of these cracks was dependent upon the relative motion of the surfaces. With movement of the contact point and the tangential force acting in the same direction, no crack growth was observed after 16 million cycles. After adjustment of raceway motion phasing by 60°, resulting in increased slip, significant crack growth was observed. Pitting/spalling type behaviour was observed after approximately 500,000 cycles, consistent across five repeats. A similar investigation into the raceway fatigue failure mechanism has recently been carried out by Song et al., 17 following on from the development of a rig to investigate tripod type CVJs. A test rig is developed which represents a reduced ball type joint, with the number of balls reduced from six to four, and the outer raceway fixed onto the test rig. The inner raceway is loaded into the outer raceway and is oscillated, causing the balls to reciprocate within their raceways. Wear and fatigue spalling is measured through the use of a rotary encoder. When material is removed the encoder will trace a larger angle to maintain a consistent force, providing a medium for determination of wear depth. Presented results show that wear depths measured this way correlate reasonably well with profilometry measurements. The model is used to run long scale (> 1000 h) failure tests. The tests exhibit three wear stages; an initial higher wear run in period, a long low wear period, and finally, an extreme high wear period due to fatigue failure.
Investigations have also been made into the wear characteristics of CVJs. Taniyama et al. 18 studied the failure modes of a Rzeppa-type CVJ. They found that even modest reductions in the contact pressure translated to significant increases in cycles before surface damage occurs. Bauer 3 measured the wear of a commercial cross groove joint. The results showed significant wear patches in the centre of each raceway. The outer raceways are shown to have significantly higher wear than the inner raceways. Pitting outbreaks are present to varying levels across the raceways due to rolling contact fatigue. Mao et al. 19 utilised a kinematic model to investigate the wear of the components in a full half shaft, comprising ball type CVJ and plunging tripod type CVJ. Measurements showed greater wear on the balls and raceways compared with the cage window surfaces.
The motivation of the present work is the investigation of the raceway coating failure due to wear in the first instance. Once the coating is worn the subsurface stresses developed in the substrate material can result in the fatigue failure of the CV joint. In order to carry out such an investigation, it is necessary to develop models of the joint. The aim of this research is to develop a multibody model capable of determining the variation of the contact forces between the components in a cross groove CVJ with respect to geometric and operational input conditions. The method of Kimata 4 is adapted to the case of a cross groove CVJ to investigate component contact forces for this configuration. Both Bauer's model and adapted Kimata's model for cross groove CVJs could be used for the purpose of the research presented here. However, adapting Kimata's model offers greater capability than Bauer's approach reported in Bauer. 3 The new model allows for consideration of potential cage-race contact and the determination of ball race contact on the non-driving side of the raceway. It also considers the effects of clearances upon the joint. Thus, for the purpose of this research, Kimata's model is modified for the case of cross groove CVJs. In order to improve contact force predictions, Hertzian contact mechanics are utilised to determine the contact stiffness in Kimata's framework, which is not hitherto reported in the open literature. One of the advantages and contributions of the developed mathematical model is that it provides a fast lightweight solution to the accurate predication of contact conditions within the cross groove CVJ. The cross groove joint model provides insights into the effects of different design parameters on the contact forces within the joint. The model is used to investigate the wear of a raceway coating intended to mitigate fatigue failure. The measured wear from an outer race sample is used to corroborate with the energy expended by the contact forces. A remarkable correlation between the work done and the existing wear patterns was observed.
The model framework and equations are outlined in this section. The equations and subsequent analyses are specific to the cross groove joint case. The proposed model adapts the framework set out by Kimata 4 to fit the cross groove geometry. The experimental method is detailed for the measured wear patches of a cross groove outer race sample.
Prerequisites and assumptions
Several prerequisites are described for the model. The joint is comprised of a set of outer and inner raceways, joined to the input and output shafts, respectively. The number of raceways on each shaft equals the number of balls. The centrelines of the raceways are positioned symmetrically about the homokinetic plane on which the balls lie. The section of the track normal to its centreline forms a gothic arch or ellipse. Hence, two unique contact points are formed between the ball and each raceway defined by the contact angle α (Figure 2).
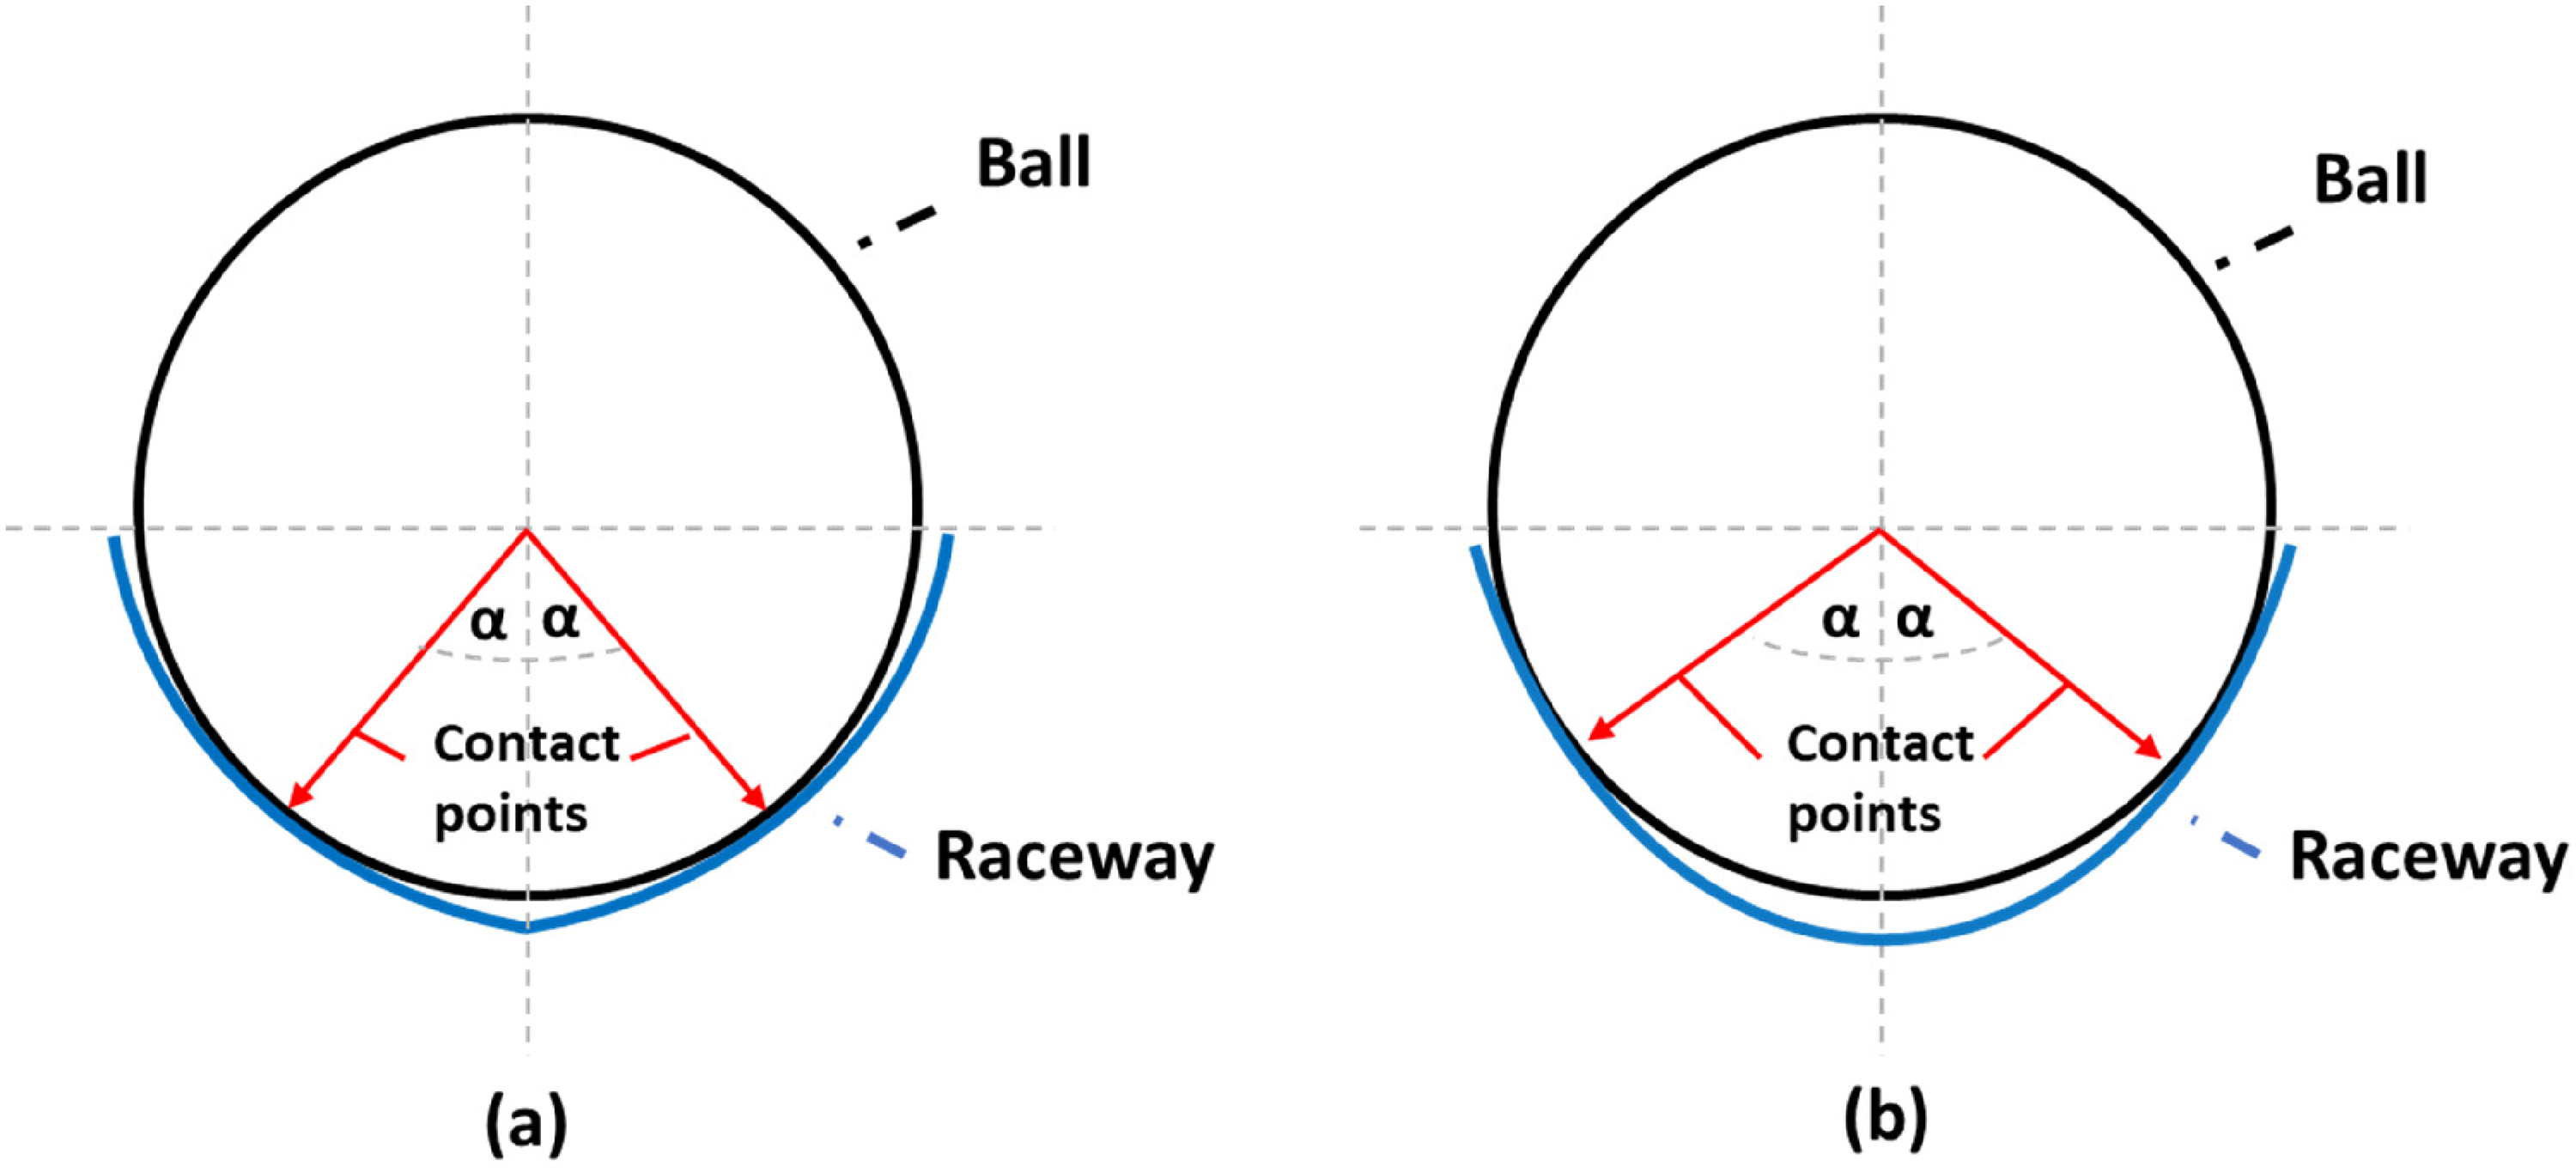
Contact point and contact angle
The following assumptions are utilised when analysing the joint:
Only local (Hertzian) elastic deformation is considered in contacts between components. The displacement magnitude is assumed to be equal to the clearances defined for the cage-race contacts. The direction of the displacement is in the direction of the contact force. The dynamic effects are neglected in this study. Omitting dynamic effects has been shown by Kimata et al.
12
to have relatively negligible effect on the predicted contact forces. Frictional as well as inertial forces including the effect of centrifugal acceleration upon the components are also neglected.
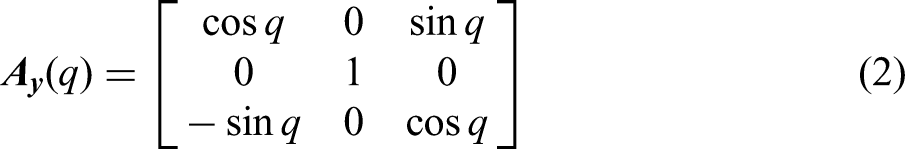
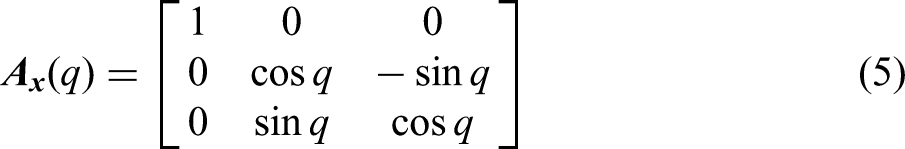
The cross groove ball CVJ mechanism is modelled in three-dimensional Cartesian space (Figure 3). Standard unit vectors
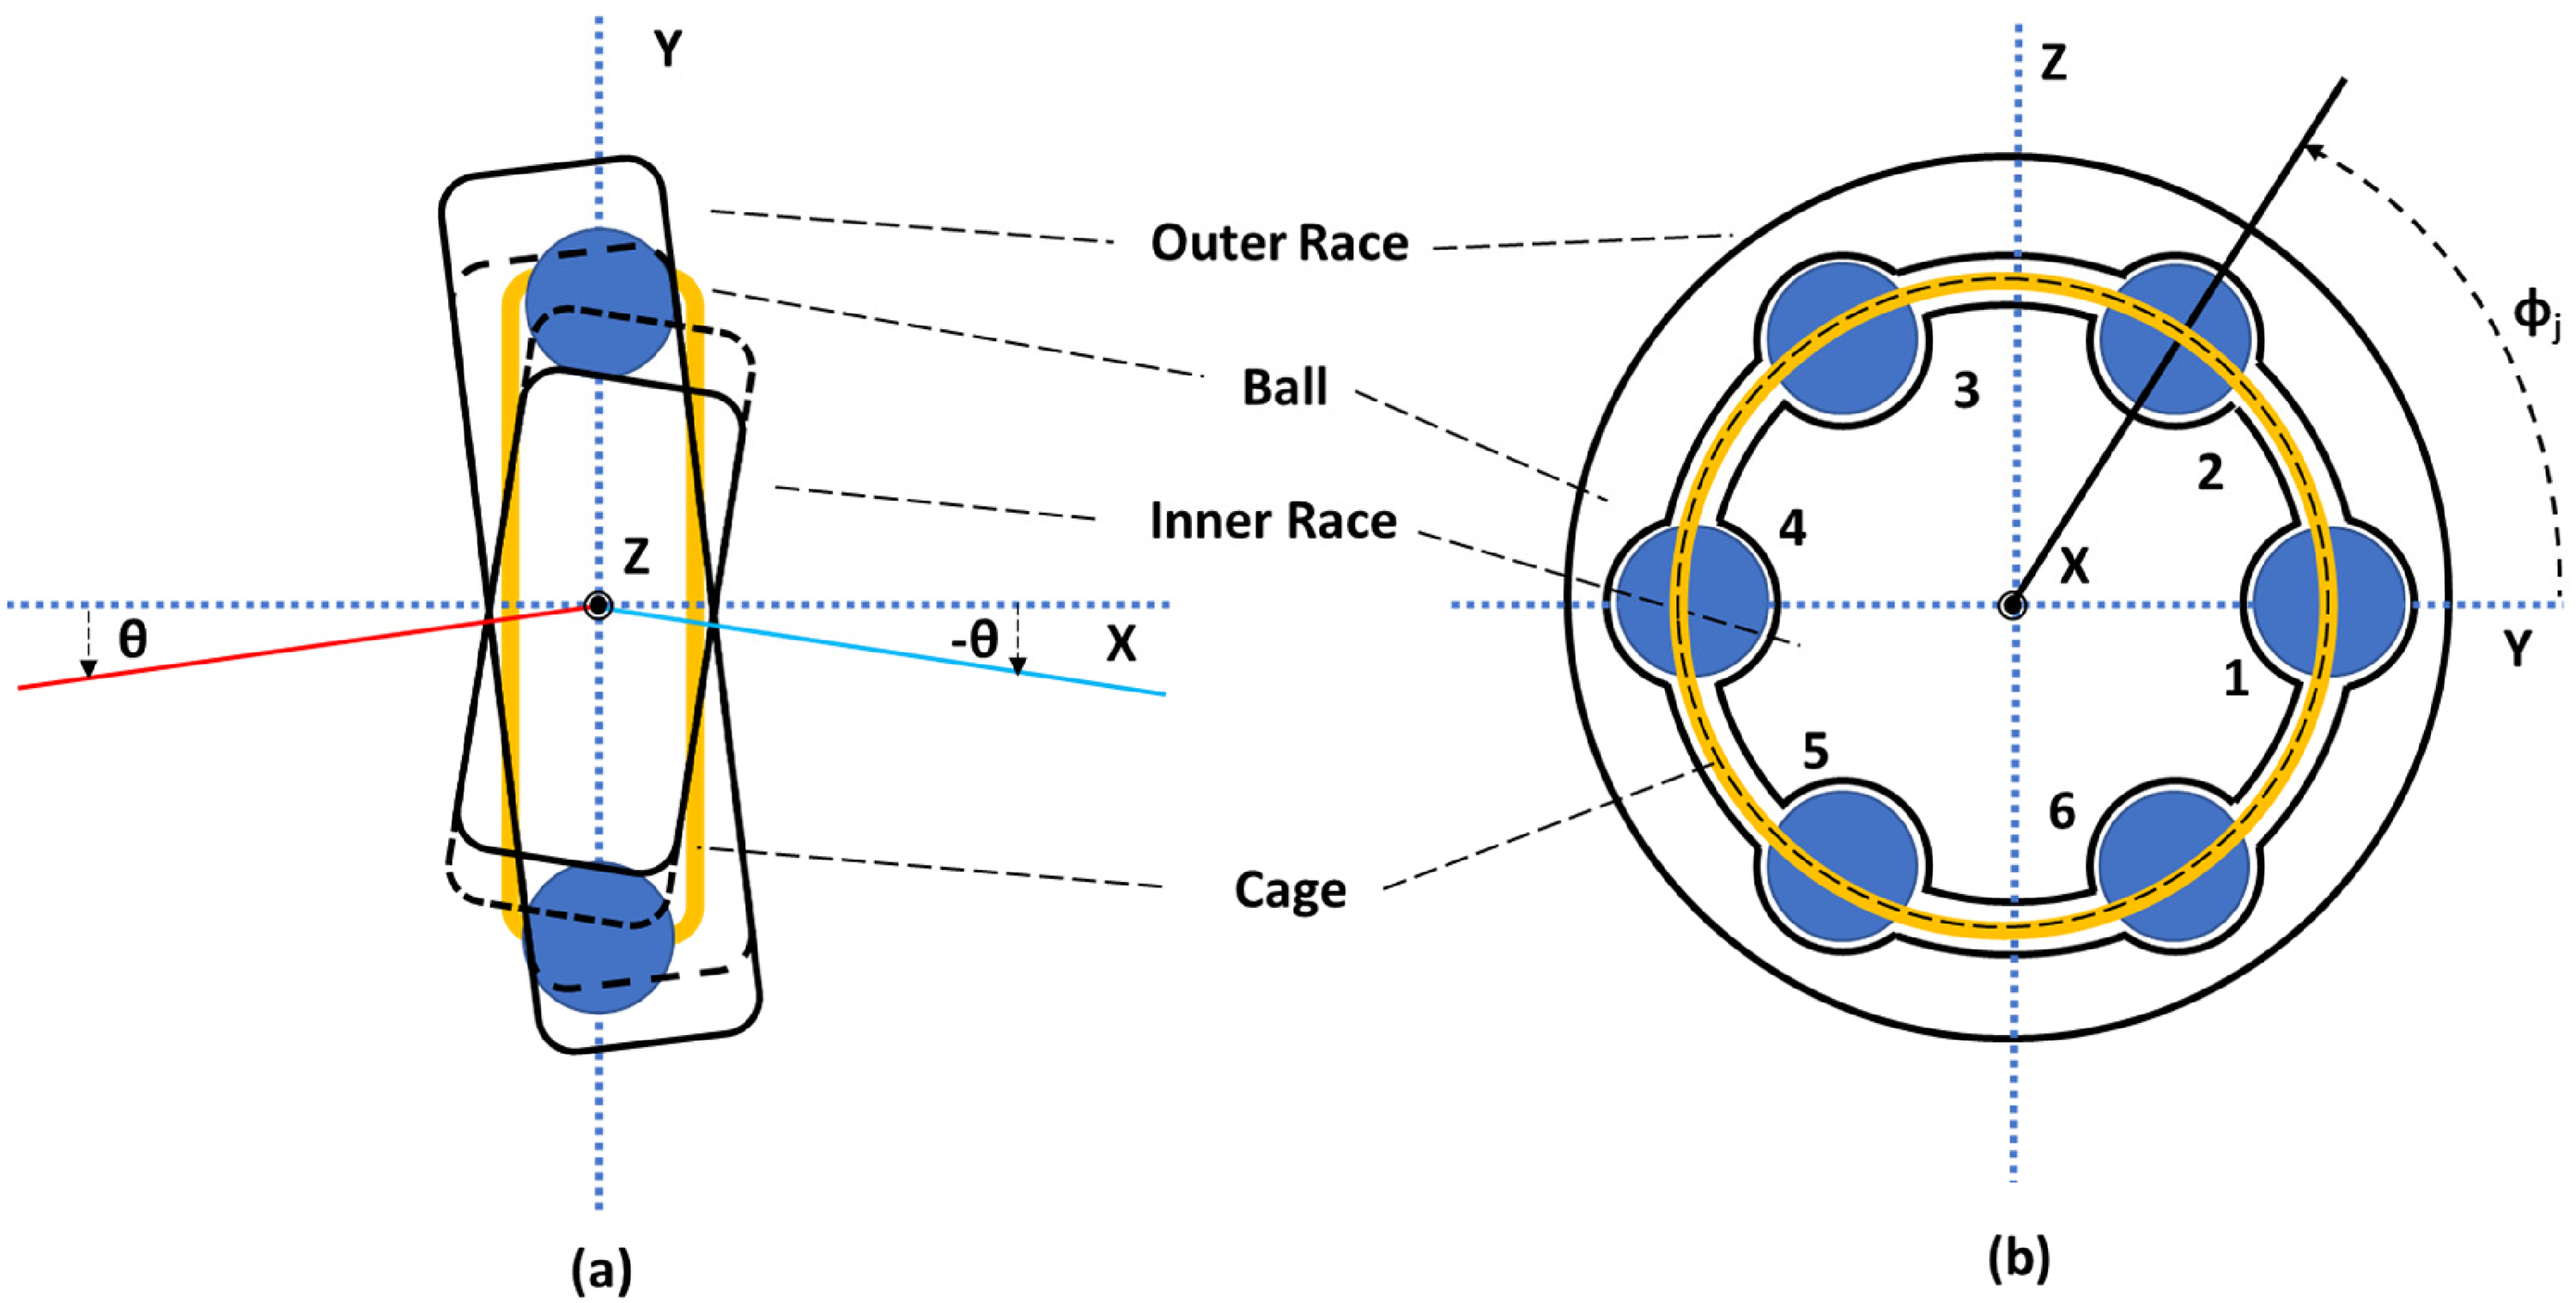
Coordinate system layout, (a) XY plane defining axis positions, and (b) YZ plane defining ball positions.
A notation system is established to refer to CVJ components in the equations of motion. Subscript
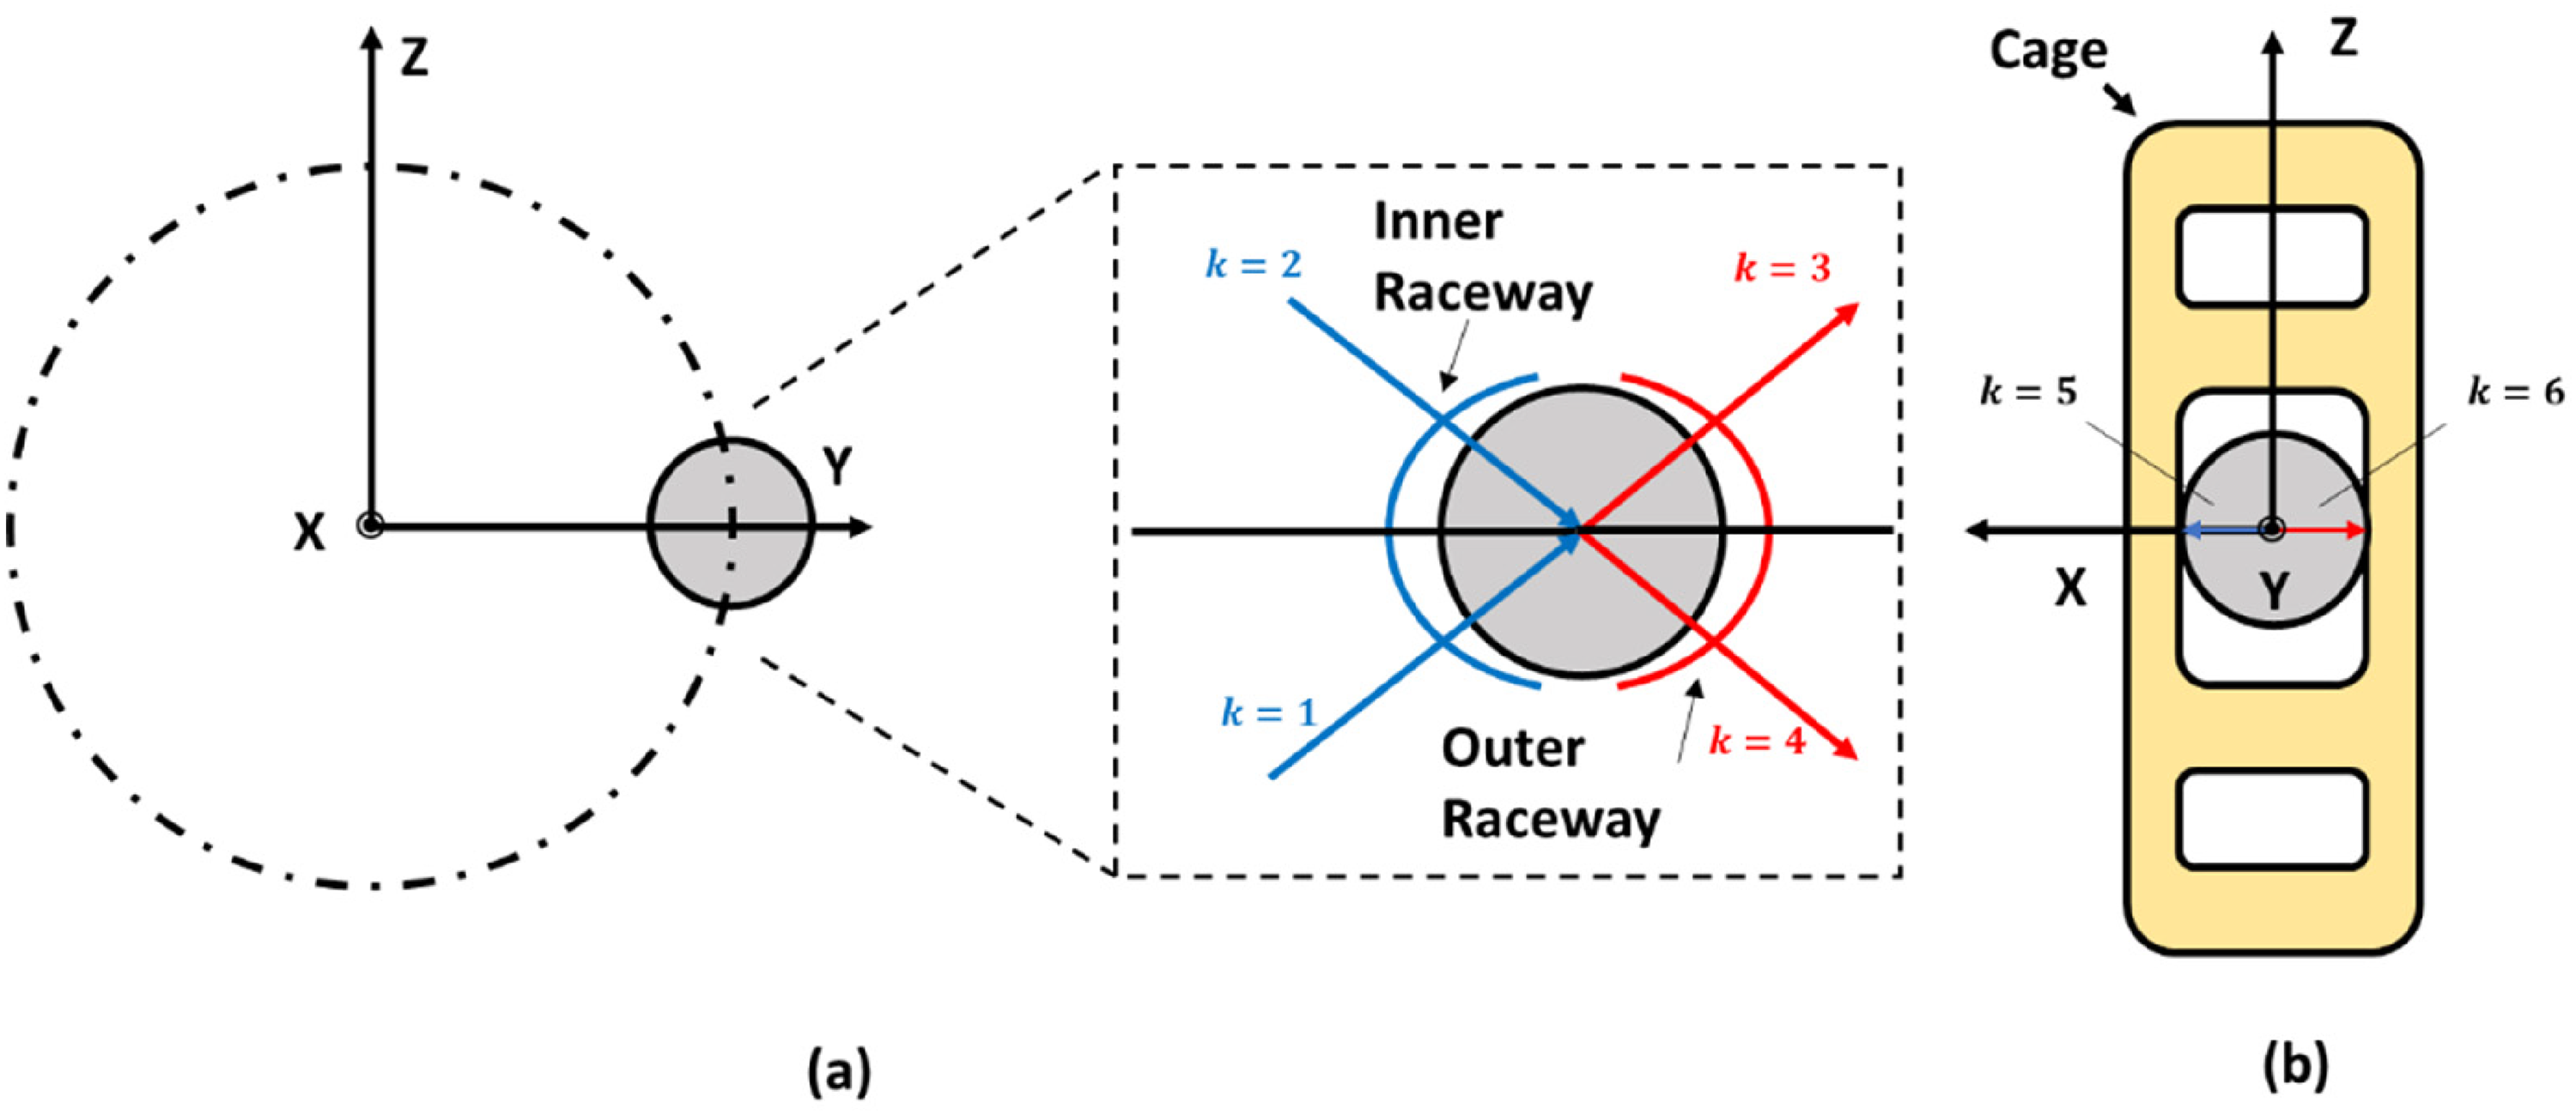
Contact designations, (a) ball-race contacts, and (b) ball-cage contacts.
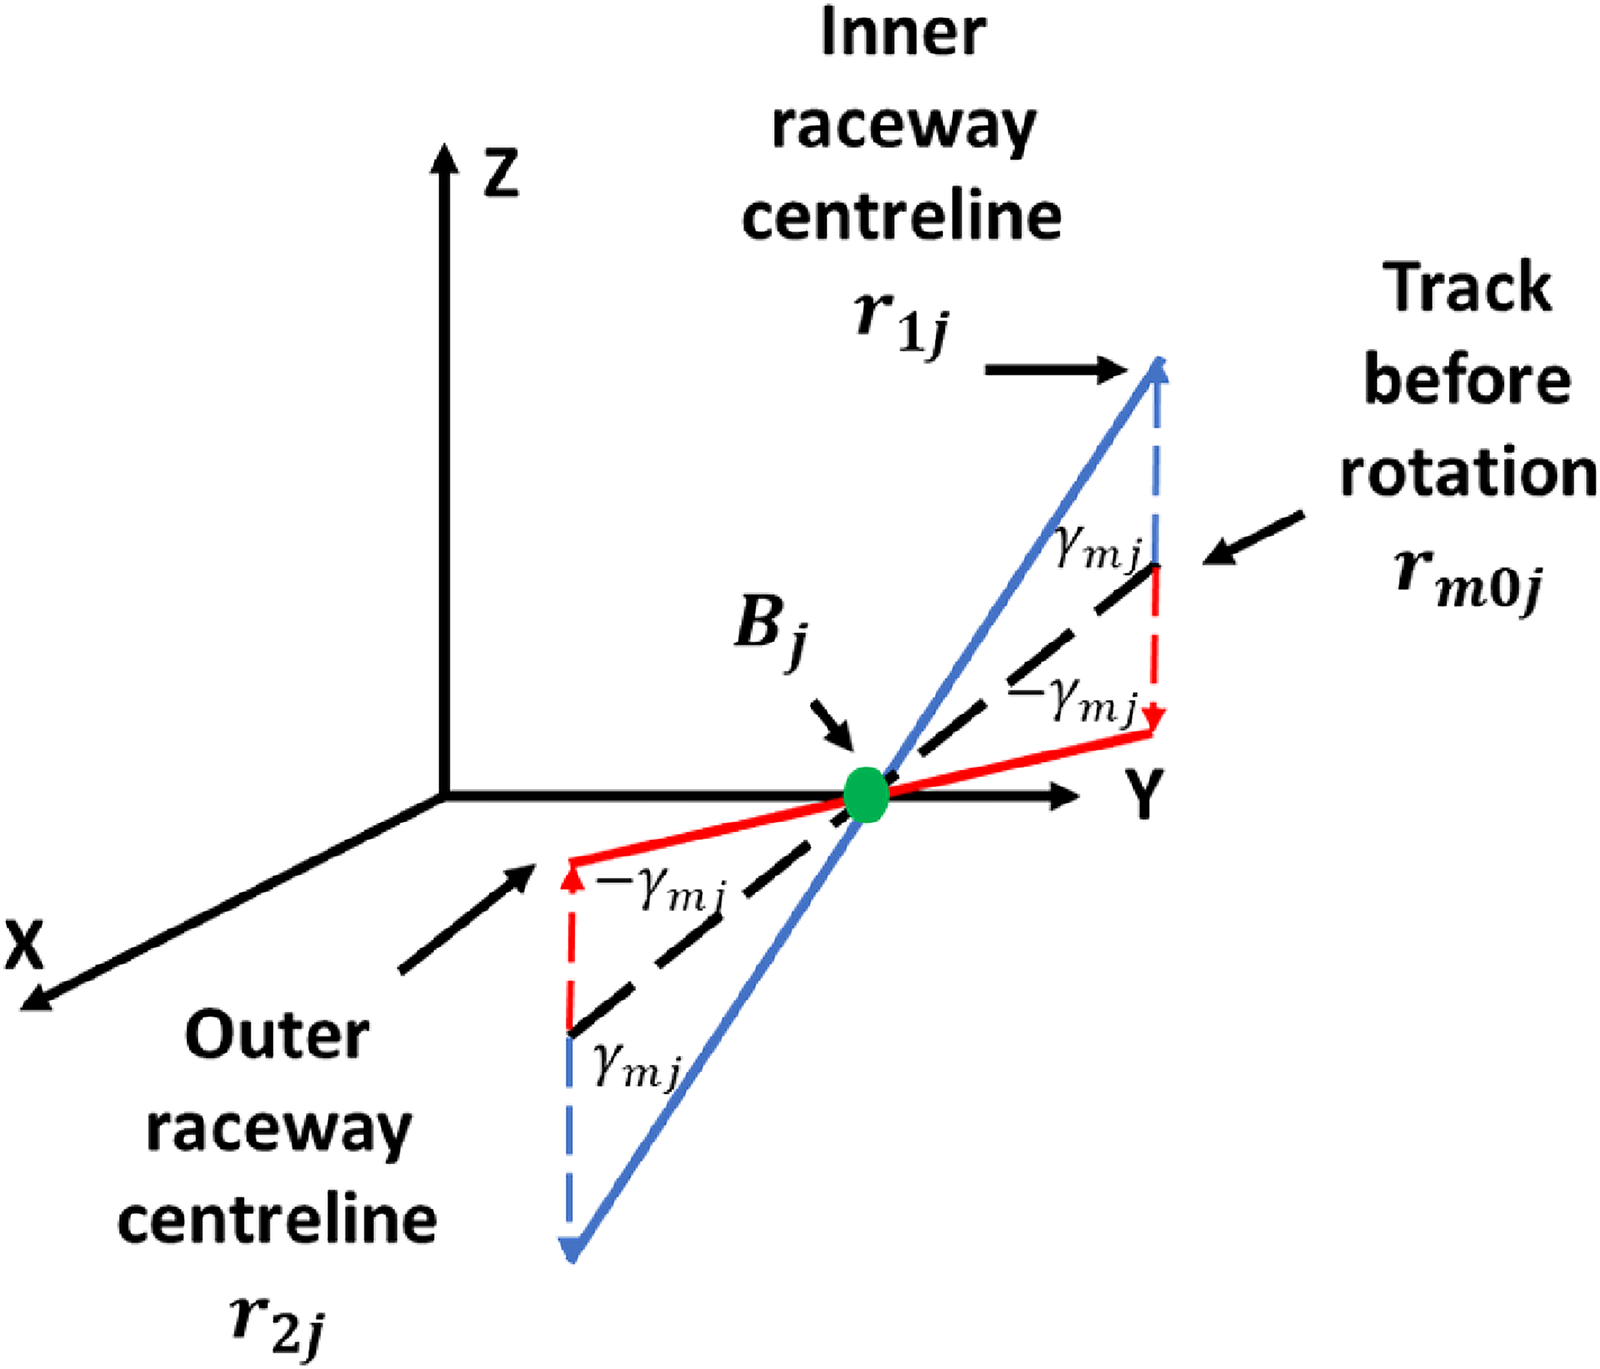
The initial track centrelines are defined for a straight track profile at each ball-raceway conjunction as:

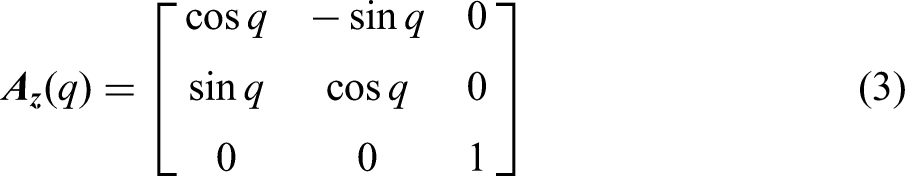
Track centreline vector rotations, (a) pitch angle
The initial track is defined for a CVJ at zero inclination angle and initial angular position of the joint. Further manipulation is required to account for the joint half inclination angle
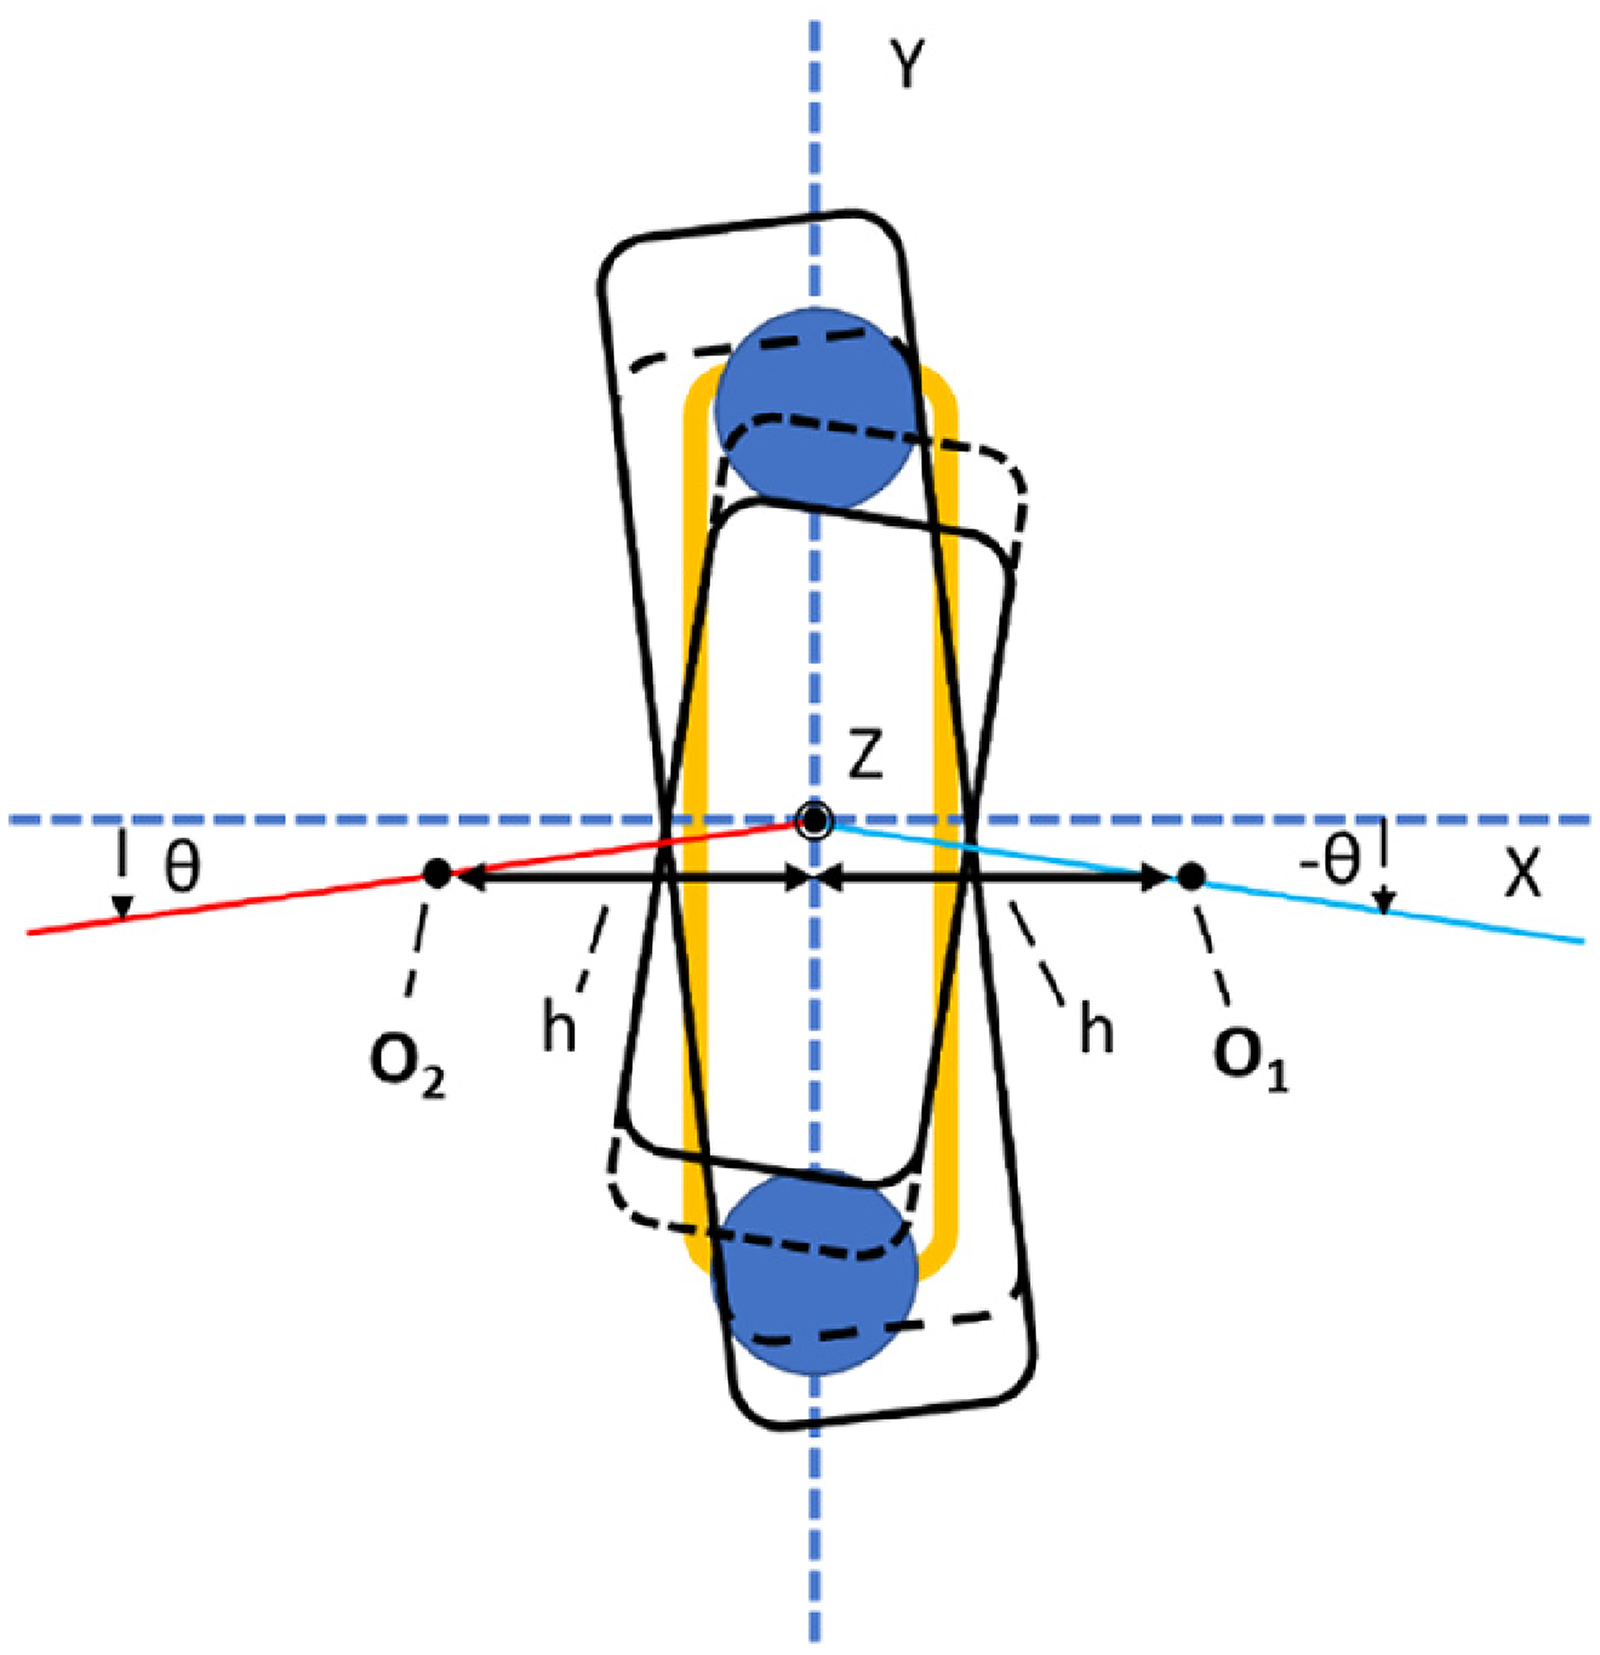
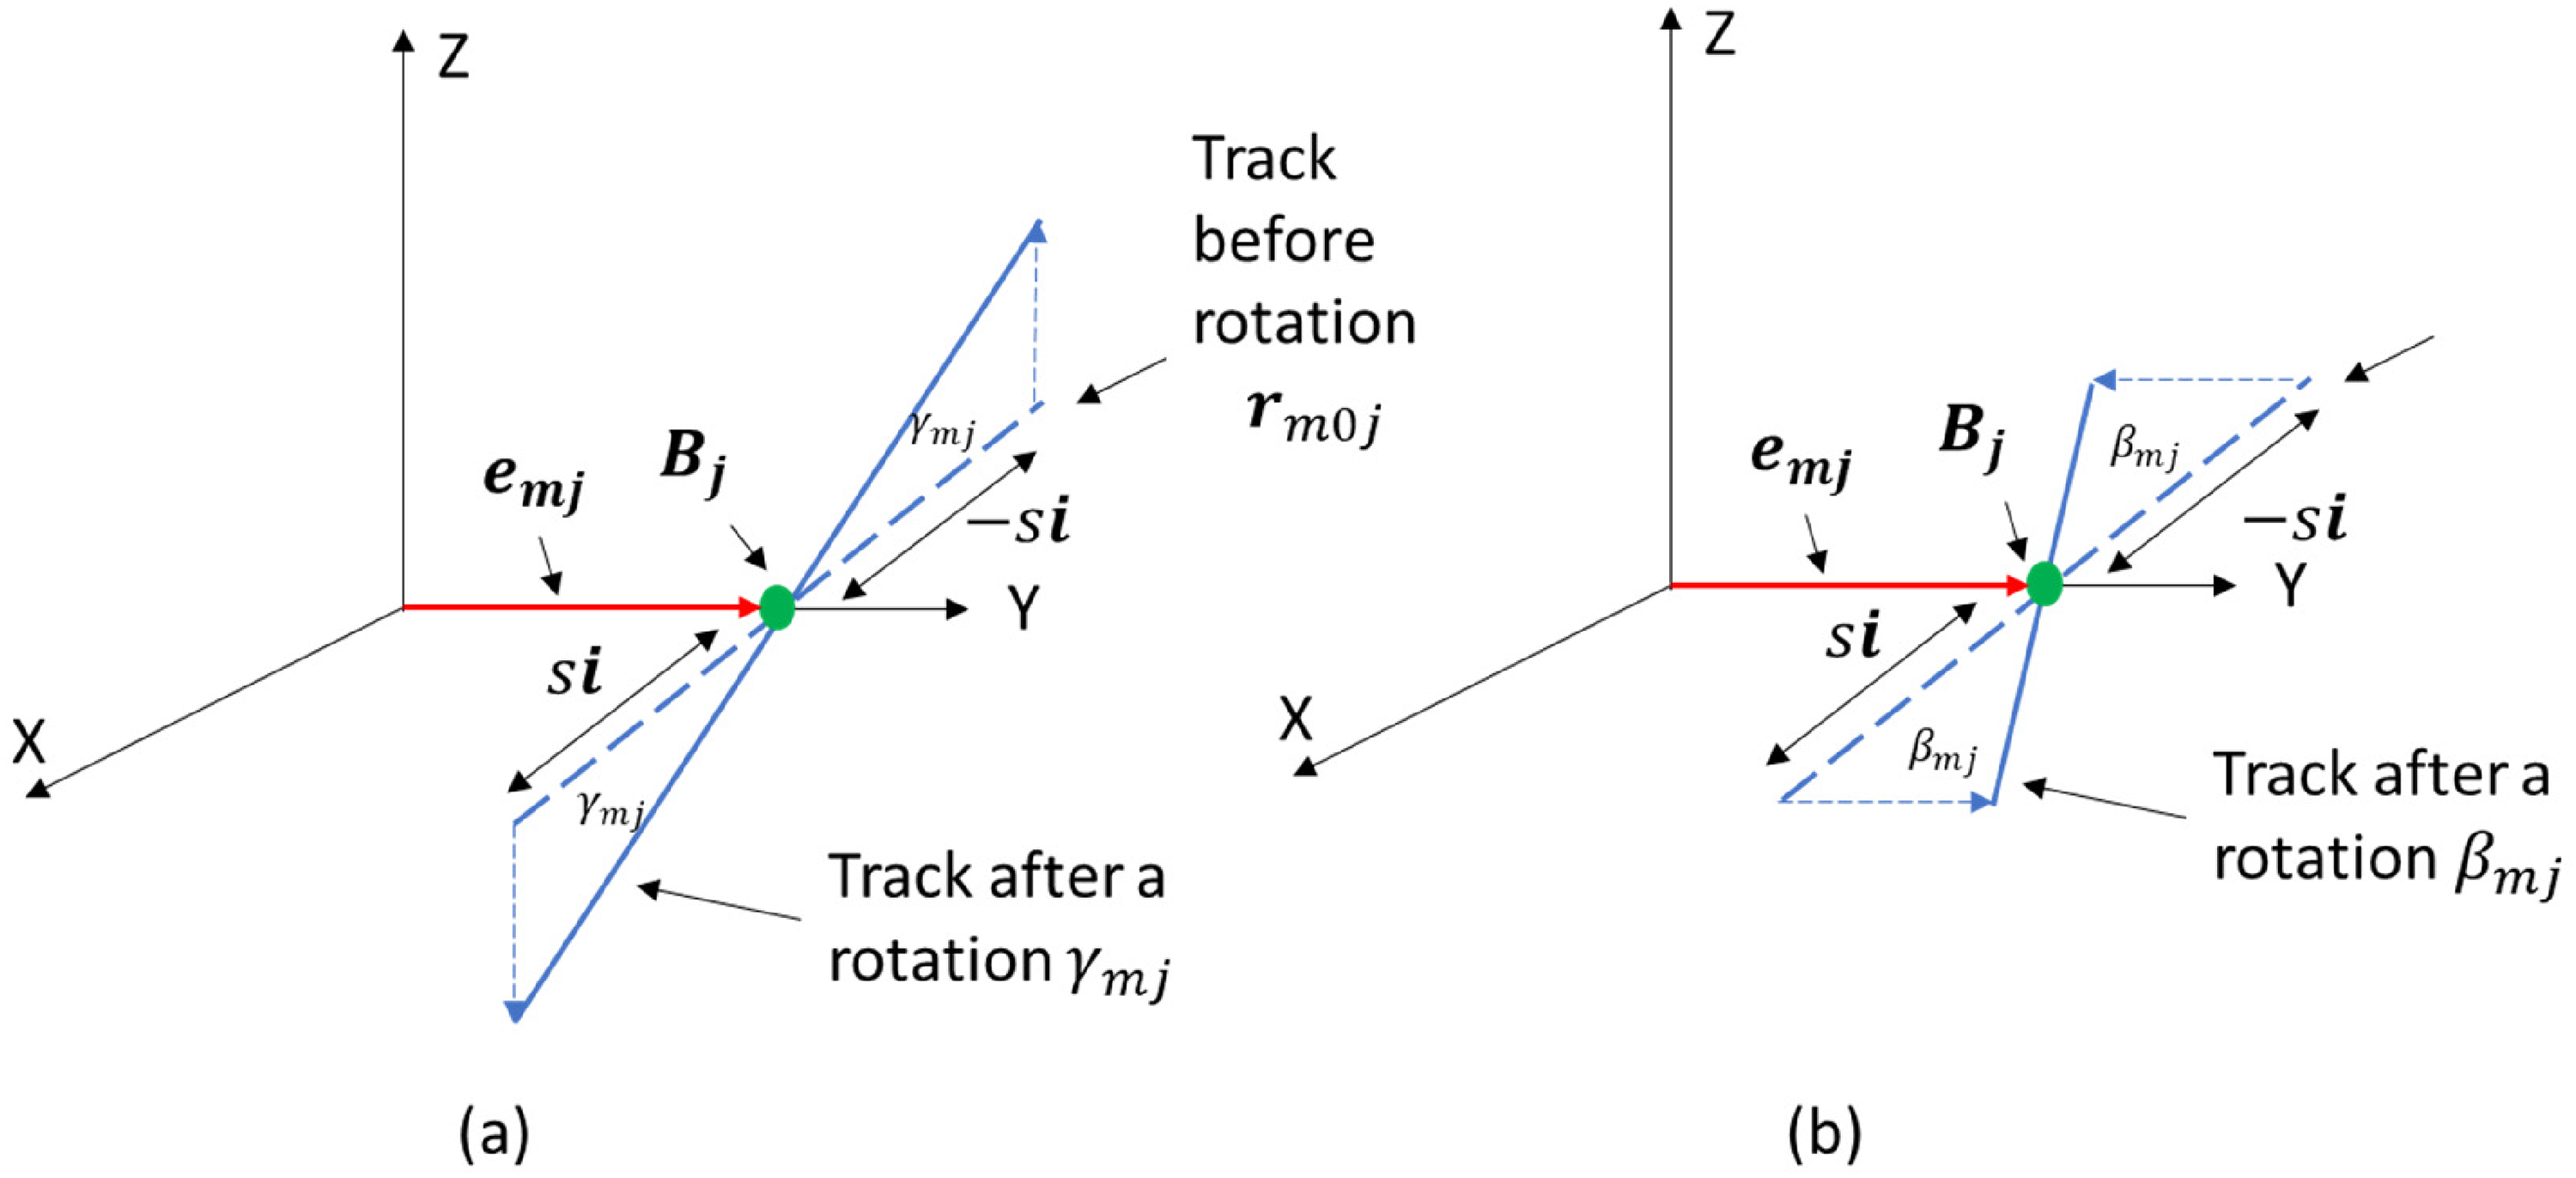
Raceway centre offset h, the X translation of the cage spherical surfaces
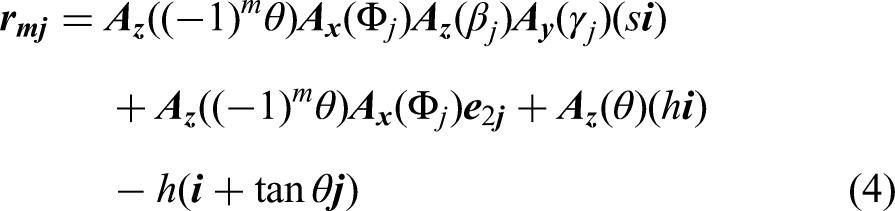
The final position of each track centreline is defined by:
Representative ball position and tracks intercept with YZ plane for
Four contact vectors
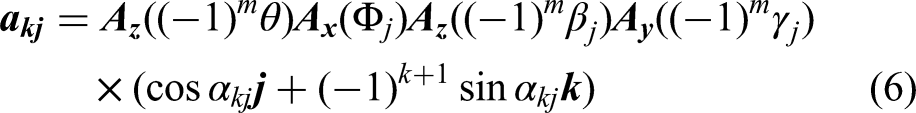
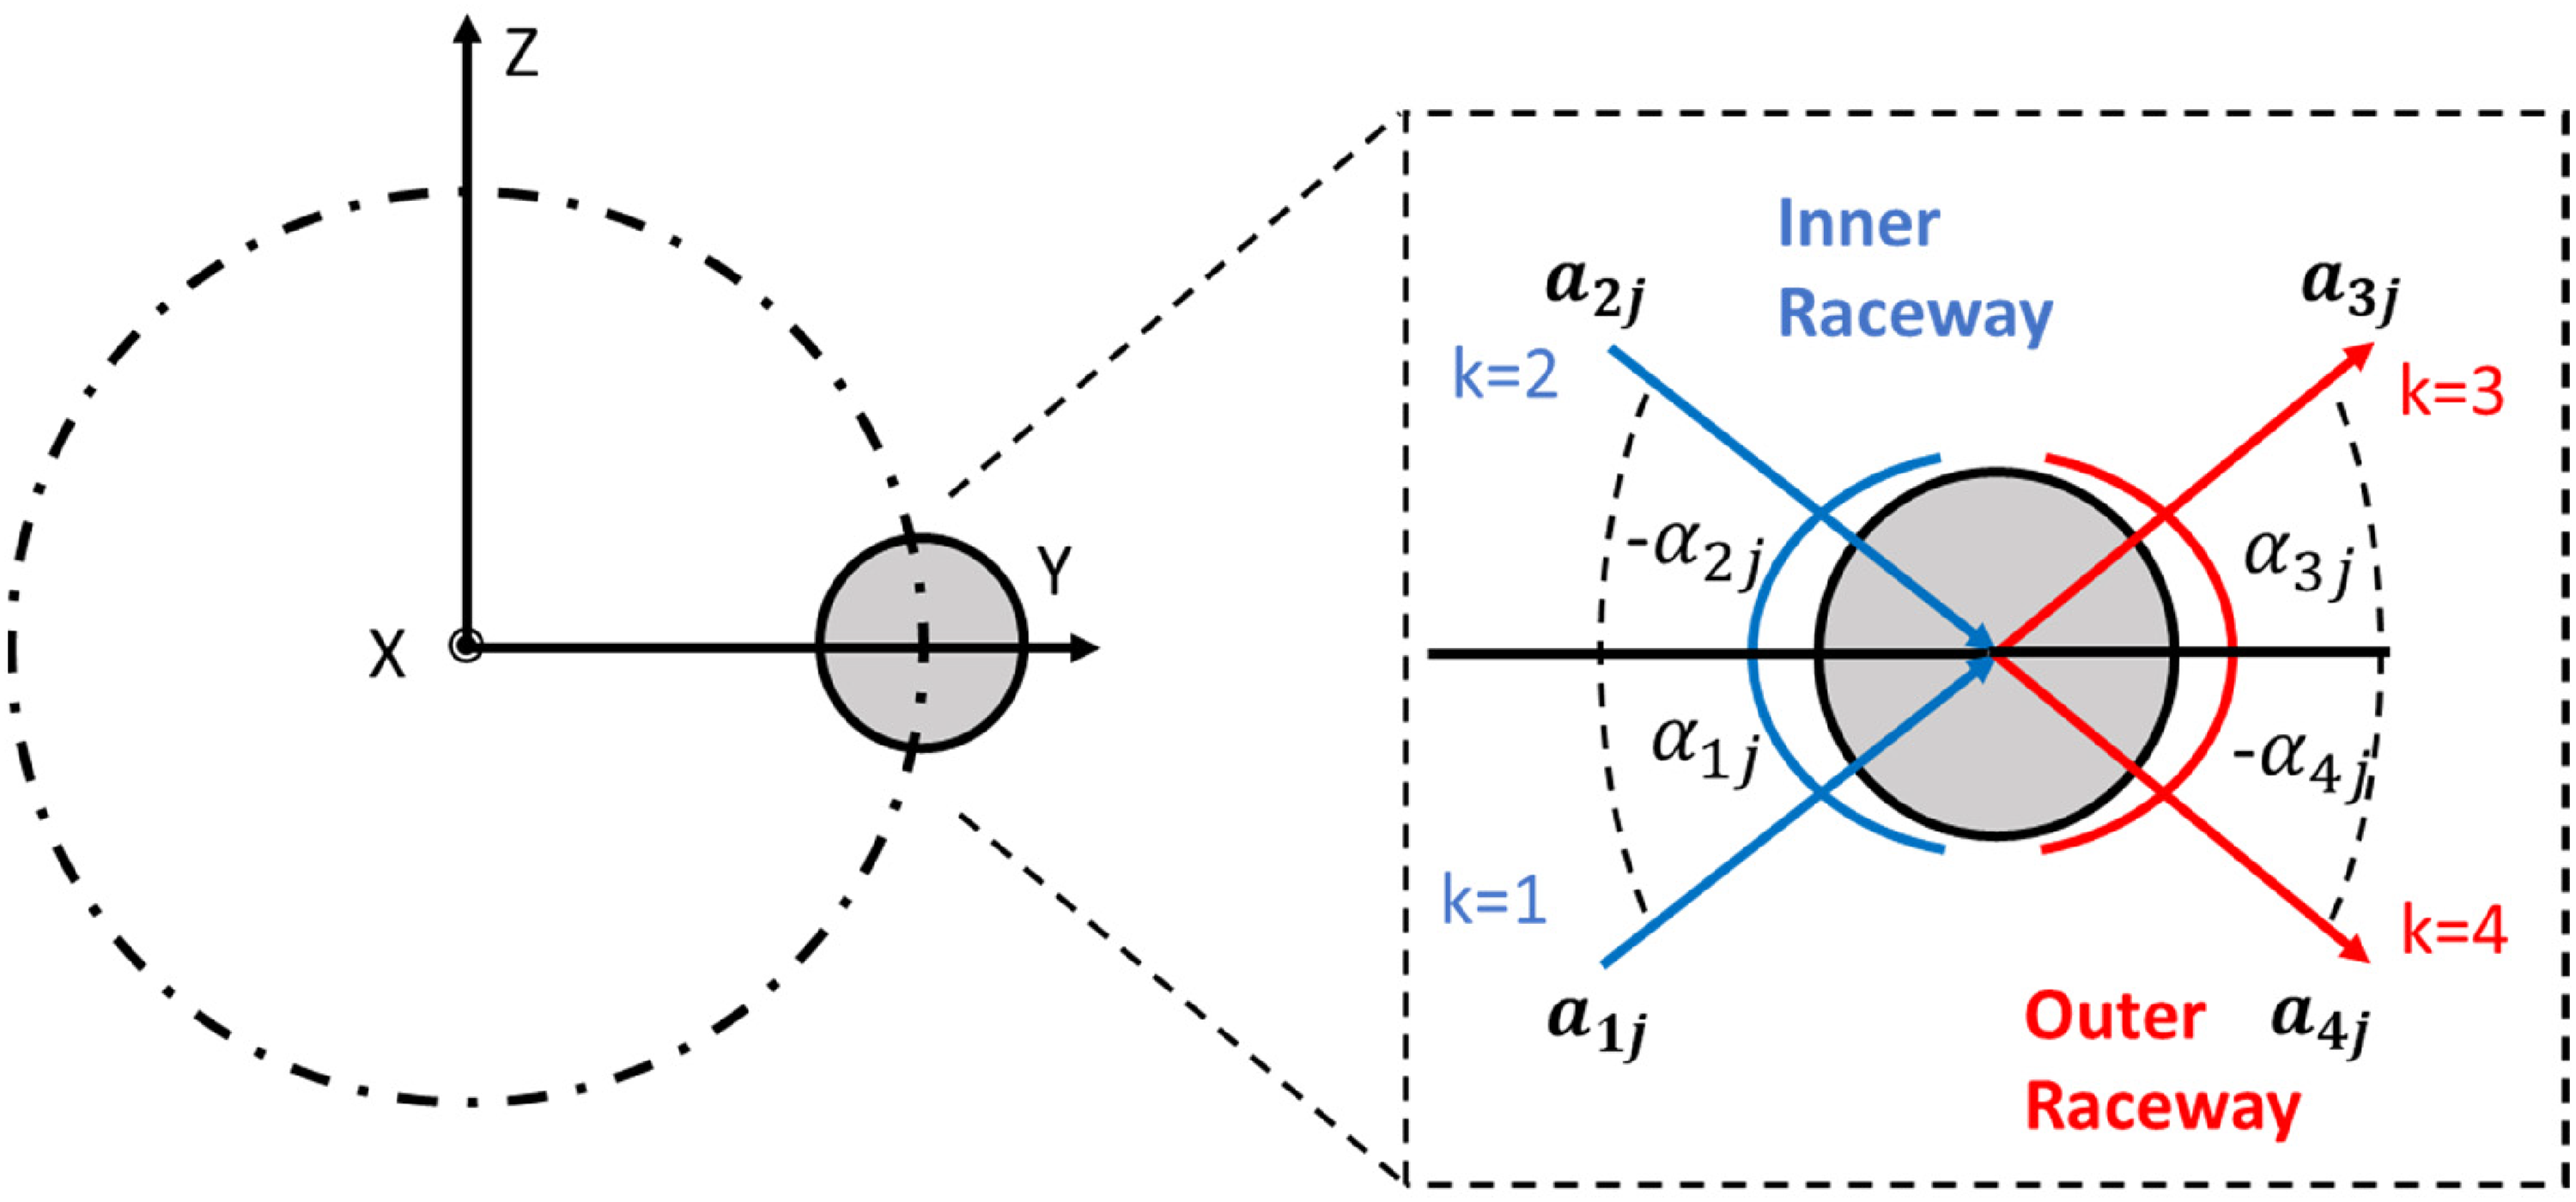
The contact vector
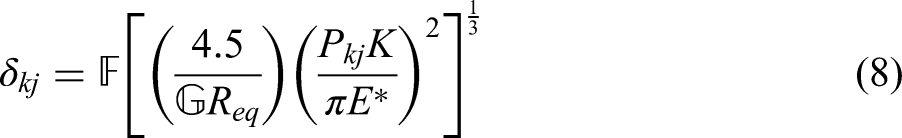
Utilising these geometric definitions, the contact interferences

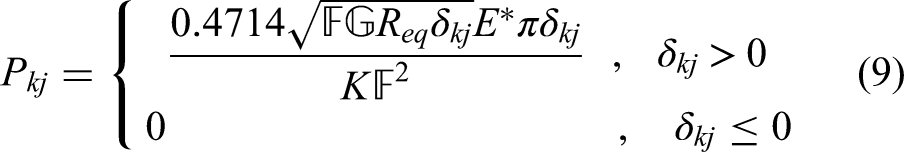
To determine the contact force imparted by the interfering components, Hertzian contact theory is applied. The method of Hamrock and Brewe
20
is utilised, where the contact force
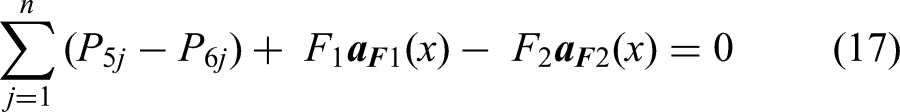
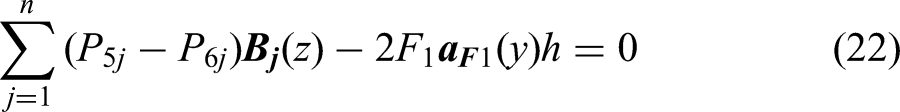
The contact forces can be utilised to set up and simultaneously solve the equations associated with the force balance of the CVJ. The setup outlined by Kimata
4
is applied to the cross groove joint. The constraint relationship between the cage and the two raceways is determined by:


Thus,

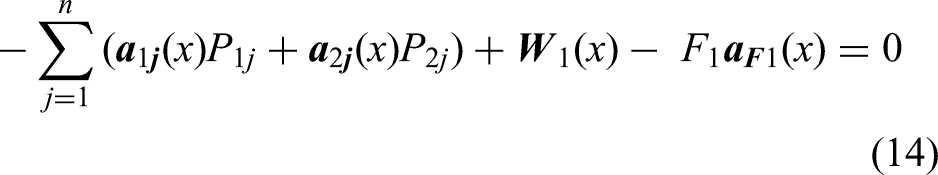
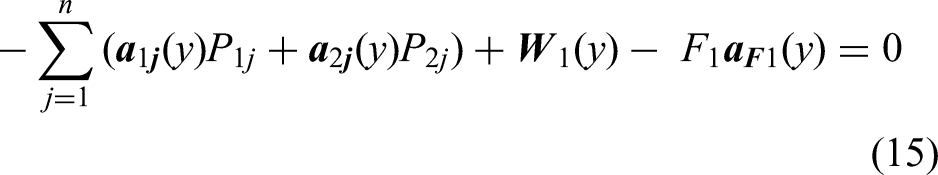


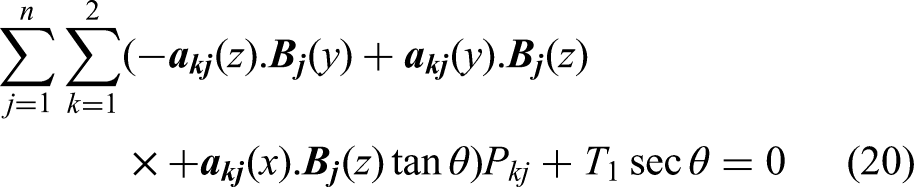
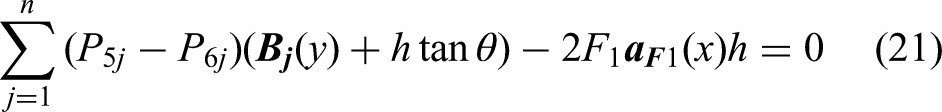
The balance of the moments about the X axis on the inner race is described by:


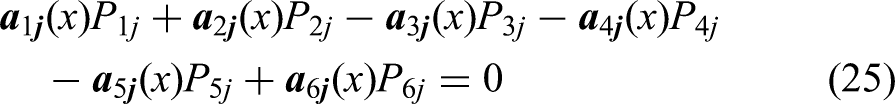


Setup of simultaneous equations and their related unknown variables.
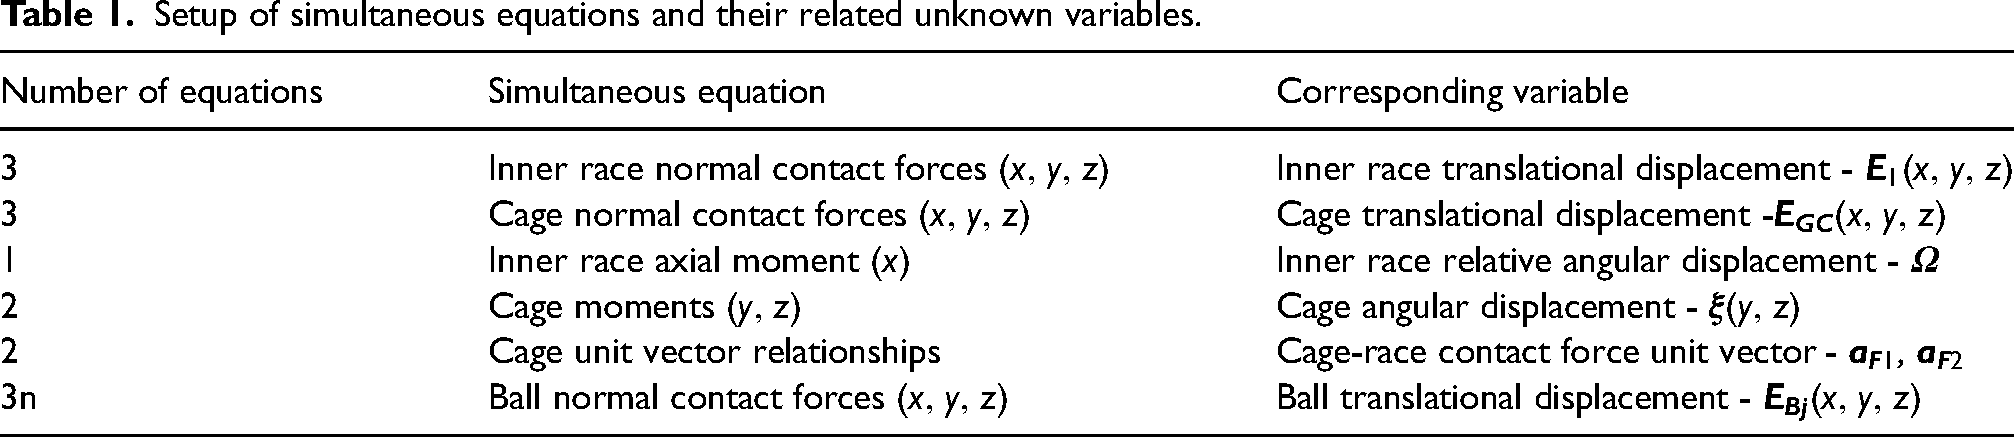
The system of equations is constructed in MATLAB, and solved using the ‘fsolve’ function, which is a nonlinear iterative function aiming to solve the system of equations
Solution diagram for the complete model.
The topography of a wear scar on a used cross groove CVJ is measured to investigate the correlation between the wear pattern and the predicted contact forces. The CVJ sample is made of a case-hardened steel material, coated with a hot black oxide surface treatment. The coating is intended to mitigate a pitting failure mechanism in the raceways. Analysis of surface topography results indicates that wear had developed in an approximately rectangular shaped patch at the centre of each raceway. The wear results in the coated being completely removed from the surface. The schematic in Figure 10 demonstrates the approximate position of the wear patches.
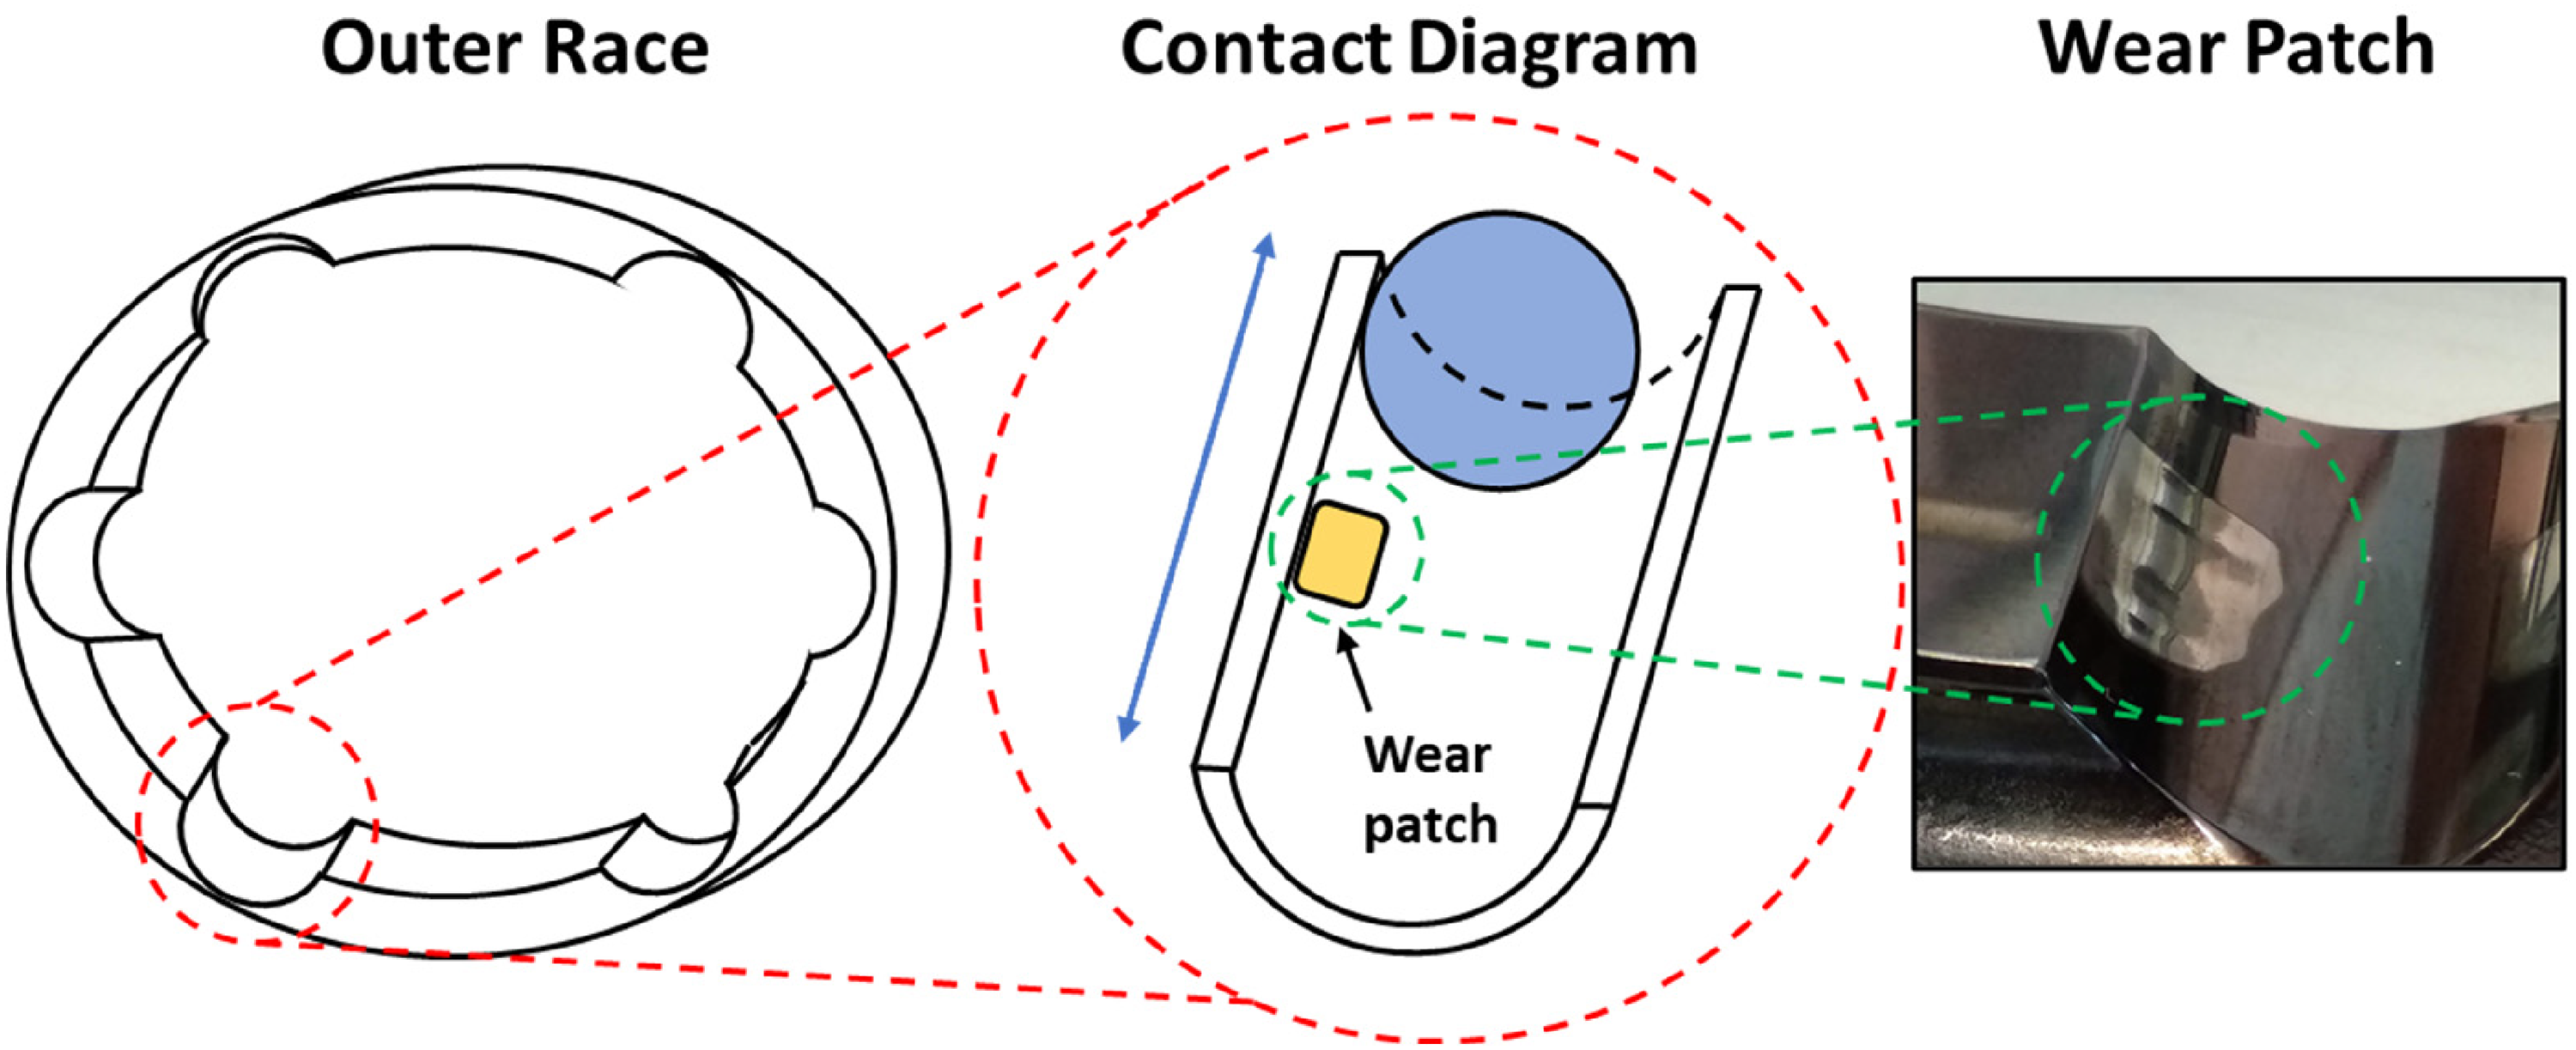
wear patch position schematic.
Surface measurements were carried out using the Bruker NPFLEX. This optical microscope measures surface topography using the White Light Interferometry principle. The NPFLEX lens should be as perpendicular as possible to the surface for accurate measurements. Due to the ring shape of the CVJ outer raceway, microscope lens cannot easily access the track groove. Therefore, a standard mirror was utilised to reflect the light from the track surface into the NPFLEX lens. A reference surface with known surface characteristics is used to validate the reflection mirror technique. The proposed technique showed no impact on surface roughness parameters. Therefore, the mirror reflections will not impact larger surface topography features such as wear scar. However, the mirroring direction should be accounted for in the postprocessing. Measurements were carried out using a 10x magnification long working distance lens. This magnification factor produces a scan area of approximately 0.5 × 0.6mm2. To capture the full area of wear scar, multiple scans of the area are recorded and stitched together in NPFLEX software. The measured data is levelled, and the form of the groove is removed using the MountainsMap software.
The proposed model predicts the displacements and contact forces within a cross groove CVJ. The reliability of the results is assessed using the findings of Bauer
3
for a commercial cross groove CVJ. Bauer provides only the pitch angle
Validation input parameters.
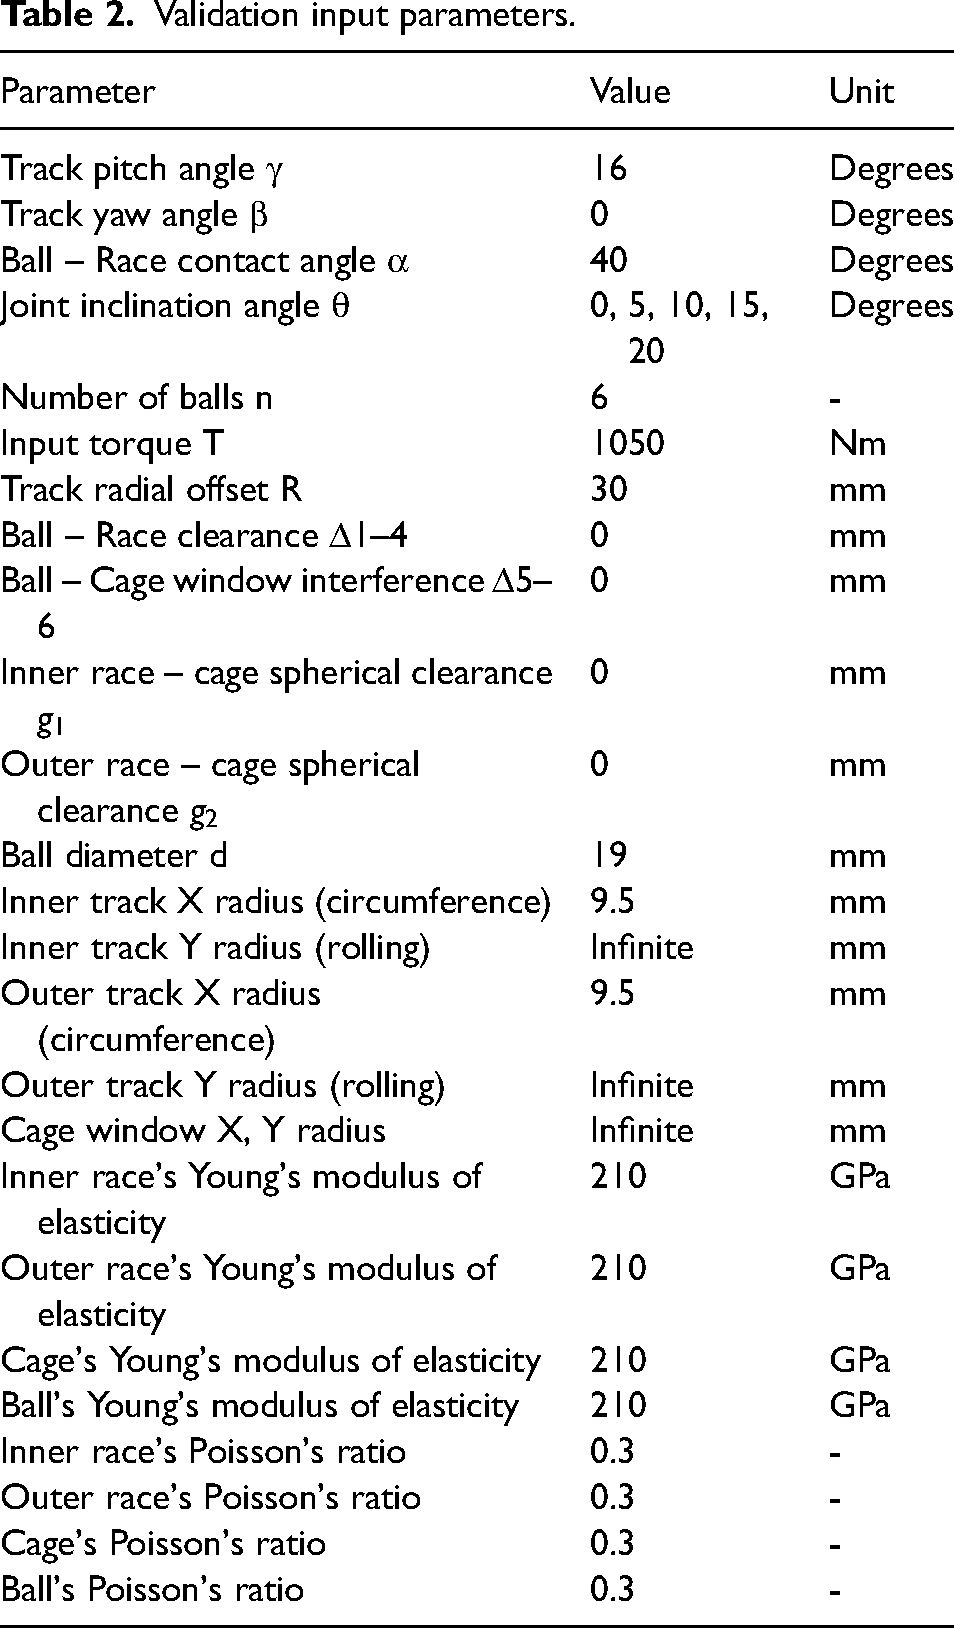
Validation input parameters.
The contact force variation with the rotational displacement and inclination angle was used for validation purpose. The predicted results by the proposed cross groove CVJ model are compared with the contact forces from Bauer's model.
3
The results of Bauer are phase shifted by 90° to match the defined phase position of the adapted model. Figure 11 presents the contact force in dimensionless 
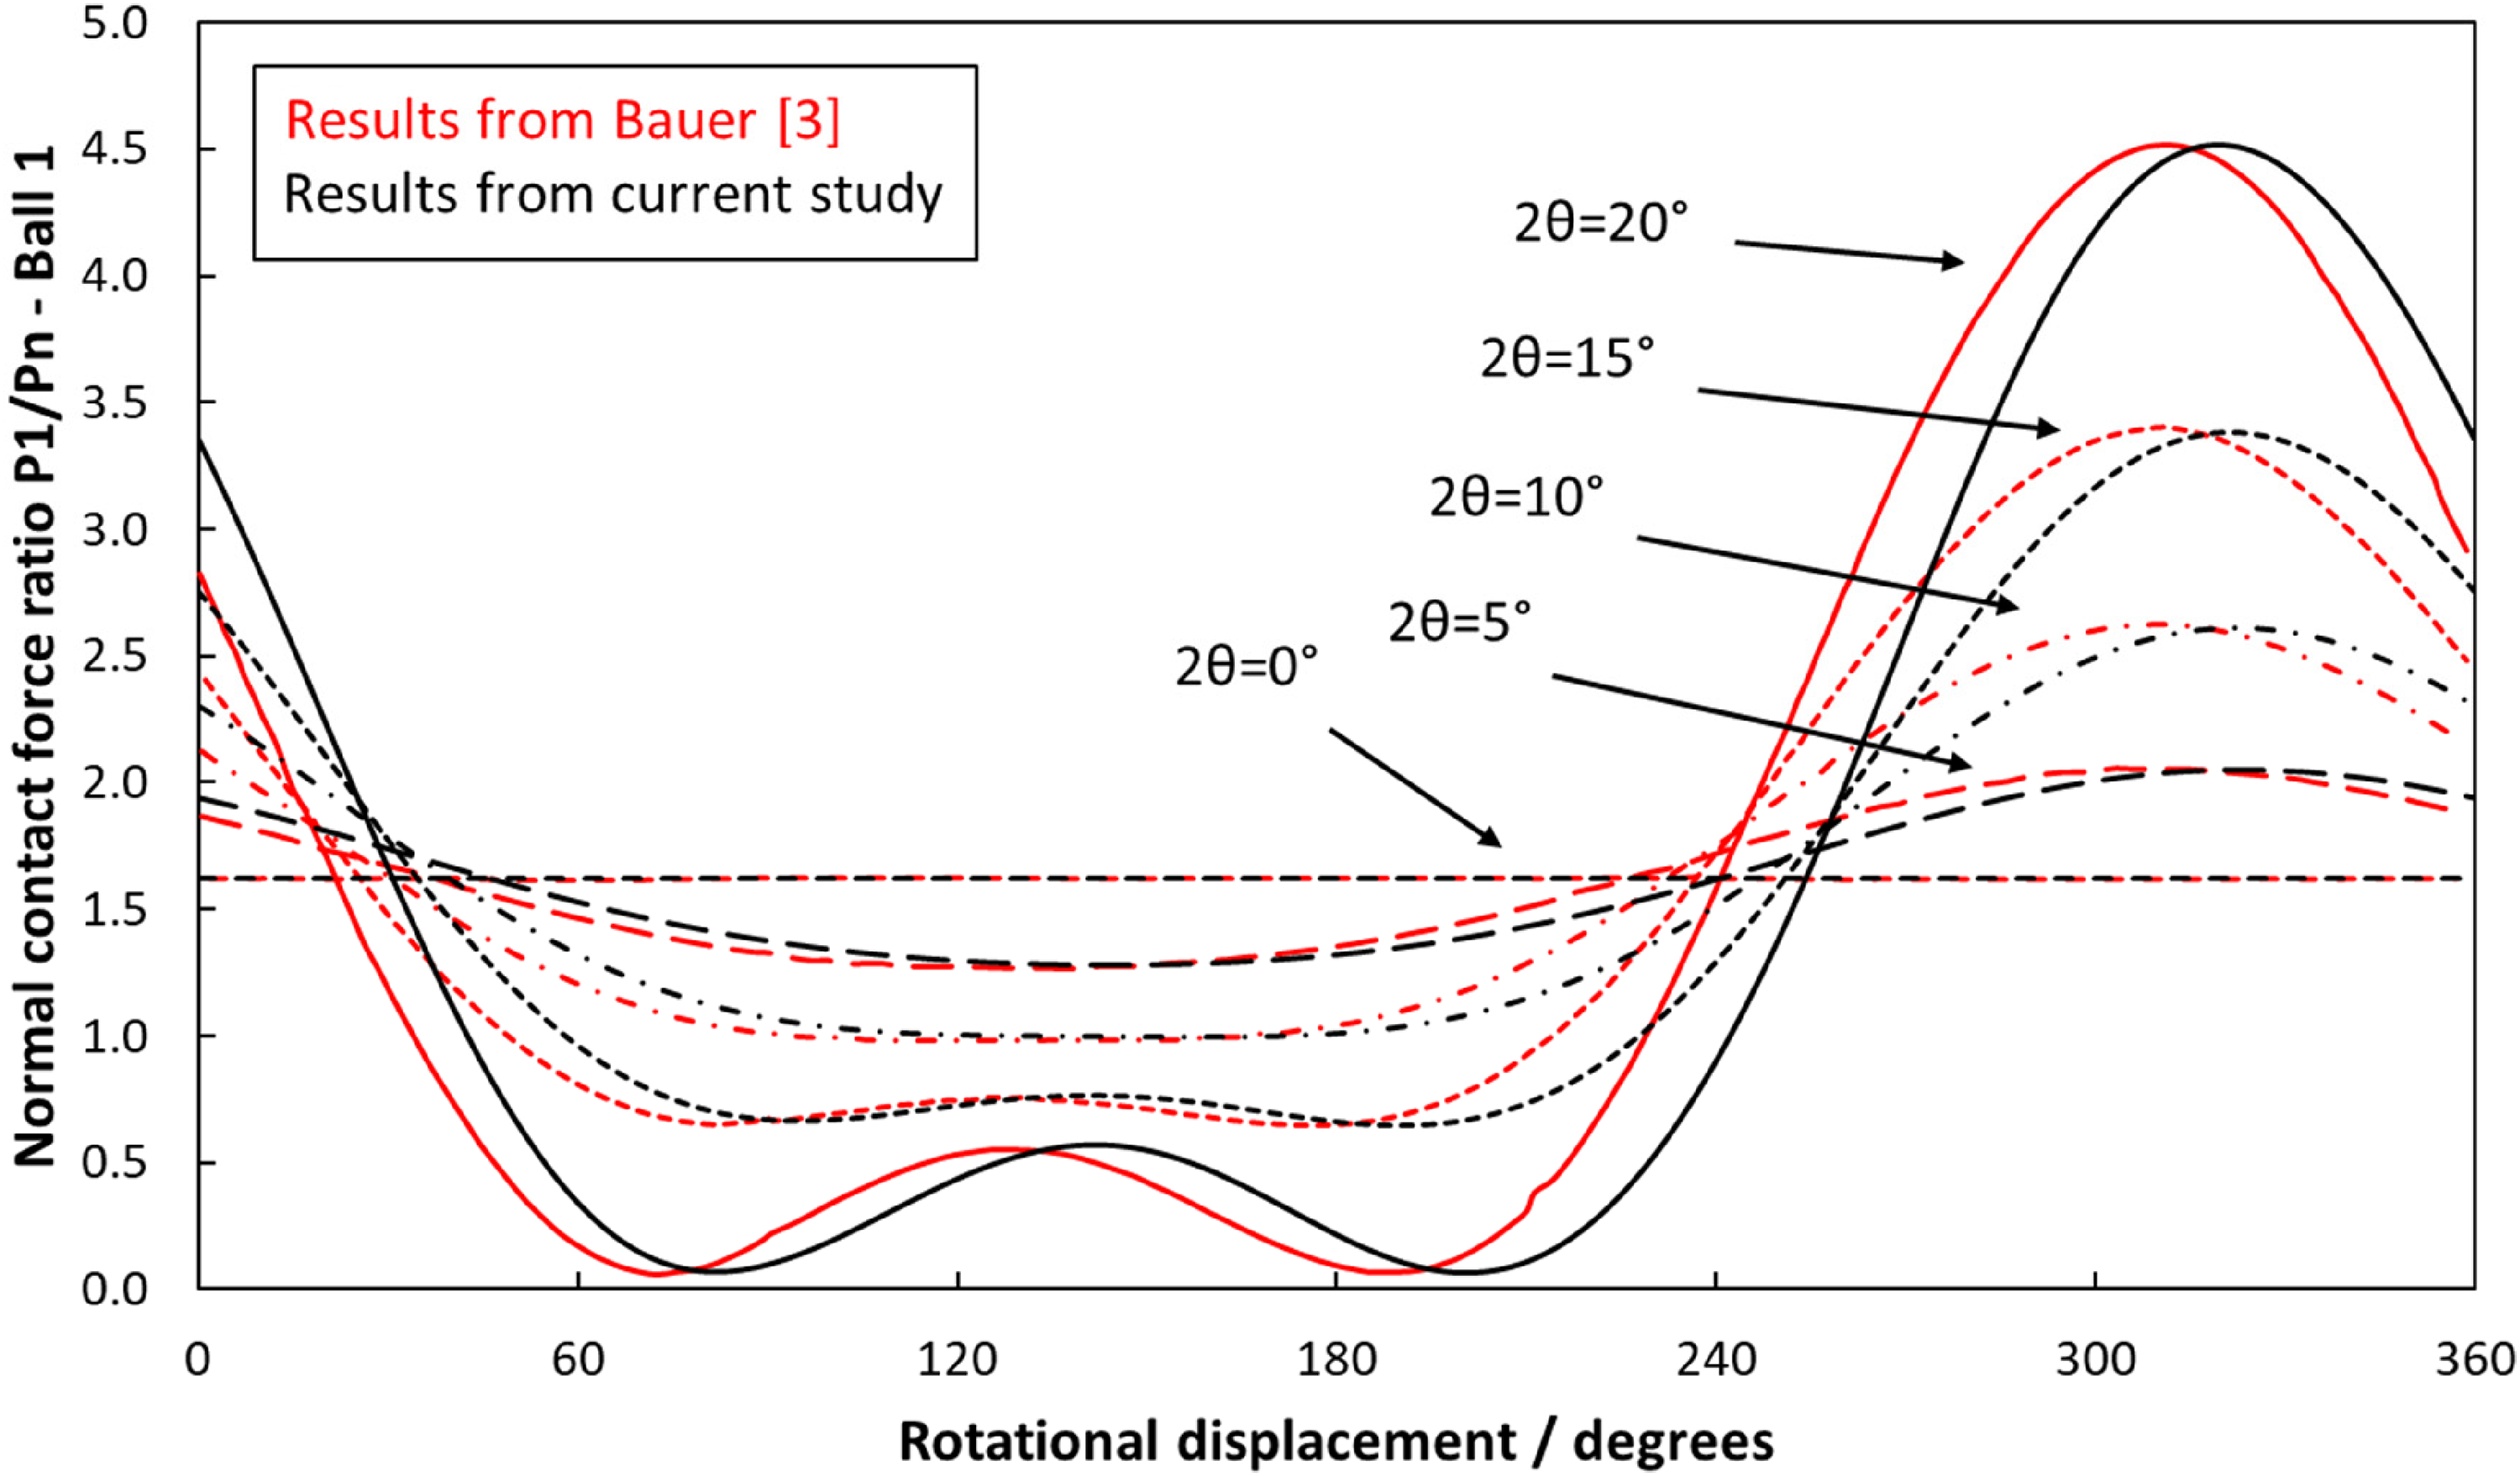
Validation of results for inner race driving normal contact force
Although the force between the ball and cage does not directly contribute to the failure observed in the ball and race contact, a further comparison is presented for the case of the ball – cage window contact
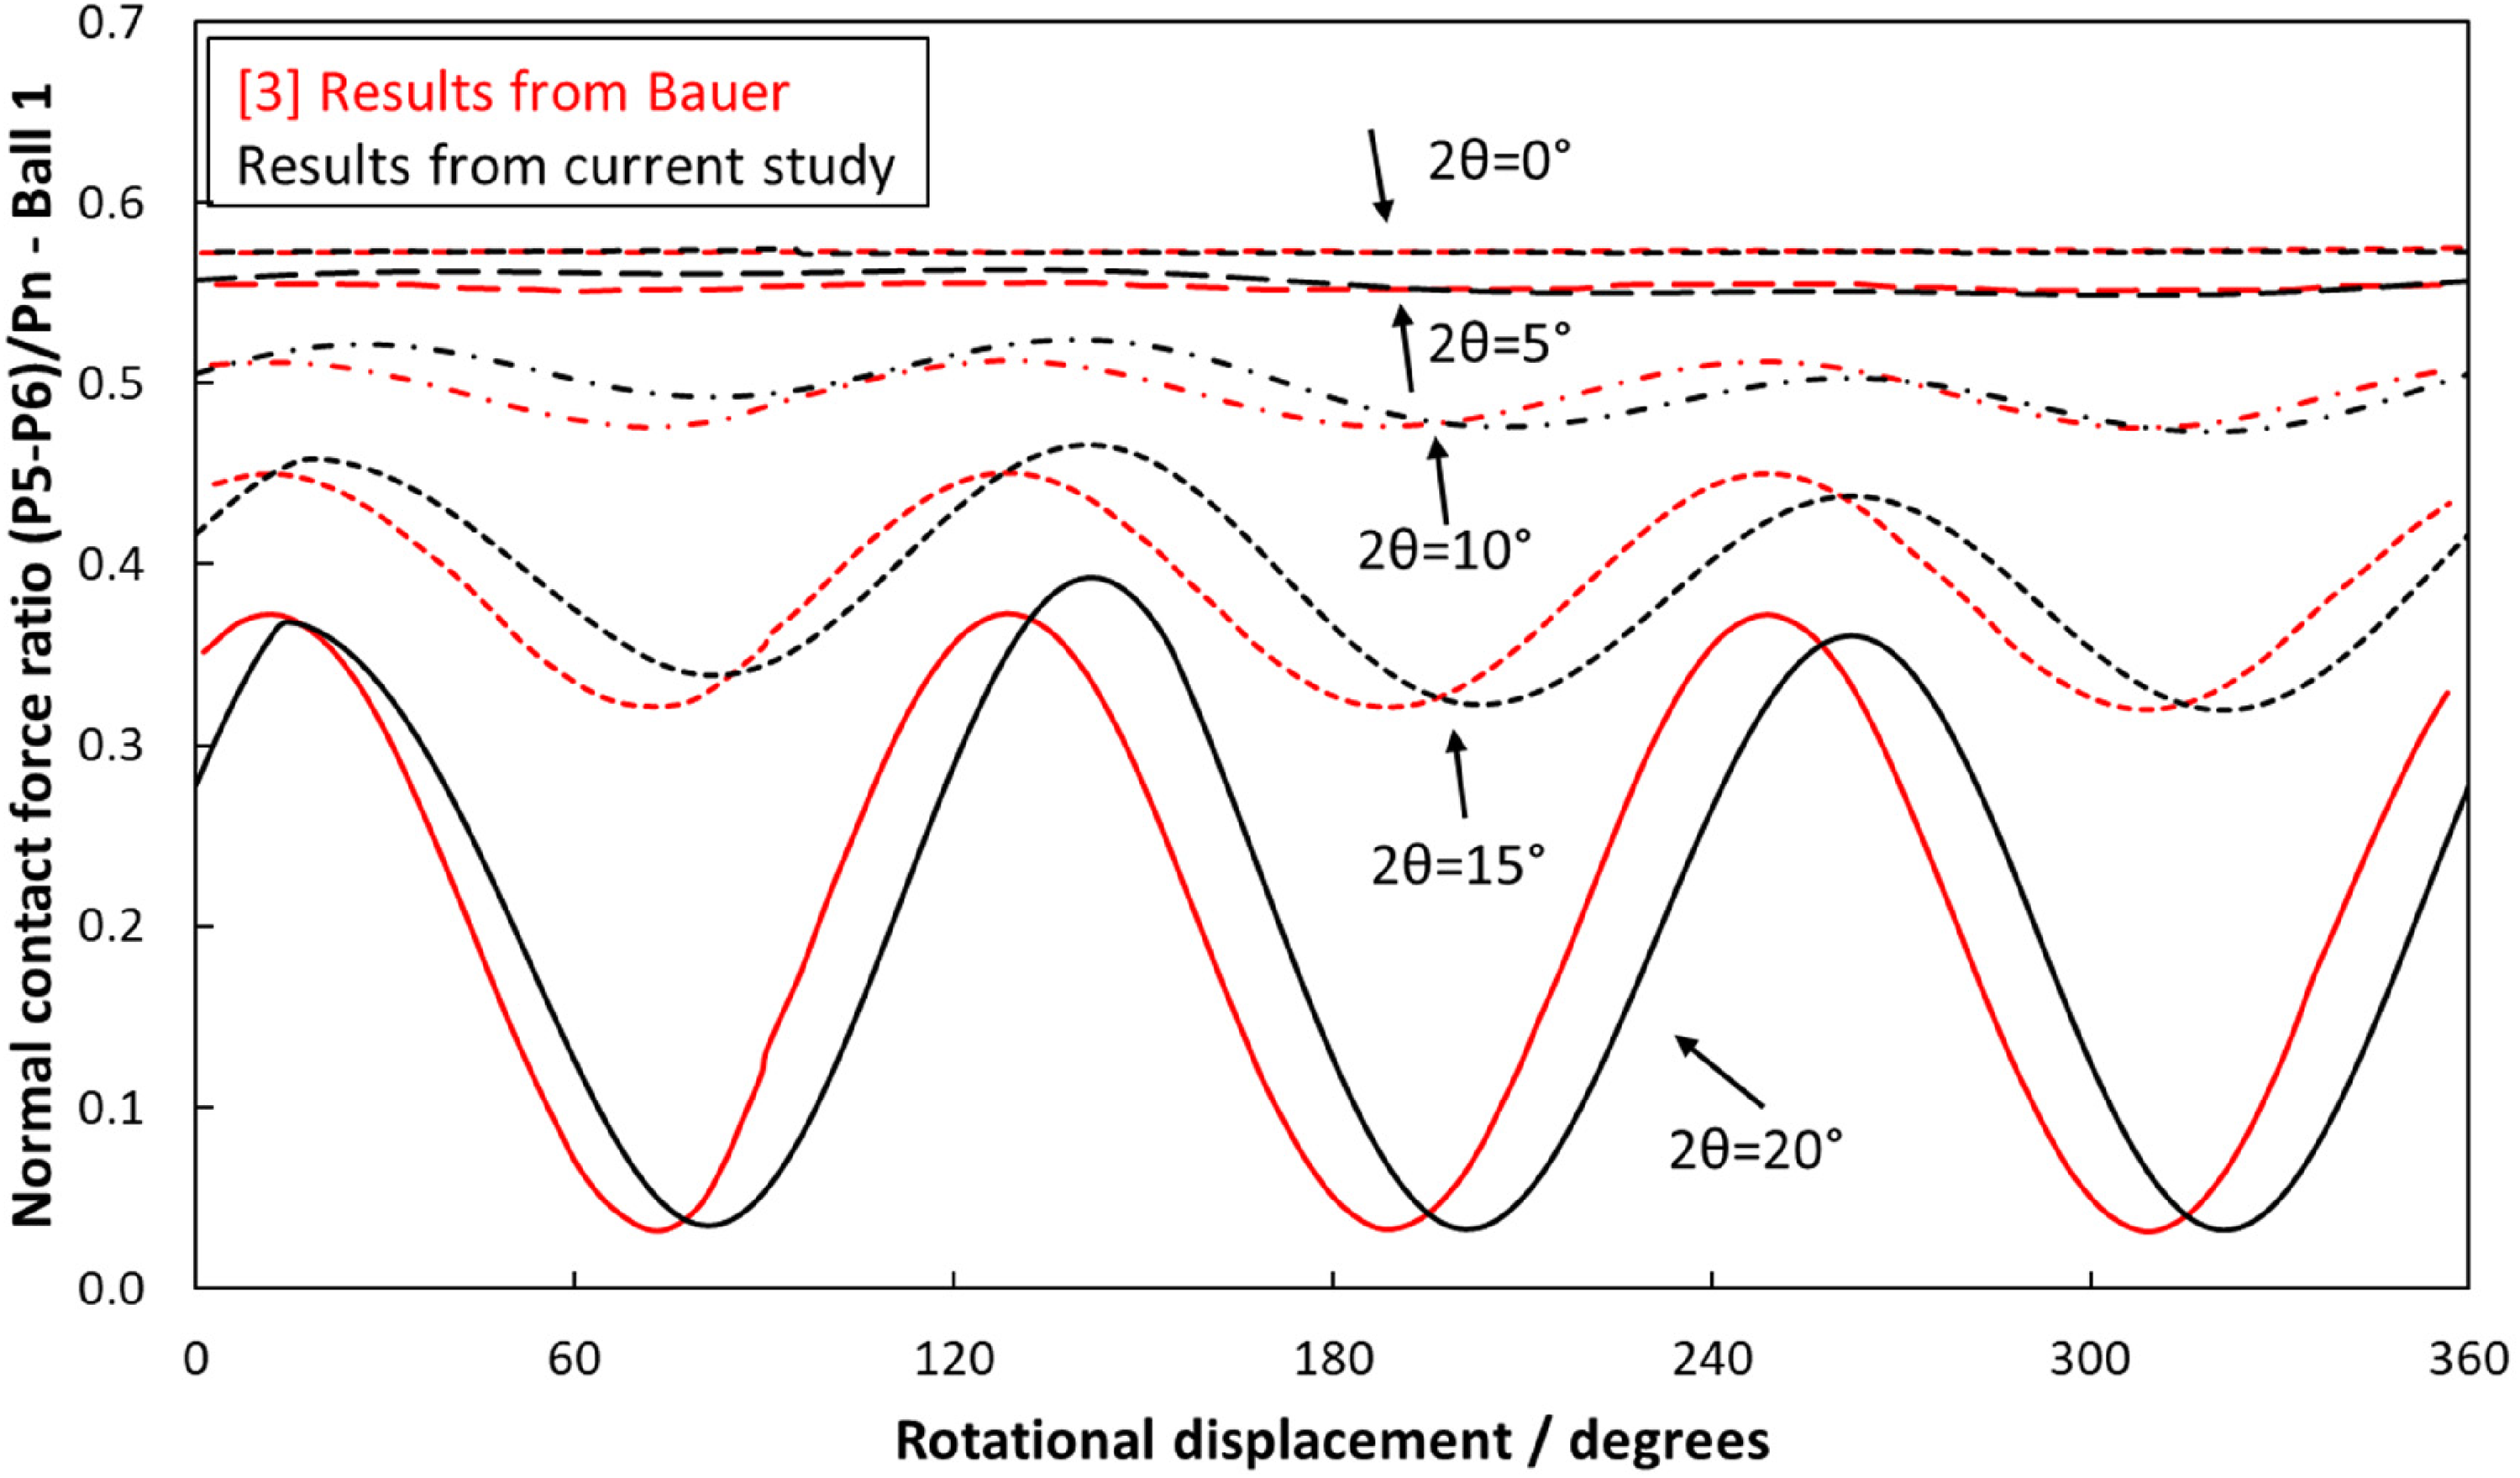
Validation of results for ball – cage window contact force
A 10° phase difference is observed between the profiles from the two models. This deviation is likely related to the differences between the two models. Bauer's model does not consider the effect of clearances, the potential cage-race contact force, or the possibility of the ball-race contact occurring on the non-driving side of the raceway (
Investigations are carried out using the input conditions detailed in Table 3. These conditions have been measured from a small batch cross groove joint used for automotive racing applications. The sample joint is known to run in angles in the range 8–12 degrees, and therefore only this range is investigated.
Measured input parameters from the sample joint.
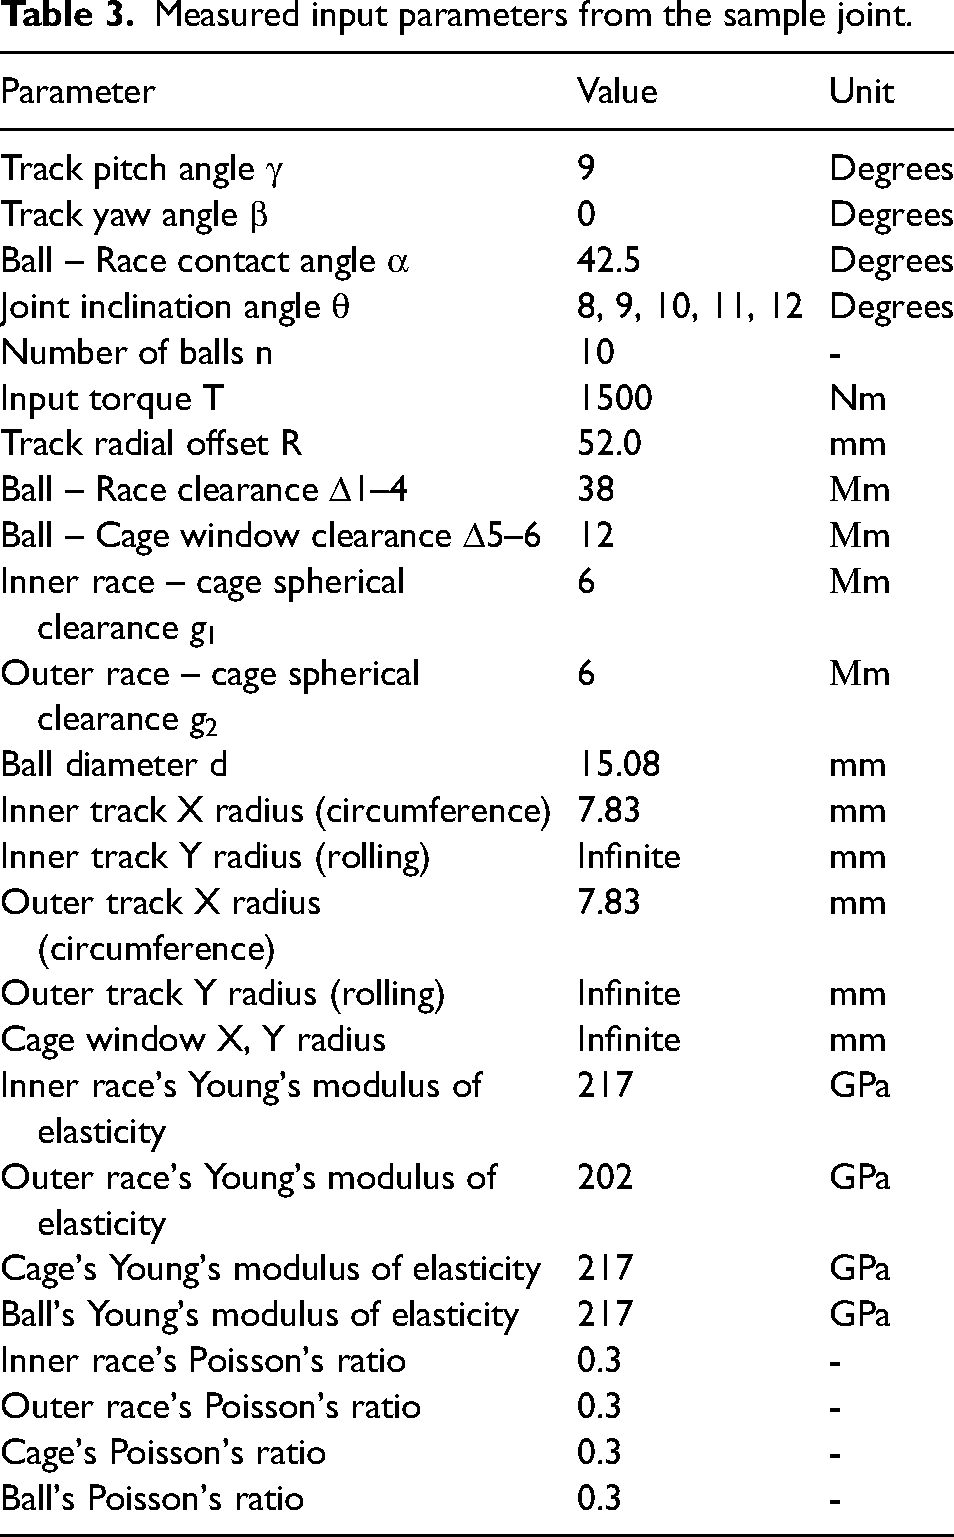
Measured input parameters from the sample joint.
The normal contact force
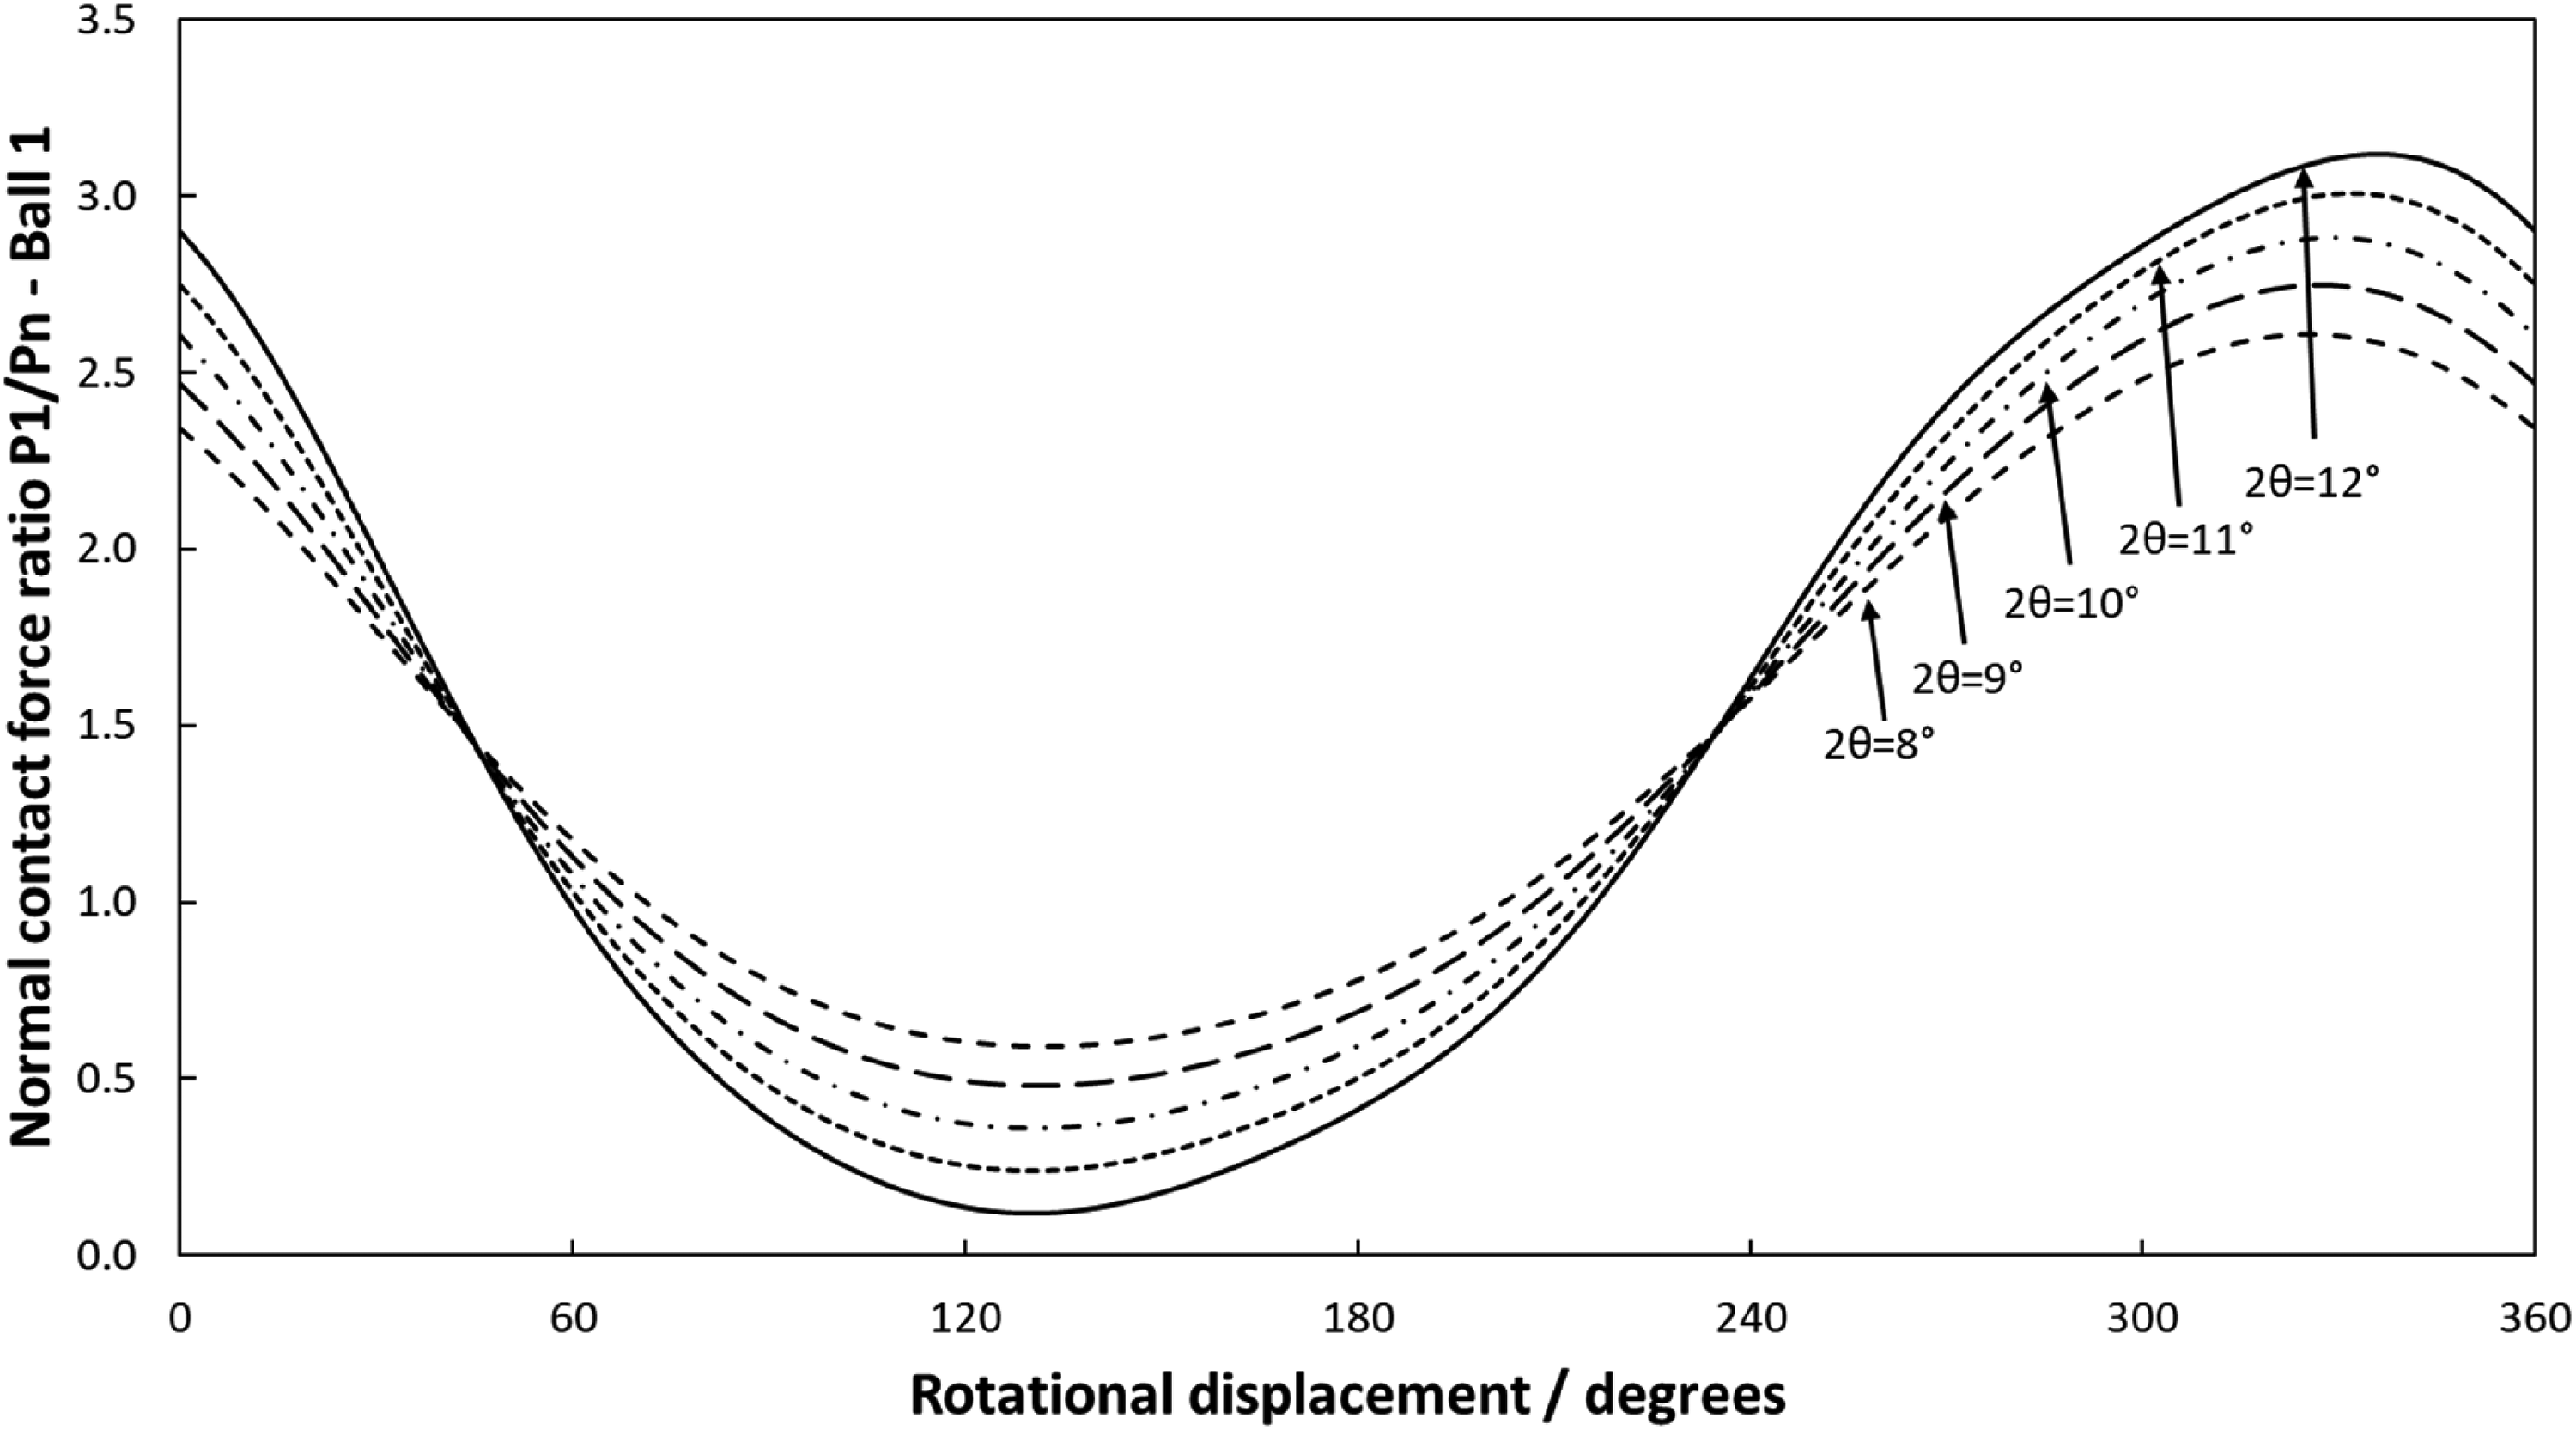
Inner race driving normal contact force
Figure 14 shows the contact force results for the full set of balls within the joint at 10 degrees inclination angle. Contact forces for the ten balls case follow two profiles with 180° phase difference. The two profiles are identical apart from their expected phase difference. The balls can be divided into two sets, alternating as the tracks are angled (Figure 15).
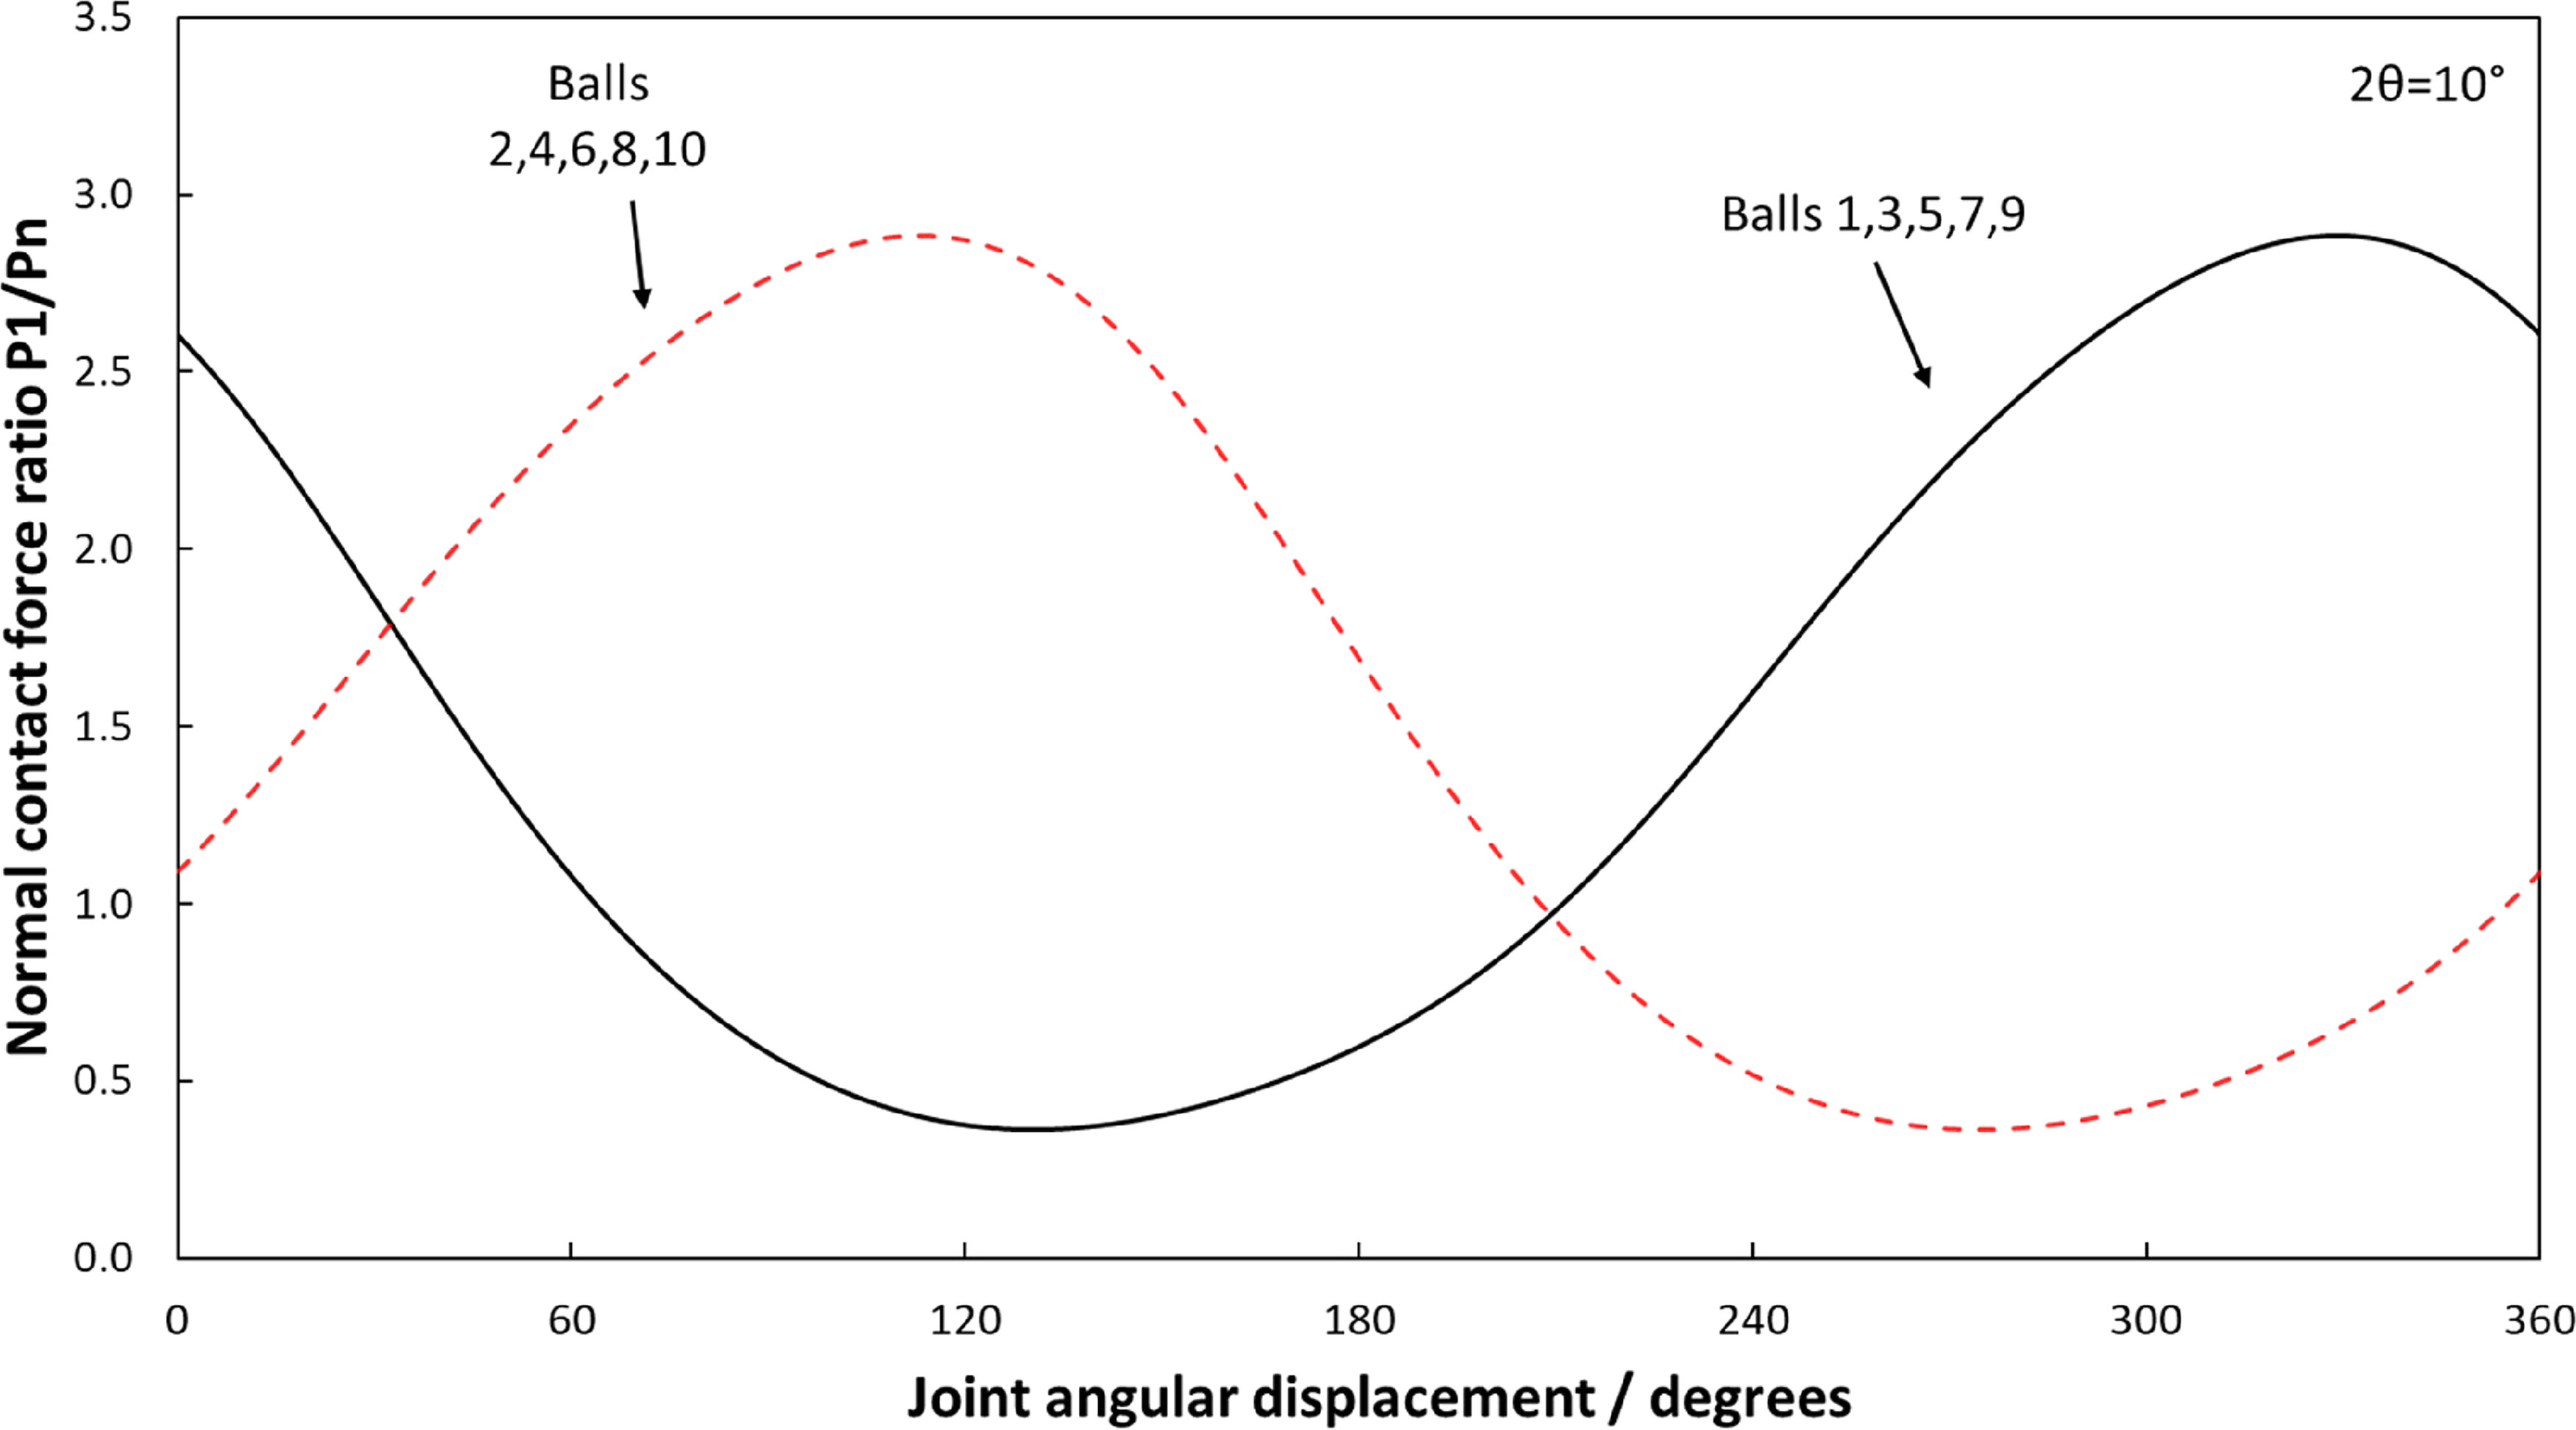
Dimensionless contact force ratio
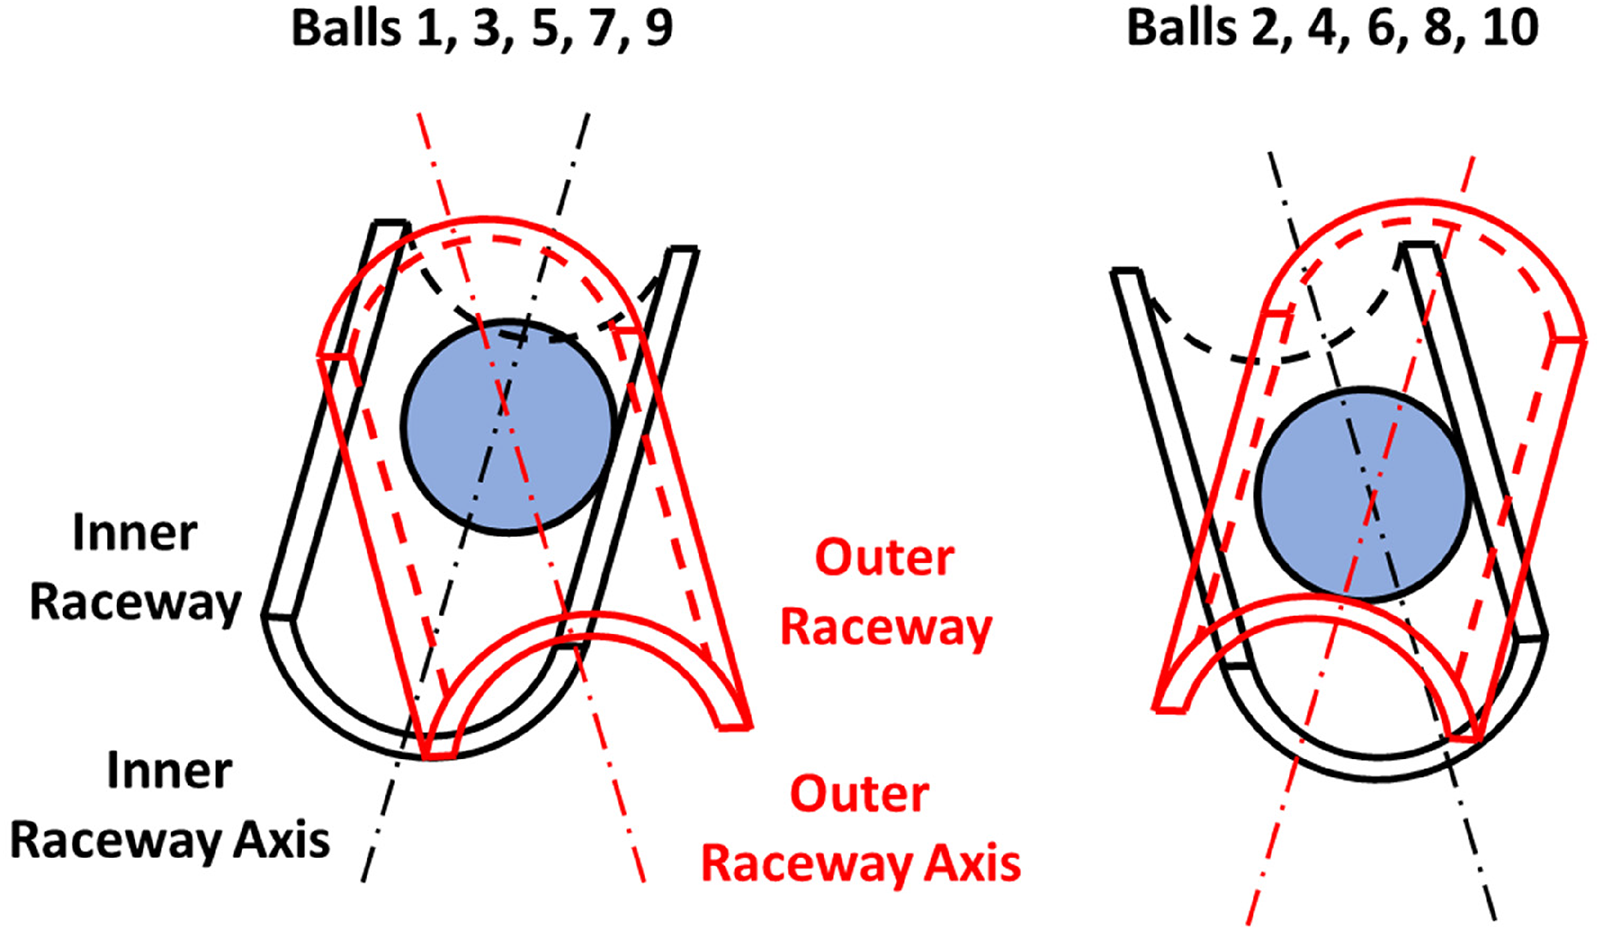
Track pairs, defining the two track sets within the joint.
The variation of normal contact force is evaluated with the axial position of the ball along the raceway (Figure 16). The presented trends are similar to the findings of Bauer. 3 The contact force depends on the rolling direction of the ball relative to the raceway. Under constant conditions, the positive side of the raceway will consistently experience higher loads than the opposing negative side. The side of the raceway with greater loading will change with the relative angle of the track set. The relative angle of a track set is defined as the positive or negative relative angle between the counter-facing tracks at zero inclination angle. Therefore, the trend shown in Figure 16 is axially mirrored about 0 for an alternate set of tracks. An alternate angle to the tracks also reverses the direction of rotation in the contact force; hence, existence of a counter clockwise direction. The maximum and minimum axial translations lie at 0° and 180° angular position. At 0° position, track set opposes the inclination direction, and the tracks have the least profile intrusion. At 180° angular position, the tracks face the articulated shafts, and the tracks have the maximum intrusion. The maximum contact load appears when tracks move from the maximum profile intrusion toward the minimum intrusion region.
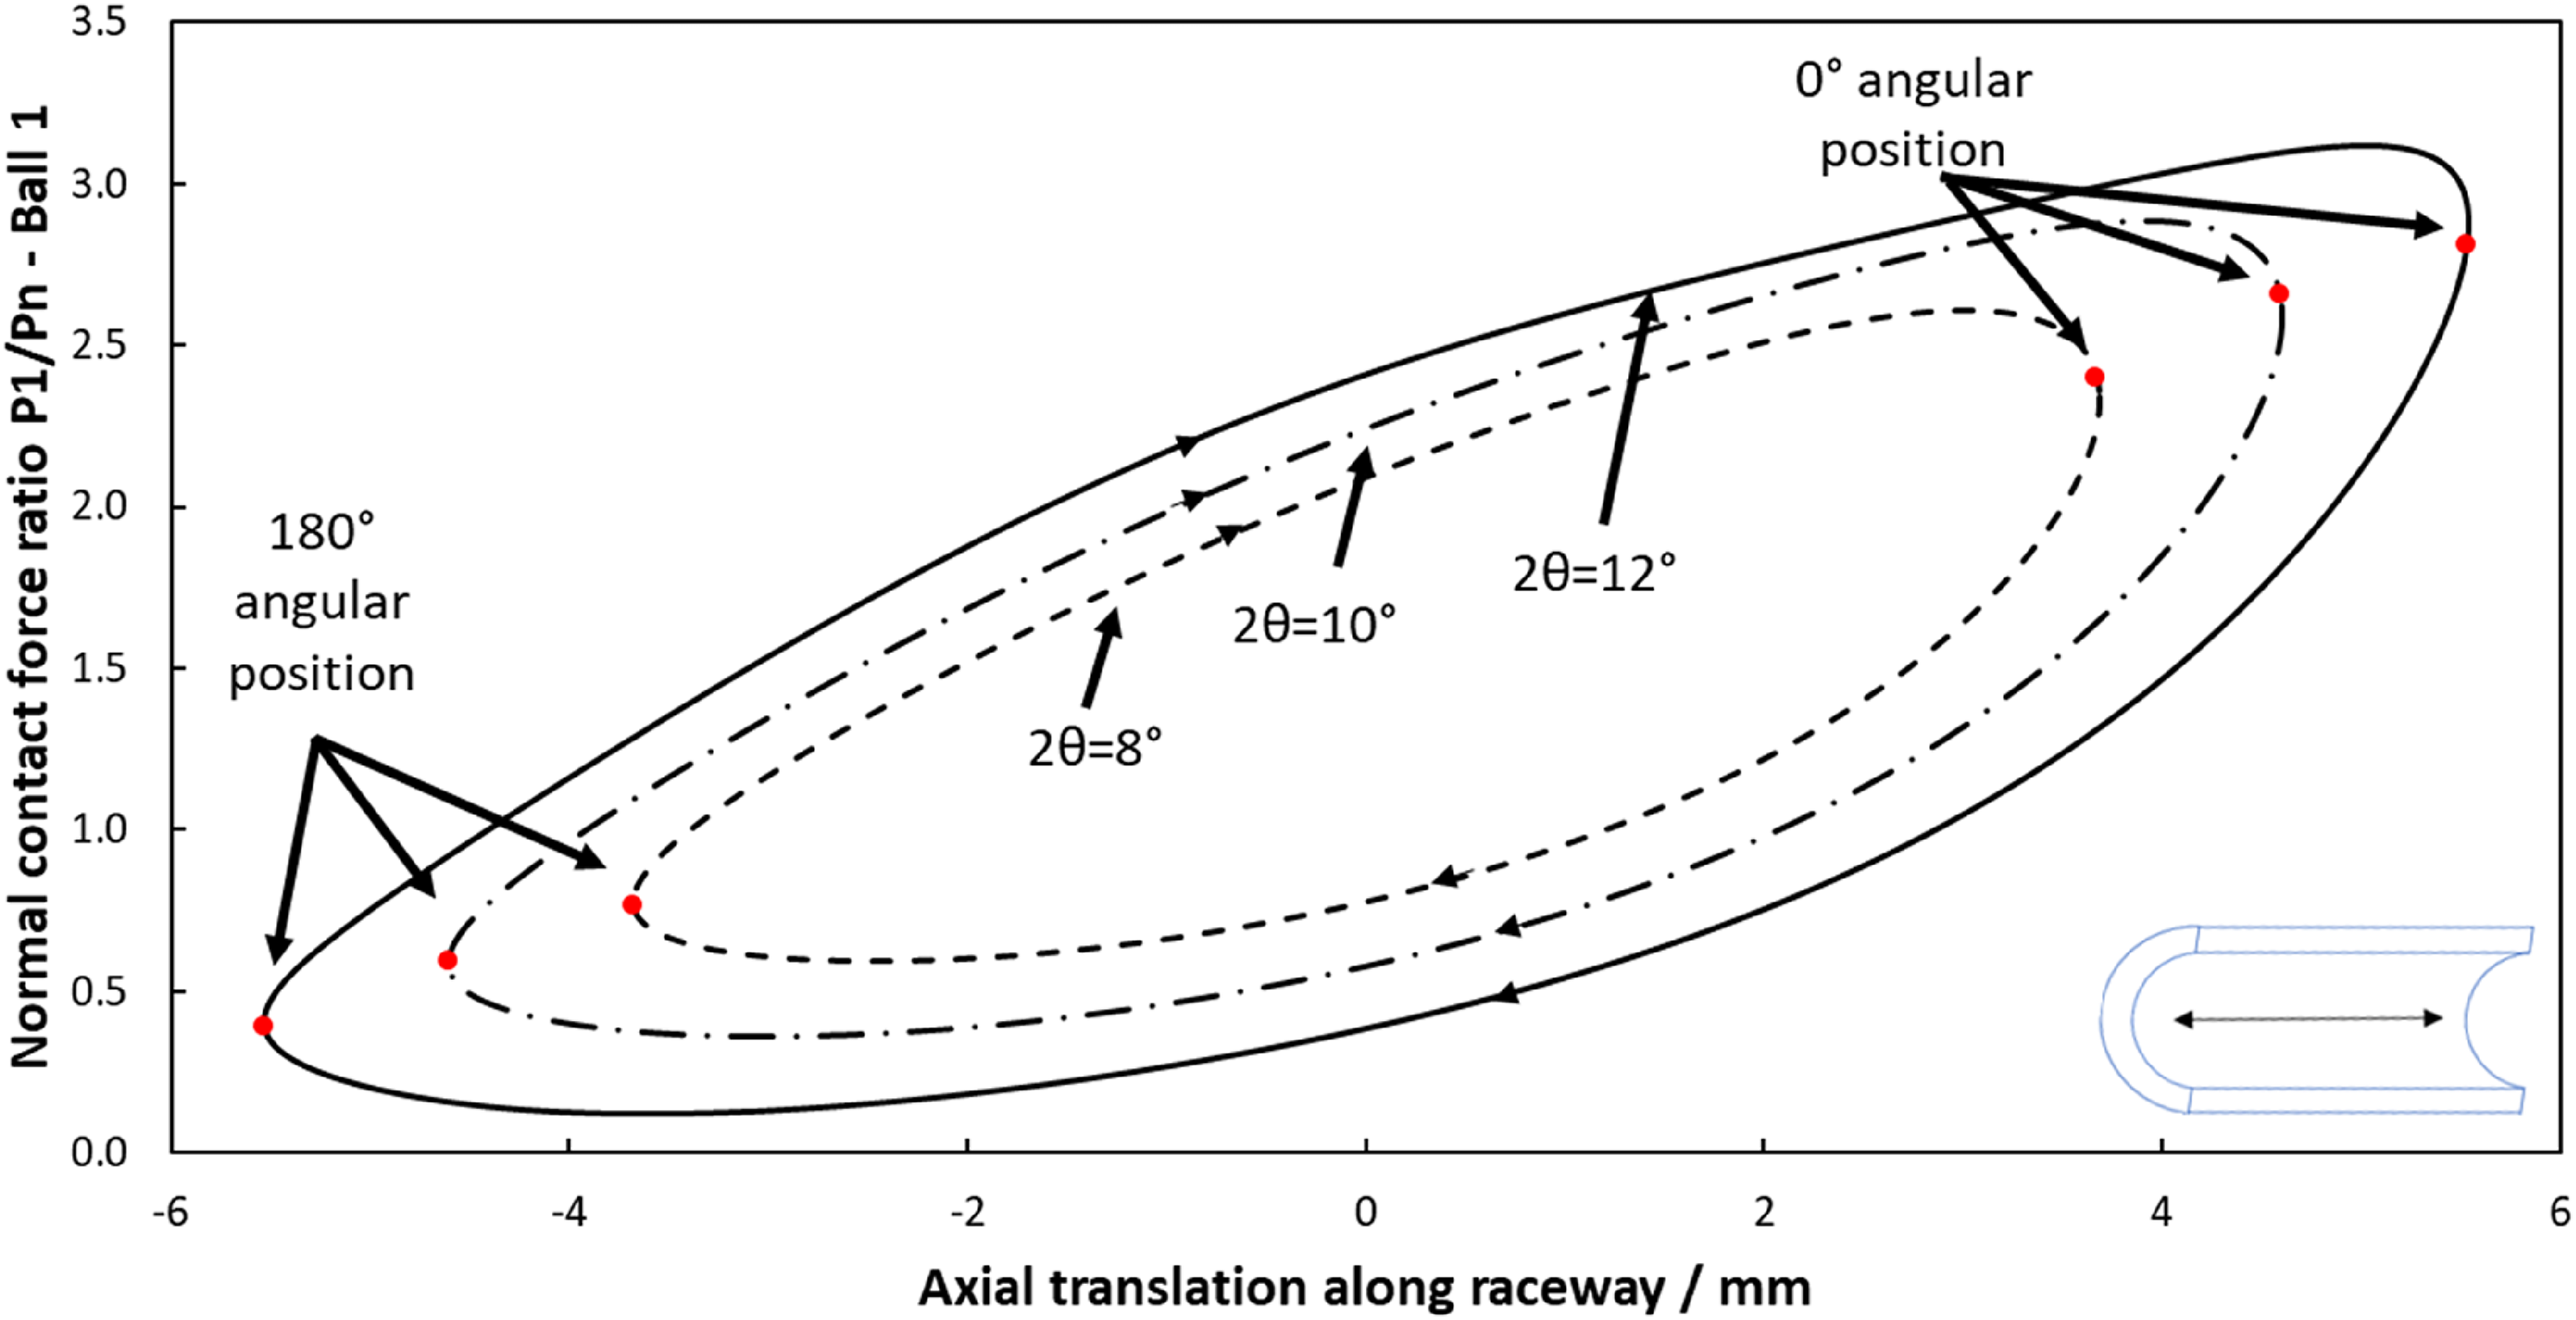
Variation of dimensionless contact force
The relative angle of a pair of tracks varies with the inclination angle and the crossing position of the track profiles. The relative angle between the tracks is described as track meeting angle (Figure 17). Figure 18 shows the variation of the dimensionless contact force
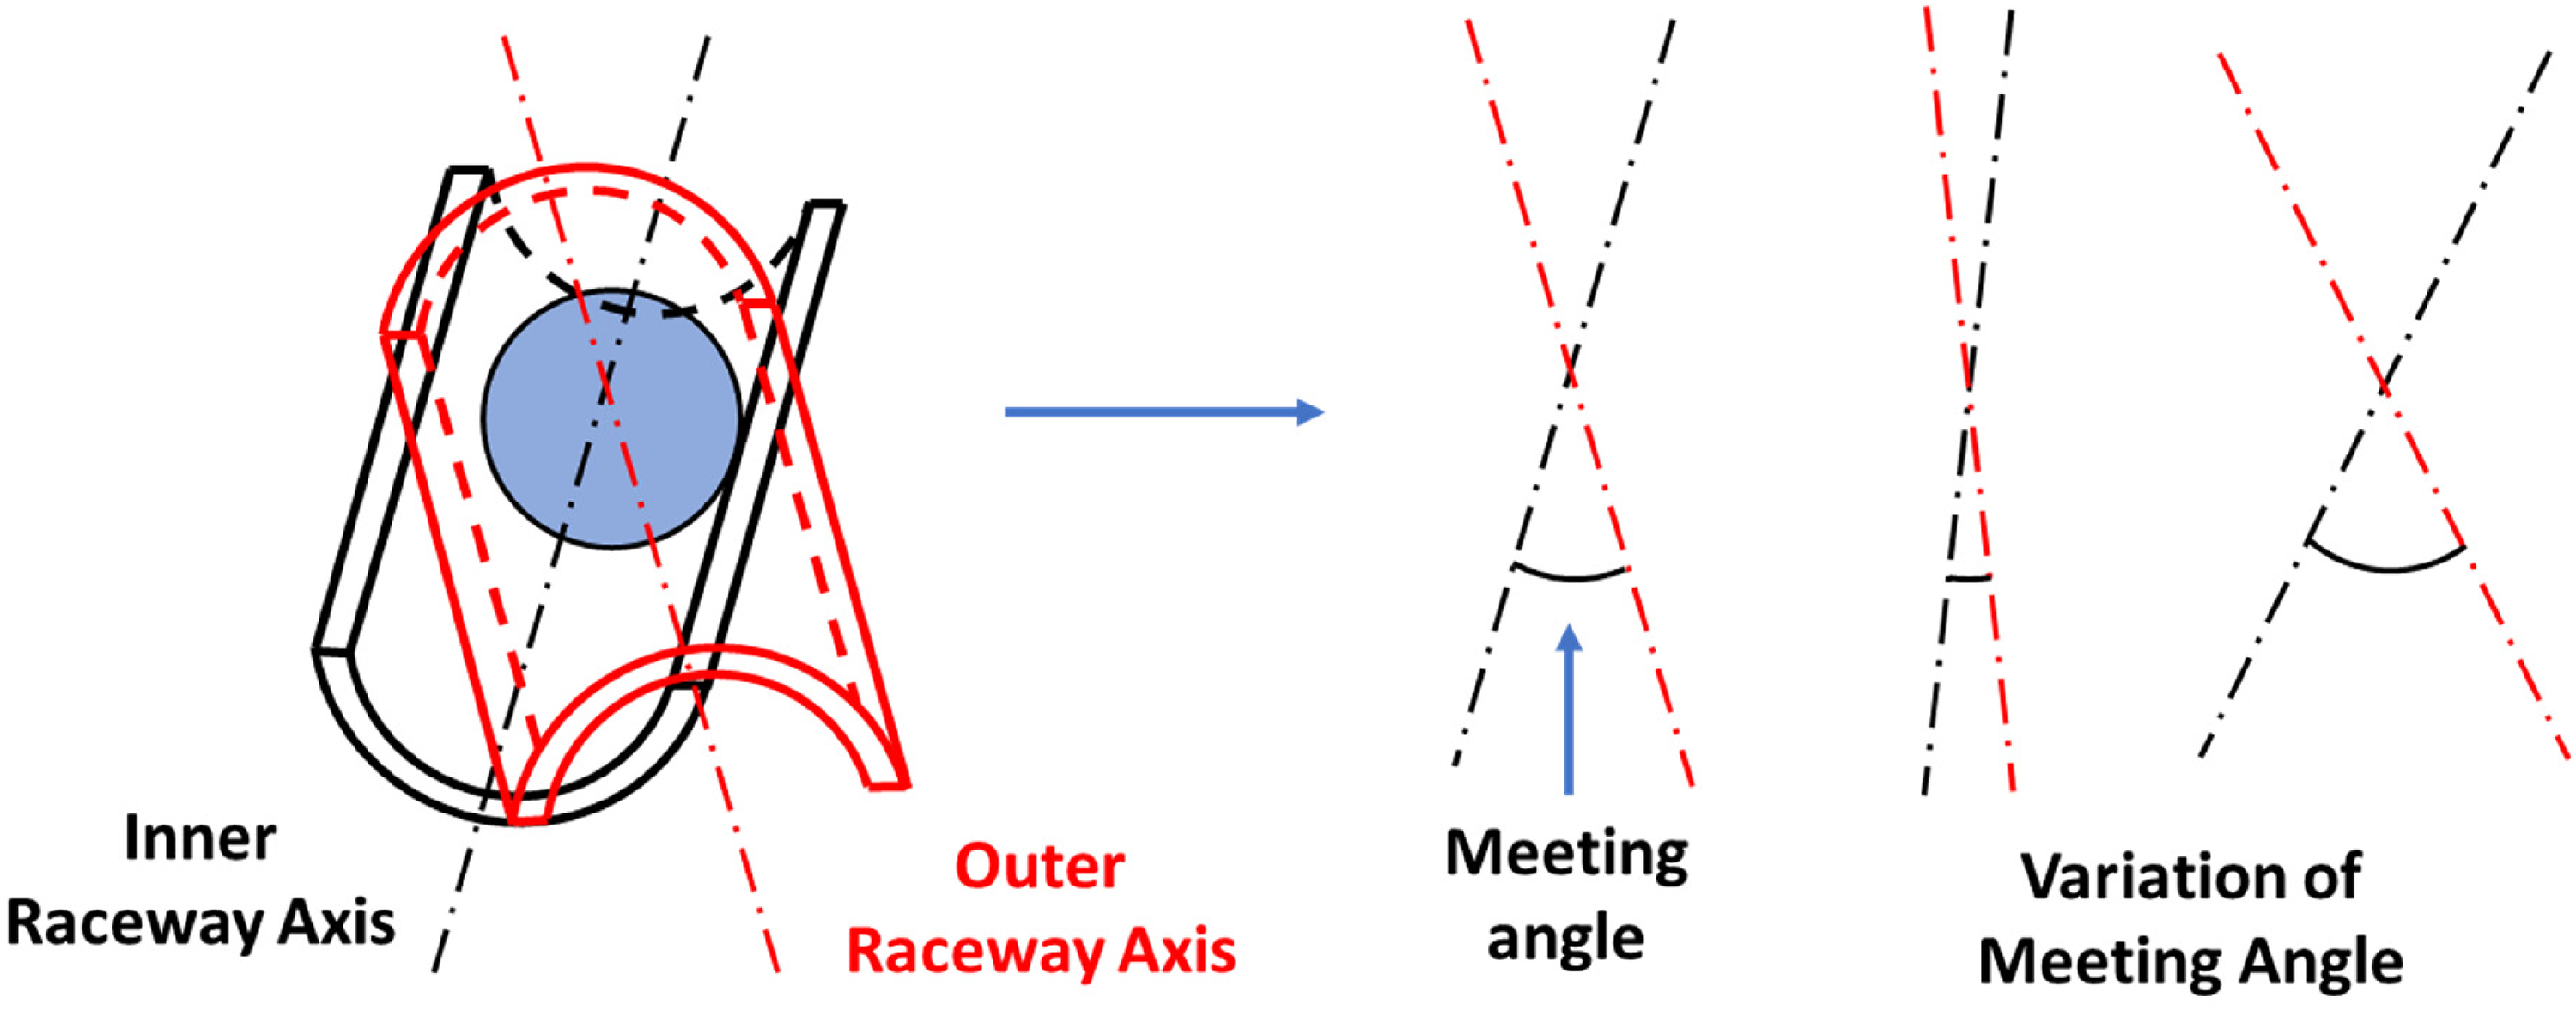
Track meeting angle definition.
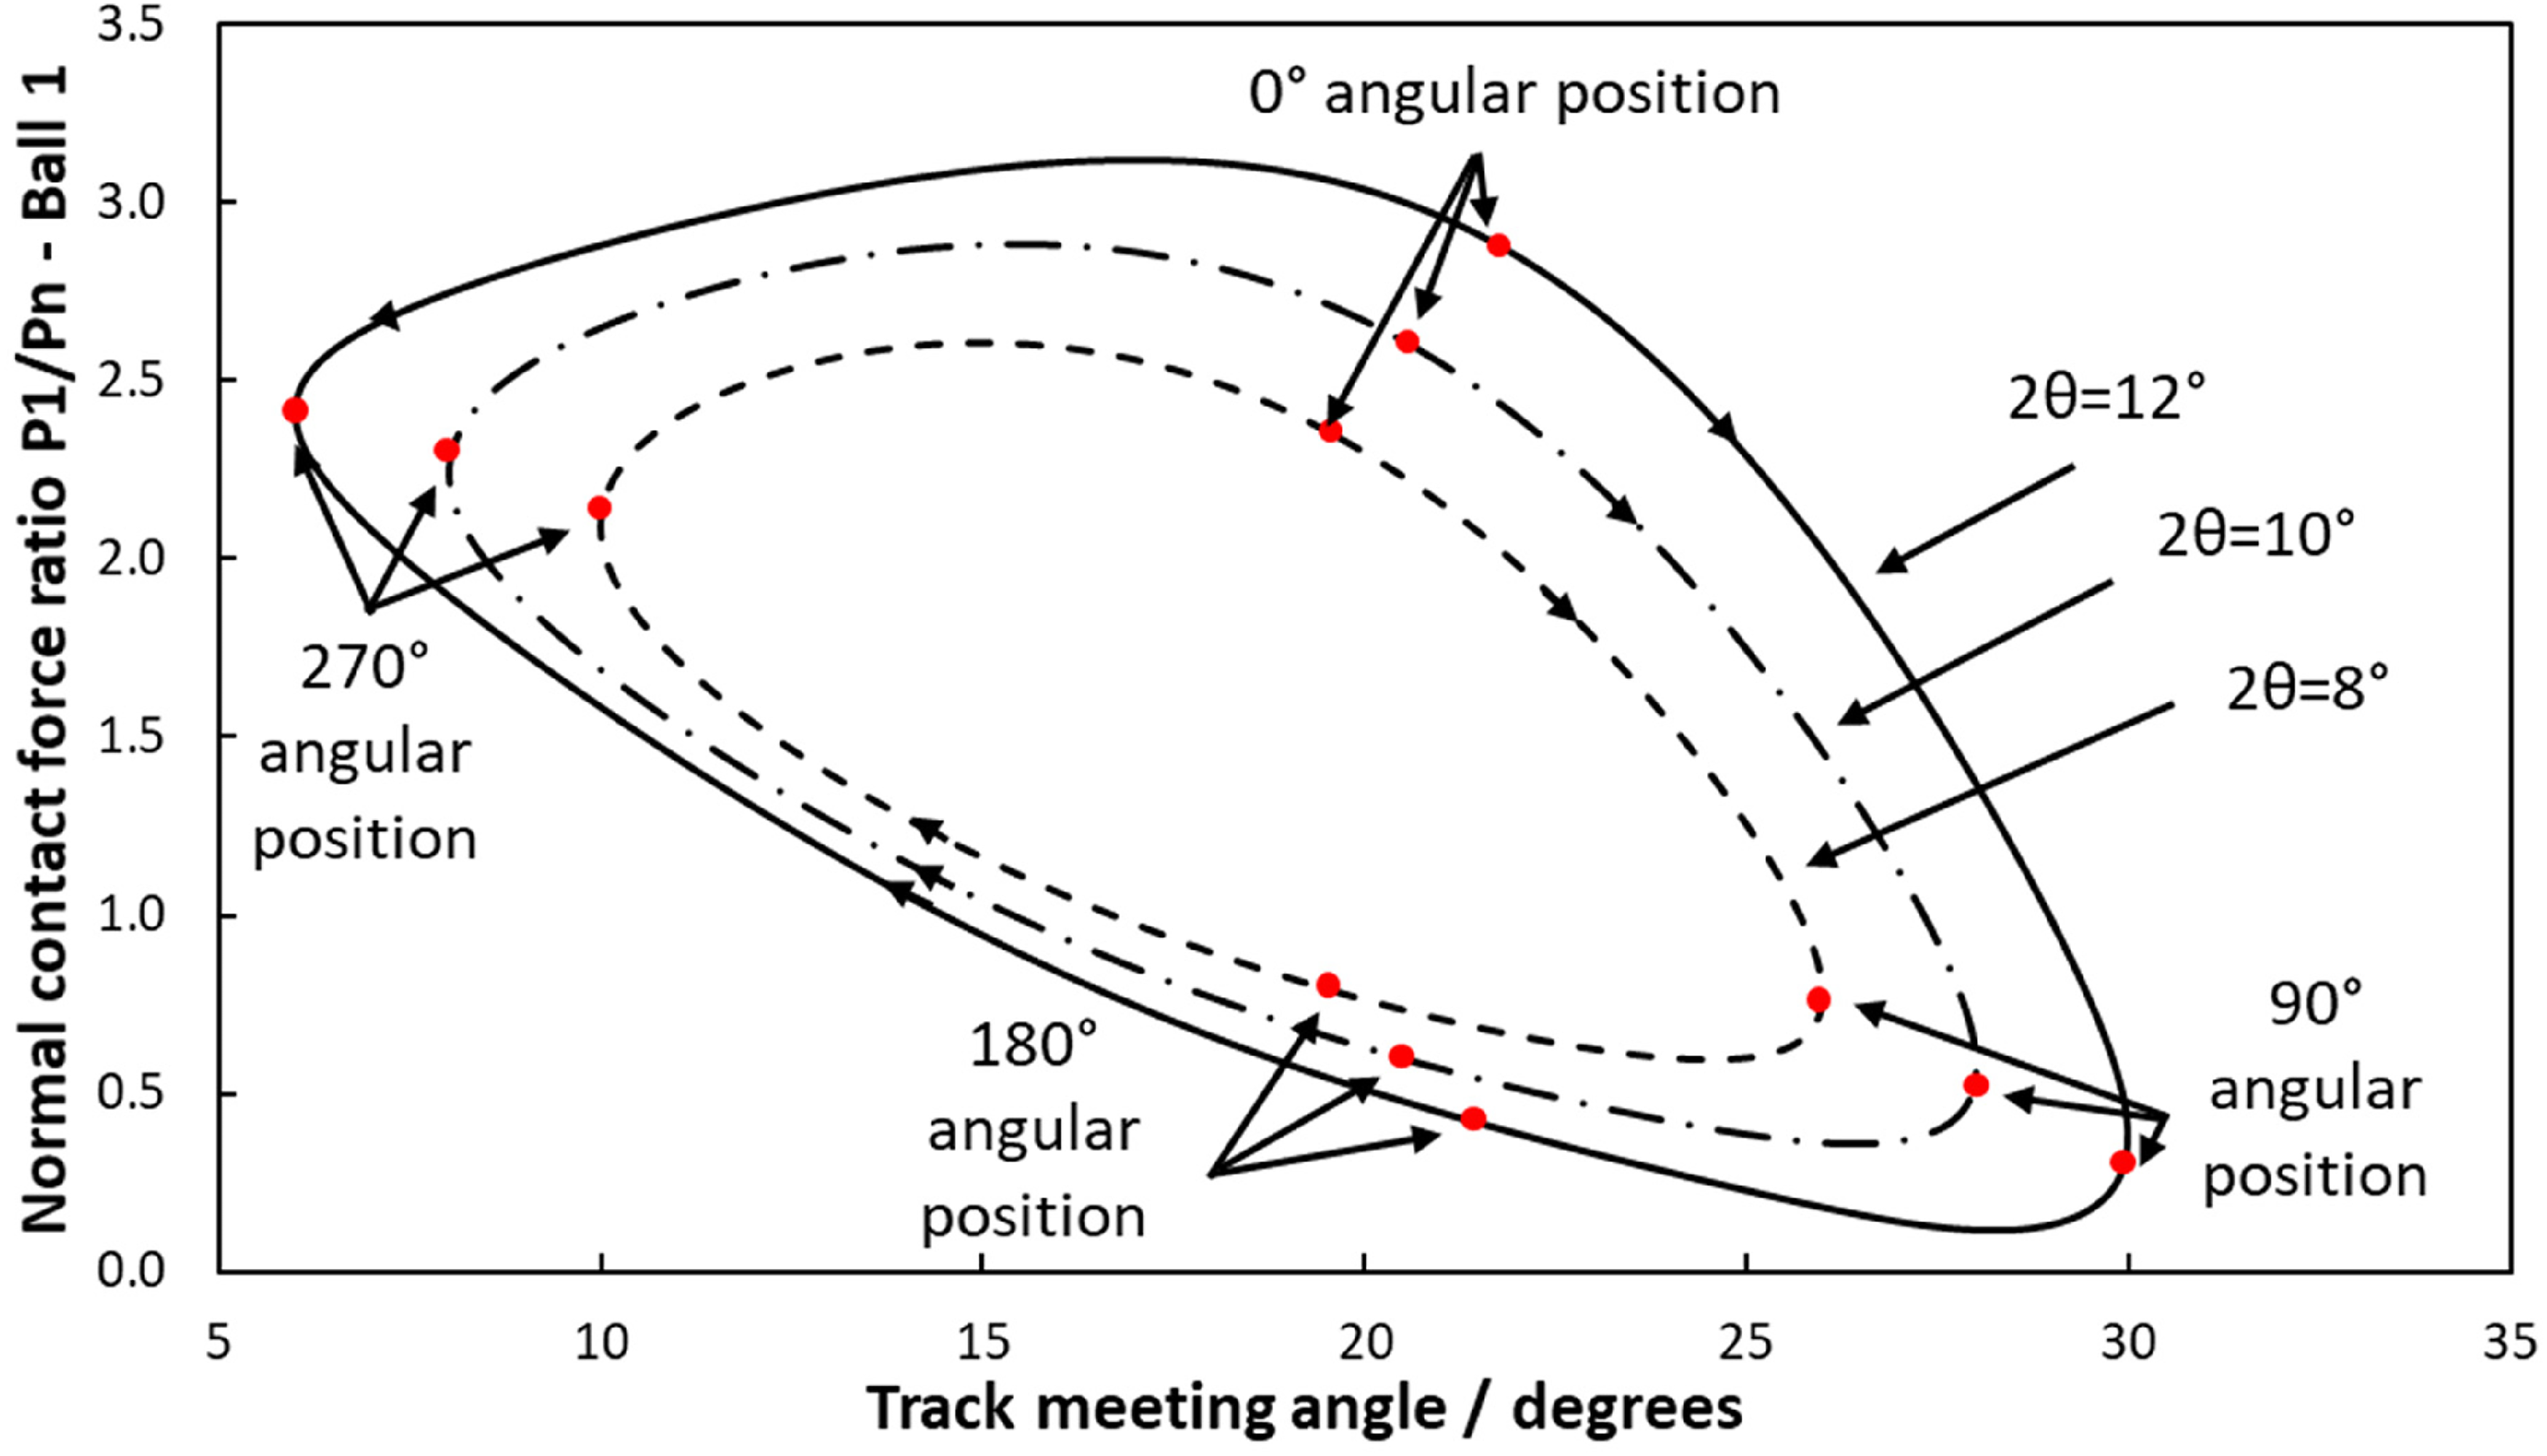
The variation of dimensionless contact force
The observations from Figure 16 and Figure 18 suggest that the combination of track meeting angle and axial position of ball contribute to the angular position of the maximum contact force.
The surface topography of a used and worn outer raceway hub sample was measured. The description of this measurement and the measured sample is provided in subsection 2.5. The measured raceways have a coating intended to prevent fatigue failure, which is worn away through abrasive wear (see Figure 10). The developed CVJ model predicts the contact force variation with the axial displacement. The predicted contact force maps are compared with the measured topographies for two raceways from a used CVJ (Figure 19). It has been shown by Archard and Hirst 21 that the wear rate is proportional to the normal contact force. The frictional work done upon the raceway is also calculated and compared.
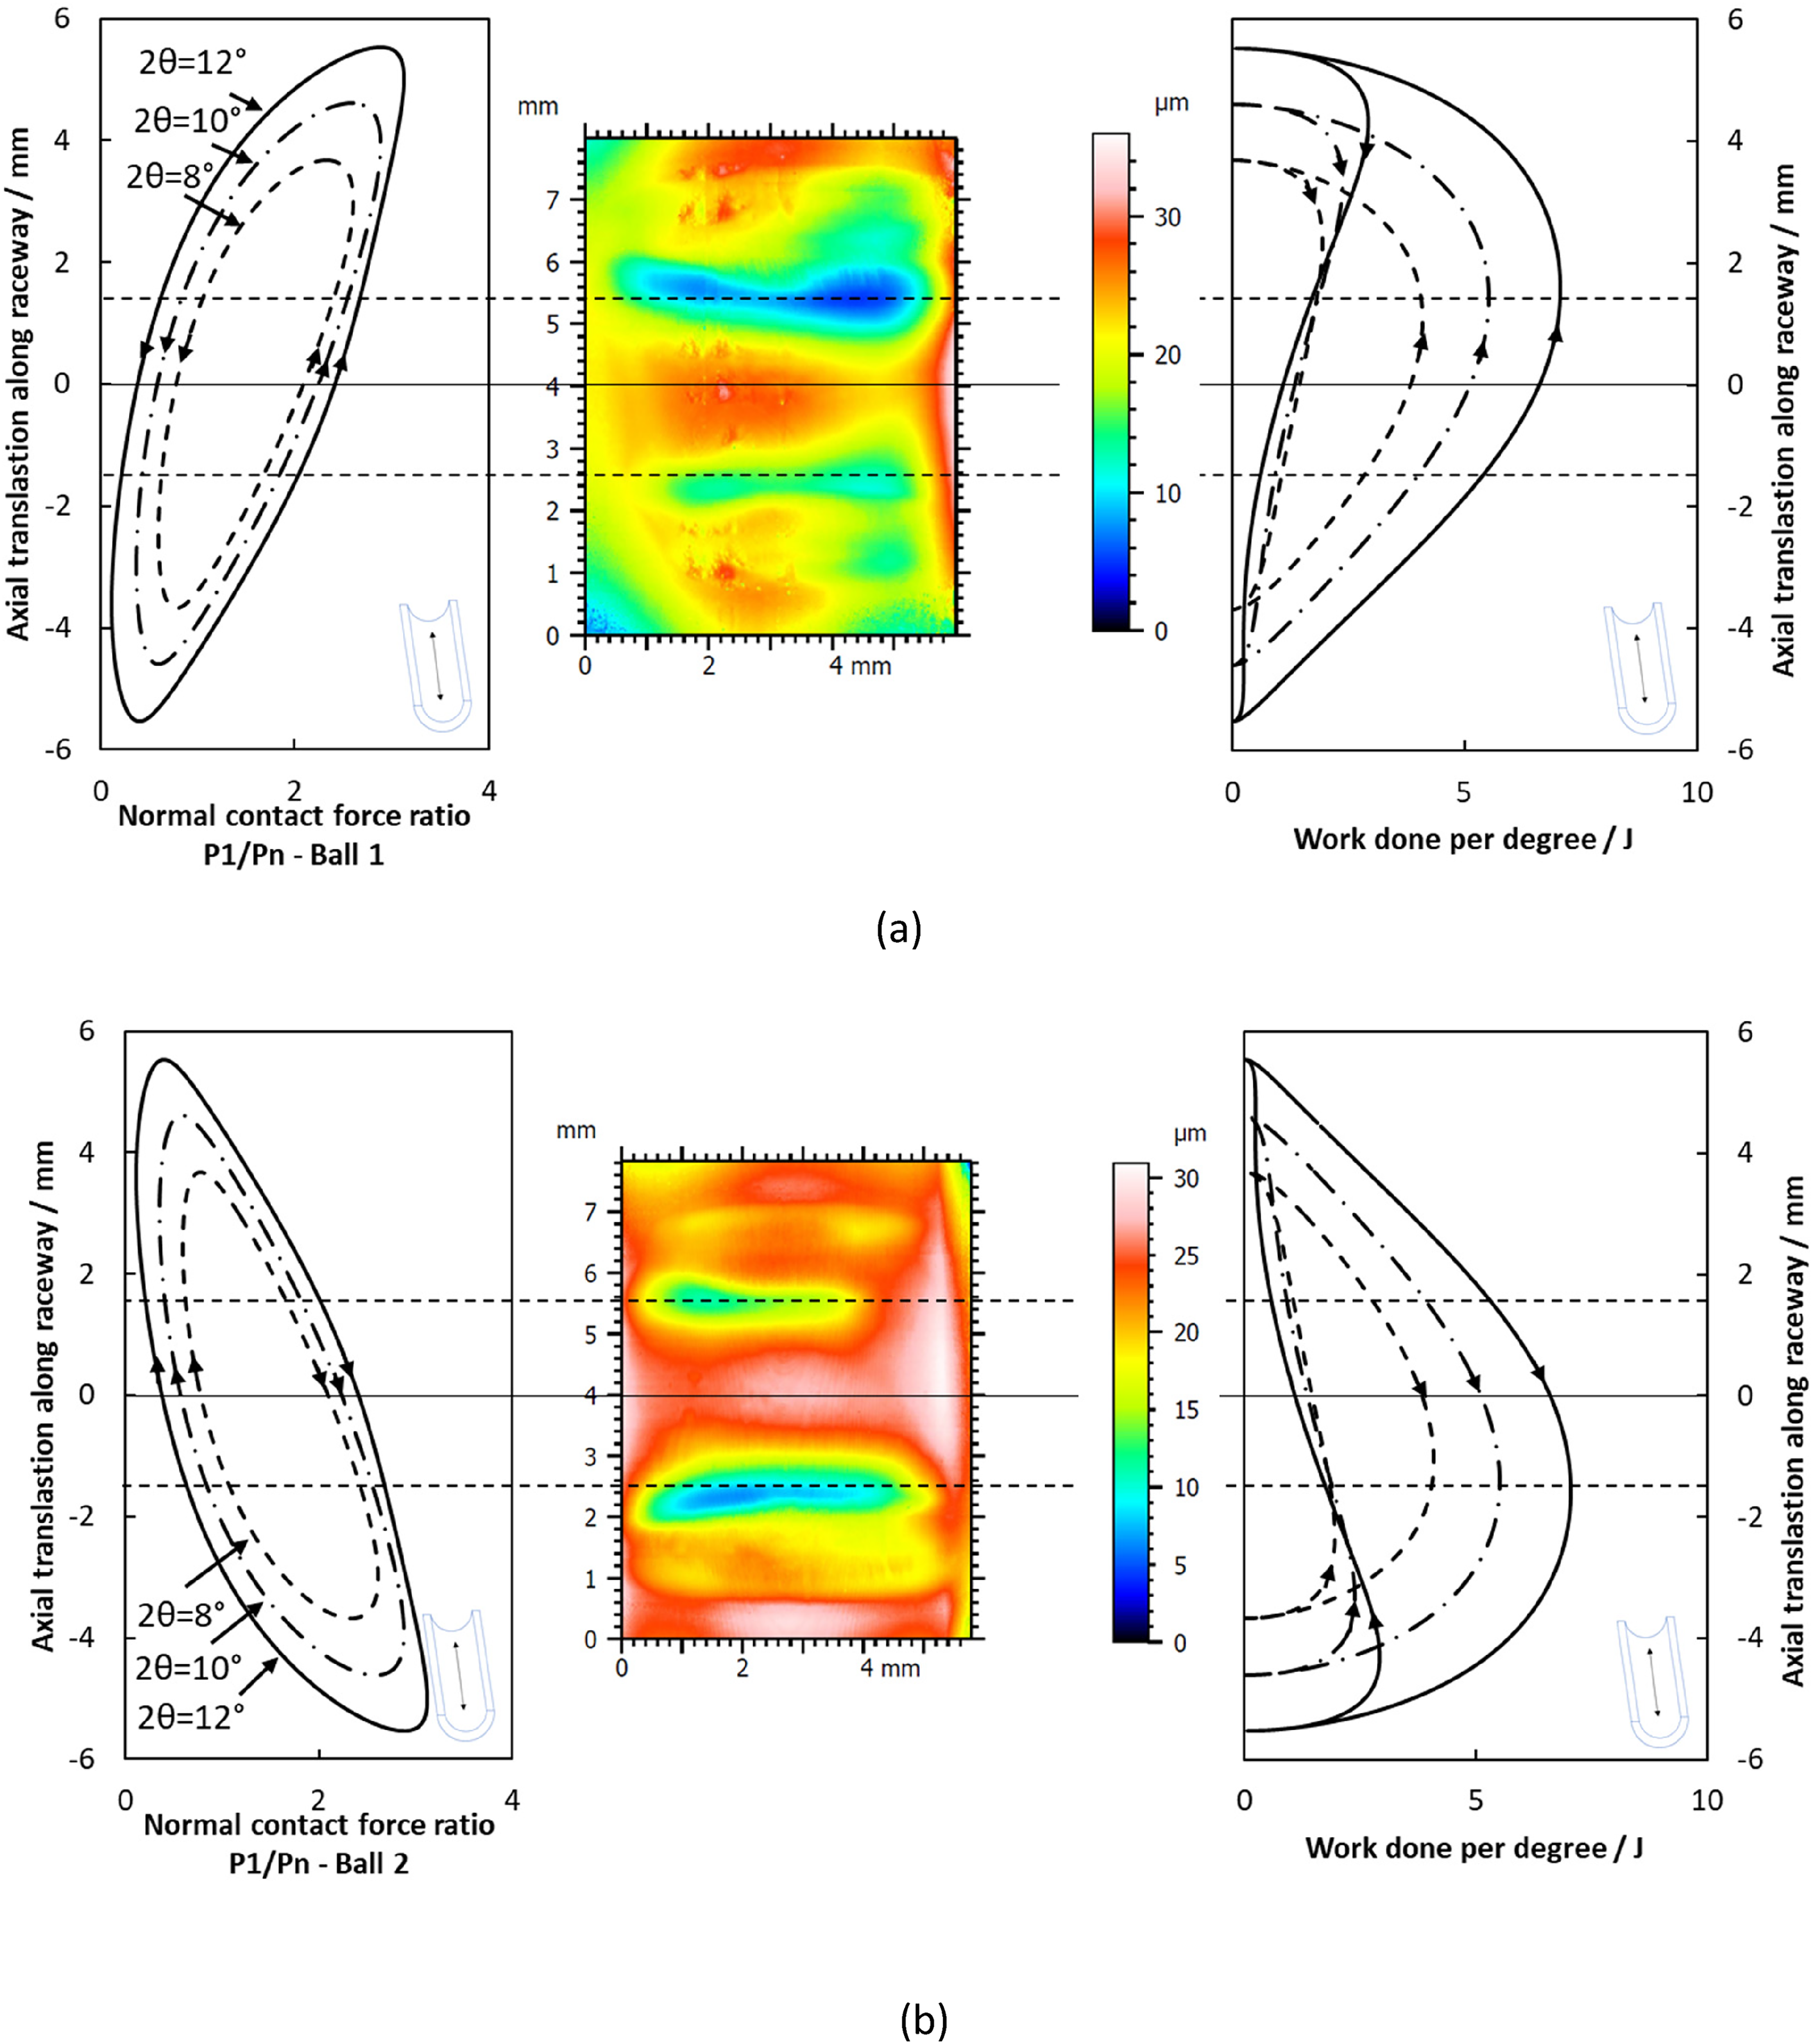
Corroboration of measured wear pattern with the dimensionless contact force and theoretical work done, (a) raceway 1, (b) raceway 2.
These raceways are alternately inclined due to the cross groove design. The measured wear patch has approximately a rectangular shape (Figure 10). Figure 19 shows two primary troughs in each raceway. These troughs are located approximately 3 mm apart in the axial direction.
Figure 19 (a) compares the contact force maps (left) with the measured locations of two wear troughs. The points of maximum contact force do not directly align with either of the wear scars. A direct relationship would lead to the deepest wear scar being located at approximately + 4 mm axial translation. The contact force is suggested to primarily define the asymmetry of the two wear scar depths. The deeper wear scar is located in the positive axial translation region, where the average contact force is high. The shallower wear scar is located in the negative axial translation region, where the average contact force is comparatively lower.
A similar correlation is observed between contact force variation and the asymmetric positioning of the wear scars for the alternating raceways. Wear topographies of the second raceway set show a flip in the positioning of the deeper wear scar (Figure 19 (b)). The contact force variation also mirrors in the axial direction. Hence, the higher contact forces are observed at the opposite extremity of ball axial reversal. The contact force map and wear topography are compared in Figure 19 (b). The comparison confirms the correlation between the positioning of the deeper wear scar and the contact forces. This alternating pattern has been consistently observed on every raceway measured on two separate outer raceway samples.
To further investigate the observed wear pattern a map of instantaneous friction work done has been generated. Due to the nature of the ball CVJ mechanism it is expected that the contact between the ball and the race experiences some degree of slide to roll ratio. The true nature of this can only be determined through a tribodynamics analysis. For the current analysis, the friction force was approximated by multiplying the contact force by a constant friction coefficient of 0.1 as is assumed in some other similar research considering the dynamics of the ball CVJ contact. 6 It is assumed that this friction coefficient represents the average friction due to the range of motion/loading/lubrication conditions the joint undergoes. Work done was calculated by multiplying the friction force by the distance traversed at each time interval. The generated maps are shown on the right side of Figure 19. For track set 1 (Figure 19 (a)), two profiles can be observed in the work map. Translating from positive to negative axial position, the work initially rises from zero, before reducing back to zero at an exponentially reducing rate. The maximum work occurs just after the work rises from zero. Translating from negative to positive axial position, the work rises linearly, peaking toward the opposing track end, before returning to zero. The maximum combined work occurs in the centre slightly weighted towards the positive end for raceway 1 (a). Significantly more work is done when the ball is travelling from negative to positive axial position. A greater proportion of the total work is carried out upon the positive axial side of the track for raceway 1 (a). This correlates with the positioning of the deeper wear scar. Track set 2 (Figure 19 (b)) shows the same trends, with a mirroring about the centre of the track, similar to the contact force. The work maps suggest that one side of the track should show more wear than the opposite, due to the asymmetrical weighting of work. This trend can be clearly observed in the results shown in Figure 19. The work map also suggest that the greatest wear should be observed near the centre. The observed wear profile, however, does not corroborate with this prediction.
It is proposed that the positioning of the wear scars is defined by several other factors, including the lubricant supply/entrainment into the contact, cyclic loading, and contact force variation. Lubricant availability in the contact is hypothesised to primarily determine the location of these wear scars. The relative velocity of the ball to the raceway approaches zero during the axial displacement reversals. Therefore, less lubricant is entrained into the contact and load carrying capacity of lubricant reduces. During motion between the reversal points, the lubricant film grows with the increase in the entraining velocity. The film separates the contacting surfaces and hence, minimises the wear at the centre of the axial displacement path. The deepest regions in the trough are slightly positioned away from the extremities of the reversal points. The CVJ is designed for a range of extreme inclination angles. The larger angles appear only during extreme operating conditions such as in heavy manoeuvres. The regions closer to the centre, however, are passed over more frequently even at average inclination angles (Figure 19). Therefore, surfaces at the axial displacement extremities undergo a fewer number of loading cycles. The contact force and work done are shown to correlate with the depth of the wear scars, with the higher load side of the track matching the side with the deeper wear scar. The ball motion relative to the track is likely to be more complex than that represented in the present model.6,10 Transient ball behaviour may also impact the positioning and depths of the observed wear scars. This all points at a need for development of a tribodynamic model for the studied CVJ in this research.
The current study presents an in-depth multibody analysis of cross groove type ball CVJs. Kimata's original model 4 is developed further to include cross groove joints and is also combined with a Hertzian contact mechanics model to primarily investigate the variations of contact forces in the CVJ's ball and racetracks. The proposed methodology is validated using the results of a 6-ball cross groove CVJ model from literature. A novelty of this work is in development of a contact force map at various inclination angles for the ball-race contact in high performance automotive racing applications, which allows for direct comparison with the observed wear patterns on the race. The developed map successfully describes the partial dependency of the measured wear characteristics on the contact force variation, hitherto not reported in the literature.
Based on the results from the current study it can be concluded that:
The investigated high performance ten ball cross groove joint operates under comparable contact force ratio levels ( Contact force maps show that a correlation between the contact force and experimental surface wear exists. Experimentally measured wear scar shows an axially asymmetric distribution, which correlates well with the predicted variation in the contact load during each cycle. Higher wear depths are observed where the contact forces are higher. An approximation of the variation of friction work done is made. It is predicted that the frictional work will occur asymmetrically. The friction work will also skew towards one end of the track axially.
The correlation between the wear trough depth and the predicted contact force suggests that balancing contact forces will potentially aid in managing wear. It is reasonable to assume that the combination of contact force, lubrication, and cyclic loading can impact the position and depth of the wear troughs. Therefore, further work is needed to determine the cause of the observed wear trends. The development of a model considering dynamic behaviour would provide an improved view of the contact conditions and hence failure mechanisms in the ball-raceway contacts. A detailed tribological model would provide a more informed understanding of the contact friction and its effects. For investigation of fatigue failure modes observed in the substrate material3,16,17 it would be essential to determine the subsurface stress distribution as a result of the normal and shear (traction) forces in the contacts.
Footnotes
Acknowledgement and declaration of conflicting interests
The author(s) declared no potential conflicts of interest with respect to the research, authorship, and/or publication of this article.
Funding
The author(s) disclosed receipt of the following financial support for the research, authorship, and/or publication of this article: This work has been carried out under a PhD studentship, funded jointly by the Engineering and Physical Sciences Research Council (EPSRC) and Mercedes-AMG Petronas Formula One Team, Brackley, UK, under Doctoral Training Program (DTP) scheme. These contributions are gratefully acknowledged.