
Abstract
A high percentage of people who are incarcerated suffer from health problems that affect them both in prison and after they are released. Environmental hazards and pollutants can exacerbate these problems as well as contribute to the development of new health conditions. One specific type of pollutant that is associated with a wide array of health problems including decreased lung function, cancer, and asthma is particulate matter smaller than 2.5 µm (PM2.5). While prior research indicates that PM2.5 is not equally distributed throughout space, it remains unknown if levels of PM2.5 differ in areas with and without correctional facilities. The current study aims to address this gap by examining if counties with state-run correctional facilities have higher concentrations of PM2.5 relative to counties without state-run correctional facilities in Texas. Results of OLS regression models indicate that counties with one or more state-run correctional facilities have higher concentrations of PM2.5 relative to counties without these facilities. These findings highlight the importance of improving prison healthcare and addressing issues of environmental injustice in correctional facilities.
Introduction
People who are incarcerated have poorer health, on average, than people in the general population (Butler et al., 2004; Fazel and Baillargeon, 2011). Individuals incarcerated in United States (U.S.) jails and prisons have been found to be more likely to suffer from hypertension, asthma, arthritis, cervical cancer, and hepatitis compared to adults in the U.S. general population (Binswanger et al., 2009). While incarcerated individuals might enter prison with preexisting conditions, they also have a higher risk of developing new health conditions in prison relative to people in the community (Wildeman and Wang, 2017). Incarcerated individuals rated their overall health more poorly than people in the general population (Butler et al., 2004). In addition, older incarcerated people are more likely to have a disease or infection than both younger incarcerated people and older people in the general population (Fazel et al., 2001; Maruschak et al., 2015). This is of particular concern as the average age of people incarcerated in the U.S. has increased substantially over the last 30 years (Carson and Sabol, 2016).
According to the United States Bureau of Justice Statistics, about 40% of people in state and federal prisons and jails of all ages reported having a current chronic medical condition (Maruschak et al., 2015), which is similar to that of the general public (Raghupathi and Raghupathi, 2018). Despite these comparable figures, incarcerated individuals have access to lower-quality healthcare than people who are not incarcerated and often are not granted access to the medications or treatment they need (Prost et al., 2021; Ross, 2012; Vaughn and Carroll, 1998), which makes living with these health conditions difficult and painful. Health problems can also make it difficult for formerly incarcerated people to successfully re-enter society (Link et al., 2019). There are several aspects of confinement that can exacerbate existing health conditions for people in prison including being offered poor diets that are not up to nutritional standards in either quality or quantity (Brisman, 2008; Holliday and Richardson, 2021) and exposure to environmental toxins (Pellow, 2021). There have been accounts of U.S. prisons having contaminated water, being infested with insects and rodents, and being located on or near superfund sites or other toxic dumping sites (Bradshaw, 2018; Leon-Corwin et al., 2020).
One specific type of environmental toxin that can worsen existing health conditions and even contribute to the development of new conditions is particulate matter smaller than 2.5 micrometers (PM2.5) (Barja, 2004; U.S. Environmental Protection Agency, 2021; Xing et al., 2016). PM2.5 consists of tiny, but dangerous particles in the air and is linked to several detrimental health conditions including asthma, cancer, upper respiratory problems, and death. Over 99% of the world's population is exposed to unhealthy levels of PM2.5 (Yu et al., 2023). More shockingly, prior research has indicated that PM2.5 is not equally distributed in space and tends to be higher, and most dangerous in disadvantaged communities (Colmer et al., 2020; Tessum et al., 2021). Yet, at present, it is unknown if PM2.5 is higher in areas with prisons relative to areas without prisons. Prisons are often located in areas characterized by low socioeconomic status and disadvantage, and thus it is hypothesized that concentrations of PM2.5 are higher in geographical areas with correctional facilities relative to geographical areas without correctional facilities (Eason, 2010). The current study begins to address this line of inquiry and examines differences in concentrations of PM2.5 in counties with state-run correctional facilities relative to counties without state-run correctional facilities in Texas.
Background
Health consequences and spatial concentration of PM25
Particulate matter (PM) consists of small particles in the air (U.S. Environmental Protection Agency, 2021). These particles can come from a wide array of both anthropogenic and natural sources such as motor vehicle exhaust, electricity production, pollen, and wildfires. PM comes in many sizes, and subscripts are used to differentiate between the different types. PM2.5 are small particles that have diameters smaller than 2.5 micrometers (μm) and are associated with more serious health effects than larger PM particles such as PM10. PM2.5 can stay in the air for longer than other types of pollution, sometimes weeks, which can be harmful as it is associated with dozens of physical and cognitive health problems (U.S. Environmental Protection Agency, 2021; Xing et al., 2016).
More precisely, exposure to high levels of PM2.5 is linked to breathing difficulties, cancer, impaired learning and memory, asthma, reduced lung function, and death (U.S. Environmental Protection Agency, 2021; Xing et al., 2016). PM2.5 can also increase the production of free radicals in the body and this increase can result in DNA damage and faster somatic aging (Barja, 2004). While the U.S. Environmental Protection Agency (EPA) standard for annual PM2.5 concentration is 12.0 µg/m3, these side effects can occur from exposure to lower PM2.5 levels as well. In serious cases, these side effects can result in mortality. Past research estimated that the risk of death increased by 4% for every additional 10 µg/m3 PM2.5 to which a person was exposed (Pope et al., 2002). It is estimated that over three million deaths worldwide were caused by side effects of PM2.5 exposure in 2010 (Apte et al., 2015). In addition, climate and health experts estimate that between 85,000 to 200,000 Americans die every year due to the harmful effects of PM2.5 (Apte et al., 2015; Tessum et al., 2021).
While many people in the U.S. die because of PM2.5 exposure every year, the fraction of overall deaths associated with PM2.5 has been lower in recent years relative to what it was in the past (Fann et al., 2018). This is likely because the overall concentration of PM2.5 has decreased for nearly two decades in the U.S. (Colmer et al., 2020; Fann et al., 2018). This decrease is primarily the result of changing energy sources in the U.S., from burning coal and other fossil fuels that release many harmful emissions into the atmosphere, to using more natural and renewable energy sources, which do not release as many harmful emissions (Davis, 2022; Di et al., 2016). Despite this overall decrease, PM2.5 is not distributed equally throughout space (Colmer et al., 2020). Rather, there are large disparities in PM2.5 concentrations that exist throughout the country. More specifically, relative to White Americans, PM2.5 exposure is greater for similarly situated Black, Hispanic, and Asian Americans (Tessum et al., 2021). Even though the national average PM2.5 concentration has decreased since 1981, communities that became more Hispanic, less White, less educated, and had a decrease in average income experienced increased levels of PM2.5 (Colmer et al., 2020). Consequently, a large portion of people serving time in U.S. prisons are low-income people from racial minority groups (Pellow, 2017). Therefore, these individuals have a greater risk of being exposed to PM2.5 and of having to suffer from the associated health effects of exposure before they enter the criminal legal system. 1
Environmental justice issues in correctional facilities
According to the United States Department of Health and Human Services “environmental justice” is “the fair treatment and meaningful involvement of all people regardless of race, color, national origin, or income in the development, implementation, and enforcement of environmental laws, regulations, and policies” (Assistant Secretary for Health, 2021). Yet, there are a host of environmental justice issues that affect U.S. correctional facilities and the individuals confined in these facilities (Bradshaw, 2018; Opsal and Malin, 2020). More precisely, past research indicates that individuals serving time in U.S. prisons have been subjected to contaminated drinking water, high levels of pollution, poor medical care, extreme temperatures, and inadequate nutrition (Dannenberg, 2007; Pellow et al., 2020).
There exists limited research regarding the location of prisons and pollution levels in those locations, however. Most past studies that discuss high levels of pollution in prisons are case studies. These studies present examples of just one or a handful of prisons that are in areas with notably high levels of pollutants. For example, individuals incarcerated in a prison in Labelle, Pennsylvania, regularly experience symptoms consistent with exposure to coal ash such as breathing problems and dizziness (Bradshaw, 2018). Consequently, this facility is situated in an area that has a coal waste dumping site. In addition, New York City's Rikers Island jail was constructed on land that once served as a landfill (Pellow, 2017). As a result, the jail, which houses close to 6000 people (Morales, 2021), is in an area that contains high levels of methane gas which can adversely impact human health. Unsurprisingly, correctional officers working in the jail regularly complain of several different health issues that are associated with methane poisoning, including cancer. Opsal and Malin (2020) note that 11 prisons in Colorado are exposed to high levels of radiation that could have negative implications on the health of incarcerated individuals and facility staff. The reason these facilities are subject to this high exposure is that a uranium processing facility existed in the area in the mid-twentieth century that routinely dumped long-lasting radioactive particles into both the ground and emitted them into the atmosphere. It is not uncommon for U.S. prisons to be built in communities that have been deindustrialized but were once known for housing industries such as coal and steel mining that were, and sometimes remain, harmful to the environment (Schept, 2014).
The idea that areas with correctional facilities have higher levels of pollution can be supported by two theoretical perspectives. First, Perdue (2023) argued that communities in Appalachia were chosen to house prisons for two reasons: first, to curb unemployment and a decreasing population from deindustrialization; and second, to place incarcerated people, whom Perdue refers to as “societal castoffs” in an area with other “outsiders”, specifically poor White people. This theory can also be applied to areas outside of Appalachia, given the information presented above about correctional facilities being built in deindustrialized communities throughout the U.S., and the fact that correctional facilities are generally constructed in poor, rural communities (Eason, 2010; Ryerson and Schept, 2023). Essentially, if more correctional facilities are being built to promote economic growth in poor deindustrialized communities which have higher pollution levels than wealthier communities with flourishing modern businesses, then areas with correctional facilities will have higher levels of pollution than areas without prisons, on average.
The second theoretical perspective that can support why areas with correctional facilities might have higher levels of pollution is Pellow's (2000) perspective on environmental inequality formation, which includes the intersection of three points. First, environmental inequality should be seen as a sociohistorical process. In this case, correctional facilities were historically developed for the goal of punishment (Barnes, 1921) and these places of punishment should not be located in desirable (i.e., environmentally clean) areas. Instead, those areas should be reserved for people outside of prison who positively contribute to society. Second, Pellow argues that environmental justice issues involve the viewpoints and decisions of different stakeholders. In this example, state correction departments are focused on maximizing safety (possibly by having correctional facilities away from highly populated areas) and keeping staff happy, whereas state governments are likely concerned with keeping corrections-related expenses low (building facilities in cheaper areas) and keeping voters happy (by building corrections facilities away from potentially valuable residential and commercial land areas). Third, Pellow argues for the examination of environmental inequality issues through a life-course lens. In this case, higher pollution levels can often be linked back to industry sites and correctional facilities might be purposely built in these areas to promote economic growth from deindustrialization and/or to replace old industry sites that are not being used.
Even if correctional facilities are not located in areas with high levels of pollutants, incarcerated individuals can still be exposed to environmental hazards by voluntarily responding to both natural and human-made disasters. In response to this work, incarcerated people might be offered monetary rewards or other privileges. For example, some incarcerated individuals were instructed to help clean up the BP oil spill in the Gulf of Mexico in 2010 (Pellow et al., 2020). In some states, incarcerated individuals can also volunteer to fight wildfires without going through proper training (Weill, 2020). While incarcerated individuals report that fighting fires is more enjoyable than being in prison, they are at risk of inhaling dangerous chemicals in the smoke, which can lead to illness and upper respiratory problems.
While these case studies highlight harmful pollution exposure that affects both incarcerated individuals and staff at these specific facilities, or at disaster response sites, it is unclear from these studies if pollution issues affect prison areas more than non-prison areas. However, there are two recent studies that do assess pollution in correctional facilities over large land areas (Leon-Corwin et al., 2020; Toman, 2022). The first study explored if zip codes with prisons and zip codes adjacent to prison zip codes had higher levels of toxic release emissions relative to zip codes without prisons and not adjacent to prison zip codes in the state of Oklahoma (Leon-Corwin et al., 2020). Toxic release emissions are tracked by the EPA and include emissions of 770 chemicals that pose a threat to human and non-human life (U.S. Environmental Protection Agency, 2022b). Results of this study indicated that the combination of prison zip codes and prison adjacent zip codes have significantly higher toxic release emissions compared to non-prison and prison adjacent zip codes, controlling for several demographic factors.
Toman (2022) built off the work of Leon-Corwin et al. (2020) by investigating if there are differences in toxic release levels in zip codes with prisons and in zip codes next to prisons relative to zip codes that do not have prisons and are not next to prison zip codes throughout the entirety of the United States. Results revealed that zip codes with prisons and next-to-prison zip codes had higher emissions than zip codes without and not next to prisons, but this relationship was not statistically significant. However, in certain geographical regions in the U.S. including the East North Central, Mountain, and Pacific regions, there was a significant association between prison zip code and emission levels.
The current study
The current study examines pollution in areas with and without correctional facilities. More specifically, this study examines if levels of PM2.5 are different in counties with state-run correctional facilities, or Texas Department of Criminal Justice (TDCJ) facilities in Texas relative to those counties without TDCJ facilities. 2 We chose Texas as the geographic area of focus for this study for three reasons: (1) because several areas in Texas have experienced increased levels of PM2.5 over time (Colmer et al., 2020); (2) because Texas has the highest number of people in state correctional facilities out of all of the states in the US (National Institute of Corrections, 2021); and (3) because Texas, and specifically TDCJ, has a history of mistreating incarcerated individuals. Incarcerated individuals in TDCJ facilities have been mistreated in several different ways, from being exposed to record-high temperatures in the summer (Clark, 2022), to experiencing an increase in fatal and nonfatal use of force from staff members (McCullough, 2020), and reporting dissatisfaction in the grievance system when they feel they have been wronged by TDCJ (Prison Justice League, 2017). By identifying potentially another way incarcerated people in TDCJ facilities are being mistreated, this study could bring more awareness to these and other problematic conditions that exist in TDCJ facilities and hopefully result in changes that improve conditions for incarcerated individuals.
Given the past evidence of environmental justice issues in prisons and the fact that PM2.5 levels are typically higher in disadvantaged communities, where prisons are often located (Eason, 2010), we hypothesize that counties with TDCJ facilities will have significantly higher levels of PM2.5. This is an important topic to investigate given the problematic health issues associated with PM2.5 and the fact that incarcerated individuals often have access only to basic and low-quality healthcare (Prost et al., 2021; Vaughn and Carroll, 1998). While members of the public also live in areas with high PM2.5 concentrations, they generally have agency, though in some cases, historical and structural factors such as poverty make it difficult or impossible to move. Individuals serving time in TDCJ facilities, however, do not have a say in which county or facility they are placed in and have no control over the conditions of their facility – from the food they are given to eat, the water they are given to drink, and the environmental toxins to which they are exposed. They rely on the state of Texas to keep them safe and healthy. If exposure to high levels of PM2.5 adversely affects the health and well-being of incarcerated individuals, then the state of Texas has the responsibility to make changes to better protect them from exposure. These changes could include improving access to and quality of healthcare for incarcerated people, improving the air quality inside TDCJ facilities, and working with the largest human-made producers of PM2.5 to lower levels of PM2.5 in the surrounding airspace.
Data and methods
This study uses data from three sources: (1) the Centers for Disease Control and Prevention (CDC) National Environmental Public Health Tracking Network (Tracking Network); (2) the Texas Department of Criminal Justice; and (3) the U.S. Census Bureau's 2015–2019 5-year American Community Survey (ACS). The Tracking Network was used to collect county-level historical averages of PM2.5 concentrations in Texas for 2018. 3 County-level PM2.5 concentrations were available for all 254 counties in Texas. The TDCJ website was used to identify Texas counties with one or more TDCJ facilities. 4 The ACS collects annual information from households in all 50 states, as well as Washington, D.C., and Puerto Rico. Every year, about 3.5 million households are chosen to participate in the survey and one member from each household is instructed to provide demographic information on all persons living in that household. Information collected includes educational attainment, income, home ownership, citizen status, etc. Results of the 2015–2019 5-year ACS were used to gather county land area, the percentage of employed people in industry jobs, median household income data, population density, and the racial makeup of residents in Texas counties. 5 The ACS had information for all Texas counties, so every county in the state was included in the analyses.
Dependent variables
The dependent variable is county-level PM2.5 concentrations in Texas in 2018. The EPA calculated these estimates by averaging daily estimates of PM2.5 in every county in 2018. PM2.5 is measured as the number of micrograms of PM2.5 that are present per cubic meter of air (µg/m3). 6
Independent variables
Three independent variables are used to examine if concentrations of PM2.5 vary between counties with and without TDCJ facilities. First, a binary variable that indicates if a county has a TDCJ facility (0 = no, 1 = yes). In total, there are 100 TDCJ facilities in 58 counties. These facilities include prisons (n = 65), state jails (n = 16), pre-release facilities (n = 4), Substance Abuse Felony Punishment (SAFPH) facilities (n = 4), psychiatric facilities (n = 3), medical facilities (n = 2), Intermediate Sanction Facilities (n = 2), multi-purpose facilities (n = 2), Developmental Disabilities Program (DDP) facilities (n = 1), and geriatric facilities (n = 1). One concern with including all these types of facilities in the analysis is that facilities that are not designated as prisons – which likely house individuals who have special needs such as severe physical or mental health concerns, and therefore are not representative of all incarcerated people in Texas – might be purposely built-in counties with specific physical or environmental features such as social service agencies or green spaces to promote health and wellbeing. As such, PM2.5 levels might differ in counties with prisons compared to those counties with special, non-prison facilities. Therefore, we designated two additional independent variables: (1) a binary variable that indicates if a county has a TDCJ prison (0 = no, 1 = yes), and (2) a binary variable that indicates if a county has a non-prison TDCJ facility (0 = no, 1 = yes). 7 Regardless of the type of facility a person is housed in, each person must be convicted of a crime and sentenced to incarceration before being placed in any TDCJ facility. One hundred ninety-six counties have zero TDCJ facilities, 36 have one facility, 14 have two facilities, three have three facilities, two have four facilities, one has five facilities, one has six facilities, and one has seven facilities.
Control variables
Six demographic variables recognized as important correlates of PM2.5 in past studies are included as controls (Colmer et al., 2020). Five of these county-level measures were taken from the 2015–2019 5-year ACS and include a measure of land area of each county (in square miles), a measure of the percentage of employed people working industry jobs (which is the sum of the percentage of employed people working in construction, manufacturing, agriculture, forestry, fishing, hunting, and mining), a continuous measure of median household income (in thousands of dollars), population density, which is defined as the number of thousand residents per square mile (which we converted to hundred because most counties have far less than a thousand residents per square mile), 8 and the racial makeup of residents which is defined as the percentage of non-Hispanic White residents. We also estimated the maximum percent of each county's population that is comprised of incarcerated individuals. We did this by getting the capacity of each TDCJ facility, aggregating those numbers to the county level, and dividing the county capacities by each county's total population. We decided to use total county prison capacity rather than the population of incarcerated individuals because current data are from post-COVID-19 times while PM2.5 data are from pre-COVID-19 and the pandemic has affected, and specifically reduced, the number of people in prisons (Lofaro and McCue, 2020).
Plan of analysis
To examine whether counties with TDCJ facilities, prisons, and non-prison facilities have higher PM2.5 values than counties without these respective TDCJ facilities, we run three OLS regression models to examine if the presence of one or more TDCJ facilities in a county is associated with PM2.5, controlling for county land area, the percentage of people employed in industry jobs, median household income, population density, percent of the county population that is people in prison, and the percentage of non-Hispanic White residents. For the first model, the primary independent variable is the binary variable that indicates if a county has a TDCJ facility. For the second model, the primary independent variable is the binary variable that indicates if a county has a TDCJ prison. For the third model, the primary independent variable is the binary variable that indicates if a county has a non-prison TDCJ facility. For OLS regression, a positive coefficient means that counties with one or more TDCJ facilities, prisons, or non-prison facilities have higher levels of PM2.5 relative to counties without TDCJ facilities, prisons, or non-prison facilities. All analyses were conducted using robust standard errors to partially correct for clustering and heteroscedasticity (Mansournia et al., 2021).
Results
Figure 1 is a choropleth map of Texas counties. Choropleth maps display statistical information about key variables over geographical regions and are helpful in identifying patterns that might be otherwise difficult to identify by looking at a table or list. Counties shaded in a lighter color indicate lower levels of PM2.5 while counties shaded in a darker color indicate higher levels of PM2.5. Counties with black dots placed on them contain at least one TDCJ facility. In general, counties with at least one TDCJ facility tend to have higher levels of PM2.5 than counties without any TDCJ facilities.
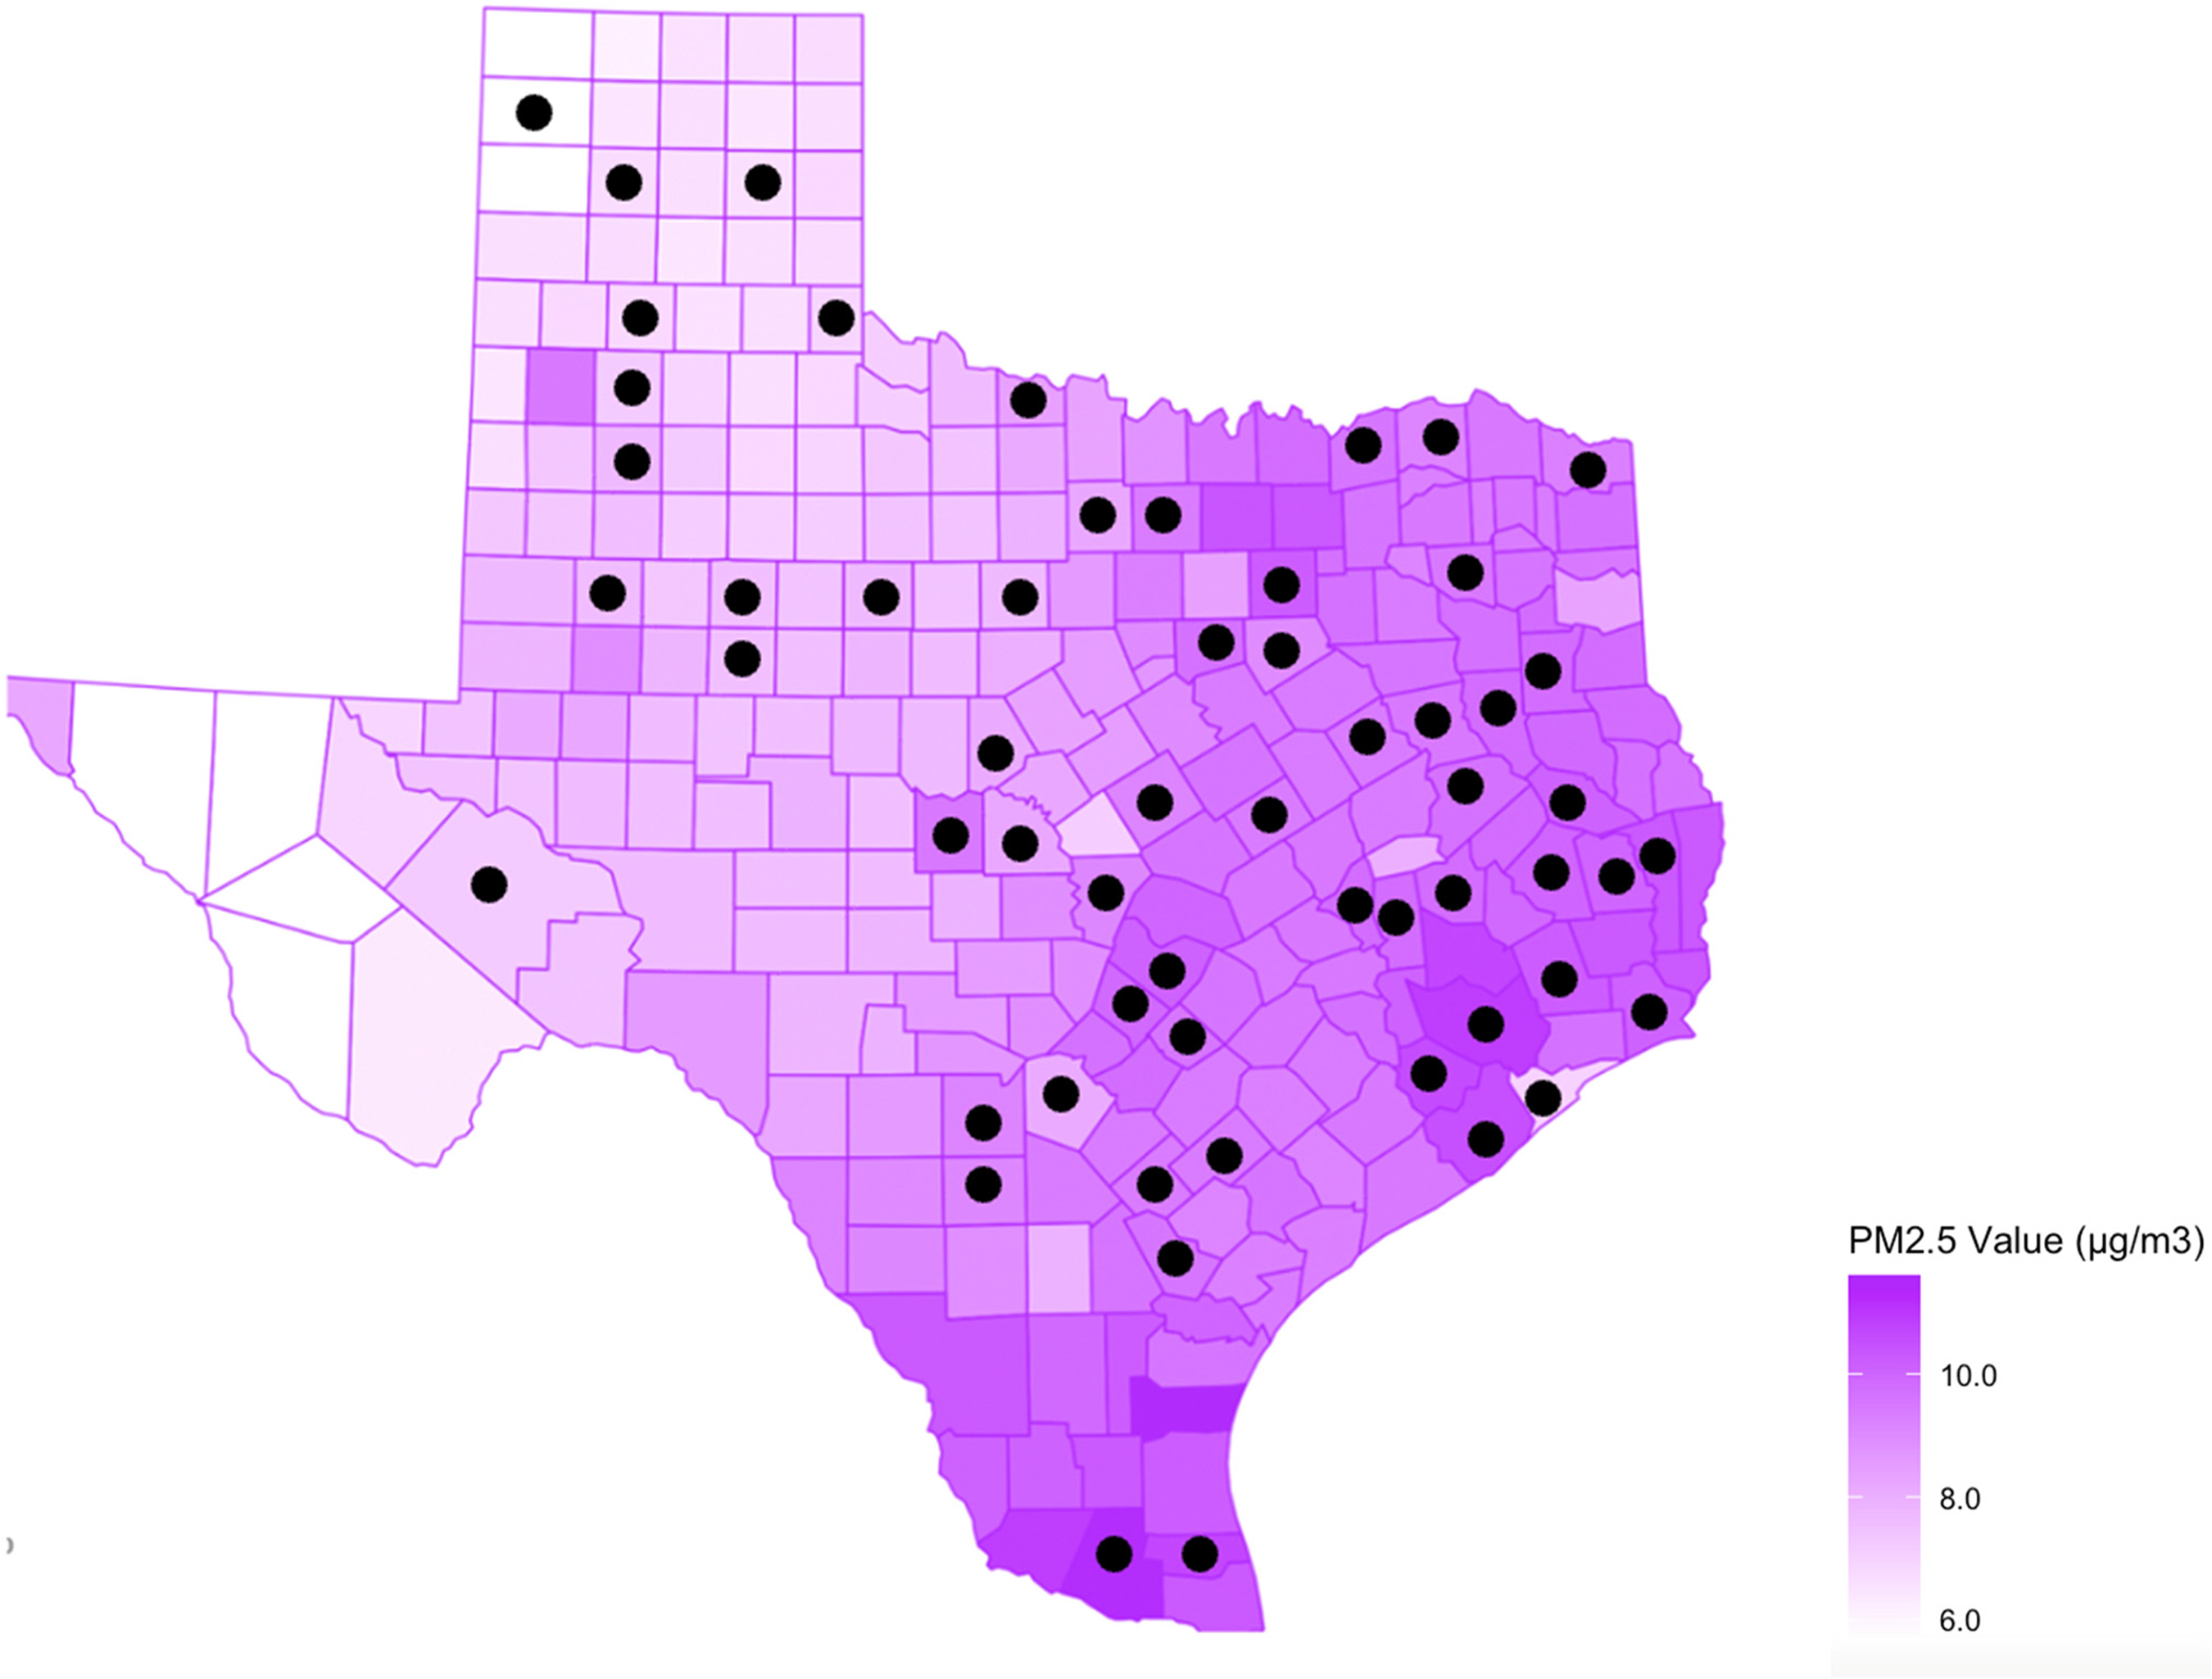
PM2.5 values by county and location of TDCJ facilities.
Table 1 displays the descriptive statistics for all counties (n = 254), counties without TDCJ facilities (n = 196), counties with TDCJ facilities (n = 58), counties with TDCJ prisons (n = 40), and counties with non-prison TDCJ facilities. Across all Texas counties, the concentration of PM2.5 is 8.63 µg/m3. This figure is higher in counties with TDCJ facilities at 9.11 µg/m3 and is lower in counties without TDCJ facilities at 8.49 µg/m3, suggesting a relationship between facility location and exposure to PM2.5. Counties with a non-prison TDCJ facility have the highest average concentration of PM2.5 at 9.37 µg/m3, while counties with a TDCJ prison have an average PM2.5 concentration of 9.04 µg/m3. The average land area of all counties is 1057 square miles and is fairly consistent across counties with different facility types. Counties with a non-prison TDCJ facility have the smallest average land area (1002 square miles) while counties without TDCJ facilities have the largest average land area (1062 square miles). The average share of employees who work industry jobs across all Texas counties is 28.24%. This figure is lowest in counties with a non-prison TDCJ facility (23.64%) and highest in counties without TDCJ facilities (29.29%). The average median household income across all Texas counties is $52,850, and ranges from an average of $52,330 in counties with TDCJ prisons to an average of $55,530 in counties with non-prison TDCJ facilities. The average population density across all Texas counties is 120 residents per square mile and there is more variability in this measure by county facility type than in other measures. Population density is lowest among counties with TDCJ prisons (90 residents per square mile on average) and highest among counties without TDCJ facilities (770 residents per square mile on average). Counties with TDCJ facilities have an average of 250 residents per square mile and counties with non-prison TDCJ facilities have an average of 490 residents per square mile. The average share of the county population, which is individuals in TDCJ facilities is between 2.99% and 7.01% across all counties with at least one facility. The average percentage of non-Hispanic White residents across all Texas counties is 55.47%, and ranges from 52.77% in counties with non-prison TDCJ facilities to 56.19% in counties without TDCJ facilities.
Descriptive statistics for all counties and counties with and without TDCJ facilities.
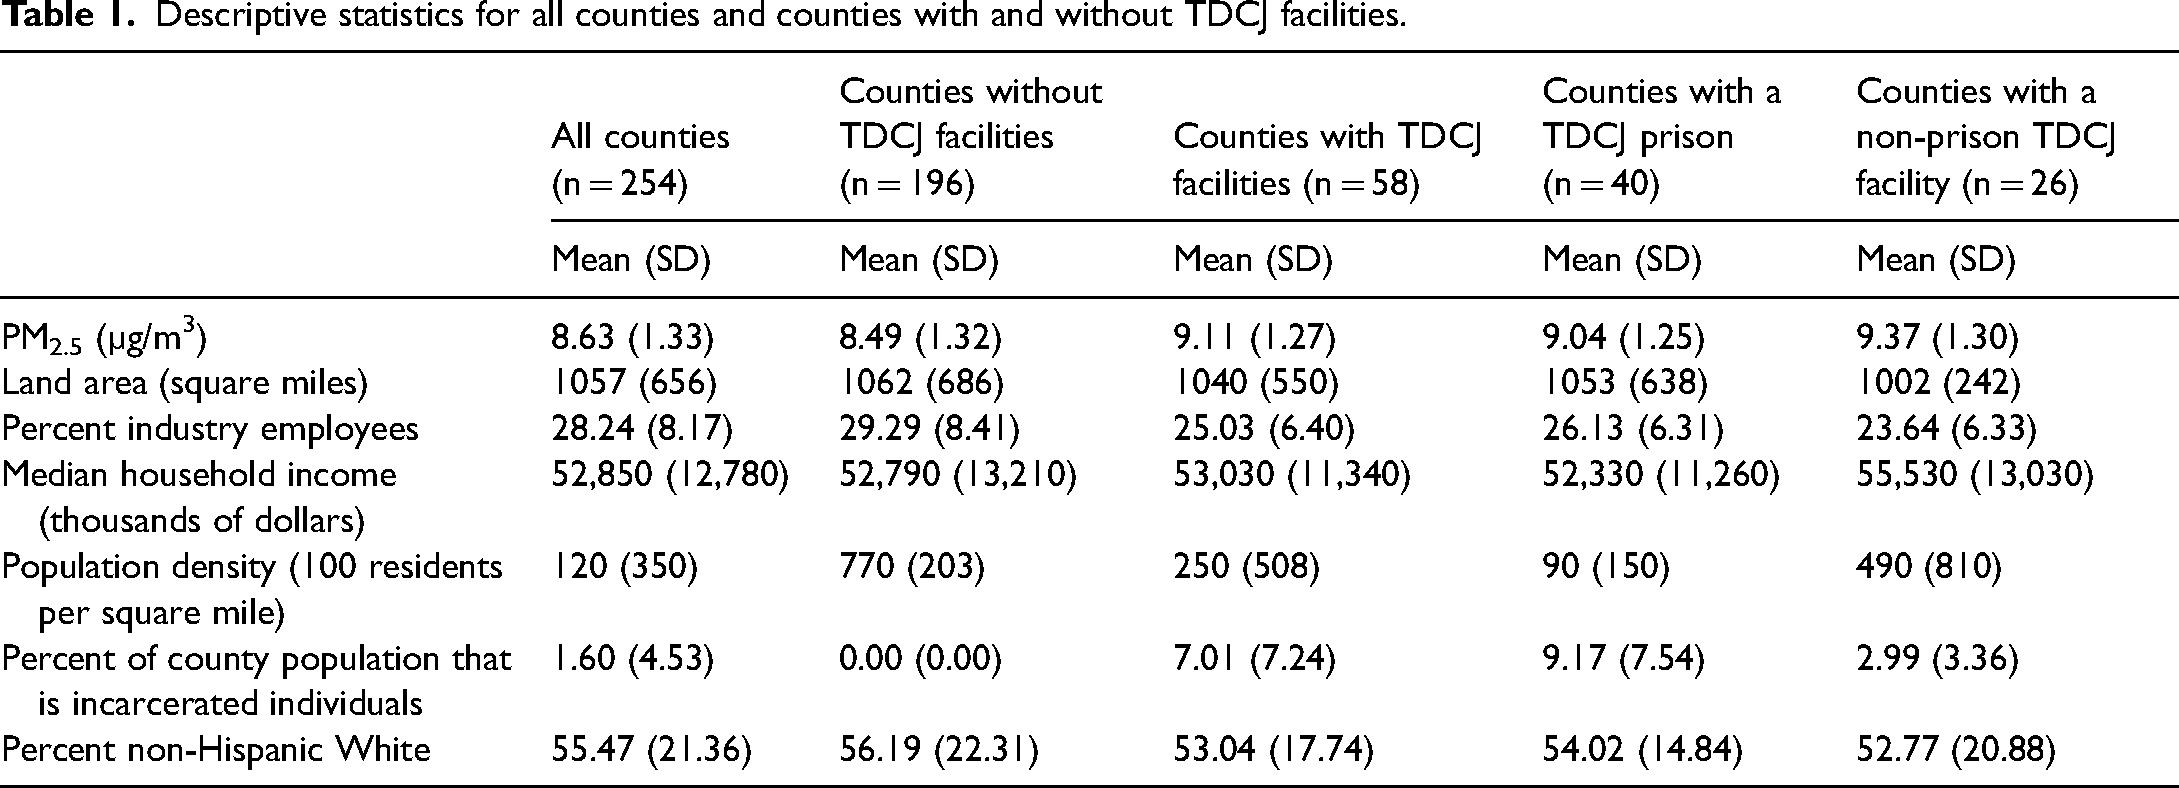
Table 2 presents the results of the OLS regression showing PM2.5 concentrations in counties with TDCJ facilities relative to in counties without TDCJ facilities. Each row presents how each measure is related to PM2.5. The first column shows the beta coefficient (b), which is how much PM2.5 changes with a one-unit increase in each independent variable. In row one, beta is the difference in the concentration of PM2.5 in counties with TDCJ facilities relative to in counties without TDCJ facilities. Column two presents the 95% confidence intervals and column three gives the p-value. The R2 and root MSE values are listed in the table notes for information on model performance. The results indicate that, compared to counties without TDCJ facilities, counties that have one or more TDCJ facilities have an increased PM2.5 concentration by about .574 µg/m3 (95% confidence interval [.066, 1.082], p = .027). This means that PM2.5 is about 6.5% higher in counties with TDJC facilities than in counties without TDCJ facilities. Smaller county land area (95% confidence interval [−.001, −.000], p < .001), a lower percent of industry employees (95% confidence interval [−.073, −.032], p < .001), and having a lower percentage of non-Hispanic White residents (95% confidence interval [−.020, −.004], p = .002) is also significantly associated with increased PM2.5. Median household income (95% confidence interval [−.005, .018], p = .243), population density, (95% confidence interval [−.322, .632], p = .523), and the percentage of the county population who are people in TDCJ facilities (95% confidence interval [−.088, .015], p = .161), is not significantly associated with PM2.5. About 26% of the variability in PM2.5 is explained by the variables presented in Table 2.
OLS regression showing PM2.5 concentrations in counties with TDCJ facilities relative to in counties without TDCJ facilities.
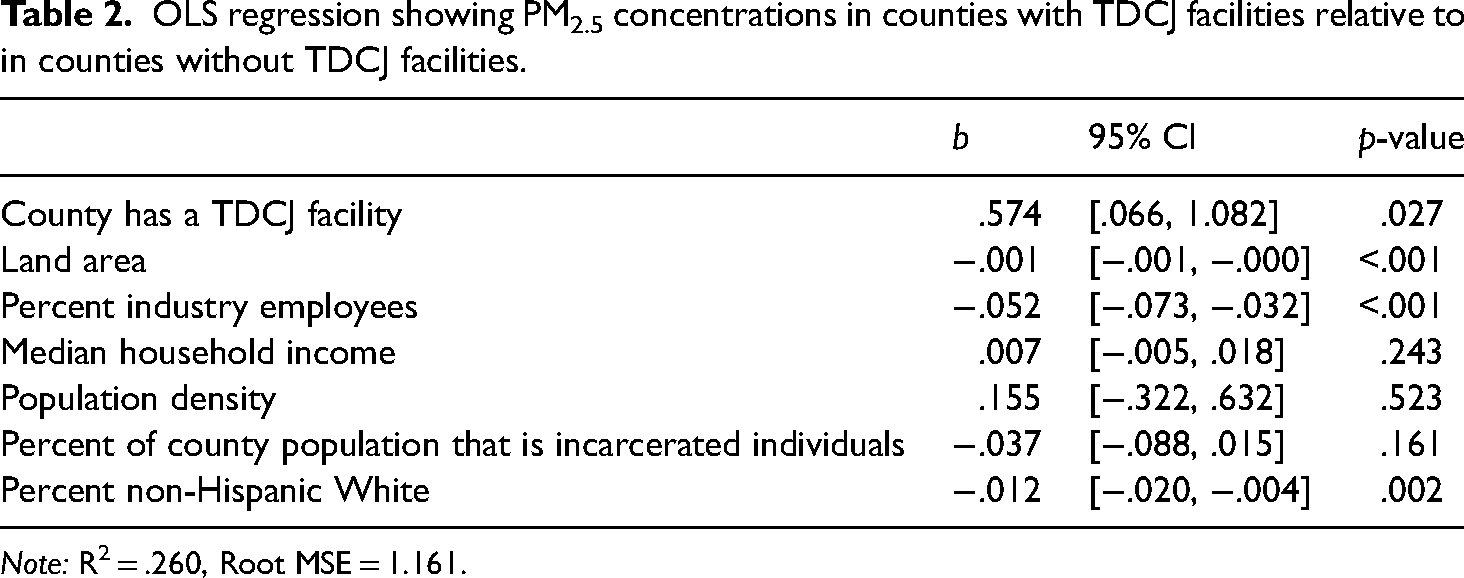
Note: R2 = .260, Root MSE = 1.161.
Table 3, which is set up identical to Table 2, presents the results of the OLS regression showing PM2.5 concentrations in counties with TDCJ prisons relative to counties without TDCJ prisons. The results indicate that, compared to counties without TDCJ prisons, counties that have one or more TDCJ prisons have an increased PM2.5 concentration by about .748 µg/m3 (95% confidence interval [.190, 1.306], p = .009). This means that PM2.5 is about 8.4% higher in counties with TDJC prisons than in counties without TDCJ prisons. Smaller county land area (95% confidence interval [−.001, −.000], p < .001), a lower percent of industry employees (95% confidence interval [−.073, −.032], p < .001), and having a lower percentage of non-Hispanic White residents (95% confidence interval [−.020, −.004], p = .003) are also significantly associated with increased PM2.5. median household income (95% confidence interval [−.006, .017], p = .371), population density, (95% confidence interval [−.163, .843], p = .184), and the percentage of the county population who are people in TDCJ facilities (95% confidence interval [−.097, .007], p = .091), are not significantly associated with PM2.5. About 26% of the variability in PM2.5 is explained by the variables presented in Table 3.
OLS regression showing PM2.5 concentrations in counties with TDCJ prisons relative to in counties without TDCJ prisons.
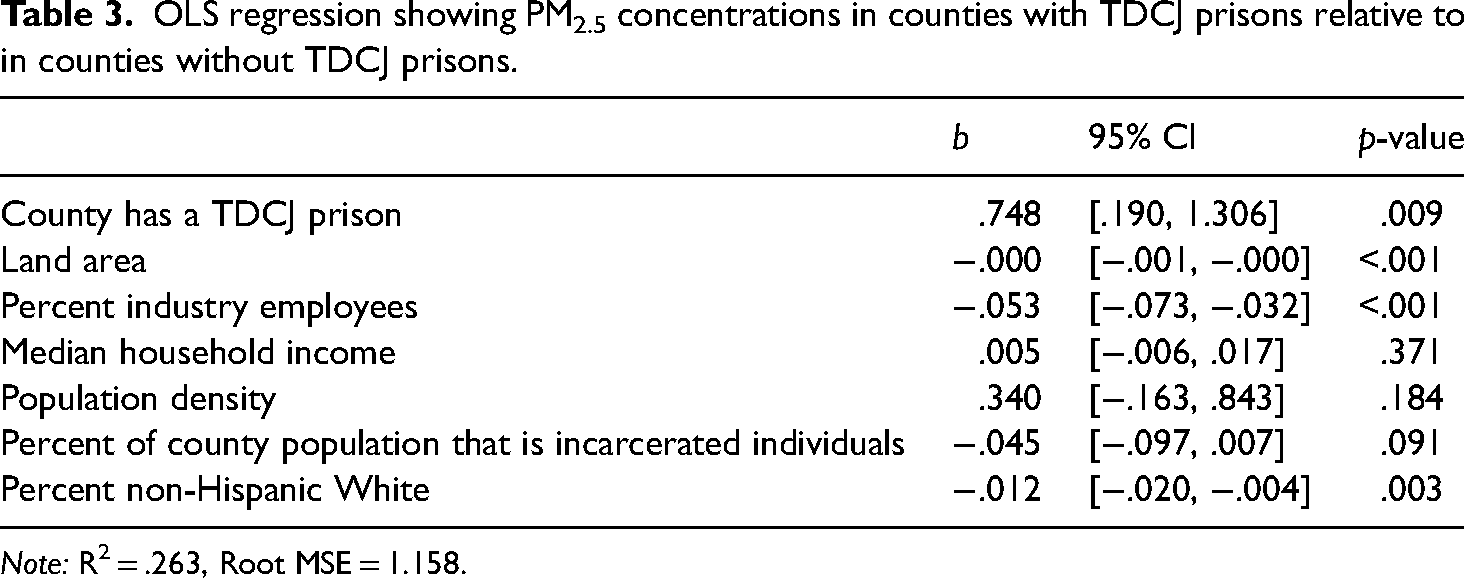
Note: R2 = .263, Root MSE = 1.158.
Table 4 presents the results of the OLS regression showing PM2.5 concentrations in counties with non-prison TDCJ facilities relative to in counties without any non-prison TDCJ facilities. The results indicate that, compared to counties without any non-prison TDCJ facilities, counties that have one or more non-prison TDCJ facilities have an increased PM2.5 concentration by about .370 µg/m3, although this increase is not statistically significant (95% confidence interval [−.196, .935], p = .200). Land area (95% confidence interval [−.001, −.000], p < .001), percent industry employees (95% confidence interval [−.075, −.033], p < .001), and the percentage of non-Hispanic White residents (95% confidence interval [−.010, −.005], p = .002) are remain significantly associated with PM2.5 such that when these values are lower, PM2.5 is higher. Median household income (95% confidence interval [−.004, .019], p = .222), population density (95% confidence interval [−.306, .706], p = .437), and the percentage of the county population who are people in TDCJ facilities (95% confidence interval [−.042, .033], p = .824), are not significantly associated with PM2.5. About 26% of the variability in PM2.5 is explained by the variables presented in Table 4.
OLS regression showing PM2.5 concentrations in counties with non-prison TDCJ facilities relative to in counties without non-prison TDCJ facilities.
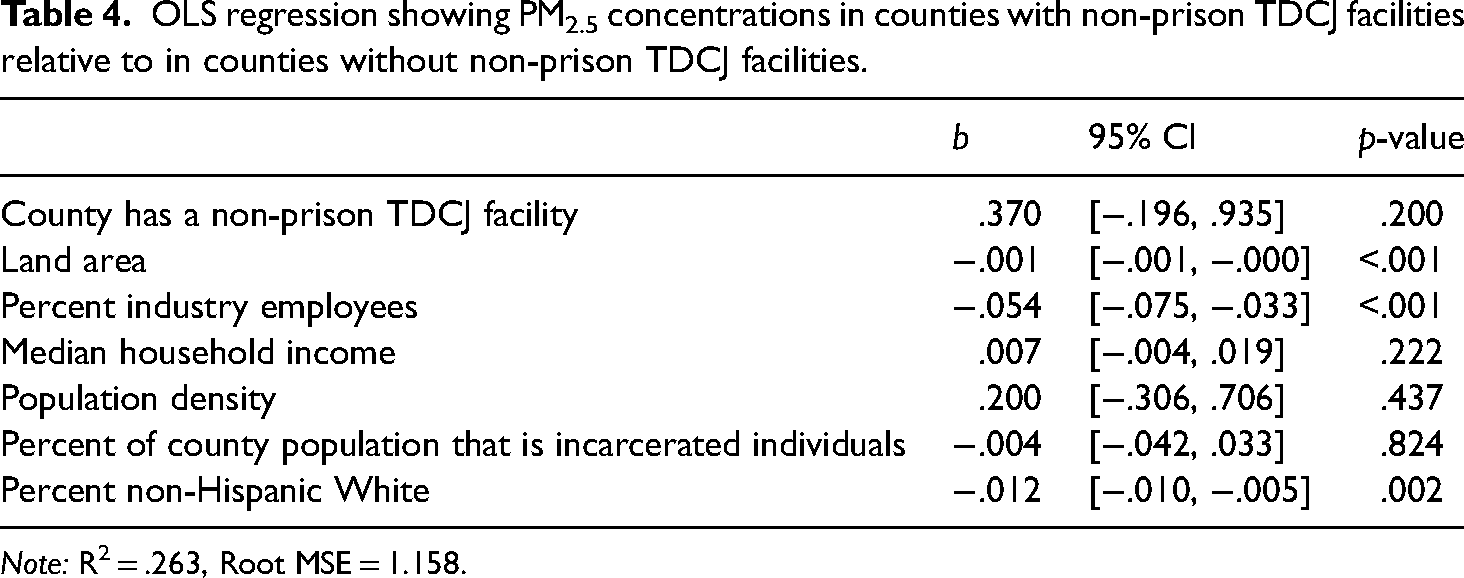
Note: R2 = .263, Root MSE = 1.158.
Discussion
Past research has indicated that some correctional facilities in the U.S. are subject to environmental justice problems, such as exposure to dangerous toxins like methane (Pellow, 2017) and coal ash (Bradshaw, 2018; Schept, 2014). Aside from a small handful of studies (Leon-Corwin et al., 2020; Toman, 2022), however, it remains largely unknown if areas with correctional facilities are exposed to higher levels of environmental toxins relative to areas without correctional facilities. Given that many incarcerated individuals suffer from a variety of health conditions (Binswanger et al., 2009; Butler et al., 2004; Fazel and Baillargeon, 2011), the quality of prison healthcare is low overall (Prost et al., 2021; Vaughn and Carroll, 1998), and exposure to environmental toxins can both exacerbate and contribute to the development of new health problems (U.S. Environmental Protection Agency, 2021; Xing et al., 2016), this is an important avenue of inquiry. The idea that areas with correctional facilities might have higher levels of environmental toxins can be supported theoretically by Perdue's (2023) argument in which communities are chosen to house correctional facilities to combat the consequences to place incarcerated people in areas with other “outsiders”, such as poor rural areas. Pellow's perspective also supports the claim that areas with correctional facilities might have higher levels of environmental toxins as stakeholders might believe that there are societal and historical reasons to build facilities in these areas.
In response to these gaps and theoretical perspectives, this study examined if levels of PM2.5, which is a form of hazardous pollution, are different in counties with Texas Department of Criminal Justice (TDCJ) facilities relative to those counties without TDCJ facilities. This study used OLS regression models to calculate if PM2.5 is higher in counties with TDCJ facilities relative to counties without TDCJ facilities and to calculate if counties with TDCJ prisons and non-prison TDCJ facilities have higher PM2.5 values than counties without these respective facilities.
It was hypothesized that the concentration of PM2.5 would be higher in counties with TDCJ facilities than in countries without TDCJ facilities. This hypothesis was supported in two of three models presented in this study, providing further evidence of environmental injustice among individuals involved in the criminal legal system. More specifically, the results of the OLS models indicated that counties with TDCJ facilities have around 7% higher concentrations of PM2.5 than counties without TDCJ facilities. In addition, counties with TDCJ prisons have around 8% higher concentrations of PM2.5 than counties without TDCJ prisons. Contrary to our hypothesis and the results for the previous two models, however, PM2.5 is not statistically different in counties with non-prison TDCJ facilities relative to counties without non-prison TDCJ facilities. Model performance is similar for each of the three models presented in the current study, with about 26% of the variability in PM2.5 is explained by the variables presented in each model.
There are some possible explanations for our significant results that warrant further discussion. First, it could be that land in TDCJ counties, where PM2.5 is elevated, was cheaper relative to land in other, less polluted counties before TDCJ facilities were built. Thus, the state of Texas chose these areas to serve as TDCJ homes to save money. Another explanation for these results is that TDCJ counties might overlap with counties that house Texas power plants and other big polluters. For the most part, TDCJ facilities are in rural areas (Penn, 2020). Consequently, Texas power plants, which can affect the concentration of PM2.5, are also often located in areas away from where large groups of people live, such as in rural towns or industry sectors of larger cities (Advanced Houston Research Center, 2003). The intersection of these two components could, in part, explain the observed relationship between PM2.5 and TDCJ facility counties.
There are also possible reasons that could explain why PM2.5 levels do not differ in counties with and without non-prison TDCJ facilities. For example, because most of these facilities are State jails with the goals of rehabilitation and treatment for people who committed low-level felonies (Graves, 2019), and a large minority of these facilities are reserved for older people and people with existing health concerns, these facilities may have purposely been built in areas with better air quality. Because the people living in these facilities are at higher risk of developing new conditions or will be released soon, it is in TDCJ's interest to do what it can to avoid the development of new medical conditions among these people.
The findings from this study indicate that people serving time in TDCJ facilities, and particularly prisons are, in general, likely being exposed to higher levels of PM2.5 than they would if they were not incarcerated. While some non-incarcerated Texas residents live in these counties and are thus being exposed to higher levels of PM2.5 as well, people in TDCJ facilities did not choose to live there and do not have the choice to move away, even if they wanted to. They must rely on the state to keep them safe. Texas state officials and TDCJ leaders should recognize this and improve conditions of confinement that will better ensure the health and safety of incarcerated individuals and facility staff. Some policies that can be changed or implemented in response to this study include improving healthcare for incarcerated individuals and upgrading air filtration systems in TDCJ facilities.
Currently, the quality of healthcare that TDCJ provides for incarcerated people is not sufficient. In a recent qualitative study, medical trainees in Hospital Galveston, which is dedicated to treating individuals under TDCJ supervision and supplies 80% of healthcare for TDCJ facilities, reveal patterns of treating incarcerated people poorly (Hashmi et al., 2021). More specifically, the trainees report delays in care and neglect for incarcerated patients. Texas also spends about 30% less on annual healthcare per person in prison compared to the average cost of annual healthcare per person in prison in the U.S. (Rao et al., 2021), suggesting that incarcerated people might not be able to get the care they need for their health concerns. To further demonstrate this point, findings from previous research revealed that around one-third of older people in TDCJ facilities were prescribed incorrect medications for their health conditions in 2006 and 2007 (Williams et al., 2010). For individuals incarcerated in TDCJ facilities to obtain the care they require, including care for environmental-justice-related health problems, the state must improve access to adequate healthcare for these people.
Another policy that can be implemented in response to the current study's findings is improving air filtration systems within TDCJ facilities. While the information on current air filtration systems at TDCJ facilities is not publicly available, a 2015 study reported that most modern air purifying technology does not have the ability to filter PM2.5 particles effectively (Liu et al., 2015). Recently developed nanofiber materials have been shown to remove 95% of PM2.5, however (Liu et al., 2015; Zhao et al., 2016). As these materials are very new and are likely expensive and difficult to access, TDCJ officials could consider an easier solution which is providing people in TDCJ facilities with N95 masks, which have also been shown to prevent some exposure to PM2.5 particles (Li and Gong, 2015). Incarcerated individuals could decide for themselves when they wear these masks and could have them taken away if the masks present a security risk. Due to the COVID-19 pandemic, TDCJ is currently issuing masks to incarcerated people and staff but the type of mask (surgical, cloth, N95) depends on the medical needs of each person and availability of resources, so not everyone has access to N95 s, and it is unclear how these masks are distributed (COVID-19 Frequently Asked Questions, n.d.).
While this study addresses an important gap in the research on environmental injustices in correctional settings, there are some limitations that should be mentioned. First, this study uses a cross-sectional design, and therefore, it is not possible to conclude if TDCJ facilities cause PM2.5 to increase in the surrounding area. Second, even though TDCJ counties have higher concentrations of PM2.5, it remains unknown what effect, if any, higher exposure to PM2.5 has on the health of individuals in TDCJ facilities. Next, this study uses county levels of PM2.5 but levels might vary from one end of a county to another, especially in larger counties. Past research indicates that PM2.5 can be accurately estimated up to 10 kilometers, or about six miles away in any direction from the location in which PM2.5 was measured (Fang et al., 2016). Thus, if PM2.5 monitoring devices are several miles from the TDCJ facilities, then the true concentration of PM2.5 might be different at these facilities. Although PM2.5 data are available at smaller geographical units, including census tracts (U.S. Environmental Protection Agency, 2022a), most census tracts in Texas do not have a PM2.5 monitoring station and therefore, a large portion of this census-tract level data is imputed. It is unknown how accurate imputed data for PM2.5 levels are. As environmental justice concerns are gaining more popularity among the public (Funk et al., 2020), additional PM2.5 and other environmental hazard monitoring stations should be installed in a greater number of geographical areas for accurate data collection.
Fourth, this study does not examine what counties individuals incarcerated in TDCJ facilities are coming from. It could be that these individuals are disproportionately coming from counties with higher levels of PM2.5 and are not actually any more likely to get exposed to PM2.5 than they would if they were not sentenced to prison. Future research should examine if PM2.5 is different in incarcerated individuals’ home counties relative to TDCJ counties. Lastly, the PM2.5 used in this study comes from just one year, 2018. As PM2.5 has decreased substantially over the last few decades (Colmer et al., 2020; Fann et al., 2018), it might continue decreasing throughout Texas and the entire U.S. as we resort to using cleaner energy sources that do not pollute the atmosphere. Therefore, it is possible that the observed positive relationships between PM2.5 and TDCJ counties captured in the present analyses might not exist in the future as PM2.5 continues to decline.
Conclusion
Overall, the current study's results provide evidence that counties with correctional facilities experience more instances of environmental injustice, in this case, PM2.5, than counties without correctional facilities in Texas. These findings demonstrate the importance of improving conditions of confinement such as bettering healthcare for incarcerated individuals to help address the health concerns that they experience while under supervision of the criminal legal system.
Footnotes
Acknowledgements
The author would like to thank Elisa Toman, Ryan Masters, and Peanut for their helpful feedback.
Declaration of conflicting interests
The author(s) declared no potential conflicts of interest with respect to the research, authorship, and/or publication of this article.
Funding
The author(s) received no financial support for the research, authorship, and/or publication of this article.