
Abstract
Over the last 10–15 years, Western societies have faced two interrelated social changes: the digitalization of media and the increase in socio-political polarization. While their relationship is causally reciprocal, population-level empirical studies focusing on over-time change remain scarce. We adopt the temporal perspective on the socio-political stratification of media usage in the context of Finland, one of the so-called Nordic media welfare states. We ask whether the ways in which media usage is socially stratified has changed from 2007 to 2018 and whether there is political polarization of media consumption. We draw on two nationally representative comparative surveys, collected in 2007 (N = 1388) and 2018 (N = 1425), and show that the main media usage patterns—the wide, the narrow, and the Internet-focused media repertoires—differ both in terms of their sociodemographic and political profiles and that the opposition between the wide and the narrow repertoires becomes increasingly polarized.
Introduction: the socio-political stratification of media usage
Perhaps with the exception of literature on the digital divide (e.g. DiMaggio et al., 2004; Norris, 2001; Scheerder et al., 2017), there has been little dialogue between studies of media use and studies of social stratification of cultural practices in recent years. This situation reflects the persistence of a more general divide between research on cultural production and cultural consumption, even if both are two sides of the same coin to the point that they become meaningless if separated (e.g. Purhonen et al., 2019).
A good example is how the link between media and politics has been approached in previous research (e.g. Bakker and de Vreese, 2011; Boulianne, 2009; Delli Carpini, 2004; Norris, 2000). Many studies by media scholars have analyzed how the use of media (especially social media and the Internet) impacts political participation or orientation, with causality interpreted as media use impacting political orientation (e.g. Holt et al., 2013; Kahne and Bowyer, 2018; Xenos and Moy, 2007). However, while this can sometimes be the case, the relationship is reciprocal, or multi-causal, because it is equally likely that political orientations and interests impact (or motivate) media use (Boulianne, 2011; Couldry et al., 2010). If the first case, where the causal order is such that media use impacts political interest, can be considered as a stimulation effect, the latter case, where the order is reversed, can be considered a reinforcement (or selection) effect, and it depends on the specific empirical case whether these “effects run stronger in one direction than the other” (Boulianne, 2011: 149). While the potential stimulation effect deserves full attention, not least due to its social significance, it is very challenging to investigate empirically: panel data (following the same set of individuals over time) and/or experimental settings are required to establish the causal power of media use on outcomes such as political participation (e.g. Boulianne, 2015).
The reinforcement effect is more straightforward because it can be considered similar to the “social stratification” of the cultural consumption model typically deployed by sociologists of culture, but with “the political” added among other variables on the stratification side (see De Keere, 2018; DellaPosta et al., 2015; DiMaggio, 1996; Harrits, 2013; Jarness et al., 2019). Thus, even if the approach does not preclude the possibility of the stimulation effect, it considers the reinforcement effect to be the primary order of causality. Just as, say, going to classical music concerts might eventually impact an individual’s socioeconomic status, it is mostly assumed that going to classical music concerts requires socioeconomic resources, and therefore people of a certain socioeconomic status tend to go to classical music concerts more often than others. The same goes for media usage and political orientations. Thus, the model of the stratification of media usage—like any other cultural practice—raises the question of inequality as it focuses on the fact that cultural practices are not distributed evenly across social groups. Media is a relevant source of cultural distinctions (Lindell and Hovden, 2018), and the usage of different media forms (and the cultural and technological capacities it requires) may result in a wide range of social and economic benefits. Examples of this entail, in the case of traditional legacy media, being able to accumulate legitimate knowledge and cultural capital and transfer them into educational success or qualifications (Bourdieu, 1984) or, in the case of new media, being able to create and maintain contacts with both significant others and people further away in distinct social networks, improving one’s possibilities of consumption and participation, or enhancing one’s position in the labor market through better academic performance and skills to promote one’s career on different online platforms (Koiranen et al., 2019; Yuen et al., 2018).
In this article, we employ the perspective of the socio-political stratification of media usage with a special focus on change over the last decade. We contend that media use, among other cultural practices, is not only an indirect product of class or status (Bourdieu, 1984) but that cultural practices could also indicate wider socio-political orientations (Lamont, 1992) present also in the traditionally egalitarian Nordic contexts (Harrits et al., 2010; Purhonen and Heikkilä 2017; Skjøtt-Larsen, 2012). This is why we approach media stratification specifically from the perspective of political attitudes and socio-political polarization. From among divergent definitions of polarization found in the literature, we use the concept of polarization in a simple sociological sense to refer to a temporal process regarding whether social and political differentiation of media usage has become more sharply pronounced over time (e.g. DellaPosta, 2020; DiMaggio et al., 1996). If it is, we can say that media usage has become more polarized. Even if the link between media (especially social media) and polarization (however defined) has recently been a much-debated issue (Tucker et al., 2018), population-level empirical studies focusing on the socio-political stratification of media usage from the perspective of change over time—like ours—remain scarce (see, however, Koiranen et al., 2019). This is the case especially regarding the period of the last 10 or 15 years (the historical context of this study) marked by rising socioeconomic inequalities (Savage et al., 2015), the increasing popularity of social media, and the concerns about it leading toward a more strongly polarized political culture or “echo chambers” of the like-minded (Kearney, 2019; Vihma et al., 2018), and a rapid digitalization of culture and the subsequent forms of digital divides (Mihelj et al., 2019).
Our empirical case is Finland, one of the relatively wealthy so-called Nordic welfare states (Esping-Andersen, 1999), or, indeed, “media welfare states” (Syvertsen et al., 2014) with still rather small income differences and a largely decommodified public sector. In terms of media, Finland stands firmly in the regime of the democratic corporatist media system model (Hallin and Mancini, 2004) but is characterized by a relatively peripherical position and volume in terms of cultural production, state-driven cultural policy, strong freedom of the press, and wide visibility of foreign media items (Purhonen et al., 2019). Compared to many other countries, Finland is a relatively scarcely populated and culturally rather homogeneous society that sociologists have found to offer few possibilities for effective lifestyle distinctions (Mäkelä, 1985); recently, however, findings indicate that Finland’s patterns of lifestyle differentiation are similarly hierarchically layered as elsewhere in the Global North (Purhonen et al., 2010, 2011, 2014). This is of course at least partly due to the general patterns of cultural globalization and common developments of post-industrial capitalist societies, also in the Nordic countries, which long enjoyed strong redistribution of wealth but are now experiencing increasing income inequalities (cf. Lindell and Hovden, 2018).
Thus, in this article and in the context of Finland, we ask (RQ1) whether and how media use and the ways in which it is socially stratified has changed between 2007 and 2018, and (RQ2) whether there are signs of socio-political polarization regarding media consumption. The article is organized as follows: After reviewing literature on the recent proliferation and abundance of media in the next section, we will present our research design and results and finally discuss and summarize them in the last section.
The changing landscape of media usage
There is a consensus that media products have proliferated in the last decades and that mediatic production systems are rapidly changing from traditional, influential top-down mass medias to fragmented and splintered smaller units of producing and sharing information and content. From the early 2000s, scholars started talking about the “end of mass communication” (Chaffee and Metzger, 2001), paving the way for ideas about “new media.” The ways in which contemporary media is consumed are also changing: audiences are seen as active and selective actors (Van Rees and Van Eijck, 2003) who need to use their skills to make choices in the increasingly more complex and abundant media environment.
This proliferation, along with technological changes, has severely challenged the institutional media and has led to the downfall or at least the remaking of traditional media. In the sphere of print media, the recent economic crises have amplified the problems (Vihma et al., 2018), leading to rapidly decreasing circulation numbers of traditional quality newspapers (Heikkilä et al., 2017). Some authors have noted that these changes have even forced traditional institutional media to adopt the same strategies that social media are using, through, for instance, hiring specific social media editors to keep track of discussion topics in different social networks with the idea of engaging better with audiences (Gleason, 2010).
What is common to all these processes is the idea of the Internet becoming a central channel for mediating information. However, scholars have very different ideas about how new media technologies, especially the World Wide Web, would impact the media and affect its users: from Manuel Castells’ (1996) optimistic idea about societies as networks and other scholars’ claims that the Internet would lower inequalities due to its capacity to make information circulate cheaply and accessibly, the discussion has shifted to debates on the “digital divide,” nowadays discussed as the superimposition of three phenomena, namely inequalities in initial access, inequalities regarding skills, and inequalities regarding accumulated benefits for users (DiMaggio et al., 2001, 2004; Mihelj et al., 2019). It is still debatable whether the new media environments lead toward better informed and politically engaged publics or rather toward unforeseen socio-political polarization (DiMaggio et al., 2001).
With the proliferation of variety in media, basic socioeconomic hierarchies regarding who uses which kind of media have not disappeared. According to many studies, media use still goes hand in hand with socioeconomic hierarchies, typically differentiating between highbrow-oriented, critical news-driven media use and entertainment-oriented use, the former being associated with high-status educated groups and the latter with groups that have low status and education (Ørmen, 2019; Lindell, 2018; Lindell and Hovden, 2018; Prior, 2007; Scheerder et al., 2019; Van Rees and Van Eijck, 2003). On the other hand, media use seems tightly tied to the rhythms and time-use routines of everyday life (Couldry and Langer, 2005; Taneja et al., 2012).
In the context of a wide offering of media products, many scholars have argued that the abundance of choice would lead people to reduce their media consumption to relatively small selections of everything that is available: this would mean adapting the so-called “media repertoires” (Hasebrink and Popp, 2006; Peterson, 1992; Van Rees and Van Eicjk, 2003; Taneja et al., 2012; Watson-Manheim and Bélanger, 2007), commonly defined as a combination of an individual’s media use routines and selection of typical mediatic products.
Many scholars have expressed worries about the segmentation of media audiences leading to groups that only receive messages apt for their pre-existing cultural and political values and thus possibly narrowing information flows or views. Lindell and Hovden (2018) go so far as to call the new isolated media groups “audience islands.” This kind of audience segmentation is seen first and foremost as a by-product and consequence of digitalization (Peterson, 1992), pushing toward personalized and user-oriented media use. On the other hand, some scholars (e.g. Dubois and Blank, 2018; Webster and Ksiazek, 2012) have pointed out that the talk about audience fragmentation, segregated “echo chambers” based on shared interests and partisanship, or like-minded “enclaves” consuming just one tightly defined niche of media might be at least partly exaggerated and that most media users exhibit a lot of overlap between different kinds of media repertoires usage.
Research design
Data
Our data were derived from two nationally representative surveys collected in 2007 and 2018: these are “Culture and Leisure in Finland, 2007” (N = 1388; response rate 46.3%; sample of 3000, 18- to 74-year-old mainland population in Finland) and “Culture and Leisure in Finland, 2018” (N = 1425; response rate 40.8%; sample of 3500, same population). Since the beginning, the two repeated cross-sectional surveys were planned to allow for analysis over the period between the two time points, and therefore, they have a high degree of comparability. The cultural fields covered in the original questionnaires included television, films, reading (newspapers, magazines, books), music, the visual arts, Internet, cultural attitudes, food and eating, body and sport, games and other leisure time activities (holidays, visiting events, etc.). While indeed not all-encompassing, the questionnaires were intended to be as inclusive as possible, offering respondents alternatives both from highbrow and popular milieus (see Variables). Both surveys also had comprehensive questions on sociodemographic background and social-political attitudes and practices.
In this article, when presenting descriptive information, the datasets were weighted by an index provided by Statistics Finland in order to correct the non-response bias in terms of respondents’ age, gender, education, and residential area. However, for multivariate analysis, unweighted datasets were used as results showed only minimal variation between the weighted and unweighted samples.
Variables
We examined the change in media use through consumption practices in the fields of television, newspapers, magazines, books, and Internet. The variables of media usage were defined as five composite measures of media use variety: (1) the number of TV channels watched regularly from a list of 10 channels (major national public channels, international movie and sports pay channels, a foreign news channel); (2) the number of newspapers read regularly from a list of seven papers (quality national newspapers, yellow press, regional and economic newspapers, free and foreign newspapers); (3) the number of magazines read regularly from a list of 12 magazines (supplements of quality newspapers and a wide range of magazines covering different areas); (4) the number of fiction books read from a list of 11 books (both highbrow and popular items, such as Rowling’s Harry Potter series and Dostoyevsky’s Crime and Punishment); and (5) the number of purposes for Internet use from a list of 11 purposes (a variety of purposes, such as emailing, reading newspapers/magazines, or taking care of everyday tasks). For TV channels, newspapers, and magazines (1–3), “regularly” was a self-rated measure, in opposition to “occasionally” and “never.” Thus, our five scales reflected the variety of media usage in terms of watching television, reading newspapers, magazines, and books, and using the Internet. In addition to the fact that the original media-related comparable questions of our questionnaires were mostly variety scales, we argue in the line of media repertoire literature (Hasebrink and Domeyer, 2012; Hasebrink and Popp, 2006; Van Rees and Van Eijck, 2003) that variety (instead of, for instance, intensity or frequency) is a key factor regarding the social differentiation of media use, wide repertoires often linked to higher social positions and narrow repertoires to lower social positions.
As for determining the sociodemographic divisions, our analysis considered the impact of variables repeatedly found to be important in studies demonstrating how cultural practices connect with class position and are socially stratified (Bennett et al., 2009), making especially age, education, and gender important factors of divisions of hierarchies (Bihagen and Katz-Gerro, 2000; Lizardo and Skiles, 2015; Scherger and Savage, 2010) affecting and structuring both traditional and new types of media use (Bergström et al., 2019; DiMaggio et al., 2004). The variables considered in our analysis were education (no/basic, vocational, college, master’s or higher), income (low, middle, high), age (18–24, 25–34, 35–44, 45–54, 55–64, 65–74 years old), gender (male, female), and residential area (urban, rural).
Our key intention was to focus not only on social stratification of media usage but on the wider socio-political stratification, including factors measuring political orientations. Thus, we used three variables. First, to capture the dimension of “new” politics focused on value and identity questions in contrast to the “old” politics concerned with redistribution (see, for instance, Fraser, 2003; Giddens, 1990; Harrits et al., 2010), we measured conservative versus liberal attitudes on a scale based on 5 items (range 0–20; Likert-type-scale attitude statements such as “sexual relationships among same-sex adults are not acceptable” or “immigration laws should be tightened”). Conservative versus liberal attitudes have been found to be a crucial dimension associated with cultural practices and lifestyles, also in the Nordic countries (Harrits et al., 2010; Jarness et al., 2019; Purhonen and Heikkilä 2017). Second, we used two indicators of civic activity, which we defined as forms of political participation reflecting the very basic and everyday-level significance of “democratic engagement” in respondents’ lives (Delli Carpini, 2004). The first measure indicated participation in at least one of the 16 NGOs and associations listed in the questionnaire, including trade unions, parents’ associations, community service associations, sports clubs, and such. The second indicated the intention to vote in national elections (whether one usually votes or not). Such political participation has been shown to be associated with cultural practices and media usage by many previous studies (see Boulianne, 2011; Couldry et al., 2010).
All the variables used were formulated identically in both the 2007 and 2018 surveys. The distributions of all original variables are presented in the Appendix (Table A1). Our choice to rely on an identical set of variables from the two time points had important methodological implications: while it guaranteed the comparability of the measures in technical terms, allowing us to measure shifts in the relative weights across different indicators and their impacts, it did not reflect the change that has taken place in its full force in the sense that the items probed for were same for both years.
Methods
Our methodological approach used a multi-step design and first identified whether there were distinct groups based on the variety of media consumption. To do so, hierarchical cluster analysis (HCA) to our five (standardized) measures of media variety was applied. These were calculated separately for each year in order to allow the possibility of identifying differences in number of groups and/or composition. Cluster analysis is a family of statistical procedures that inductively classifies individuals in a finite number of groups based on their similitude or “distance” (Kaufman and Rousseeuw, 1990). Statistical analysis does not impose any structure or theoretical constraint to the data, allowing to reveal the “natural” clustering of data based on observed patterns. HCA with Ward’s linkage method was applied using R’s package “cluster” (Maechler et al., 2019; R Core Team, 2019). The decision on the number of clusters was validated using several criteria available in the literature and implemented in the package NbCluster (Charrad et al., 2014).
The second part of our analysis sought to explain the unequal distribution of media consumption, its association with different socio-political variables, and the changes between 2007 and 2018. Here, we used multinomial logistic regressions (Agresti, 2013), generalized linear models that test how likely a positive outcome is for one or more numerical and/or categorical variables. To study temporal differences between media engagement, two models, separated by year, were adjusted. The first includes demographic information (control variables) only and the second adds our three variables of political orientations, allowing us to test the change in explanatory power after their addition. We were aware that, when working with repeated cross-sectional data, it is not possible to interpret longitudinal change from direct comparison of regression estimated coefficients (Mood, 2010). Therefore, we focused our attention on the direction of effects, significance levels, and predicted probabilities (margins). This was implemented using Stata 15.
Results
Descriptive trends of media use in 2007 and 2018
Our first step was to measure the basic descriptive trends between 2007 and 2018 regarding the use of the five media types studied: TV, newspapers, magazines, books, and Internet. Figure 1 shows the mean varieties of the numbers of items used. In general, there were very few changes between 2007 and 2018: only a small increase in books and newspaper variety and a small decrease in TV and magazine variety. The Internet, as expected, was where we saw the greatest increase. When it came to similar descriptive trends regarding political attitudes and values, shown in Figure 2, we observed a moderate decrease in conservative attitudes. For NGO participation, we observed a tiny decrease, besides we also found a small decrease in voting.
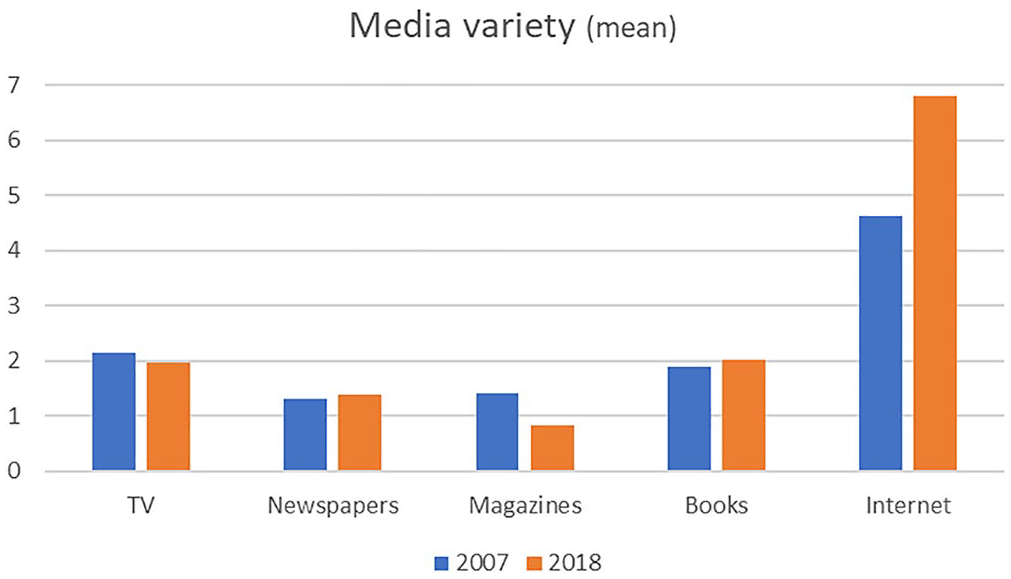
Evolution of patterns of media variety, 2007 and 2018 (weighted).
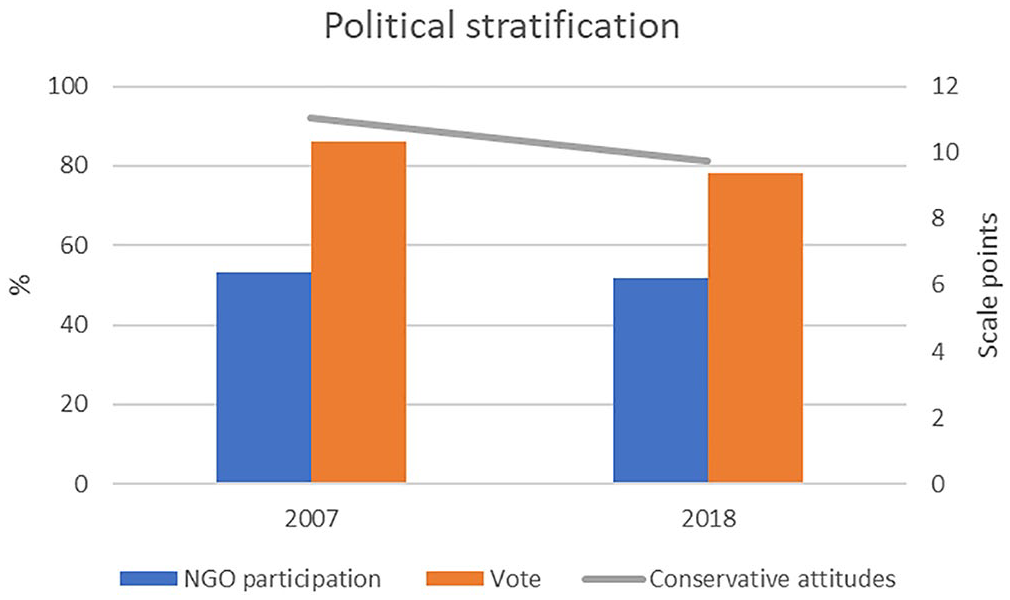
Evolution of patters of political variables, 2007 and 2018 (weighted).
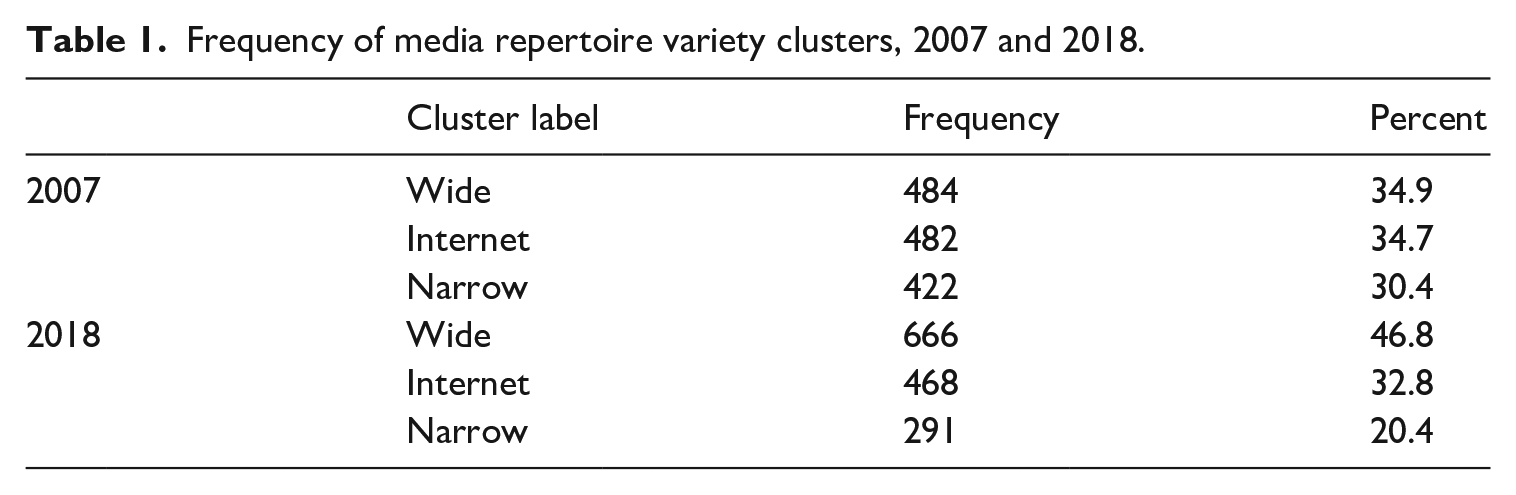
We next used hierarchical cluster analysis on media usage variables in order to identify media repertoires. After an inspection of dendrograms, cluster silhouettes, comparison with alternative solutions, and the study of several criteria available in R’s NbCluster, we identified a three-cluster solution for both datasets. In terms of size and composition, these three identified clusters or repertoires seemed to be similar across time (Table 1) and broadly consistent with media repertoire literature (e.g. Hasebrink and Domeyer, 2012; Hasebrink and Popp, 2006; Van Rees and Van Eijck, 2003). We labeled them “wide,” “Internet,” and “narrow” on the basis of their basic determinants. There is an interesting interplay regarding the sizes of the groups: while in 2007 the “wide” and “Internet” groups were almost exactly as large and the “narrow” group was not much smaller, by 2018, the balance had changed: the “wide repertoire” group was by far the largest, accounting for nearly half of the population. Meanwhile, the “Internet repertoire” group remained relatively stable, whereas the “narrow repertoire” group had diminished to account for only one-fifth of the population.
Frequency of media repertoire variety clusters, 2007 and 2018.
When examined more closely (Figure 3), it can be observed that the “wide repertoire” groups showed the highest variety for everything besides Internet. The “Internet repertoire” members had the highest variety of Internet uses, but they scored very low on the use of any other types of media. Finally, the group labeled as “narrow repertoire” displayed low variety (close to 1) on every aspect, except for TV and the online activities.
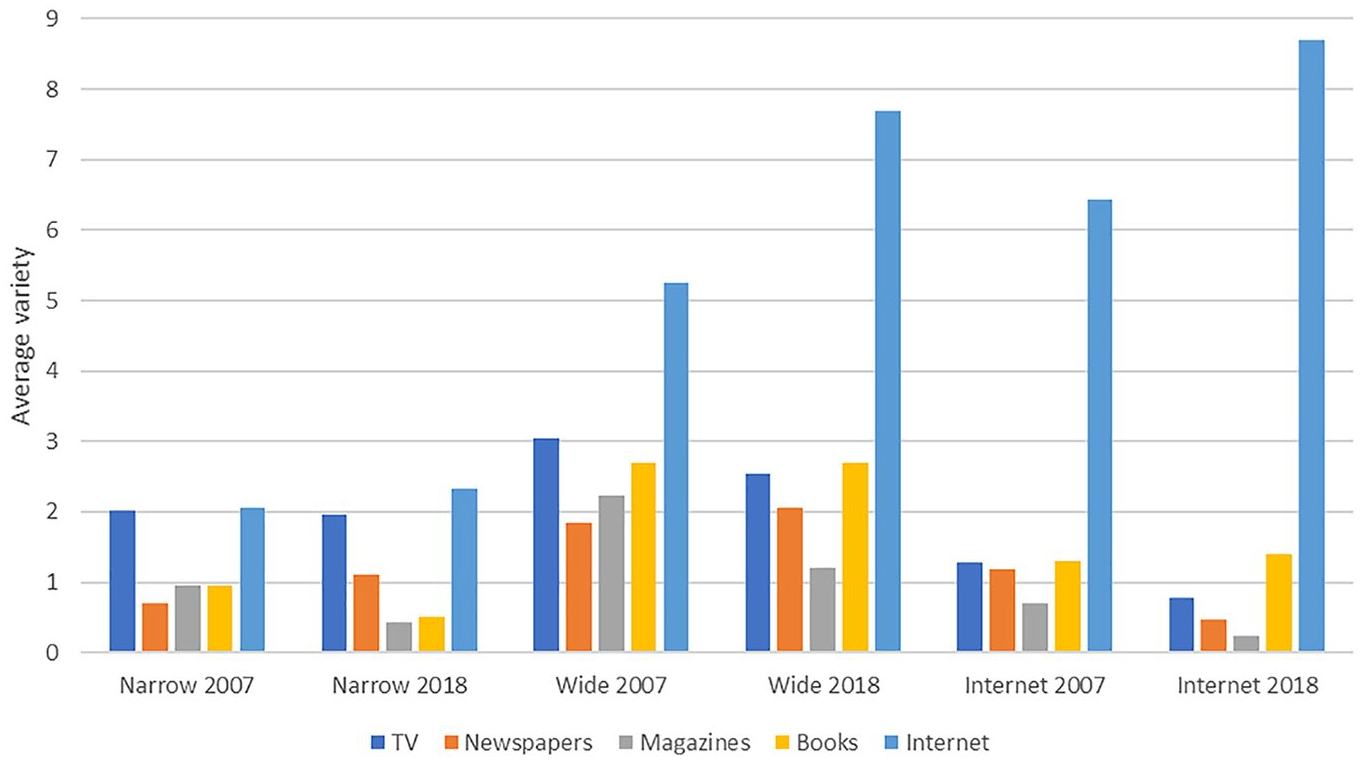
Average variety of different types of items per media repertoire variety clusters, 2007 and 2018 (weighted).
Comparing across years, we first of all detected an overall decrease of TV and magazine variety across all groups (with the difference that the narrow repertoire group did not decrease its TV variety). The variety of books read remained fairly constant, again with the exception of the “narrow repertoire” group that decreased its book variety from close to one book to less than a half. The variety of newspapers read showed a tiny increase in the narrow and wide groups but a more notable decrease in the “Internet repertoire” group. Expectedly, there was a big increase regarding Internet use, although its pace is not the same for all groups: the increase of Internet use was much slower for the “narrow repertoire” group than for the two other groups. When it came to changes inside of the groups, the “wide repertoire” group somewhat increased its newspaper, books, and Internet use variety but decreased its TV channel and magazine variety between 2007 and 2018. The “Internet repertoire” group reduced the consumption of all forms of media scrutinized here (with the slight exception of books) in favor of Internet use. Finally, the “narrow repertoire” group’s media use remained highly similar between 2007 and 2018, but there was a slight increase in newspaper and Internet variety and a slight decrease in magazines and book variety—and while both other repertoire groups decreased their TV variety, in the “narrow repertoire” group there was barely any change.
Demographic factors behind media repertoires
When the demographic composition of the clusters or repertoires is observed (Table 2), we can see that in general the differences between the different repertoires are fairly significant. In general, the “wide repertoire” group has female overrepresentation, its members have higher education and income than members of the two other groups, and it is fairly urban. The “Internet repertoire” group is more typically male, younger, and more often urban than the two other groups. The narrow group is characterized by older age and lower income than the other groups, by less urban residents, less NGO activity, and more conservative attitudes.
Media repertoire variety clusters according to sociodemographic and political variables, 2007 and 2018 (weighted).
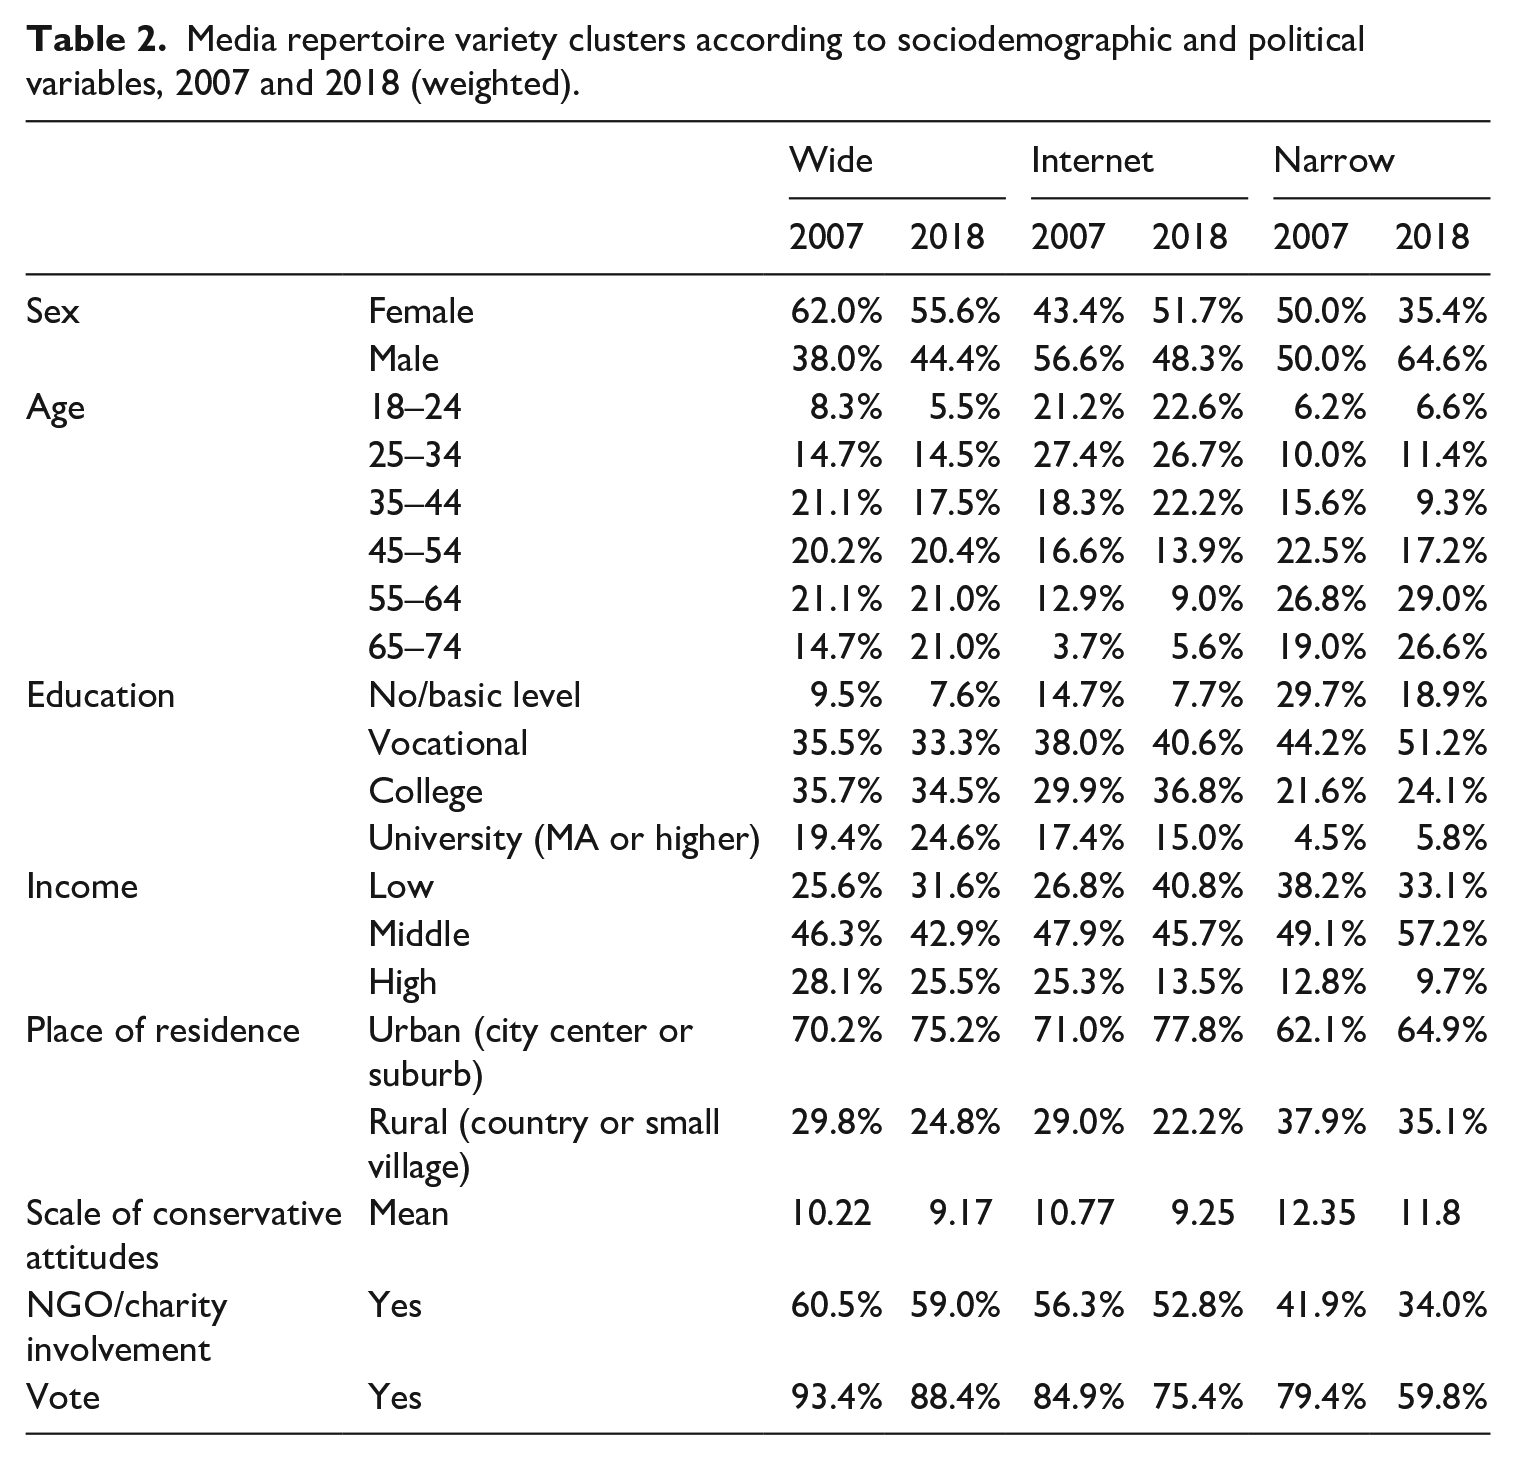
Paying closer attention to how the clusters or repertoire groups have changed between 2007 and 2018, we can see that the initially predominantly female “wide repertoire” group is closer to gender balance in 2018. Income figures are fairly similar across time, the group’s age composition has changed to include somewhat older members, and by 2018, its members are most typically part of the two oldest age groups. Regarding education, in 2018, already a quarter of all “wide repertoire” members have a university diploma, which is a clear increase from 2007. At the same time, the “wide repertoire” group is less conservative in 2018 than 10 years ago.
When it comes to the “Internet repertoire” group, we can see that its gender composition has changed from predominantly male to very close to a full gender balance. Regarding education, there is not a large difference. However, we can observe the greatest changes in terms of income. Group members in 2018 have considerably lower incomes than in 2007. In both years, the two youngest age groups are the predominant ones. Likewise, the “Internet repertoire” group, more urban than other groups already in 2007, becomes even more urban in 10 years. It also becomes somewhat less conservative.
Finally, the “narrow repertoire” group has a dramatic change in gender balance: while in 2007, it is composed of exactly the same relative amount of men and women, by 2018, the amount of women decreases to almost one-third. Regarding education and income, there are no large changes. The “narrow repertoire” group remains by far the most conservative group of the three, but there is a tiny change toward more liberal attitudes. Meanwhile, the NGO participation figure of the “narrow repertoire” group plummets from an already low 41.9% to only 34 %, thus much lower than in other groups to begin with, while other groups more or less preserve their NGO participation levels. While all groups’ voting decreases slightly, the “narrow repertoire” group experiences a radical decrease, from nearly 80% voting to only around 60%.
Media repertoires and political attitudes
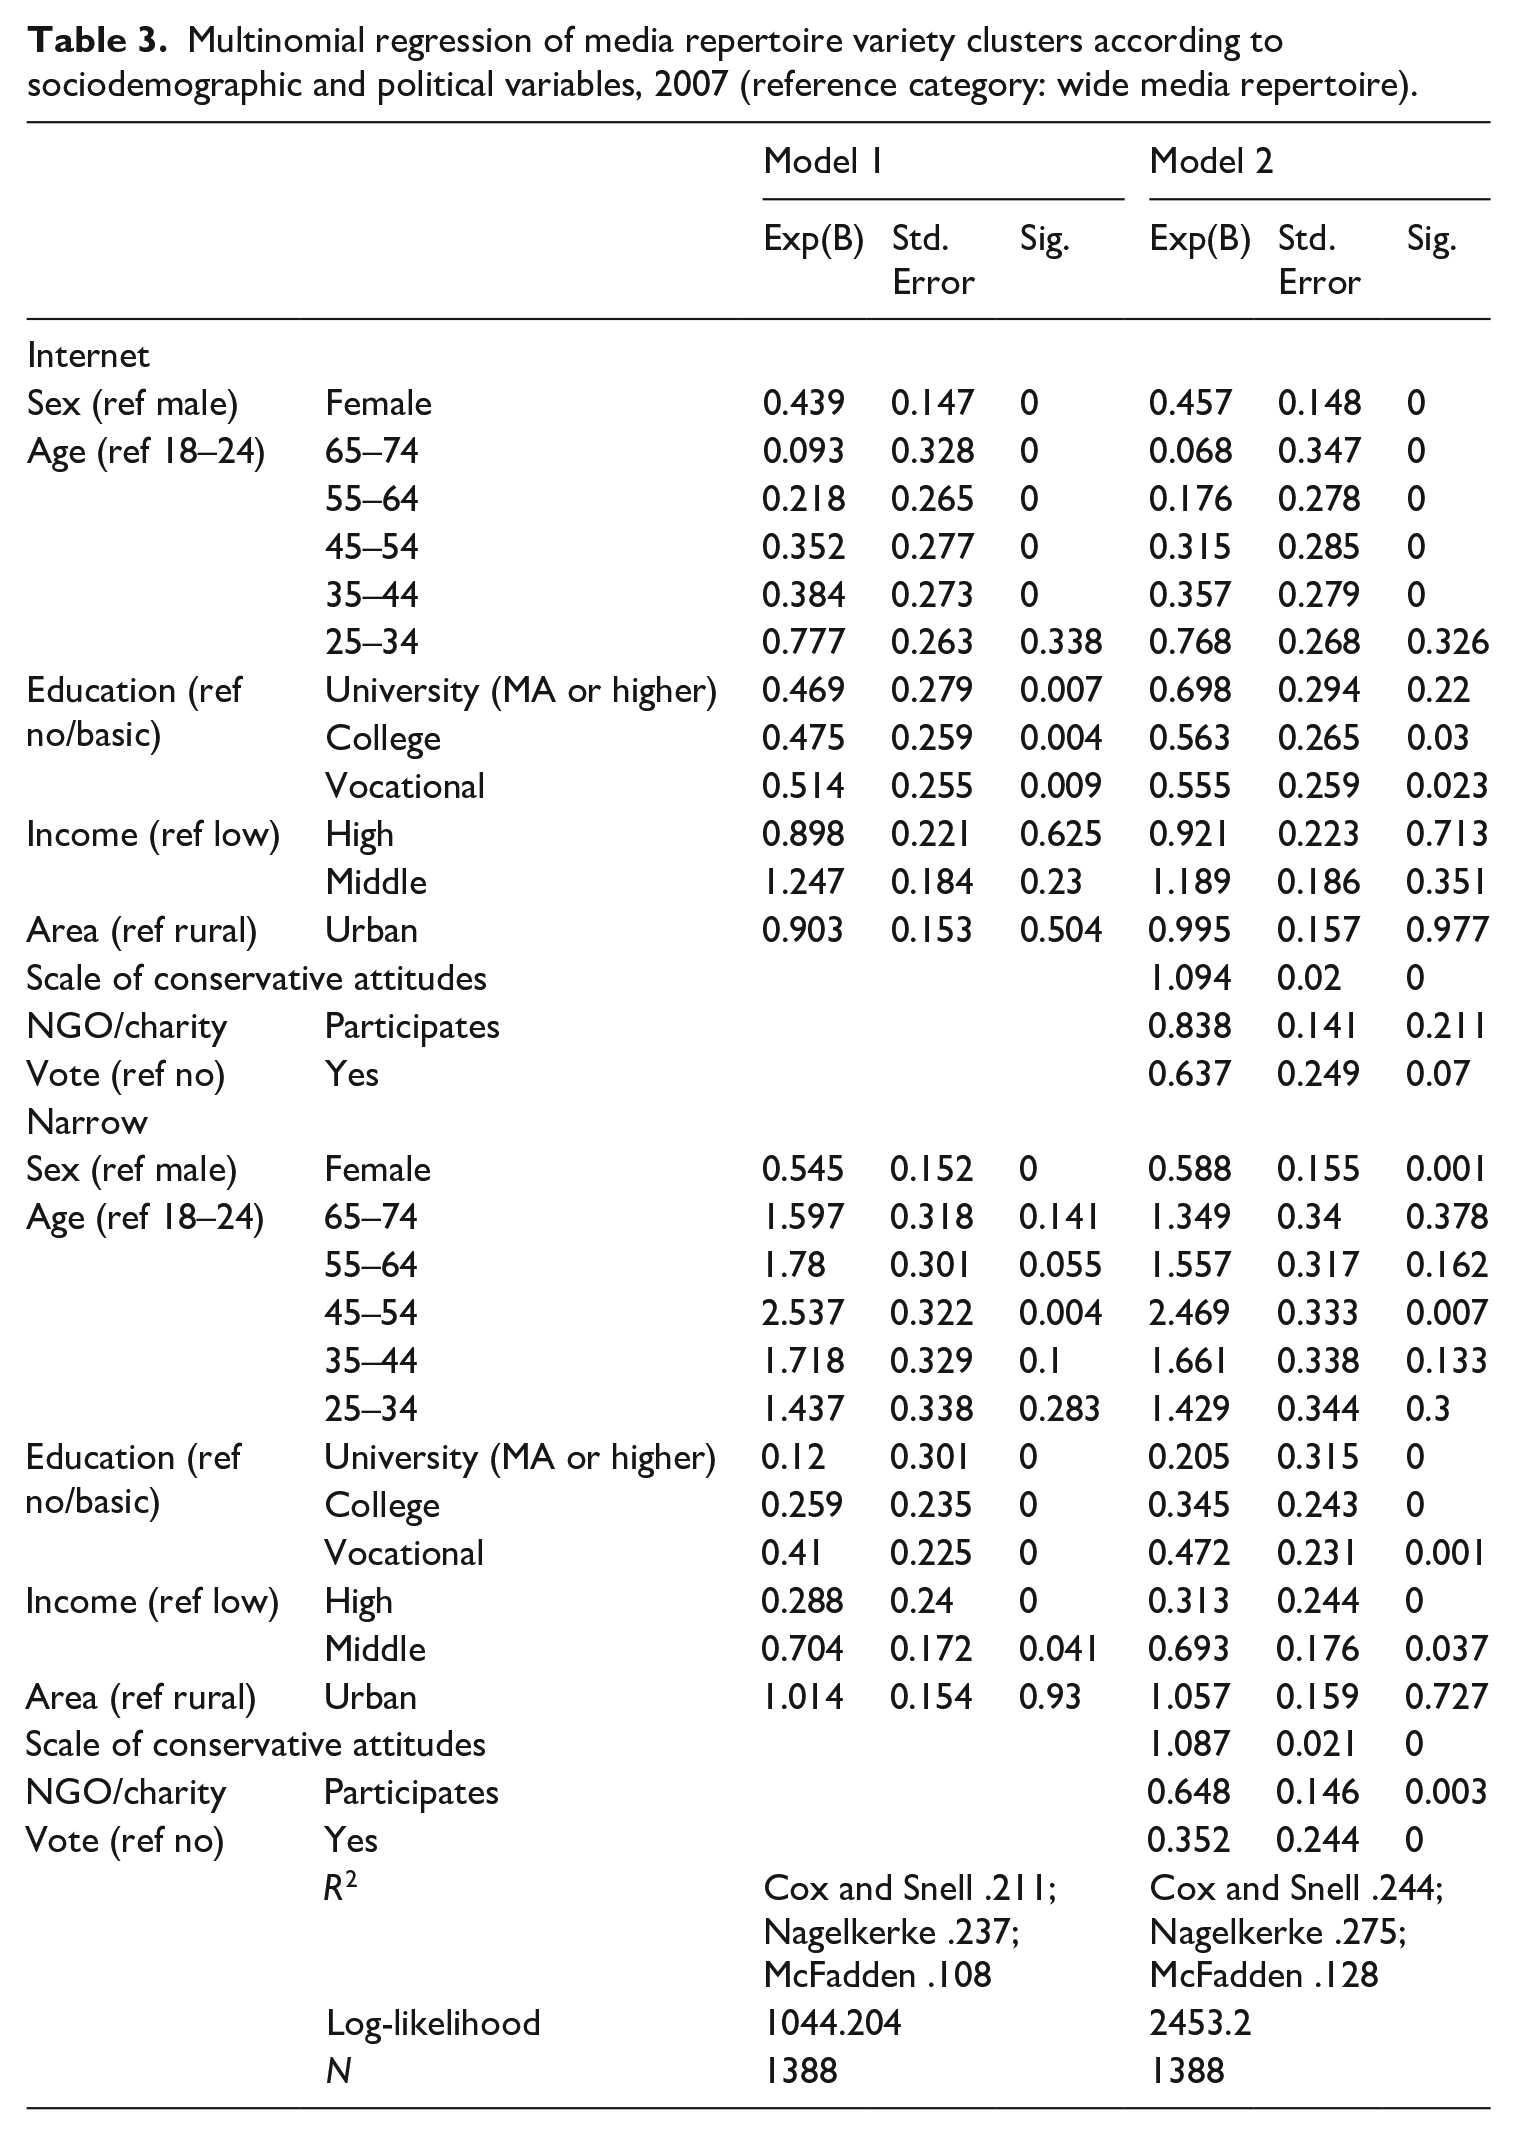
Let us now turn to the changing social composition of media repertoires and political attitudes. As noted earlier, we used logistic regression modeling. Such analysis provides the higher granularity needed to unpack the relative strength and significance of different demographic factors in shaping engagement with media and the impact of politics on media consumption groups. Estimated odds ratios, their standard errors and significance levels are shown in Tables 3 and 4, while Tables A2 and A3 in the Appendix provide their predicted probabilities.
Multinomial regression of media repertoire variety clusters according to sociodemographic and political variables, 2007 (reference category: wide media repertoire).
Multinomial regression of media repertoire variety clusters according to sociodemographic and political variables, 2018 (reference category: wide media repertoire).
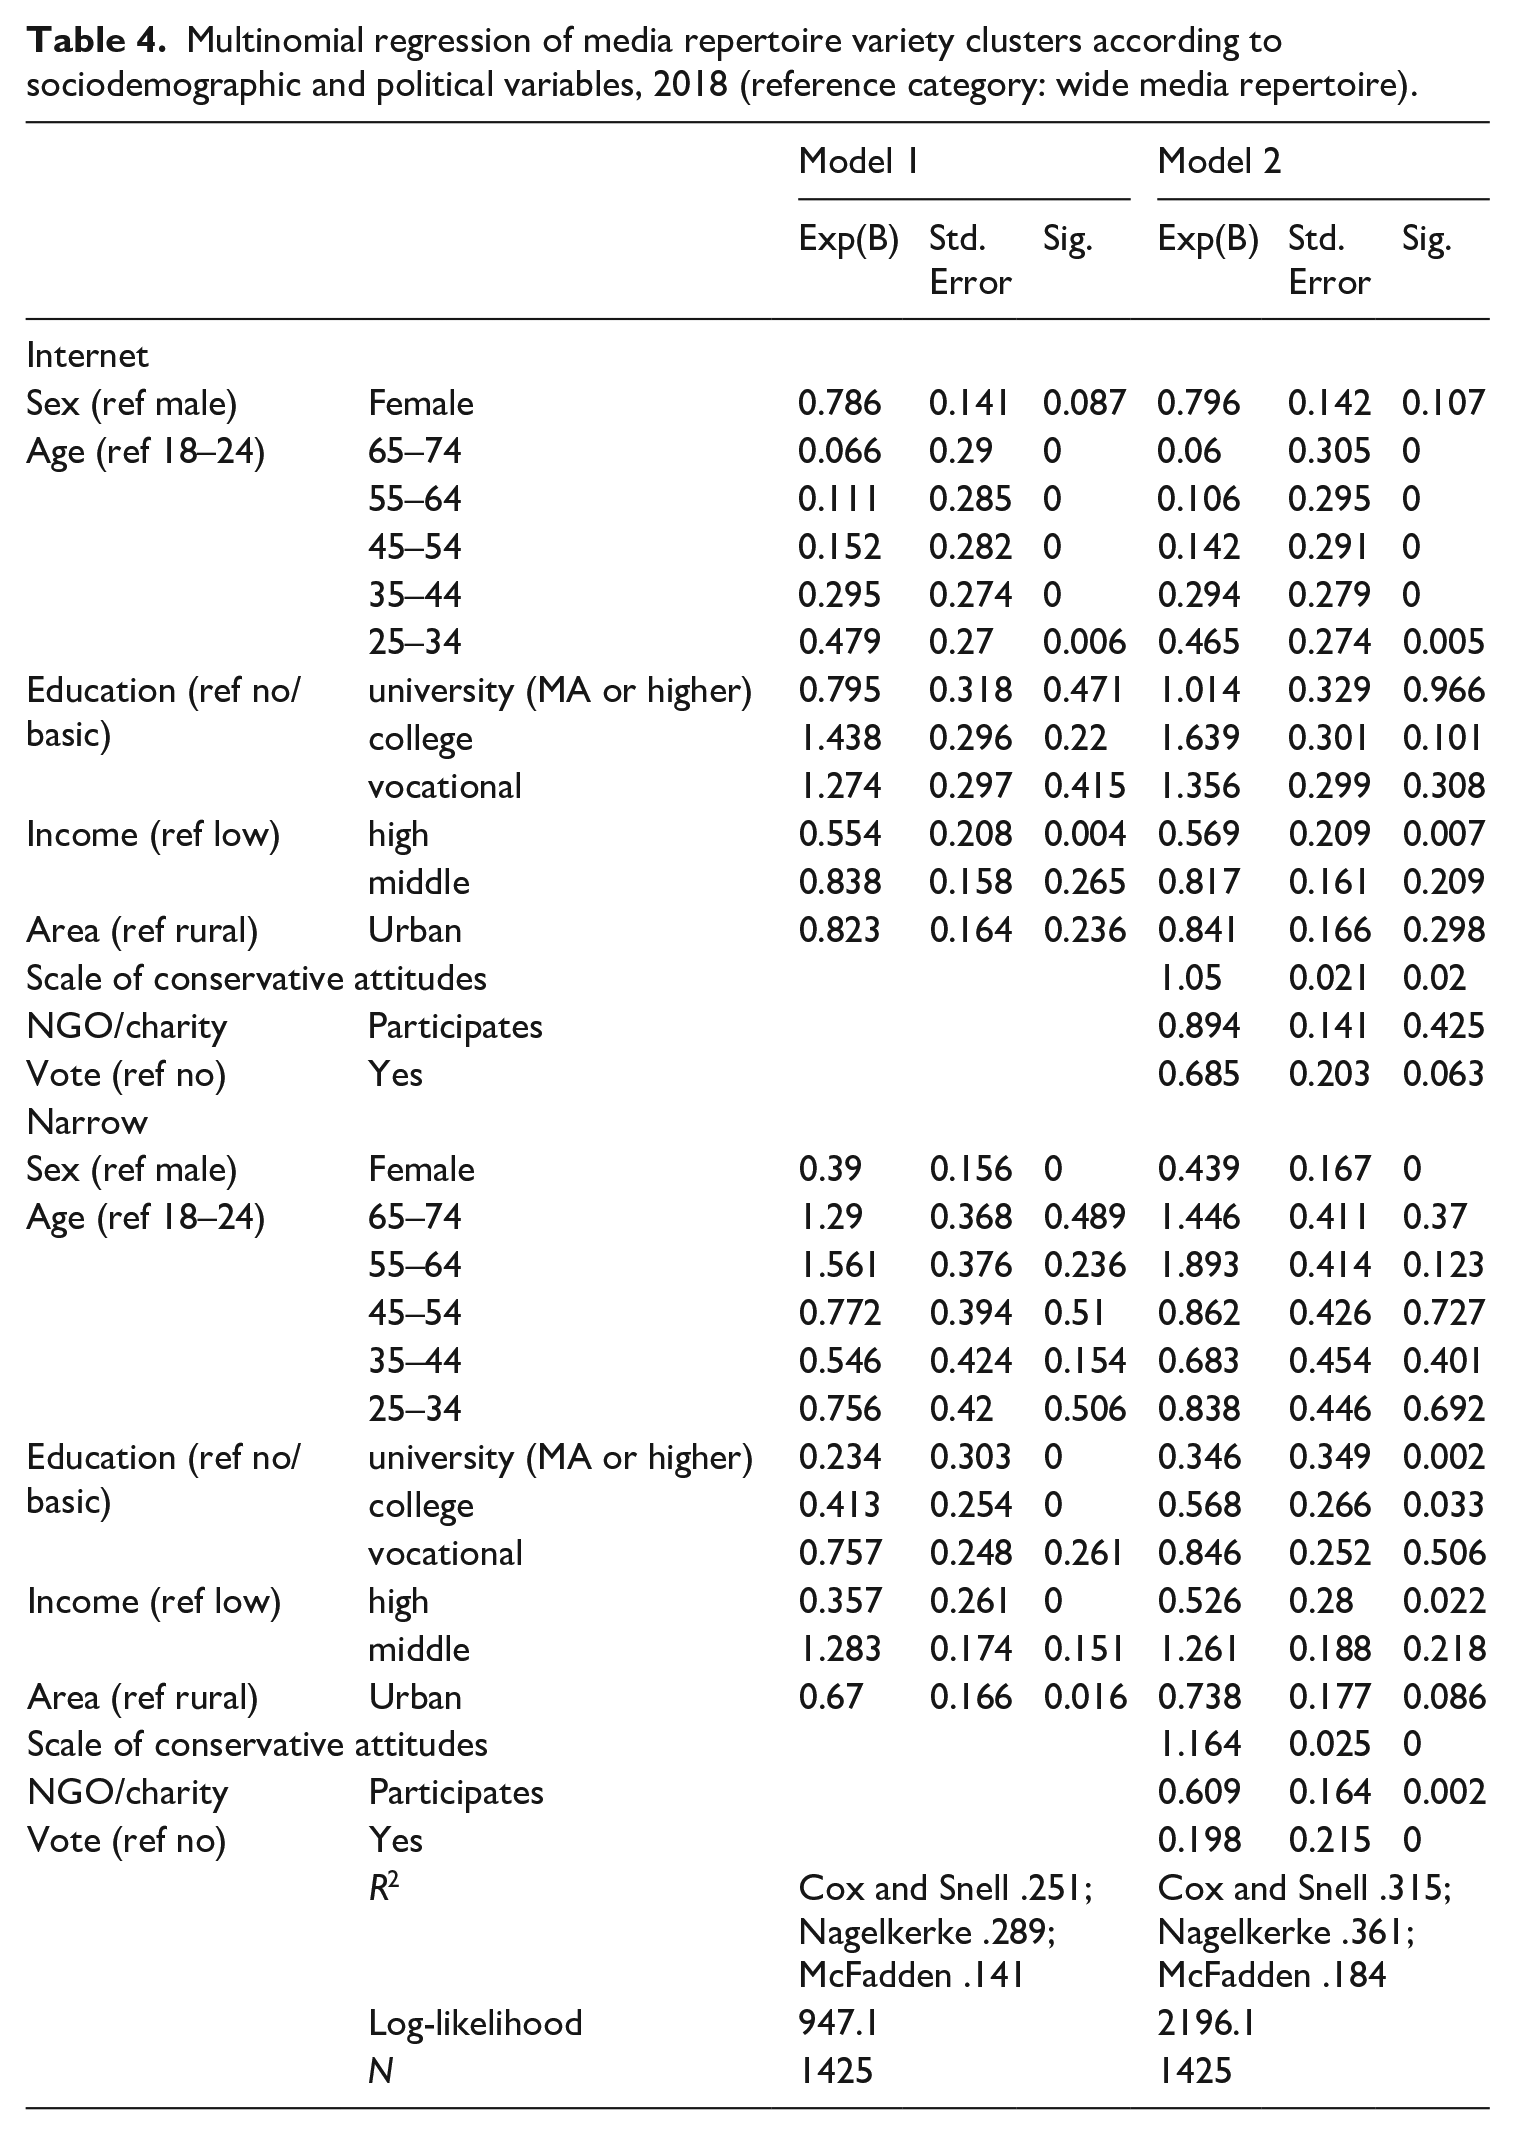
Model 1 (Tables 3 and 4) shows that all variables except for residential area have statistically significant effects. Education, age, and income are the strongest predictors of media repertoire groups. We can see that younger people are more likely to be members of the “Internet repertoire” group and older people, of the “narrow repertoire” group. Both groups are more likely to have lower education and income than the “wide repertoire” group (our reference category). Also, women are more likely to be part of the widest group. For 2018, similar broad trends remain, but the aforementioned gender difference between the wide and Internet groups disappears. In addition, in 2018, the age difference between the “wide repertoire” and “narrow repertoire” groups melts away, and the latter seems more concentrated in the countryside.
The results for models adding political attitudes are in line with previous findings. The more conservative one is, the more likely it is that one belongs to the “narrow repertoire” group or “Internet repertoire” group versus belonging to the “wide repertoire” group. Voting also makes one more likely to belong to the “wider repertoire” than to the “narrow repertoire.” Active participation in NGOs makes one a less likely member of the “narrow repertoire” group and a much more likely member of the “wide repertoire” group.
Next, we look at how political attitudes shape the probability of belonging to each of the media repertoire clusters. Figures 4 to 6 give predicted probabilities for different levels of conservative attitudes, participation in NGOs, and voting for all three media repertoire groups and for both years. In both 2007 and 2018, the general trend is that the less conservative one is, the more probable it is to belong to the “wide repertoire” group. In 2007, conservative attitudes were found to be associated fairly similarly with the “Internet repertoire” and “narrow repertoire” groups; by 2018, this has changed, and separation across groups is clearer among the more liberal.
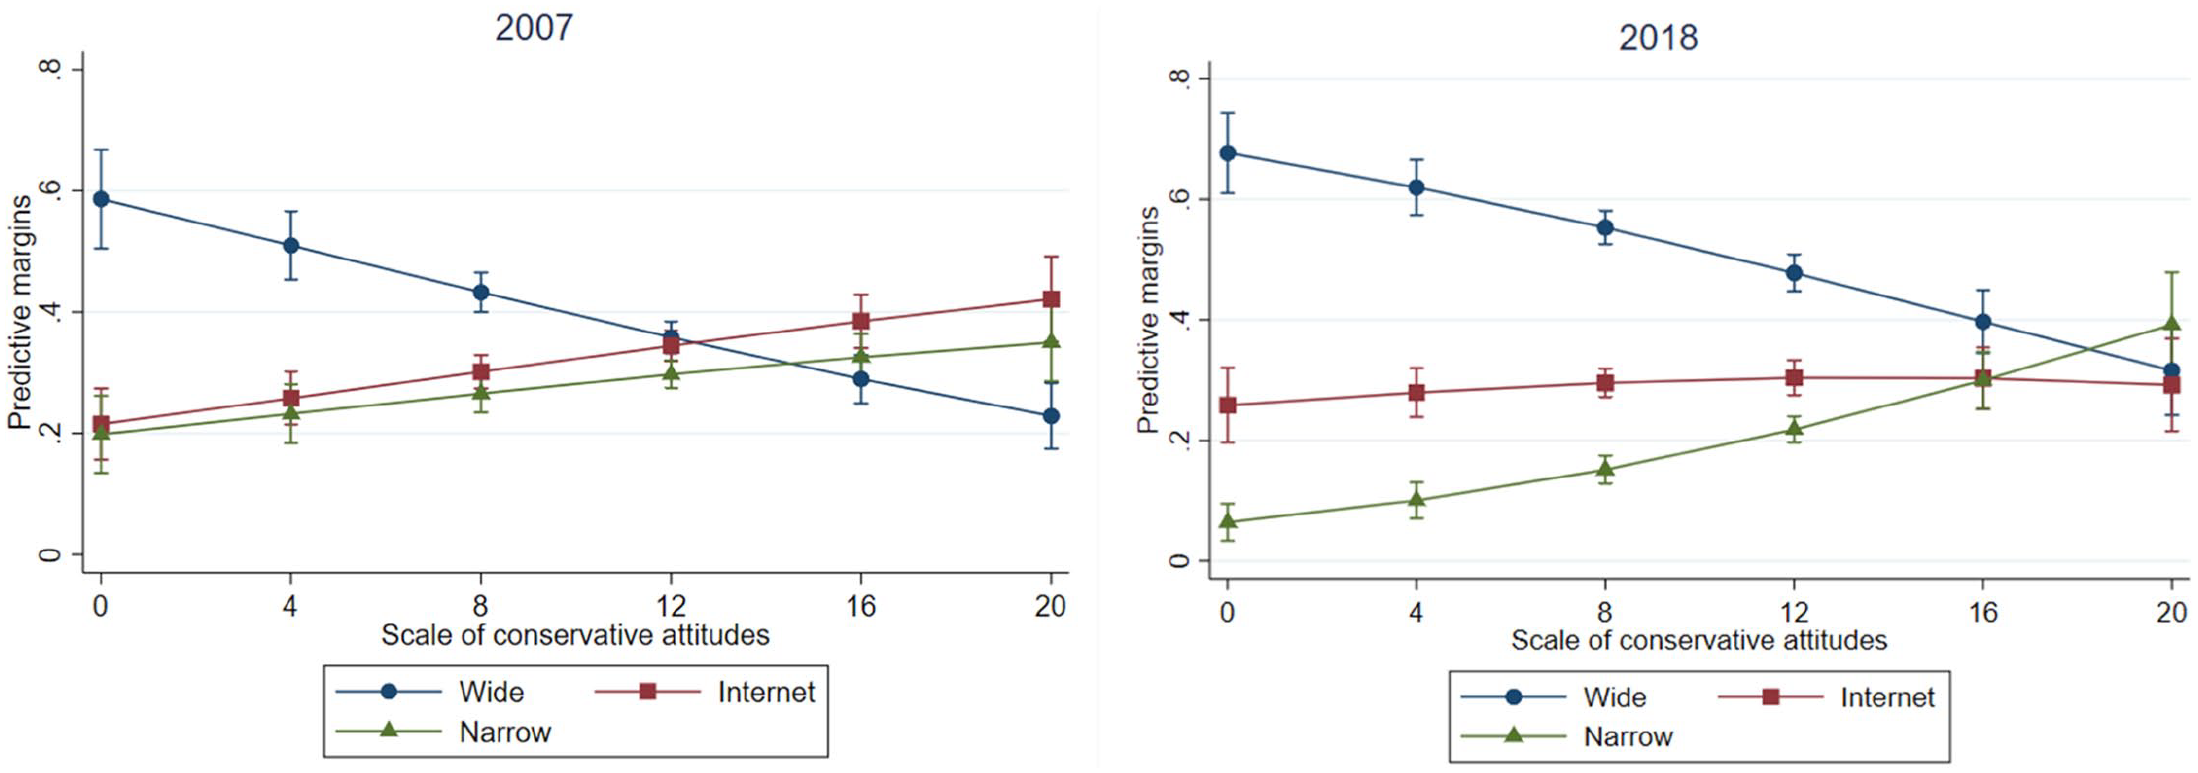
Predicted probabilities and 95% confidence interval from multinomial regression for media repertoire variety cluster; scale of conservative attitudes in 2007 and 2018.
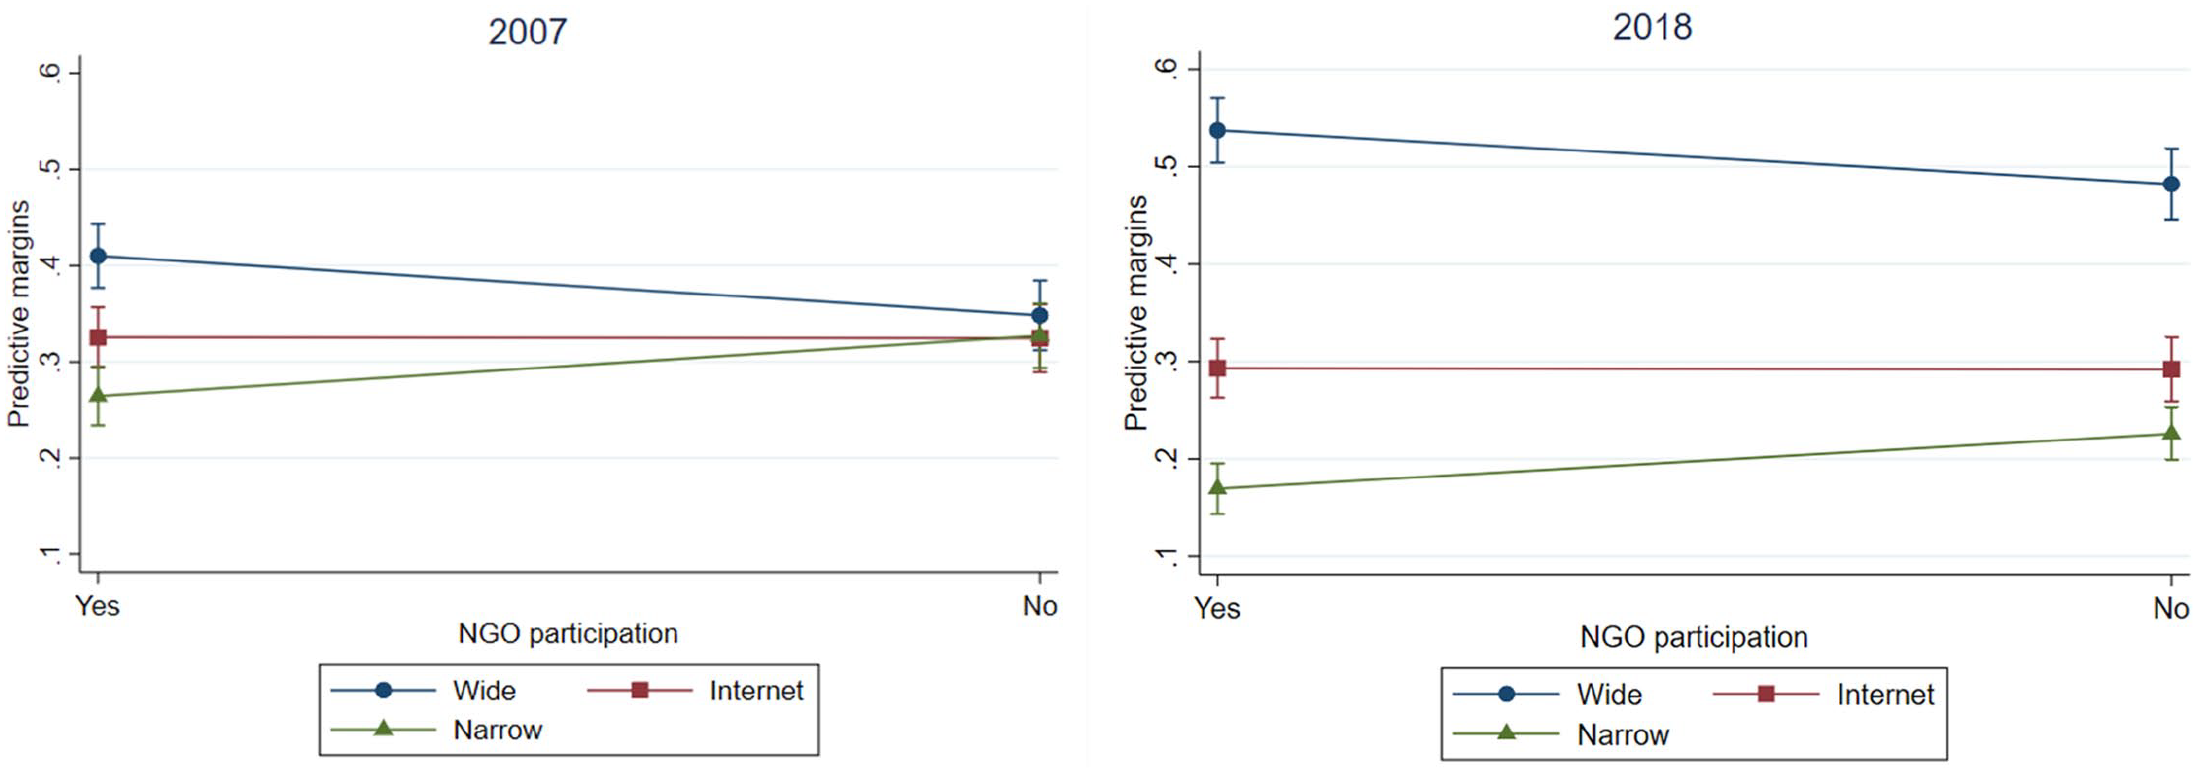
Predicted probabilities and 95% confidence interval from multinomial regression for media repertoire variety clusters and NGO participation in 2007 and 2018.
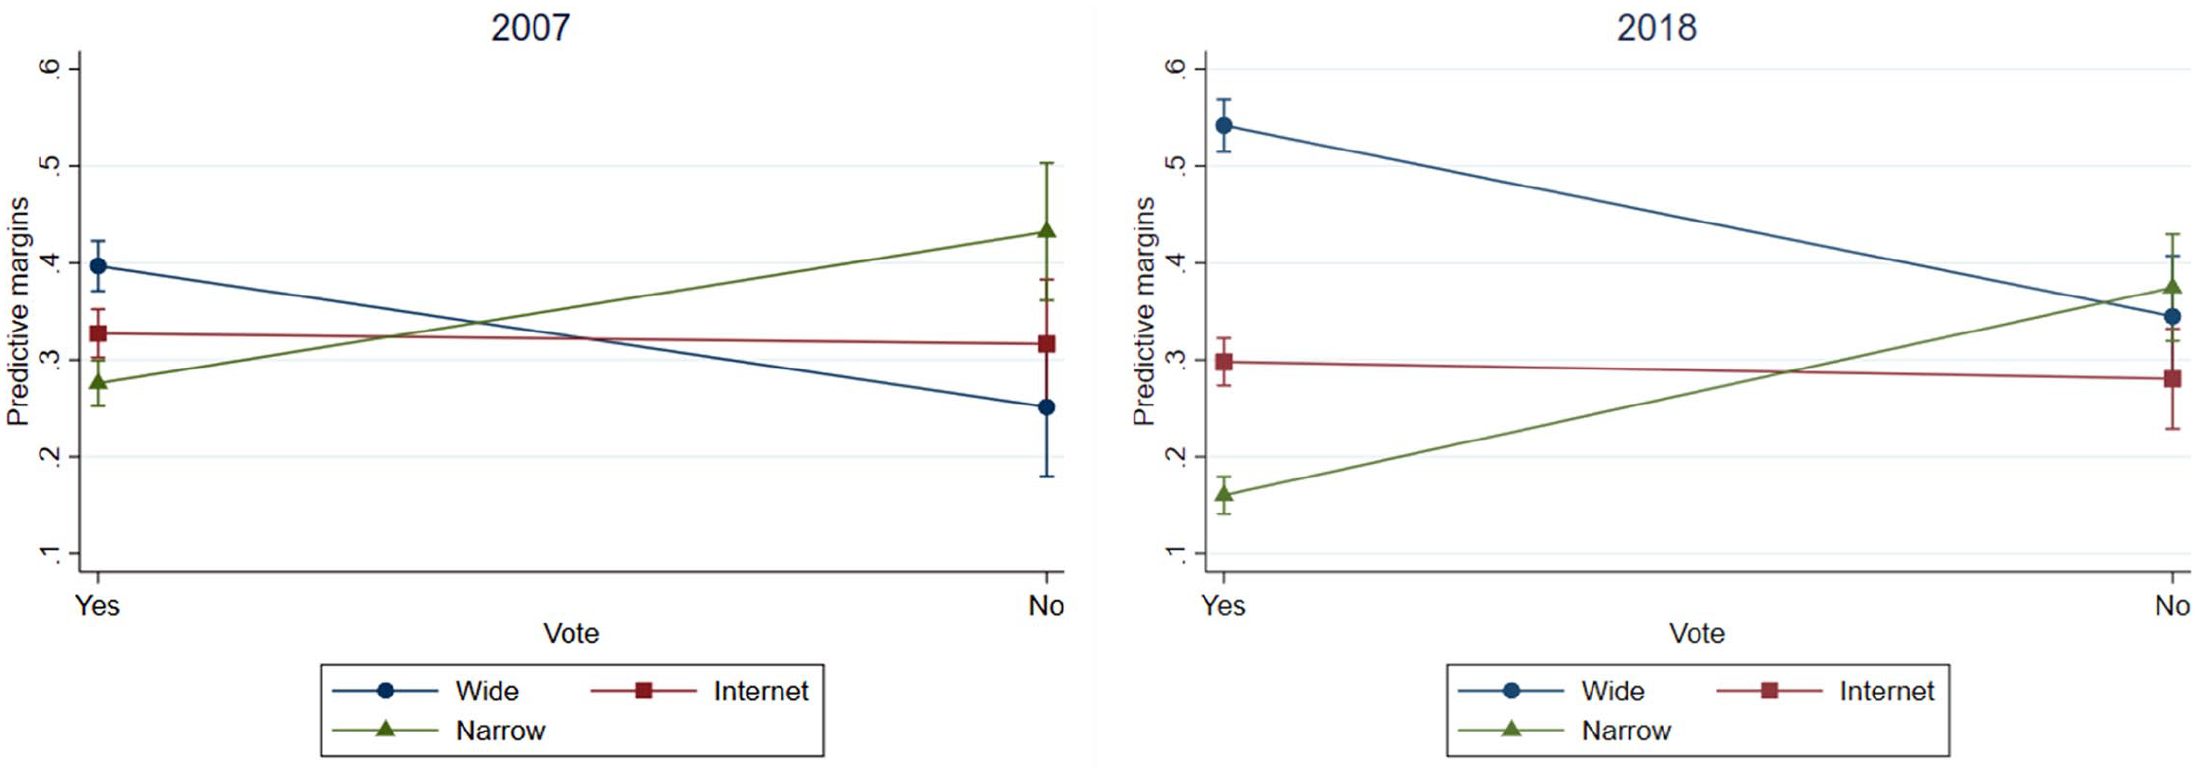
Predicted probabilities and 95% confidence interval from multinomial regression for media repertoire variety clusters, voting 2007 and 2018.
Regarding NGO participation, we find an even more dramatic differentiation between the media repertoire groups between 2007 and 2018. In general, those participating in NGOs are more likely to belong to the “wide repertoire” group in both years. This effect has been accentuated between 2007 and 2018, making NGO participants into much more likely “wide repertoire” members and more unlikely “narrow repertoire” members in 2018 than 10 years earlier.
Voting provides an even clearer picture of these changes. While in 2007, the differences in the likelihood of belonging to each one of the media repertoire groups for those voting were modest, they grew considerably in 2018, with voters being more likely associated with the “wide repertoire” and much less likely with the “narrow repertoire.”
Summary and discussion
In this article, we analyzed whether and how media use and the ways it is socio-politically stratified have changed over the last decade in Finland—have there been signs of increased polarization across media use patterns between 2007 and 2018? At the descriptive level, we saw few changes other than an increase in the variety of purposes for Internet use. Internet use, like expected, underwent a huge change: non-users of the Internet basically vanished, and the variety of different uses increased notably. Regarding political orientations between 2007 and 2018, there was a change toward less conservative attitudes and a small decrease in both NGO participation and voting.
Typologizing the users according to their media use, we found three types of users or repertoire groups that remained similar across both years studied: we named these the “wide,” “Internet,” and “narrow” repertoires. Between 2007 and 2018, the “wide repertoire” group increased in size, the “Internet repertoire” group remained the same, and the “narrow repertoire” group decreased. When it came to the sociodemographic changes determining these repertoires, we saw that the “wide repertoire” group was, in general, linked with being female, having a higher education and income than the other two groups, having the most NGO participation and the least conservative attitudes, and voting the most. By 2018, the “wide repertoire” group gained some gender balance and became older but less conservative. Quite expectedly, and in line with the famous idea of the high-status cultural omnivore (Purhonen et al., 2010; see also Peterson, 1992), the “wide repertoire” represented the most advantaged of the media user groups, characterized not only by high socioeconomic status but also by liberal attitudes and strong political engagement. The “Internet repertoire” group was mostly associated with a young age and being urban. Between 2007 and 2018, the “Internet repertoire” group, initially predominantly male, gained some gender balance and became even more urban. Finally, the “narrow repertoire” group, differentiated especially by lower education, lower income, and less urbanity than the other groups, was still in 2007 composed of half men and half women but became by 2018 predominantly linked with being male, and was also deserted by the least conservative, in other words the most liberal.
Especially, the changes in the profile of the narrow group, which became smaller in size between 2007 and 2018, suggest that there is at least some degree of socio-political polarization of media use in Finland. The “narrow repertoire” group that watches few television channels, reads increasingly fewer magazines and books, and even uses the Internet for only a limited number on purposes, unlike the other two groups, became much less interested in civic participation and became abandoned by the least conservatives. Remembering the fact that the “narrow repertoire” is also the most disadvantaged in terms of sociodemographic characteristics, it is important to notice that our analysis revealed that its political profile (being the most conservative and having the lowest political engagement) was not due to the sociodemographic characteristics (conservativeness and low political engagement being associated with low socioeconomic status) as such because the associations with politics held even after controlling for the effects of sociodemographic variables.
We could thus argue, or at least speculate, that the immanent mediatic dangers of our “post-truth” era—narrowing sources of information, sliding into “echo chambers,” or in general turning away from any kind of serious or objective media—reside in the decreasing but increasingly restricted “narrow repertoire” group. This reflects the interpretation of Prior (2013), who noted that ideologically one-sided news exposure affects a small part of the population while underlining the empirical finding that narrowing and one-sided media does not really affect the majority of media consumers. Meanwhile, it is interesting that we clearly identified this kind of “narrow” group in Finland, a “media welfare state” (Syvertsen et al., 2014). Thus, it is likely that similar socio-political polarization regarding the gap between the wide and the narrow media repertoire groups is even more pronounced in countries where the level of inequality is overall higher. The question has to do with the accumulation of disadvantages in which cultural practices (and, in this case, media consumption), social hierarchies, and political orientations overlap (see DellaPosta et al., 2015; Jarness et al., 2019; Purhonen and Heikkilä, 2017; Savage et al., 2015).
The main limitations of our study include the fact that we have only been able to scrutinize media use through variety variables and not in terms of the cultural status of the media items consumed; on the other hand, this allowed us to get closer to the debate about socio-political polarization and the worries about socially differentiated widening or narrowing visions of the world regarding media. Another important limitation was our use of symmetrical sets of media use indicators for both years, 2007 and 2018; while this solution provides stability across years, it goes without saying that different cultural items have different cultural meanings at different time points. On the one hand, new media forms and usages (e.g. the different purposes of Internet use in this article) “mature” and potentially become more mainstream as time goes by. On the other hand, in the case of some media items (e.g. reading a certain book), becoming older may either increase or decrease the group of its potential consumers (e.g. in the case of a contemporary book, increased distance from its publication may enhance readership, whereas an old classic might become forgotten). Furthermore, due to the comparative settings, we were neither able to pay sufficient attention to entirely new media forms that have rapidly emerged (e.g. social media platforms). Thus, the results of this study are indicative, at their best, of the lower boundary of changes brought on by the new media use over the last 10 or 15 years.
Finally, we have studied the variety and not the intensity of media use. This leaves us important blanks which perhaps would be especially interesting regarding the narrow media repertoire group—which lies at the heart of both polarization and rising inequality debates. An important future step for research would be to identify and understand better, both through quantitative and qualitative techniques, the logics and trajectory of the narrow media repertoire which seems to drift further from the other gradually more common media use patterns and become increasingly differentiated, both in terms of sociodemographic characteristics and narrowing political attitudes and practices.
Supplemental Material
The_Stratification_of_Media_Usage_in_Finland_APPENDIX – Supplemental material for The stratification of media usage in Finland, 2007–2018: Signs of socio-political polarization?
Supplemental material, The_Stratification_of_Media_Usage_in_Finland_APPENDIX for The stratification of media usage in Finland, 2007–2018: Signs of socio-political polarization? by Riie Heikkilä, Adrian Leguina and Semi Purhonen in New Media & Society
Footnotes
Funding
The author(s) disclosed receipt of the following financial support for the research, authorship, and/or publication of this article: The authors received funding from The Academy of Finland (grant numbers 309181 and 307756) and from the Institute of Advanced Studies at Loughborough University.
Supplemental material
Supplemental material for this article is available online.
Author biographies
References
Supplementary Material
Please find the following supplemental material available below.
For Open Access articles published under a Creative Commons License, all supplemental material carries the same license as the article it is associated with.
For non-Open Access articles published, all supplemental material carries a non-exclusive license, and permission requests for re-use of supplemental material or any part of supplemental material shall be sent directly to the copyright owner as specified in the copyright notice associated with the article.