
Abstract
This article examines converging trends in ageing, digitalisation and datafication in the context of mobility and transport. While mobility data are increasingly captured by (public) transport and mobility as a service (MaaS) providers, Internet of Things (IoT) vehicles, apps and so on, the increasing entanglement of mobility and datafication happens unevenly, for example, in relation to age. This is particularly significant in the light of the rise of data-driven policy-making, and its potential impacts on mobility provision for older people. The article highlights new questions for public policy around data gaps and social inclusion and examines them through a UK case study. The results show that old age and mobility is an area with significant gaps in the data available to policy makers. A key recommendation is for commissioning bodies to develop a strategic approach to structured data gathering and analysis that addresses issues of exclusion from smart public service infrastructure.
Keywords
Introduction
The constant increase in the median age of populations represents a global ‘mega trend’ of demographic change (Price Waterhouse Coopers, 2016). According to the UN World Population Prospects report (United Nations, 2015), the population of older people is growing globally, at an unprecedented rate. By 2050, there will be more above 65-year-olds than below 15-year-olds and the number of people over 100 will increase by 1000%.
Another line of constant increase, the use of digital ICT, has caused an exponential growth in the amount of digital data, often generated as a by-product of our mediated transactions, movement and communication, and stored in private and public sector databases. The turning of vast amounts of human activity and behaviour into data, which has been described as the ‘datafication’ of society has become a significant feature of contemporary social life (Dencik et al., 2018: 1). This includes transport, where mobility data are increasingly captured by (public) transport and mobility as a service (MaaS) providers, Internet of Things (IoT) vehicles, apps and so on. But this increasing entanglement of mobility and datafication might be happening quite unevenly for different parts of our societies, for example, in relation to age.
Today, in countries with high Internet diffusion, a growing majority of older adults use online digital media. Across the EU-28, 52% of adults aged 64–74 used the Internet at least once a week in 2018 and 42% daily (Eurostat, data explorer). Internet use among 64- to 74-year-old adults rises to 70% or over in one in three EU member states. However, there are also segments of older demographics who are not using digital media devices such as computers, tablets and smartphones. For example, of the 4.8 million UK adults who had never used the Internet in early 2017, nearly 80% were over the age of 65 (Office for National Statistics (ONS), 2017). Analysis of US data of the same year suggests that while some older groups, such as those who are younger, more affluent and more highly educated, use various technologies at rates similar to adults under the age of 65, this is not the case with the very old groups (Anderson and Perry, 2017). In the light of these trends, differences in our engagement with media technologies are not usefully explained as generationally located, that is by birth cohort (Gilleard et al., 2015: 2). At the same time, age remains a main demographic factor with regard to inequality of digital access, skills and cultures, and therefore, outcomes of digital engagement, alongside income and education (Dutton and Reisdorf, 2019).
In this hybrid – both theoretical and empirical – article, we examine these wider converging trends in ageing, digitalisation and datafication, especially in the context of mobility and transport. Our analysis of social implications of data in our ageing societies draws on our research for an intelligent community transport project (Behrendt et al., 2017). Our research questions are: How do social inclusion and data gap issues at the intersection of ageing and datafication play out for public policy, specifically in the realm of intelligent transport/mobility? How does that manifest itself in the context of a UK city (Brighton and Hove)? The case study we discuss originates in the United Kingdom but illustrates broader, international trends in the reciprocal relationship between data and digital public service infrastructures. The aims of the article are as follows: to highlight how the convergence between ageing and datafication creates new questions for public policy, to investigate emerging policy questions around data gaps and social inclusion, and to examine these questions using a case study from an intelligent transport project. The next sections of this article outline a conceptual framework by investigating current developments in data-driven government and public services, highlighting critical issues of data, visibility and power, and discussing smart transport as a data-driven public service for older citizens. Next, we introduce our method and case study, followed by the results of analysing an intelligent community transport project. The discussion considers the findings in the light of the conceptual framework, drawing out key issues on data gaps, mobility justice and social inclusion in our ageing and datafying societies.
Data-driven government and public services
In the United Kingdom, data were positioned at the centre of government and policy debate in late 2012, when the ‘Number 10 Dashboard’ was introduced by the Government Digital Service to provide performance indicators on a number of government services, real-time information on aspects of the economy, and trends from social media and expert commentary. The news headline was ‘[Prime Minister] testing app to aid government decisions’ (Lee, 2012). This dashboard marked an increasing reliance of government on data and their data infrastructures, recognising that a ‘datafied’ UK ‘opened new possibilities for everyday governance and public service delivery’. (Bartlett and Tkacz, 2017: 7). As a concept, datafication describes a transformation of social action into online quantified data for tracking and predictive analysis. According to Mayer-Schönberger and Cukier (2013) datafication is the process of ‘taking information about all things under the sun . . . and transforming it into a data format to make it quantified’ (p. 15). Reflecting on digital data as a phenomenon of complexity and a prominent characteristic of ‘deep mediatization’, Breiter and Hepp (2018: 387) understand the profound social consequences of ongoing datafication in terms of digital media being ‘not only means of communication but increasingly also of generating data’. This often happens as an (unintended) side effect of our media-related activities without awareness on behalf of data subjects. Thus, an information technology driven sense-making process is being ‘gradually normalised’ as a means to access, understand and monitor behaviour in an ecosystem of connective media, corporations, public institutions, including academic research and state apparatuses such as law enforcement (van Dijk, 2014: 198), adding a new level of social construction (Breiter and Hepp, 2018: 388).
Data considerations that have taken centre stage among UK government departments during the last decade, mirror a broader international context in public administration and, more generally, in digital bureaucratic systems (Gaeber, 2015 in Thornham and Gómez Cruz, 2018) and are supported by specialist studies and policy reports. For example, in February 2016 ‘The Big Data Dilemma’ report of the UK Parliament’s Science and Technology Committee urged the government to commit to developing data analytics skills and digital infrastructures (Bartlett and Tkacz, 2017: 10). In the same year, NESTA recommended public investment to co-locate data scientists and analysts in front-line local government teams such as social care to make better use of data within local government in order to address ‘the challenges of austerity, along with a drive towards improved efficiencies and transparency in the public sector’ (Symons, 2016: 5).
The UK Government Transformation Strategy, published in February 2017, positioned data ‘at the centre of everything’ (Tkacz, 2017) having as its main objective to ‘make better use of data [. . .] to enable transformation across government and the private sector’ (Department for Digital, Culture, Media & Sport [DCMS], 2017). This emphasis on data use has been matched by a proliferation of data systems in both central and local government for public service provision and policy development in recent years (Dencik et al., 2018: 3). Thus, datafication became central to public service transformation, through building capability to operate digital public services, increase transparency and enhance efficiency in the business of government (Cabinet Office, 2012; Tkacz, 2017), and for ‘market-changing opportunities’ from easing travel congestion to enabling cheaper insurance and helping prevent crime (DCMS, 2017). Echoing discourses surrounding ‘e-government’ in the late 1990s and early 2000s (Cabinet Office, 2000, 2005) data are bestowed a key role in achieving efficiency in public service provision as well as increasing social inclusion (Open Data Institute (ODI), 2018; The Royal Statistical Society (RSS), 2015).
The emphasis on data and measurement comes with expectations that policy making and policy (non)decisions are backed by data (Bartlett and Tkacz, 2017: 15). Data available as evidence for policy as well as the data not available have consequences in ‘issue-fying’ matters to grant them urgency (Rogers et al., 2015: 12), picking problems and listing solutions, determining which ‘well-established concerns that have obvious relevance to the user’ (Tkacz, 2017) government have to answer. In this context, digital data mark a ‘significant shift’ in governance (Dencik et al., 2018), by determining what counts as knowledge and, in that way, transforming the terms under which we come to know and reason (Couldry and Hepp, 2017). In the emerging ‘datalogical systems’ that need ‘inputted information for decision-making processes’ initial systems of data measurement have consequences for defining problems, planning solutions and for the future traction of data generated (Thornham and Gómez Cruz, 2018: 316).
Data, visibility and power
Historically, data production and accumulation have been variable and uneven (Dalton et al., 2016), shaped by technology and knowledge infrastructures (Bowker and Star, 1999; Kitchin et al., 2017; Star and Bowker, 2006). Access to technologies, such as networked media devices, and connectivity required to generate and display digital data, such as home or mobile Internet, street sensors or cameras, are also deployed unevenly. Data use and display are further shaped by ownership and licencing regimes (e.g. if data are owned by public or private organisations, if software is proprietary or open), legal and regulatory frameworks (e.g. for security and privacy) and cultural and ethical codes in ad hoc policies governing data sharing (RSS, 2015). In short, data do not exist independently of the instruments, practices and systems of knowledge used to generate, process and analyse them (Bowker, 2005; Gitelman and Jackson, 2013; Kitchin, 2014; Ribes and Jackson, 2013). The scope of data is therefore always limited, reflecting the choices and technical procedures of those that actively produce this kind of information (Breiter and Hepp, 2018: 391).
Data are generated in systems of power (Ruppert et al., 2017) and always captured from particular positions (Amin and Thrift, 2002). Data collection and assemblage are subject to decisions that include or exclude, make visible or keep out of sight. Data can then be ‘conspicuous in their absence’ (Iliadis and Russo, 2016: 1 citing Brunton and Nissenbaum, 2015). A lack of data is another indication of power asymmetries (Williams et al., 2018). Data ‘silences’ (Kitchin et al., 2017) or ‘gaps, cracks, and blind spots’ (French, 2014) may reinforce the exclusion of those without access to the data for analysis, manipulation and (re)presentation, or of those whose data do not get collected or used. Andrejevic (2014: 1673) described ‘the asymmetric relationship between those who collect, store, and mine large quantities of data, and those whom data collection targets’ as a ‘data divide’ to highlight ‘differential access to ways of thinking about and using data’.
Data exist in context, ‘taking on meaning from that context and from the perspective of the beholder’ (Borgman, 2015: 18) and have ‘potential force’ that ‘can be realized in myriad ways’ through their uptake and deployment (Ruppert et al., 2017: 2). From this perspective, the technologies and cultures of datafication, in government and beyond, and choices to register, track and deploy data, require contextual understanding. Datafication can be seen to ‘come out from, make and remake social relationships’ (Borgman, 2007: 183), thus can be more productively understood as ‘both a component and a producer’ of the institutional, technological and cultural world around them (Ribes and Jackson, 2013). These conversations continue in emerging work on data justice that considers how vulnerable individuals are increasingly marginalised within digital societies and the role data plays in this context (see for example Taylor, 2017).
Intelligent transport, digital data and later life
Mobility and transport are one key area where these considerations around data, policy and age play out. Intelligent transport is today a key area of innovation in public policy in the United Kingdom and internationally with automotive predicted to remain the highest growth sector in the IoT economy (Winchcomb et al., 2017). Following Elliott and Urry (2010) and Behrendt (2016), smart transport relies heavily on digital networks, in addition to mobile physical objects and users, and involves data collection and analysis at scale.
Intelligent transport solutions, from public transport journey updates, to smart buses and autonomous vehicles can improve access to transport services for people who are less mobile and less able to stand for long (e.g. at a bus stop), for example, due to their age. Measures to promote inclusive smart transport include journey planning information such as real-time public transport and traffic updates (e.g. www.tfl.gov.uk) and demand responsive smart technology services (Behrendt et al., 2017). In the first category, information is provided by the service provider to passengers to help plan all aspects of their prescheduled journey: route, ticket purchase, signalling the driver and navigation around the trip. Transport operators in the second category are responding to client travel requests, to accommodate mobility needs through flexible routes, for example, dial a ride and provide information.
Smart mobility is also a commercial proposition targeted at the millions of older adults who will hand their driving licenses over and are not served (well) by public transport. Major tech and data companies like Google, Uber and Lyft are promoting the idea of autonomous vehicles, also known as ‘self-driving’ cars as a solution to public service access, part of a care package in countries such as the United States (e.g. Google’s self driving cars advert, see BuzzfeedVideo, 2016). The development, deployment and acceptance of autonomous buses and public transport (Pakusch and Bossauer (2019)) and the replacement of public transport/transit with services such as Uber (Cecco, 2019) are also a part of these debates.
The role of smart public transport is bound to increase in our ageing societies. Older people are less likely to drive, and more likely to have mobility difficulties, and to depend on public and community transport provision. According to the 2017 ‘Later life in the UK Factsheet’ (AgeUK, 2017), 25% of bus journeys by people aged 65+ are for medical appointments, while 11% of adults aged 65+ find it difficult to access a corner shop, 12% to get to their doctor’s surgery and 25% to get to their local hospital, also 18% of adults aged 60–69 and 38% of adults aged 70+ have a mobility difficulty.
Docherty et al. (2018: 122) consider the forms of ‘digital discrimination’ which may arise in future mobility, and question whether there will be ‘services for areas deemed undesirable (or unprofitable) by mobility firms and service providers’ – and, as this article shows, this is not just a geographical, but also a demographic issue. Although, a majority of older adults in the UK today are using connected technologies (Ofcom, 2017; ONS, 2017), connected ICTs are not part of the daily media ‘diet’ of the people of an advanced old age (Ofcom, 2017: 4).
Transport increasingly needs data, and even more so in relation to social inclusion policy targets (see ODI, 2018). Intelligent transport can be seen to typify mediatization (Couldry and Hepp, 2013) where ICT capability becomes intrinsic to social institutions such as public transport systems, and practices, including participation in leisure and cultural activities. Emphasising the importance of data in digital public services, the UK Open Data Institute has been advocating more open transport data, securely shared journey data, and engagement with local communities to collect data at the scales needed to realise benefits in smart transport (ODI, 2018). The Bus Services Act requires UK bus operators to provide open data by 2020 (Department for Transport, 2017), and some companies are now testing ‘smart buses’(ODI, 2018). The role played by smart transport in social inclusion increases in our ageing societies. With this, the requirement for connectivity and data infrastructure foregrounds some new questions for public policy surrounding data gaps as we discuss in the remaining of this article.
The link between community transport and mobility justice is particularly interesting since ‘community-based organisations started using the term [mobility justice] first, due to dissatisfaction with existing terminology such as “transportation equity”’ (Sheller, 2018: xiii). As the role of data in the context of mobility increases, it becomes central to issues of social inclusion.
Materials and method
In this article, we take a case study and a qualitative mixed method approach. Our case study involves empirical ‘in-depth’ research ‘with a real world perspective’ of a contemporary phenomenon’ (Yin, 2018: 5, 15), while we draw on Merriam’s understanding of a case study as ‘an in-depth description and analysis of a bounded system’ (Merriam, 2009: 40). The bounding of our case study is geographical (the city of Brighton and Hove in the United Kingdom), time-related (late 2016 to early 2017), thematic (focus on data and community transport for older age), and through our research aims and questions (see above), resulting in a single case study approach (Yin, 2018: 17). The project report gives a more detailed account of the approach (Behrendt et al., 2017).
As part of this article’s case study, we use two qualitative methods. First, we conducted and analysed semi-structured expert interviews and semi-structured meeting-style focus groups with relevant stakeholders from community transport, from the city council and the clinical commission group (all Brighton and Hove). In terms of community transport, this involved a ‘Facilities and Development Manager’ from ‘Community Transport (Brighton, Hove and Area) Ltd’, a ‘Project Manager’ from ‘The Big Lemon CIC’ and a ‘Regional Manager’ from ‘The Grace Eyre Foundation’. For Brighton and Hove City Council, it included a ‘Public Health Consultant’, the ‘Public Health Programme Manager’, the ‘Commissioning Manager Adult Social Care’ and representative of the ‘Traffic Control Team’. For the ‘Brighton and Hove Clinical Commissioning Group (CCG)’, it involved the ‘Head of Engagement’. The interviews and focus groups were recorded through written notes. The deductive analysis of the material was guided by the interview schedule, which was informed by the findings of the other project work packages, desk research of literature and existing technical solutions, as well as best practice from business analysis.
Second, we identified and analysed relevant existing data sources. These were identified by project stakeholders and through desk research of online sources and academic literature. They are discussed in more detail in the ‘Results: age, mobility and data gaps’ section. The wider project also included a survey of community and public transport providers, a public-health informed social-isolation approach, a novel data model and a workshop with stakeholders and local digital/data industry (Behrendt et al., 2017). Due to the focus and scope of this article, these are not included in the analysis here. In the following section, we combine the findings from the two methods outlined earlier in an integrated analysis. Limitations of our approach include that no end-users were involved in the data collection and that only one case study is considered. Also, a key limitation of using semi-structured interviews is that the interview guide structures the conversation and thereby privileges topics selected by the researchers over other potential topics that could emerge from a completely open-ended format where participants generate the agenda.
Results: age, mobility and data gaps
The case study material presented here stems from the ‘Intelligent Transport Solutions for Social Inclusion’ (ITSSI) project (late 2016 to early 2017) that brought together a small team of transport sociologists, communications, public health and computing specialists to examine opportunities for smart community transport interventions to improve access to travel and health-care services for socially isolated individuals in the city of Brighton and Hove (Behrendt et al., 2017).
Community transport is a term used in some national contexts, such as the United Kingdom and Australia, but for this article also covers these kinds of services that are labelled differently under other countries’ conventions as the term ‘is a general term which can be applied to a very wide range of different transport services’ (ECT Charity, 2016: 8). A recent UK report explains that they ‘may operate in both rural and urban areas and they are usually developed to cover a specific transport need or meet the needs of a particular group of individual’, while they ‘are typically run by voluntary sector organisations for the local community on a non-profit basis’ (ECT Charity, 2016: 8). Community transport schemes can be defined by four main key characteristics, namely, ‘Accessible transport [. . .], Social deprivation [. . .], Geographical isolation [. . .], Community cohesion’ (ECT Charity, 2016: 8). Community transport in Brighton comprises commissioned community operators (a local company with a fleet of mini buses, commissioned by Brighton & Hove City Council and the Clinical Commissioning Group), non-commissioned community transport (a range of local community groups that run a small number of mini buses each to get end-users to activities) and buddy systems (a community group matches a ‘buddy’ with an end-user to take the end-user door-to-door on a trip) using various modes of transport. For our project’s community transport understanding, we also included a wide range of informal community transport initiatives that exist in the city of Brighton and Hove – for example, very locally arranged volunteer care schemes and informal minibus use, section 19 providers (not-for-profit passenger transport that is not available to the general public), public transport services, voluntary car schemes, taxi operators, voluntary sector providers and Brighton and Hove City Council.
Figure 1 represents the visualisation of community transport services in Brighton & Hove.
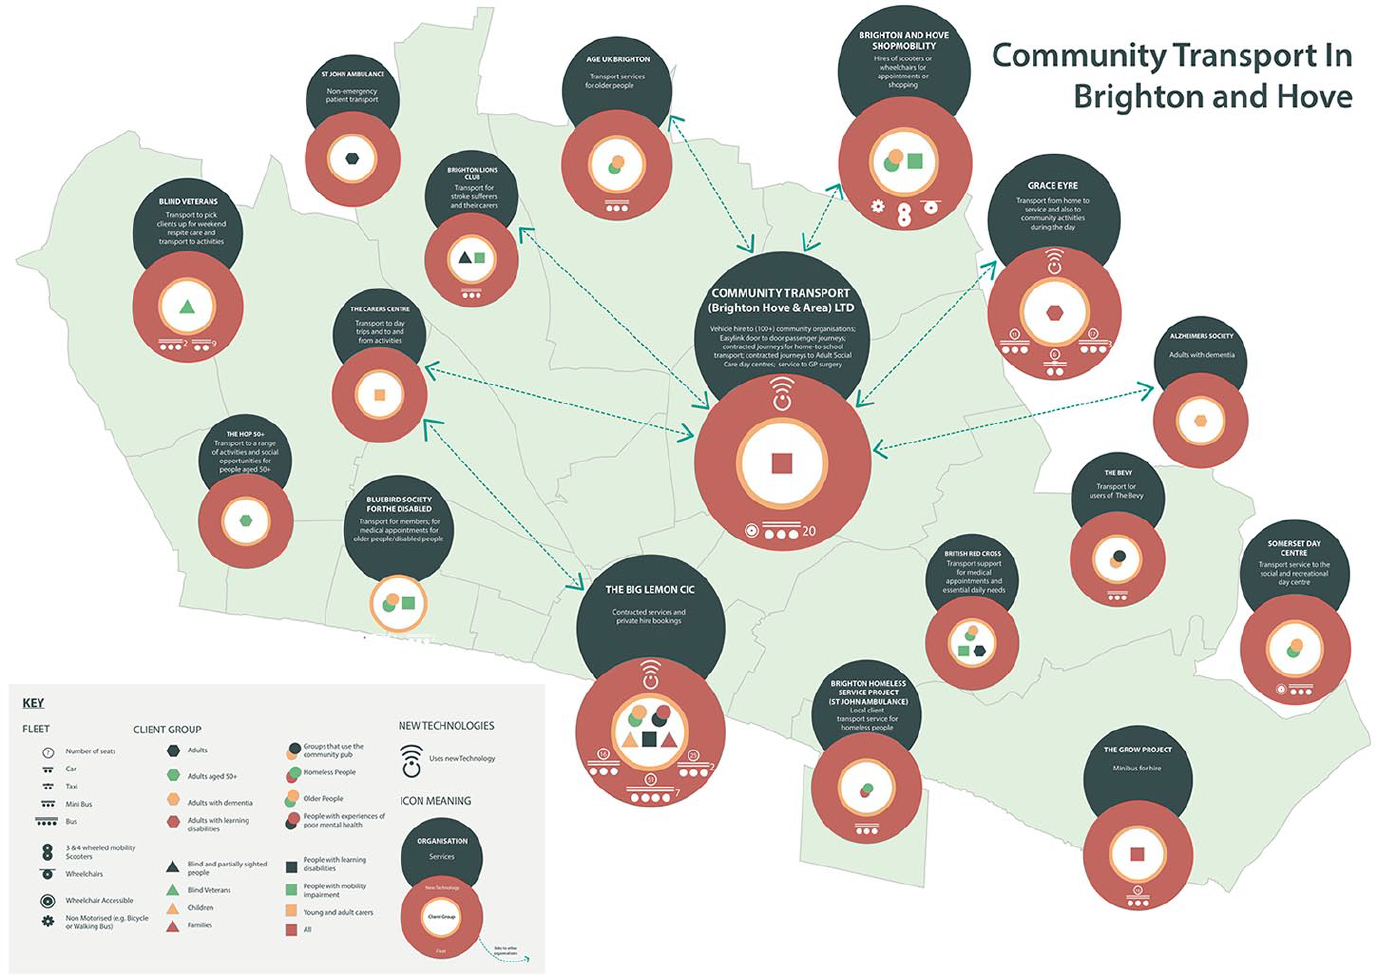
Visualisation of Community Transport Services in Brighton & Hove (that responded to the project survey); the map is a backdrop. Source: Caitlin Bowbeer.
One of the project’s research aims was to identify how use of Information and Communication Technologies (ICT) and apps can optimise the capabilities of community transport, with a particular focus on older populations. For some elements of the project, including the material presented here, we had a geographic focus on two specific areas of Brighton and Hove (the United Kingdom) that had seen the recent closing down and/or relocation of GP surgeries.
We defined ‘intelligent’ and ‘smart’ as synonyms, referring to the use of digital technologies (including data) to improve the inclusiveness of community (and to a lesser extend public) transport by improving access to information about any aspect of the journey, including destination and pickup points, booking and payment systems, timetable and so on; available for self-service use (by transport users themselves) or for proxy use (by a third person such as carer, on behalf of or with the transport user). We took a ‘rainbow’ approach to technology (Clement and Shade, 2000) understanding digital technology as comprising: carriage infrastructure, devices, software/tools, content service, service access provision, social facilitation/literacy and governance. This perspective recognises the relational character and the material, digital and human aspects of media and ICT use. We draw on the concept of media technologies to refer to choices individuals make at different moments for maintaining connection, reaching out to people and services, and information. Being aware of how (old) age thresholds vary according to industry, organisational context and culture (e.g. national statistics, public health, digital media industries datasets may define old age as 65 plus, 55 plus or 45 plus), we conceptualise both age and ICT appropriation as ‘entangled and complicated’ relations with a range of media technologies (Fernández-Ardèvol, Sawchuk, and Grenier, 2017: 40–41) rather than static phenomena of homogeneous media use defined by age (Hepp, Berg, and Roitsch, 2017). Our perspective on technology ‘use’ also recognises technologies outside their ‘original’ field: for example, technologies of transport (e.g. tracking) have a social uptake outside the field of transport – and vice versa: everyday technologies (e.g. mobile phone apps) can be used to facilitate transport and mobility (Hubers and Lyons, 2013).
In order to develop age-inclusive smart transport ideas, the research team sought to utilise open data on the digital profile of older adult residents in the case study area (in addition to other approaches, see (Behrendt et al., 2017). In terms of age-related data, we were able to identify relevant demographic data for the two specific areas of Brighton and Hove by drawing on various reports and websites, as well as on Brighton & Hove CONNECTED (http://www.bhconnected.org.uk/) and DataShine (http://datashine.org.uk/; Behrendt et al., 2017, see page 66ff.). This gave us an understanding of the age profile in the relevant areas.
In addition, we also needed data on ICT infrastructure (digital connectivity and device ownership) and, ideally also the digital skills of older residents. For an overview of ICT availability and skills, we used the open data Community Insight databases http://brighton-hove.communityinsight.org/. This tool is based on data published by more than 50 UK government agencies on access and transport, car ownership, digital services (broadband connection speed and availability), education, vulnerabilities, age, disability, family status, and so on, and is updated on a weekly basis (Community Insight, n.d.). However, Communityinsight.org did not include data on digital device ownership (mobile, pc, tablet), home broadband connection and 3G or 4G mobile connections. Also, data on education and skills did not provide the level of detail needed in terms of relating it to age.
Finally, we were interested in finding out about community transport data, especially in relation to the age of users, for not only the two target areas, but also for Brighton and Hove as a whole. These data were not included in any of the publicly available databases or datasets. Interviews that we conducted with stakeholders from community transport providers and the local authority showed that these data were not systematically collected, and where it was collected it was not made available and remained isolated and under-utilised. For example, council representatives explained that contracts by different departments of the city council are made with a range of providers, with no coordinated approach to data collection across these contracts or providers. Our research material also shows that several providers used ICT for route planning, rostering and other logistical and office tasks, but none did so to collect data about their users. A community transport provider that was reluctant to share data with the commissioning council, faced the threat of not renewing their contract, as our material shows. Overall, very little data were available, and none of it in a structured format, or as an open access. Where data were collected, it rarely included age-relevant information, and never included information about the ICT capabilities of users. We found two main reasons for this situation, one being the strong fragmentation of community transport providers that resulted in small providers with low data and ICT capabilities or skills and little or no facility to invest in either. Second, the council’s commissioning of these services had not included stipulations around data collection and sharing. The ITSSI project made recommendations on how to engage with these (and other) issues (Behrendt et al., 2017).
Overall, this meant that granular data on the digital capability of older people and their use of community transport in Brighton, and the two smaller focus areas, were not available. There were no datasets with information on the transport needs and capabilities of materially, socially and digitally isolated older citizens, and neither were there existing datasets on individual issues that could be linked together.
The situation we faced can be understood as symptomatic of a wider lack of data on digital media and technology and its use in relation to age. Information about the media lives of older people (Givskov, 2018; Hagberg, 2012; Taipale et al., 2018) is too often absent within national statistics 1 (Eurostat, n.d.; Ivan, 2017), communications and media research (Vincent, 2017), commercial surveys and qualitative panels due to bias in study design research protocols and funding schemes (Fernández-Ardèvol et al., 2019). According to an EU-wide mapping of data sources about older populations in Europe (Data Mapping Project, n.d.), datasets on ICT use comprise data that are general in nature, and do not include service- or app-specific information. Widespread assumptions that those aged over 75 are not relevant to findings and no longer technologically competent or interested in using the same technologies as younger adults, are also playing a role in more recent surveys of mobile tracking. Older consumers are frequently not included in the research sample, 2 and when they are, log data are not always being clearly defined, creating non-explicit or hidden biases (Fernández-Ardèvol et al., 2019). Our results show that the areas of mobility and transport risk perpetuating these ageisms.
Discussion: data, public policy, old age and social exclusion
This article examined new questions for contemporary societies and public policy at the intersection of ageing and datafication and emerging issues around data gaps and social inclusion, through the lens of an intelligent community transport case study. Bringing together the results and the conceptual framework, we now discuss the implications of an ageing society in relation to the ‘data shift’ in government, using the example of a major area of public service provision, namely community transport.
First, our results show that the existing national and local datasets do not provide a combination of relevant data at the required granularity to understand the interrelationship between digital capabilities/skills, age and geography that is needed for considering community transport in the age of smart mobility and intelligent transport. Second, our results demonstrate how community transport providers and the local government commissioning them do not collect or hold data in structured ways; data that could inform both the providers and the commissioner’s practices and policies in a way that is ready for a data approach to mobility and transport.
These results raise a number of public policy issues and questions. One issue concerns the skills, capabilities and resources that community transport providers have around data – and the huge gulf between these ‘traditional’ and local mobility providers and more contemporary and global providers such as Uber with their data-first approach to transport. Similarly, there is a key question around the skills and resources commissioning authorities such as the local government have around data. Combined, this leads to a lack of consideration of data in the commissioning process for community transport, and it also leads to requests for (not necessarily well-informed) ad hoc changes to these, rather than a considered and well-structured, integrated approach to collecting, analysing the data and their use in the policy context. This is a highly significant and timely issue, as UK local governments are having to increasingly cut their budgets in the current political climate, and non-statutory services such as community transport, that are hugely beneficial to social inclusion but not required by the law, are being cut and at risk of further cuts. A key recommendation is, therefore, for commissioning bodies such as the local government, to develop an integrated and strategic approach to structured data gathering and analysis around community transport that is of value to providers, users and commissioners, and also considers skills development. Despite the focus on data in UK government strategy documents (e.g. DCMS, 2017), at local level, and in the context of austerity, there are significant gaps in the data available to policy decision makers, and we have shown that older age and mobility is one of these areas.
Another policy issue is that in the contemporary context of data-driven policy making, a lack of data can often be equated to a lack of need for a service, or to a lack of value of the service. The policy recommendation is therefore to be very mindful of the need and value of those services that do not fit in with contemporary regimes and expectations of datafication. This lack of data is therefore an indication of power asymmetries (Williams et al., 2018), can be understood as data silence (Kitchin et al., 2017), and shows the role data can play in marginalising individuals and groups – an issue of data justice (Taylor, 2017).
We now draw on the conceptual framework developed earlier to discuss these results in more detail, bringing together concerns around data-driven governments; data, visibility and power; and age and intelligent transport.
The conceptual and empirical material presented in this article underlined questions about the kind of data we have in contemporary societies – and the data we do not have. At present, digital data available to use in the design of innovative solutions for public service are likely to exclude a majority of the older adults who are not all currently using online connectivity to communicate and transact. Older adults with mobility difficulties include groups that depend on public and community transport services; suffer geographical isolation and social deprivation (ECT Charity, 2016: 8) and our research shows that they are not producing a ‘data trail’ around their mobility though, for example, using smart payment systems and are more likely than other groups to be excluded from access to intelligent transport due to lack of data trails (at present).
In a broader sense, this article’s results raise questions of social inclusion in our ageing societies. As data become infrastructure for public services (Parkes et al., 2018: 4) and connection through digital systems increasingly becomes a requirement for social participation (Couldry, 2017), data – and data we lack (Williams et al., 2018) – shape opportunities for inclusion and participation in later life. In this social process, the lack of access to physical, social and digital resources experienced by those who might not have easy access to transport and communications, maps onto new, digital data infrastructures. With growing amounts of transport and mobility data being matched by an increasing reliance on data in government and in the economy, those who are less mobile or/and not producing a data trail around their mobility 3 (Behrendt, 2016, 2019) are at risk of exclusion from smart public service infrastructure.
The invisibility of older adults in data demonstrates how data gaps can be seen to reflect levels of digital and social exclusion. Older people have commonly been marginalised in technological innovation often due to lack of user involvement, poor representation of all groups of citizens, and therefore inadequacy with citizens’ real needs and expectations (Bull et al., 2017). For example, data scientists and designers might have no or little experience of older people and/or no data to draw on. Lack of data, due to any combination of uneven access to digital connectivity, unevenness in the data collection around different modes of transport, and bias on research design, and the way these often go unnoticed in cultural accounts of old age and digital media – all show in the algorithmic logic of measurement that underpins digital applications (Boyd and Crawford, 2012) and can therefore perpetuate or increase social inequality. These contribute to excluding older people from new or changing services that generate ‘datasets that can support better decision-making about transport infrastructure and operations’ (ODI, 2018).
In the light of their take-up rates, everyday smart technologies and applications such as smartphones cannot be considered as having a role as ‘agents’ in structuring emerging social divisions of age (Gilleard et al., 2015). At the same time, as our societies are ageing and mediatising, the possibility of new regimes of data collection through citizens’ data and ‘big data’ generated by social media, mobile positioning and search engines (Grommé et al., 2017) has implications for all areas of public policy. However, if unnoticed, today’s cultures of data registration and measurement will have long-lasting impact in defining problems and planning solutions (Thornham and Gómez Cruz, 2018: 316). Gaps in data infrastructures may limit the potential for practical and innovative solutions, such as smart community transport.
Digitally mediated experiences are inseparably integrated into our everydayness and experience of growing older: ‘[I]n as much as everyday life has become mediatized the experience of growing old also takes place with and through media technology’(Givskov, 2018). In times of ‘deep mediatization’ (Breiter and Hepp, 2018: 388) we, as individuals, collectivities or organisations ‘cannot not leave digital traces’ (Merzeau, 2009: 4). The current situation, where the daily activity of a majority of people over 75 years of age is not surveyed in research nor logged through smartphones and the Internet, is bound to change in the near future. In the emerging market for smart cities, smart transport, IoT, cognitive homes and life logging, data produced and shared through digital connectedness can produce new meanings of being old (Marshall and Katz, 2016). In this new mediatized context of ongoing datafication and ageing inherited and emerging data gaps gain increasing significance.
Our results illustrate the potential of digital data to increase the scope of exclusion as an unintended and indirect effect of technology (Hubers and Lyons, 2013: 225). It also shows how issues of data justice (Taylor, 2017) play out in relation to mobility and ageing, and how this is intertwined with questions of mobility justice (Sheller, 2018) in contemporary societies.
Sheller (2018) states that ‘only by actively seeking mobility justice can we protect our common futures’ (p. 171), and, as this article has shown, this is only possible by considering the role data-related practices play in this context. While other critical considerations of data-related mobilities in the policy context are often concerned with geographic exclusions (e.g. Docherty et al., 2018) or consider data invisibility for active modes of transport (Behrendt, 2019; Behrendt et al., 2017), this article contributes a demographic perspective on mobility in the context of data justice.
Footnotes
Acknowledgements
The following people made significant contributions to the ‘Intelligent Transport Solutions for Social Inclusion (ITSSI)’ research project and some of the material presented in this article draws on specific elements of their contributions: Dr Lesley Murray, Prof Jörg Huber, Andrew Hancox, Angela Hughes, Martina Gregory, Becky Farmer. ![]() is based on a survey led by Lesley Murray. The authors would also like to express their gratitude to all stakeholders from the Brighton and Hove policy, community transport and digital sector who contributed insights to the ITSSI project. The ITSSI project was funded by Brighton and Hove City Council through ‘South East Area Transport Solutions’ (S.E.A.T.S.) that in turn is funded through the Department for Transport’s UK wide ‘Total Transport Pilot Fund’. They confirm that all authors have agreed to the submission and that the article is not currently being considered for publication by any other print or electronic journal.
is based on a survey led by Lesley Murray. The authors would also like to express their gratitude to all stakeholders from the Brighton and Hove policy, community transport and digital sector who contributed insights to the ITSSI project. The ITSSI project was funded by Brighton and Hove City Council through ‘South East Area Transport Solutions’ (S.E.A.T.S.) that in turn is funded through the Department for Transport’s UK wide ‘Total Transport Pilot Fund’. They confirm that all authors have agreed to the submission and that the article is not currently being considered for publication by any other print or electronic journal.
Funding
The author(s) received no financial support for the research, authorship, and/or publication of this article.