



Abstract
Despite widespread assumptions, there is surprisingly little firm evidence on the extent of police activity among people who face, and in areas where people face, more mental health and well-being challenges in the United Kingdom. We conducted a secondary analysis of existing data from four different sources to examine the relationship between police stop-and-search practices and the prevalence of mental health issues across England. Our findings indicated an association between higher stop-and-search incidents and the prevalence of mental health issues outside London, persisting even when controlling for factors like ethnicity, age demographics, deprivation, crime rates and accessibility to local services. By contrast, within London, stop-and-search frequency correlated more with higher crime rates and ethnic diversity, whereas the prevalence of mental health issues and other socio-demographic factors showed no significant impact. This is the first national-level study to illustrate that area-level mental health, the percentage of Black individuals, and overall ethnic diversity directly influence the prevalence of stop-and-search incidents across the country.
Introduction
Evidence primarily sourced from the United States indicates that police activity is significantly more pronounced in areas, and among individuals, that are grappling with mental health and well-being challenges. Two systematic reviews on policing and mental health by Jindal and colleagues (2021) and McLeod and colleagues (2019) have highlighted the empirical link between police encounters and adverse mental health outcomes. Quantitative research supports this connection, and qualitative studies provide a deeper understanding of the experiences of those who have either directly encountered or heard about what are frequently perceived as unfair policing practices. Taken overall, the evidence indicates intensified police activity in areas with higher mental health challenges (see, e.g. Koziarski, 2021). Furthermore, it shows police focus disproportionately on individuals with mental health issues in comparison with the broader population (see, e.g. Hallet et al., 2021).
There is as yet surprisingly little United Kingdom (UK)-based evidence on the extent to which mental health challenges directly influence police activities, highlighting a significant gap in localised research that needs to be addressed to better understand and improve policing strategies in these communities. Of the 11 studies included in the McLeod and colleague review (2019), and the 29 studies included in the Jindal and colleague review (2022), no studies came from the UK. However, these reviews only included studies on ‘Black Americans’ (McLeod et al., 2019) and ‘Black youth in the US’ (Jindal et al., 2022). We are aware of only three UK-based studies on the patterning of police activity (Bendelow et al., 2019; Hallet et al., 2021; Linsley et al., 2007). In particular, although it is commonly accepted that (a) UK police have a lot of contact with people with mental health issues and (b) that police are usually not best placed to address these issues (hence, among other things, the ‘Right Care, Right Person’ (RCRP) model; Home Office, 2023), what is less clear is whether such contact arises as, largely, a consequence of other factors, or whether mental health and well-being are in and of themselves important ‘drivers’ of police activity. Are people living with mental health challenges more likely to encounter police because they live in areas with more crime and deprivation, or is the link between policing and mental health more fundamental – are police drawn to some areas rather than others because they contain more people with mental health challenges? And if this is the case, what are the implications for the ways we think about both policing and policy responses to mental health issues?
In this article we attempt to address these questions. Using data from four existing sources [police.co.uk, the 2019 Small Area Mental Health Index (SAMHI), the 2019 Index of Multiple Deprivation (IMD), and the 2021 Census], we consider the level of police activity in small local areas, and assess the extent to which the concentration of people with mental health challenges may draw or attract police to those areas. Specifically, we investigate how area-level mental health issues, along with socio-economic and demographic factors, influence the prevalence of stop-and-search incidents across England, and explore how these relationships differ within and outside London.
In line with the international literature, our results illustrate the strength of the link between policing and mental health – a link that persists independently of factors such as deprivation and crime rates. Whatever the reason, police spend much time and resources in and on areas with high concentrations of people facing mental health challenges (but are clearly not the best agency to deal with such issues). Seen from one perspective, our results align with efforts to insert or activate other, more appropriate, service providers in the contexts and contacts involved. Yet, our data on the geographical patterning of policing and mental health also support the idea that police are involved in the regulation and control of marginalised and vulnerable populations in ways that escape the issues of crime and disorder, pointing, perhaps, to the likely challenges to be faced by policies such as RCRP that attempt to attenuate or even break the link.
From here the article proceeds as follows. We discuss existing evidence on the link between policing and mental health; subsequently, we outline our research questions, describe the data and methodologies utilised, and present our findings.
Mental health and police activity
In addition to the largely US-based studies noted above, research conducted in Canada has recently indicated that police activity is more prevalent in areas where people face mental health and well-being challenges (Hallet et al., 2021; Hodgkinson and Andresen, 2019; Koziarski, 2021; Vaughan et al., 2016). Specific locations have been identified as ‘hot spots’ where police respond to mental health-related incidents. These areas include social services and public health units, hospitals, homeless shelters, motels used for short-term housing, low-income residences, public and private substance use and/or addiction services, pharmacies, walk-in clinics, alcohol points-of-sale and criminal justice services. The location of mental health facilities, such as hostels and rehabilitation centres, often in economically disadvantaged areas, then, can significantly impact the nature and frequency of police calls and reported incidents.
Existing research therefore indicates a potential link between locations frequented by individuals facing mental health challenges and the clustering of police activity (operationalised as mental health-related calls for police service). However, these associations have thus far been drawn from visualisations of these locations using kernel density estimation results (Vaughan et al., 2016) or relied on the authors’ familiarity with the study jurisdiction (Hodgkinson and Andresen, 2019; Koziarski, 2021). There is, therefore, unsurprisingly, an element of circularity – areas likely to ‘attract’ people with mental health issues attract more mental health-related calls for service; and as Koziarski (2021) aptly concludes, it is imperative for future research to not only explore the relationship between place and concentrations of mental health-related police activity, but also employ more robust and rigorous methodologies for this investigation.
Considering the wider international picture, data reveal that the frequency of interactions between individuals with mental health issues and the police can be very high. This includes arrests, police involvement in pathways to mental health care, and a wider set of police dispatches and encounters. For example, Livingston's (2016) comprehensive analysis of 85 studies found that one in four people with mental disorders had a history of police arrest. In addition, 1 in 10 individuals had police involved in their pathway to mental health care in some way, and approximately 1 in 100 police dispatches and encounters involved people with mental disorders. Koziarski and colleague's (2022) research also highlighted the involvement of people with mental illness in calls for police service. Although ‘mental health’ call classifications represented only 0.9% of calls, a similar figure to that reported by Livingston (2016), people with mental illness were involved in a substantial 10.8% of these calls. Similarly, in Hodgkinson and Andresen's (2019) analysis of hot spots of police calls for service in a Canadian city, ‘total mental health-related’, a subcategory of known mental health calls, attempted suicide, disturbance and drunkenness, ranked as third most common (14% of all calls for service).
It is important to acknowledge that the term ‘mental health problem’ encompasses a diverse array of conditions and diagnoses, each presenting unique characteristics and implications. Notably, certain mental health issues, such as paranoid schizophrenia and substance misuse, are more commonly linked with antisocial behaviours and specific criminal activities; and therefore, police calls for service often involve specific mental health issues (Ghiasi et al., 2023). For instance, individuals struggling with substance misuse are frequently involved in burglary and theft, whereas those experiencing symptoms of paranoid schizophrenia might be more prone to engage in violent acts (Fazel et al., 2009).
Studies also highlight disproportionality in the extent of interaction between police engagement with individuals with mental health challenges compared with those without such conditions. This disproportionality is evident in various aspects, including police contact (Dean et al., 2021), arrests and charges (Crocker et al., 2009), the use of force (Kesic et al., 2013; Morabito et al., 2017) and Taser usage (Hallet et al., 2021; O'Brien et al., 2011). Dean and colleagues’ (2021) study found that children who were identified by their teachers as having emotional or behavioural problems at school entry had a significantly higher incidence rate of police contact for any reason. Crocker and colleagues (2009) found that persons with mental illness were more likely than those without mental illness to be in contact with police as suspected offenders, to have a greater number of offences, to reoffend more quickly and to be formally charged for a suspected offence. Kesic and colleagues’ (2013) study found that the police were more likely to use or threaten to use weapons, like pepper spray, on people who seemed to have mental health issues; and Hallet's et al. (2021) research highlighted the relatively common use of Tasers in mental health crises, with individuals experiencing mental distress subjected to a higher prevalence of Taser usage than the general population.
The evidence therefore suggests that police activity is likely to be notably higher in areas and among individuals facing mental health and well-being challenges. What is perhaps less clear is why this is the case. One important factor may be the extent to which mental health correlates, or clusters, with poverty and deprivation (Marmot, 2005) and therefore with crime (Ministry of Housing, Communities & Local Government, 2019). The causality underlying this relationship is likely to be complex – does poor mental health cause poverty, or does poverty cause poor mental health, or are they mutually constituted (Payne, 2012) – although recent studies suggest moves into poverty can indeed have mental health consequences (Thomson et al., 2023; Wickham et al., 2017). Whichever is the case, however, if people with mental health problems are more likely to live in areas with higher levels of deprivation and crime, this may make them more exposed to police and therefore more likely to have contact with officers because police are more active in those types of areas (Bradford, 2017; Suss and Oliveira, 2023). It may also be the case that other services providers are more stretched in more deprived areas, leaving the police, the ‘service of last resort’, with the task of dealing with a wide range of issues that include mental health. The link between mental health and policing may thus be partly or fully explained by deprivation, crime and associated variables such as accessibility to local services.
There may, however, be other explanations for the high level of police contact among people experiencing mental health challenges. First, levels of need may be higher among this population, which experiences elevated levels of victimisation, and may be more likely to engage in activities that require some sort of institutional response (Bhavsar et al., 2019; Dean et al., 2018; Kamperman et al., 2014; Khalifeh et al., 2015; Latalova et al., 2014; Maniglio, 2009). Police are clearly the agency tasked with addressing the former, and in an era marked by significant ‘de-funding’ of other service providers often find themselves dealing with the latter, even if no crime or potential crime is involved. Here, the link between policing and mental health stems, at least in part, directly from the needs and behaviours of people with mental health problems.
Second, the extent to which police attention is focused on marginalised and excluded populations independent of crime, deprivation and other relevant variables is well established. This facet of the ‘distribution’ of policing is most commonly identified in relation to race and ethnicity. US-based research regularly concludes that the ethnic or racial makeup of an area attracts police attention independently of crime and other variables (Feldman et al., 2019; Roh & Robinson, 2009). UK-based studies are increasingly reaching similar conclusions. For example, Vomfell and Stewart (2021) concluded that minority communities in their study area were ‘over-patrolled’, whereas Suss and Oliveira (2023) found that stop-and-search rates in London were higher in areas with larger non-white populations, even after controlling for crime, deprivation and inequality. Yet, race/ethnicity may not be the only marker of marginality implicated in such processes. Bradford and Loader (2016), for example, found that controlling for a wide range of socio-demographic and behavioural variables, individuals reporting poor health were more likely to have been stopped and searched by police. Young people from working class communities are generally more likely to be the targets of police attention, in ways that cannot be reduced to questions of place, poverty and crime (Bradford, 2017); and class, in turn, may intersect and interact with race and ethnicity to produce a further heightened level of police attention (Soss and Weaver, 2017). On these accounts, part of the explanation for patterns of policing across different areas and social groups relates not to levels of crime, offending and victimisation, but to the effort to monitor, control and discipline groups seen as unruly, threatening and/or ‘disturbers of the peace’ (Neocleous, 2000; Vitale, 2017).
The two accounts above offer starkly contradictory versions of the aetiology of police activity. Yet both suggest that the focus of police on marginalised groups in general, and people with poor mental health in particular, is not a by-product of other processes but a fundamental feature of policing, which both provides an institutional response to people in need and the control of marginalised and excluded populations. Both, in other words, indicate a link between policing and mental health that cannot be ‘explained away’ by deprivation, crime or, indeed, the failure of other services.
Although existing data do not enable us to test these two alternative explanations, fully we can assess whether factors like deprivation, crime rates and access to local services might partly or fully account for the link between mental health and policing. If these factors do not explain the relationship, it would suggest that exploring these alternative explanations could be worthwhile. Specifically, in this article, we use data from four different sources to answer the following questions:
Is police activity associated with the prevalence of mental health issues in small geographical areas in England? Does any association between prevalence of mental health issues and police activity persist even when salient neighbourhood characteristics (crime, ethnic and racial composition, deprivation, age, accessibility to local services, and population density) are taken into account?
The exploration of the extent and nature of the association(s) between police activity and the prevalence of mental health and well-being challenges among certain individuals and in specific areas is important for several reasons. First, understanding whether police activity is higher in areas and among individuals facing mental health and well-being challenges is essential to addressing issues of equity and social justice. For example, if certain groups – here, communities with higher mental health needs – are more exposed to policing in ways that cannot be explained by, most obviously, crime, this raises questions about the fairness and equity of the distribution of police activity.
Second, identifying areas with a higher prevalence of mental health challenges and increased police activity can inform proactive measures to prevent adverse outcomes. It enables the development of targeted interventions and support systems to address both mental health needs and potential interactions with the police. Indeed, emerging research has demonstrated the likely negative consequences of police contact. There is evidence that individuals who have prior interactions with the police experience a nearly doubled prevalence of adverse mental health conditions compared with those without such exposure (McLeod et al., 2019). Policing practices have been linked to a wide range of individual mental health outcomes, and these effects remain significant after controlling for an array of demographic characteristics (e.g. gender, age, socio-economic status). For example, studies have found that exposure to policing is associated with higher rates of depression, anxiety and stress as well as increased evidence of PTSD and other psychotic disorders and suicidal ideation and attempts (Jindal et al., 2022; McLeod et al., 2019). This police exposure includes both direct police exposure – various aspects of interactions with police, including encounters, stops, and arrests, and indirect police exposure, including witnessing or hearing about policing, typically measured using self-reported measures.
Data and methods
This study utilises data from four different sources (police.co.uk, SAMHI, IMD and the 2021 Census). Area-level measures of police activity (stop and search), mental health and neighbourhood characteristics (crime rate, ethnic and racial composition, deprivation, age, accessibility to local services and population density) were linked by Lower layer Super Output Area (LSOA). LSOAs are a Census-based area classification designed to be similar in terms of population size. There are 32,844 in England, with an average of ∼1,500 people and 650 households.
Dependent variable: Police activity
The first source of data was the stop-and-search data stored at police.uk, which we used to generate the count of stop and search within LSOAs over the past 3 years (September 2020 to August 2023). We treat this primarily as an indicator of assertive police practice. However, because stop and search is closely associated with police use of force (TASERD, 2023) – the most common form of which is (compliant and non-compliant) handcuffing – it can also be considered a proxy for overall levels of police activity in a given LSOA. Where stop and search is high, it is reasonable to assume that other forms of police activity will also be high
We do not adjust for population, i.e. use a rate per 1,000 population, because calculating stop-and-search rates in this way (versus total count of stop-and-search incidents) is arguably redundant given that LSOAs are designed to be similar in terms of population size. The distribution of the number of stop-and-search incidents across LSOAs is presented in Figure 1. Descriptive statistics for this and the measures described below are shown in Table 1.
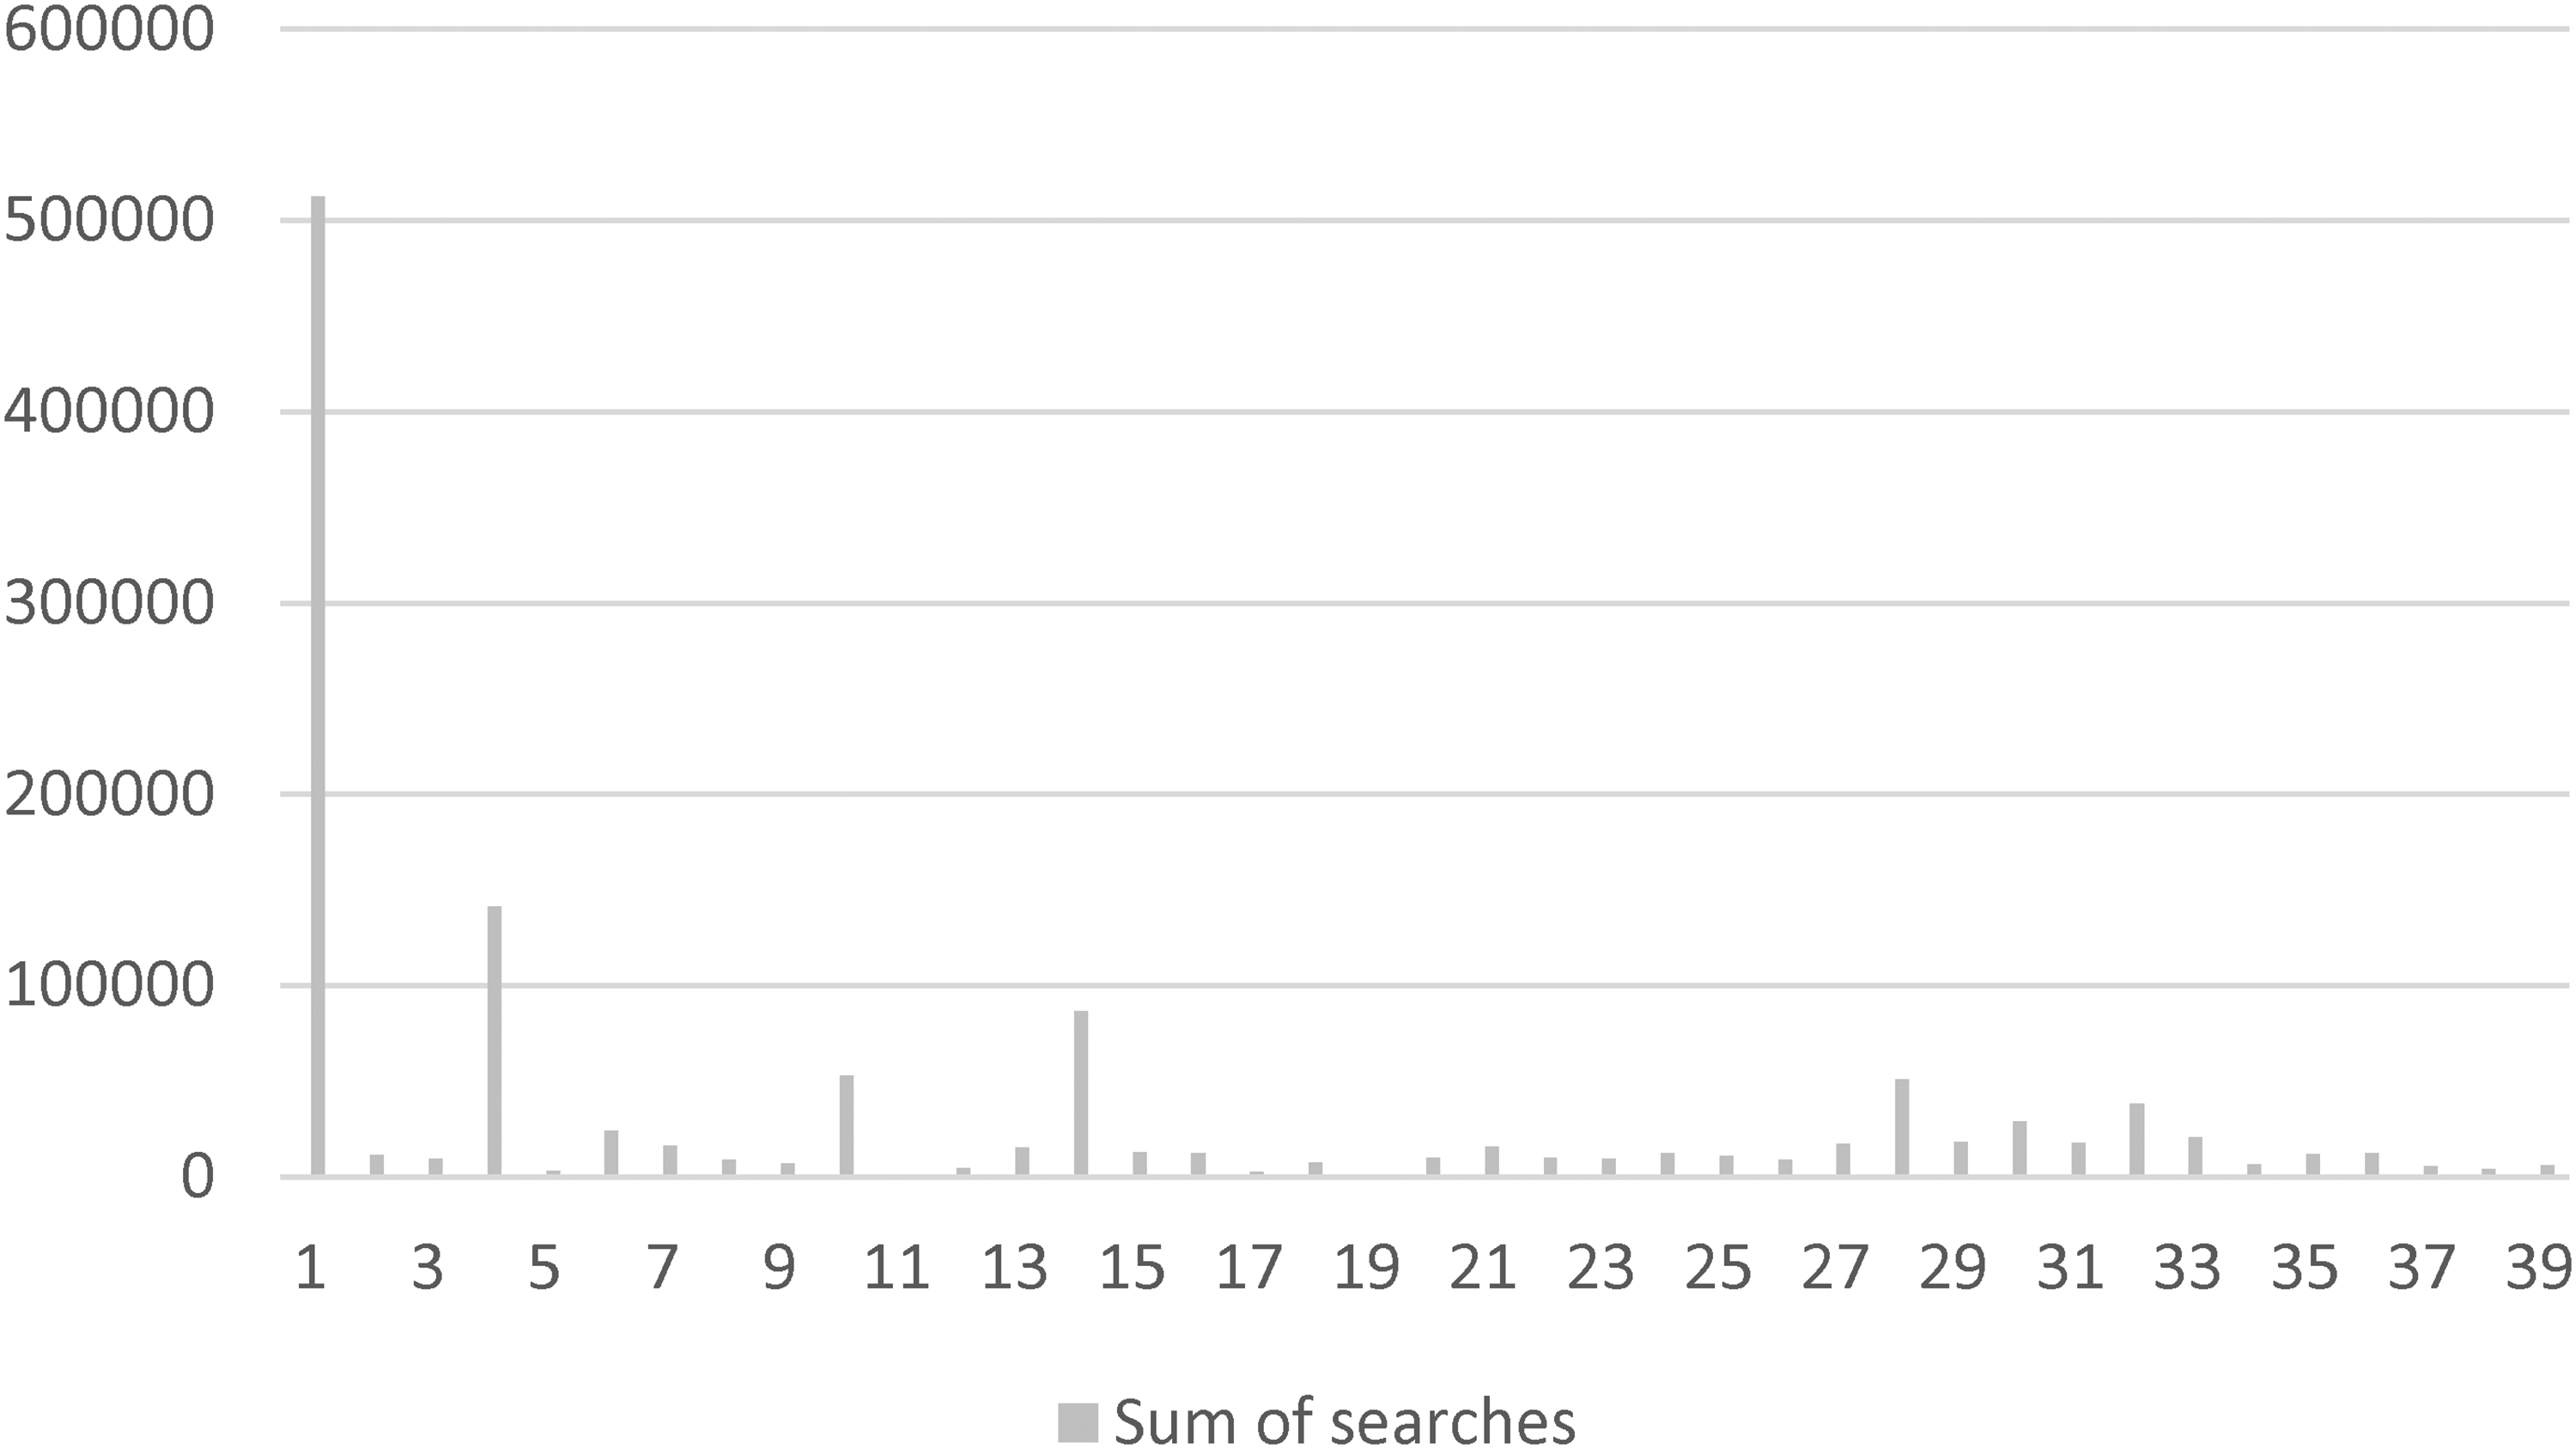
Total number of stop-and-search incidents by police force area (Metropolitan Police Service = 1).
Descriptive statistics and correlation matrix.

Note: S&S = stop and search; IMD = Index of Multiple Deprivation; SAMHI = Small Area Mental Health Index.
p < .01.
Independent variable: Mental health
Second, we used an area-level measure of mental health: the SAMHI. The SAMHI is ‘a composite annual measure of population mental health for each Lower Super Output Area (LSOA) in England. The SAMHI combines data on mental health from multiple sources (NHS-Mental health-related hospital attendances, Prescribing data – Antidepressants, QOF – depression, and DWP – Incapacity benefit and Employment support allowance for mental illness) into a single index’ (Daras & Barr, 2021: 1). We use the 2019 SAMHI index. Higher scores on the index indicate that mental health is worse in the area in question.
Control variables: Neighbourhood characteristics
Crime rate
Third, we used the crime domain index of the 2019 IMD (Ministry of Housing, Communities & Local Government, 2019) to generate a measure of crime at the local level. The 2019 IMD uses crime data from 2016/2017 and 2017/2018, i.e. before our study window. However, recorded crime is to a significant degree an outcome of police activity in an area, because increased police presence leads to increased crime detection. We already include a measure of police activity in our models (stop and search), and recorded crime is likely to be co-constituted (in other words, correlated with, generative of and generated by) police activity. We therefore reasoned it would be preferable to treat crime as a ‘structural’ characteristic of LSOAs that leads them to be more or less exposed to police activity. Using data from before our study window helps in this regard – moreover, we used the crime deciles reported in the IMD, where LSOAs are divided into 10 groups ranging from the lowest to highest crime areas. Among other things, this more clearly groups LSOAs into higher and lower crime type areas.
Accessibility of local services
We used the ‘geographical barriers’ sub-domain of the barriers to housing and services domain index of the 2019 IMD, which relates to the physical proximity of local services, to generate a measure of accessibility to local services at the local level. This time, using data from before our study window helps in treating accessibility to local services as a ‘structural’ characteristic of LSOAs that might lead people to be more or less exposed to police activity. By examining the relationship between police activity and the geographical placement of services, we can identify whether areas with higher levels of police activity are also those where local services may be less accessible. As above, we used the proximity to local services deciles reported in the IMD, where LSOAs are divided into 10 groups ranging from areas with the lowest to highest proximity to local services.
Ethnic and racial composition, deprivation, age and population density
Fourth, the 2021 Census provided a number of measures. The ethnic composition of the LSOAs in the data set were represented by: (a) the percentage of the population with a Black ethnicity (per cent Black), and (b) ethnic diversity as represented by Simpson's Index of Diversity
1
, which provides a value that ranges between 0 and 1 for each LSOA, with higher values indicating greater diversity. A further Census-based indicator measured household deprivation. We used the Census ‘dimensions of deprivation’ to identify levels of household deprivation (ONS, 2023). These are:
Education: A household is deprived on this dimension if no household member has at least level 2 education and no one aged 16 to 18 years is a full-time student. Employment: A household is classified as deprived in this dimension if any member who is not a full-time student is either unemployed or economically inactive due to long-term sickness or disability. Health: A household is classified as deprived in this dimension if any person in the household has general health that is bad or very bad or is identified as disabled. Housing: A household is classified as deprived if the household's accommodation is either overcrowded, in a shared dwelling or has no central heating.
For each LSOA, household deprivation was defined as the percentage of households that met at least three of the four criteria above. Two further Census-based measures were used: the percentage aged 15–34 (to account for the inevitable focusing of police activity on younger people); and population density (people per square kilometre), because the latter is highly variable between LSOAs which are designed to be similar in population but not in the size of the area covered.
Police force area identifiers
We include police force area (PFA) identifiers for all 39 territorial police forces in England (although see below for individual model specifications).
Analytic strategy
First, we present descriptive and bivariate statistics that consider the relationship between use of stop and search and area-level characteristics, including mental health, in isolation. Second, we consider whether area-level mental health predicts stop and search in an area, independent of area-level crime, accessibility to local services, ethnic and racial composition, deprivation, age, population density and PFA. This strategy allows us to explore two inter-related questions: Is police activity associated with the prevalence of mental health issues in specific geographical areas? Does any association between prevalence of mental health issues and police activity persist even when other important neighbourhood characteristics are taken into account?
Results
Bivariate analysis
Table 1 shows descriptive statistics and the correlation matrix for the variables used in the analysis.
As might be expected, there are moderate to strong correlations between almost all variables, which means that police activity, crime, larger ethnic minority populations, deprivation, the presence of young people and population density all tend to cluster together. Specifically, the number of stop-and-search incidents tends to be higher (p < .001):
where crime is higher (r = −.20; note that 1 = highest crime areas, hence the negative valence) where accessibility to local services is lower (r = −.13) in areas with larger Black populations (r =.22) in more ethnically diverse areas (r =.25) in more deprived areas (r =.16) in areas with a larger presence of young people (r =.08) in more densely populated areas (r =.18)
Notably, although the strength of the correlation is weak (r = −.04, p < .001), at the bivariate level the number of stop-and-search incidents appears to be lower where there are more people with mental health problems. There also appears to be a strong link between mental health, crime and deprivation. Specifically, there are more people with mental health problems where crime is higher (r = -.35; note that 1 = highest crime areas, hence the negative valence) and in more deprived areas (r = .50).
To complement Table 1, Table 2 shows the association between key measures and the number of stop-and-search incidents in an area. These were generated from a series of regression models with count of stop-and-search incidents as the dependent variable and each of the area characteristics, in turn, as the sole independent variable. To account for differences across different police force areas, PFA identifiers were included as fixed effects in the models. 2 The fixed effects soak up all variation associated with the PFAs – most obviously, here, that different PFAs use stop and search in very different ways (and in ways that cannot be reduced to the other variables in the model).
Bivariate regression models predicting number of stop-and-search incidents.

Note: IMD = Index of Multiple Deprivation; SAMHI = Small Area Mental Health Index.
*Higher scores = higher prevalence of mental health issues.
**1 = most deprived 10 of Lower layer Super Output Areas (in terms of crime).
***1 = most deprived 10 of Lower layer Super Output Areas (in terms of accessibility to local services).
Table 2 indicates, first, the prevalence of mental health issues may be important in predicting the number of stop-and-search incidents in an area. The positive coefficient (7.91, p < .001) indicates that when PFA-level variation is taken into account stop and search is used more in areas with higher SAMHI values. Second, the demographic and social characteristics of an area also seem to be important. For example, the positive coefficient of per cent Black (2.88) indicates that areas with a higher percentage of Black populations see more stop-and-search incidents, again accounting for PFA-level variation. Police use of stop-and-search powers is also higher in areas with higher levels of crime, that are more ethnically diverse, have higher levels of deprivation, where accessibility to local services is lower, have a larger presence of young people and which are more densely populated.
In sum, the bivariate analysis indicates that stop-and-search incidents are much more likely to occur in some types of areas compared with others. People who live in areas with higher levels of mental health issues, larger Black populations, more ethnic diversity, a larger presence of young people, higher levels of deprivation, less accessibility to local services and more crime, were more likely to be ‘exposed’ to stop and search by police. Because all these variables are correlated with each other (Table 1), the contribution each one is making to explaining the distribution of stop-and-search incidents is unclear. We therefore turn to multivariate analysis to help better understand the correlates of police activity (here, conceptualised as the number of stop-and-search incidents).
Multivariate analysis
Preliminary analyses: Differences between PFAs
Preliminary analyses revealed significant differences in size, count of stop-and-search incidents, levels of mental (ill)health and demographic profile between PFAs, with a particular emphasis on the Metropolitan Police Service (MPS)'s distinctiveness as a unique PFA. The MPS area is the largest and most densely populated PFA in the UK, has a much lower prevalence of mental health issues compared with the rest of the PFAs, and accounts for 41% of all stop-and-search incidents. Moreover, the MPS's demographic profile is very different compared to most other PFAs (younger and more ethnically diverse).
First, the MPS represents 15% of all LSOAs in the data set, encompassing a total of 4829 LSOAs. This figure markedly surpasses other forces, which vary between 6 3 and 1680 LSOAs, with only two other forces exceeding 1,500. This clearly marks the MPS as the largest PFA by a considerable margin. Relatedly, a one-way analysis of variance (ANOVA) revealed significant differences in population density across PFAs, F(38, 32,805) = 380.34, p < .001, η2 = .10. Post hoc comparisons indicated that the mean score for the MPS (M = 10,157.91 SD = 6672.42) was significantly different at the p < .001 level from all other PFAs (M = 1831.26 to 5209.04). In other words, the MPS area is also much more densely populated compared to all other PFAs.
Second, regarding stop-and-search incidents, the MPS significantly leads the count with a total of 512,076 searches over the study window (Figure 1). This number is substantially higher than other forces, which range from just 341 to 141,245 searches, with only two other forces recording more than 80,000. Critically, the MPS accounts for 41% of all searches conducted, underscoring its predominant role in stop-and-search incidents nationwide.
Third, the MPS area stands out with a mean SAMHI score indicating better mental health outcomes. A one-way ANOVA revealed significant differences in SAMHI across PFAs, F(38, 32,805) = 505.320, p < .001, η2 = .37. Post hoc comparisons indicated that the mean score for the MPS (M = −0.39, SD = .57) was significantly different at the p < .001 level from all other PFAs (M = 0.06–2.16). Because higher scores on the index indicate worse mental health, and the MPS has a significantly lower mean score (M = −0.39) compared to all other PFAs (M = 0.06–2.16), this implies that the MPS has better mental health outcomes. Therefore, in terms of mental health rankings where a lower score indicates better conditions, the MPS is ranked first among the PFAs for having the most favourable mental health statistics. In other words, compared with all other PFAs, the MPS exhibits the most favourable mental health statistics.
Finally, the MPS area has a very diverse demographic profile, with the LSOA mean percentages in categories such as per cent Black population, ethnic diversity and per cent population aged 15–34 significantly surpassing all other PFAs. The analyses of per cent Black, ethnic diversity and per cent aged 15–34 across PFAs using one-way ANOVAs revealed significant differences in each category. The MPS consistently showed higher means in all three areas: per cent Black (13.17), ethnic diversity (0.55) and per cent aged 15–34 (29.77), significantly differing from other PFAs at the p < .001 level. These results demonstrate the MPS's distinct demographic profile compared to other PFAs.
From preliminary analyses it therefore appears that: (a) we need to take account of PFAs 4 ; and (b) the MPS area exhibits unique characteristics that set it apart from other PFAs, reflecting distinct demographic, socio-economic and operational dynamics that distinguish it within the broader policing landscape.
In our final model, we therefore (a) include the PFA identifiers as fixed effects 5 using dummy variables to account for differences across different police areas; and (b) separate London (MPS) from the main analysis. To ensure comprehensive coverage, we present two models: one encompassing all PFAs excluding London, and another focused exclusively on the MPS. This approach allows for a nuanced comparison and a clearer interpretation of the data given the distinct characteristics of the MPS area. Another benefit of this approach is that it enables us to incorporate London borough identifiers in the MPS model.
Final model: all PFAs excluding London
Table 3 shows results from two linear regression models predicting number of stop-and-search incidents.
Linear regression models predicting number of stop-and-search incidents (all police force areas excluding London).

Note: IMD = Index of Multiple Deprivation; SAMHI = Small Area Mental Health Index.
**p < .01 ***p < .001.
In Model 1, we used the count of stop-and-search incidents as the dependent variable, with the SAMHI serving as the primary independent variable. The positive and significant coefficient (40.35) suggests that stop and search tends to be higher in areas with higher SAMHI values, accounting for variation across different PFAs. In other words, the number of stop-and-search incidents is higher in areas where there are more people with mental health problems. Note this model essentially replicates the model presented in Table 2 above, but removing the MPS results in a much stronger correlation between stop and search and mental health.
Model 2 mirrors Model 1 with one key distinction: it incorporates a comprehensive set of covariates. We find that even when controlling for crime rates, the percentage of Black residents, ethnic diversity, household deprivation, the proportion of the population aged 15–34, accessibility to local services and population density, the number of stop-and-search incidents was higher in areas with worse mental health. The association between the prevalence of mental health issues and police activity persists even when controlling for other important neighbourhood characteristics. Taking each of the other covariates in turn, the number of stop-and-search incidents appear to be higher in areas with larger Black populations, greater ethnic diversity, a larger presence of young people, higher levels of deprivation and more crime. By contrast, after controlling for the other neighbourhood characteristics, the accessibility of local services does not appear to be associated with the number of stop-and-search incidents.
One unexpected feature of this model is that, conditioning on the other variables shown, population density is negatively associated with the number of stop-and-search incidents (i.e. all else equal stop and search tends to be higher in less-densely populated areas). 6 Because the pairwise correlation (Table 1) and the bivariate coefficient (Table 2) between these variables were positive, this can probably be considered largely an artefact of the model, although it could also suggest that, all else being equal, levels of stop and search in more densely populated areas are lower than might be expected. If that were indeed the case, this could be attributable to urban dynamics. For instance, post-war housing estates on urban peripheries, although characterised by lower population density, are often areas of significant deprivation. Similarly, certain inner-city locations might have sparse residential populations, but also significant night-time economies, an almost certain ‘attractor’ of policing. These factors could explain the higher incidence of stop-and-search operations in these less-densely populated yet urban or semi-urban areas.
The MPS model
Table 4 shows results from two linear regression models predicting number of stop and incidents in the MPS area. For consistency with the previous model, we have here incorporated identifiers for the London boroughs. To maintain consistency in our analysis, we have excluded the Borough of Westminster from the MPS model. This decision aligns with our earlier approach of removing the MPS from the national model and reflects Westminster's unique characteristics in terms of the number of searches and its demographic profile (see for example Tiratelli et al., 2018).
7
Linear regression models predicting number of stop-and-search incidents (MPS only).

Note: IMD = Index of Multiple Deprivation; SAMHI = Small Area Mental Health Index.
*p < .05, ***p < .001.
In Model 1, we used the count of stop-and-search incidents as the dependent variable, with the SAMHI serving as the primary independent variable. To control for London borough variations, we incorporated identifiers for the 31 local authority districts
8
as categorical fixed effects, employing dummy variables. As seen in Table 4, accounting for variation across different London boroughs, there is no evidence to suggest that there is a relationship between the SAMHI and the number of stop-and-search incidents in the MPS area.
Model 2 in Table 4 incorporates the same set of covariates as previously. Crucially, the relationship between the SAMHI and the number of stop-and-search incidents in the MPS area remains non-significant even after controlling for crime rates, the percentage of Black residents, ethnic diversity, household deprivation, the proportion of the population aged 15–34, accessibility to local services and population density.
Taking each of the other covariates in turn, the number of stop-and-search incidents is on average higher in areas with more crime, more ethnic diversity and in areas with a larger presence of young people. However, in the MPS area, areas with larger Black populations and higher levels of deprivation do not appear to be associated with the number of stop-and-search incidents; and, as before, the accessibility of local services does not appear to be associated with the number of stop-and-search incidents either. As before, one unexpected feature of this model is that conditioning on the other variables shown, population density is negatively associated with the number of stop-and-search incidents (all else being equal stop and search tends to be higher in less-densely populated areas).
Discussion
In line with US evidence revealing that police activity is higher in areas where people face more mental health and well-being challenges (Vaughan et al., 2016; Hallet et al., 2021; Hodgkinson and Andresen, 2019; Koziarski, 2021), we found that in England, with the exception of London, there is a notable correlation between the frequency of stop-and-search incidents and the prevalence of mental health issues. This link persists even when accounting for various neighbourhood characteristics, including accessibility to local services. Although the incidence of stop and search tends to be higher in areas with larger Black populations, greater ethnic diversity, a substantial number of young residents, higher deprivation levels and increased crime rates, the mental health of people living in that area seems to act as an additional ‘attractor’ of police activity. By contrast, in London police activity does not appear to be correlated with the prevalence of mental health issues. This holds true even after adjusting for the same set of covariates. Therefore that our results seem to confirm that there is a link between policing and mental health at the area level that cannot be explained by deprivation, crime and other factors.
The complex interplay between policing and mental health challenges
The reasons why police interactions are more frequent in communities and among individuals dealing with mental health issues remain somewhat elusive. Research has suggested that factors such as deprivation, crime and access to local services might contribute to this association (Bradford, 2017; Suss and Oliveira, 2023), but although our analysis could not definitively answer the underlying questions here, the fact that (at the area level at least) the association persisted even after taking such variables into account indicates a need to focus on the specifics of the relationship between mental health and policing.
Two alternative explanations provide insight into why mental health challenges correlate with increased police activity. First, individuals with mental health issues often experience greater victimisation and engage in behaviours that require institutional intervention (Bhavsar et al., 2019; Dean et al., 2018; Kamperman et al., 2014; Khalifeh et al., 2015; Latalova et al., 2014; Maniglio, 2009). With significant cuts in other service areas, the police frequently become the default responders, even in non-criminal contexts. This scenario creates a direct link between policing and mental health challenges, shaped by the specific needs and behaviours of this demographic.
Second, police attention disproportionately targets marginalised and excluded groups, independent of crime rates or other contextual factors like deprivation. This trend is particularly pronounced regarding race and ethnicity, where police involvement often extends beyond addressing crime to managing broader social issues associated with these groups (Feldman et al., 2019; Roh & Robinson, 2009). Additional factors such as health status and social class also influence policing (Bradford, 2017), indicating that police practices may extend to monitoring and disciplining groups perceived as disruptive or threatening, beyond traditional crime prevention (Neocleous, 2000; Vitale, 2017). This situation presents challenges for policies like RCRP, which seek to sever the association between policing and the management of these social issues.
Together, these perspectives highlight that the connection between mental health and policing is multifaceted and cannot be explained solely by conventional factors such as crime or service inadequacies. This complexity calls for a deeper understanding of the relationship, suggesting a direction for future research to address.
Why is London so different?
The difference in the relationship between the prevalence of mental health issues and the number of stop-and-search incidents between London and the rest of England could be attributed to many factors, including: policing strategies and resources; population density and urban dynamics; diversity and socio-economic factors; crime rates and types; awareness and training in mental health; reporting and data collection differences; and community engagement and trust. London, as a ‘global city’, has different policing strategies and resources compared with other parts of England (House of Commons, 2021). The MPS employs different tactics and focus areas, which could influence how stop and search is implemented. In addition, the availability of specialised units or resources for dealing with mental health issues is different in London compared with other regions (Mayor of London, 2014). Also, London's high population density and unique urban dynamics (Hebbert et al., 2024) might shape the nature of policing and crime. High-density areas could lead to more visible crime or different types of crime, shifting the focus of police activities away from individuals with mental health issues. In addition, although London is ethnically diverse and has areas of high deprivation, its overall socio-economic and cultural landscape is different from other parts of England (ONS, 2022). This diversity might lead to a broader range of factors influencing policing, with mental health issues being less of a focal point than is the case elsewhere. Moreover, London experiences different crime rates or types of crime compared with other parts of England (ONS, 2023). If crime rates are higher or the nature of crime is different, this could lead police to prioritise certain types of incidents or areas, which may not necessarily correlate with the prevalence of mental health issues. There are also varying levels of awareness and training regarding mental health issues among police forces across different regions (HMICFRS, 2018). London police have distinctive training or policies in place to deal with individuals with mental health issues, leading to a different approach in handling such cases. Moreover, there are differences in how incidents are reported, and data are collected across regions (HMICFRS, 2023). This could affect the apparent correlation between mental health prevalence and stop-and-search incidents. Finally, levels of community engagement and trust in the police vary between London and other parts of England (Brown & Hobbs, 2023). In areas with higher community trust and engagement, there might be different approaches to policing, which could affect how mental health issues are addressed. Understanding these regional differences requires a nuanced analysis of local contexts, policing policies, community dynamics, and socio-economic factors.
Other factors explaining the distribution of stop-and-search incidents
It is widely accepted that many ethnic minority groups experience a disproportionate level of police searches in England compared with their white counterparts. For instance, although Black and Asian individuals represent just 11% of the population, they account for a striking 30% of all police stop and searches (Home Office, 2018). A notable investigation by Vomfell and Stewart (2021), focusing on the West Midlands Police area, analysed more than 36,000 searches conducted by approximately 1,100 officers. This study demonstrated that officers’ search practices vary according to the ethnic makeup of the areas they patrol. Other studies have demonstrated a link between economic disparities and stop and search. Suss and Oliveira (2023), for example found that areas of London characterised by a mix of affluent and economically vulnerable populations see a higher incidence of these practices, even after accounting for crime rates and other significant factors.
Our work accords with many of previous studies in this area. It also breaks new ground, providing an in-depth examination of stop-and-search patterns across the whole of England. To our knowledge, no national-level research has yet illustrated how the percentage of Black individuals and overall ethnic diversity in an area influences the prevalence of stop-and-search incidents there. We found that areas with higher populations of Black individuals and greater ethnic diversity tend to experience a more significant number of these incidents. Interestingly, in London, although the size of the Black population in a given area does not seem to correlate with the frequency of stop-and-search occurrences, areas exhibiting a broader spectrum of ethnic diversity do. We also found a link between economic deprivation and stop and search, although London, again was an apparent exception. Although our study focuses primarily on mental health implications, these findings are crucial for understanding the broader context of policing practice.
Limitations
It is important to note that the analysis presented in this article is exploratory and descriptive in nature. It provides a sketch of the distribution of police activity (using stop and search as a proxy) over geographical and social space, and of the association between police activity and some key area-level variables. It cannot tap into the causal processes that generated these associations. We can say something about ‘what’ is going on ‘where’ but can say little about ‘why’. The potential for ecological fallacy is another important issue. The danger of the ecological fallacy is that one cannot assume that what is true for a group is true for individual members of the group: for example, that those who live in a high crime area are all offenders (or even that those who live in a high crime area are more likely to be offenders). Just because an individual lives in area where police activity is higher does not mean that they themselves are more likely to encounter police.
Moreover, we acknowledge that our data focus primarily on conflict-driven interactions between police and the public, such as stop-and-search scenarios. This emphasis excludes supportive or non-conflict encounters in which police assist individuals experiencing mental health crises. Recognising this gap, we suggest that further research into these non-conflict and potentially supportive encounters is needed. Future studies should explore instances in which, for example, police actively help transport individuals to safe environments during acute mental health episodes. This approach will provide a more comprehensive understanding of the varied roles policing plays in mental health situations.
Practical implications
Identification of a clear correlation between police activity and the prevalence of mental health challenges in England raises significant concerns. This is particularly troubling in light of existing evidence showing the detrimental effects of policing on mental health (McLeod et al., 2019; Jindal et al., 2022); police interventions may exacerbate mental health issues. Our findings therefore align with the growing volume of questions about the role of police in handling mental health-related incidents and the need for alternative approaches to providing appropriate care and support to individuals in crisis.
The practical implications of these findings call for a reassessment of current policing strategies, particularly in how they intersect with public mental health. First, the correlation between heightened police activity and areas with more pronounced mental health challenges underscores the need for a paradigm shift in the policing approach to mental health crises. Traditional policing methods, often centred on control and containment, may exacerbate mental health conditions, leading to a cycle of distress, crisis and increased contact with police. This supports the now widespread acceptance of the need for urgent integration of mental health expertise into policing, either through specialised training for officers or the incorporation of mental health professionals in crisis response teams. Such initiatives could foster more compassionate, informed responses to mental health incidents, potentially reducing the need for forceful interventions and improving community trust in police.
Second, the findings presented here highlight a pressing need for policy reforms that advocate for a collaborative, multi-agency approach to mental health crises. There is an opportunity to divert resources towards community-based mental health services, providing a more supportive and less confrontational environment for individuals experiencing mental distress. By establishing clear protocols for when and how police should engage in mental health-related incidents, it should be possible to ensure that individuals receive appropriate care at the first point of contact. This approach could involve the development of crisis intervention strategies that prioritise de-escalation and empathy, thereby reducing the potential for negative mental health outcomes from police interactions. In essence, our research supports calls for a re-evaluation of the role of the police in managing mental health issues within the community. By adopting a more integrated and compassionate approach that leverages the expertise of mental health professionals, we can move towards a model of policing that is not only more just and equitable but also more effective in fostering the well-being and safety of the community.
Conclusion
In summary, our findings reveal that a range of area characteristics are correlated with the prevalence of stop-and-search incidents and, also, that London seems to differ markedly from the rest of the country. Outside the capital, there is a significant association between the prevalence of mental health issues and instances of stop and search, even when controlling for other neighbourhood factors, including accessibility to local services. The frequency of stop and search is also higher in areas with larger Black populations, more ethnic diversity, a significant young demographic, higher deprivation and elevated crime rates. By contrast, within London, the prevalence of mental health issues does not significantly correlate with police stop-and-search activities. Here, the primary correlates of stop-and-search frequency appear to be levels of crime, ethnic diversity and the age of the local population. Interestingly, neither the size of the Black population nor the level of deprivation within London areas is ‘uniquely’ associated with the frequency of stop and search.
Understanding the local dynamics of police activity – the nature of the areas in which police are most active – is an important step towards understanding the ways in which police activity affects different groups in society. In as much as we have shown that the mental health profile of an area seems in and of itself to ‘attract’ police attention (outside London), the findings presented in this article underline the link between policing and mental health, and resonate with current calls both to improve the ways police deal with people suffering from mental health problems and to shift the emphasis towards other service providers better suited to dealing with their needs. One marker of the ultimate success of such policies might be attenuation or even the breaking of the correlations reported here.
Supplemental Material
sj-docx-1-psm-10.1177_14613557241293004 - Supplemental material for Intersections between policing and mental health at the neighbourhood level: Evidence from England
Supplemental material, sj-docx-1-psm-10.1177_14613557241293004 for Intersections between policing and mental health at the neighbourhood level: Evidence from England by Arabella Kyprianides and Ben Bradford in International Journal of Police Science & Management
Footnotes
Acknowledgements
We would like to thank Dr Matt Ashby for his technical assistance and guidance.
Declaration of conflicting interests
The authors declared no potential conflicts of interest with respect to the research, authorship, and/or publication of this article.
Funding
The author disclosed receipt of the following financial support for the research, authorship, and/or publication of this article: This research was supported by ESRC ES/X003434/1.
Economic and Social Research Council, (grant number ESRC ES/X003434/1).

Supplemental material
Supplemental material for this article is available online.
Notes
Author biographies
References
Supplementary Material
Please find the following supplemental material available below.
For Open Access articles published under a Creative Commons License, all supplemental material carries the same license as the article it is associated with.
For non-Open Access articles published, all supplemental material carries a non-exclusive license, and permission requests for re-use of supplemental material or any part of supplemental material shall be sent directly to the copyright owner as specified in the copyright notice associated with the article.
