
Abstract
The increasing levels of air pollutants produced by human activities create a demand for efficient gas detectors, among which passive acoustic sensors are one of the most promising technologies. This work contributes to the field by developing a gas sensor based on a finite-size phononic crystal with a defect. Unit cells are made of dual Helmholtz resonators attached to a rectangular waveguide. The defect is introduced as a spacer between two periodic arrays of resonators and forms a one-dimensional cavity defined by Bragg reflectors. As a result, the structure’s transmission spectrum exhibits a narrow resonant peak within the stop band, and its spectral characteristics are susceptible to the acoustic properties of the medium filling the structure. The sensing response is analyzed using the transfer matrix method and validated by the finite element method, with thermoviscous losses taken into account to assess realistic sensor performance. Several hazardous gases, including carbon dioxide and ammonia, are considered as test samples. For the considered configurations, the estimated sensitivity is 1.38 Hz.s/m. The limit of detection is associated with the minimum detectable sound-speed variation, 0.04 m/s, for the defect mode resonance, depending on the gas and the length of the spacer. This enables the detection of small concentration changes in gas mixtures.
Introduction
The dramatic increase in anthropogenic activities is associated with greater emissions of air pollutants and the deterioration of the natural atmospheric environment. As a consequence, ecosystems and human health are endangered.1–3 Thus, the development of technologies that allow the detection of chemicals in their gaseous or vapor phases is of extreme importance. Among current approaches, 4 including semiconductor, optical, or electromechanical sensors, acoustic sensors represent one of the most promising technologies due to their high sensitivity and response speed, wide dynamic range, and low cost. 5 Nevertheless, there is still room for improvement, especially in terms of selectivity, and novel devices based on various platforms are under active development. Specific examples include MEMS-based sensors,6,7 which might be enhanced with metal-organic frameworks 8 or acoustic and optical cavities.9,10
Recent developments in surface acoustic wave sensors11,12 are associated with advances in micro- and nanostructuring of the sensing layer 13 and the use of unconventional materials, such as metal halide perovskites 14 and 2D materials. 15 Another modern approach utilizes bulk waves propagating in multi-layered phononic crystals with incorporated locally resonant elements, enabling mode formation within the band gap. The spectral position, amplitude, and quality factor of the excited defect mode are highly sensitive to changes in the acoustic parameters.16–19
Possible implementations of a gas sensor based on periodic structures include duct systems supplemented by arrangements of various sequences of closed and open20,21 or Helmholtz resonators.22,23
Recent developments in Helmholtz-resonator-based acoustic absorbers further highlight the role of these elements as building blocks for resonant metastructures. Weakly coupled Helmholtz arrays with rough necks and small back cavities have been shown to achieve efficient absorption across multiple frequency ranges. 24 In addition, a machine-learning-based inverse-design method for bending-channel resonators enables precise prediction of absorption performance. 25 The ultrathin bending labyrinth metasurfaces, which use generalized geometries, achieve perfect absorption at specific frequencies while maintaining their broadband performance, leading to noise reductions above 8 dB in enclosure tests. 26
Specific designs of duct systems also include structures based on dual Helmholtz resonators (DHRs),27,28 which are a promising configuration for noise-insulating systems.29–33 In addition, the use of double-resonant systems might also be beneficial for cloaking 34 or energy harvesting. 35
This work aims to develop a sensor that combines the advantages of DHRs with a defect-mode approach. In the proposed configuration, periodic arrays of DHRs form two Bragg mirrors separated by a spacer acting as a one-dimensional Fabry-Perot cavity whose frequency lies within the stop band of the mirrors. Characterization of the system is performed using the transfer matrix approach (TMM) and the finite element method (FEM). As a result, the device is shown to exhibit high sensitivity and low detection and quantification limits, for various asphyxiant (N2, CH4, C3H8) and hazardous (CO2, NH3, SO2, Ar, O2) gases. Sensing parameters are discussed in terms of the number of resonators, and the effect of thermoviscous losses on the sensor’s performance is discussed. It is concluded that even small concentrations of hazardous gases in binary mixtures with air can be detected, making the proposed structure promising for practical sensing applications.
In contrast to other phononic crystal sensors based on single Helmholtz resonators, the use of two Helmholtz resonators (DHRs) introduces a resonance splitting process that causes the emergence of additional band gaps. This provides greater flexibility in tuning the spectral response and improves the confinement of defect modes. As a result, the proposed structure offers improved frequency resolution and creates opportunities for future multi-frequency sensing strategies that may improve selectivity beyond the single-feature response considered in the present work.
Design of the sensor
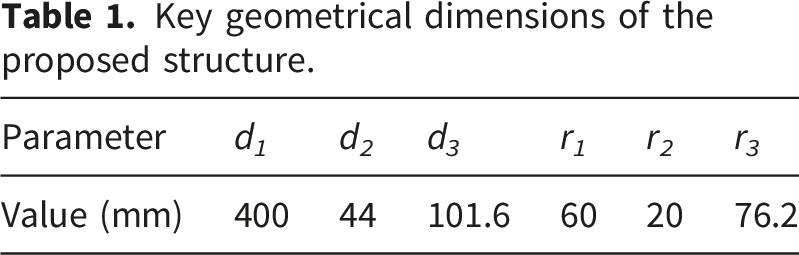
Figure 1 shows the proposed system, which consists of the acoustic waveguide loaded with two periodic DHR arrays separated by a distance d0. The waveguide and the spacer are characterized by a square cross-section with side lengths r0 and r1, which are equal in the present configuration. The proposed spacer breaks the system’s spatial periodicity and thereby allows the excitation of a defect mode within the stop band. Each DHR represents a pair of identical cylindrical resonators in the neck-cavity-neck-cavity configuration. Both resonators are characterized by the same neck radius r2, neck length d2, cavity radius r3, and cavity length d3. The distance between the adjacent DHRs is d1, which defines the period of each resonator array, each consisting of N unit cells. All walls within the system are considered to be sound-hard, and the acoustic properties of the gaseous medium that fills the structure are fully defined by the speed of sound c and density ρ. The fixed geometric parameters are listed in Table 1. Schematics of the system. The structure consists of two finite-size phononic crystals separated by a spacer (defective waveguide) with the length d
0
. Each array consists of N unit cells representing dual Helmholtz resonators (DHRs). Effectively, the arrays represent Bragg mirrors, and the spacer acts as a Fabry-Perot cavity. As a result, the defective Fabry-Perot mode occurs within the band gap, such that the corresponding high-Q resonance is sensitive to the change in the material parameters of the fluid in the duct. Key geometrical dimensions of the proposed structure.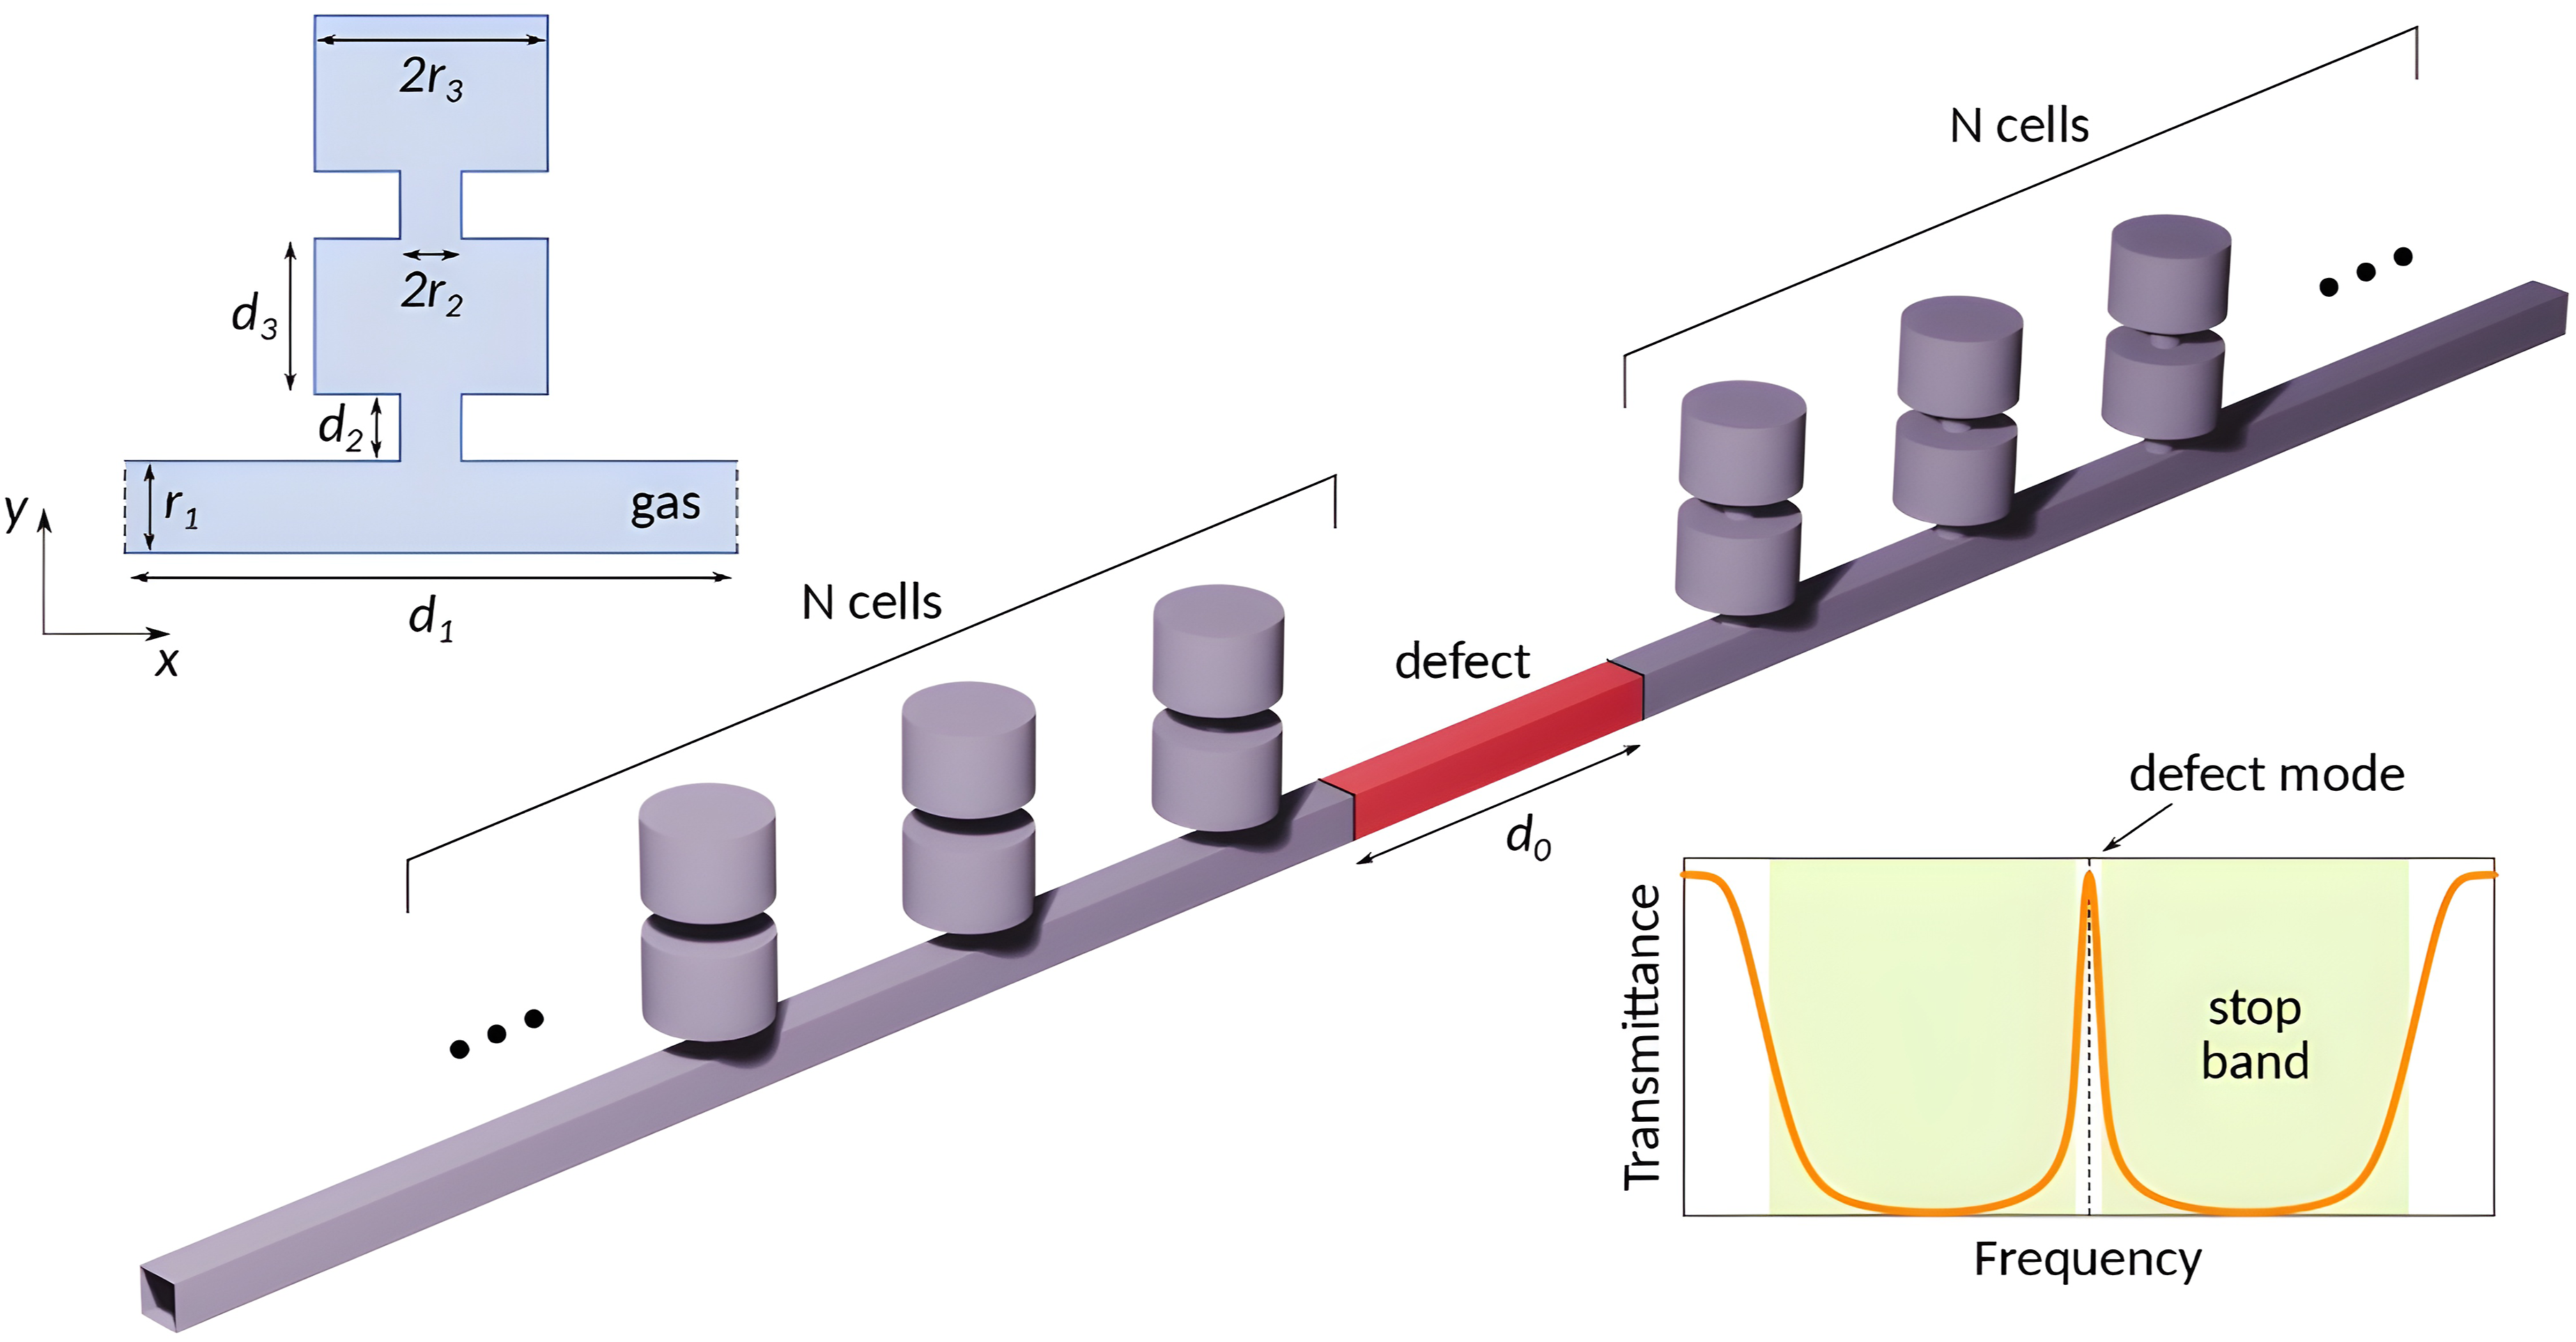
The sensing characteristics were analyzed using the transfer-matrix method, with the thermoviscous formulation incorporated into the model (see Appendix), to obtain the analytical transmission spectra and resonance parameters. The finite element method (FEM) was used to validate spectral results, to calculate eigenmodes, and to study the effects of thermoviscous losses. In the FEM model, the Pressure Acoustics interface was used with a unit-amplitude background pressure field, and the maximum element size was chosen to be one-sixth of the minimum wavelength in the studied frequency range. Experimental validation would be an important next step and will be considered in future work.
The analysis of the system begins with the consideration of the air-filled structure, such that the sound speed and density were taken as 340 m/s and 1.2 kg.m−3, respectively. In the absence of the defective waveguide section, the structure behaves as a phononic crystal. In the low-frequency range from 50 to 950 Hz, the band structure of the infinitely periodic system is characterized by four band gaps, as shown in Figure 2(a). The corresponding eigenmodes (Figure 2(b)) are associated with the DHR resonances occurring at 173 and 292 Hz and with the waveguide modes at 854 and 882 Hz. To describe the mechanism of band gap formation, it is reasonable to start from a limiting case in which the unit cell is represented by a simple waveguide without resonators. Obviously, such a structure supports only waveguide modes. Introduction of a single HR (not DHR) into the unit cell results in the appearance of an additional mode between the fundamental and next-order waveguide modes. Hence, two lower band gaps occur, and their spectral positions as well as their widths are determined by both the parameters of resonators and periodicity. In addition, resonators can be considered as periodic variations of the effective impedance, which is one of the mechanisms responsible for band gap formation in phononic crystals. When the HR in the unit cell is substituted by a DHR, the Helmholtz resonance splits into two, and hence an additional band gap is formed. The spectral position of the defect mode is mainly governed by the Fabry–Perot condition, with additional shifts caused by the effective phase response of the DHR arrays, taking into account the fact that the effective length of the defect segment is larger than the actual one due to the leakage into the arrays of resonators. Accordingly, the transmission spectrum of a finite-size structure is characterized by the dips coinciding with the positions of the band gaps. Properties of a periodic DHR structure. (a) Band diagram of the infinitely periodic structure with the unit cells consisting of dual Helmholtz resonators. Band gaps in the dispersion relation are indicated by the green-shaded areas. (b) Acoustic pressure eigenmode distributions for selected eigenfrequencies at the Γ point.
The analysis was restricted to the 300 − 650 Hz range as this interval contains the stop band and the localized defect mode used for sensing. This frequency window therefore captures the band gap edges and the confined resonance relevant to the sensing mechanism. The band gap edges and localized resonance throughout this range become distinctly visible, which serves as the fundamental requirement for precise identification of defect-mode confinement together with its displacement during gas property alterations. This frequency window contains the essential features needed for sensing, whereas frequencies outside it are not relevant to the chosen design because they do not contribute to the sensing mechanism.
Of particular interest is the stop band located in the approximate frequency range from 420 to 510 Hz, which is formed by the DHR and waveguide modes and where the defect mode occurs. For the case of periodic structure, the depth and width of the stop band increase with the total number of unit cells (Figure 3(a)), as should be expected for a phononic crystal. When two of the finite-size arrays are placed in sequence, the spacing between them results in the excitation of a resonance within the stop band (Figure 3(b)). Generally speaking, the spacer acts as an acoustic cavity bounded by two periodic arrays of DHRs, each consisting of N unit cells, which effectively act as Bragg mirrors. Hence, the increase in the number of unit cells within each array increases the reflection coefficient of the mirrors and, as a consequence, the quality factor of the defect mode. In particular, the full width at half maximum (FWHM) of the corresponding resonance decreases from 4.5 to 0.001 Hz when N changes from 5 to 17 (Figure 3(c)), and the Q factor increases from 102 to 4 × 10⁶, respectively (Figure 3(d)). Finite-size DHR structure. (a) Transmission spectra of the periodic finite-size structure having the length of N
tot
unit cells. (b) Transmission spectra of the structure with broken periodicity in which the defect waveguide section length is d
0
= 500 mm. Each array consists of N unit cells. Green shaded areas indicate the positions of band gaps of the associated infinitely periodic system. (c) Full width at half maximum and (d) quality factor of the defect mode resonance as discrete functions of N.
The spectral position of this resonance is defined by the length of the defect waveguide section, such that the parametric space is characterized by several nearly equidistant resonances (Δd0 ≈ 350 mm), as shown in Figure 4(a). According to the corresponding eigenmode field distribution (Figure 4(b)), the amplitude reaches its maximum at the center of the defect section and then decays exponentially with the coordinate along the x-axis (Figure 4(c)). It should be noted that the FWHM and Q-factor of the defect mode resonance depend on its spectral position with respect to the edges of the stop band, and the further the defect mode lies from the stop band edge, the lower its spectral width. Transmission properties of the air-filled structure. (a) Numerically calculated transmission coefficient of the considered structure in which the defective waveguide is placed between two arrays, each consisting of 5 dual Helmholtz resonators. Dashed orange lines indicate the eigenmodes of the system. (b) Field distribution corresponding to the mode occurring at the frequency 481 Hz at d
0
= 500 mm. (c) Eigenmode pressure amplitude as a function of the coordinate.
Sensing parameters
The performance of the designed sensor is analyzed in terms of conventional parameters. First of all, the main characteristic of the defect mode is its quality factor, defined as the ratio of the resonant frequency and the full width at half maximum (FWHM) of the transmittance peak:
The sensitivity is defined as

and finally, the limit of detection (LoD) is given by:
The above parameters are determined algorithmically using the spectra calculated with the transfer matrix method. In order to properly resolve the spectra, the frequency step was considered to be 0.01 Hz.
Sensing performance
The operating principle of the proposed sensor is based on the modification of the acoustic properties of the analyte medium, which is assumed to fill the entire structure homogeneously, both the central waveguide and the attached DHRs. In this configuration, the acoustic response of the system is determined by two main aspects, which are also captured in the transfer-matrix formulation (see Appendix). First, the dominant effect is the change in the phase accumulation within the defect cavity (spacer). Second, the acoustic impedance of the DHRs, zDHR, changes with both the sound speed and the density of the gas (equations (13) and (14)). Hence, the reflectivity and phase response of the Bragg mirrors that form the cavity are altered by the changes in material parameters. Under these conditions, the variation in the speed of sound modifies the phase accumulation in the defect section and therefore shifts the frequency of the localized defect mode, as reflected by the transfer matrix in equation (10). In other words, the sensor functions primarily as an interrogator of the sound speed within the Fabry-Perot cavity, with the DHR arrays serving to create a confined resonant mode suitable for precise frequency-shift detection.
The current sensing system has an inherent selectivity limitation because its defect-mode frequency depends primarily on the effective sound speed of the filling gas. As a result, different gases or gas mixtures with comparable sound speeds produce resonance shifts that determine the baseline selectivity of the system when only one spectral feature is monitored. Therefore, the present structure should be regarded primarily as a sound-speed-sensitive platform, while improved selectivity may be achieved by combining the defect-mode response with additional spectral observables, such as linewidth, transmission amplitude, or multiple resonant modes.
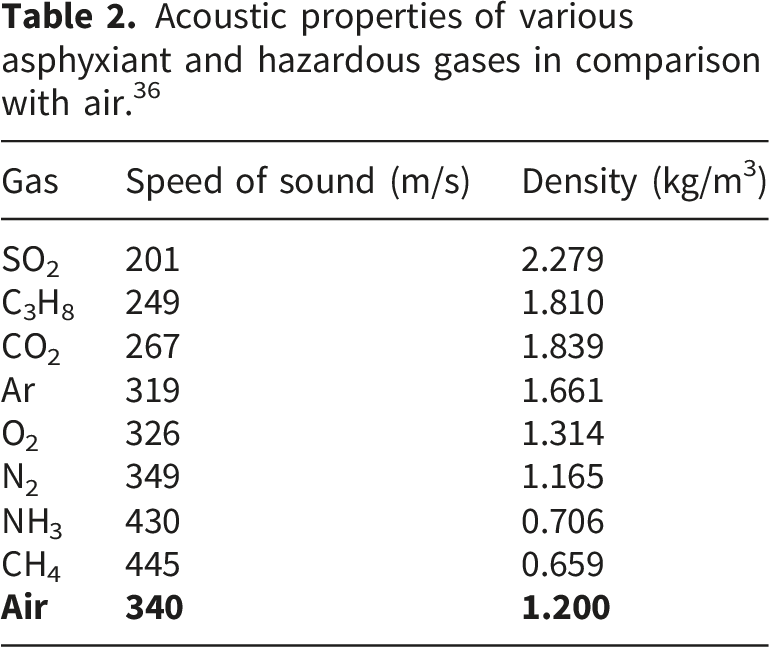
Acoustic properties of various asphyxiant and hazardous gases in comparison with air. 36
The proposed sensor does not rely on a single material parameter, rather, the transmission peak is affected by the combined influence of the sound speed and density of the filling gas. In practice, the resonance shift is governed mainly by the sound speed, whereas the density primarily affects the impedance mismatch and, consequently, the resonance width and amplitude. This acoustic spectral signature is advantageous because the defect mode provides a narrow and easily measurable resonant signature, thereby enabling passive, compact, and contactless sensing in a duct configuration.
Despite the excellent sensing performance, the practical suitability of a large structure is in question, and the reported values may be difficult to achieve experimentally. In principle, the gas type identification relies on comparing the measured defect-mode frequency and linewidth with calibration data, while the concentration could be estimated from the frequency shift relative to the air baseline. Experimental validation of such a classification procedure is left for future work. The reason for this conclusion is explained in the next section, where thermoviscous losses are discussed. Here, however, it may be briefly noted that large structures imply large losses, resulting in significant broadening of the defect mode resonance and drastic decrease of its amplitude.
A compromise between the size of the structure and the narrowness of the transmission peak can be achieved when the arrays consist of N = 5 resonators, and hence all subsequent calculations are provided for this case. To estimate the sensing parameters, three arbitrarily chosen configurations of the defective waveguide section length are considered: 300, 500, and 900 mm. The resonant frequency values range from 260 to 600 Hz, such that the resonant frequency is lowest at d
0
= 300 mm, increases for d
0
= 500 mm, and then shifts slightly toward lower values for d
0
= 900 mm, as shown in Figure 5(a). Therefore, the change in the length of the defect waveguide section affects the transmission properties, as shown for air in Figure 4(a). Note that at a fixed value of d0, the resonant frequency correlates with the speed of sound in the gas, such that the higher the sound speed, the higher the frequency. Sensing parameters. (a) Resonant frequency, (b) Sensitivity, (c) Figure of merit, and (d) Limit of detection as functions of the defective waveguide length d
0
. For all panels, the defective waveguide is located in-between two finite-size periodic arrangements of dual Helmholtz resonators, each consisting of 5 unit cells. Still, the trend for air is the same, and lower frequency is observed for d
0
= 300 mm (purple), while the highest is for d
0
= 500 mm (orange).
In terms of sensitivity (Figure 5(b)), the trend correlates with that for the resonant frequency, as expected from equation (2). The highest value, 1.77 Hz.s/m, is observed for oxygen when d0 = 500 mm. For N2, the sensitivity is the lowest, within the range of 0.87 to 0.97 Hz.s/m depending on the value of d0. This performance is related to the fact that the resonant frequencies of N2 are close to those of the air, since their acoustic characteristics are rather similar. In general, for all gases, the change in sensitivity with defect-waveguide length is less pronounced and typically does not exceed 0.2 Hz.s/m. At the same time, the decrease in d0 negatively affects the FoM, as shown in Figure 5(c). This behavior is justified by the fact that at d0 = 300 mm the defect mode lies closer to the edge of the stop band than for other lengths of the defect waveguide section (Figure 4(a), for example). In the case of sulfur dioxide, the FWHM is the lowest among the considered samples, and hence the FoM is the largest. At the same time, the value of FWHM for nitrogen is lower than for NH3 or CH4, but the sensitivity has smaller values, which is why FoM is minimal for N2.
Finally, the trend of the LoD is similar for all gases, such that the maxima are observed for d0 = 300 mm ( Figure 5 (d)). Concerning the specific numbers, at d0 = 300 mm the LoD values lie in the range 0.014 − 0.071 m/s. Notably, at a fixed length of the defective waveguide section, the quality factor is nearly the same for all gas samples; therefore, the LoD differs mainly because of the sensitivity and resonant frequency. The dependence of the defect mode on material parameters. (a) Resonant frequency and (b) Full width at half maximum (FWHM) as functions of the sound speed and density of the gas filling the structure. (c) Calibration curves for two sample gases, CO2 and NH3 mixed with air. The horizontal dashed line indicates the resonant frequency of the defect mode for the case when the structure is filled with pure air. For all panels, the defect waveguide section has the length d
0
= 500 mm and each of the resonator arrays consists of N = 5 unit cells.
It should be emphasized that the limit of detection refers to the smallest detectable variation in the sound speed of the filling medium, rather than to a direct gas-classification threshold. In practice, different gases and different concentrations produce different calibration trajectories of the defect-mode frequency, which can be used for identification when compared with reference data. Once the appropriate calibration curve is identified, the gas concentration can be estimated from the position of the measured point along the corresponding calibration curve. In cases where different gases produce similar frequency shifts, linewidth and transmission amplitude may serve as auxiliary observables to improve discrimination.
Although the above results demonstrate good sensing performance for the case in which the structure is filled by a single gas, practical applications usually require the consideration of mixtures in which a hazardous gas is present in a specific concentration. To estimate the limit of quantification, the resonant frequency and the width of the defect mode resonance are considered as functions of the acoustic characteristics of the gas filling the structure. According to Figure 6(a), the spectral position of the defect mode peak is almost independent of the density but at the same time is sensitive to the sound speed. In particular, a sound-speed change of 1 m/s results in a frequency shift of approximately 1.5 Hz. At the same time, the spectral width of the corresponding transmission peak remains in the range between 1 and 1.1 Hz (Figure 6(b)). Two peaks can be resolved if the distance between their maxima exceeds the sum of halved FWHMs, which means that the sensor allows the detection of a sound-speed change of Δcmin = 1.1 m/s. This value can be related to the minimum detectable gas concentration using the known expression for the speed of sound in a gas,
36


Where xi is the fraction of the i-th component. Therefore, the limit of quantification can be estimated as the gas fraction for which c changes by at least Δcmin with respect to air. As an example, carbon dioxide may be considered one of the most dangerous gases. Assuming that the molar mass of air is 28.96 g/mol and its specific heat ratio is 1.4, it can be concluded that the minimum detectable fraction of CO2 in the binary mixture with air is approximately 0.01, if γCO2 = 1.29 and MCO2 = 44.01 g/mol. As a reference, hazardous effects of CO2 are typically observable at concentrations greater than 5%, 37 and therefore the proposed sensor allows the detection of CO2 at low concentrations that do not yet pose immediate danger. Further, equations (5) and (7), as well as the results shown in Figure 6(a) and 6(b), can be utilized to obtain calibration curves for different samples. Examples for CO2 and NH3 are shown in Figure 6(c), demonstrating that the deviation of the resonant frequency from that obtained for air increases with the concentration of a sample gas, as should be expected.
Thermoviscous losses
It should be noted that the design procedure was performed for an idealized lossless case. However, practical applications imply the presence of dissipation, which may negatively affect the quality factor of the defect mode and thereby decrease the sensitivity. To assess the effect of thermoviscous losses on sensing performance, FEM calculations are provided for a modified model incorporating the ”Thermoviscous Boundary Layer Impedance” condition applied to all boundaries of the structure. This condition takes into account both the localized viscous and thermal dissipation in thin boundary layers at the solid walls. In acoustic waveguides and Helmholtz-type resonators, the characteristic geometric dimensions are typically significantly larger than these boundary layers and therefore govern the dominant loss mechanisms. In this case, the boundary layer impedance model is an accurate and computationally efficient approximation because it does not require solving the complete set of thermoviscous fields in the fluid domain. This approximation is widely used in duct acoustics and resonator-based metamaterials because it captures the dominant boundary-layer dissipation without requiring the full thermoviscous field equations to be solved in the entire fluid domain.
The high-Q values obtained in the lossless case should be regarded as an optimistic upper bound. A more realistic estimate of sensor performance is therefore obtained when thermoviscous losses are included. Besides viscous and thermal dissipation, there are also wall roughness, radiation leakage, and other imperfections in the fabrication that contribute to further resonance broadening and amplitude reduction. These effects are not modeled explicitly in the present work, but they are expected to play a secondary role compared with boundary-layer losses. Based on this, the sensing performance obtained under thermoviscous loss conditions should be considered the most realistic estimate of practical operation.
As an illustrative example, CO2 is considered again (Figure 7). The inclusion of thermoviscous losses weakly affects resonant frequencies, as the frequency shift is within 1 Hz. Obviously, dissipation results in the broadening of resonances and increased FWHM (Figure 7(a)). At the same time, the spectral width of the transmission peaks can be controlled by the number of resonators in the arrays, in agreement with Figure 3(b). Effect of the number of resonators N on sensing performance in the presence of thermoviscous losses. (a) Full width at half maximum, (b) Sensitivity, (c) Figure of merit, and (d) Limit of detection for the case of CO2 gas. Here, the spacer size is d
0
= 500 mm.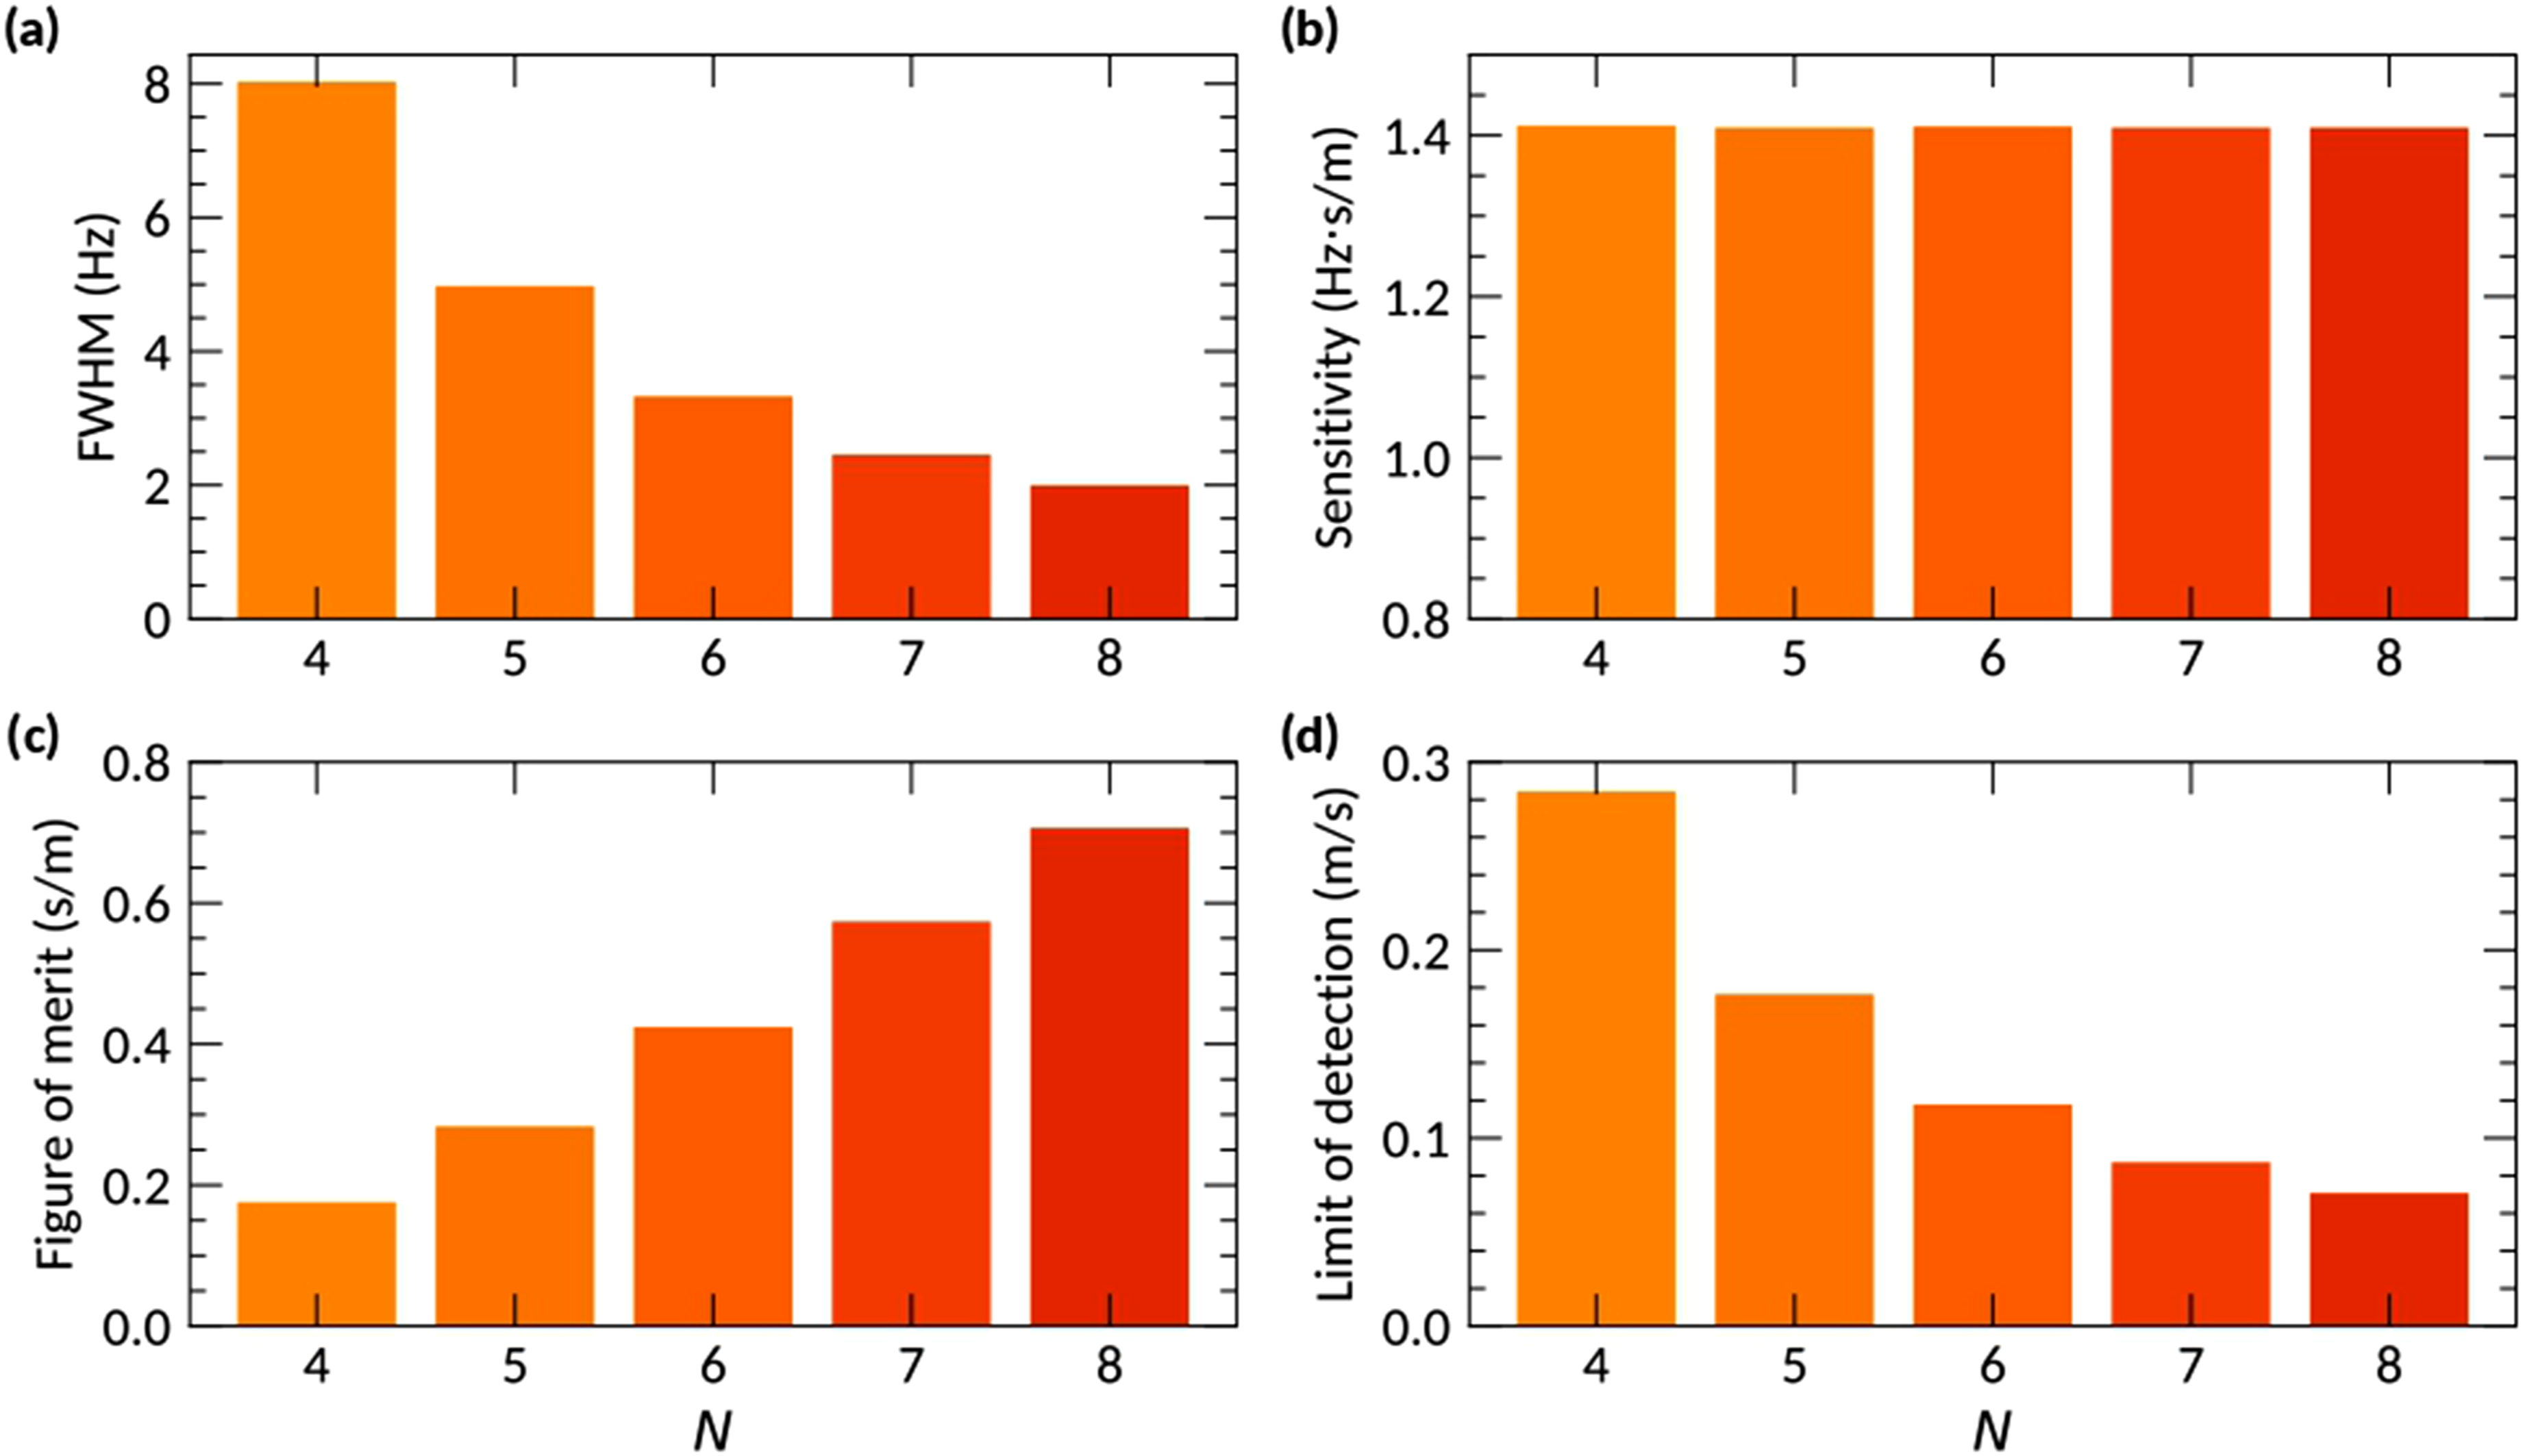
However, it should be noted that the amplitude of the transmission peak drops with increasing N, so the corresponding transmission coefficient for N = 4 is approximately 0.66, while for N = 8 it drops to 0.07, indicating that larger structures may be less practical. In this context, N = 5 seems to be a balanced choice with a transmission coefficient of around 0.5 and a clearly distinguishable narrow resonance. Still, sensitivity remains nearly invariant with respect to the size of the structure, and its value is nearly the same as for the lossless case (Figure 7(b)). This behavior is justified by the fact that the resonance frequencies remain practically the same.
In addition, another consequence of broadening is a decrease in FoM, which decreases from 1.67 to 0.71 s/m (Figure 7(c)). In addition, LoD increases from 0.04 to 0.18 m/s (Figure 7(d)). Therefore, it can be concluded that the introduction of thermoviscous losses results in the expected worsening of sensing performance, which, nevertheless, is still comparable with other structures, as discussed below. However, further investigation of various loss mechanisms, as well as frequency dispersion of material parameters, is beyond the scope of the present work.
It should be clarified that the number of resonators is not presented as the fundamental cause of thermoviscous losses. Instead, it serves as a structural parameter to explore how a lossy setup reacts as the effective resonant path and the overall size of the device increases. Indeed, the extent of thermoviscous damping depends fundamentally on the gas being used. This dependency arises not only from the physical shape but also from properties like viscosity, thermal conductivity, and heat capacity of the medium involved. In this research, we employ loss analysis to evaluate how genuine dissipation influences the defect-mode resonance in a typical setup. Although the specific widening of the linewidth may differ between gases, the primary sensing mechanism remains the shift in resonant frequency caused by the gas. In contrast, thermoviscous losses mainly influence the height of the peak and the breadth of the spectrum.
As the sensing mechanism is governed primarily by the sound speed of the filling medium, temperature variations represent an intrinsic source of cross-sensitivity. In fact, the temperature variation alters the sound speed and consequently shifts the spectral position of the localized defect mode even at constant gas composition. To explain this effect, Figure 8 shows a temperature-frequency transmission map of the defective structure for pure air (Figure 8(a)) and an air–SO2 mixture with SO2 molar fraction x = 0.6 (Figure 8(b)). The fact that the high-transmission bands, such as the localized mode, drift diagonally indicates that the sensing response is temperature dependent and hence must be read along with the system temperature. A comparison between the two cases also shows that changing the filling gas composition modifies the position of the transmission features, confirming that the spectral response depends not only on temperature but also on the gas mixture. A quantitative temperature compensation study remains a promising future perspective, though beyond the present scope. Transmission spectra colormap for acoustic waves as a function of the frequency and temperature for two cases: (a) Air filling the structure and (b) an air-SO2 mixture for x = 0.6. In both cases, the spacer length is d
0
= 500 mm.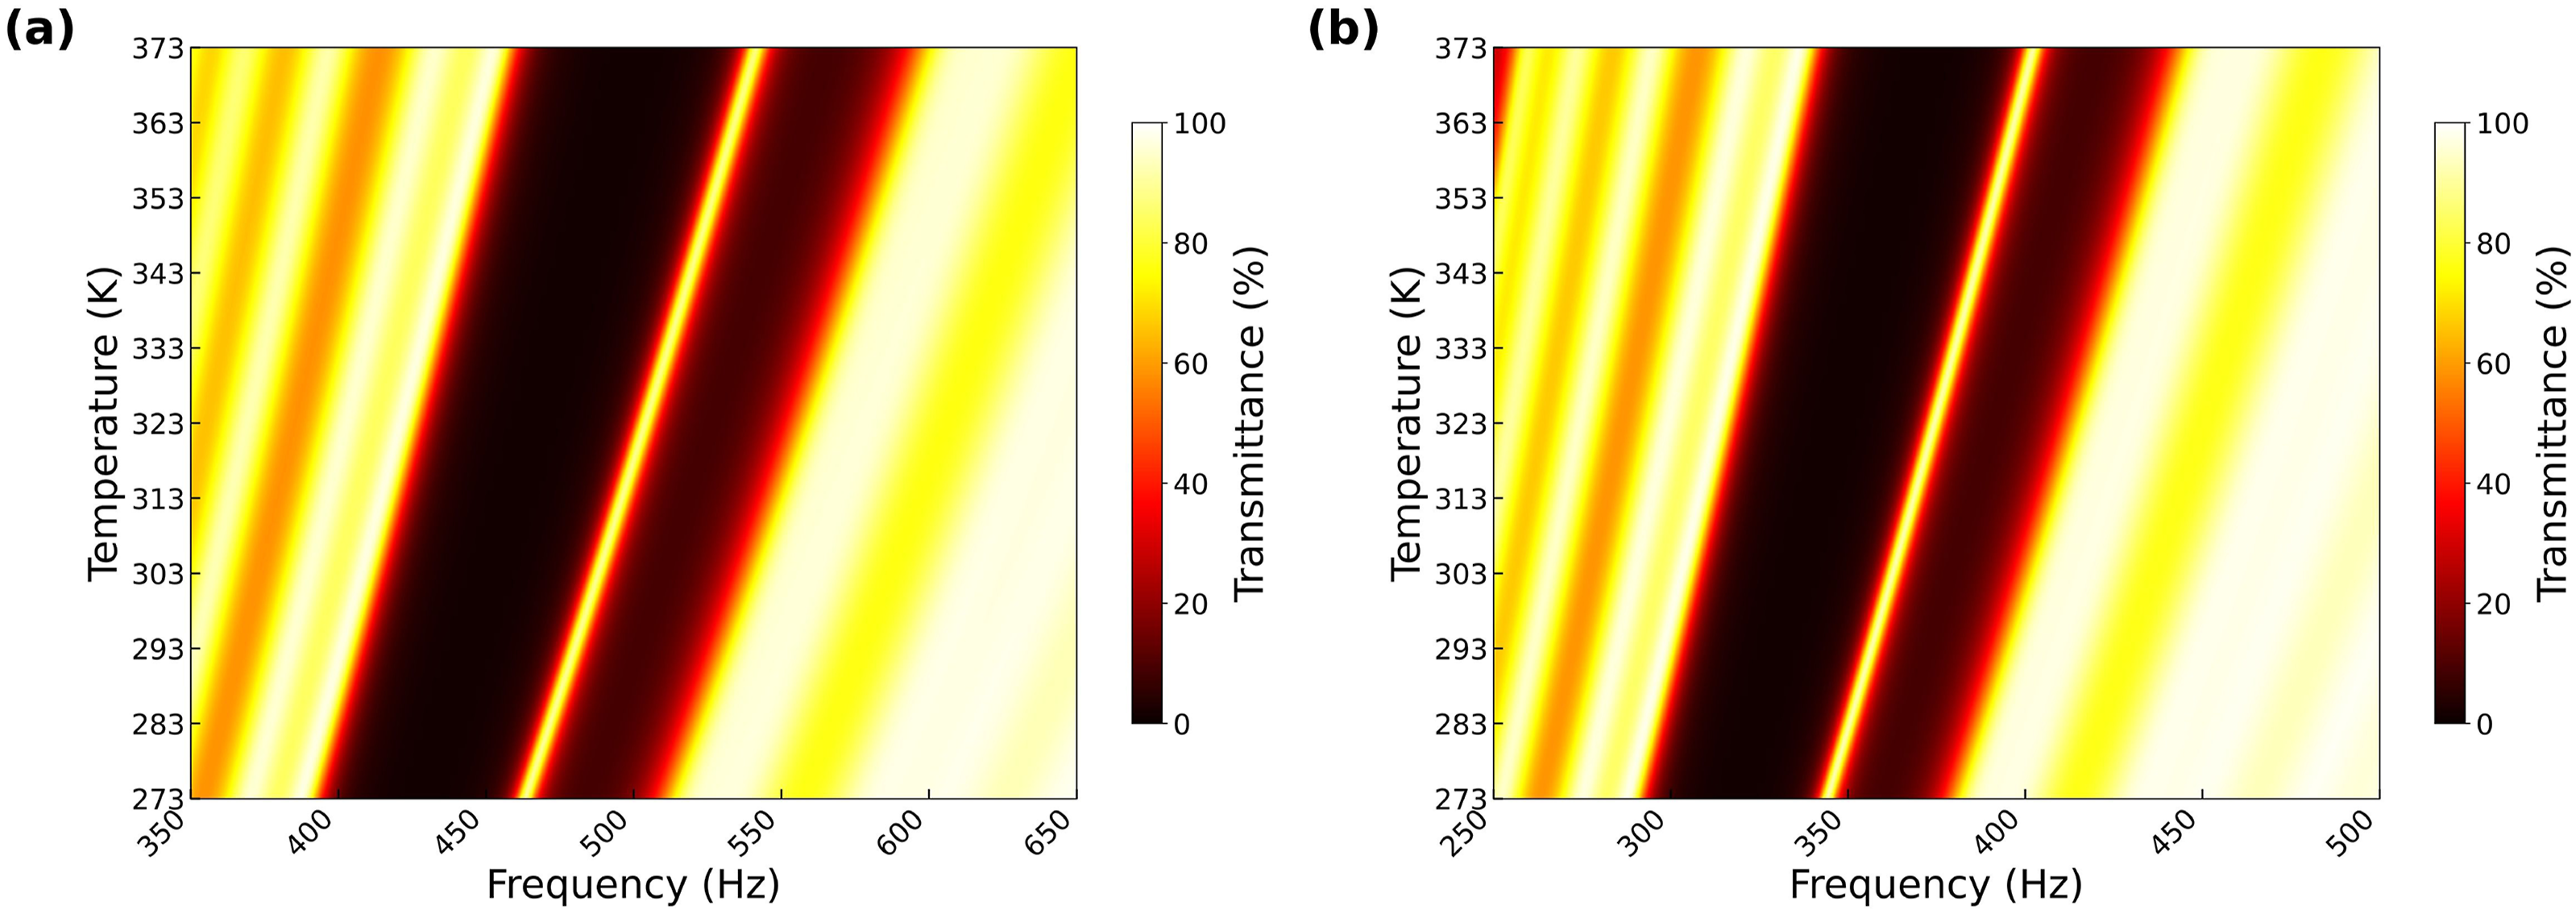
Discussion
Comparison of different structures in terms of their sensing parameters. The values for the DHR-based structure are given for the case of CO2, such that when N = 17, the spacer length is d 0 = 921 mm, and for N = 5 the corresponding value is d 0 = 500 mm.
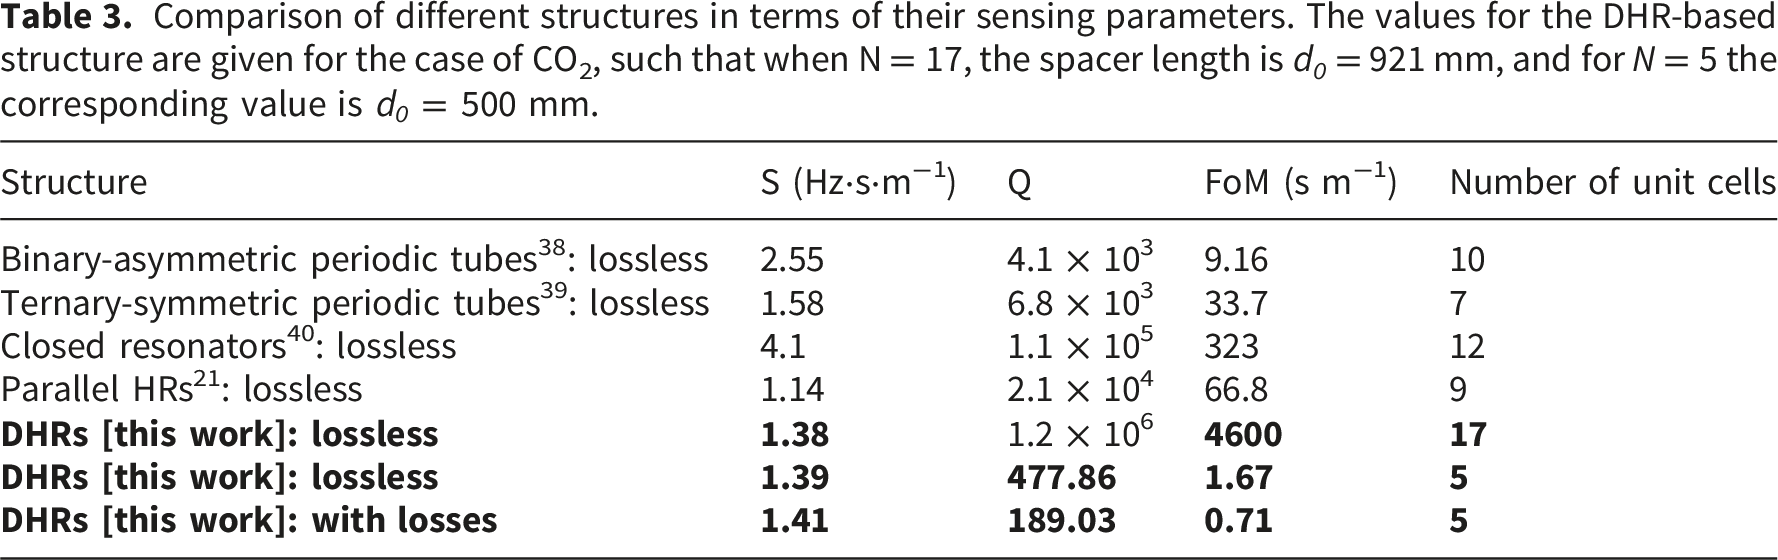
The remaining sensing parameters are less competitive in comparison with other structures, though two crucial remarks have to be made. First, none of the cited examples explicitly considers thermoviscous losses, and hence, the values of sensing parameters are overestimated. Then, the size of the structures in terms of the unit cells is significantly larger than that considered in the present work. In the comparable idealistic scenario, the developed sensor also demonstrates extremely high quality factors (Figure 3(d)), which, however, are unrealistic in practical implementations, as discussed above. Therefore, the proposed DHR sensor exhibits reasonable performance, representing a compact structure suitable for practical applications.
Beyond the quantitative comparison in Table 3, the present DHR-based sensor differs conceptually from conventional resonator-based sensors. Unlike systems based on a single Helmholtz resonance or a uniform resonant cavity, the proposed structure combines local resonances with a defect-mode phononic crystal, leading to strong spatial confinement and narrow transmission peaks. The use of dual Helmholtz resonators also enables resonance splitting, which provides additional flexibility in shaping the band structure and positioning the defect mode.
To further assess the specific contribution of the DHR architecture, an additional control simulation was performed for a defective structure based on single Helmholtz resonators under the same geometric and modeling conditions. For the single-HR control case, the calculated sensing parameters were S = 1.39 Hz.s/m, Q = 61, FoM = 0.22 s/m, and LoD = 0.21 m/s. These values should be compared with the corresponding DHR-based results under lossy conditions, for which S = 1.41 Hz.s/m, Q = 189.03, and FoM = 0.71 s/m (Table 3), while the thermoviscous loss analysis gives LoD = 0.18 m/s. This comparison indicates that the raw sensitivity is nearly unchanged, whereas the DHR configuration yields a substantially higher quality factor and figure of merit, together with a modest reduction in the limit of detection. Thus, the main advantage of the DHR design lies in the improved spectral quality and tunability enabled by resonance splitting, rather than in a marked increase in sensitivity itself.
Another important remark is that the provided calculations are based on the assumption of a stationary gas within the structure. The Mach number is significantly less than 0.1, its influence on sound propagation can often be neglected, and the flow velocity did not exceed 10% of sound-speed. At such low values of Mach number, the flow can be considered incompressible, and the influence of fluid motion on sound propagation becomes negligible and can be disregarded.41,42 Nevertheless, practical applications may imply the presence of a grazing flow significantly affecting the transmission properties of Helmholtz resonators.43–45 While it might be expected that the quality factor of the defect mode resonance will be affected by the increase in the Mach number, investigation of the associated change in sensing performance is beyond the scope of the present work.
For the selected optimal configuration (N = 5), the total device length is on the order of several meters (approximately 4.5 m), which is compatible with duct-based sensing implementations. Although this size is larger than that of MEMS-scale devices, it enables operation in the low-frequency range, where acoustic losses are reduced. The proposed structure can be scaled via geometric minimization, thereby shifting the operating range toward higher frequencies. Nonetheless, this scaling must be balanced against the fact that smaller dimensions have higher thermoviscous losses. In comparison to MEMS-based acoustic sensors, the proposed design is simple, passive, and offers high spectral resolution, although at a larger physical scale.
To generalize the discussion, it should be mentioned that DHRs play the role of Bragg mirrors, and, technically, any other elements characterized by the same effective impedance can be used instead, which leaves room for further optimization of the structure. At the same time, the resonances in DHRs and the associated stop bands formed by them can serve as additional features suitable for potential improvement of the sensor. For instance, an additional defect might be introduced to achieve a second defect mode at a different frequency. With two resonances, which are affected by the change in material parameters in a slightly different manner, the selectivity may be improved. However, the development of multi-resonant sensors with a complex response is considered a natural direction for future work.
Conclusion
In conclusion, the design of a gas sensor based on arrays of dual Helmholtz resonators was developed and analyzed using the transfer-matrix and finite-element methods. It is shown that breaking the periodicity of the resonators’ arrangement results in the excitation of a defect mode and the associated occurrence of a high-Q transmission peak within the stop band of the structure. The spectral position of the peak is highly sensitive to the sound speed of the sample, and the frequency resolution in a lossless case is about 1 Hz. As a result, the proposed structure is shown to function as a sound-speed-sensitive passive acoustic sensing platform whose defect-mode response can be calibrated for various hazardous and asphyxiant gases, as well as for representative mixtures with air.
Under a realistic operating scenario that includes thermoviscous losses, the sensing parameters remain reasonable, and good performance is still observed, as demonstrated for the example case of CO2. Specifically, the estimated sensitivity is 1.41 Hz.s/m, while the figure of merit is 0.71 s/m. Accordingly, the present work should be interpreted primarily as a proof-of-concept for calibration-based acoustic sensing, rather than as a complete demonstration of universal gas classification. These results support the potential of DHR-based defective phononic crystals for passive acoustic gas sensing and motivated future experimental validation.
Footnotes
Acknowledgments
This work was partially funded by CNPq (306199/2025-4), by FAPEMIG (PPE-00124-23, APQ-04523-23, APQ-05305-23, RED-00194-23, APQ-03162-24), by the Brasil 6G project (01245.020548/2021-07), supported by RNP and MCTI, and by the project XGM-AFCCT-2024-9-1-1 supported by xGMobile – EMBRAPII-Inatel Competence Center on 5G and 6G Networks, with financial resources from the PPI IoT/Manufatura 4.0 from MCTI grant number 052/2023, signed with EMBRAPII, and by FINEP (n° 1060/2 contract 01.25.0883.00). The work of the author M. Krasikova is supported by the Russian Science Foundation (project 24-21-00275). The author M. Krasikova also thanks Sergey Krasikov for useful comments and suggestions.
Author contributions
M.E.M. analyzed the data, discussed the results, wrote and revised the main manuscript text, and was the team leader. M. K. performed numerical calculations with the FEM, analyzed the data, and wrote the revised manuscript. A.K. supervised this work. F.A.P.F. reviewed the paper, analyzed the data, and discussed the results. All authors contributed to the writing and editing of the final manuscript.
Declaration of conflicting interests
The authors declared no potential conflicts of interest with respect to the research, authorship, and/or publication of this article.
Data Availability Statement
The data that support the findings of this study are available from the corresponding author upon reasonable request.