
Abstract
This study presents a bi-directional building network for regional safety management. In the network, the relationship between the structural responses of multiple buildings in a region is bi-directionally established via long short-term memory (LSTM). To build a network, the buildings’ frequency and time domain response were used to consider the characteristics of buildings. In the model, the structural response of the building, which was assumed to suffer data loss, was intentionally excluded, and the responses of the remaining buildings were set as inputs. The excluded response was set as the output of the model. Even when data loss occurs in any of the target buildings, the model trained using datasets enabled the prediction of lost data using the responses of the remaining buildings. The proposed method was applied to the safety management of a specific region to which multiple buildings were assumed to be adjacent.
Keywords
1. Introduction
Structural health monitoring (SHM) is a technique for measuring structural responses using various sensors and analyzing the measured structural responses to ensure the safety of a structure.1,2 In SHM, vibrations in structures are measured to identify the inherent characteristics of a structure, through which the safety of the structure is assessed.3,4 In addition, structural deformations, such as displacement and deflection, are measured to evaluate the serviceability of the structure.5,6 Particularly, for high-rise buildings, global positioning system (GPS) sensors are installed at the top floor to measure the lateral displacement of the building and assess its safety.7,8 Hence, various types of sensors and technologies to analyze measured structural responses have been developed, where SHM has been emphasized as a realistic and reasonable technology to assess the safety of a building. However, the current SHM technology has its limitations in long-term monitoring for buildings because the lifespan of a sensor is significantly shorter than that of a structure when applied to buildings, civil engineering structures, etc. 9 In addition to sensor failure, other problems with sensors, such as anomaly measurement and data loss, are also considered limitations of the current SHM technology. 10
To overcome the limitations of SHM technology, technologies have been employed to recover and predict structural responses when the measurement of structural responses from sensors cannot be made, or data is lost. In this regard, many related studies have been underway, underlining the value of neural networks with excellent prediction and classification capabilities. Doroudi et al. 11 presented a method for predicting the dynamic structural response of high-rise buildings. To this end, the support vector regression (SVR) model was introduced and utilized to predict dynamic acceleration response. Furthermore, to increase the accuracy of prediction, an optimization algorithm was introduced to present the optimal SVR. The presented method was applied to the dynamic acceleration response of two super-tall buildings: Milad Tower and Canton Tower. On the other hand, Zhou et al. 12 proposed a dynamic structural response prediction method using deep learning and physics estimators for building structures. In addition, a transformer model was constructed using the building structural information and dynamic structural response obtained by entering dynamic load information into a finite element (FE) model. The constructed model was applied to predict the dynamic acceleration, velocity, and displacement responses of the FE model of the building structure. Chen et al. 13 presented a deep learning model with the auto-encoder Koopman operator and the unknown component of the equation of motion (EOM) for a structure combined to predict the dynamic structural response of the structure. In this model, the theorem of dynamics was introduced to allow a time-delay neural network to recover the unknown component of the incomplete equation of motion. Then, the unknown component was searched by the Koopman operation generated using the auto-encoder neural network. Lastly, the dynamic structural response was predicted by time-stepping the EOM. The method presented in this paper corresponds to a model that combines data-driven and theory-based approaches used to predict dynamic acceleration and velocity responses of example structures. Hu et al. 14 suggested a dynamic displacement response prediction technique for building structures under seismic loads. Specifically, they introduced a physics-informed neural network (PINN) with a ground motion (GM) data set as input and a dynamic displacement set as output. To improve the performance of the proposed PINN-based prediction technique, the volume of the training data was increased via data augmentation. The proposed technique was applied to the dynamic displacement prediction of frame structures.
Long short-term memory (LSTM), which has been widely used for time series data estimation, has also been applied to predict the structural response of building structures. Hareendran and Alipour 5 introduced LSTM to predict the wind-induced dynamic structural response of high-rise buildings. In the LSTM, wind load was set as input to predict the dynamic displacement response and wind-induced dynamic acceleration response was set as output. The proposed LSTM-based technique was applied to predict the structural response of a 150-meter-tall building and showed a considerably high level of accuracy. Liao et al. 15 introduced LSTM for predicting the dynamic structural response of linear and non-linear building structures. In the LSTM, ground acceleration was the input, while acceleration, velocity, and displacement were the outputs. To train the LSTM, datasets were created by analyzing numerical models for 60 earthquakes. To compare the prediction performance of LSTM, a recurrent neural network (RNN) was additionally trained and used for comparison. The comparison revealed that for nonlinear structural systems, LSTM showed better prediction performance than RNN. Panfeng et al. 16 proposed an LSTM-based missing data recovery method for large-span spatial structures. To do this, they presented an LSTM-based model in which the same type of structural response is set to input and output based on the correlation between the measured structural responses. The presented LSTM was trained using structural responses measured in a large airport terminal building. The trained LSTM predicted displacement, acceleration, and stress data quite accurately. In addition, the performance of the proposed LSTM-based data recovery method was compared with that of conventional neural networks such as support vector machines and multi-layer perceptrons, and the results confirmed that LSTM exhibited much better prediction performance.
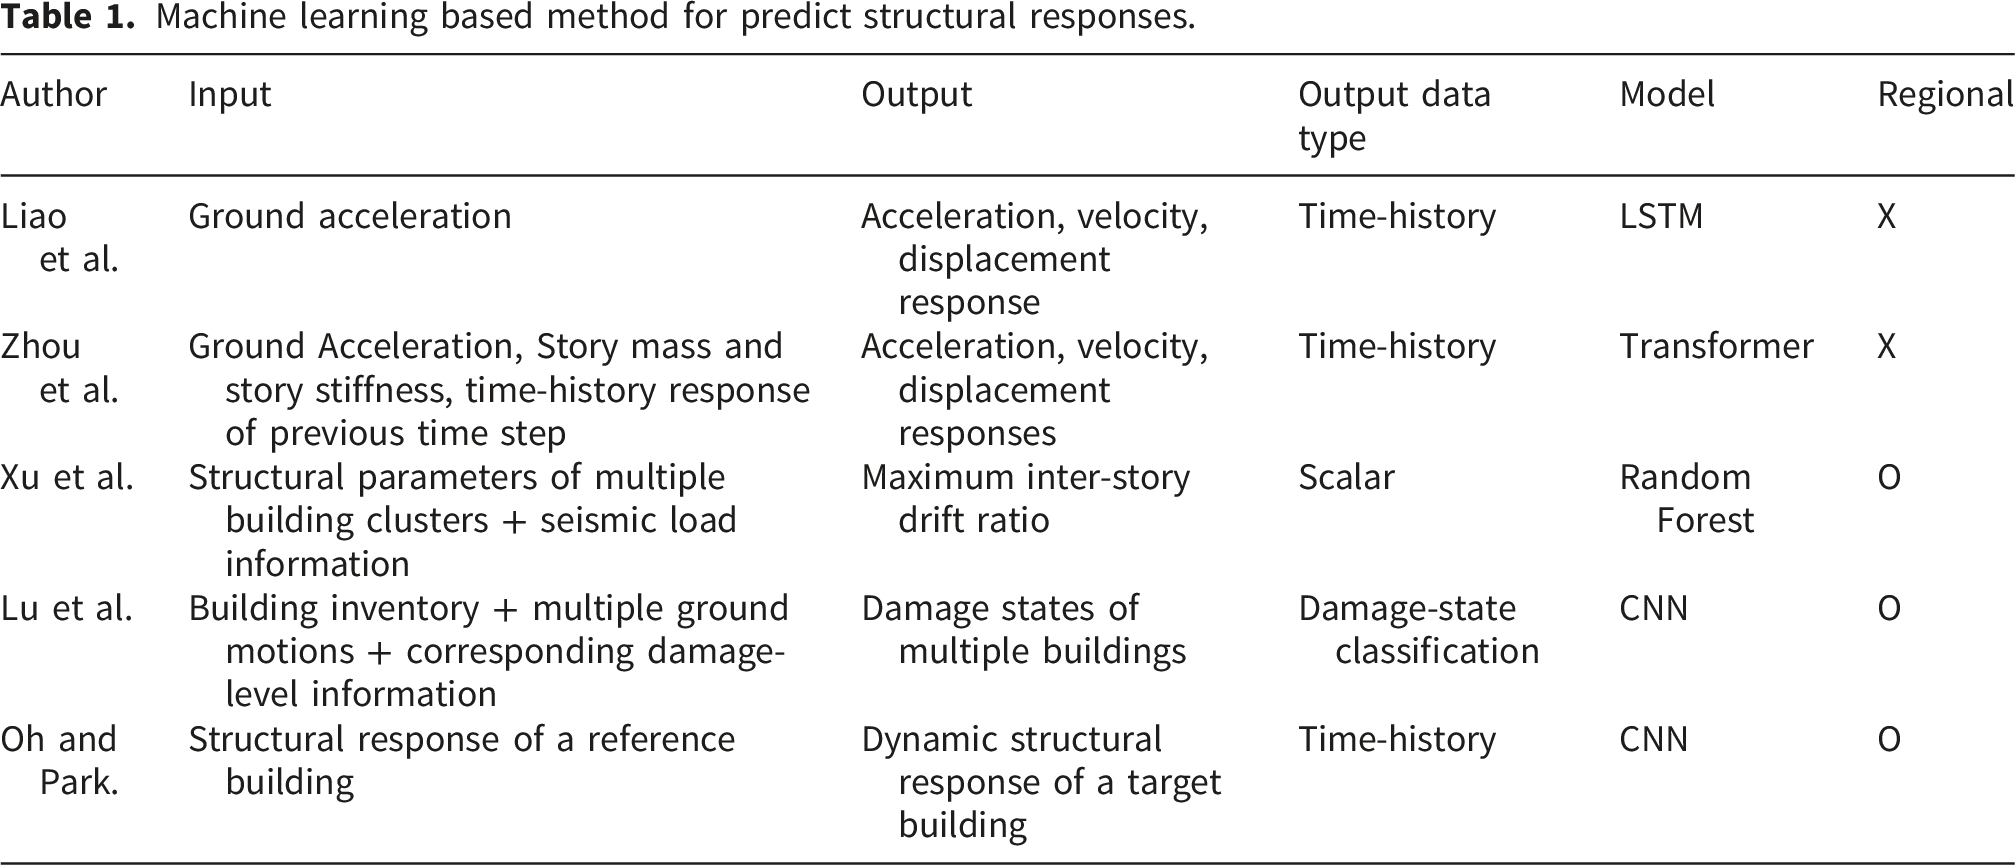
However, the application of the aforementioned neural network-based structural response recovery and prediction techniques has been limited to a single building structure. Recently, methods with the SHM concept extended to include the regional and city scales have been proposed to assess the safety of multiple buildings in a specific region. For instance, Lu et al. 17 promoted a city-scale safety assessment method for multiple buildings in a region. The proposed method based on a convolutional neural network (CNN) built using an inventory of buildings, multiple GM data, and corresponding damage levels predicts the status of multiple buildings in a region during future seismic events. The method aimed to predict the damage state of 619 buildings on a university campus. Xu et al. 18 advocated a regional-scale machine learning method to simultaneously predict the nonlinear seismic response of multiple buildings in a region. To this end, random forest (RF) was introduced as a machine learning technique. For training in RF, a lot of seismic load information and structural parameters of multiple building clusters in a specific region were set as inputs, while structural responses such as maximum inter-story drift ratio were set as outputs. RF trained with 3,798 seismic data and 2,2788 building data in a specific region was implemented to simultaneously predict the structural responses of all buildings. Oh and Park 19 proposed an urban safety network for the safety assessment of multiple buildings in a specific region. The building with a robust SHM system in a specific region was set as a reference building, while the building subject to safety assessment via structural response prediction was set as a target building. The relationship between the structural responses of the reference building and the target building was established by CNN. The training in CNN, training was carried out in one direction from the reference building to the target building. Later, in cases where it is impossible to measure the structural response of the target building, the structural response measured from the reference building is entered into the CNN to predict the dynamic structural response of the target building. However, due to its unidirectional response prediction from the reference building to the target building, this technique poses limitations in that if the sensory system of the reference building fails, or the measurement data is lost, it is impossible to assess the structural safety of not only the reference building but also the target building.
Thus, this study seeks to propose a bi-directional building network capable of assessing the safety of buildings even when the sensing system of any building fails in a region for regional safety management. In the recommended bi-directional building network, the relationship between the structural responses of all buildings in the target region is determined by LSTM. To train LSTM, the time-domain dynamic structural responses of buildings measured under dynamic loading are used with the data converted to the frequency-domain response from the time-domain dynamic structural response. LSTM-based models are presented, which are trained using time and frequency domain data. Then, the time and frequency domain structural responses of target buildings in a region are utilized as input and output, when the structural response of a building, which is assumed to suffer data loss or sensing system failure, is intentionally excluded from the input layer of the LSTM, and only the structural response of the remaining buildings, which are assumed to have no data loss, are set in the input layer. The intentionally excluded structural response is set to the output layer of LSTM. Rather than considering only the data loss of a specific building, the possibility of data loss for all target buildings is taken into account to create datasets for the number of target buildings subjected to a single dynamic load with a specific length, which is then used for training LSTM. The trained LSTM-based model can predict the structural response of a building in which data loss occurs based on the structural responses of other buildings, regardless of the data loss of any building in a region. This method enables the establishment of a bi-directional building network between buildings in a region to ensure regional safety management. The study’s suggested method was applied to predict the dynamic structural response of example buildings in a region where multiple buildings are assumed to exist. In the application process, the model’s validity was examined using time-domain and frequency-domain data, along with the prediction performance due to changes in LSTM network configuration even when frequency-domain data are used together. In addition, the applicability of the proposed model due to an increase in the number of target buildings in a region was confirmed. Furthermore, the prediction performance due to an increase in the number of buildings where data loss occurs was comprehensively analyzed.
2. Methodology
2.1. Overall concept of bi-directional building networks for regional safety management
This study presents a bi-directional building network for regional safety management. In relation to the concept of building safety management, it seeks to expand the target of SHM to a region by utilizing multiple buildings in a region rather than focusing on a single building in the existing SHM. The proposed network intends to address problems with sensors installed in buildings, such as sensor failure and data loss, which are considered one of the limitations of the current SHM technology. The core concept of this study is to predict the structural response of buildings from which structural response cannot be obtained due to an SHM system failure as the structural response obtained from adjacent buildings is applied to the bi-directional building network when the SHM system of specific buildings fails in a region. Buildings in a region respond with different characteristics to dynamic loads such as earthquakes. As each building has its inherent frequency characteristic, it responds differently to earthquakes depending on the characteristics of the earthquake in the frequency domain. Also, adjacent buildings in a region will respond in different ways subject to the same load. Therefore, the recovered structural responses should not only approximate the missing signals numerically, but also remain consistent with the fundamental dynamic characteristics of the structure, such as dominant frequency content and the associated response amplitude observed in the frequency domain. In this study, this aspect was considered by training the LSTM model using both time-domain structural responses and FDD-based frequency-domain features, so that inter-building correlations could be learned together with building-specific dynamic characteristics. If these response characteristics are trained using neural networks such as LSTM to build the network, the SHM system will be able to predict the lost structural response of a building using the structural response measured from adjacent buildings when a new earthquake occurs. Hence, this research method’s primary contribution is to build a network capable of predicting structural responses bi-directionally between buildings in response to situations where it is not known in which building the SHM system failure occurs. Here, bi-directional prediction refers to an operational response-recovery setting in which any building in the regional network can alternately become the missing-response target through repeated exclusion-based training scenarios, rather than to a physical or causal bidirectional mechanism between buildings. That is, if the network is set up so that the structural responses of buildings can be predicted from each other, the neighborhood buildings will help predict the structural response of any building in which the SHM system fails.
Structural responses of multiple buildings in a region to dynamic loads are needed to build a bi-directional building network. Therefore, in this study, it is assumed that SHM systems should be installed in buildings that are subject to regional safety management. To build a network, structural responses are measured from multiple buildings in a region when dynamic loading occurs. The measured time-domain structural responses and the responses converted to frequency-domain data of these structural responses are used together to train the LSTM model for building the network. The combined use of time-domain and frequency-domain information was intended not only to improve prediction accuracy, but also to help the recovered responses preserve physically meaningful dynamic characteristics of each building. Whenever the buildings are subjected to dynamic loads, the measured time-history structural responses and the extracted frequency-domain data are stored and used to train the LSTM model. The LSTM model trained in this way is called a bi-directional building network in this study. To predict the structural response of a building in which an SHM system fails when new dynamic loading occurs in the future, data measured from adjacent buildings are entered into the trained LSTM-based bi-directional building network to predict the structural response of the building where the SHM system failure occurs. On this basis, the safety of buildings in a region is assessed to promote regional safety management. Figure 1 explains the overall concept of the proposed research method. Overall concept of the presented method.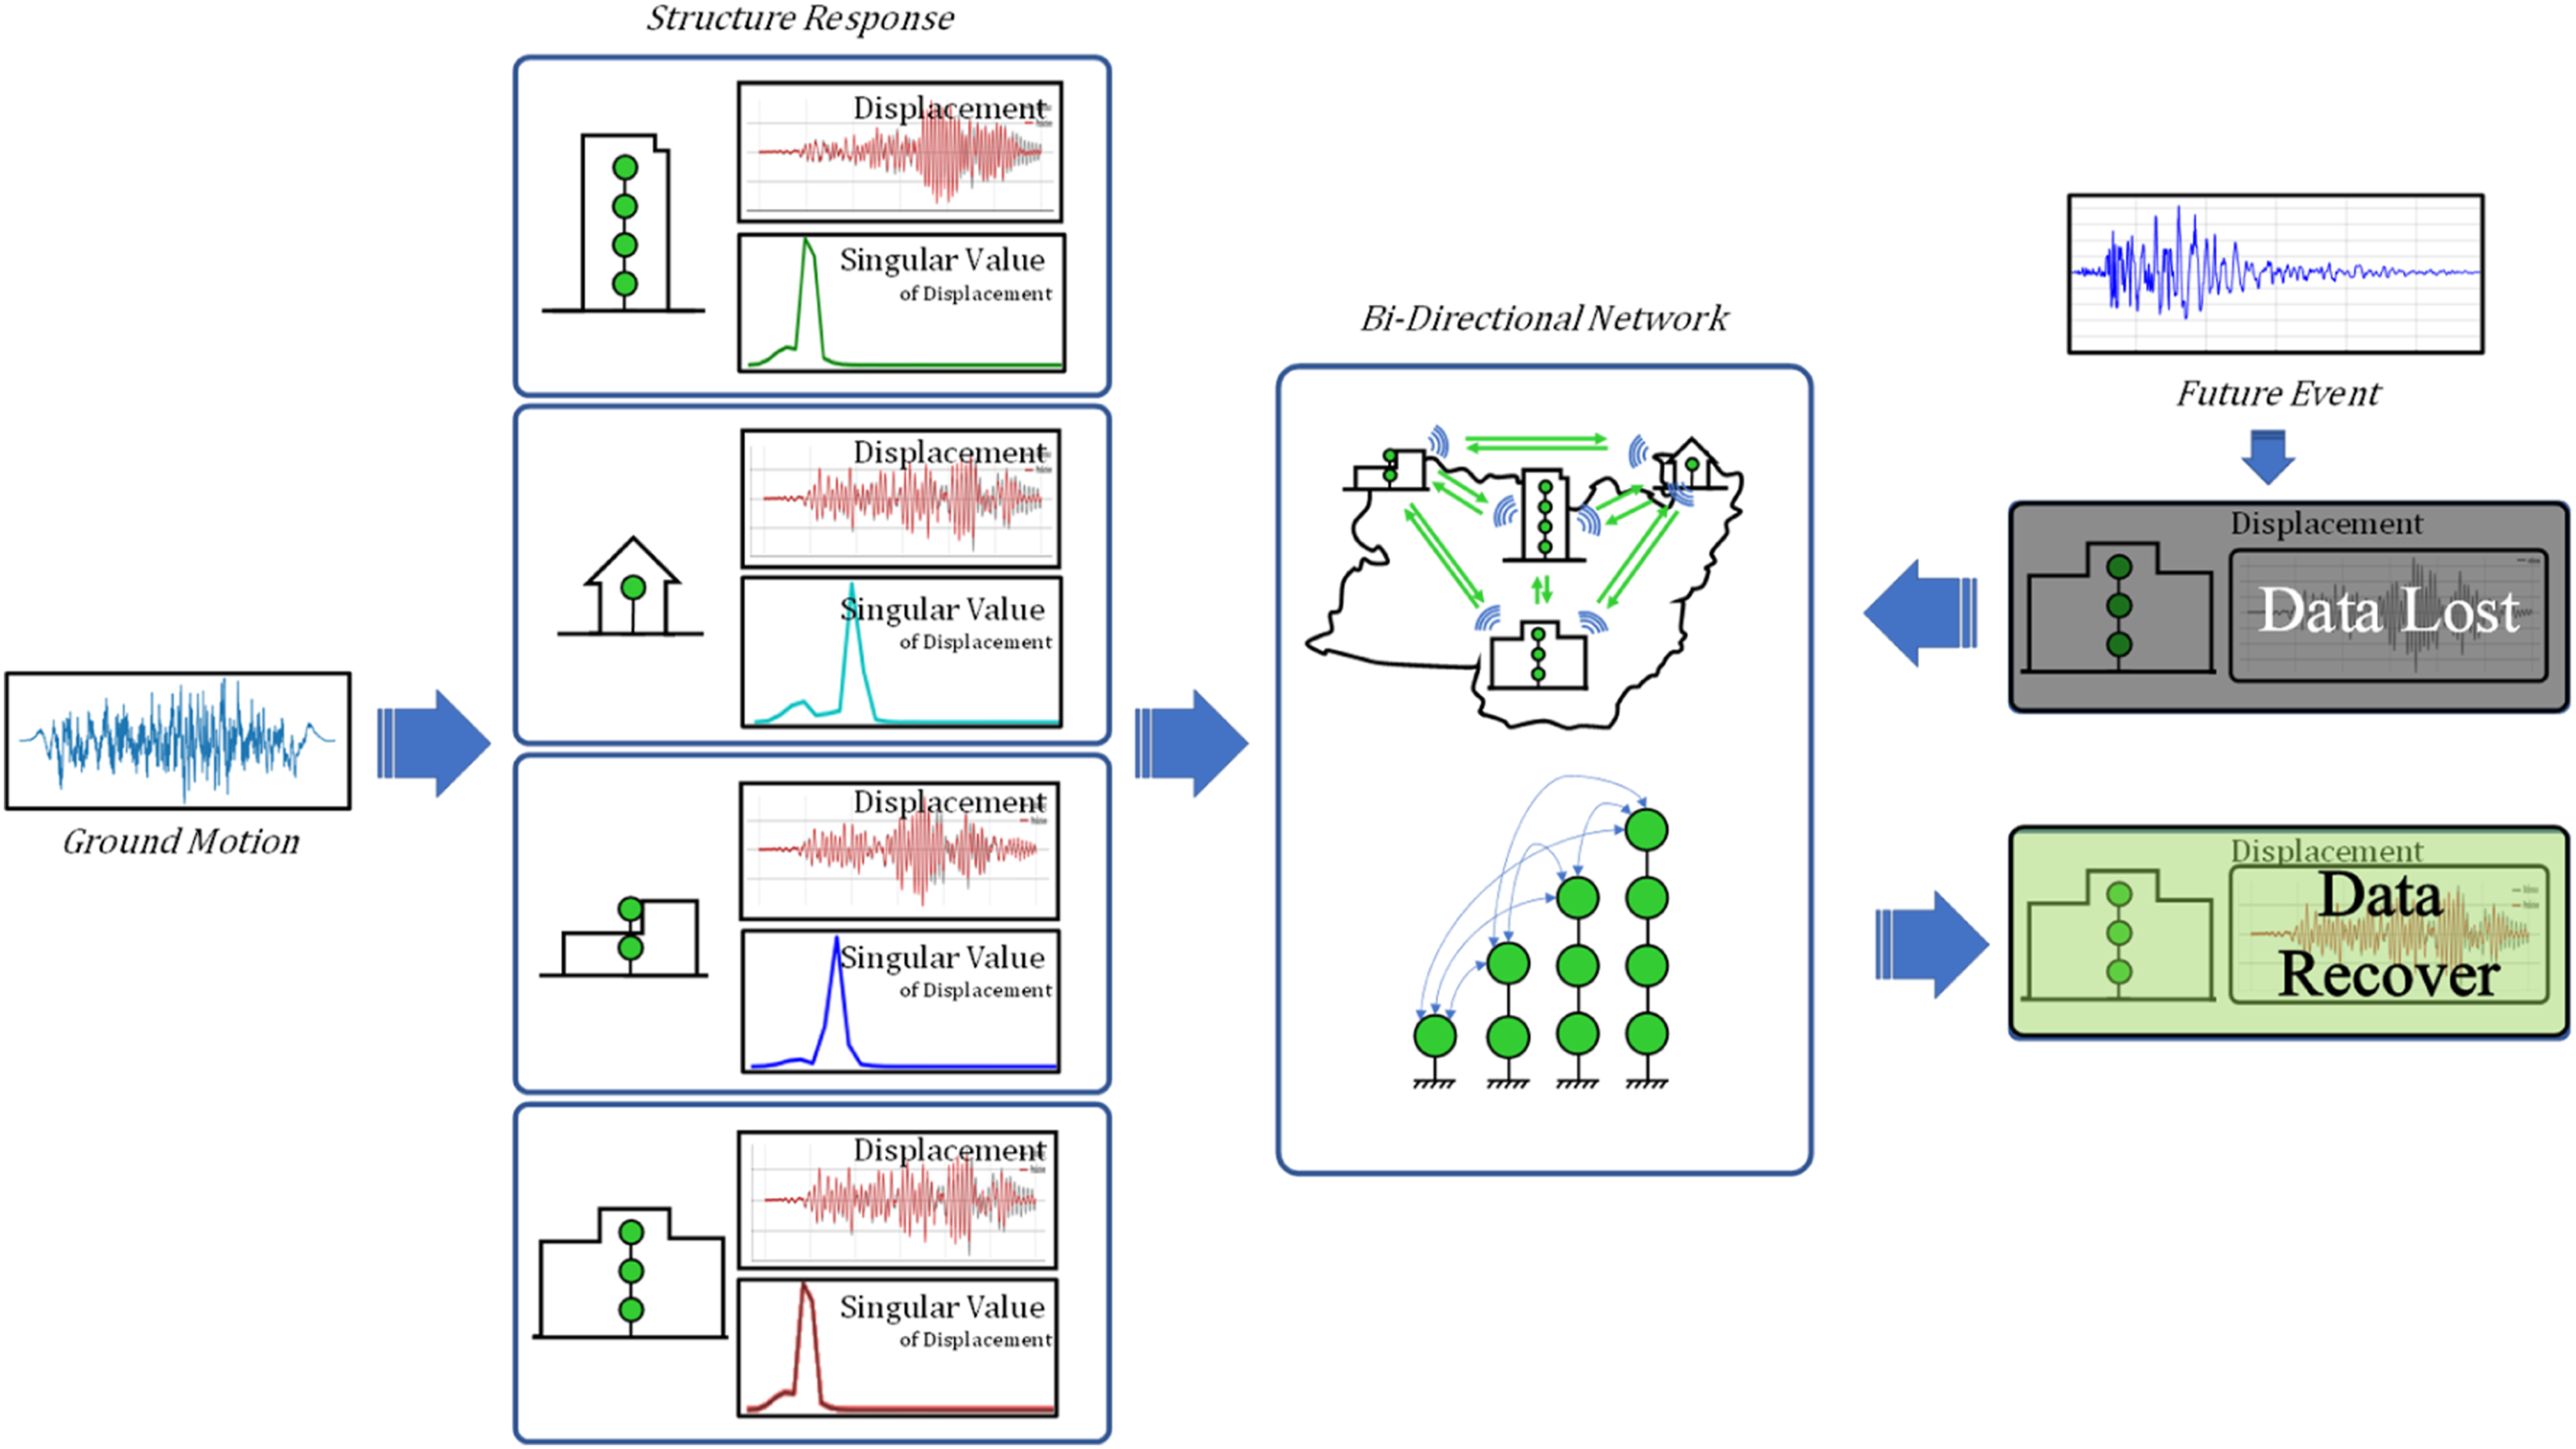
2.2. Descriptions of LSTM-based prediction models
This study presented three LSTM-based models to build a bi-directional building network. Another contribution of this study is that the network is built using both time domain data and frequency domain data. Many response prediction models using only time domain data have been developed in previous SHM-related studies. Therefore, it is necessary to investigate whether it is effective to use frequency domain data and time domain data for building a network. Accordingly, a model using only time domain data as input information for LSTM is presented, as emphasized in Figure 2(a). Let LSTM models: (a) Model 1, (b) Model 2, and (c) Model 3.
Figure 2(b) shows the second model (i.e., Model 2) with frequency domain data converted from time domain structural response used together. Where the
Model 3 in Figure 2(c) is also a network using time and frequency domain data, but it is different from Model 2 in that all data are trained via a single LSTM. As underscored in Figure 2(c), which simulates a network for four buildings, eight channels are configured, and data is entered into the LSTM. Half of the channels are for the time series data, and the other half are for the FDD data. Because the data length within the channel must be the same, the latter half of the frequency domain data are padded with zeros, and the same length is entered for eight channels. The input data are trained via LSTM, and the final output value is then derived. The dataset configuration method and network configuration are the same as the other models. Model 2 and Model 3 were built to examine how the response prediction performance varies depending on the different LSTM configurations, even though the two models utilize time domain and frequency domain data in the same manner, and ultimately to find a better model. In this study, the frequency-domain data obtained through FDD were not used simply as an additional representation of the same signal, but as complementary features describing how response amplitude is distributed over the frequency range. These spectral amplitude patterns reflect building-specific dynamic characteristics, such as dominant frequency content and resonance-related response concentration, which are not explicitly separable from the time-history response alone. Therefore, combining time-domain displacement histories with FDD-based frequency-domain data enables the model to learn both the time-history characteristics of structural responses and the spectral characteristics associated with inherent structural properties. This is the main rationale for the data fusion strategy adopted in Models 2 and 3.
Machine learning based method for predict structural responses.
3. Applications
3.1. Descriptions of bi-direction building network for example structures
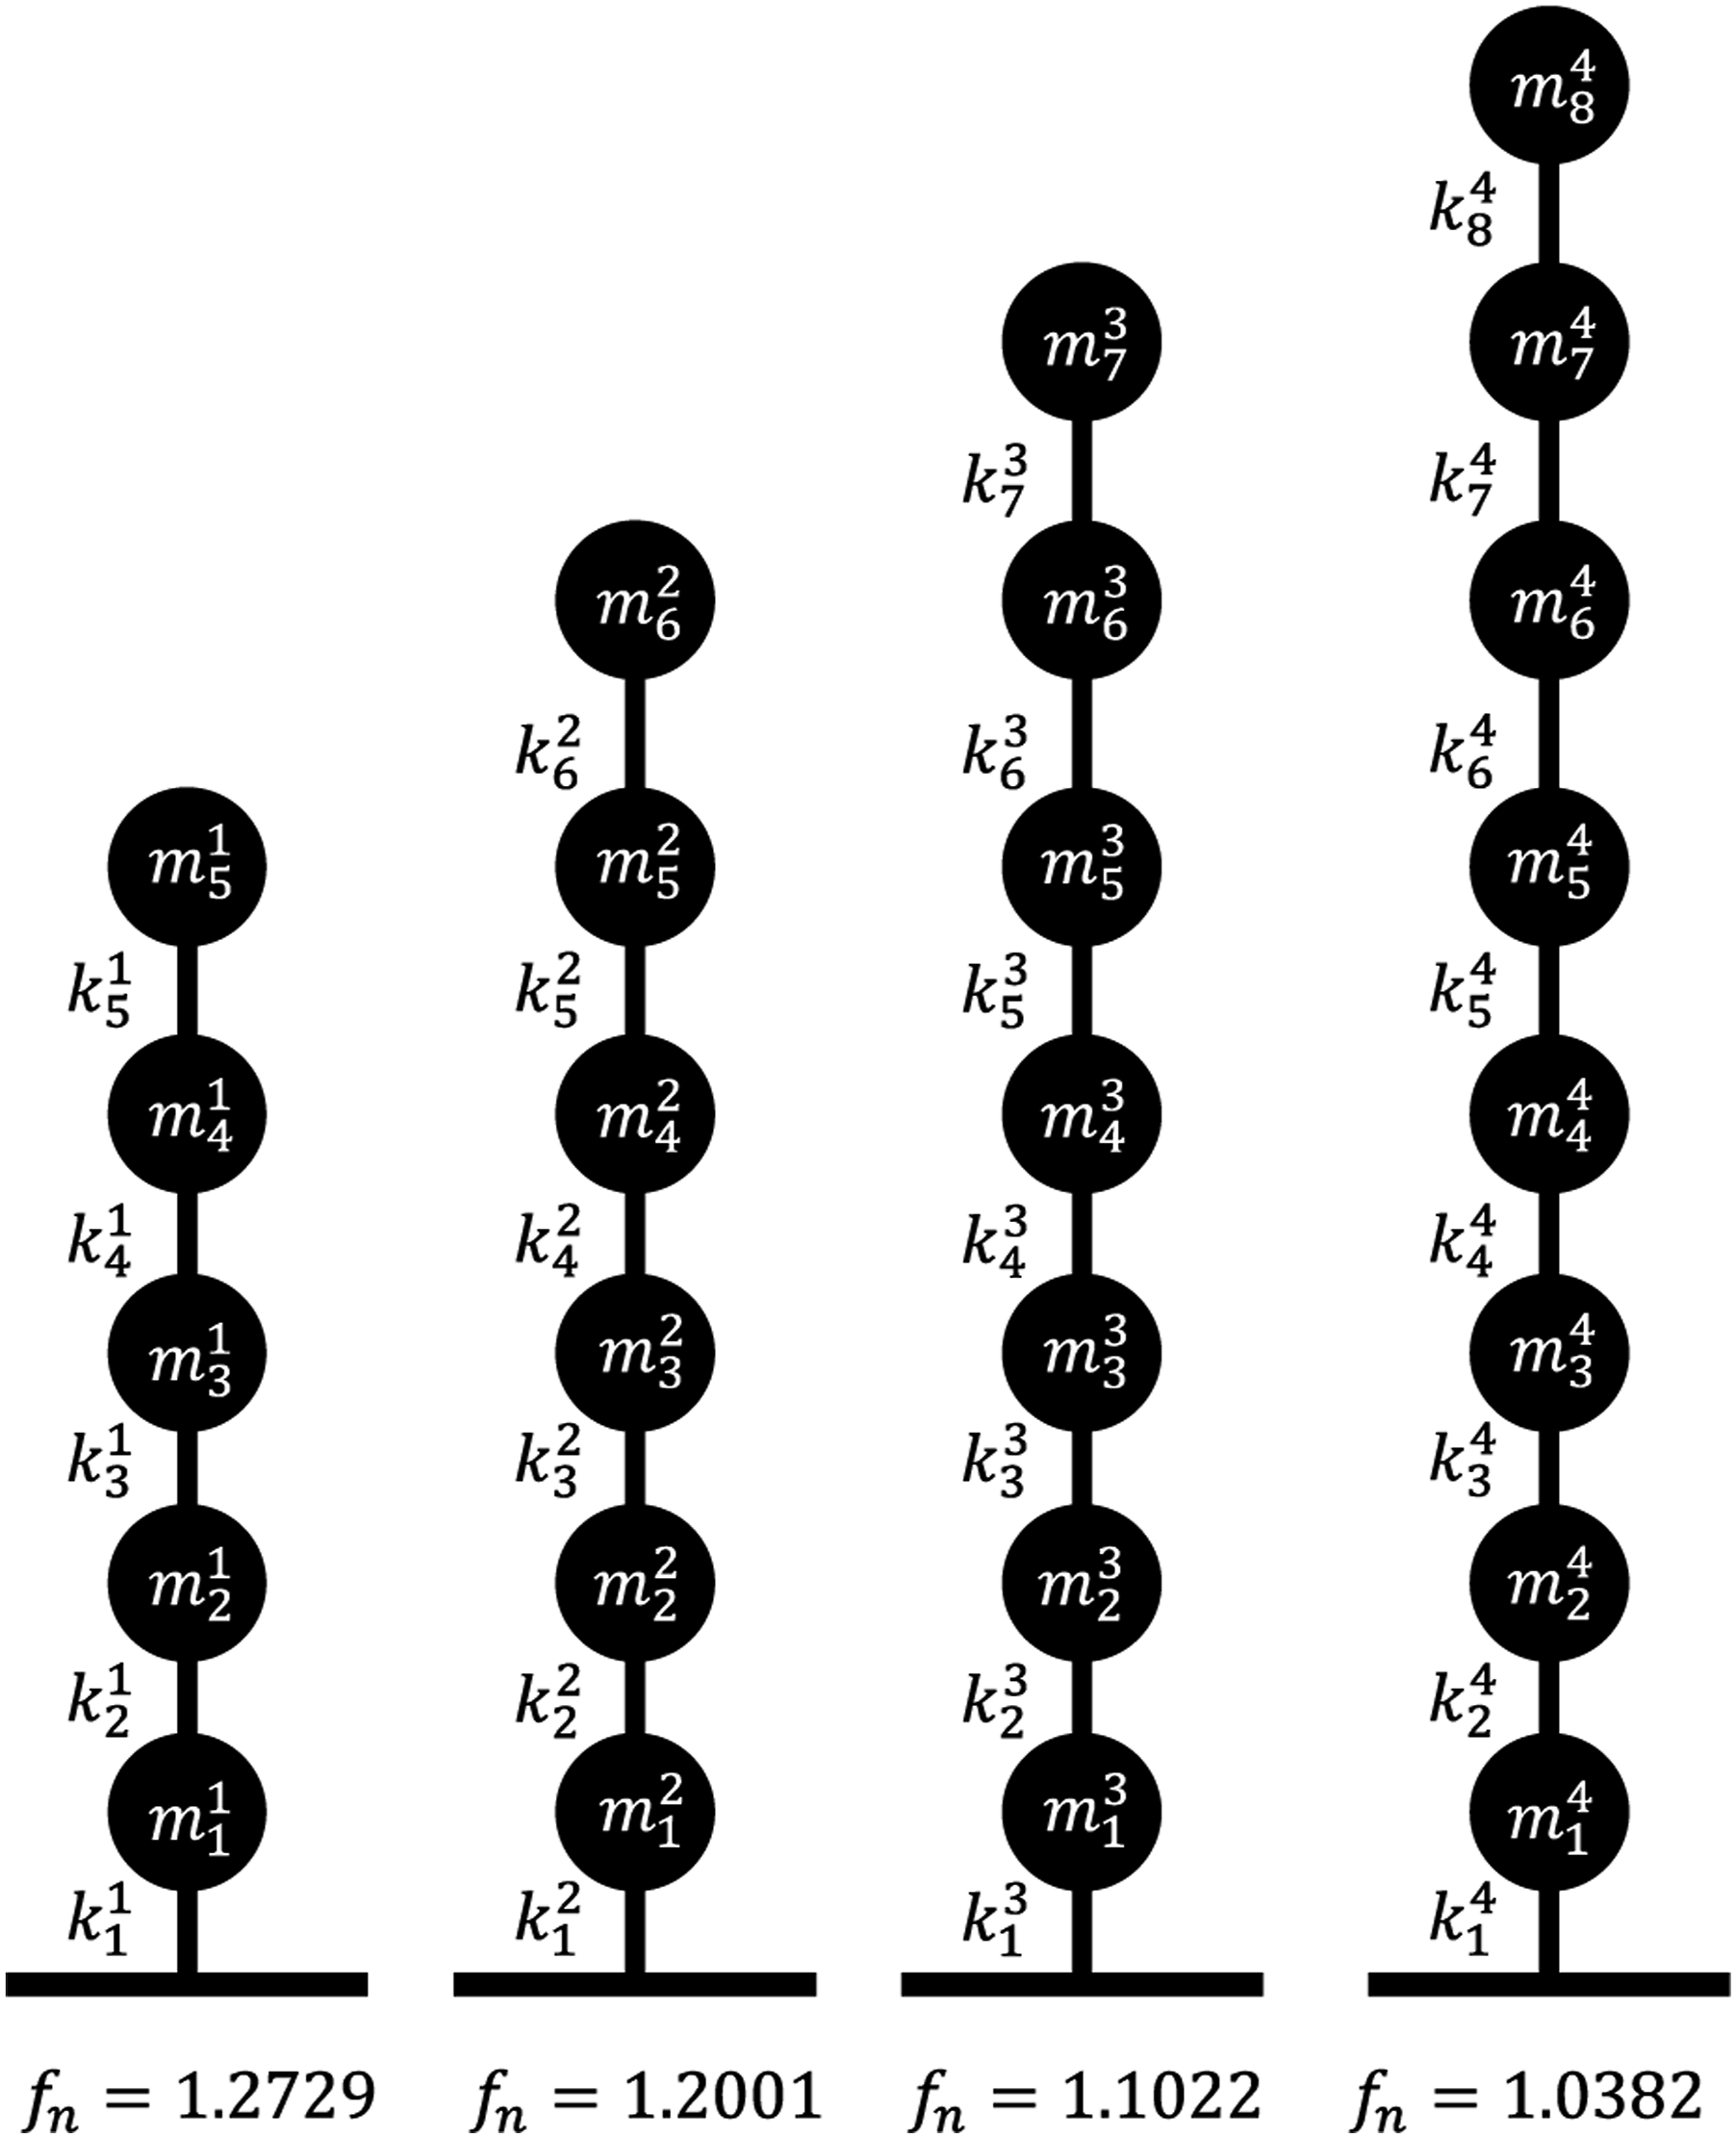
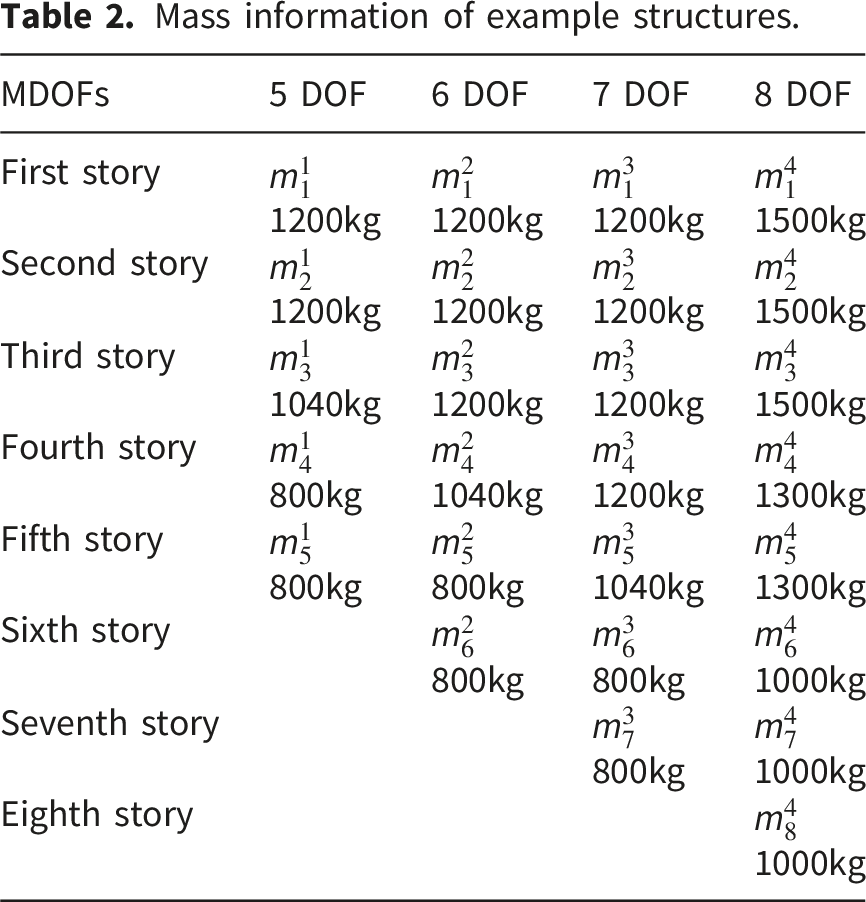
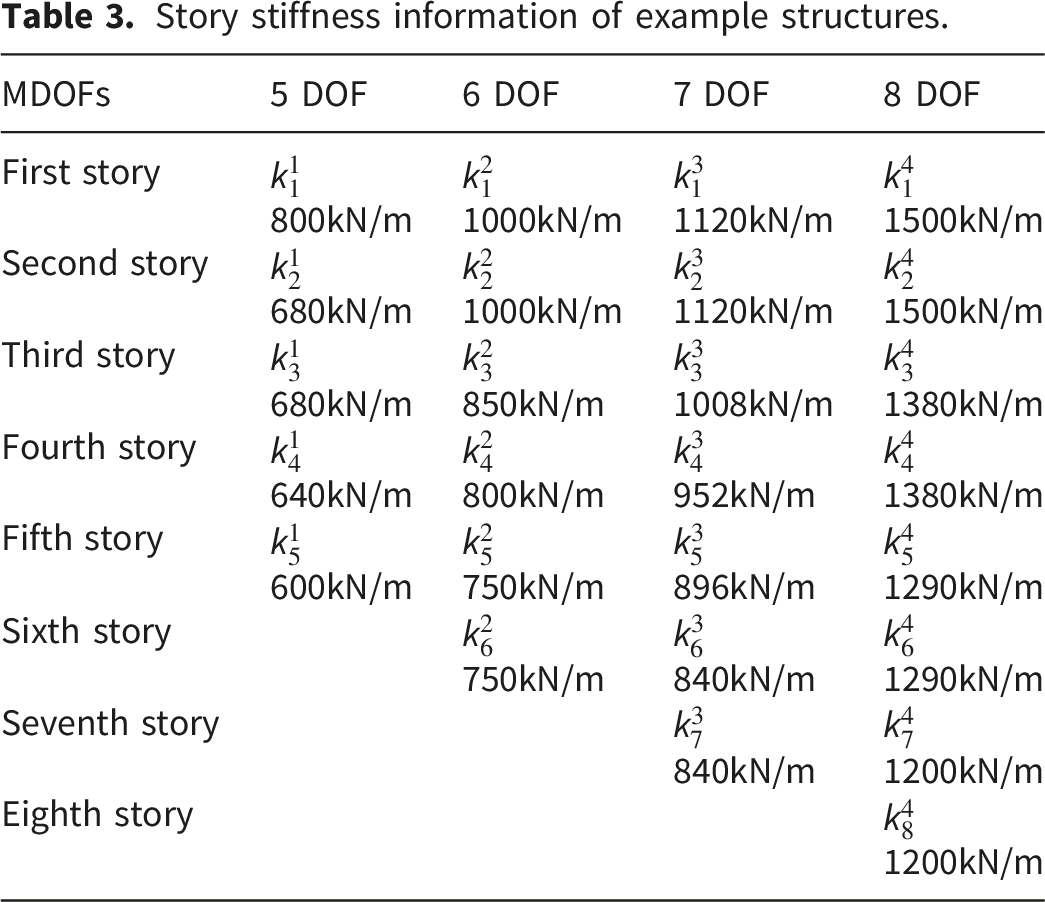
Four example structures assumed to be within the region illustrated in Figure 3 are presented in Figure 4. The buildings are represented as multi-degree of freedom (MDOF) structures using lumped mass and story stiffness as many as the number of degrees of freedom. From the left side of Figure 4, MDOFs with 5 to 8 degrees of freedom are shown. All these structures have different natural frequencies. The Bi-directional building networks using the four example structures. Example structures in a region. Mass information of example structures. Story stiffness information of example structures.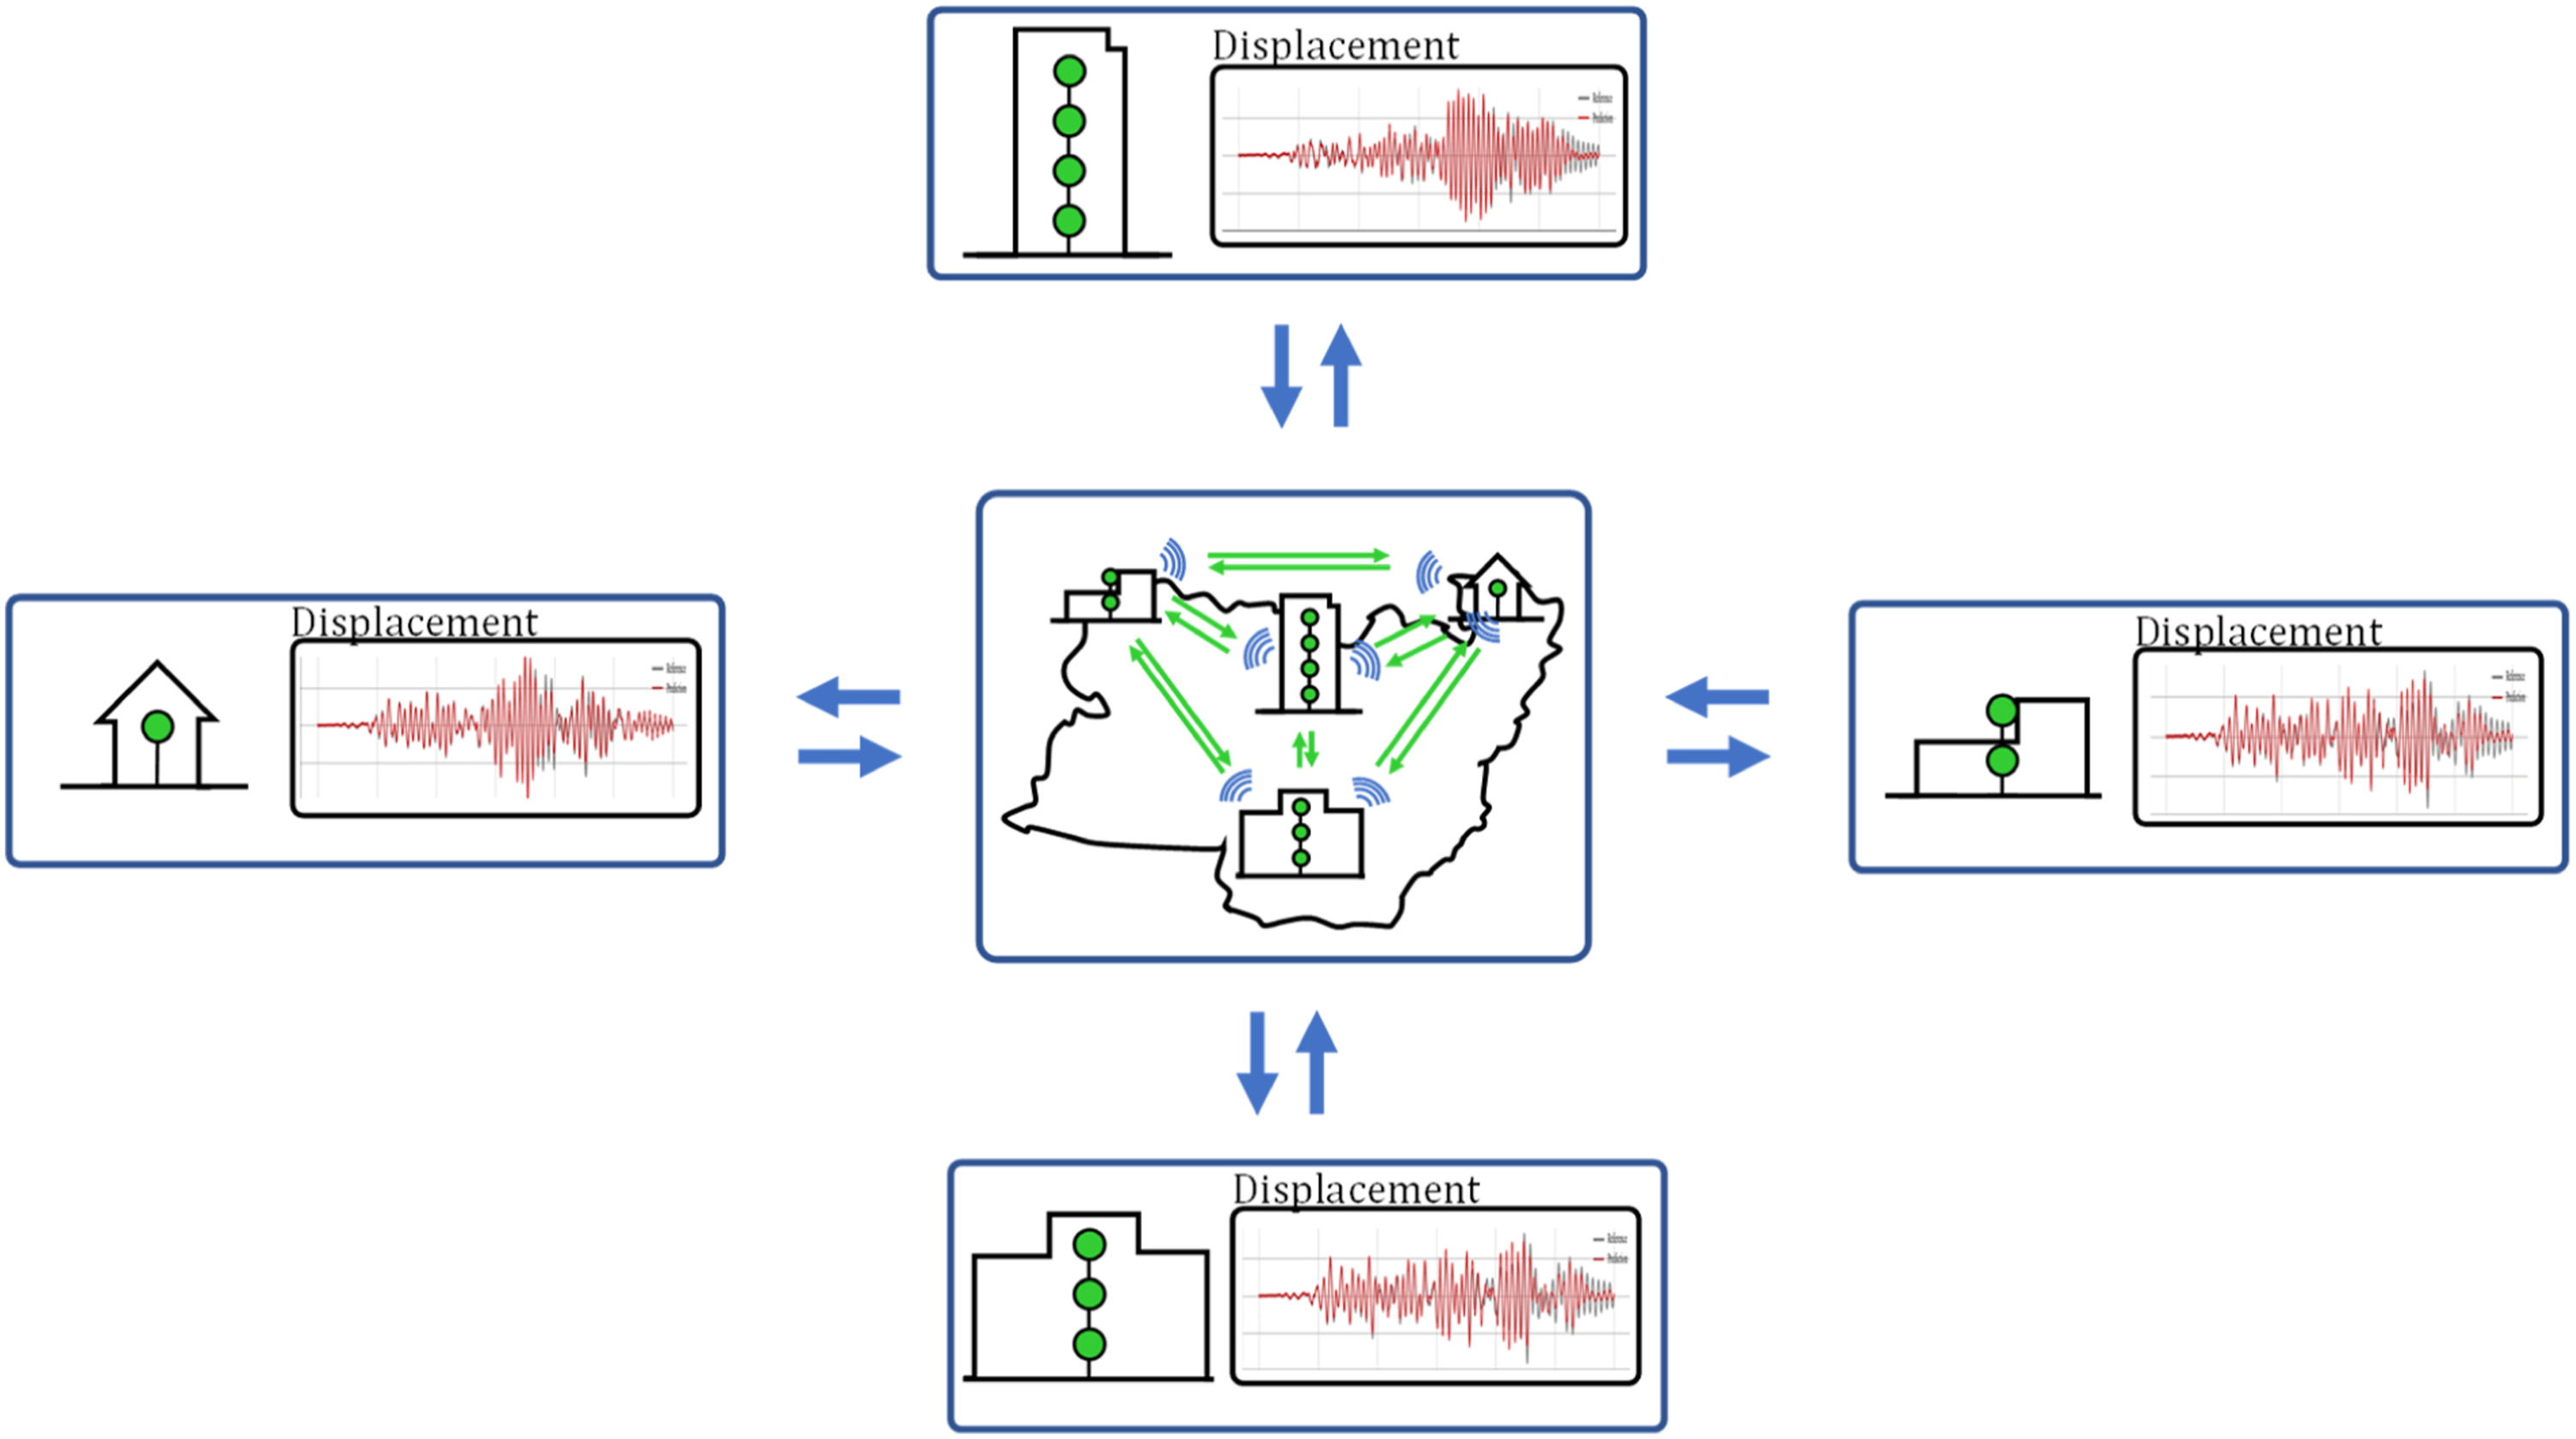
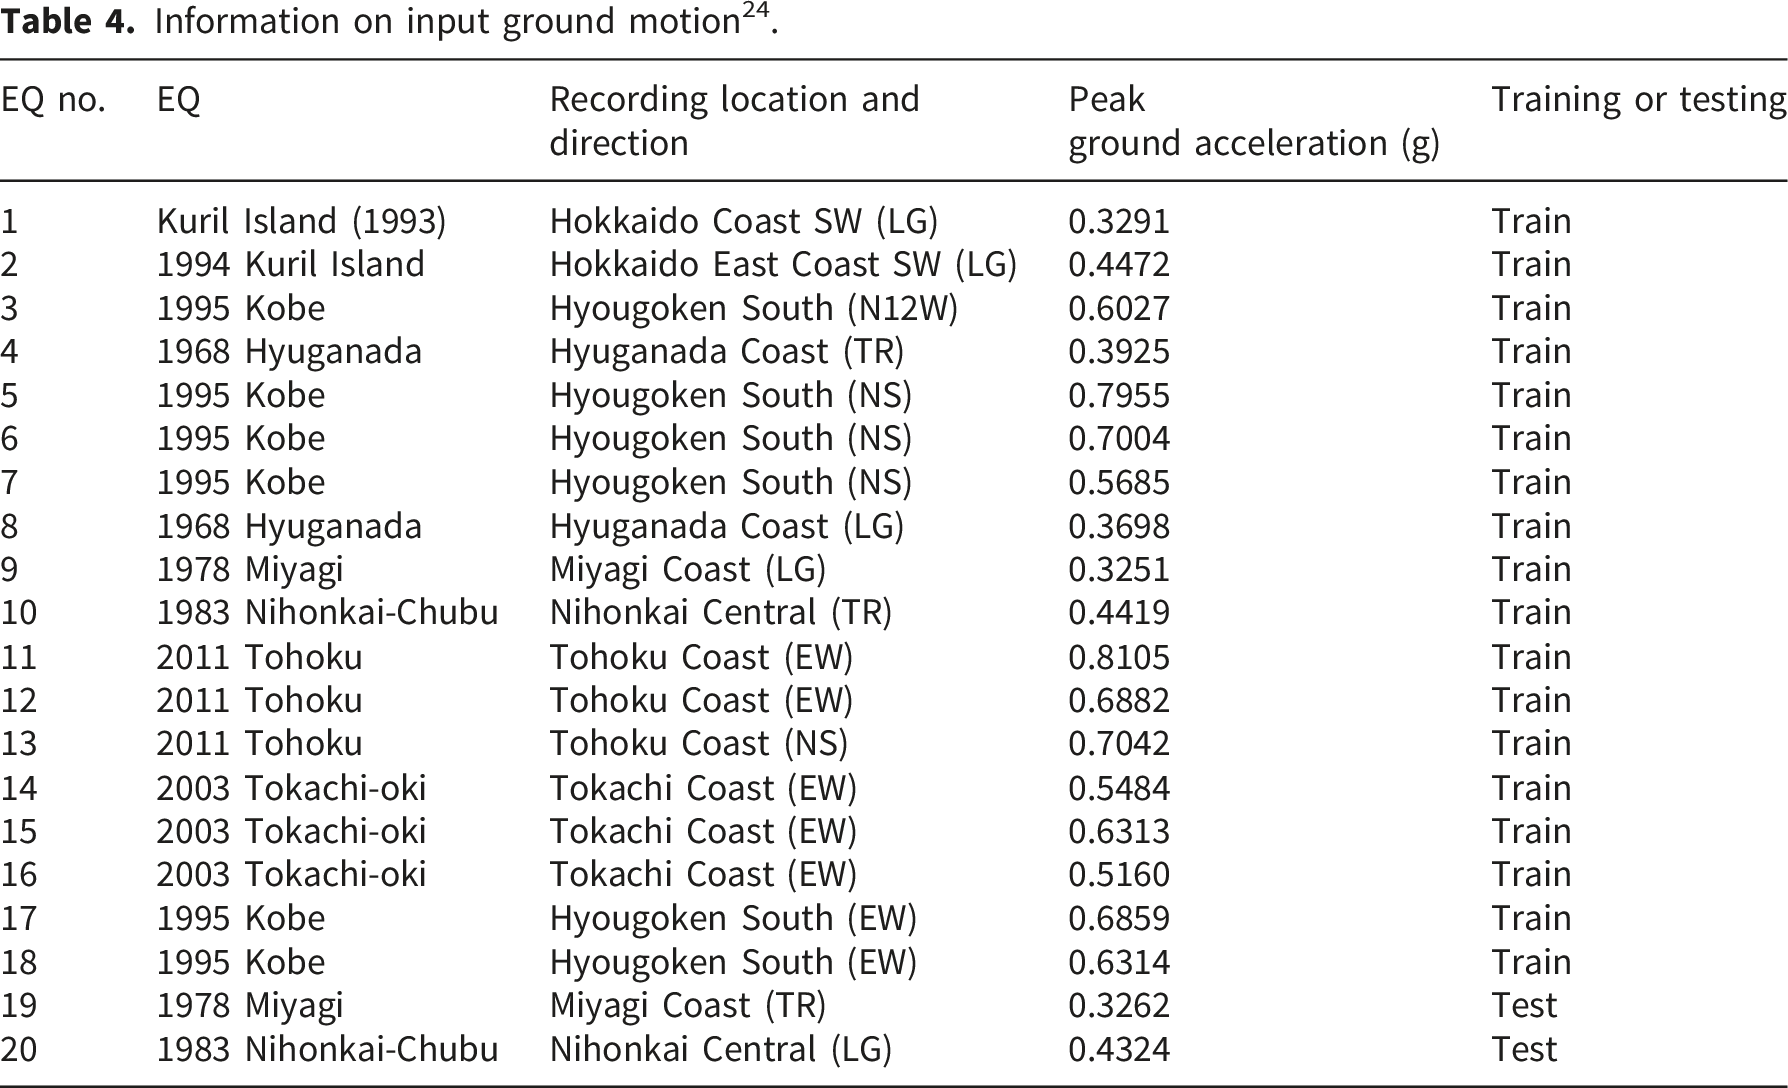
Information on input ground motion 24 .
3.2. Prediction results
3.2.1. Prediction results of LSTM-based models for four building structures
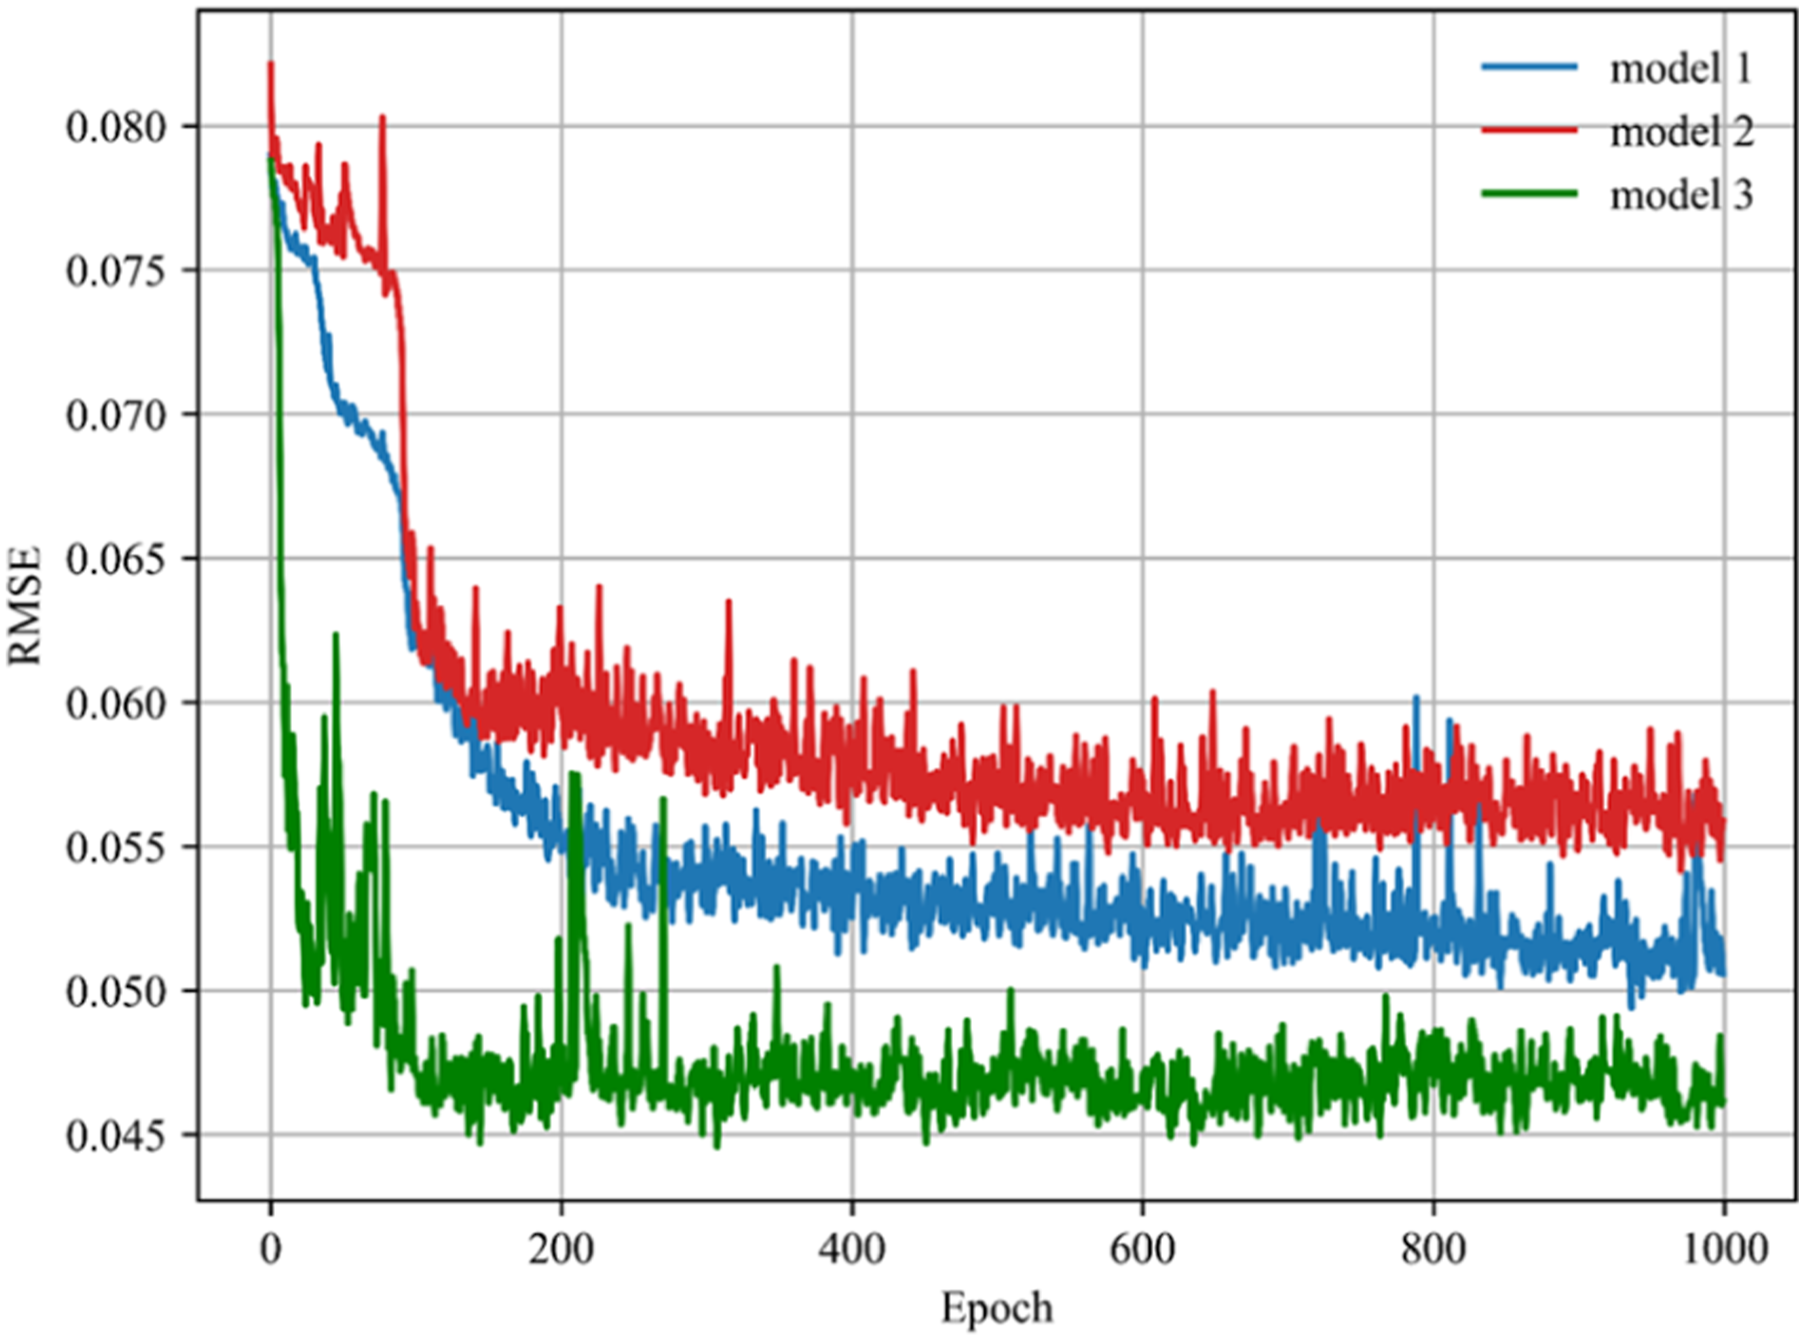
The three LSTM-based models were trained using the datasets created by the method described in Section 3.1. However, when the models were retrained even under the same conditions, different prediction results were derived for the test datasets. Each model was trained eight times under the same conditions. And the training results are displayed in the form of root mean square error (RMSE), as drawn in Figure 5. All three models displayed excellent prediction performance in all cases, but none of the three models derived the same prediction results from each training. The transparent dots in Figure 5 represent the RMSE values for the test datasets obtained via eight rounds of the training process. The RMSE values given in Figure 5 signify the median values of RMSE obtained via eight training sessions. The reason for differences in the prediction results obtained from each training session is that the data input for training is automatically shuffled at every epoch. As in this study, where time series data or a time sequence is crucial, automatic data shuffling leads to different training results. Therefore, in this study, training was done via shuffle fixed to a specific seed value, through which it was possible to reproduce the same prediction results when training was repeated under the same conditions. Figure 6 shows the RMSE values for the datasets of the three models at each epoch with a fixed shuffle. The findings infer that all three models have converged in a stable status while training. The red dots in Figure 5 indicate the RMSE values for the test datasets of the model trained by shuffling with fixed seeds. Model 3 exhibited the most excellent prediction performance. Prediction performances of the presented three LSTM models. Loss functions in the training of the presented three LSTM models.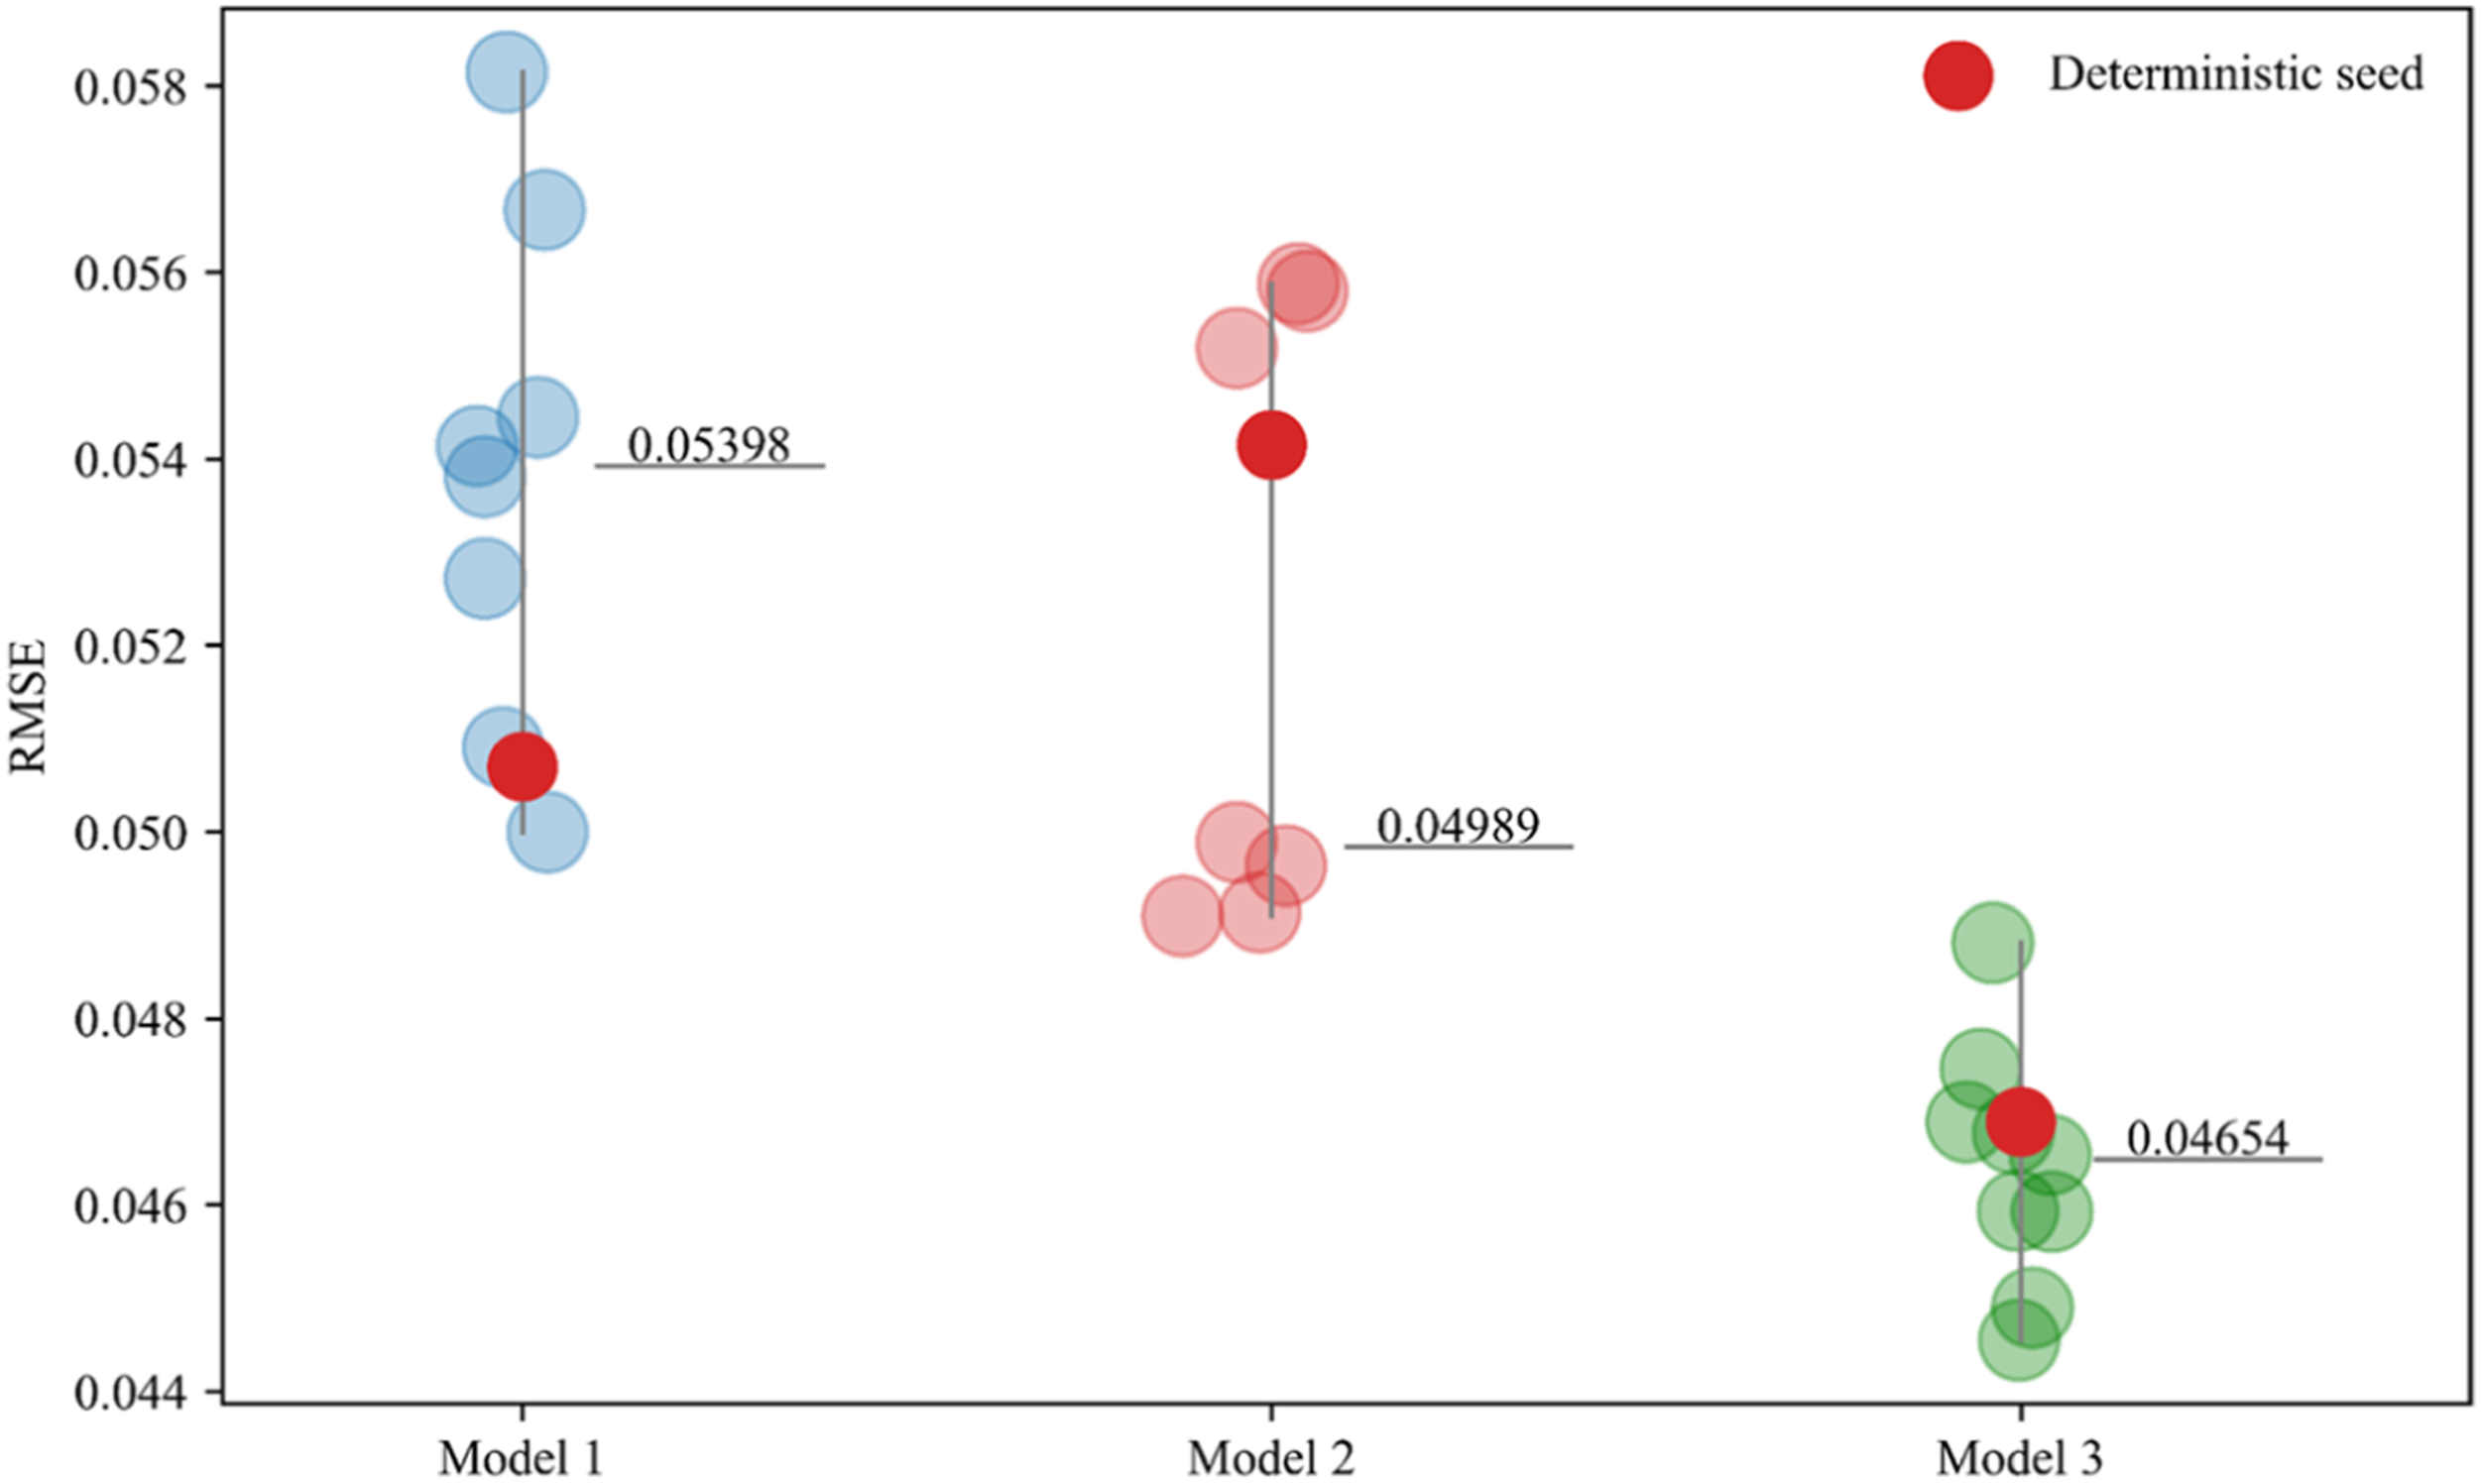
The three trained models demonstrated fairly accurate results when predicting the time series response to the test earthquakes. Figure 7 points out the time series response prediction results for the 5 DOF, one of the four example structures when data loss occurred in the 5 DOF. As with the previous results, Model 3 predicted the time series data most accurately. On the other hand, Models 1 and 2 predicted the period of response to some extent but showed some differences in terms of amplitude. Comparing Model 1 and Model 3 clarified that the response of a building in which data loss occurred was best predicted when the frequency domain response was used together with the time domain response. Additionally, Model 2 and Model 3 differed in accuracy even though they utilized the same frequency domain data. This suggests that the LSTM model needs to be properly configured when the frequency domain response is used. Also, better predictions can be made when the time and frequency domain data are configured as different channels and entered into a single LSTM, as in Model 3. The comparison between Model 1 and Model 3 provides important insight into the role of the frequency-amplitude correlation in response recovery. Model 1, which uses only time-domain displacement responses, was able to reproduce the response period to some extent, but discrepancies remained in amplitude. By contrast, Model 3, which additionally used FDD-based frequency-domain features, more accurately reproduced both the temporal pattern and the response amplitude. This indicates that the frequency-domain information helped the LSTM capture how structural response amplitude is distributed around dominant frequency components, thereby improving its ability to represent building-specific dynamic behavior. In this sense, the frequency-amplitude correlation served as physically meaningful complementary information that strengthened the prediction capability of the proposed bi-directional building network. Prediction results for the time series of displacement by the three LSTM models: (a) for EQ no.19 and (b) for EQ no. 20.
To provide a more meaningful engineering interpretation of the prediction results, additional normalized error measures were also examined. In particular, the normalized RMSE was used to evaluate the overall time-history prediction accuracy, while the absolute percentage error of the peak displacement was used to assess the prediction accuracy of the maximum response. The results showed that Model 3 yielded the lowest NRMSE values, reaching 8.5% and 5.9% under EQ No. 19 and EQ No. 20, respectively, indicating that the use of both time-domain and frequency-domain information improved the reconstruction of the overall response pattern. In terms of the maximum response, the absolute percentage error ranged from 12.53% to 23.93% under EQ No. 19 across the three models. Under the more challenging EQ No. 20 case, Model 3 reduced the peak response error to 37.64%, compared with 72.33% in the less accurate models. However, the error in the peak response remained relatively larger than the error in the overall time-history response, especially in the more challenging test case. This implies that, although the proposed framework is effective for simulation-based response recovery, further improvement is needed before the predictions can be directly used for engineering decision-making based on peak seismic demand.
When creating datasets, the amount of overlapping data in time series data was changed to train Model 3 with increased data. The number of datasets described above is 30040, with 20 data overlapped. The amount of overlapped data was changed to 15 (45060 datasets), 10 (60080 datasets), and 5 (120160 datasets), thus creating four dataset cases. Figure 8(a) reports the results of the Model 3 trained using four datasets. In all cases, Model 3 was trained stably, exhibiting fairly accurate prediction results. In terms of accuracy represented as RMSE, each case demonstrated a very slight difference. Then, 30040 datasets, 45060 datasets, 60080 datasets, and 120160 datasets resulted in RMSE values of 0.0469, 0.0468, 0.0446, and 0.0472, respectively. The training results also verified that an increase in the number of datasets does not always improve the prediction performance of the LSTM-based model 3. Figure 8(b) graphs the epochs per dataset for each case. The figure reveals that in the cases where the number of datasets increased significantly (60080 datasets and 120160 datasets), the number of epochs was greatly reduced at the termination of training. Influence of variations in the number of datasets on the training of Model 3: (a) training results and (b) comparison of epoch in the termination of the training.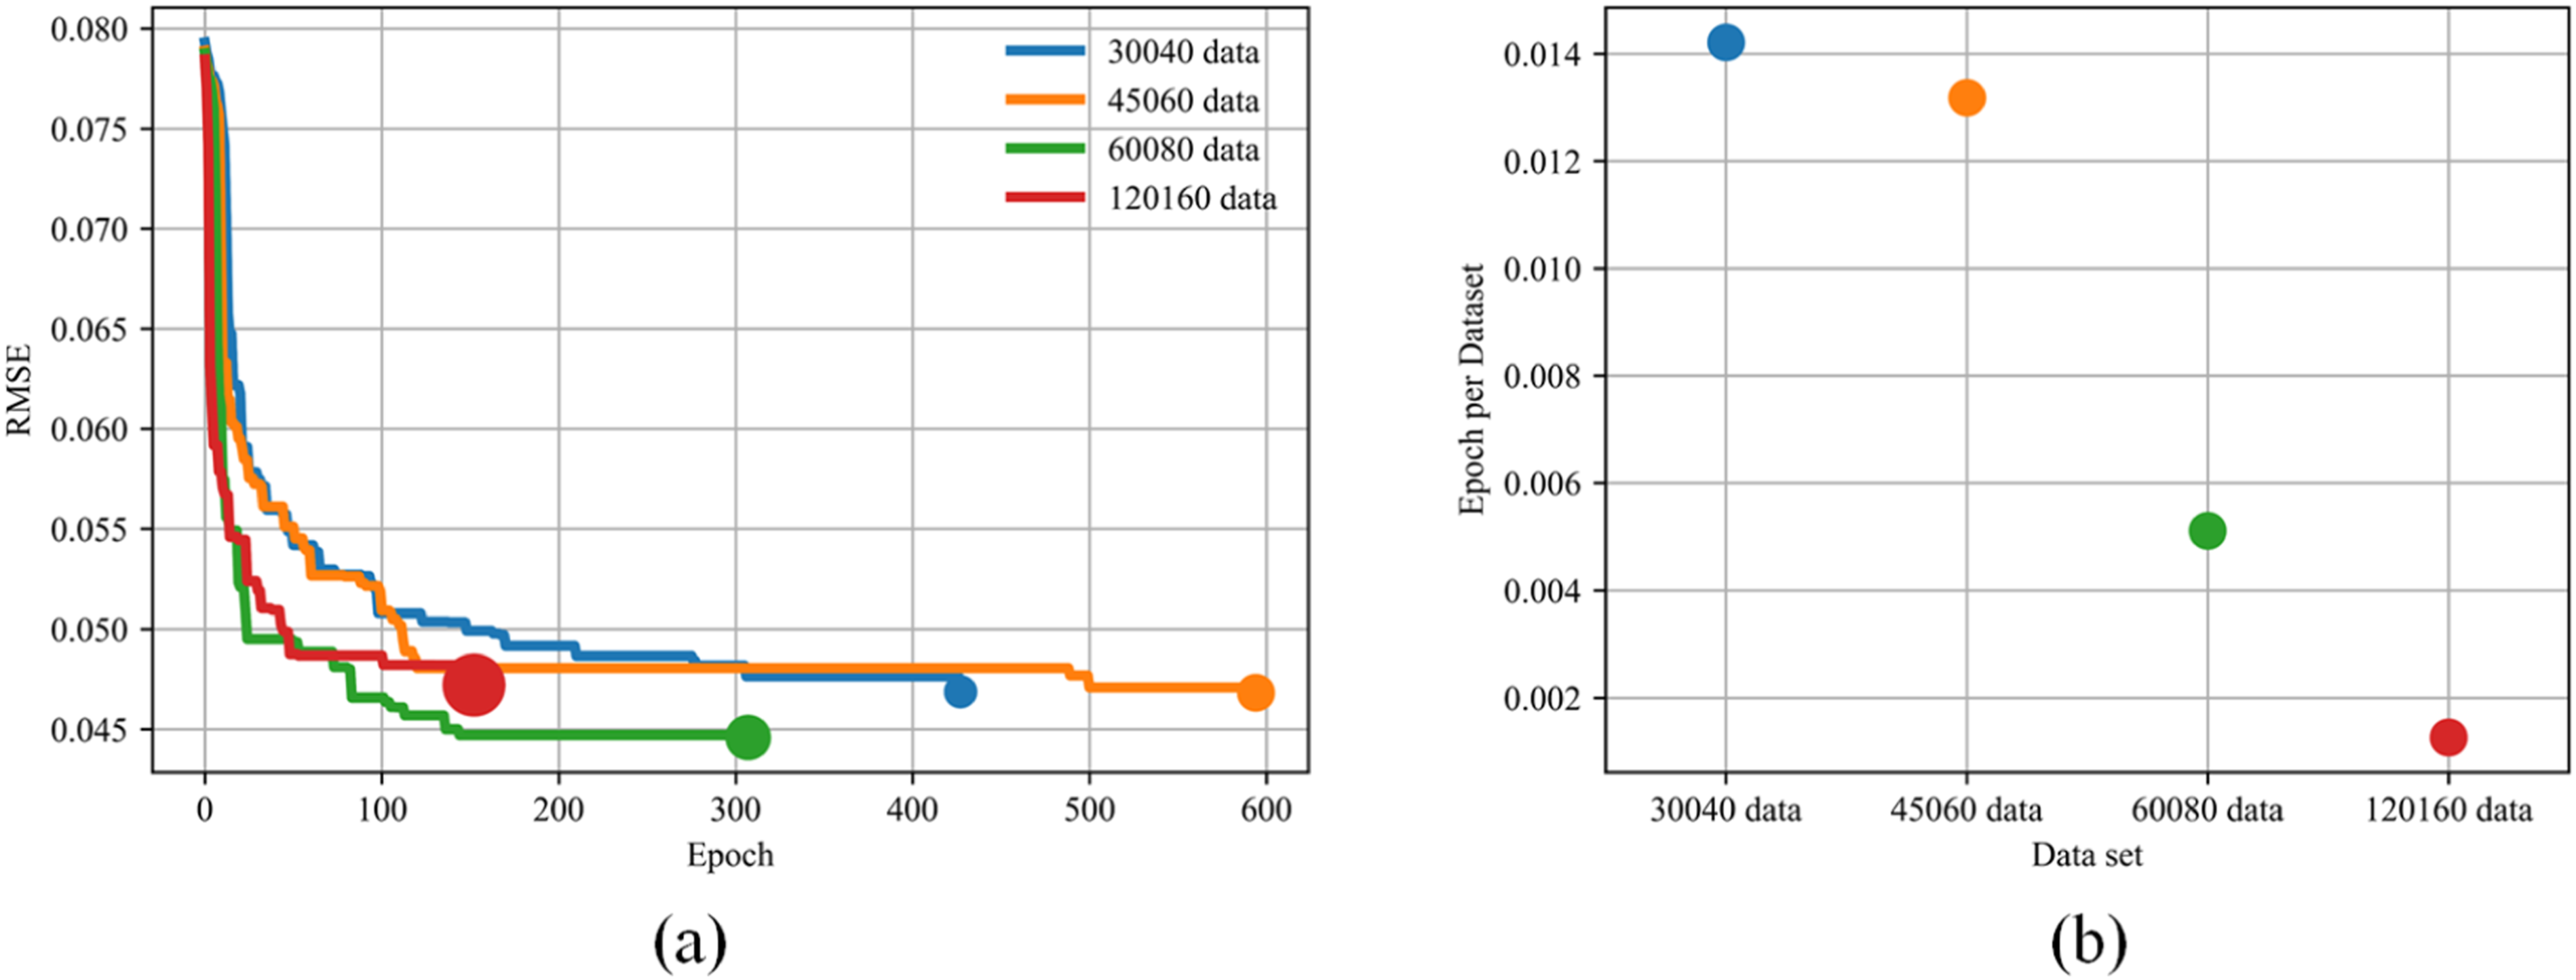
3.2.2. Prediction results in cases with the increase of buildings
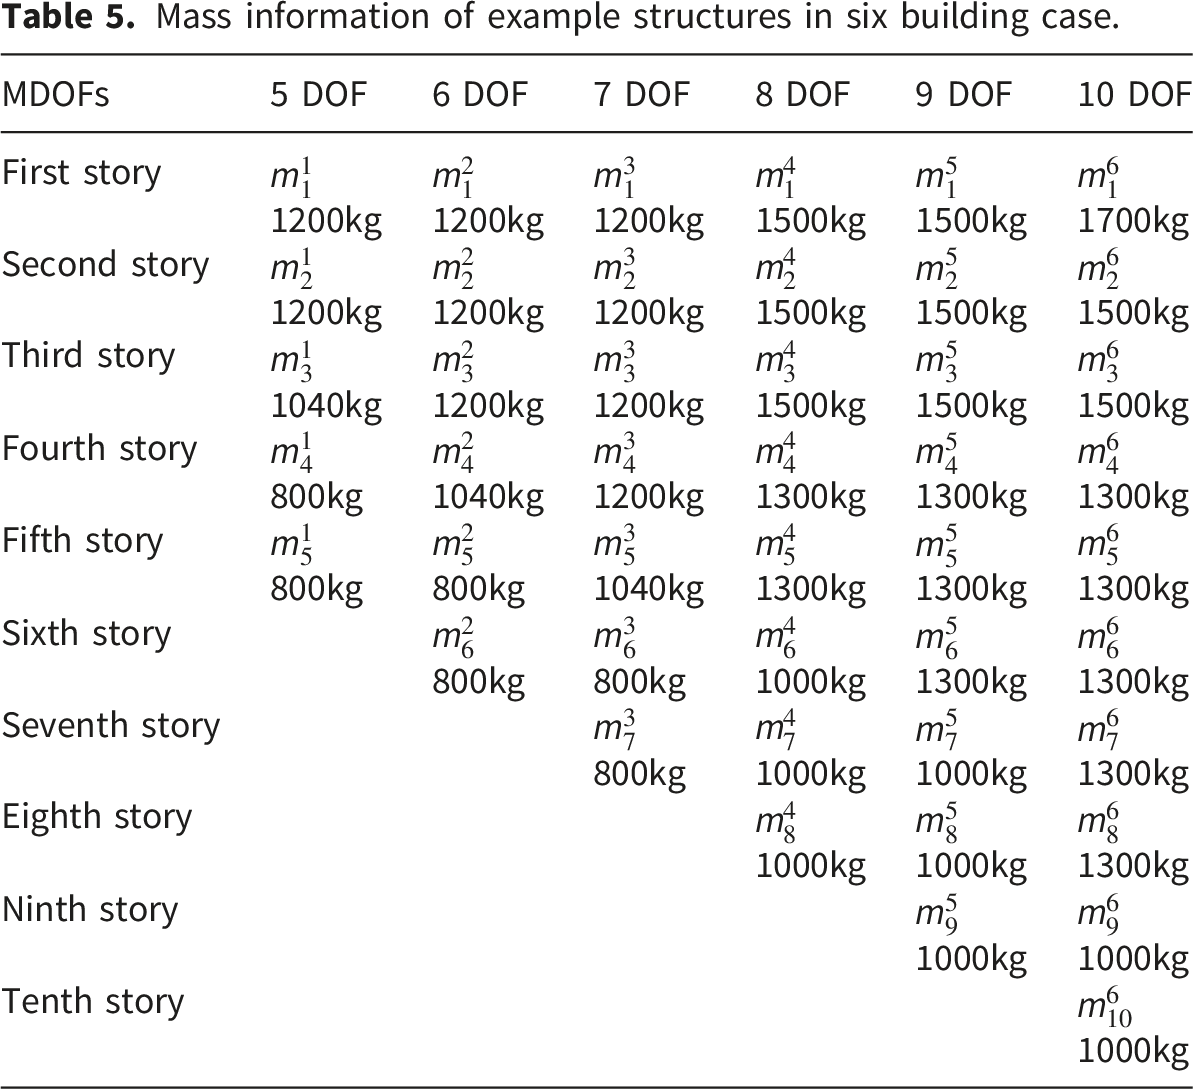
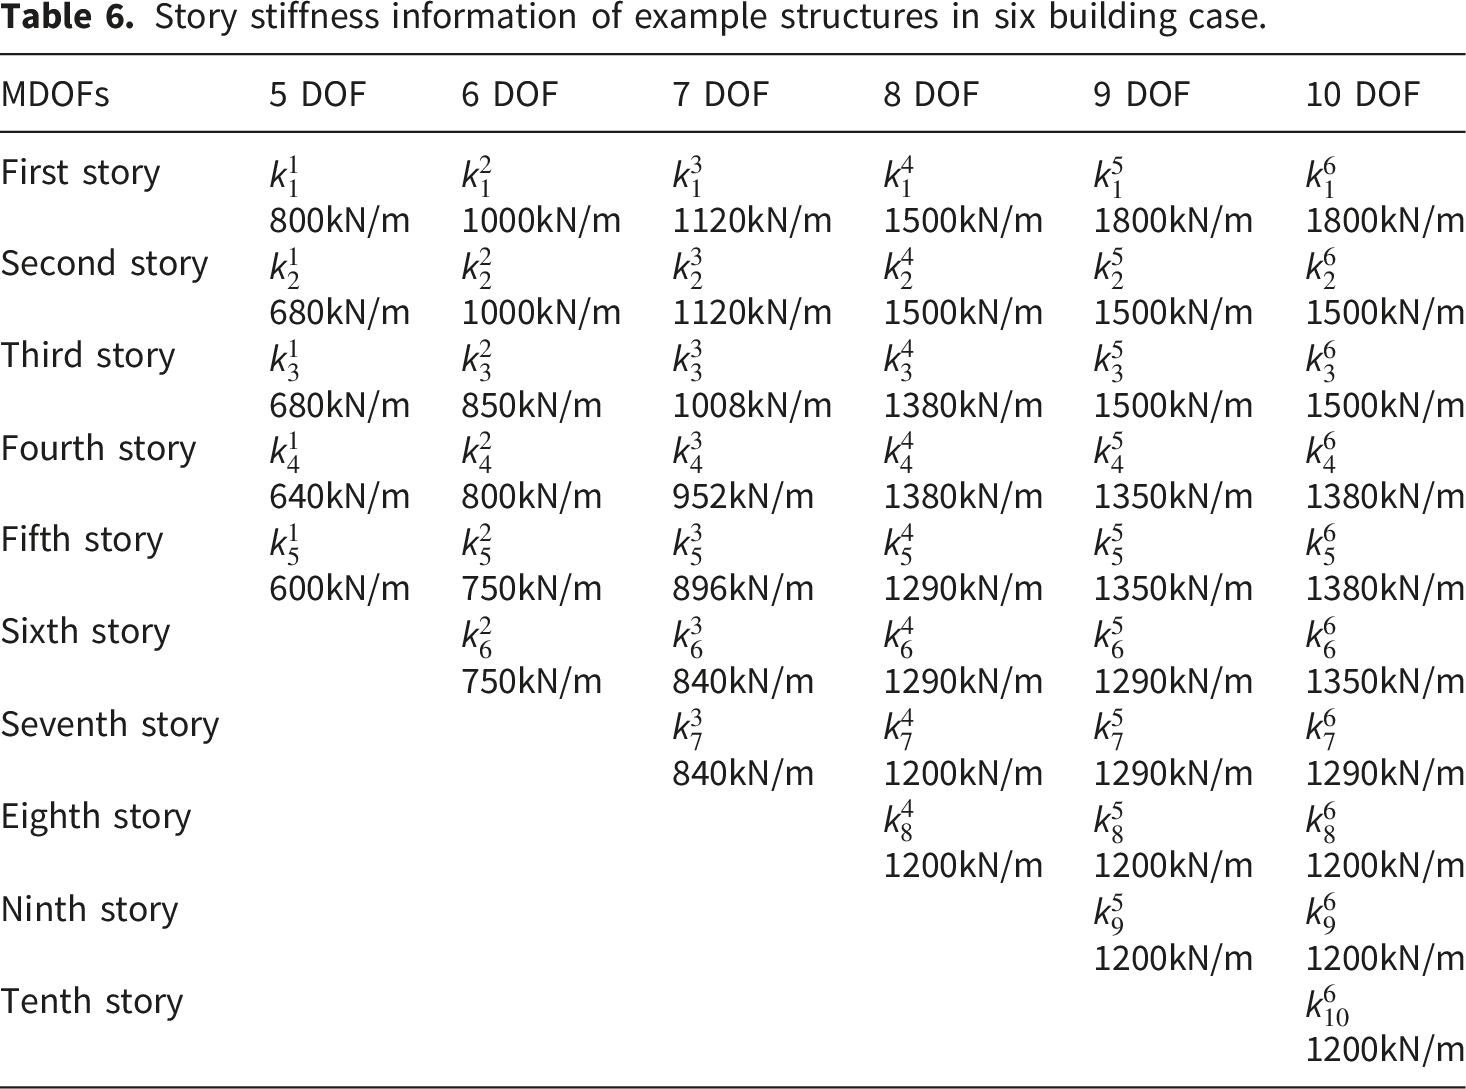
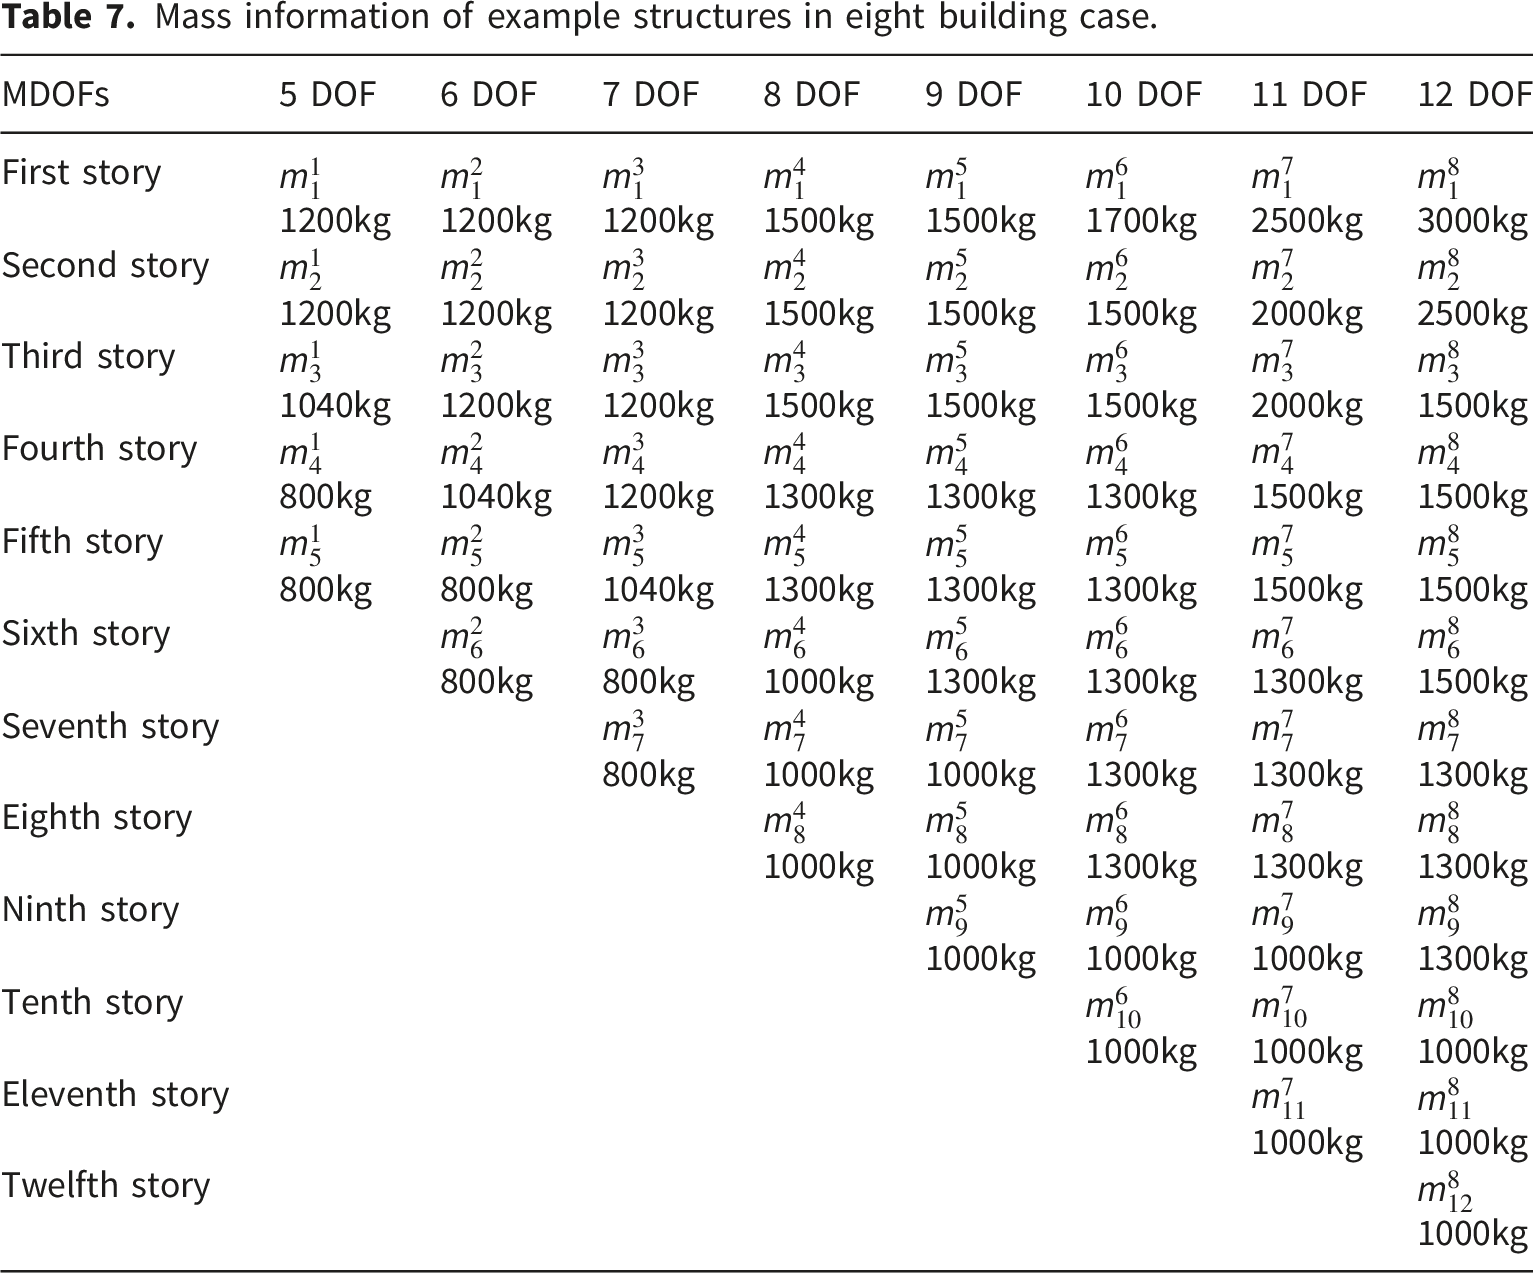
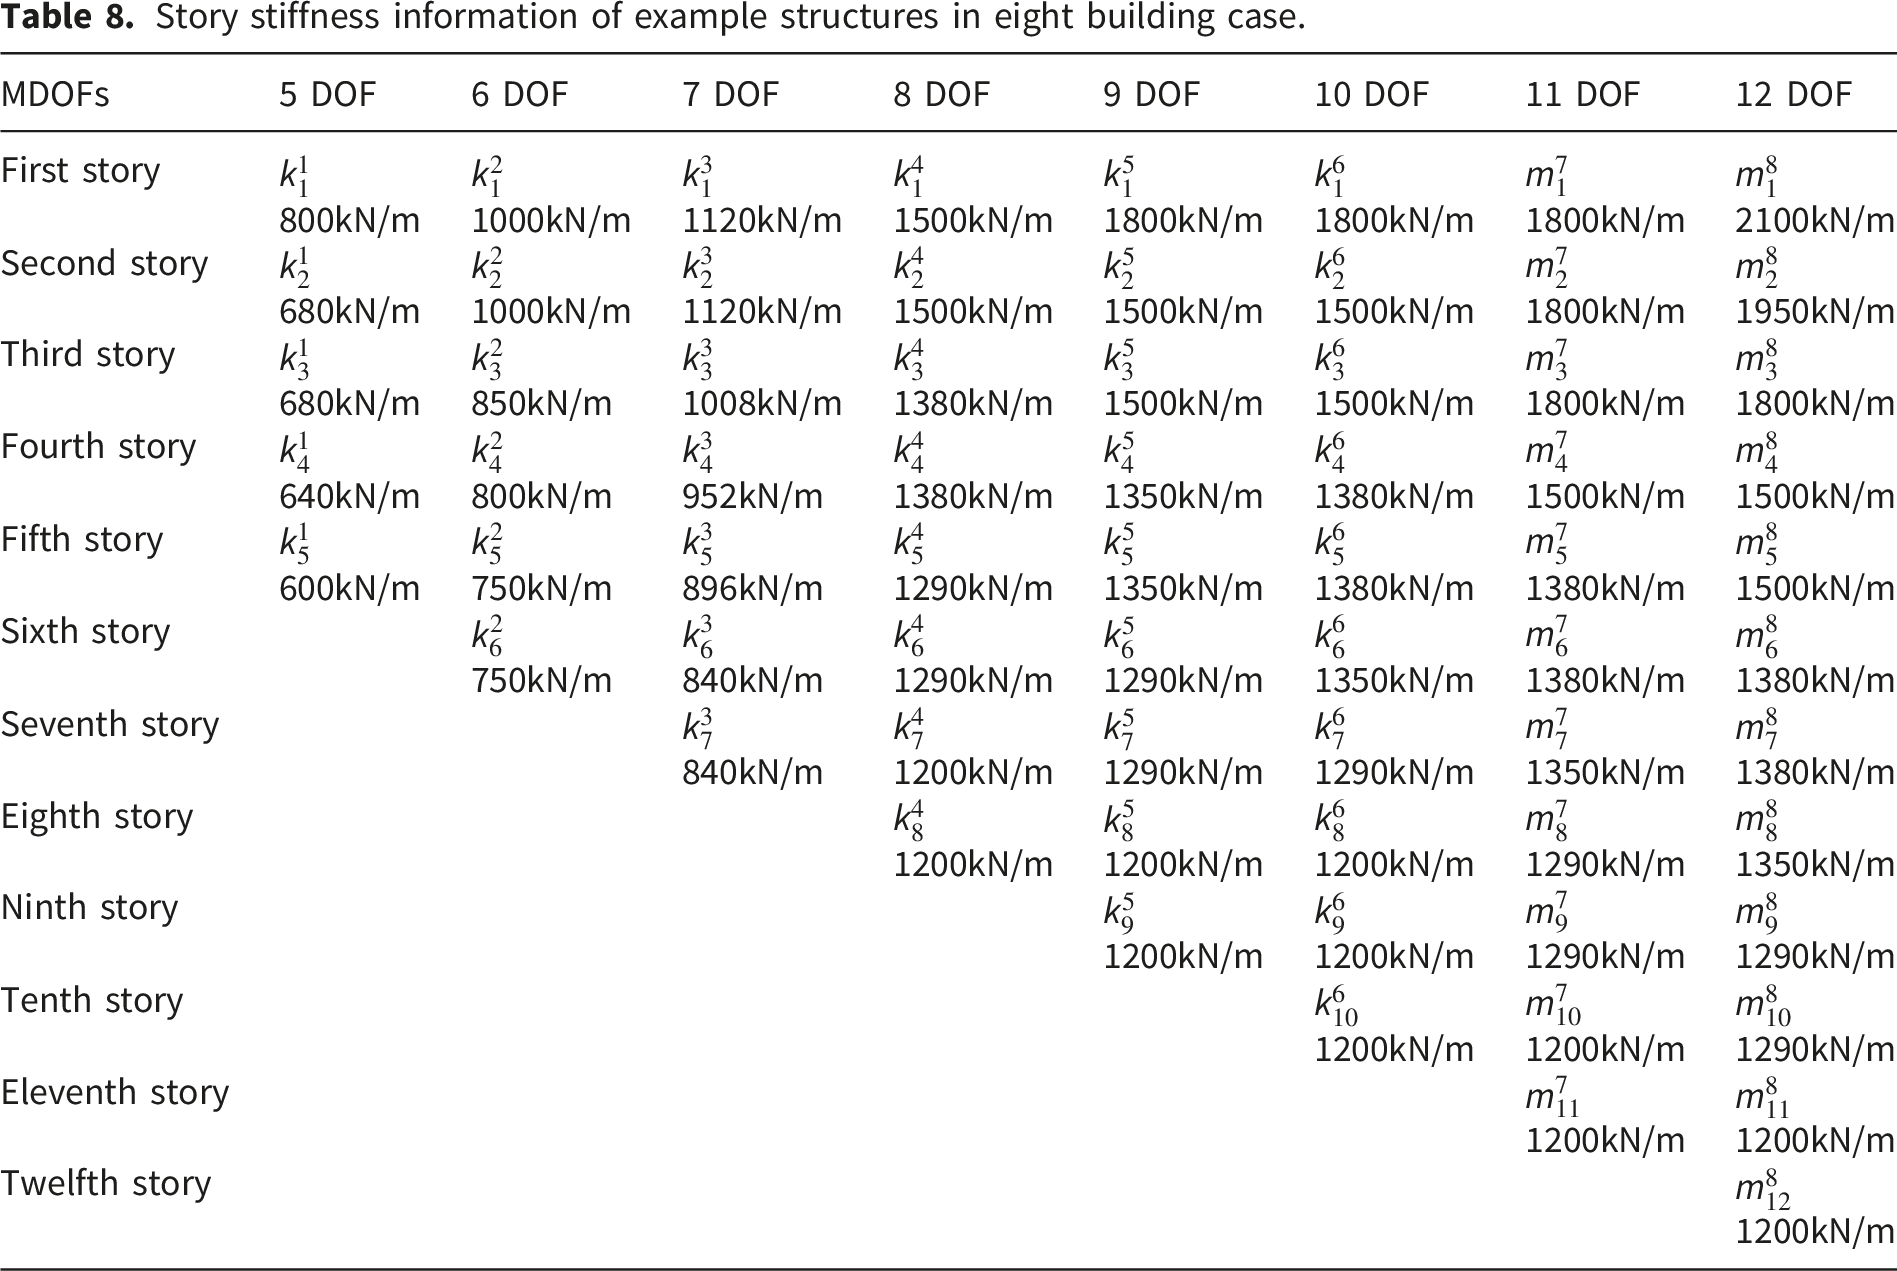
The proposed model’s response prediction performance when the number of buildings increased in a region was analyzed. As exemplified in Figure 9, the model was applied to three cases, and the prediction performance was then comparatively analyzed for each case. Figure 9(a) specifies a case where a bi-directional building network is formed between the four buildings presented in Section 3.2.1, which are located in one region. Figure 9(b) reveals a case where a bi-directional building network is created between six buildings located in one region. Figure 9(c) presents a case where a bi-directional building network is developed between eight buildings located in one region. Tables 2 and 3 synthesize the details of the buildings in the four-building case. Both the six-building case and the eight-building case are represented as MDOFs in the same way as in the four-building case. The mass and story stiffness information details of the six buildings are detailed in Tables 5 and 6, respectively. In addition, the mass and story stiffness information details of the eight buildings in the eight-building case are listed in Tables 7 and 8, respectively. The displacement responses of the buildings in the 6-building and 8-building cases were extracted in the same manner presented in Section 3.2.1 and used to build the model. In all three cases, the network was built in the same way—using the Model 3. Even in the dataset creation, only the situation where the SHM system of one building failed was considered in all three cases. Also, in all three cases, the LSTM was trained under the same training conditions described in Section 3.2.1. Bi-directional building networks for (a) four buildings, (b) six buildings, and (c) eight buildings. Mass information of example structures in six building case. Story stiffness information of example structures in six building case. Mass information of example structures in eight building case. Story stiffness information of example structures in eight building case.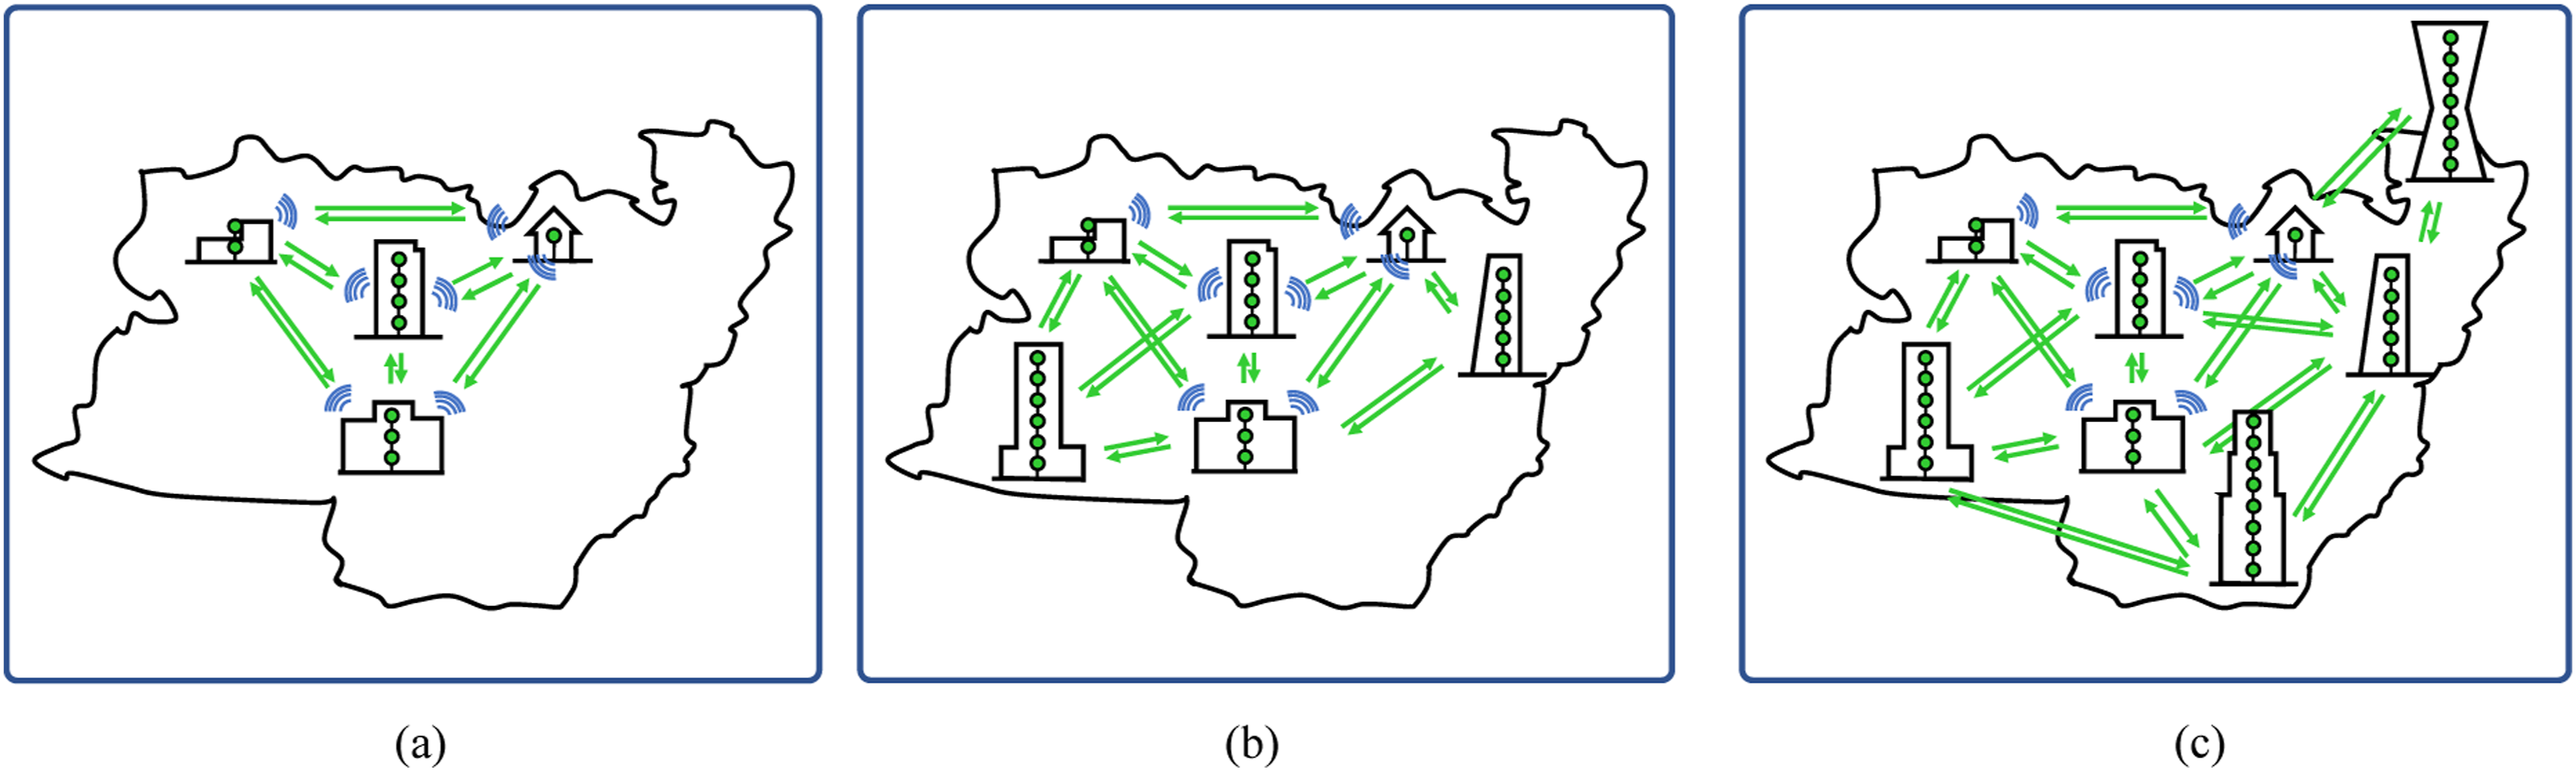
The response prediction results of the models trained with six and eight building data are shown in Figures 10 and 11, respectively, in the form of a time series response prediction for a building with data loss. The DOF number in the upper right of each graph in Figures 10 and 11 corresponds to a building with data loss, and the predicted response of the building is displayed on the graph. Figure 10(a) and (b) describe the response prediction results of the model trained on EQ No.19 and EQ No.20, respectively. Similarly, Figure 11(a) and (b) illustrate the response prediction findings of the trained model for EQ No.19 and EQ No.20, respectively. The response of a building with data loss is predicted relatively accurately in terms of the period and amplitude of the two test earthquakes. Moreover, the results confirm that it is possible to build a bi-directional building network even when the number of buildings increases in the region. However, it was found that the prediction performance decreases with increasing number of buildings in the network. Prediction results of the time series of displacement responses by a network with six buildings in case of data loss of one building data: (a) For EQ no. 19 and (b) for EQ no. 20. Prediction results of the time series of displacement responses by a network with eight buildings in case of data loss of one building data: (a) For EQ no. 19 and (b) for EQ no. 20.

Figure 12 presents the RMSE values for cases with four, six, and eight buildings. As depicted in the figure, the RMSE value increases as the number of buildings increases. For a single-building loss scenario, the RMSE values were 0.04660, 0.08410, and 0.12980 for networks configured with four, six, and eight buildings, respectively. Comparison of prediction performances for the three networks in case of data loss of one building data.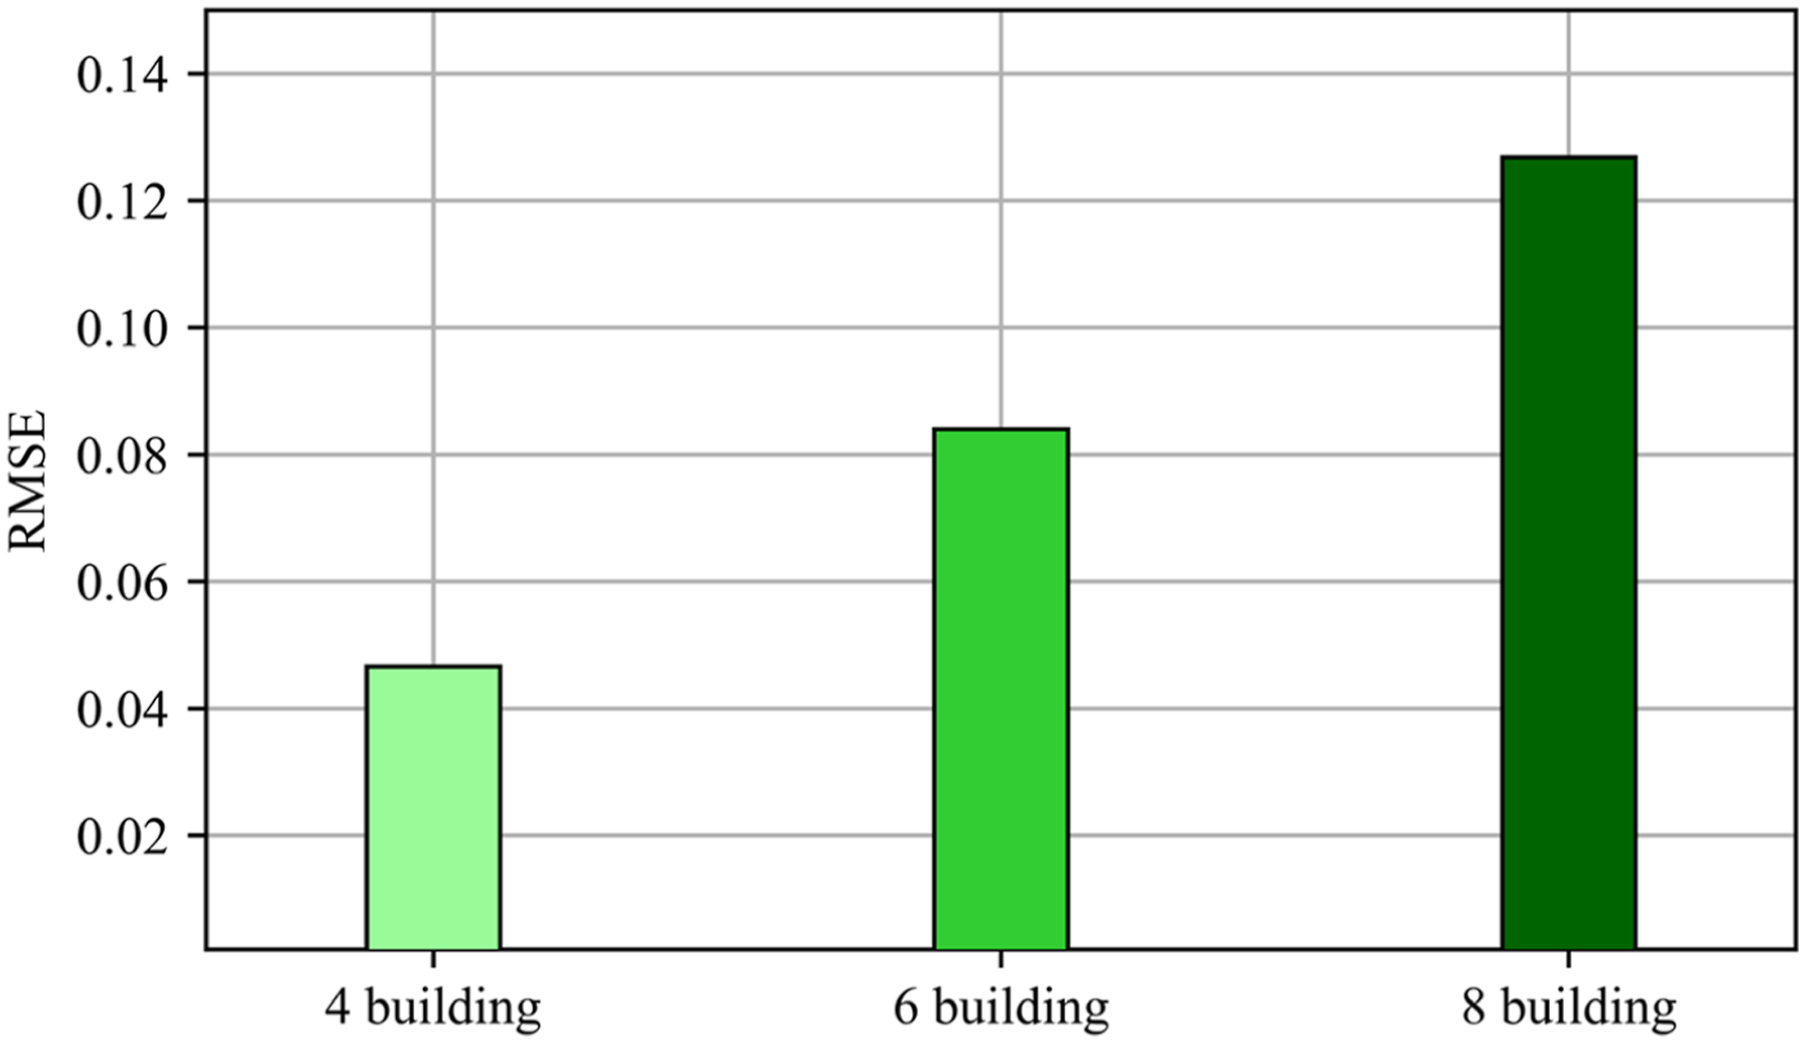
The proposed model’s response prediction performance when the number of buildings with data loss among the buildings considered in the region increased was examined. The bi-directional building network for the four example structures presented in Section 3.2.1 was used for the examination. As the number of buildings with data loss increases, the creation of datasets in the examination differs from the case of data loss in one building, as detailed in Section 3.2.1. That is, when the input data of Model 3 in Figure 2(c) is configured, the amount of lost data indicated in black as zero increases. As the number of lost data increases, the amount of predicted data corresponding to the output increases as well. Models were built for the cases where the number of buildings with data loss was 2 and 3, respectively. Even when the number of buildings with data loss increased, the structural response prediction of the buildings with data loss was relatively accurate. The response prediction performances for test datasets in which the number of buildings with data loss is 1, 2, and 3 are represented as RMSE values, as shown in Figure 13. The figure confirms that the response prediction performance decreases as the number of buildings with data loss increases. It was also confirmed that the RMSE increased by 1.12 times and 1.16 times when the number of buildings with data loss was 2 or 3, respectively, compared to the case where the number of buildings with data loss was 1. Even when the number of buildings in which data loss occurred increased, the proposed model predicted the response of buildings with data loss relatively accurately. However, the prediction performance decreases with an increasing number of buildings in which data loss occurs. Comparison of prediction performances of the network for the four buildings in case of an increase in the number of buildings where data loss occurs.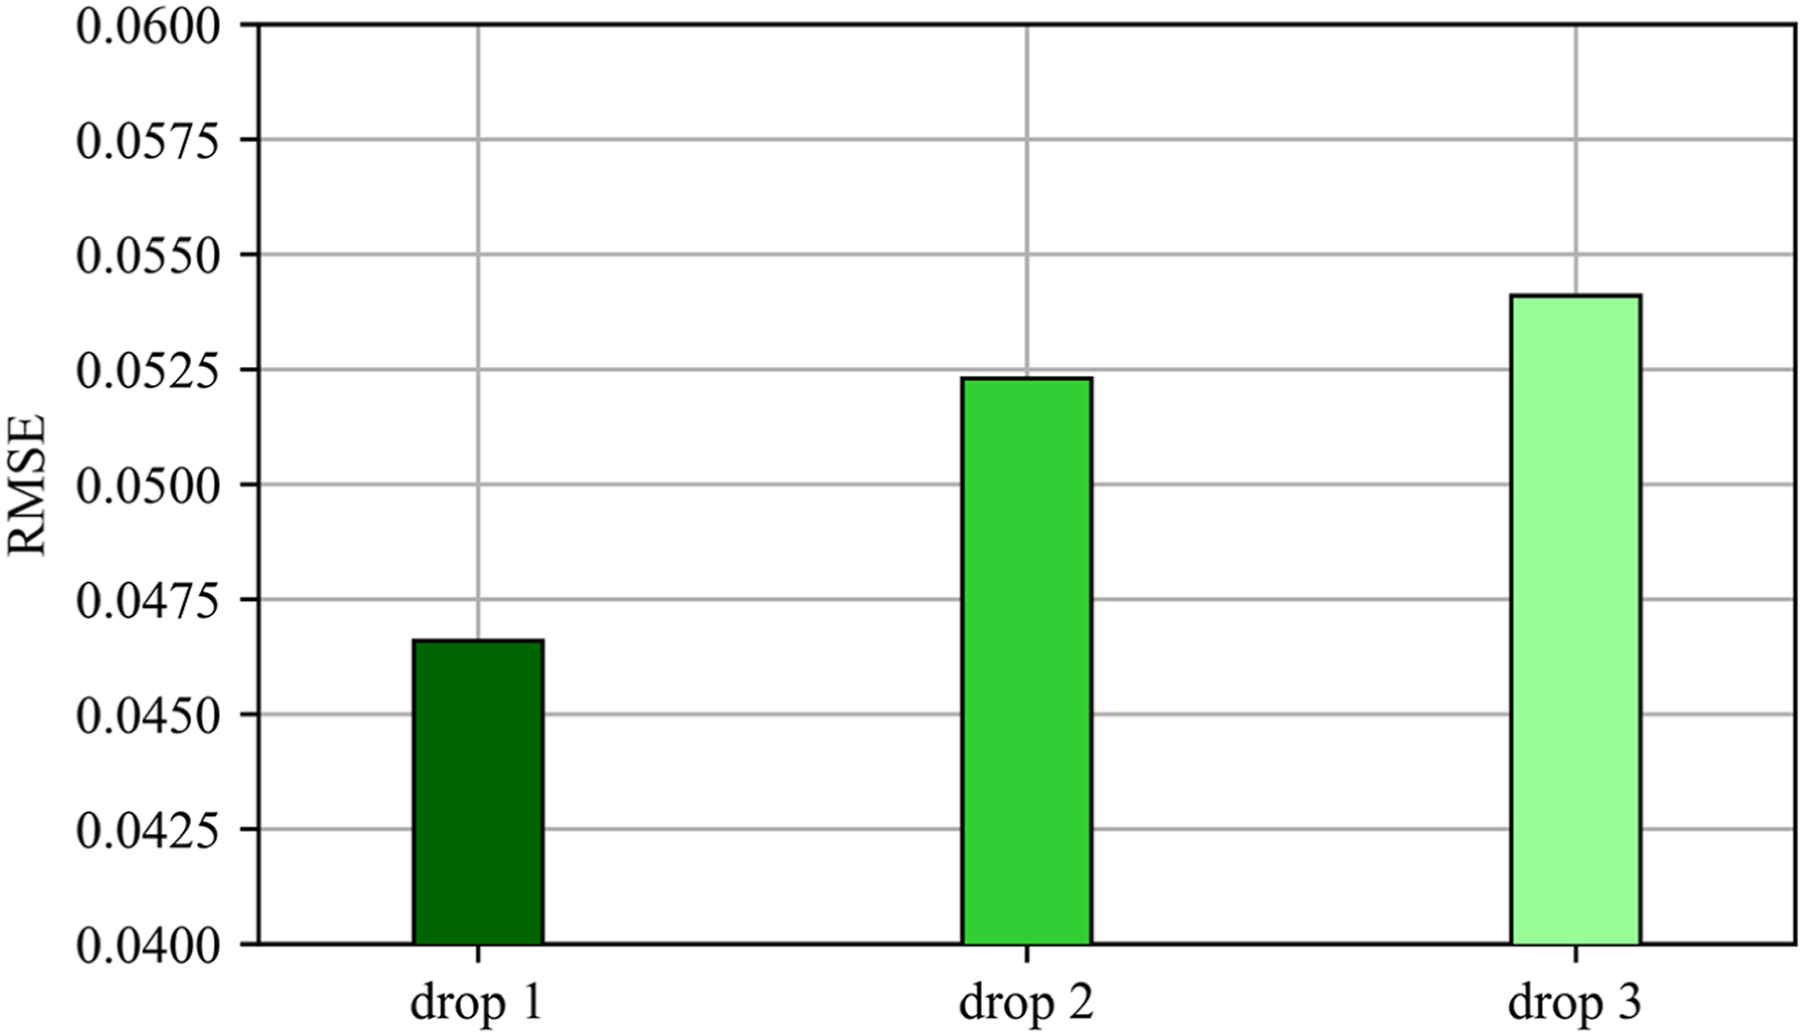
4. Conclusions
This study proposes a bi-directional building network for regional safety management. The network was built using the dynamic structural responses of multiple buildings in a region. The LSTM-based building response prediction models were presented for network construction. In the models, the time and frequency domain responses were used to train the LSTM. The presented models were applied to the response prediction of multiple example structures in a specific region. The conclusions obtained by implementing the presented models are summarized as follows: ■ When a bi-directional building network is built, using frequency domain response and time domain response to train LSTM-based models enables more accurate response prediction, because the frequency-domain information provides complementary spectral characteristics of structural responses. ■ Even when frequency domain response and time domain response are used together, the prediction performance varies depending on the LSTM model configuration. Also, the model with time and frequency domain data configured as different channels and entered into one LSTM effectively predicts the response of a building with data loss. ■ Despite variations in the number of datasets, similar results are obtained in terms of response prediction accuracy. An increase in the number of datasets does not always indicate an increase in the prediction accuracy of the model. When the number of datasets is considerably large, the number of epochs at the termination of training can be significantly reduced. ■ The proposed model can predict the response of buildings with data loss relatively accurately even when the number of buildings considered in a region increases. However, the prediction performance decreases somewhat with increasing number of buildings. ■ The proposed model was applied to the case in which the number of buildings with data loss increased. Even when the number of buildings with data loss increased, the trained LSTM-based model predicted the response of buildings with data loss relatively accurately. The prediction performance of the trained model slightly decreased as the number of buildings with data loss increased.
In addition, normalized error measures were considered to interpret the prediction results in a more meaningful engineering context. The results indicate that the proposed framework can recover the overall response pattern with reasonable accuracy under the present simulation setting, although prediction errors in peak response remain non-negligible in more challenging cases. Therefore, the current framework should be interpreted as a simulation-based proof-of-concept for regional response recovery rather than a finalized tool for direct safety decisions.
This study has several limitations. All results were obtained from numerically generated data based on simplified MDOF structural models, with a fixed damping ratio of 2% and top-floor displacement used as the target response. Accordingly, the present results demonstrate the feasibility and effectiveness of the proposed framework under controlled numerical conditions, while experimental and field validation remain important next steps toward practical implementation. Although top-floor displacement alone does not provide a complete basis for structural safety assessment, it offers a meaningful starting point for extending the framework toward more practically relevant seismic response indicators, such as maximum inter-story drift ratio, through future multi-story displacement recovery. In addition, the present scalability analysis was demonstrated for synthetic building cases, and computational cost, training time, and real-time implementation feasibility were not explicitly evaluated. The current framework also assumes an idealized regional deployment setting in which response data are available from all target buildings in advance. As a result, practical issues such as sensor noise, modeling errors, structural nonlinearity, heterogeneous sensing systems, asynchronous data acquisition, and partial instrumentation were not explicitly incorporated into the present analysis. Future work will extend the framework through experimental or field validation, noise-contaminated measurements, nonlinear structural response cases, and more realistic large-scale deployment scenarios, including scalable distributed sensing platforms such as MEMS-based sensing systems 25 for long-term regional SHM implementation.
Footnotes
Funding
The authors disclosed receipt of the following financial support for the research, authorship, and/or publication of this article: This work was supported by a National Research Foundation of Korea (NRF) grant funded by the Korea government (Ministry of Science, ICT & Future Planning, MSIP) (RS-2023-00220019). This research was also supported by the Yonsei University Research Fund of 2024-22-0470.
Declaration of conflicting interests
The authors declared no potential conflicts of interest with respect to the research, authorship, and/or publication of this article.
Data Availability Statement
The data that support the findings of this study are available from authors upon reasonable request.