
Abstract
Purpose
The purpose of this study is to propose an automated pipeline integrity monitoring framework. Thermography is presented as the primary inspection and monitoring tool at critical locations in gas pipelines.
Design/Methodology
A custom laboratory-scale experimental setup was developed to induce commonly observed defects on the pipeline surface, such as dents, cracks, holes, and scratches. A dataset of 1,451 annotated samples was created by capturing the thermographic images corresponding to the different defects. A two-stage deep learning framework was designed. In the first stage, a Residual Network (ResNet-18) was implemented for defect classification. Gradient-weighted Class Activation Mapping (Grad-CAM) was used to visualize and interpret the image regions that influenced the model’s classification. In the second stage, the You Only Look Once (YOLO) model was applied to detect and locate defects.
Findings
ResNet-18 combined with Grad-CAM provided accurate classification and interpretability. Grad-CAM highlighted the defect zones effectively. YOLO demonstrated a strong ability to detect and localize surface-level defects through bounding boxes and confidence scores. Some misclassification occurred between visually similar defects, such as dents and cracks, or cracks and scratches. Thermographic imaging produced stronger and clearer fault signatures compared with conventional camera images.
Originality/Value
This work combines thermography with deep learning for pipeline monitoring. The results from the lab-scale setup validate the feasibility of the approach as a proof of concept for using thermography as a reliable monitoring tool. The study highlights the potential to extend this framework for industrial-scale pipelines by integrating larger datasets, diverse operating conditions, and real-time implementation.
1. Introduction
The pipeline is the critical infrastructure of the oil and gas industry as it provides a safe and efficient means of transporting petroleum and gas over long distances and across borders. These critical infrastructures are exposed to harsh and changing environmental conditions. These conditions deteriorate the pipeline surface and sub-surface and may lead to the formation of cracks, corrosion, dents, leaks, or fatigue failures. If these faults are not detected early, they can lead to pipeline failure. This can result in major financial losses, environmental damage, and safety hazards. Therefore, effective and reliable monitoring of pipeline health has become an important focus for researchers and the industry. Each fault leaves a measurable sign that should be identified and monitored in real time for early detection before it becomes serious.
Traditional methods provide useful data, but their application is limited by poor accessibility in hard-to-access areas, which results in high costs. These systems are not often capable of producing real-time information. There is a serious need for automated, non-invasive, and continuous monitoring techniques. Among these, thermography has shown great potential. It can detect surface and subsurface anomalies in a non-contact and rapid manner.
Infrared thermography is a non-invasive and non-contact technique. It is widely preferred for pipeline inspection to visualize temperature distributions across the radiating surfaces. Over recent years, thermography technology has undergone significant development and has become an efficient tool for industrial safety. It is now widely recommended in the energy sector as part of daily monitoring practices, as this technique provides the early detection of faults without interrupting operations and direct access to the pipeline surface.
1.1. Background
All objects above absolute zero emit radiation. The technique that detects and translates this emitted radiation is defined as infrared thermography. Hidden faults or early-stage defects can be demonstrated as thermal anomalies. For example, corrosion, thinning, and structural surface and sub-surface defects like dents, cracks, and scratches alter the thermal maps through the conduction and convection characteristics of the pipe. This may produce minor but measurable thermal anomalies using the thermography technique.
Thermography excels at identifying relative temperature variations on the surface, even when the operating range is low. When a pipeline is exposed to sunlight or subjected to minor operational heating, defects alter thermal absorption and dissipation patterns and produce characteristic signatures. Thus, even at low pipeline operating temperatures, thermography provides a reliable means of identifying faults based on differential heating, cooling, and emissivity patterns, rather than only accounting for absolute temperature.
A certain segment of pipeline infrastructure functions under elevated temperature conditions. These include steam pipelines, hot crude transport lines, and refinery process lines, where transported fluids are maintained at higher temperatures as part of thermal processing. In these cases, thermography is more beneficial as the higher thermal gradients improve defect visibility. This consolidates the case for integrating thermographic monitoring in both low- and high-temperature pipeline environments.
Despite these benefits, thermography has certain limitations. The accuracy of thermal signatures is greatly dependent on environmental conditions and the similarity of thermal signatures for different fault types. This is where machine learning and deep learning methods1–3 provide an important advantage. Furthermore, advances in this technique over the years can now offer integration with artificial intelligence (AI) and machine learning (ML) for the automated interpretation of complex thermal patterns, which were previously difficult to analyze without a skilled operator. They learn discriminative features from large datasets. Models such as convolutional neural networks (CNNs) and object detection algorithms can improve the sensitivity of thermography, also supporting the establishment of a path towards real-time, intelligent, and scalable monitoring solutions for critical pipeline infrastructure.
1.2. Literature review and research gaps
Visual camera inspection is one of the most widely researched and applied techniques for surface corrosion monitoring in oil and gas pipelines.4,5 This method examines the pipeline surface to identify damage such as rust, discoloration, pitting, or cracking. The study developed a large dataset of optical images and proposed a custom convolutional neural network (CNN) for feature extraction, classification, and defect localisation. 6
Regular cameras capture only visible light, whereas thermography detects the infrared radiation emitted from surfaces. Subtle temperature variations due to any pending fault that are invisible to the naked eye can be easily detected through thermography. Unlike visual inspection, thermography enables the identification of faults that do not exhibit obvious surface signatures. Gas leaks, insulation failures, and internal corrosion may not produce visible signs, but they manifest as abnormal thermal patterns. Thermal imaging captures emissivity variations around dents, leaks, and cracks, where even small defects can disturb local temperature gradients. This makes thermographic images far more sensitive and reliable for early fault detection compared to standard optical images.
Despite its numerous advantages in inspection and strong potential for condition monitoring, thermography has seen limited application in the fault detection of oil and gas pipelines. The Scopus database was used to retrieve relevant research related to the monitoring and inspection of oil and gas pipelines using thermography. An initial search was conducted using the keywords “oil AND gas AND pipeline,” with a refined search of “Thermography”. This search produced around 130 publications over the past 25 years (Figure 1). VOSviewer-based bibliometric analysis of thermography research in oil and gas pipelines over the past 25 years using overlay visualisation.
Several analytical and numerical studies have investigated vibroacoustic behavior, sound transmission loss, and wave propagation works. These approaches provide valuable insights into structural-acoustic behavior but they are primarily focused on sound insulation and vibration analysis rather than thermal-based monitoring.7,8 Most existing works focus on detecting thermal gradients caused by gas leakage, insulation failures, or localized heating from stress and corrosion. Recent studies have investigated the relationship between pipeline fault mechanisms and transient thermal–flow behavior.9,10 In one such study, the gas pipeline was modeled as a multi-node system to capture spatial and temporal variations in pressure, flow rate, and temperature along the pipeline length. 11 Fault-specific physical modifications were incorporated. The results demonstrated that transient flow and thermal parameters vary with both time and location when structural faults are present. This produces measurable thermal disturbances on the pipe surface. These findings indicate that defect geometry and severity influence thermal pattern formation through localized changes in heat transfer and flow dynamics.
Summary of thermography and machine learning applications in inspection and monitoring.
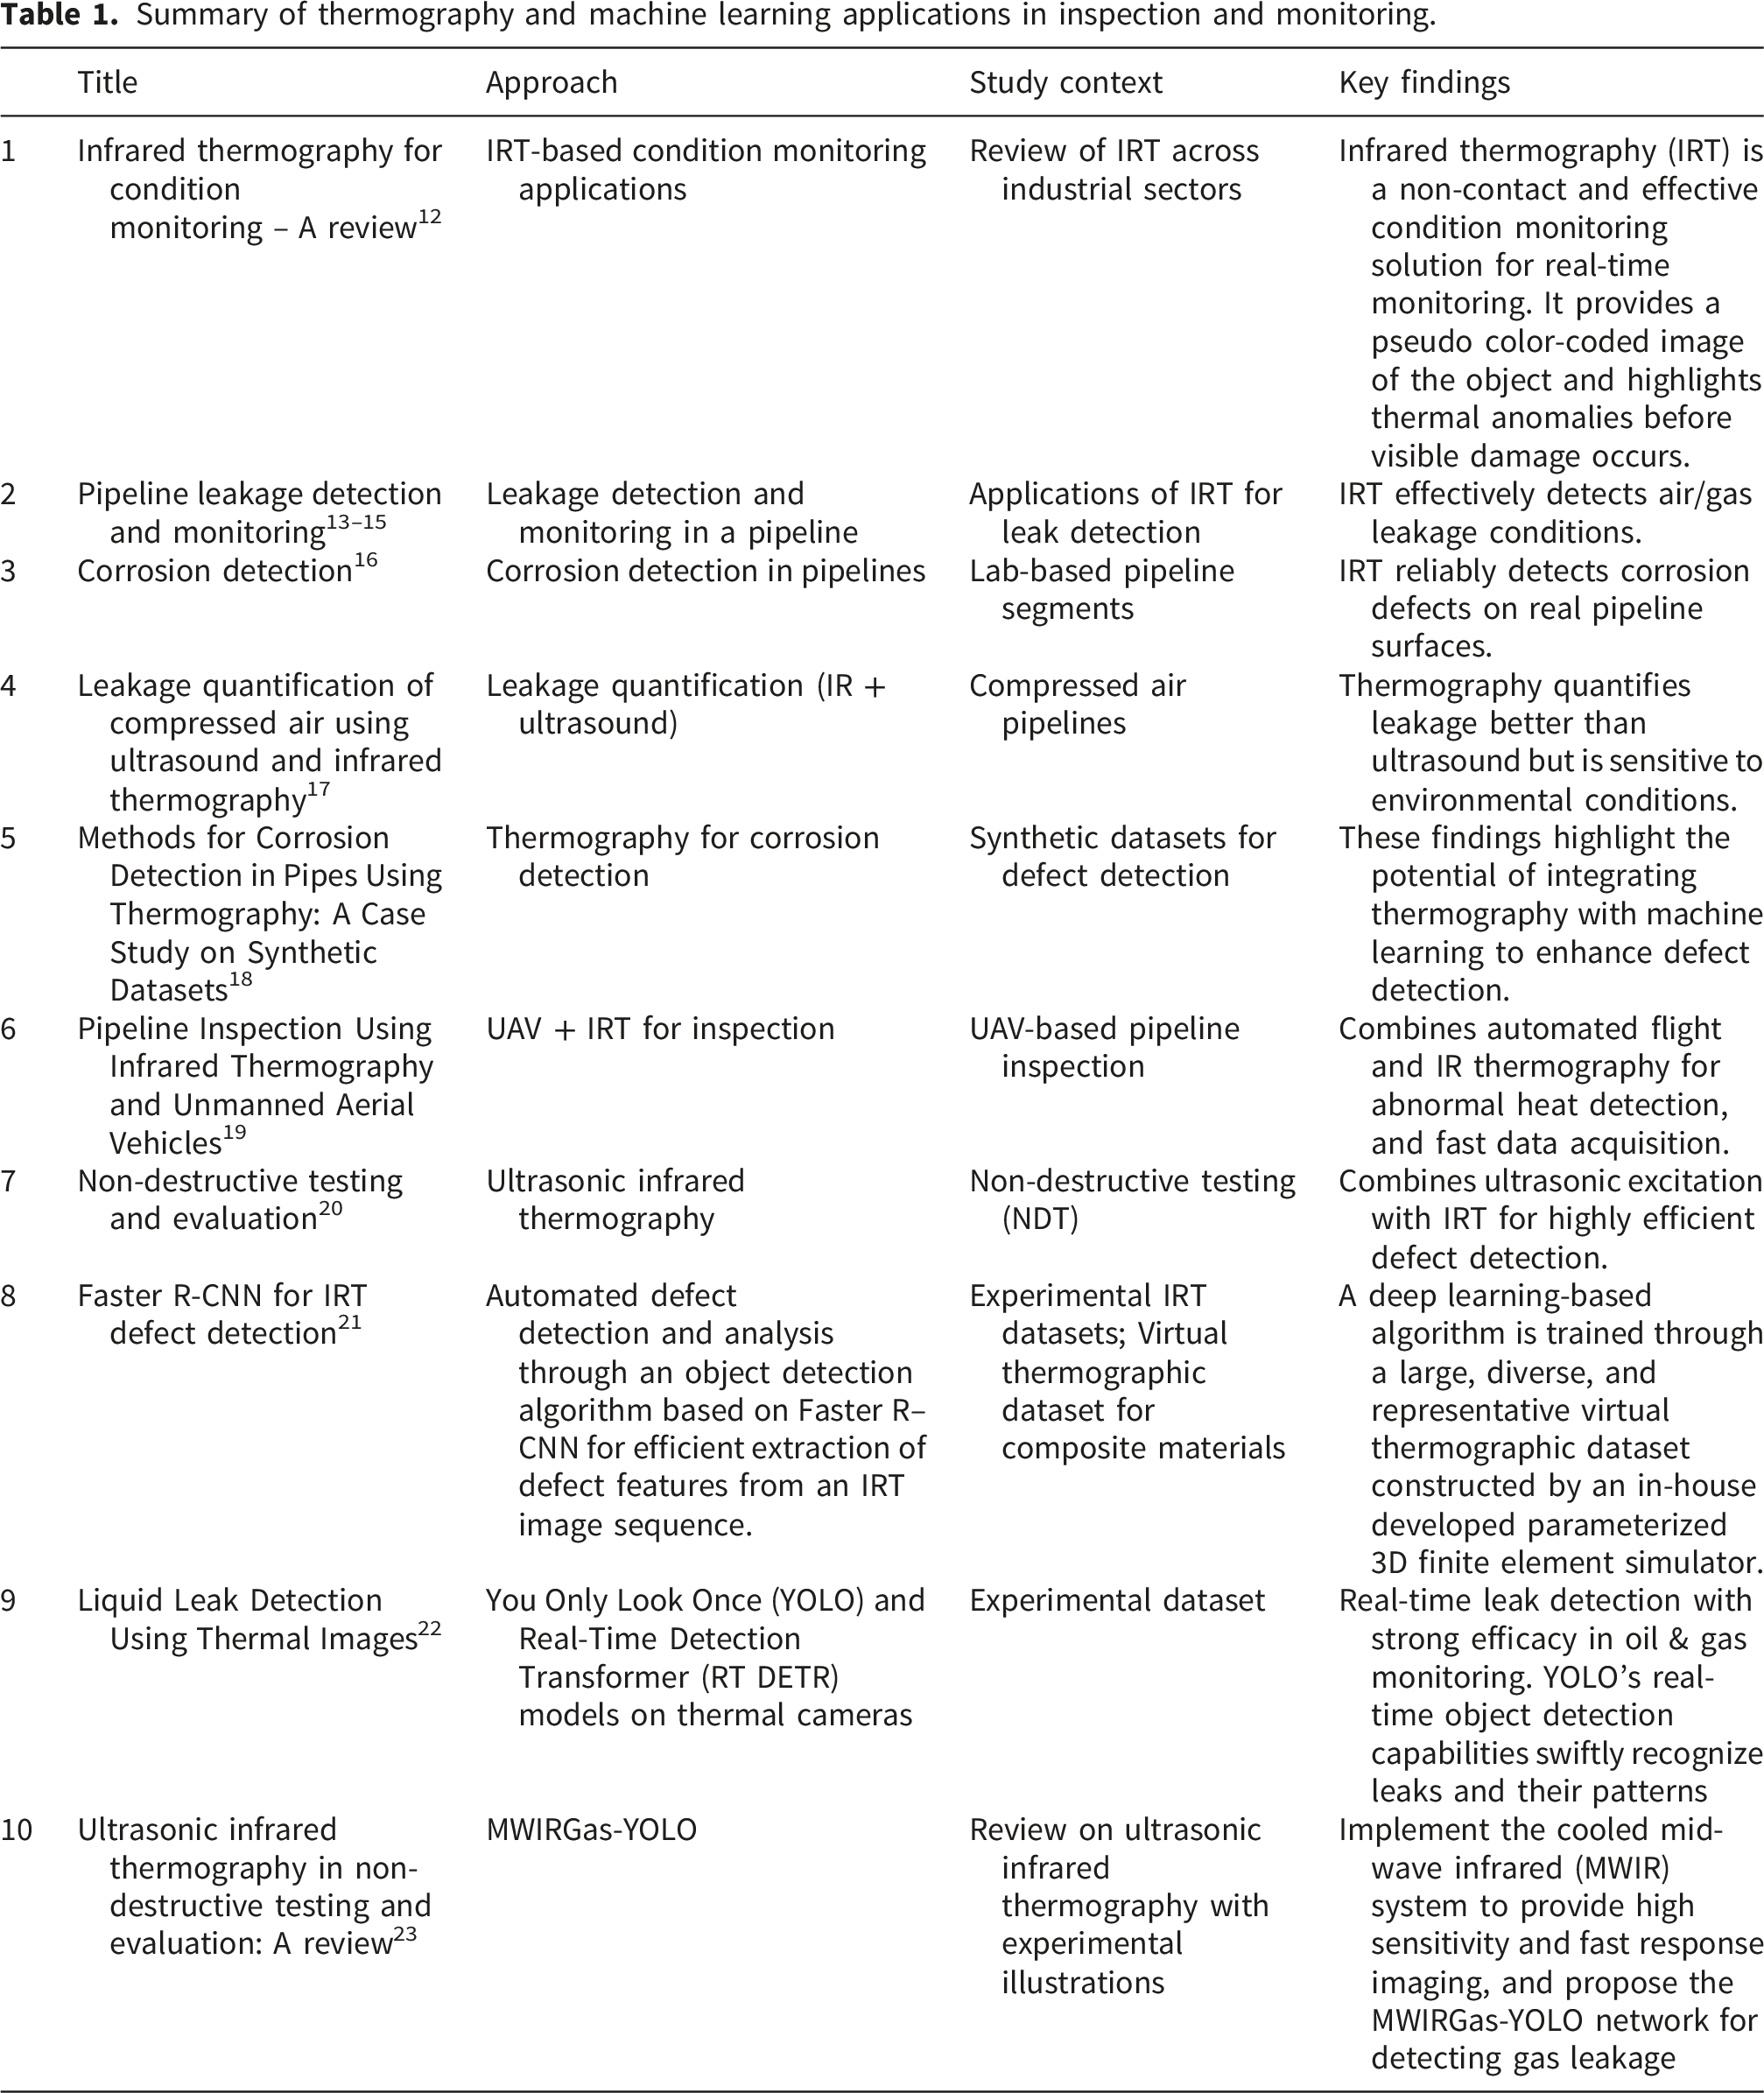
The comparative analysis of existing literature (Table 1) highlights both the advancements and limitations of thermography in pipeline monitoring.
It also highlights the critical drawbacks of traditional monitoring methods. Traditional methods are effective in detecting common pipeline faults under controlled conditions; however, their generalizability and robustness are limited in real-world scenarios. UAV-based inspections and automated image analyses have offered scalability; however, the majority of methods rely on single-step classification or detection. This often leads to false alarms or missed localised anomalies.
The latest studies with machine learning have attempted to address these gaps. However, most works depend on single-model implementations. CNN-based classification models perform well for broadly extracting thermal features, but they are not optimised for fine localisation. On the other hand, YOLO-based detection models are effective for local anomaly detection but depend on strong discriminative features to minimize misclassifications.
Based on the review of existing studies, several key research gaps are identified in the application of thermography for gas pipeline monitoring.
Thermography has been explored in various inspection studies. However. its use as a monitoring tool for detecting fault conditions in gas pipelines has remained very limited over the past twenty-five years. Existing research largely focuses on offline defect identification rather than continuous thermal screening of oil and gas pipelines. Prior studies do not integrate a structured deep-learning workflow that can first scan large surface areas and then automatically localise the defect site. Most existing deep-learning applications rely on RGB images or pre-segmented thermal datasets and do not address thermal screening across extended pipeline sections.
1.2. Proposed integrated framework and methodology
This study emphasizes the need for developing advanced frameworks that combine thermography with machine learning for real-time and non-invasive monitoring. Advances in thermal imaging have expanded the scope of continuous monitoring applications. Modern technology in thermal imaging offers higher sensitivity, wider area scanning, and improved fields of view with enhanced accuracy. This covers a larger section of the pipe as compared to an earlier handheld device. Moreover, the cost of thermal cameras has also reduced significantly in the past few years. This makes their use economically feasible for continuous monitoring implementations.
The study proposes taking advantage of modern thermal camera advancements by installing them at critical points such as joints, bends, and valves for continuous monitoring of oil and gas pipelines. These locations have a higher probability of leakage or mechanical stress. Integration with a wireless sensor can further extend the monitoring capability in hard-to-access areas. These systems can transmit real-time data for efficient monitoring without the need of an operator’s presence. Additionally, thermographic systems can also be unified with centralized monitoring platforms. This system provides access to visualize and analyze the live data and video feed from multiple sites. This ensures that all the crucial locations are covered and continuously monitored, and if a defect is detected, the specific area can be zoomed in for further evaluation.
The proposed two-stage monitoring framework is illustrated in Figure 2 using a deep learning architecture for pipeline condition monitoring. The first block in the framework represents data management. It begins with sensor deployment at critical points of the pipeline. After deployment, the captured thermographic data is pre-processed to improve quality. Wireless transmission is used to transfer the data to the storage unit. All data is stored and managed systematically for further analysis. The second block represents data identification and imaging. Thermographic images are acquired and enhanced to highlight relevant features. Data augmentation is applied to increase the diversity of the dataset. This ensures that the deep learning model learns a wide variety of training samples. The dataset is then passed to the deep learning stage. In the deep learning stage, a two-stage framework is employed for screening and detection. Proposed two-stage thermography and deep learning framework for pipeline fault monitoring.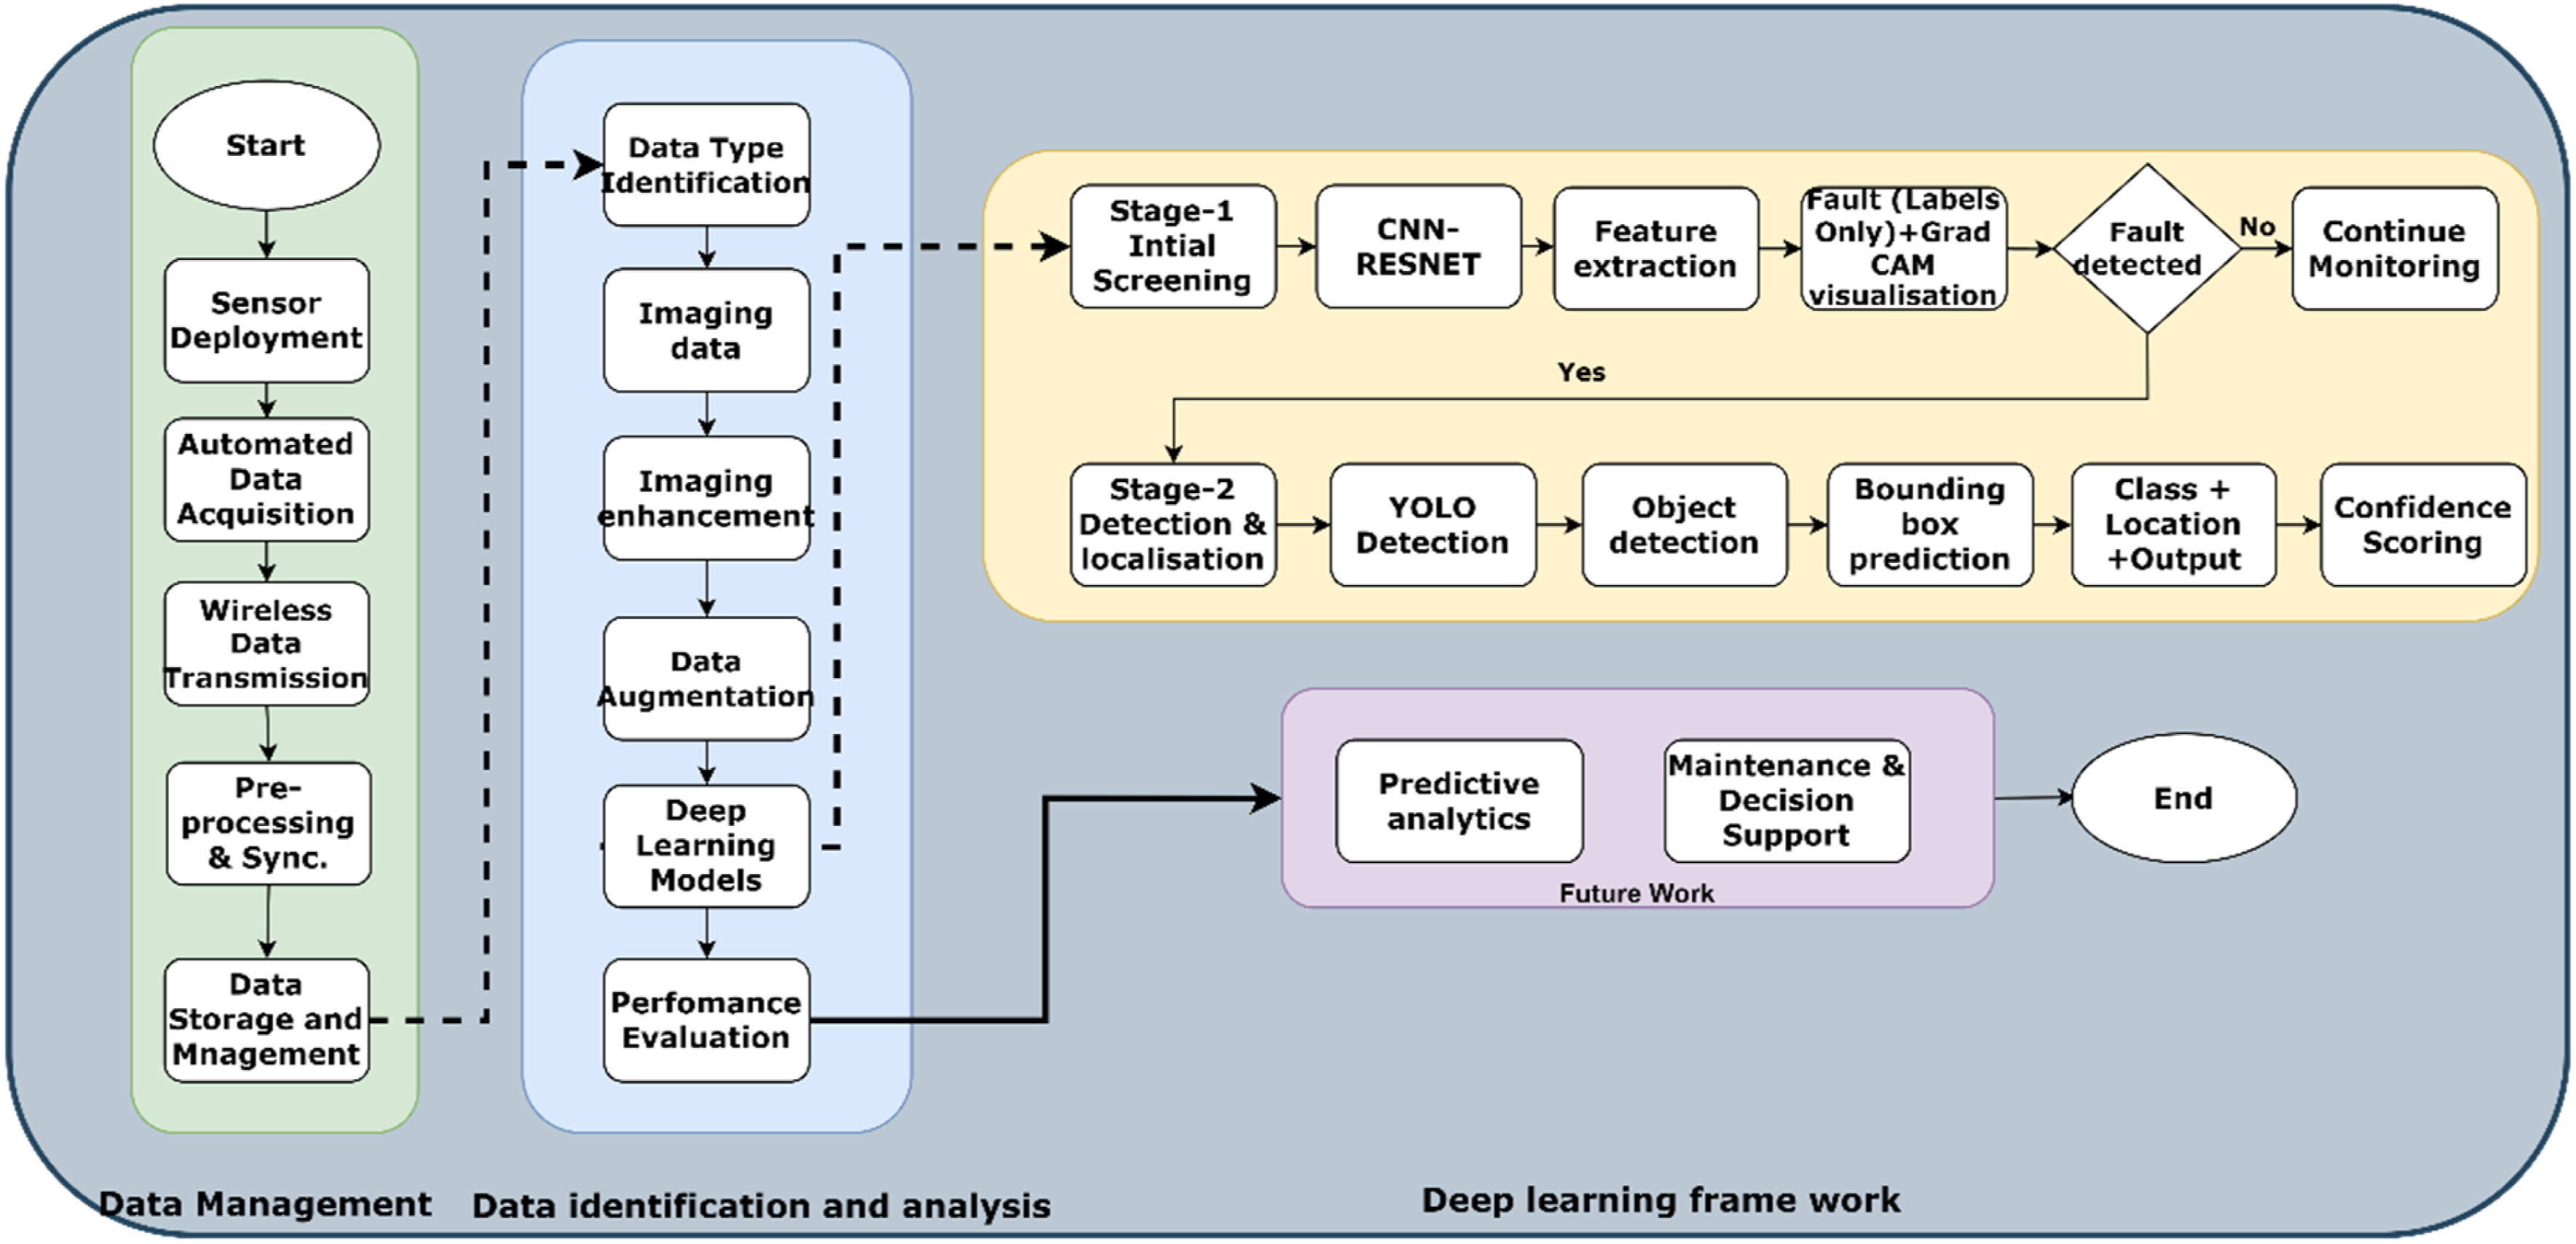
In the first stage of the proposed framework, ResNet (Residual Network) is employed as the screening tool. ResNet is a deep residual network designed to overcome vanishing gradient issues in deep convolutional neural networks (CNNs). It is widely used for learning rich feature representations. It is a lightweight and computationally efficient model that performs well on small and moderately sized datasets. In contrast, architectures such as VGG, EfficientNet, or MobileNet have significantly higher parameter counts. This increases the risk of overfitting, with a limited dataset. It learns deep representations from thermographic data and identifies abnormal patterns in pipelines. This step improves feature generalisation and narrows down potential anomaly regions.
In the second stage, YOLO (You Only Look Once), a real-time object detection model that efficiently detects and localises multiple objects in an image in a single pass. This stage serves as a local detector. It identifies the cracks, leaks, hot spots, or other structural defects within the screened regions. After the deep learning process, performance evaluation is carried out to assess the accuracy and robustness of the framework. Predictive analysis, maintenance, and decision support systems are considered as a future extension to forecast the progression of defects over time.
This screening - detection synergy ensures robust generalization and fast responsiveness. Infrared thermography is proven effective for detecting gas leaks in pipelines due to the Joule–Thomson effect. It is a phenomenon where pressurized gas rapidly cools down due to expansion. This creates a localized cold spot in thermal images, while the other structural defect will appear as an abnormal thermal pattern. This makes thermographic techniques quantitatively sensitive for early detection of leaks, even when they are invisible to the naked eye.
The present work introduces a two-stage framework that uses ResNet for rapid thermal-pattern screening and YOLO for bounding-region identification on the same thermographic domain. This integration is developed specifically for monitoring applications where large surfaces must first be examined for abnormal heating patterns before detailed localisation is attempted. The proposed framework provides a foundational step toward automated thermal monitoring of long gas transmission pipelines and establishes a proof of concept that can be further extended with larger thermal datasets and full performance evaluation in future studies. Building on these capabilities of infrared thermography for pipeline fault detection, the paper is organized as follows to present the proposed framework into five main sections. The introduction provides the background of the study, a review of existing literature, and identifies the research gaps, followed by the proposed integrated framework and methodology. Section 2 describes the experimental design, including the development of a pipeline fault simulation system, the sensor network setup, and the process of data pre-processing and annotation. Section 3 explains the implementation of the proposed two-stage fault detection framework. Section 4 presents the performance evaluation and results from both stages of the framework. Finally, Section 5 concludes the study, summarizing key findings and outlining directions for future work.
2. Experimental design and development of a pipeline fault simulation system for investigating thermal variations
2.1. Experimental framework
Simulated defects in experimental pipes and their relevance to real-world pipeline health.
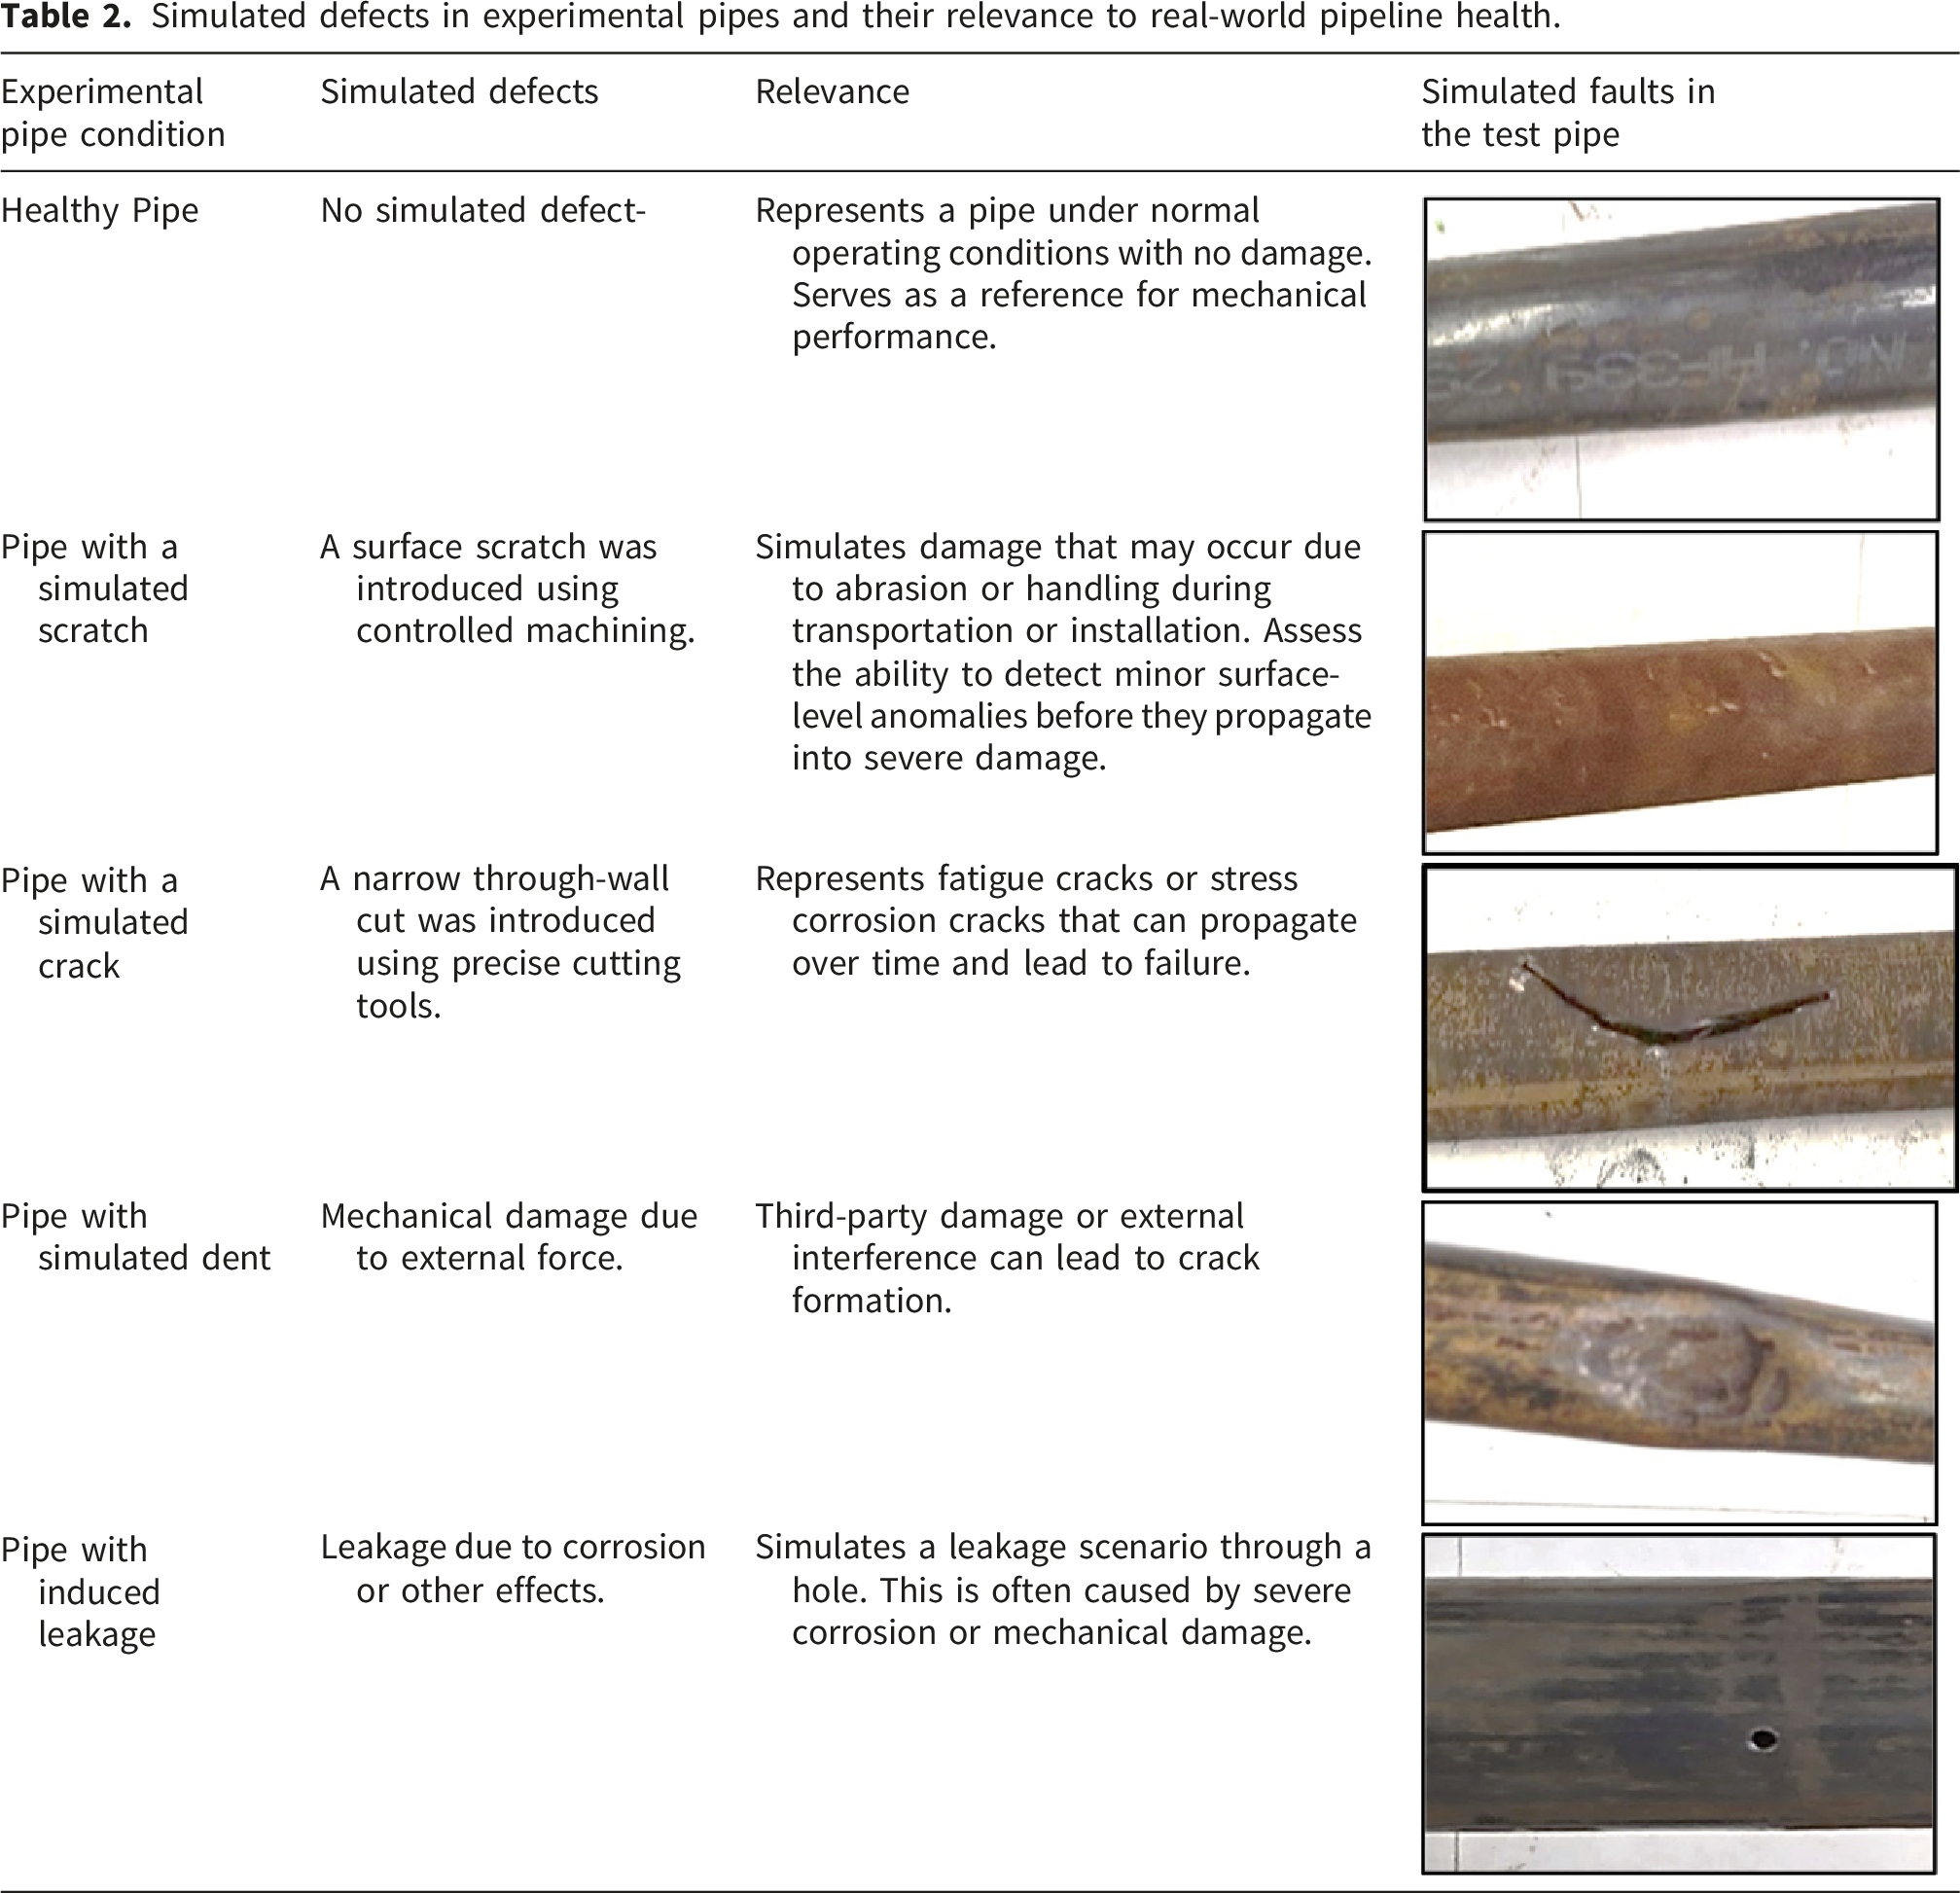
The custom-built experimental setup, as illustrated in Figure 2, was designed to simulate a controlled pipeline system and to monitor critical parameters and abnormalities along the pipe. Carbon steel pipeline sections are mounted securely on stands at both ends for structural stability and accurate data collection.
The laboratory setup was designed to simulate real pipeline operating conditions and capture both physical and thermal responses. The data collection nodes were used to continuously monitor the flow and pressure in the test pipeline. The thermal infrared module provided a non-contact method to track surface temperature variations, which are strongly influenced by faults. The thermal infrared camera was positioned at a fixed distance of approximately 90-95 cm from the pipe surface during all measurements. The distance was selected to maintain consistent image coverage and stable resolution. The camera was aligned perpendicular to the pipe surface to avoid any angular distortion. This setup ensured that no distance-related variations were introduced in the dataset. Natural disturbances such as motion blur, vibration, or camera shake did not occur because the thermal module was mounted on a stable stand. Ambient conditions were maintained throughout the experiments. The airflow around the pipe was also controlled to avoid surface cooling or heating. Minor thermal noise was naturally present in the images. However, other variations, such as changes in lighting, background interference, or fluctuating environmental conditions, were controlled for experimental repeatability.
This combination of thermal and sensor-based monitoring provides comprehensive fault detection and improves the reliability of the experimental study. The ambient environmental conditions during imaging were controlled for repeatability and to eliminate external thermal influences.
Figure 3 shows the complete arrangement, which represents the image of the lab-scale experiment set-up and thermal data during the experiment. Sample thermal image (Figure 2(c)) illustrates how localized heating patterns can be used as indicators of developing faults. A thermal camera is mounted with a connected display screen. It captures and visualizes the surface temperature distribution of the pipeline in real time. The data is transferred wirelessly to a centralized server for monitoring and storage. These images highlight surface heating patterns and highlight variations caused by different pipeline conditions. Complete experimental arrangement.
2.2. Sensor network design and data acquisition
The experimental setup consists of a compact integrated assembly of a Raspberry Pi, a touchscreen display, and a TOPDON TC001 infrared thermographic camera. A TC001 infrared thermal camera was used to obtain the thermographic images. The camera can measure temperatures between -20 °C and 550 °C and operates in the 8–14 µm infrared spectral range. It has a noise-equivalent temperature difference (NETD) of less than 40 mK and a thermal image resolution of 256×192 pixels. This makes it possible to identify minute temperature changes of 0.1 °C. A field of view of approximately 56°× 42° is used to record thermal data at a frame rate of 25 Hz. With dimensions of 71 × 42 × 14 mm and a weight of about 30 g, the TC001 is a lightweight, compact design that can be used for both fixed installations in continuous monitoring setups and portable inspections.
The Raspberry Pi was mounted directly on the back of the touchscreen and forming a single portable unit as presented in Figure 4. This will process and display the images simultaneously. The TC001 camera was connected to the Raspberry Pi through a USB-C interface, and a Python-based control program was implemented to capture thermal images at predefined regular intervals. The live thermal feed from the camera was displayed on the integrated screen for real-time visualisation. All captured images were stored locally on the Raspberry Pi for subsequent analysis. Sensor network design for thermography-based monitoring.
This module provided continuous thermal mapping and allowed for observing the defect-induced gradient on-site. However, the deep learning experiments of the ResNet-based screening stage and the YOLO-based detection stage were performed on a workstation. The objective of this work was to first evaluate the feasibility and performance of the proposed two-stage AI framework under controlled computational conditions. All AI training and inference tests were conducted on a laptop with an Intel Core i7 processor (2.8 GHz), 16 GB RAM, and an NVIDIA GTX 1650 GPU. The ResNet screening stage required 12-15 ms per image, and the YOLO detection stage required 22-28 ms per image. This confirms that the proposed approach is computationally lightweight and suitable for real-time thermal data processing. Future work can be optimised through the implementation of AI platforms such as NVIDIA Jetson Nano or Xavier NX for complete on-device defect screening and detection.
The same assembly can be implemented for continuous monitoring by installing a camera at critical pipeline locations such as joints, bends, and corrosion-prone zones. The thermal images at these critical locations can be transmitted periodically via Wi-Fi to a remote monitoring station. These make the setup highly suitable for fault detection in oil and gas pipelines.
2.3. Data pre-processing and annotation
The captured thermal images were first processed to remove blurred or low-quality samples.
Each image was then resized to a fixed resolution to maintain uniformity in the training process.
Images were enhanced for visibility of thermal patterns through contrast adjustment.
For the object detection stage, manual annotation of the images was performed using Roboflow. Bounding boxes were drawn around visible defects such as scratches, cracks, dents, and leaks. Each defect was assigned a class label according to its type, as shown in Figure 5. The annotated dataset was then exported in YOLO compatible format. These included the images and corresponding label files. With this step, the YOLO model could learn the location and type of each defect. The final dataset was divided into training, validation, and test sets. Sample thermal images from each defect class with their corresponding labels.
This split was performed for the model to be trained on one subset of data, validated on another to tune parameters, and tested on unseen data to evaluate performance.
After completing the preprocessing and annotation of thermographic images using Roboflow, the prepared dataset was utilised in the proposed fault detection pipeline. A two-stage framework was developed to systematically analyse and detect the defects in the pipeline efficiently. The first stage focuses on screening and classifying thermal images into defect categories, while the second stage performs precise localization and detection of faults on the pipeline surface. The following section provides a detailed explanation of the implementation of this two-stage detection framework.
3. Implementation of the two-stage fault detection framework
The two-stage framework begins with a screening stage designed to classify incoming thermal images and identify potential faults. This step also ensures that irrelevant data is filtered out and the defect-related images are forwarded for further detection. To achieve this, a ResNet-based classification approach was employed by transfer learning for accurate thermal image classifications.
3.1. Stage 1: ResNet-based screening and classification
Residual Networks (ResNet) are a type of deep convolutional neural network. They are designed to solve the problem of vanishing gradients in very deep networks. ResNet utilizes skip connections, which are also known as residual connections. These connections let the network pass information directly from one layer to another. This helps the network learn better and train deeper models without losing accuracy. For thermal image-based classification, ResNet has several advantages over traditional CNNs and shallow models. It improves feature extraction and also reduces the risk of overfitting. It can capture fine details in images due to pending pipeline defects such as cracks, dents, or scratches, or leakage conditions.
3.1.1. Experimental dataset and ResNet training setup
In the first stage, a deep residual network (ResNet-18) was employed as a screening tool to classify thermographic images into four pipeline defect categories: scratch, crack, dent, and hole. The dataset contained 1,451 thermal images, organized into separate folders per class and imported into MATLAB with labels derived from folder names. To balance the training dataset, moderate oversampling was implemented. To improve model generalization under variable real-world conditions, data augmentation was applied, such as random rotations (±45°), translations (±30 pixels), scaling, and both horizontal and vertical reflections. A transfer learning approach was adopted using the pretrained ResNet-18 architecture. This optimized configuration provided a robust and efficient model architecture for screening thermal images and identifying potential pipeline anomalies before defect localization.
The ResNet-based screening stage serves as a preliminary filter by classifying thermal images and identifying suspicious patterns that may correspond to pipeline defects.
Instead of processing all data with a computationally extensive detection method, only the flagged images are sent to the YOLO-based detection stage, as demonstrated in Figure 6. This strategy ensures that YOLO is used only on potentially suspicious areas for accurate localization and visual confirmation of defects to improve the system’s reliability. Two-stage ResNet–YOLO architecture for detection and localization of pipeline faults.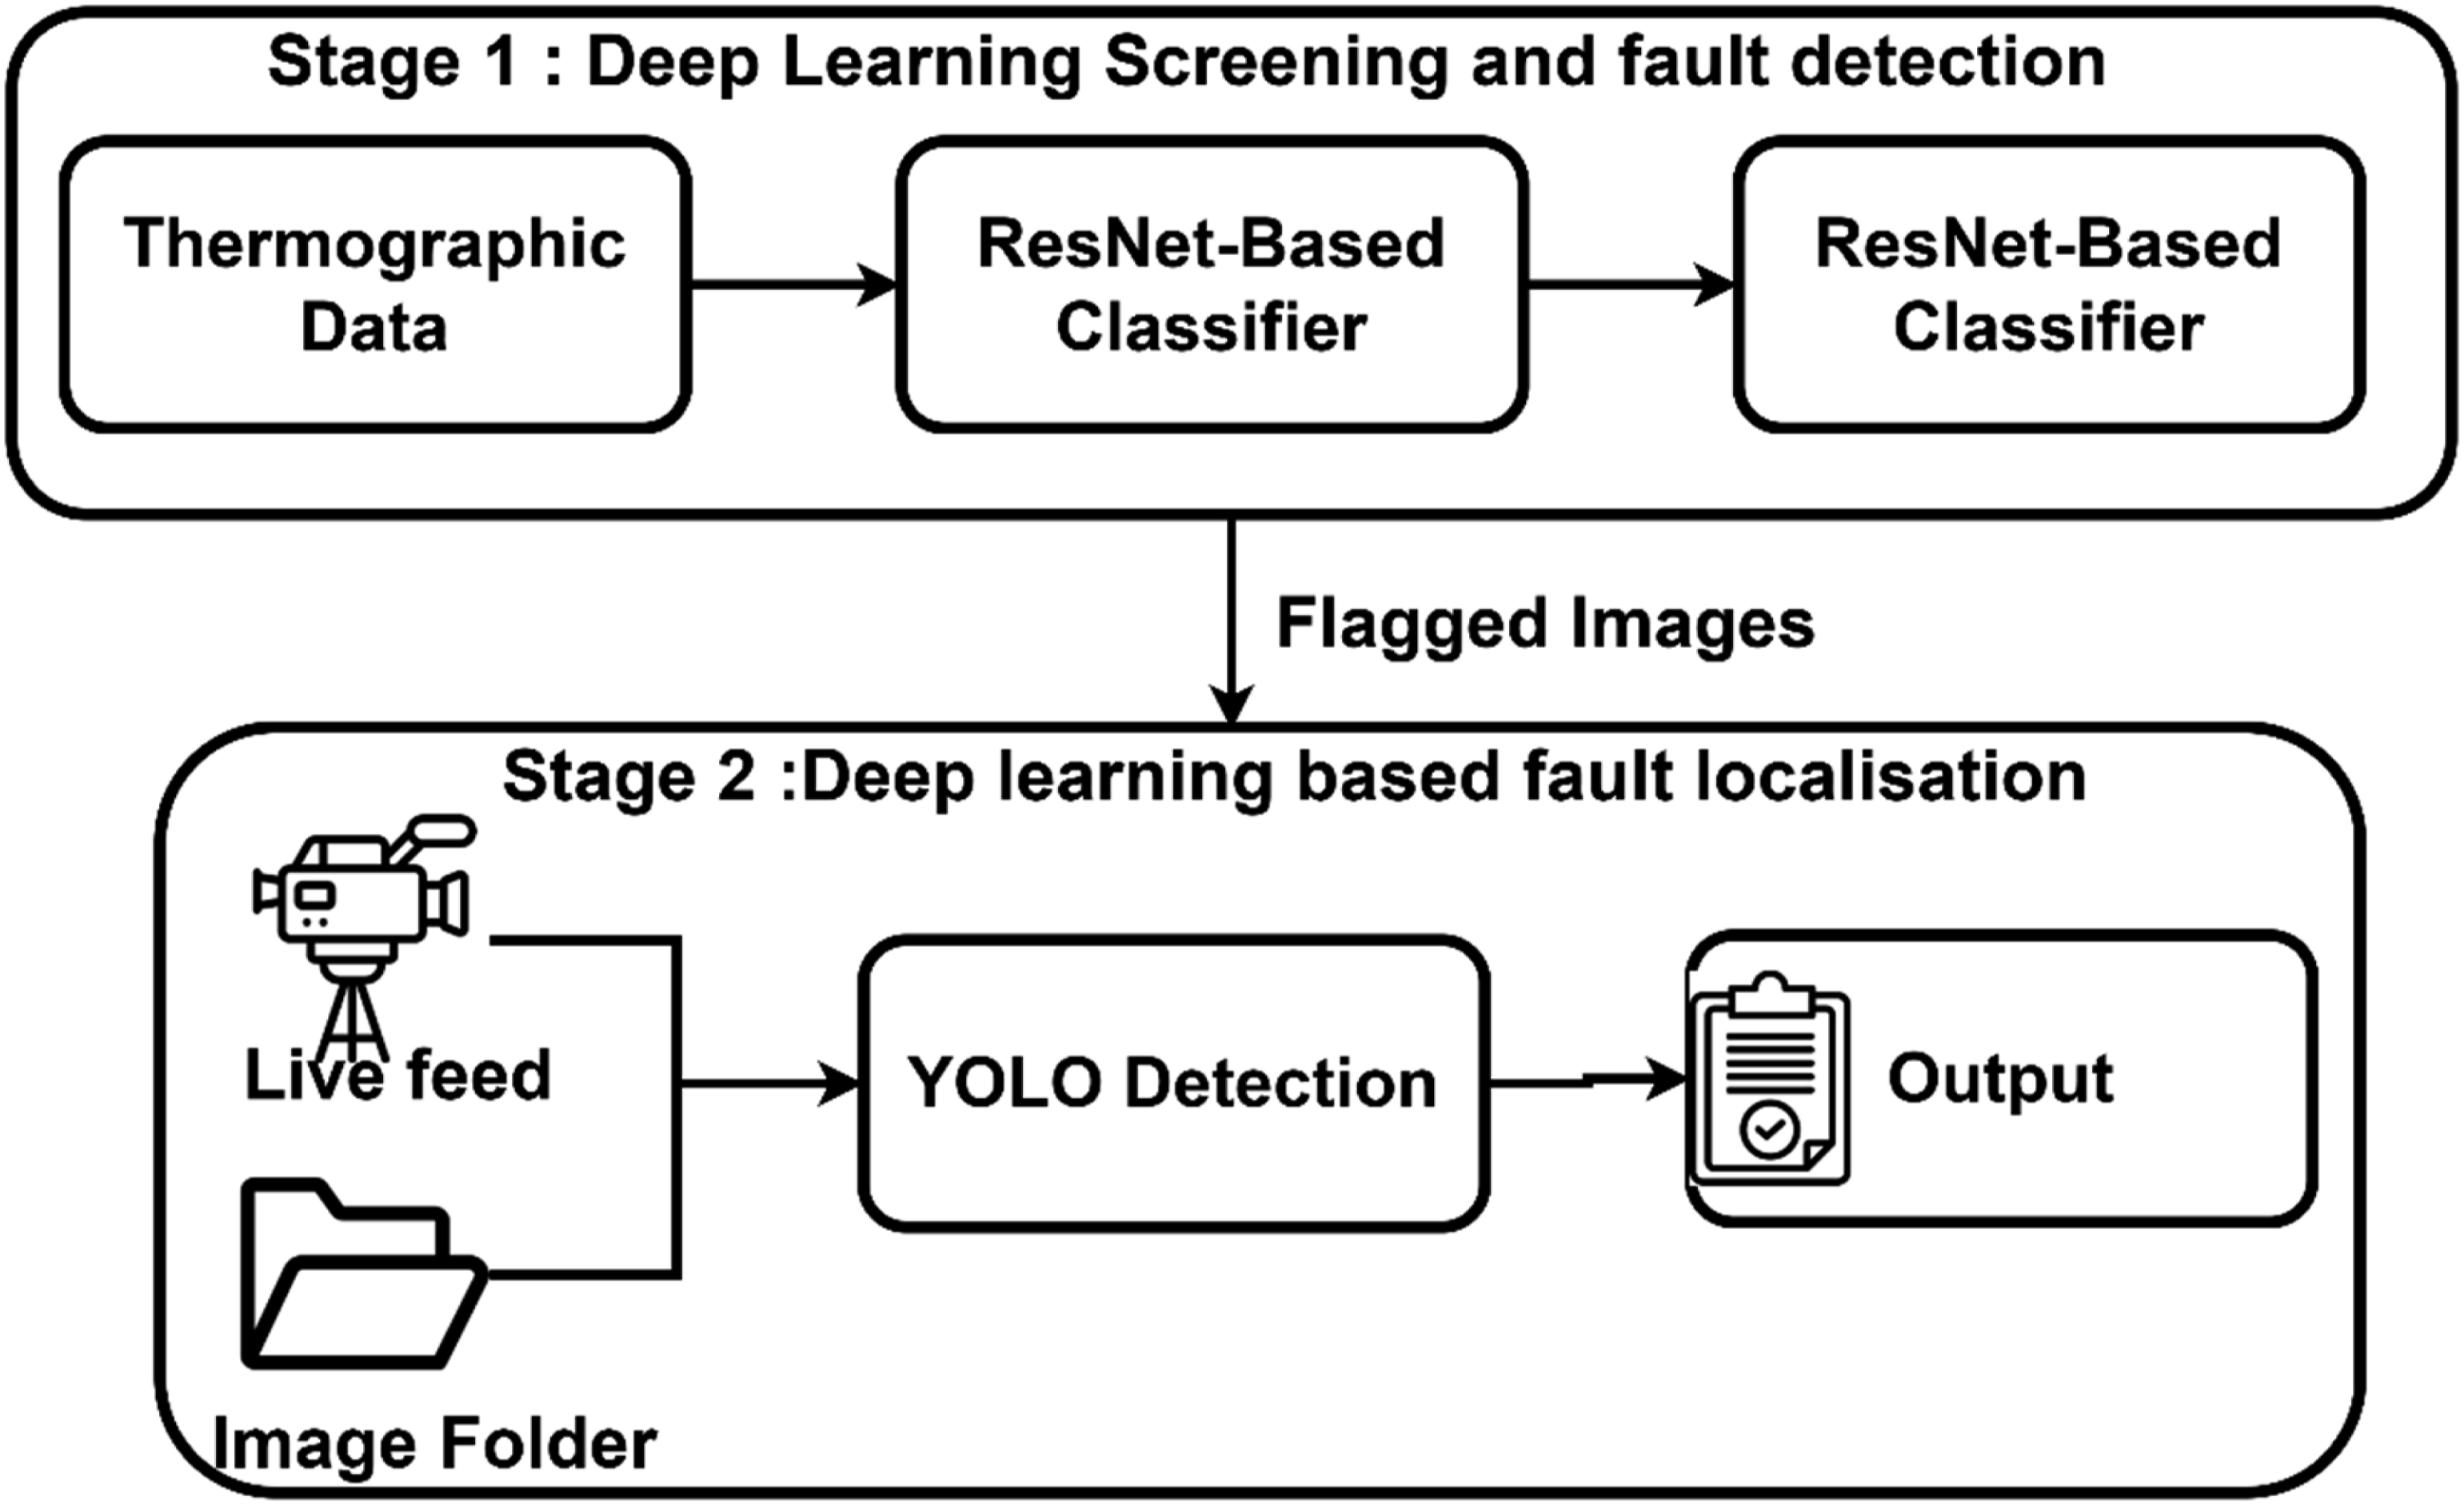
3.2. Stage 2: YOLO-based detection and localization
YOLO is a real-time object detection framework that predicts bounding boxes and class probabilities for multiple objects in a single pass. YOLO processes the entire image at once and thus reduces the computational load. It is suitable for detecting pipeline anomalies in thermal images due to its architecture, which is designed for speed and accuracy.
By applying YOLO to the regions flagged by the ResNet screening stage, the system can accurately localize cracks, dents, scratches, or holes. Following the initial signal-based screening and classification stage, the second stage of the methodology integrates a computer-vision-based detection tool developed using the YOLO (You Only Look Once) architecture. This stage aims to visually confirm and localize surface-level defects such as dents, cracks, holes, and scratches on the pipeline surface.
The proposed system offers two distinct modes of operation:
3.2.1. Live feed detection
In this mode, real-time data is acquired directly from a connected webcam or IP camera feed. Each frame is passed to the trained YOLO model. It performs object detection and overlays bounding boxes and confidence scores around detected defects. This mode is intended for continuous monitoring applications where immediate detection and alerting are critical.
3.2.2. Batch/folder-based image detection
Alternatively, the system can process a pre-stored set of images from a designated folder or database. Images are processed in batches to optimize visualization and review efficiency. This approach is particularly useful for post-event analysis, record-keeping, and validation of pipeline condition over time.
Both approaches utilize the same trained YOLO model but differ in data acquisition and processing workflows. The live-feed mode prioritizes real-time decision-making, whereas the batch-mode approach enables systematic offline inspection with visual documentation.
3.3. Scalability and real-time deployment considerations
The proposed methodology was validated under lab-scale conditions using a standard computer and moderate-sized datasets. It is important to note that the described experimental pipeline was implemented in a lab-scale environment using a Raspberry Pi, which is sufficient for image acquisition and batch processing. However, in a real-time industrial deployment, this setup would require a more robust computing platform or an industrial-grade computing device. These platforms should be equipped with graphics processing units (GPUs) for handling real-time inference and storing high volumes of thermal images. Moreover, the hyperparameters may need to be re-optimized to accommodate the larger and more diverse image datasets expected in field conditions.
Additionally, the experiments in this study were conducted under controlled indoor laboratory conditions to isolate defect-induced thermal variations. In real field environments, factors such as solar reflections, ambient conditions, and non-uniform background radiation can influence surface thermal patterns. In buried pipeline scenarios, surface thermal signatures are further affected by soil properties.
4. Performance evaluation and results
The performance of the proposed two-stage pipeline was evaluated in terms of classification accuracy, localization performance, and visual interpretability.
4.1. Stage 1 results: ResNet-based fault classification
The performance of the trained ResNet-18 model was evaluated using classification accuracy, confusion matrix analysis, feature visualization with t-SNE, and interpretability analysis with Grad-CAM. The following subsections present these results and highlight the model’s ability to focus on defect-relevant thermal regions.
4.1.1. Dataset and class distribution
The thermographic dataset consists of a total of 1,451 experimentally acquired images with an imbalanced class distribution due to the nature of fault generation during testing. The original class distribution before any processing was as follows: crack (491 images), dent (208 images), hole (241 images), and scratch (511 images). The dataset was split in a stratified manner into 70% training, 15% validation, and 15% testing subsets. Moderate oversampling was applied to the training dataset for class balancing. The validation and test datasets were kept unchanged. This approach ensures that the model learns balanced class representations during training. Performance evaluation remains unbiased and reflects real-world fault scenarios. Data augmentation and class-balanced sampling were employed to balance the variation in the class size.
4.1.2. Training and validation performance
Figure 7 illustrates the progression of training and validation accuracy and loss values over the training epochs for the ResNet-18 model. The network began with an initial training accuracy of 49.08% at epoch 1. It was rapidly improved to 96.88% in epoch 2 and achieved around 99% accuracy from epoch 6 onward. Correspondingly, the training loss decreased sharply from 1.8630 in the initial epoch to below 0.02 after the fourth epoch. This indicates fast and stable convergence. Validation accuracy also followed a similar trend with minimal oscillations in validation loss. Training and validation accuracy and loss curves for the ResNet-18 model.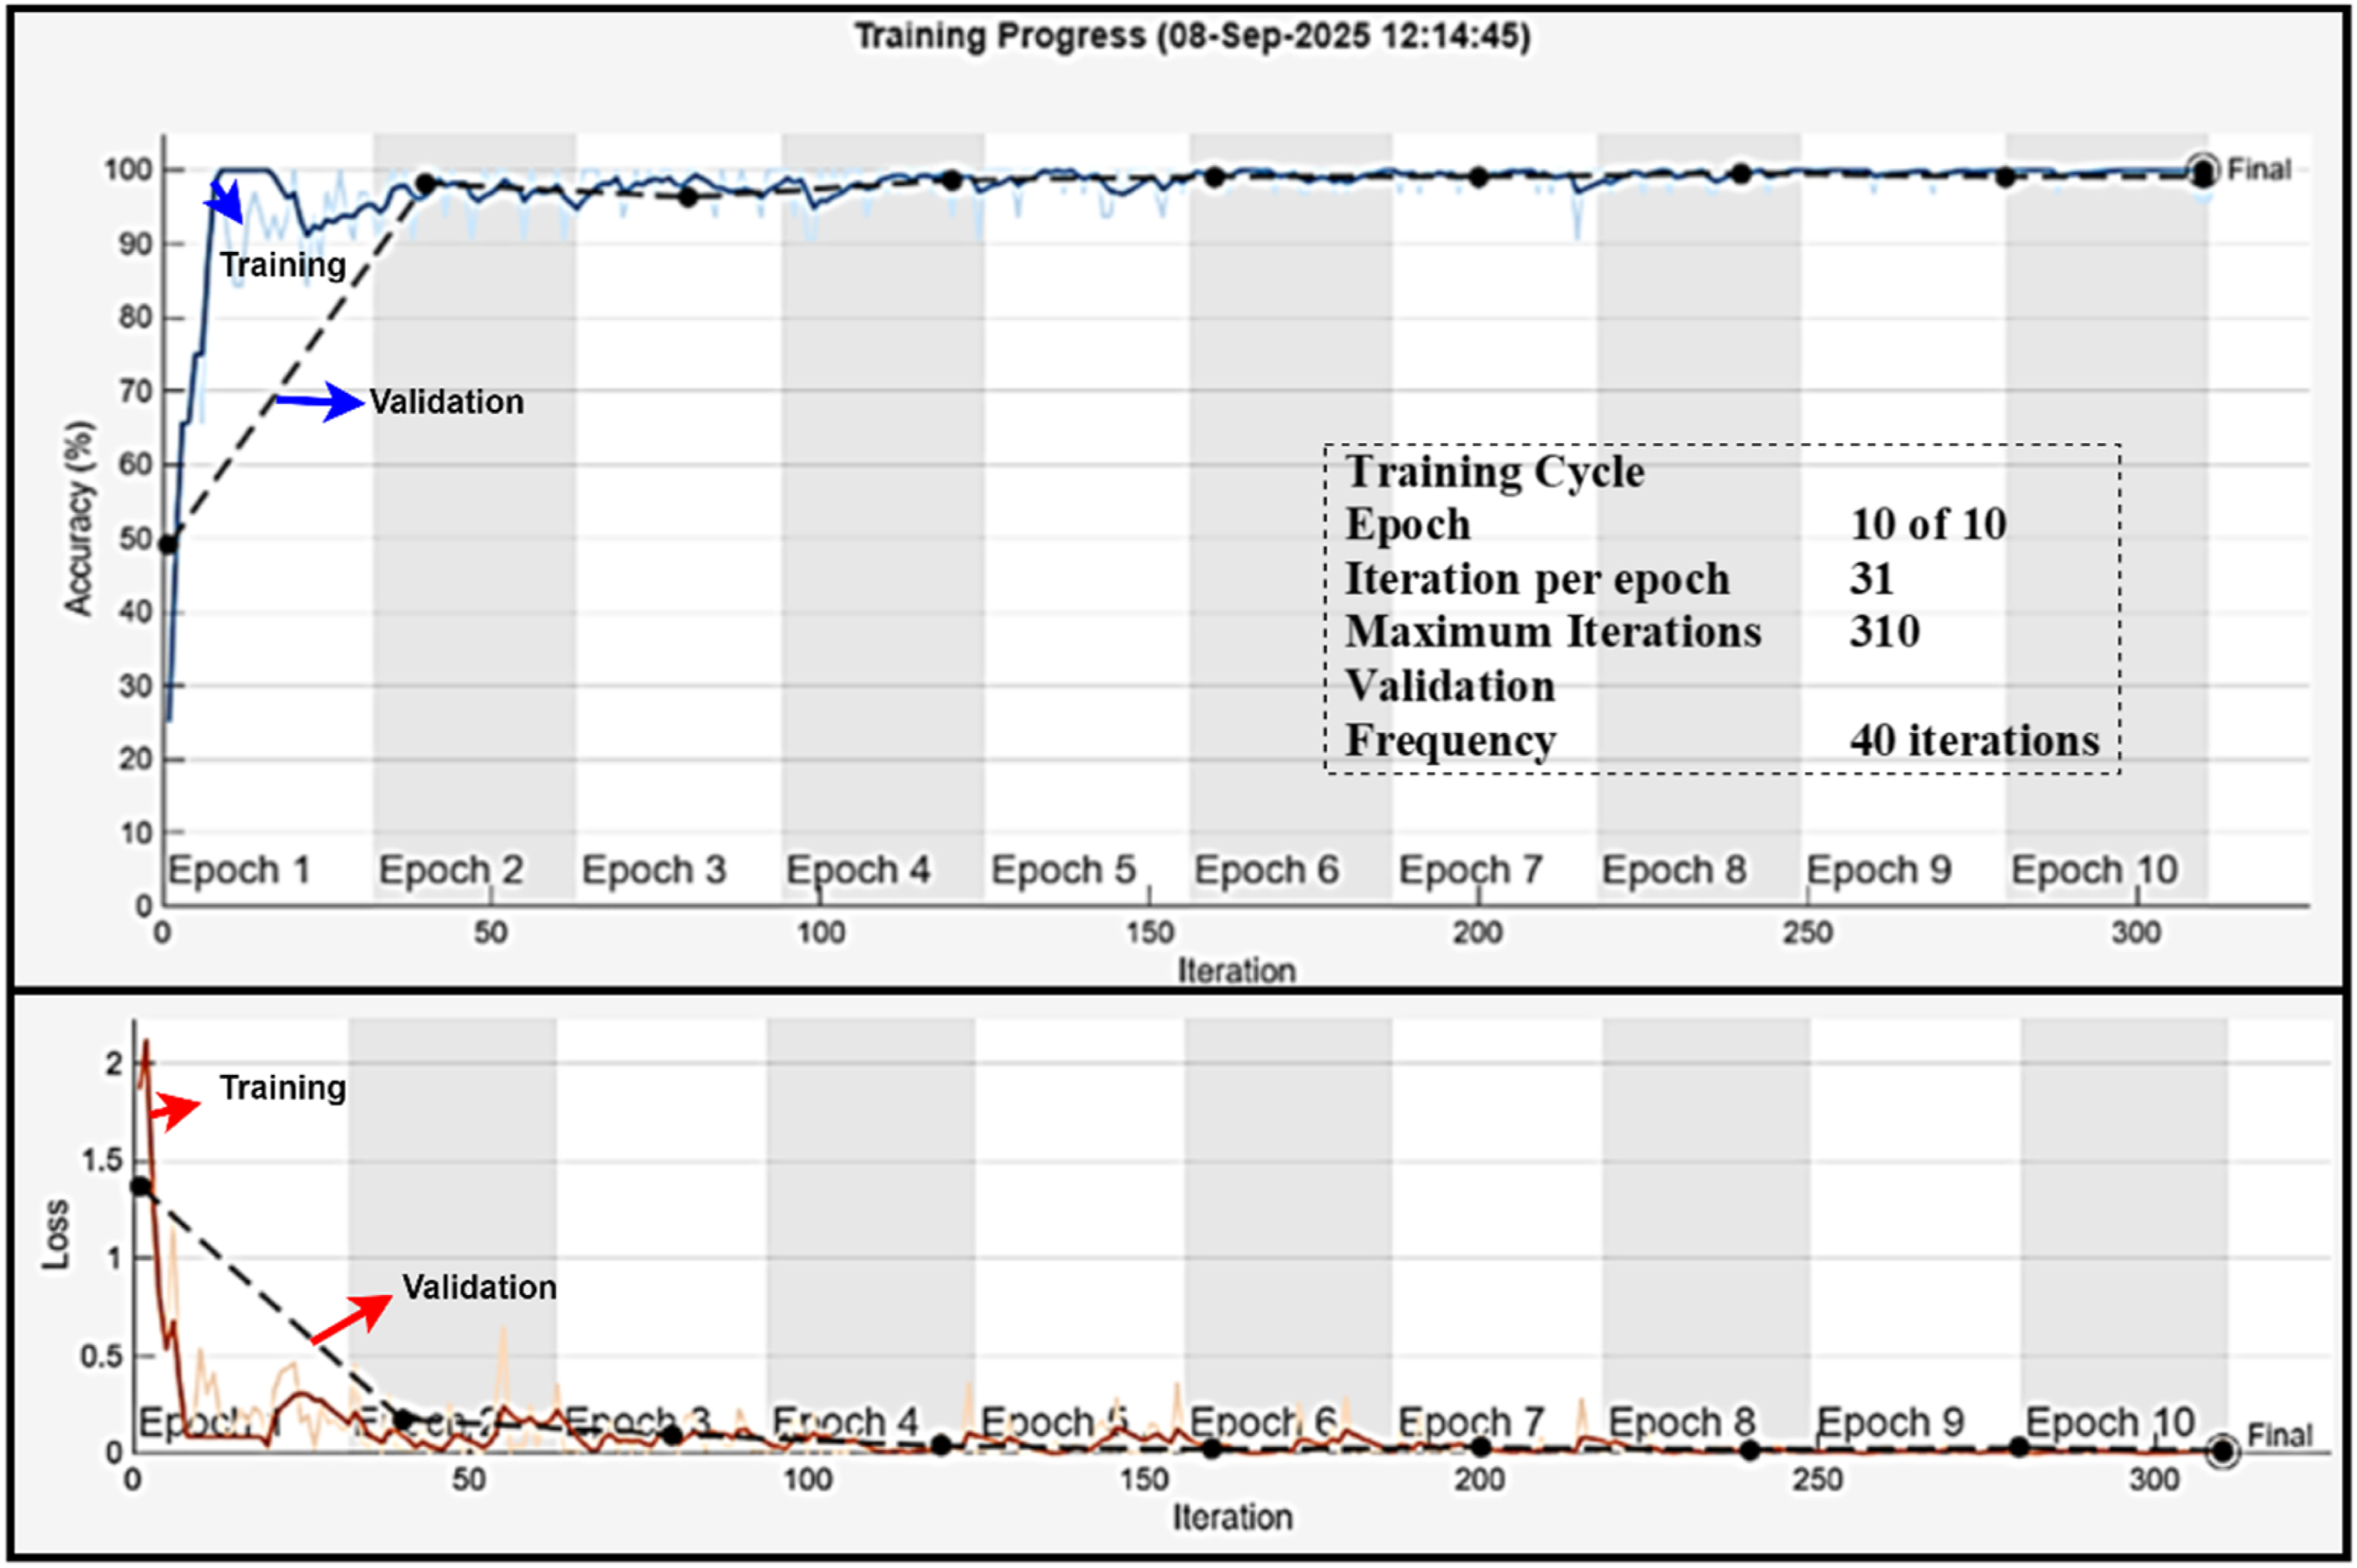
This consistent alignment between training and validation curves demonstrates that the network generalized well to unseen data. This makes the ResNet-based screening stage highly effective for thermographic defect classification.
4.1.3. Confusion matrix and class-wise performance
A confusion matrix was generated to visualize the classification results and highlight any class-wise misclassification trends.
Model performance on the validation set was evaluated using a confusion matrix (Figure 8). The confusion matrix provides direct computation of precision, recall, and F1-score for each defect category. The network correctly classified 73 crack images, 31 dent images, 36 hole images, and 76 scratch images. As a result, precision, recall, and F1-score values of 1.00 were achieved in the validation set. These results highlight the strong differentiative capability of the ResNet-based screening stage under the current experimental conditions. Confusion matrix for the ResNet screening stage.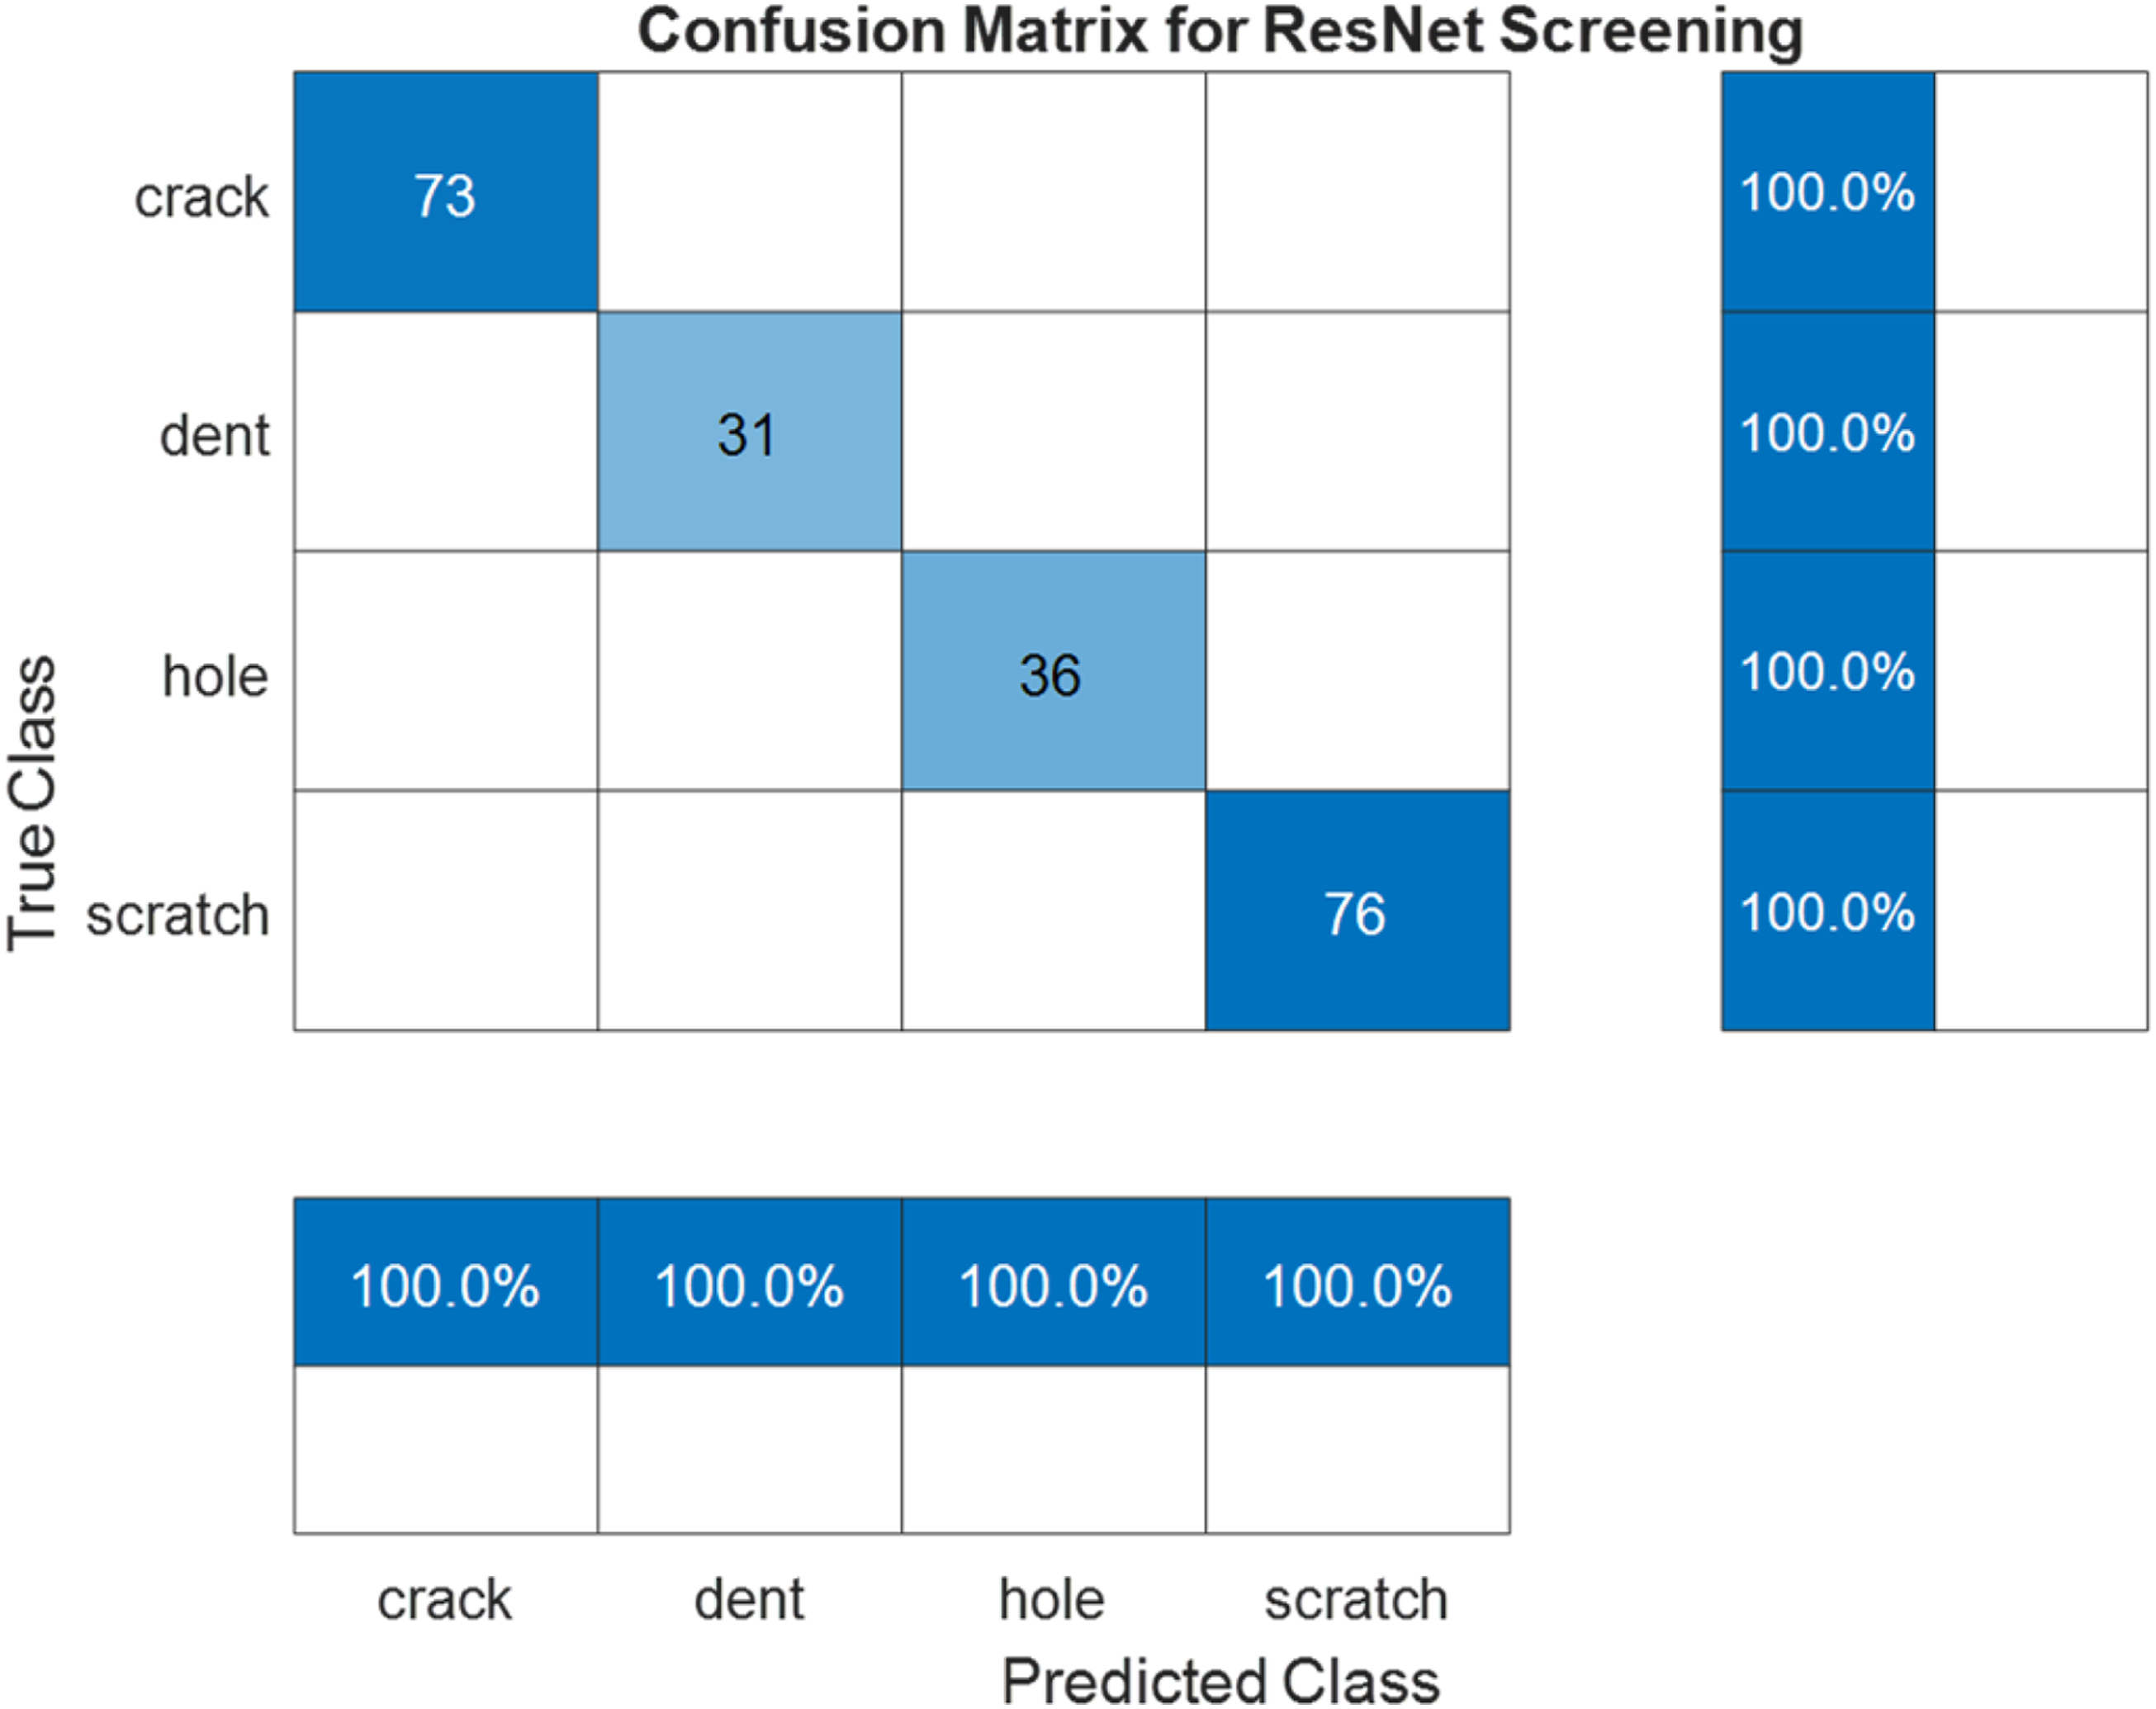
4.1.4. Feature representation using t-SNE
To examine how well the network separates different defect classes in feature space, t-distributed Stochastic Neighbor Embedding (t-SNE). t-SNE applied. It reduces the high-dimensional feature vectors into a two-dimensional space by retaining the local neighbourhood structure.
The 2D t-SNE plot (Figure 9) shows four distinct clusters corresponding to the fault classes: crack, dent, hole, and scratch. Most clusters are well separated. This confirms that the network learned discriminative features for classification. Two-dimensional t-SNE visualization of feature embeddings of ResNet-18.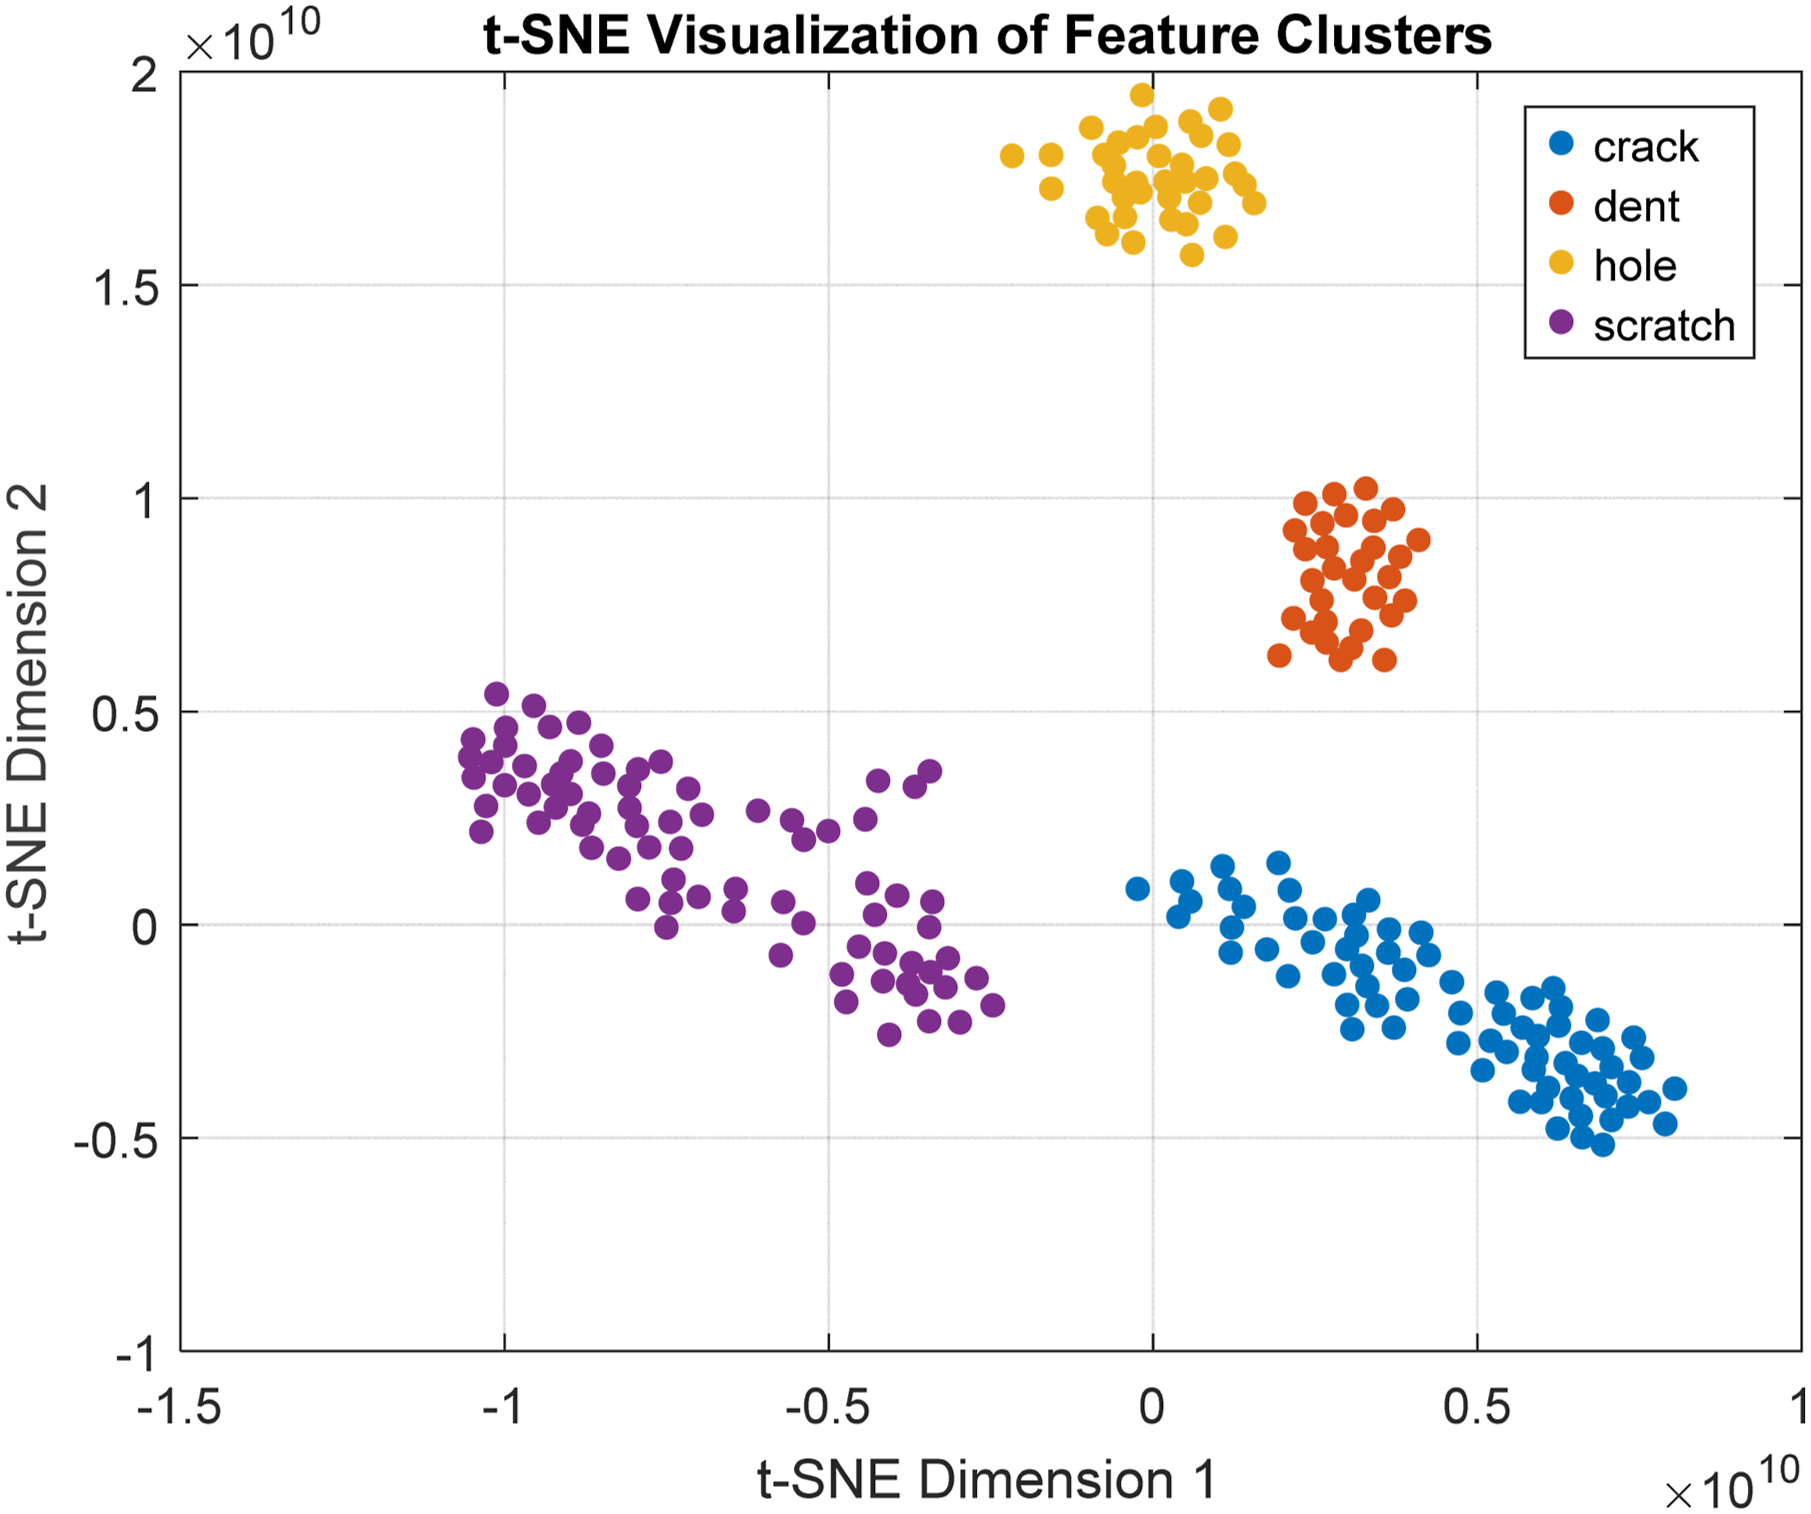
4.1.5. Grad-CAM-based model interpretability
To ensure model interpretability, Grad-CAM visualizations were generated for representative samples of each fault class (Figure 10). The highlighted regions in the heatmaps are well aligned with the defect locations. These demonstrate that the network’s decisions are based on meaningful features rather than background error. Grad-CAM visualizations highlighting model focuses for different pipeline defects: (a) crack, (b) dent, (c) hole, and (d) scratch. Warmer regions (red/yellow) indicate areas most influential in the classification.
The Grad-CAM for the crack samples highlights the elongated high-activation band aligned with the crack trajectory. Strong red-yellow activation is concentrated along the central segment of the defect, where the thermal gradient is most significant. This gradually weakens towards the edges. The surroundings suggest that the model also accounts for the nearby gradient field to understand the defect.
For the dent sample, the heatmap represents a rounded activation region centered over the dented area. The warm activation covers a broader surface compared to a narrow crack pattern. This reflects the sensitivity of the model to localize the deformation and its thermal footprint. The Grad-CAM result for the hole shows a sharply localized activation at the defect site. The heatmap highlights a small, well-defined hotspot that indicates where the model focuses to identify the fault. In the original thermographic image, the defect region appears as a low-temperature zone due to gas expansion, but the Grad-CAM clearly emphasizes it as a hotspot for classification. This bounded focus reflects the localized nature of material loss and confirms the model’s ability to detect small but critical defects that may develop into leakage paths.
In the scratch sample, the heatmap highlights a thin, elongated activation zone following the surface mark. Compared to cracks, the activations are less intense and more diffuse. It is consistent with the weaker thermal contrast of scratches. At certain points, the highlighted area extends slightly beyond the scratch edges. This indicates that the network also considers minor emissivity variations or texture changes around the defect.
4.2. Stage 2 results: Automated detection using YOLO
The YOLO-based detection framework was trained using a dataset of approximately 1,451 annotated images across four defect categories: dents, cracks, holes, and scratches. The system was able to effectively detect and localize faults by producing bounding boxes and confidence scores around the identified regions. This demonstrates the capability of YOLO to capture surface-level anomalies and provide interpretable visual evidence of the defect. Both single-image batch processing and live-feed processing showed consistent bounding box generation, validating the feasibility of this approach for real-world applications.
The YOLO-based framework demonstrated strong capability in detecting and localizing pipeline defects (Figure 11(a) and (b)). Bounding boxes were consistently generated around defect regions, even when misclassification occurred. This confirms that the system has effectively learned where faults are located. YOLO detection results for pipeline defects: (a) hole correctly identified, (b) scratch correctly identified, (c) crack misclassified as scratch, and (d) dent misclassified as crack. Bounding boxes indicate the detected regions with corresponding confidence scores.
However, the model showed difficulty in distinguishing between visually similar fault types. Dents were misclassified as cracks in some instances, and cracks were confused with scratches. These errors highlight the challenge of differentiating the defect categories with similar thermal gradients, as highlighted in Figure 11(c) and (d). The error arises due to two main factors:
Importantly, the system’s strength lies in its localization ability. Even in cases of misclassification, the bounding boxes reliably highlighted the defective region. This indicates that the architecture has successfully learned where defects are located but requires a more diverse and expanded dataset to learn what type of defect is present with higher accuracy.
At this proof-of-concept stage, quantitative performance metrics were not computed. The evaluation remains qualitative due to the restricted dataset. Future work will focus on dataset expansion, advanced data augmentation, and the application of standard evaluation metrics for more rigorous evaluation. Despite these limitations, the results present the feasibility of YOLO for defect detection in pipelines. The reliable localization of anomalies, even under misclassification, provides a valuable tool for live-feed monitoring as well as for offline inspection. These findings establish a strong foundation for extending the system to industrial-scale applications with large and diverse datasets and optimized models.
Conclusion
This work proposed a two-stage deep learning framework for gas pipeline integrity monitoring using thermography. Thermography was introduced as a non-contact, real-time inspection method that can capture subtle thermal anomalies linked to pipeline defects. Compared to conventional camera images, thermographic data provided stronger and more discriminative features for defect detection and classification.
The first stage of the framework employed ResNet with Grad-CAM visualization. This provides accurate classification of defects such as dents, cracks, holes, and scratches with clear interpretability of the model’s decisions. The Grad-CAM results highlighted the specific thermal regions used by the network and hence confirmed the effectiveness of thermography in identifying localized anomalies.
The second stage applied YOLO for defect localization. The bounding box predictions successfully identified fault regions in both single images and live feeds. Even when misclassifications occurred, the model consistently localized the defect, demonstrating robustness in practical monitoring scenarios.
The current dataset includes only single-defect scenarios. Therefore, the ResNet-based screening stage performs single-label classification by identifying the dominant defect in each thermographic image. The YOLO detection framework is capable of multi-object localization, but reliable detection of multiple simultaneous defects requires training on images containing simultaneous faults with corresponding annotations. Multi-defect detection is identified as an important direction for future work.
The experimental results confirmed that thermography, combined with deep learning, offers a promising solution for real-time monitoring of gas pipelines. The proposed framework establishes the feasibility of automated inspection at critical locations where traditional methods may be difficult or costly.
Future work includes creating a large and diverse database of thermal images by capturing various types of defects on both the pipeline surface and subsurface, along with quantitative evaluation metrics. Overall, this study demonstrates that thermography is a highly reliable inspection method and has significant potential for implementation as a continuous monitoring tool. The combination of thermography and deep learning provides a strong foundation for safe and reliable gas pipeline operations.
Footnotes
Funding
The authors disclosed receipt of the following financial support for the research, authorship, and/or publication of this article: This work is supported by Qatar University - International Research Collaboration Grant no. IRCC-2024-002.
Declaration of conflicting interests
The authors declared no potential conflicts of interest with respect to the research, authorship, and/or publication of this article.
Declaration of generative AI and AI-assisted technologies in the writing process
During the preparation of this article, we have used Grammarly and ChatGPT to improve the readability of some parts of the manuscript and enhance grammar. After using these tools, the authors reviewed and edited the content as needed and take full responsibility for the content of the published article. The authors highlight that these tools’ roles were to assist in refining the text and language, and not to replace any critical tasks of the authors.