
Abstract
Vibration-based health diagnosis in gearboxes aims to detect faults and degradation earlier, well before the prevalence of complete failure. Ultimately, deterioration leads to a gear train system failure, impacting the availability of the entire system. Early identification of faults permits a perfectly planned downtime to avoid major failure and to ensure reliable operation and significant expense savings. Gears are influenced to varying service conditions that are accidentally encountered to abnormal duty behaviour, would allow the diverse faults on teeth. These flaws trigger the severity rate using vibration at different loading conditions, and lower the efficiency of power transmission. The current work deals with introducing artificial fault modelling on the gear tooth through 0%, 25%, 50%, 100% broken tooth with applied loads ranging from 0Kg to 7.5 Kg with increase of 2.5 kg, on each case via condition monitoring viewpoint and concentrates through early identification of fault propagates in gear tooth with the different flaw sizes using vibration signal analysis. In this situation, both “vibration analysis” and “Ansys Vibration Analysis” have been introduced for the effective analysis of spur gears, which would result in validating information for fault monitoring. Validated the obtained experimental Vibration signal values with the ANSYS Explicit Dynamics.
Keywords
1. Introduction
A gearbox, the most critical component, in the spinning machinery, harnessed for motion transmission by velocity modulation, finding its use in power generation, automotive industries, rail applications, maritime and Aircraft etc., Defects in the gear assembly leads to abnormal operation, increased noise, poor efficiency and sometimes catastrophic failure of machinery, would lead to extending equipment downtime, If not monitored periodically.1,2 Condition monitoringinvolves the assessment of machine operating conditions and permits the timely detection of possible defects. From an industrial viewpoint, adopting a suitable diagnostic strategyminimizes downtime and the overall maintenanceexpenses. Data analysis stands outas a useful diagnostic approach, since it enables the direct characterization of the condition of the system. NumerousSophisticated signal analysismethods have emergedover the decades and complementtraditional approaches. Outcomes are different because each method is based on a unique theoretical foundation, and these outcomes are often inconsistent.3–6 Experimental study detecting gear tooth cracks under varying conditions using vibration features and neural networks, 1D-CNN and 2D-CNN to detect gearbox faults directly from raw vibration signals were found effective.7,8 Comprehensive review emphasizing data-driven fault diagnosis and emerging AI-enabled sensing, providing current benchmark methods. 9 Detecting early-stage gear pitting in operational conditions, highlighting high-frequency band-energy sensitivity to surface degradation. Investigated combined pitting + crack faults experimentally and numerically, showing how compound failures modify vibration signatures in multispeed conditions.10,11 Examination of crack growth mechanisms and vibration markers through hybrid simulation-experiment method; identifies sensitive statistical time-domain indicators. Considered friction/lubrication influence on cracked gear behaviour, showing friction-excited vibration amplifies damage-related harmonics.12,13 Tooth geometry affects vibration sensitivity, offering insight into why certain breakage levels create distinct amplitude signatures.14,15
1.1. Vibration analysis of gear tooth fault diagnosis
The anomaly identification in the machinery implies observing the machine with sufficiently frequent readings to find a performance decline before the system failure that takes place. Vibration analysis techniques are largely used in numerous industries to monitor equipment health status based on recorded vibration data.
16
Gearbox defect detection significantly hinges on vibration analysis due to its effectiveness in detecting early-stage mechanical issues. The intention of monitoring vibrations is to find irregularities caused by gear erosion and provide timely warnings before major failures occur. Early gear fault detection allows a properly scheduled outage of the whole machine to avert a disastrous situation. Figure 1 exemplifies the idea of monitoring changes in the vibration signal associated with a damaged tooth when it comes to gear engagement.17–20 Anomalies in machinery entail pinpointing faulty elements or subsystems that deviate from normal functioning. Even if the mechanical component fails and if it is not functioning properly, then the machine may continue to operate, though likely at poor performance or reliability.21–24 Therefore, the whole system may not bein a faulty state, since no System-wide failure has been observed across the entire unit. Identifying changes in the vibration signal resulting from the engagement of a cracked tooth.
In the realm of anomaly detection in gears, the single gear tooth can be considered a sub-item of the spur gear. A gear tooth is deemed defective if a crack appears, leading to a decline in its intended dynamic behavior beyond acceptable limits, indicating a failure has taken place. The gear’s performance will be suboptimal.25–28
2. Design and analysis of spur gear modelling
Details of the faulty spur gear.

Figure 2(a) is a healthy design without any spur gear tooth faults, and Figure 2(b)–(d) are the artificially created faults with the flaw size of 25%, 50% and 100% on the gear tooth. Simulation of the spur gear tooth damage.
2.1. Analysis of spur gear in Ansys
The vibration analysis of the spur gear was conducted using ANSYS software. Meshing is a vital step of the computer-assisted design and engineering process where the gear structure is discretized into a small number of elements. The FEA’s core idea is to calculate only a discreteset of points, then estimate the results acrossthe entire domain. A continuous object has infinite degree of freedom, and it is impractical to find the direct solution to the problem. Finite element analysis simplifies the degree of freedom from endless to finite with the help of discretization. Geometry has 27471 nodes and 137966 elements with a size of 5mm. The following Figure 3 shows the vibration simulation of anintact spur gear tooth in the Ansys Workbench.
35
(a) Shows the meshing of the spur gear, (b–e) show the vibration analysis of the spur gears with a gradual increase in load from 0 Kg to 7.5 Kg.
2.1.1. Case 1: Effect of load on healthy gear
Figure 3(a) shows the meshing of a healthy gear, while Figure 3(b)–(e) illustrate the vibration severity under different loads: 0 kg, 2.5 kg, 5 kg, and 7.5 kg, respectively. The result shows that as the load increases, the vibration severity also increases rapidly. The following graphs depict the vibration severity of spur gears over time (Figure 4). (a–d) of healthy gear without any flaws shows vibration severity with a variable load of 0kg, 2.5kg, 5kg, and 7.5 kg from 0.81256 m/s2 to 1.0613m/s2.
2.1.2. Case 2: Effect of load on 25% broken tooth
The following Figure 5(a)–(e) demonstrate the vibration simulation results for the spur gear with a 25% broken tooth, analysed using Ansys Workbench. The analysis provides valuable insights into the dynamic behaviour and vibration patterns of the 25% damaged gear, allowing for a deeper insight into the effects of tooth breakage on gear performance and potential failure mechanisms. Shows the meshing and analysis of the 25% broken tooth spur gear for a gradual increase in load from 0 to 7.5 Kg.
Figure 5(a) portrays the meshing of a spur gear with a 25% broken tooth, while Figure 6(a)–(d) display the vibration severity under different loads: 0 kg, 2.5 kg, 5 kg, and 7.5 kg, respectively. It is observed that as the load increases, the vibration severity escalates rapidly. These graphs demonstrate the vibration severity over time, providing valuable insights into the dynamic behaviour of the damaged gear under various load conditions. (a–d) of 25% broken gear tooth flaw and show vibration severity with a variable load of 0kg, 2.5kg, 5kg, and 7.5 kg from 1.0089 m/s2 to 1.3432m/s2.
2.1.3. Case 3: Effect of load on 50% broken tooth
The following Figure 7(a) shows the meshing of the spur gear and Figure 7(b)–(e) present the vibration simulation results for a spur gear with a 50% broken tooth, analysed using Ansys Workbench. This testing provides a detailed insight into the dynamic behaviour and vibration patterns of the gear under various conditions, highlighting the impact of significant tooth damage on gear performance and potential failure mechanisms. (a) represents the meshing of the 50% broken tooth spur gear; sequence of (b–e) demonstrate the frequency analysis of the spur gear as the loadgradually increases from 0 to 7.5 kg.
Figure 8(a)–(d) present the vibration severity experienced under varying loads from 0 kg, 2.5 kg, 5 kg, and 7.5 kg, respectively. The results clearly show that the vibration severity manifests a rapid increase as the load increases, revealing the crucial impact of load on gear vibration. These graphs offer a clear representation of how the vibration severity evolves over time, offering meaningful observations into the dynamic nature of the damaged gear under different loads. (a–d) display the vibration intensity of the 50% broken tooth at a load from 0 to 7.5 Kg.
2.1.4. Case 4: Effect of load on 100% broken tooth
The following Figure 9(a)–(e) present a comprehensive vibration simulation analysis of a spur gear with a 100% broken tooth, conducted using Ansys Workbench. This simulation provides an in-depth examination of the gear’s dynamic behavior and vibration patterns under various conditions, highlighting the critical effects of complete tooth failure on gear performance and structural integrity. (a) portrays the meshing pattern of 100% broken tooth spur gear, and (b–e) show the vibration severity of the spur gears at various loading conditions.
Figure 9(a) illustrates the meshing of a gear with a 100% broken tooth, while Figure 10(a)–(d) display the vibration intensity under different loads ranging from 0 kg to 7.5 kg, gradually increasing with a step load of 2.5 kg, respectively. As the applied load increases, a corresponding rapid escalation in vibration severity is observed. These graphs provide a detailed representation of the vibration severity over time, offering valuable insights into the dynamic behavior of the completely damaged gear under various load conditions. (a): vibration severity of 100% broken tooth at (b): vibration severity of 100% broken tooth at 0 Kgload 2.5 kg load. (c): vibration severity of 100% broken tooth at (d): vibration severity of 100% broken tooth at 5 kg load 7.5 kg load.
Graphs 10(a) through 10(d), representing a 100% broken gear tooth, clearly portray the vibration severity under variable loads of 0 kg, 2.5 kg, 5 kg, and 7.5 kg, with vibration severity values ranging from 0.89586 m/s2 to 2.388 m/s2. This significant increase in vibration severity highlights the substantial impact of load variations on gear dynamics and potential failure mechanisms.36,37
3. Experimentation
3.1. Experimental setup
The setup for the experimentation used in this research is depicted in Figure 11(a) comprises a 3-HP motor connected to a magnetic brake offering a constant torque power transmission through a dual-stage gearbox. The system is managed with a variable speed controller and integrated with several accelerometers and a digital tachometer. These accelerometers are placed on the intermediate shaft’s bearing hub in vertical, horizontal, and axial directions for data gatheringand on the motor for activating data collection. Both accelerations and tachometer data are sampled at a rate of20 kHz using a dSPACE data acquisition system with an Analog-to-digital converter (ADC) board. The input shaft speed is regulated via a computer interfacevia a USB connection to the variable speed controller and tachometer. The schematic overview of the experimental test rig is displayed in the Figure 11(b). (a) Experimental test rig (b) Graphical representation.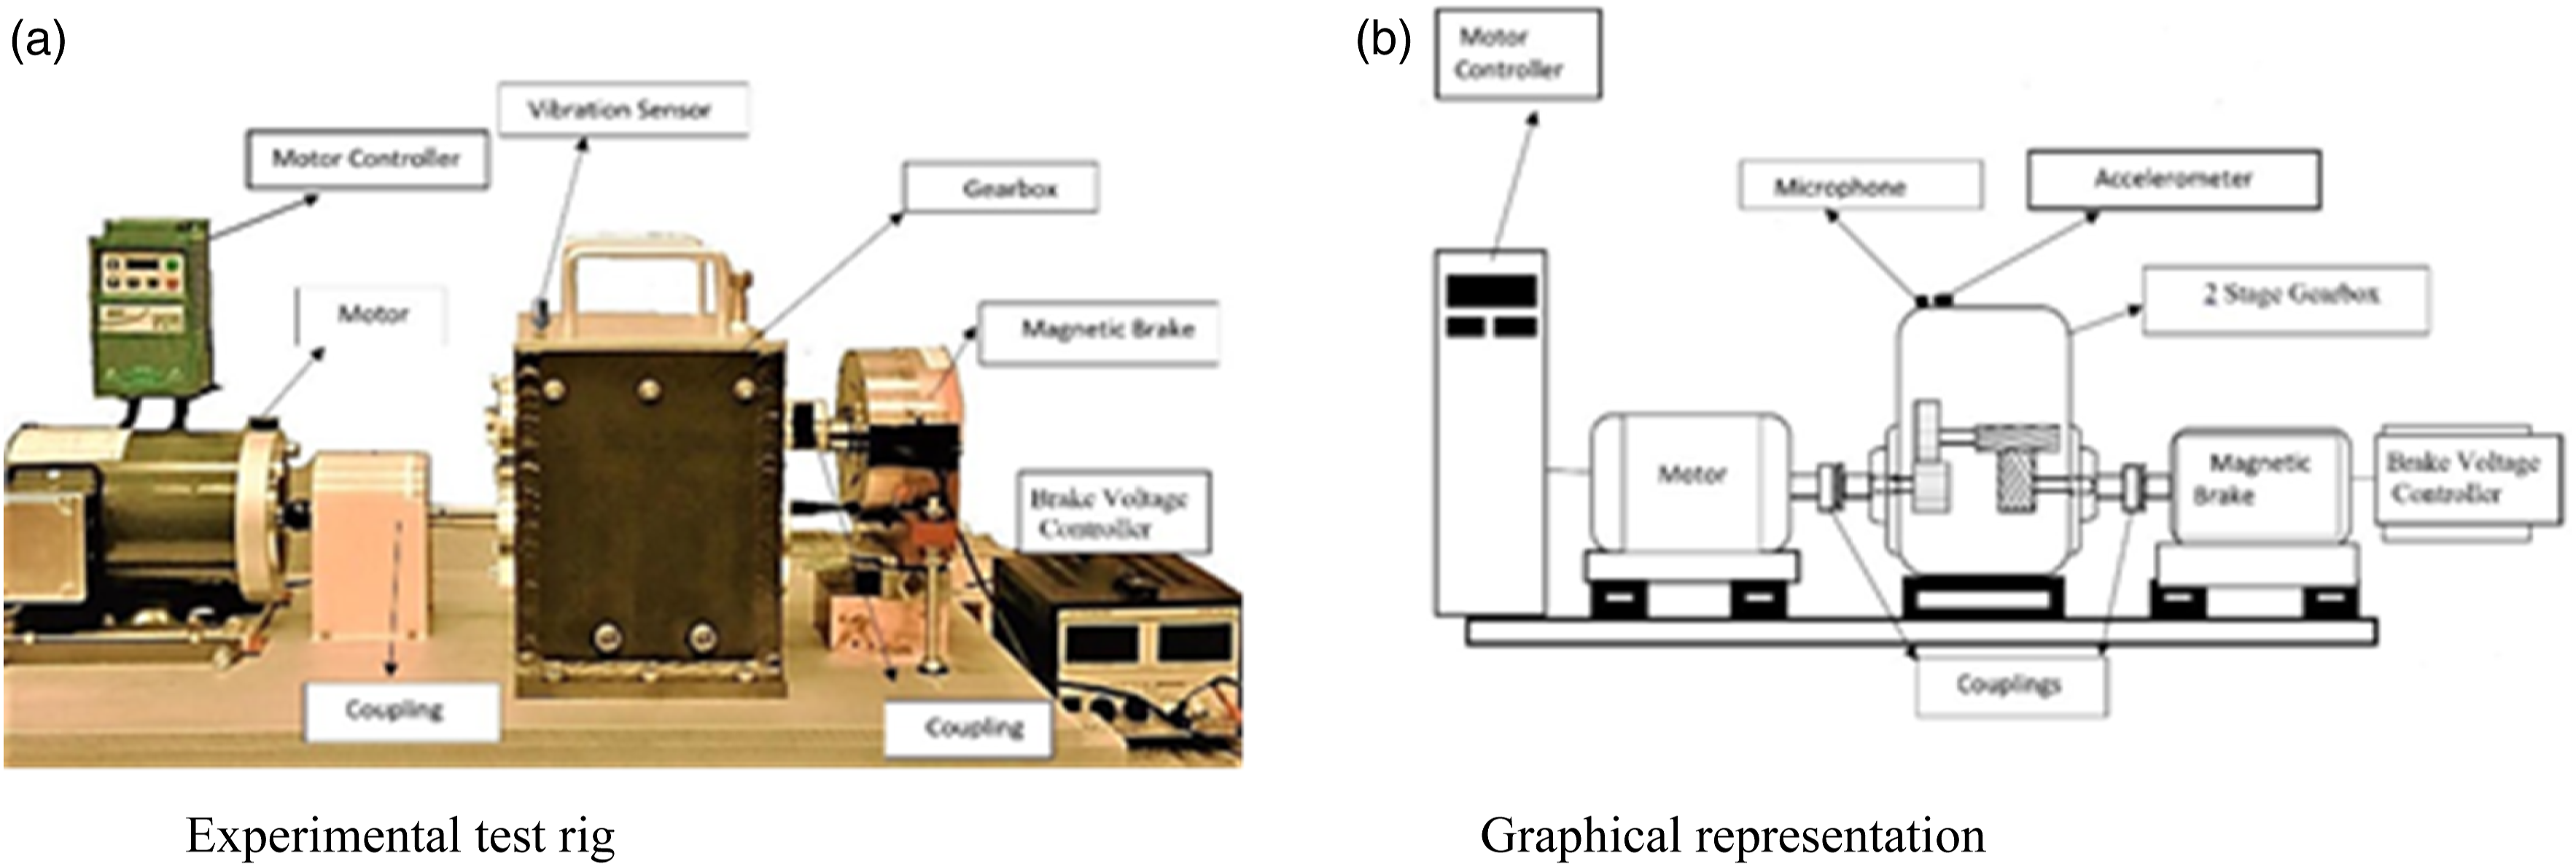
Figure 12 presents a visual representation of spur gear teeth with varying levels of damage: (a) 25% broken tooth, (b) 50% broken tooth, and (c) 100% broken tooth. These artificially induced faults enable the investigation of fault severity and its impact on gear performance, allowing for a detailed analysis of the relationship between damage extent and vibration response. Shows the broken spur gears.
Figure 12 illustrates three cases of gear tooth damage: (a) a tooth with 25% damage, (b) a tooth with 50% damage, and (c) a tooth with 100% damage. These artificially created faults are designed to simulate real-world scenarios, enabling researchers to investigate the relationship between fault severity and gear performance, and ultimately develop more effective defect detection and diagnosis procedures.
3.2. Time-domain signal analysis of vibration signal for different faulty spur gears with increasing loads
Vibration measurements generated from rotating machinery equipmentare typically recorded in the time domain using appropriate sensors. The human inspection of vibration signals as part of time-domain fault diagnosis can be categorized into two primary types: visual examination and feature-based analysis. This chapter explores time-domain vibration signal processing by focusing on statistical functions and advanced techniques that can be used to extract features from raw time-series vibration data, efficiently representing machine health. The advanced methods comprise time synchronous average, autoregressive moving average, filter-based approaches, stochastic parameter techniques, and blind source separation. Various statistical functions arewidely usedto extract features fromthe time domain vibration signal based on signal amplitude. Model-based vibration monitoring methods can enable finding machine faults even if data is available from the machine operated under normal condition.
When the excitation is applied as an input to the system, the response of vibration can be understood from the system with the help of transducers in any form, like the voltage, velocity, displacement, and acceleration, with the function of frequency response or time response. Time-domain analysis means conveying system information with respect to time in condition-based maintenance.
3.2.1. Case 1: Time domain analysis of healthy gear
The following Figure 13 present the time-domain vibration data of a healthy spur gear, providing valuable insights into its dynamic behavior and vibration characteristics under normal operating conditions. This data serves as a baseline for comparison with vibration signals from faulty gears, enabling the identification of distinctive patterns and anomalies indicative of damage or degradation. Time domain vibration measurements for the spur gear under 0-7.5 kg load.
The timedomain vibration data from Figure 13(a)–(d) for a healthy spur gear under varying loads (0 kg to 7.5 kg) demonstrate a noticeable increase in vibration intensity as the load gradually increases. Notably, the vibration levels rise from 0.9326 m/s2 to 1.0836 m/s2, indicating a direct relationship between load and vibration amplitude. This highlights the importance of considering load conditions when analysing and interpreting vibration data for gear health monitoring.
3.2.2. Case 2: Effect of loads on 25% broken tooth
The following Figure 14(a)–(d) visualise the time-domain vibration measurements of a 25% broken tooth spur gear, furnishing valuable information on the gear’s dynamic nature and vibration characteristics under defective conditions. This data facilitatesthe identification of distinctive patterns and anomalies in the vibration signals, informing the development of reliable fault detection and diagnosis procedure. Time domain signal measurements data for the broken tooth spur gear (25%) subjected to 0 to 7.5 kg load.
The time-domain vibration signal data from Figure 14(a)–(d) for a 25% broken tooth spur gear under applied loads (0 kg to 7.5 kg) displayed a significant amplification in vibration intensity as the load increased. To be precise, the vibration levels surge from 1.0283 m/s2 to 1.4032 m/s2, showing a strong relationship between load and vibration amplitude. This observation emphasizes the importance of considering load effects when analysing vibration data for gear systems fault diagnosis.
3.2.3. Case 3: Effect of loads on 50% broken tooth
The following Figure from 15(a)–(d) represent the time-domain vibration measurement data of a 50% broken toothspur gear, showcasing the impact of considerabletooth damage on the gear’s vibration attributes. This data provides crucial information on the changes in vibration characteristics and magnitude, facilitating the effective fault detection and diagnosis methods for gear systems. Time domain signal data for the 50% broken tooth spur gear, ranging from 0 to 7.5 kg load.
The time-domain vibration measurement data from Figure 15(a)–(d) for a 50% broken tooth spur gear under applied loads from 0 kg to 7.5 kg demonstrates a significant increase in vibration intensity as the load escalates. Particularly, the vibration levels rise from 1.5721 m/s2 to 2.2089 m/s2, confirming a clear link between load and vibration magnitude. This trend emphasizes the crucial impact of load and spur gear tooth damage on gear vibration, stressing the need for meticulous analysis in vibration-based fault diagnosis.
3.2.4. Case 4: Effect of loads on 100% broken tooth
The figures from 16(a)–(d) manifest the time-domain signal data of a 100% broken tooth spur gear, illustrating the dramatic effect of severe tooth failure on the gear’s vibration attributes. This data provides crucialinformationon the changes in vibration patterns and magnitude, paving the way for theestablishment of efficientdefect detection and diagnosis approaches for gear systems. (a) Time domain signal data of 100% broken (b) Time domain signal data of 100% broken tooth spur gear at 0 kg load tooth gear at 2.5 kg load (c) Time domain signal data of 100% broken (d) Time domain signal data of 100% broken tooth spur gear at 5 kg load tooth gear at 7.5 kg load.
The time-domain vibration signal data from Figure 16(a)–(d) for a100% broken tooth spur gear under load from 0 kg to 7.5 kg display a significantrise in vibration intensity as the load increases. Specifically, the vibration levels surge from 0.9132 m/s2 to 2.4029 m/s2, demonstrating a stark correlation between load and vibration amplitude. This dramatic rise in vibration levels underscores the critical influence of load conditions on gear dynamics, particularly in the presence of severe tooth damage.
4. Conclusions
Shows the vibration behaviour of the spur gear with different loads in 4 cases.

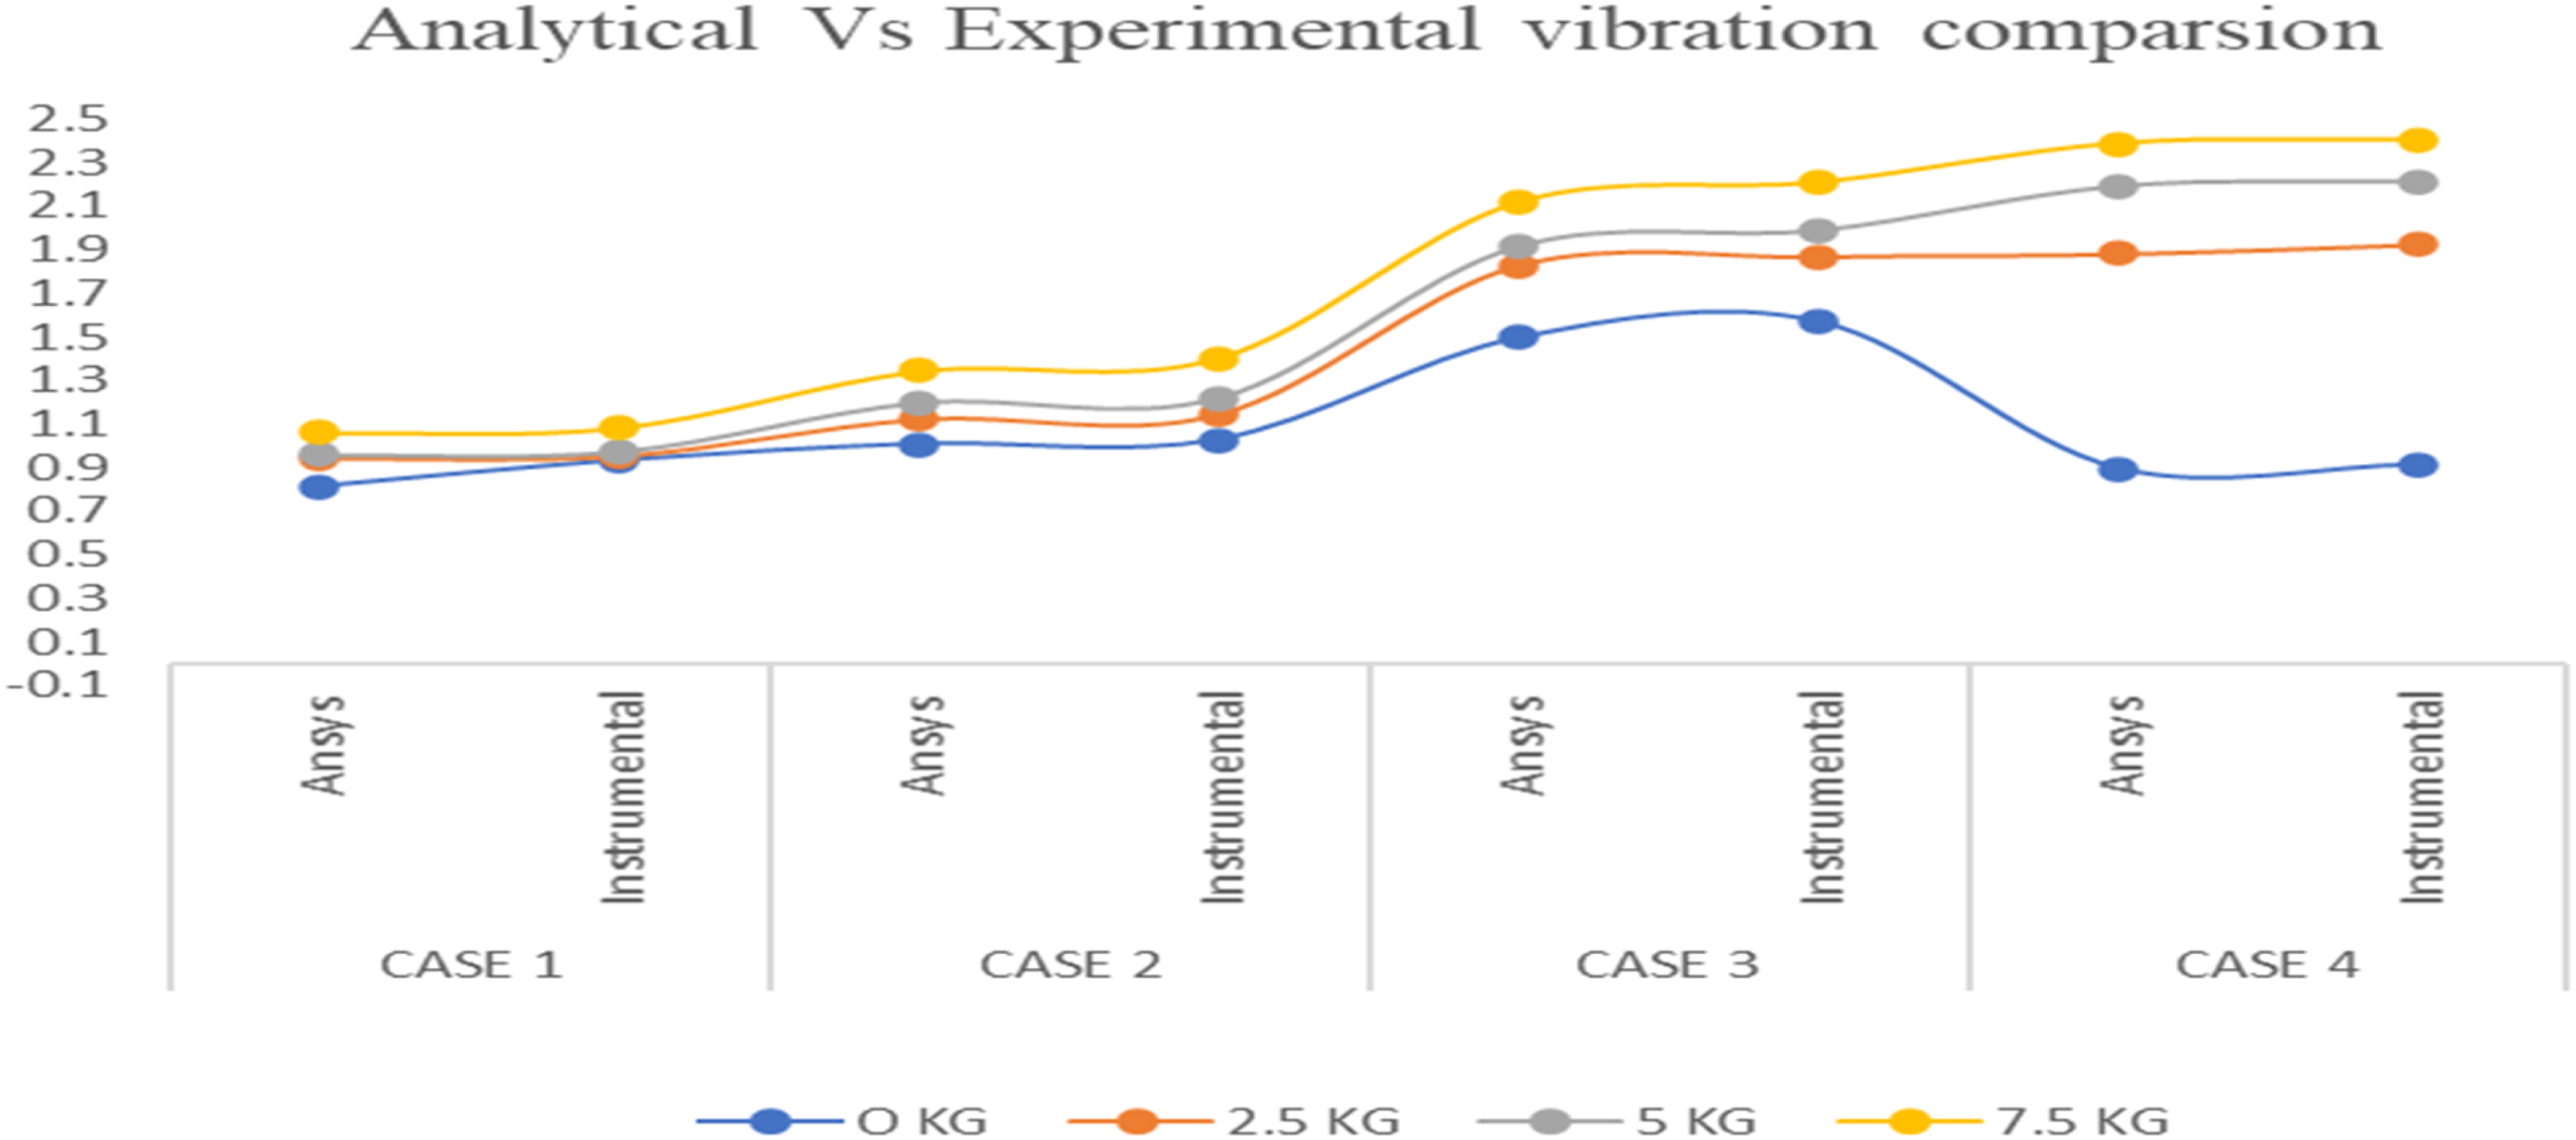
Comparison of vibration signal data from the Ansys and Experimental setup.
The above Table 2 and comparison graph show that the increased load on the gear will increase the vibration level. Also, increasing the fault size will increase the vibration severity. The vibration data of the 4th case at the initial load is reduced compared to cases 1, 2, and 3 at 0kg load because of the lack of teeth available (100 % tooth removed) when the load is added to the system. Again, it is observed that the severity of vibration increases compared to the initial 3 cases. The instrumental vibration values are higher than the Ansys values because the entire system was considered while taking experimental readings, but in the Ansys, only the gear and pinion were modelled in the Ansys system.
There is a rising trend towards leveraging prognostic parameters based on system analysis through numerous diagnostic procedures to monitor the health of the system or equipment. Monitoring helps in minimising machine downtime. A vibration signaturecaptured at the machine’s external surface or any appropriate place gives valuable information to showcase the present condition of the machine.
Footnotes
Funding
The authors received no financial support for the research, authorship, and/or publication of this article.
Declaration of conflicting interests
The authors declared no potential conflicts of interest with respect to the research, authorship, and/or publication of this article.