
Abstract
This paper presents an innovative approach to improve the assessment of mechanical responses in short-span bridges, introducing a novel method with significant implications for bridge engineering. The method integrates a convolutional neural network (CNN) and a multilayer perceptron (MLP) model to monitor stiffness degradation in bridge spans over time, representing a significant step forward in SHM techniques. By harnessing the power of neural networks, our approach enables simultaneous monitoring at multiple measurement points across spans or at various time intervals, providing valuable insights into bridge behavior. Through empirical validation, manuscript demonstrates the high accuracy achieved by our combined CNN and MLP model, augmented by power spectral density moments, in evaluating the quality of bridge projects throughout their operational lifespan. Moreover, our method proves highly effective in identifying potential hazardous areas on bridges and detecting structural damage in problematic spans, addressing critical safety concerns in infrastructure management. Furthermore, we propose the integration of data from both non-contact and contact sensors to further enhance the monitoring and assessment of bridge conditions, contributing to the development of more SHM strategies. Additionally, extending the scope of our research to encompass different bridge types and environmental conditions, such as marine environments or high-temperature settings, promises to elucidate the method’s versatility and widespread applicability in practical scenarios. Future directions for research include conducting additional real-world tests on bridge structures to validate the method’s feasibility and accuracy under diverse conditions. In summary, this paper not only presents a cutting-edge methodology for assessing bridge health but also sets the stage for future advancements in structural monitoring technology, with profound implications for the safety and longevity of bridge infrastructure worldwide.
Keywords
Introduction
Structural Health Monitoring (SHM) systems are widely utilized across various fields due to their economic benefits, ability to enhance user safety, and potential for predicting future damage. Comprehensive investigations, such as those conducted in recent studies, have highlighted the significant role of SHM systems in assessing structural alterations. Field experiments have utilized various dynamic excitation sources, including wind, ocean waves, traffic-induced vibrations, and impact excitation, to evaluate their effectiveness. The responses of the bridges to distinct types of dynamic excitation were captured utilizing accelerometers affixed to the bridge deck. The real-time extraction and recording of data have captivated the interest of numerous researchers subsequently examined vibration-based damage detection (VBDD) within a real-world scenario.1–3 The fundamental principle underlying VBDD techniques lies in the notion that modal characteristics, such as shown in Figure 1. Research trends on VBDD.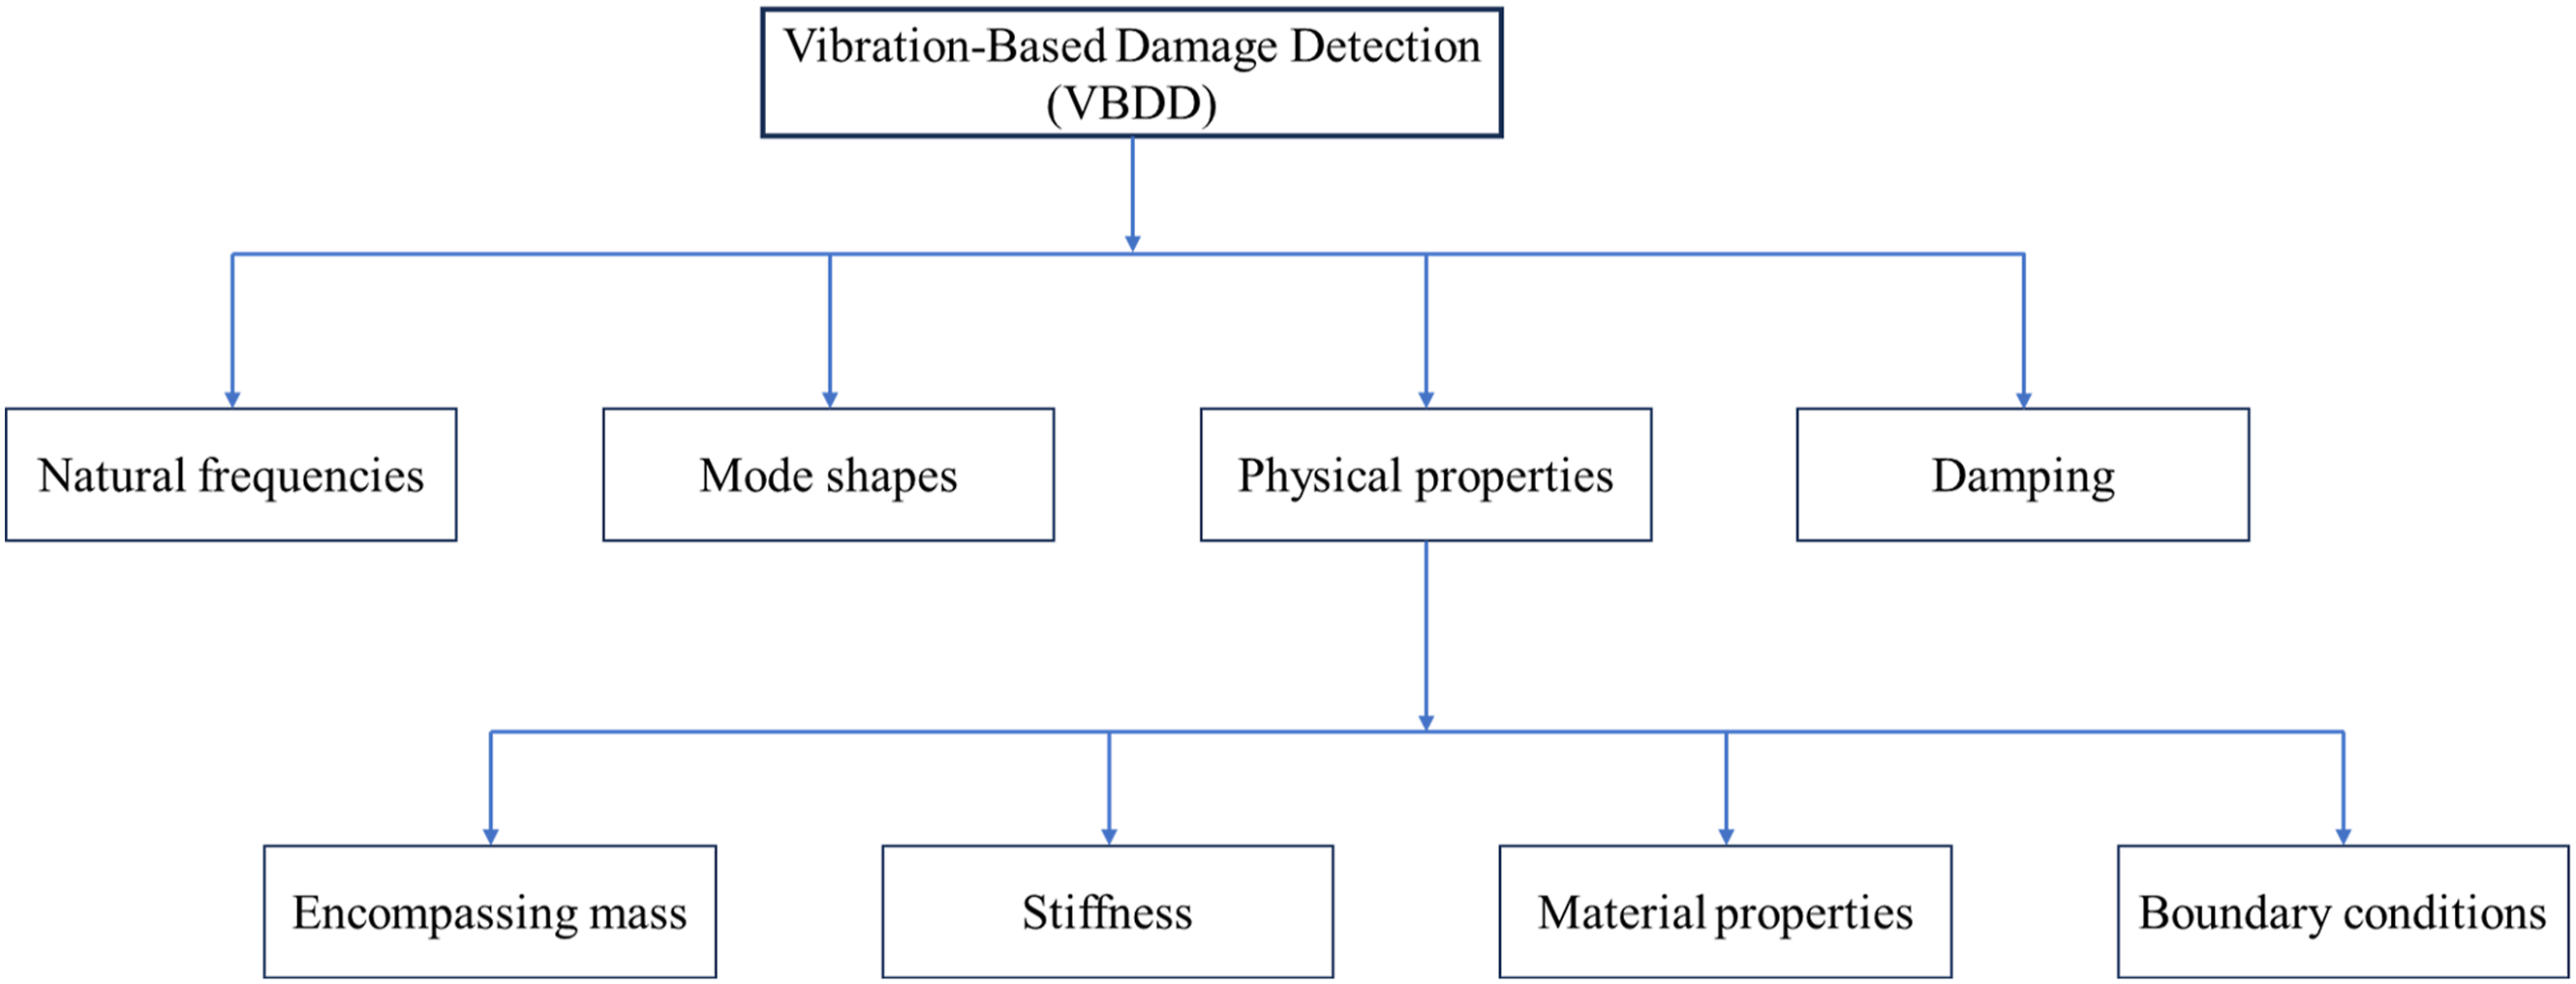
Any modifications occurring in the physical properties of the structure will consequently induce corresponding alterations in the modal properties.4,5 Ideally, to effectively monitor the health and condition of a structure, it is crucial to identify the primary response parameters and those that are susceptible to changes in the system’s physical properties. These parameters are commonly referred to as damage-sensitive features.6–8 The general approach for damage detection in structures involves extracting meaningful features from the measured data
9
and monitoring them for changes indicative of damage.
10
Addressing the challenge of environmental influences on vibration-based SHM, it becomes necessary to extract features that exhibit high sensitivity to damage while remaining unaffected by system variability and environmental factors. In recent years, global vibration-based methods have attracted considerable attention as alternatives to traditional local inspection techniques. Researchers, including those in recent studies, have proposed using vibration signals under ambient, unknown excitations, such as wind or traffic, combined with large arrays of sensors—often referred to as “smart dust”—for effective bridge monitoring.11,12 During the final phase of the SHM process, pattern recognition techniques are employed to examine the relationships between variations in features and structural changes. Two main approaches are commonly utilized in SHM as shown in Figure 2: model-based methods,13,14 which involve mathematical modeling and analysis of structural components, and non-model-based methods,15,16 which utilize signal processing techniques to extract features from measured responses. Some research model trends on SHM.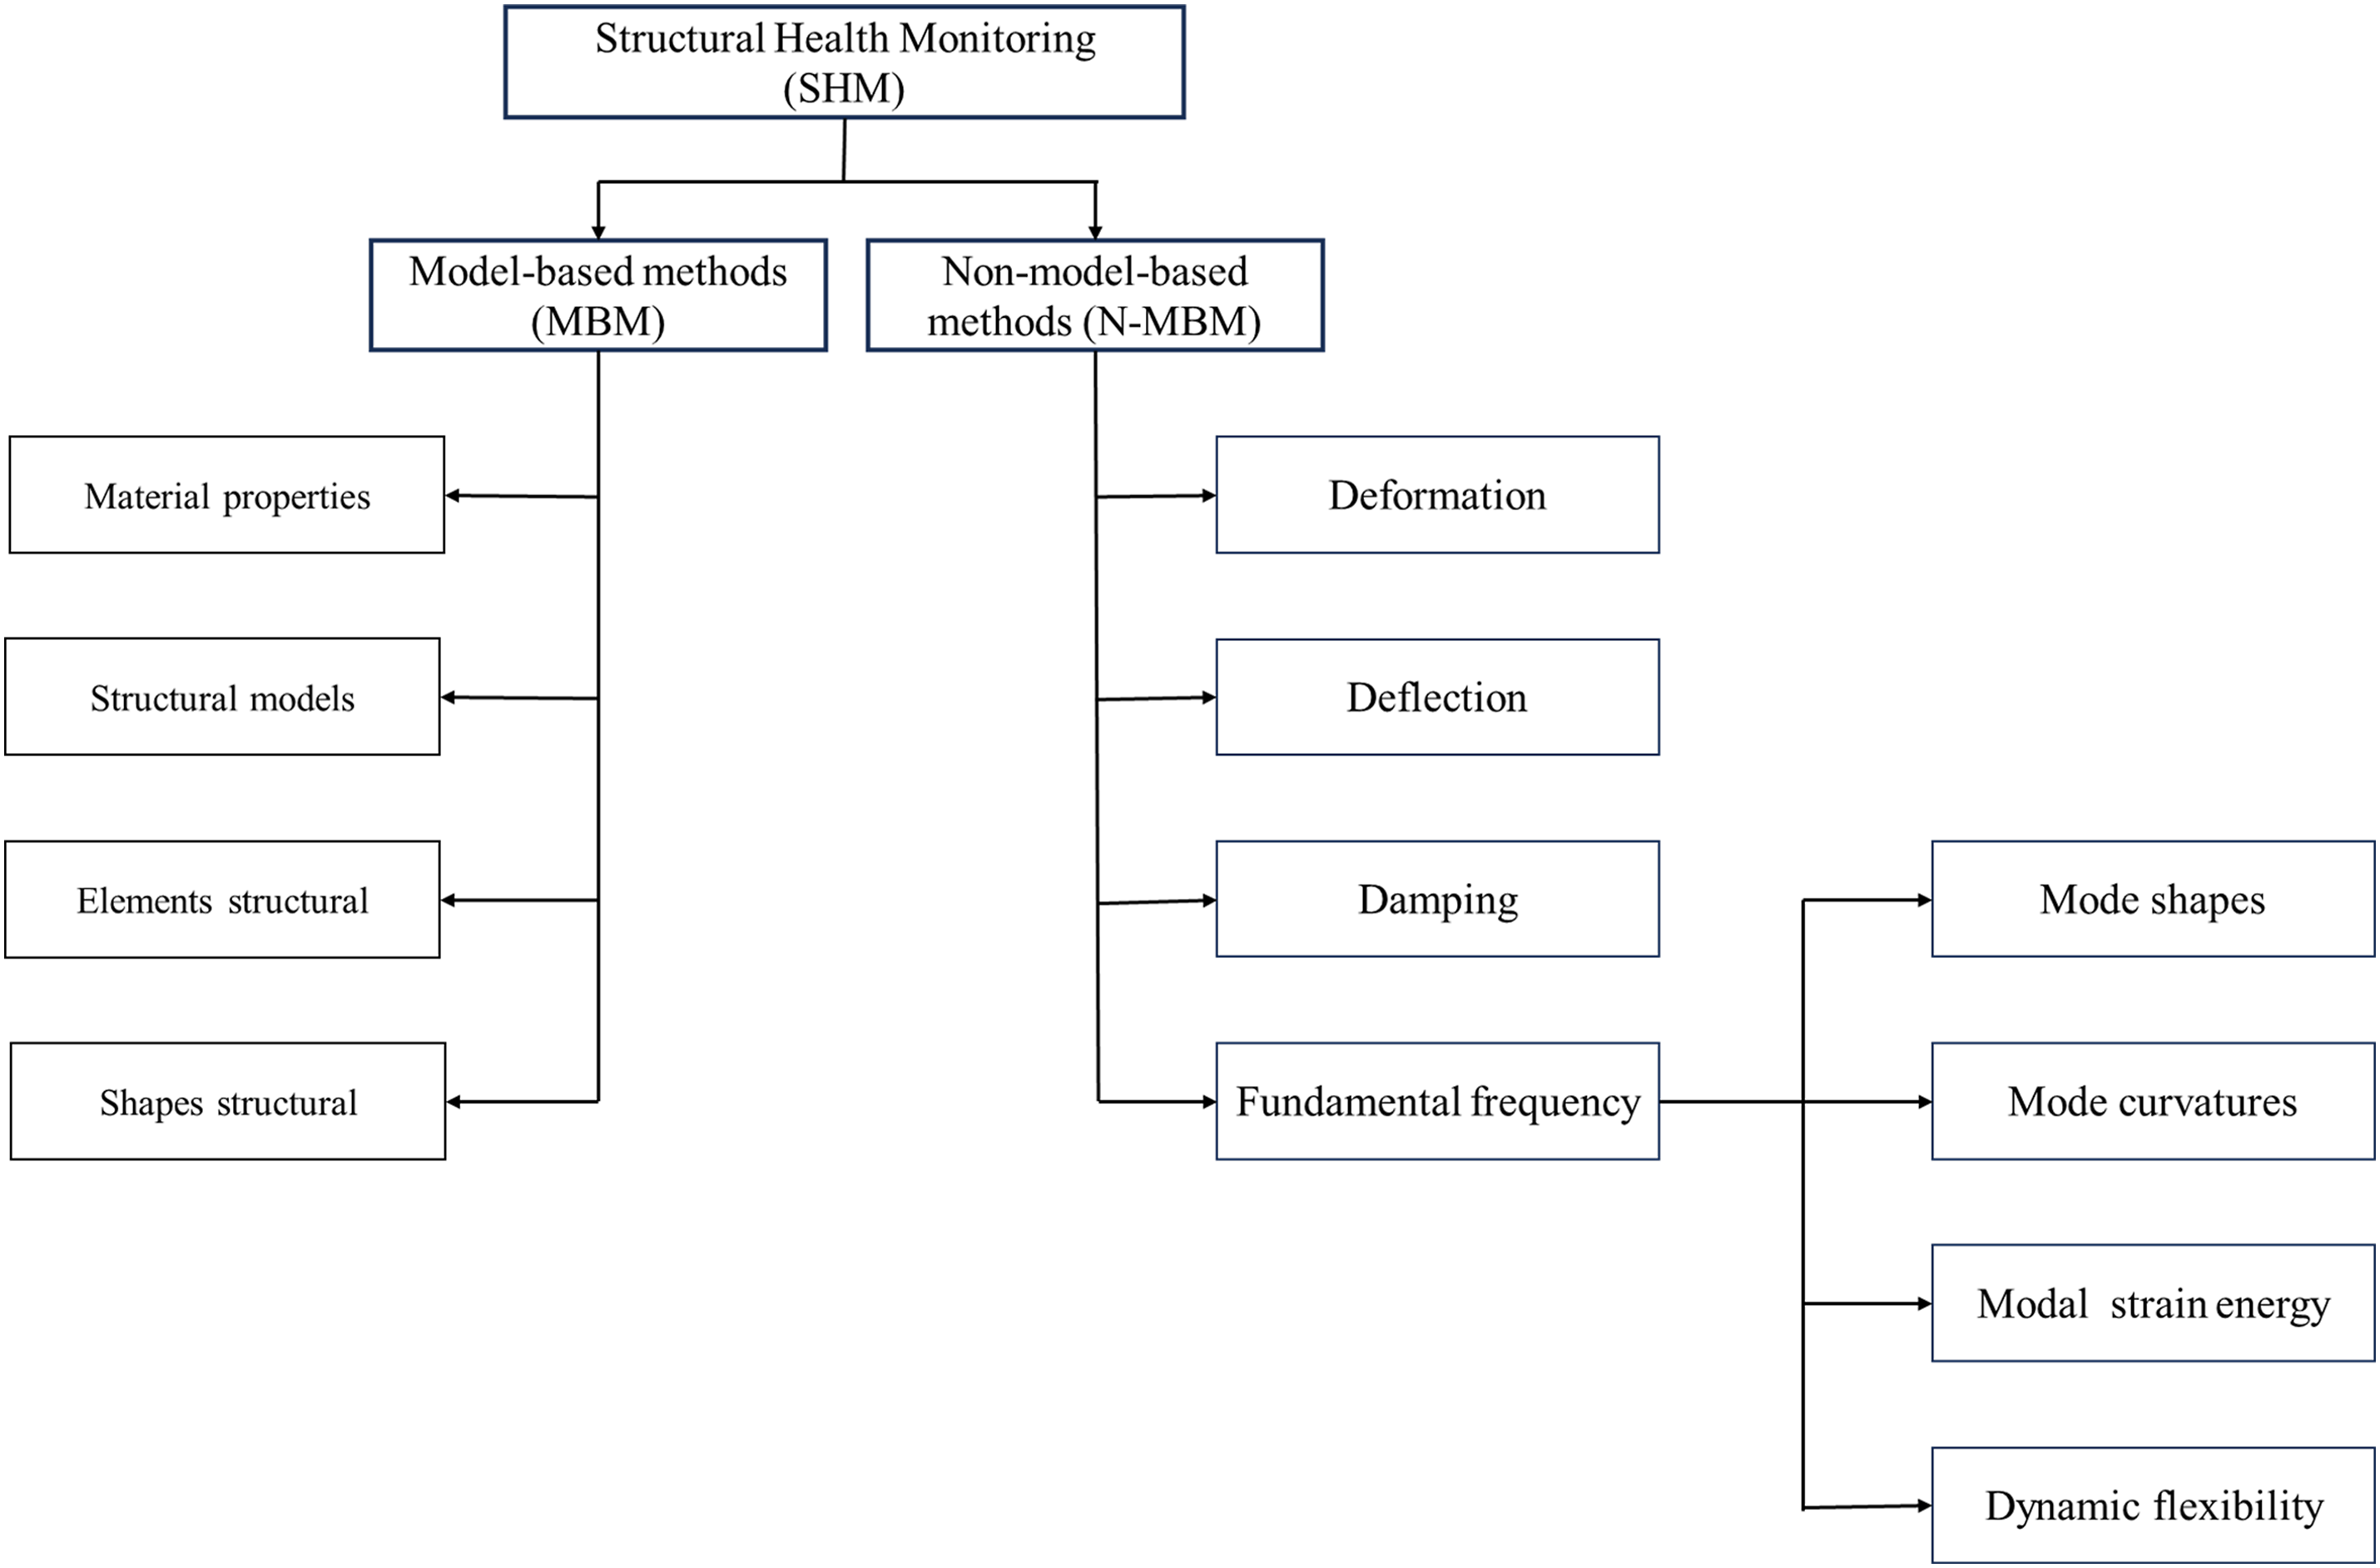
The selection of parameters is dependent on their measurability and sensitivity to structural changes. Vibration data offers the advantage of being easily obtainable and analyzable, thereby providing a cost-effective approach for dynamic monitoring of bridges. Numerous studies have aimed to enhance signal sensitivity through the application of statistical methods,17,18 optimization algorithms,19,20 artificial neural networks,21,22 wavelet analysis in combination,23,24 or neuron-fuzz techniques.25,26 Additionally, there has been considerable focus on transforming vibrating signals into intermediate signals to achieve more effective results than the original signals. Examples include works that convert signals into load vectors, ritz vectors, elastic deformation potentials, or wavelet signals. Signal spectrum analysis is a vital method used to analyze signals from monitoring devices attached to structures showing signs of damage, as outlined in Figure 2. By employing tools like Fourier transform and wavelet analysis, signals are converted from the time domain to the frequency domain, enabling the detection and analysis of signal variations and changes in spectral shape. Through signal spectrum analysis, we can pinpoint indications of damage within structures. Anomalies in the signal can signify fractures, cracks, or material deformations, helping identify weaknesses or potential issues within structures before they escalate. Monitoring changes in the signal spectrum allows us to assess structural damage, predict incidents, and implement timely repair or maintenance measures to prevent major accidents. With technological advancements, mobile devices and smart sensors are increasingly integrating with signal spectra, facilitating continuous monitoring and early detection of structural issues. A recent emerging characteristic applied in the search and assessment of structural damage is the moment spectrum model. This model is particularly useful in cases where the output signal features are complex, such as diagnosing defects in random directions or multilayered force functions. The moment spectrum concept identifies characteristic parameters to determine damage and monitor the operational status of structures. Some studies have demonstrated the use of moment spectra for damage detection in various structures, such as surface cracks in ball bearings, failure analysis of load-bearing connecting elements, and evaluating the durability of machine components, self-propelled structures, and railway bridge structures. However, these studies often focus solely on defined load-bearing objects, requiring full control over the acting loads. One advantage of moment spectra is their ability to be calculated in the time domain, frequency domain, or time-frequency domain, making them flexible for different types of response measurements and enabling real-time investigation, such as continuous SHM systems. Furthermore, moment spectra are suitable for both linear and nonlinear problems. Linear defect models typically involve changes in physical properties like mass, stiffness, and damping reduction, while nonlinear defect models may result from physical phenomena and dynamic characteristics rather than changes in material stiffness or state parameters.
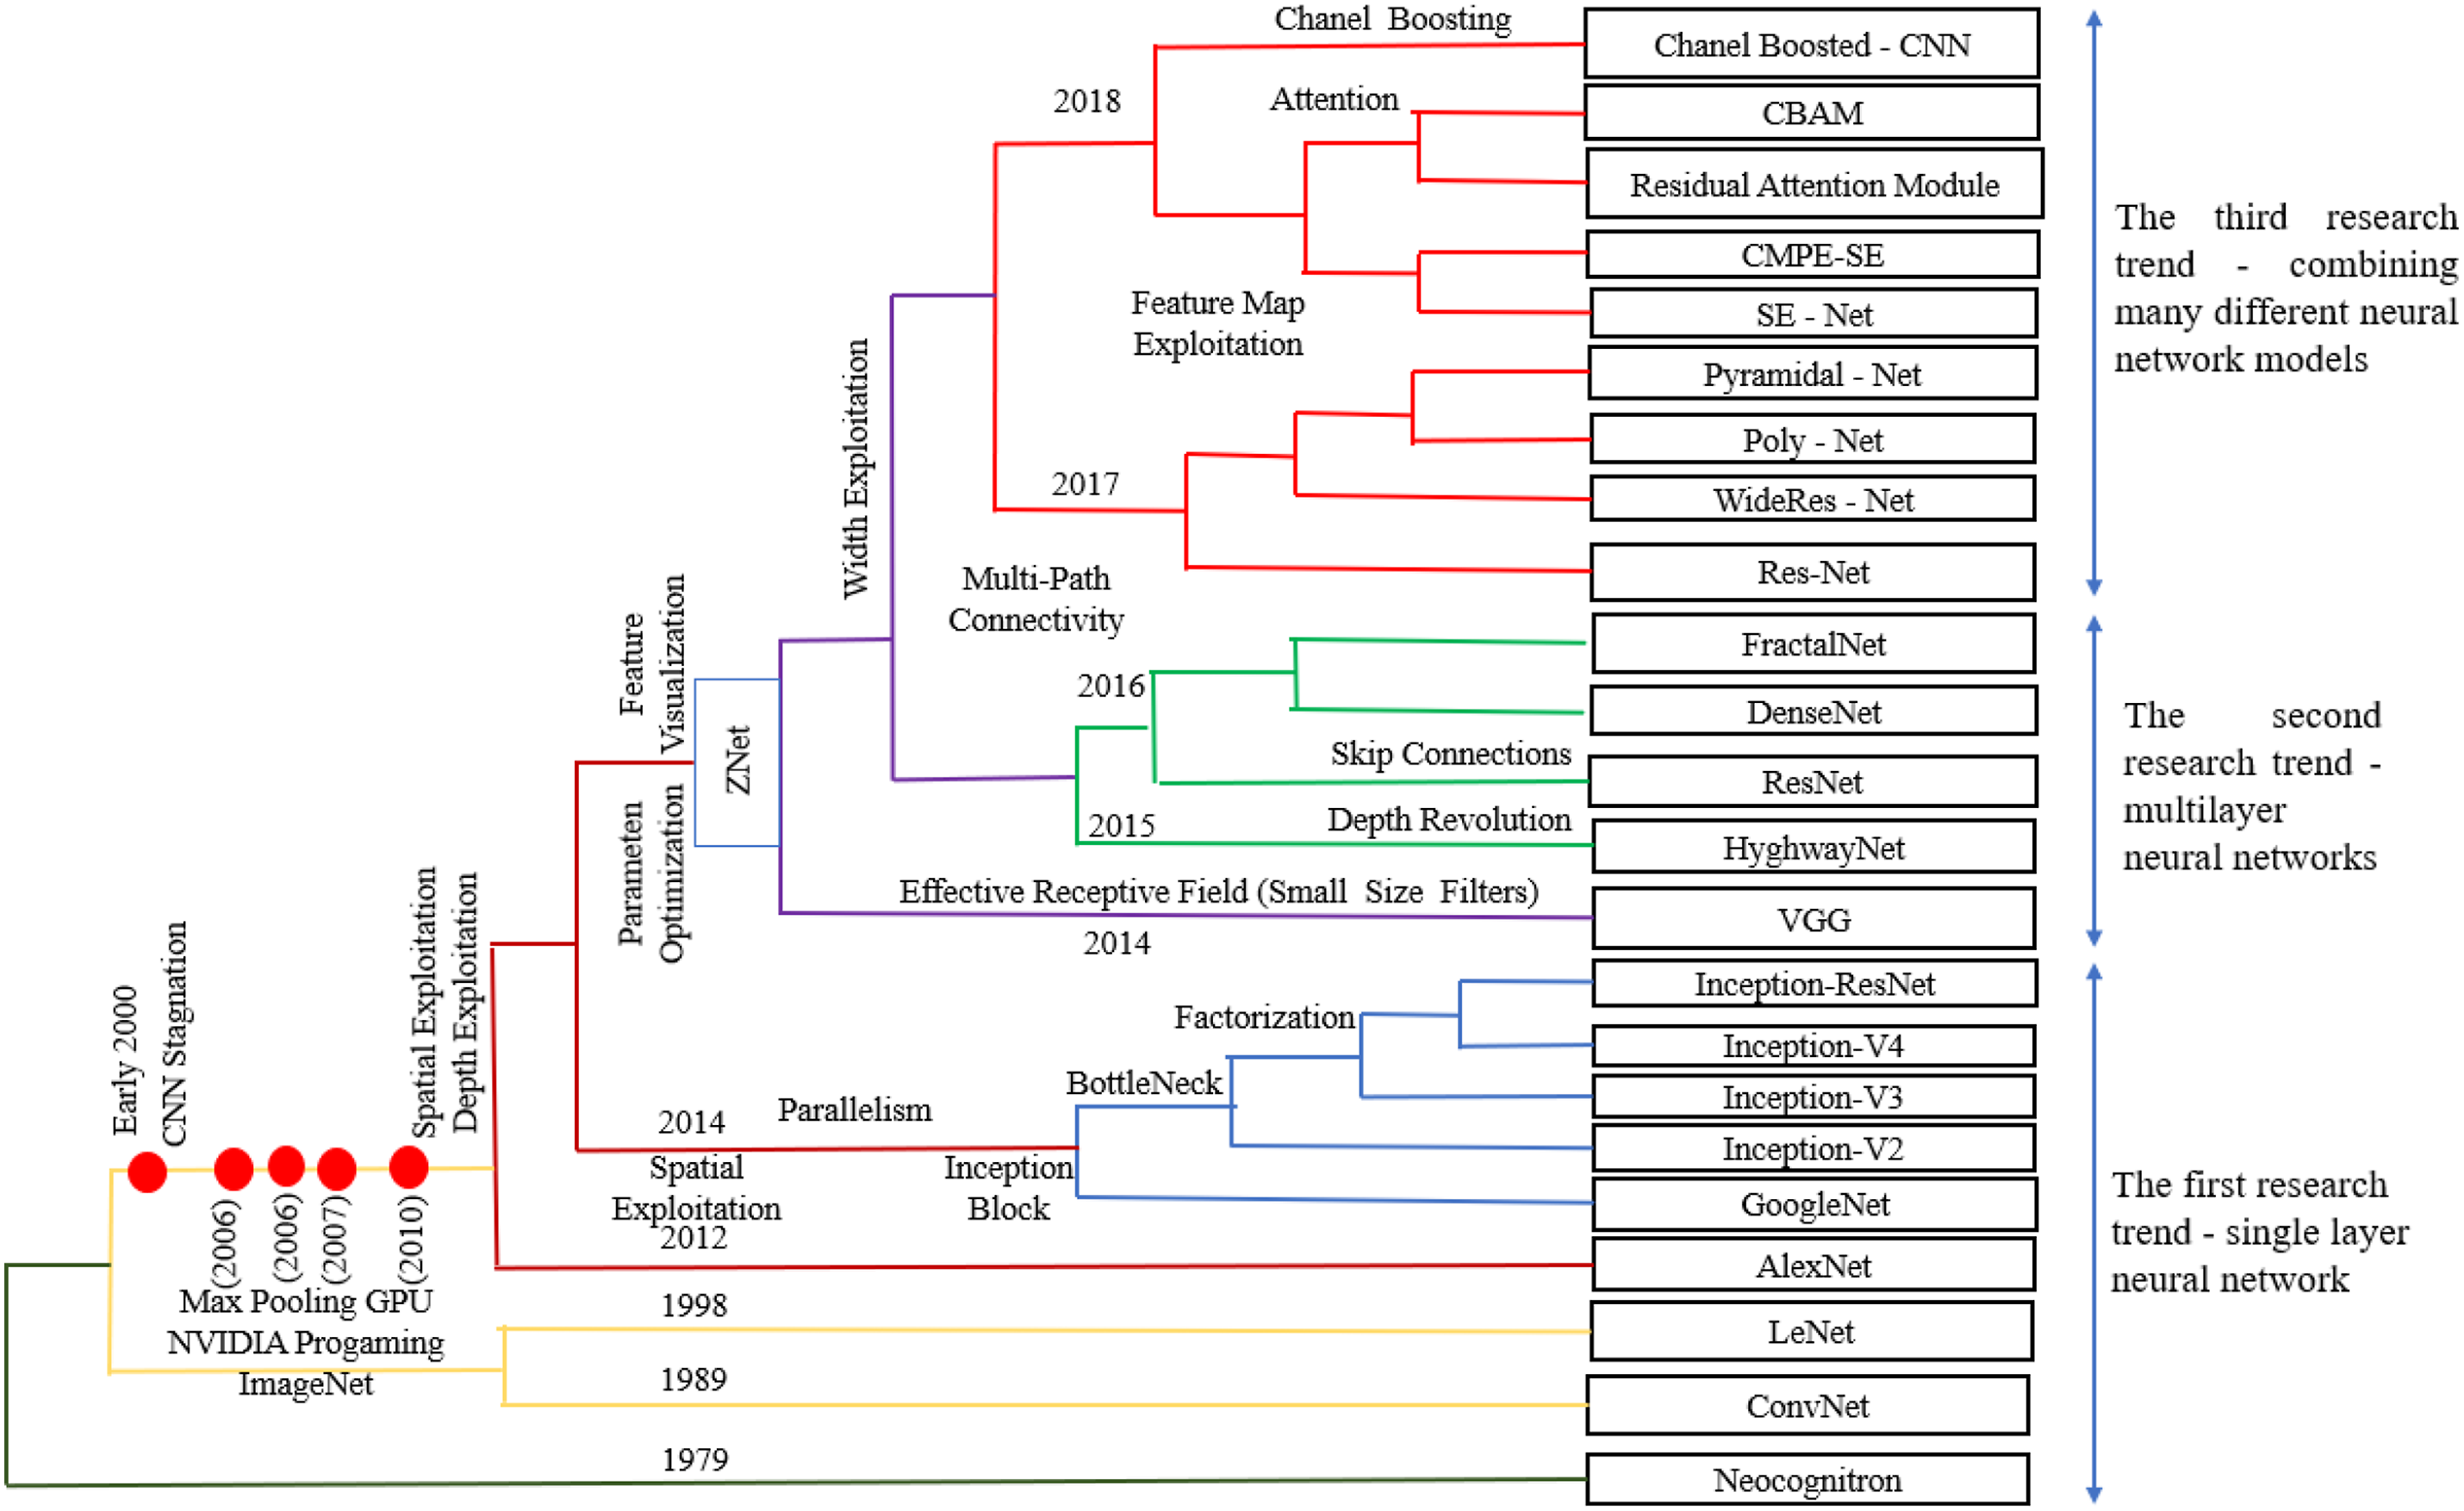
Currently, with the advancement of machine learning models, the problem of forecasting and recognizing structural changes has become easier, with numerous applications in real-world structures. Many studies propose diagnostic methods for tracking real-world structural changes over time using the feature coefficients obtained from artificial intelligence networks as shown in Figure 3. According to these studies, the mechanical properties of structures over time tend to decrease. Additionally, the effect of real-world loads on the structure accelerates the deterioration process more rapidly than expected. This change directly impacts the quality of the construction as well as the safety of the structure over time. Vibration signals have been utilized in these studies, including: - First Research Trend: The first research trend focuses on employing simple artificial neural network models, typically described by a single layer perceptron (SLP).27,28 These models are favored for their simplicity and low memory usage during data processing. However, despite these advantages, they still have limitations in terms of achieved results, training efficiency, and model optimization, which are not yet at an optimal level. In the context of monitoring and assessing damage in structures, these SLP-based models are utilized to analyze data gathered from monitoring devices attached to structures. The advantage here is that they provide a straightforward approach to processing the signals obtained from these devices. They can quickly process the data and identify potential signs of damage, making them suitable for real-time monitoring applications. However, the drawback of these models is their limited capability to handle complex data patterns and relationships within the structural data. This limitation can result in less accurate predictions and may miss subtle indications of structural damage. Additionally, the training efficiency of these models may not be optimal, meaning they require a large amount of training data to achieve satisfactory performance. Overall, while the simplicity and low memory usage of SLP-based models make them attractive for monitoring structural damage, their limitations in achieving high accuracy and efficiency in training and optimization are areas that need further improvement. This highlights the need for ongoing research and development to enhance the effectiveness of these models in the field of SHM. - Second Research Trend: The second research trend highlights the widespread use of the MLP artificial intelligence model in detecting structural defects, fueled by advancements in industrial computing and optimization algorithms. This model’s advantages lie in its versatility across various structural models and its ability to handle a rich set of input data and output results. However, its main limitation is its inability to effectively deal with complex structures or real-world mixed structures with numerous input conditions.29,30 In the context of monitoring and assessing structural damage, the MLP model offers a flexible approach to analyzing data collected from monitoring devices attached to structures. Its versatility allows it to adapt to different types of structures, making it applicable in various scenarios. Additionally, its ability to process a diverse range of input data and provide detailed output results enhances its utility in identifying and evaluating structural defects. Despite these strengths, the MLP model faces challenges when dealing with highly complex structures or mixed structures with numerous input conditions. In such cases, its performance may be compromised, leading to less accurate detection of structural defects. Additionally, the complexity of these structures may require more sophisticated modeling techniques beyond the capabilities of the MLP model. Overall, while the MLP model offers significant advantages in detecting structural defects, its limitations in handling complex structures underscore the need for continued research and development in this area. Improving the model’s ability to handle complex structural scenarios will be crucial for enhancing its effectiveness in real-world applications of SHM. - Third Research Trend: The third research trend focuses on addressing the challenges in identifying and detecting structural defects in mixed structures, which often remain inadequately addressed by single-layer or multi-layer models designed for specific tasks. To overcome these shortcomings, researchers are increasingly adopting an approach that combines multiple models to tackle real-world problems more effectively.16,20 In the context of monitoring and assessing structural damage, this trend involves integrating various models to enhance the efficiency of defect identification. By combining different models, researchers can leverage the strengths of each model to overcome their individual limitations. This approach allows for a more comprehensive analysis of structural data, leading to improved accuracy in identifying defects within mixed structures. One of the main advantages of this trend is its ability to address the diverse and complex nature of structural defects encountered in real-world scenarios. By combining multiple models, researchers can create a more robust and versatile framework for defect identification, capable of handling a wide range of structural complexities and variations. However, there are also some drawbacks to this approach. Combining multiple models can increase the complexity of the analysis process and require significant computational resources. Additionally, integrating different models may introduce challenges related to model compatibility and data integration. Several relevant studies31,32 have introduced the stiffness separation method as an effective approach for damage identification and parameter evaluation in structural health monitoring (SHM). The studies demonstrate how computational efficiency can be achieved while maintaining accuracy in damage identification. Similarly, the parameter identification of beam bridges based on stiffness separation method explores the applicability of stiffness-based techniques for evaluating bridge parameters under various conditions. Overall, while the integration of multiple models offers significant advantages in identifying structural defects in mixed structures, researchers must carefully balance the benefits with the associated challenges. Continued research and development in this area will be crucial for further improving the efficiency and effectiveness of defect identification processes in SHM. The development history of artificial intelligence networks in the problem of structural damage identification.
Bridges experience damage that accumulates over time due to various factors such as material aging, environmental conditions, and traffic loads. These factors directly impact the stiffness, damping, and dynamic behavior of the structure, leading to observable changes in fundamental frequencies. By monitoring these changes, it is possible to infer the physical state of the bridge, including stiffness degradation and potential damage mechanisms such as cracking or joint wear. This study focuses on detecting such changes using advanced signal analysis methods, including vibration-based assessments and spectral moment analysis, to link the observed frequencies to physical damage mechanisms. While this study highlights the use of AI methods, specifically CNN and MLP, as innovative tools for structural health monitoring (SHM), these techniques are firmly grounded in the physical context of bridge dynamics. The Saigon Bridge, as the case study, exhibits complex structural behaviors that require advanced methods to detect and localize damage effectively. The integration of CNN and MLP is designed to enhance the analysis of vibration signals by identifying patterns linked to stiffness degradation, material fatigue, and other structural anomalies. To ensure balance, the manuscript also discusses the physical characteristics of the bridge, the types of damage being monitored, and how AI methods complement traditional vibration-based analysis. This combination bridges the gap between computational advancements and their practical applications in real-world SHM.
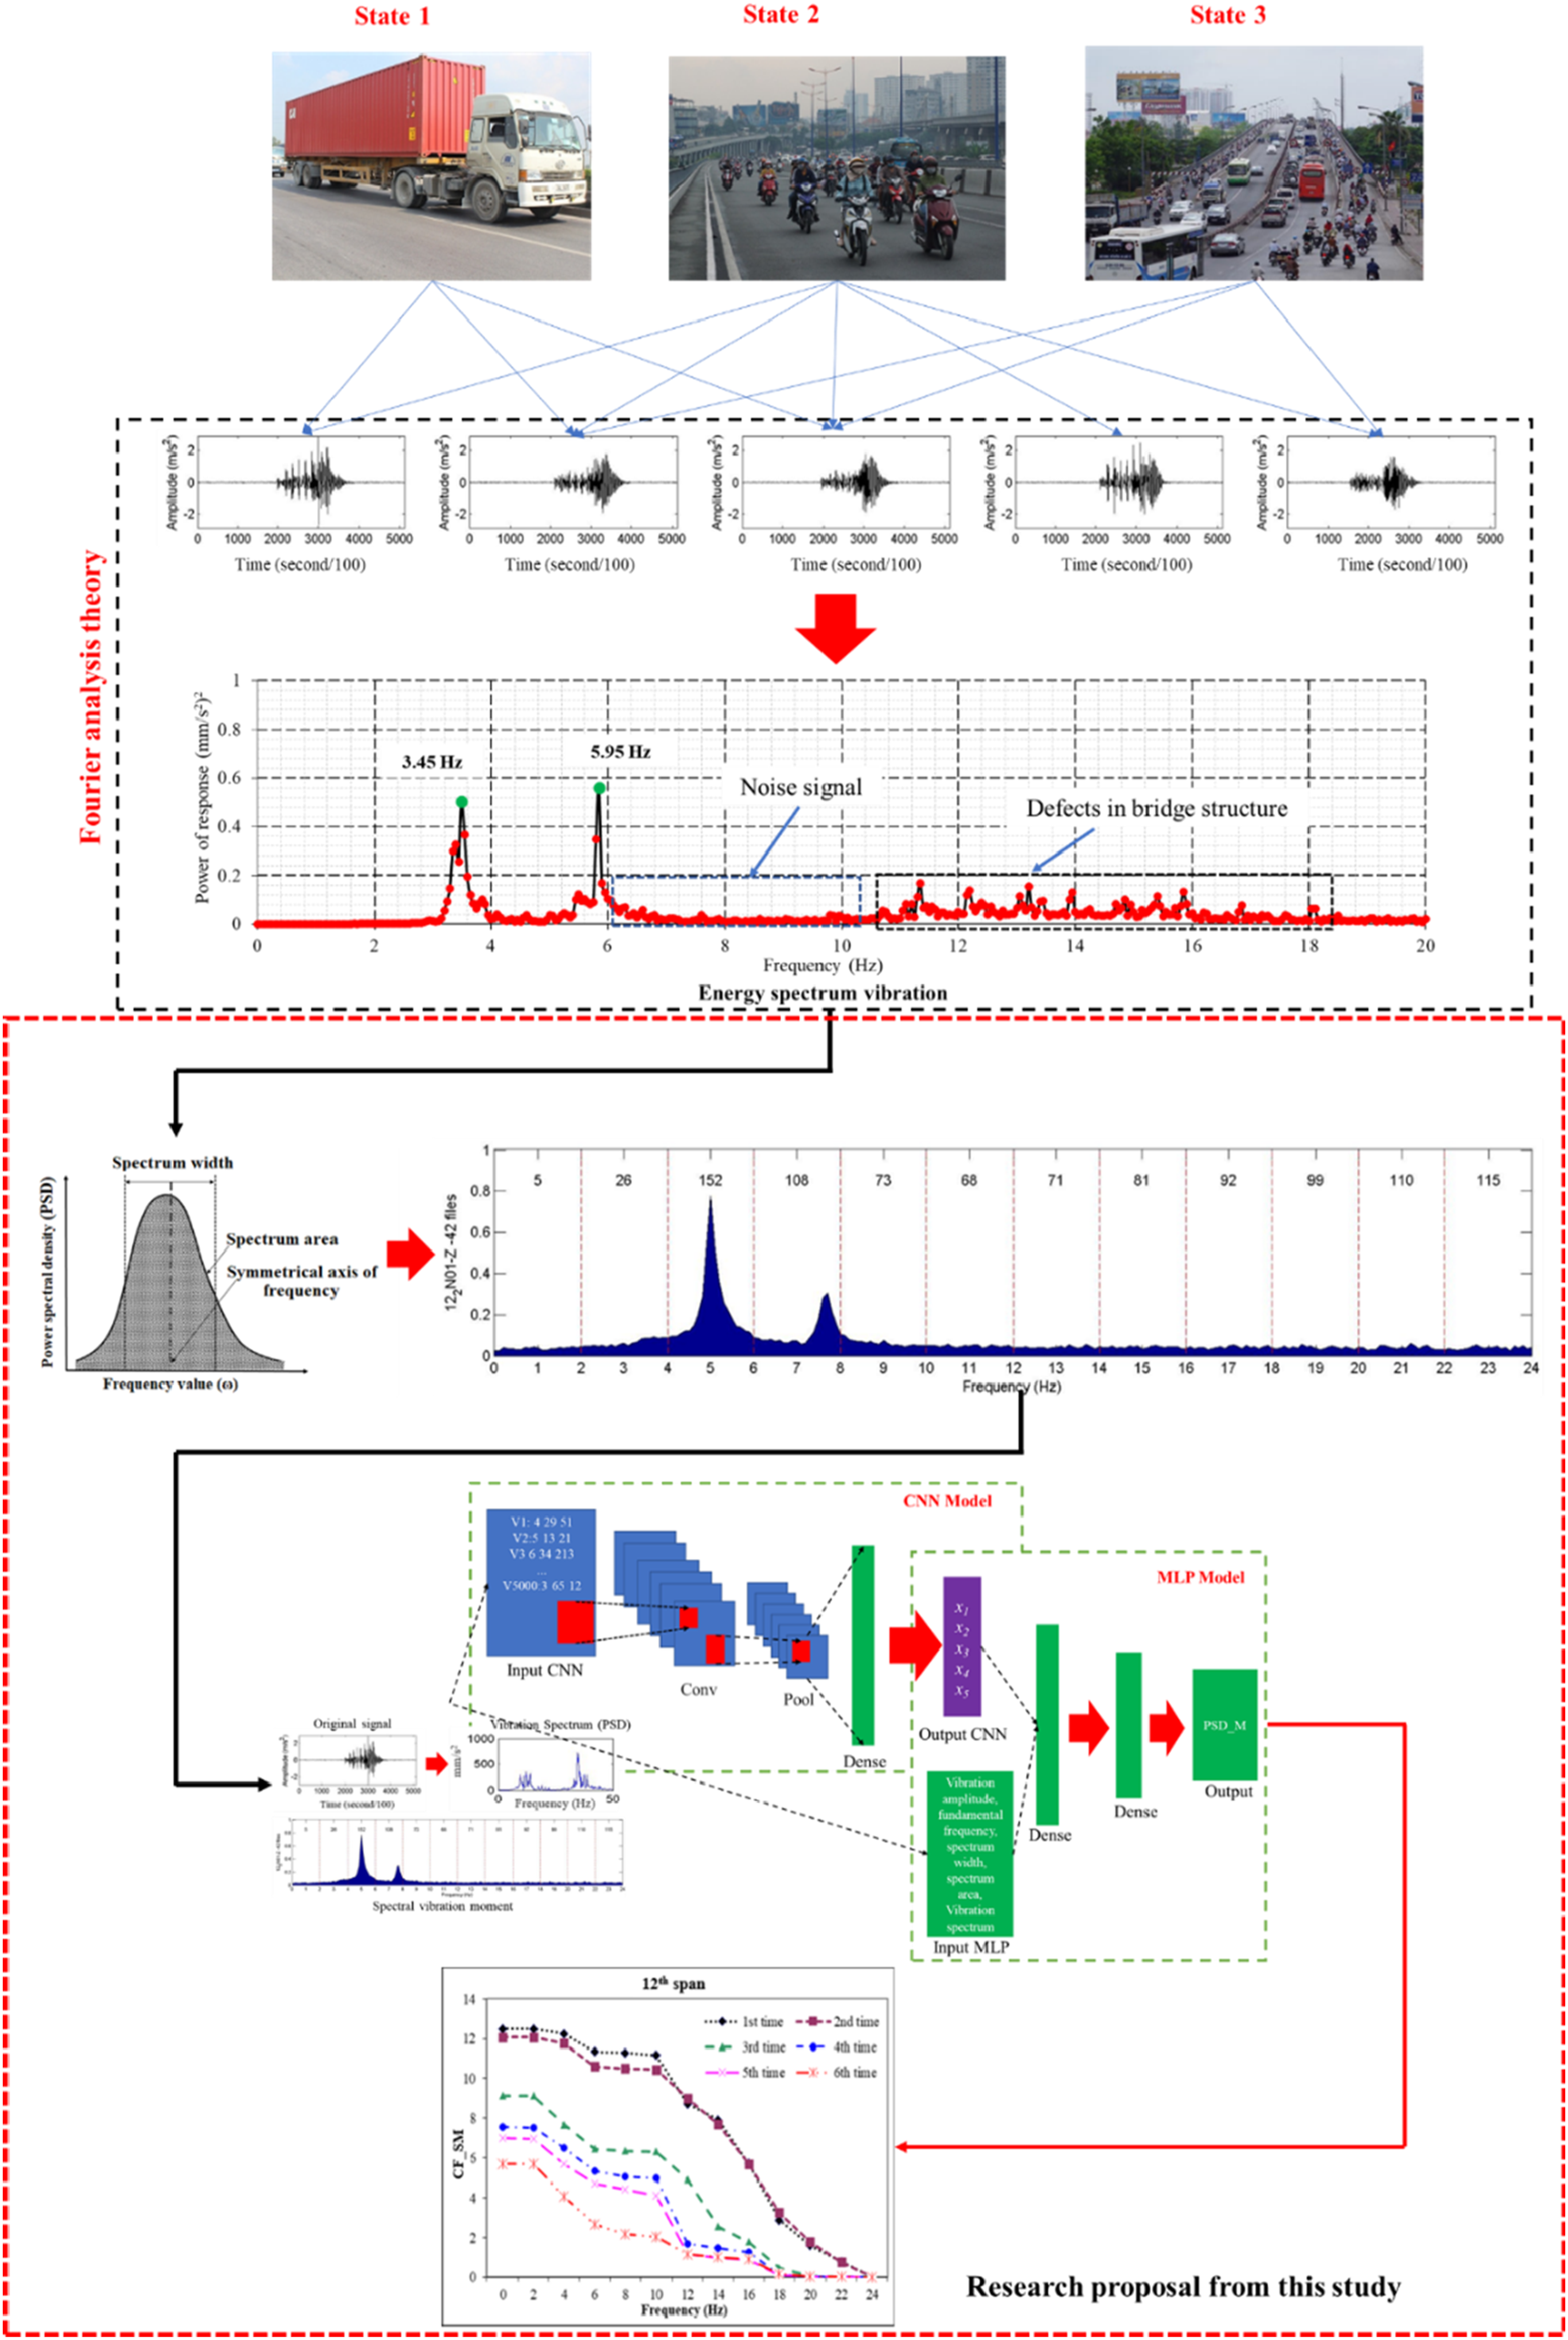
This paper introduces a novel method to improve the assessment of mechanical responses in short-span bridges, providing a valuable contribution to bridge engineering practices. Our approach combines CNN and MLP models to monitor stiffness degradation over time, marking a significant advancement in SHM as shown in Figure 4. By leveraging neural networks, our method enables simultaneous monitoring at multiple points or time intervals, providing unprecedented insights into bridge behavior. Empirical validation demonstrates the remarkable accuracy of our combined CNN and MLP model, augmented by PSD moments, in evaluating bridge quality over its lifespan. Moreover, our method effectively identifies hazardous areas and detects structural damage, addressing critical safety concerns. We propose integrating data from non-contact and contact sensors to enhance monitoring and assessment further, paving the way for comprehensive SHM strategies. Future research will explore the method’s versatility across different bridge types and environmental conditions, validating its feasibility and accuracy under diverse circumstances. In summary, this paper not only presents a cutting-edge methodology for assessing bridge health but also lays the groundwork for future advancements in structural monitoring technology, ensuring the safety and longevity of bridge infrastructure worldwide. The combined CNN and MLP research model.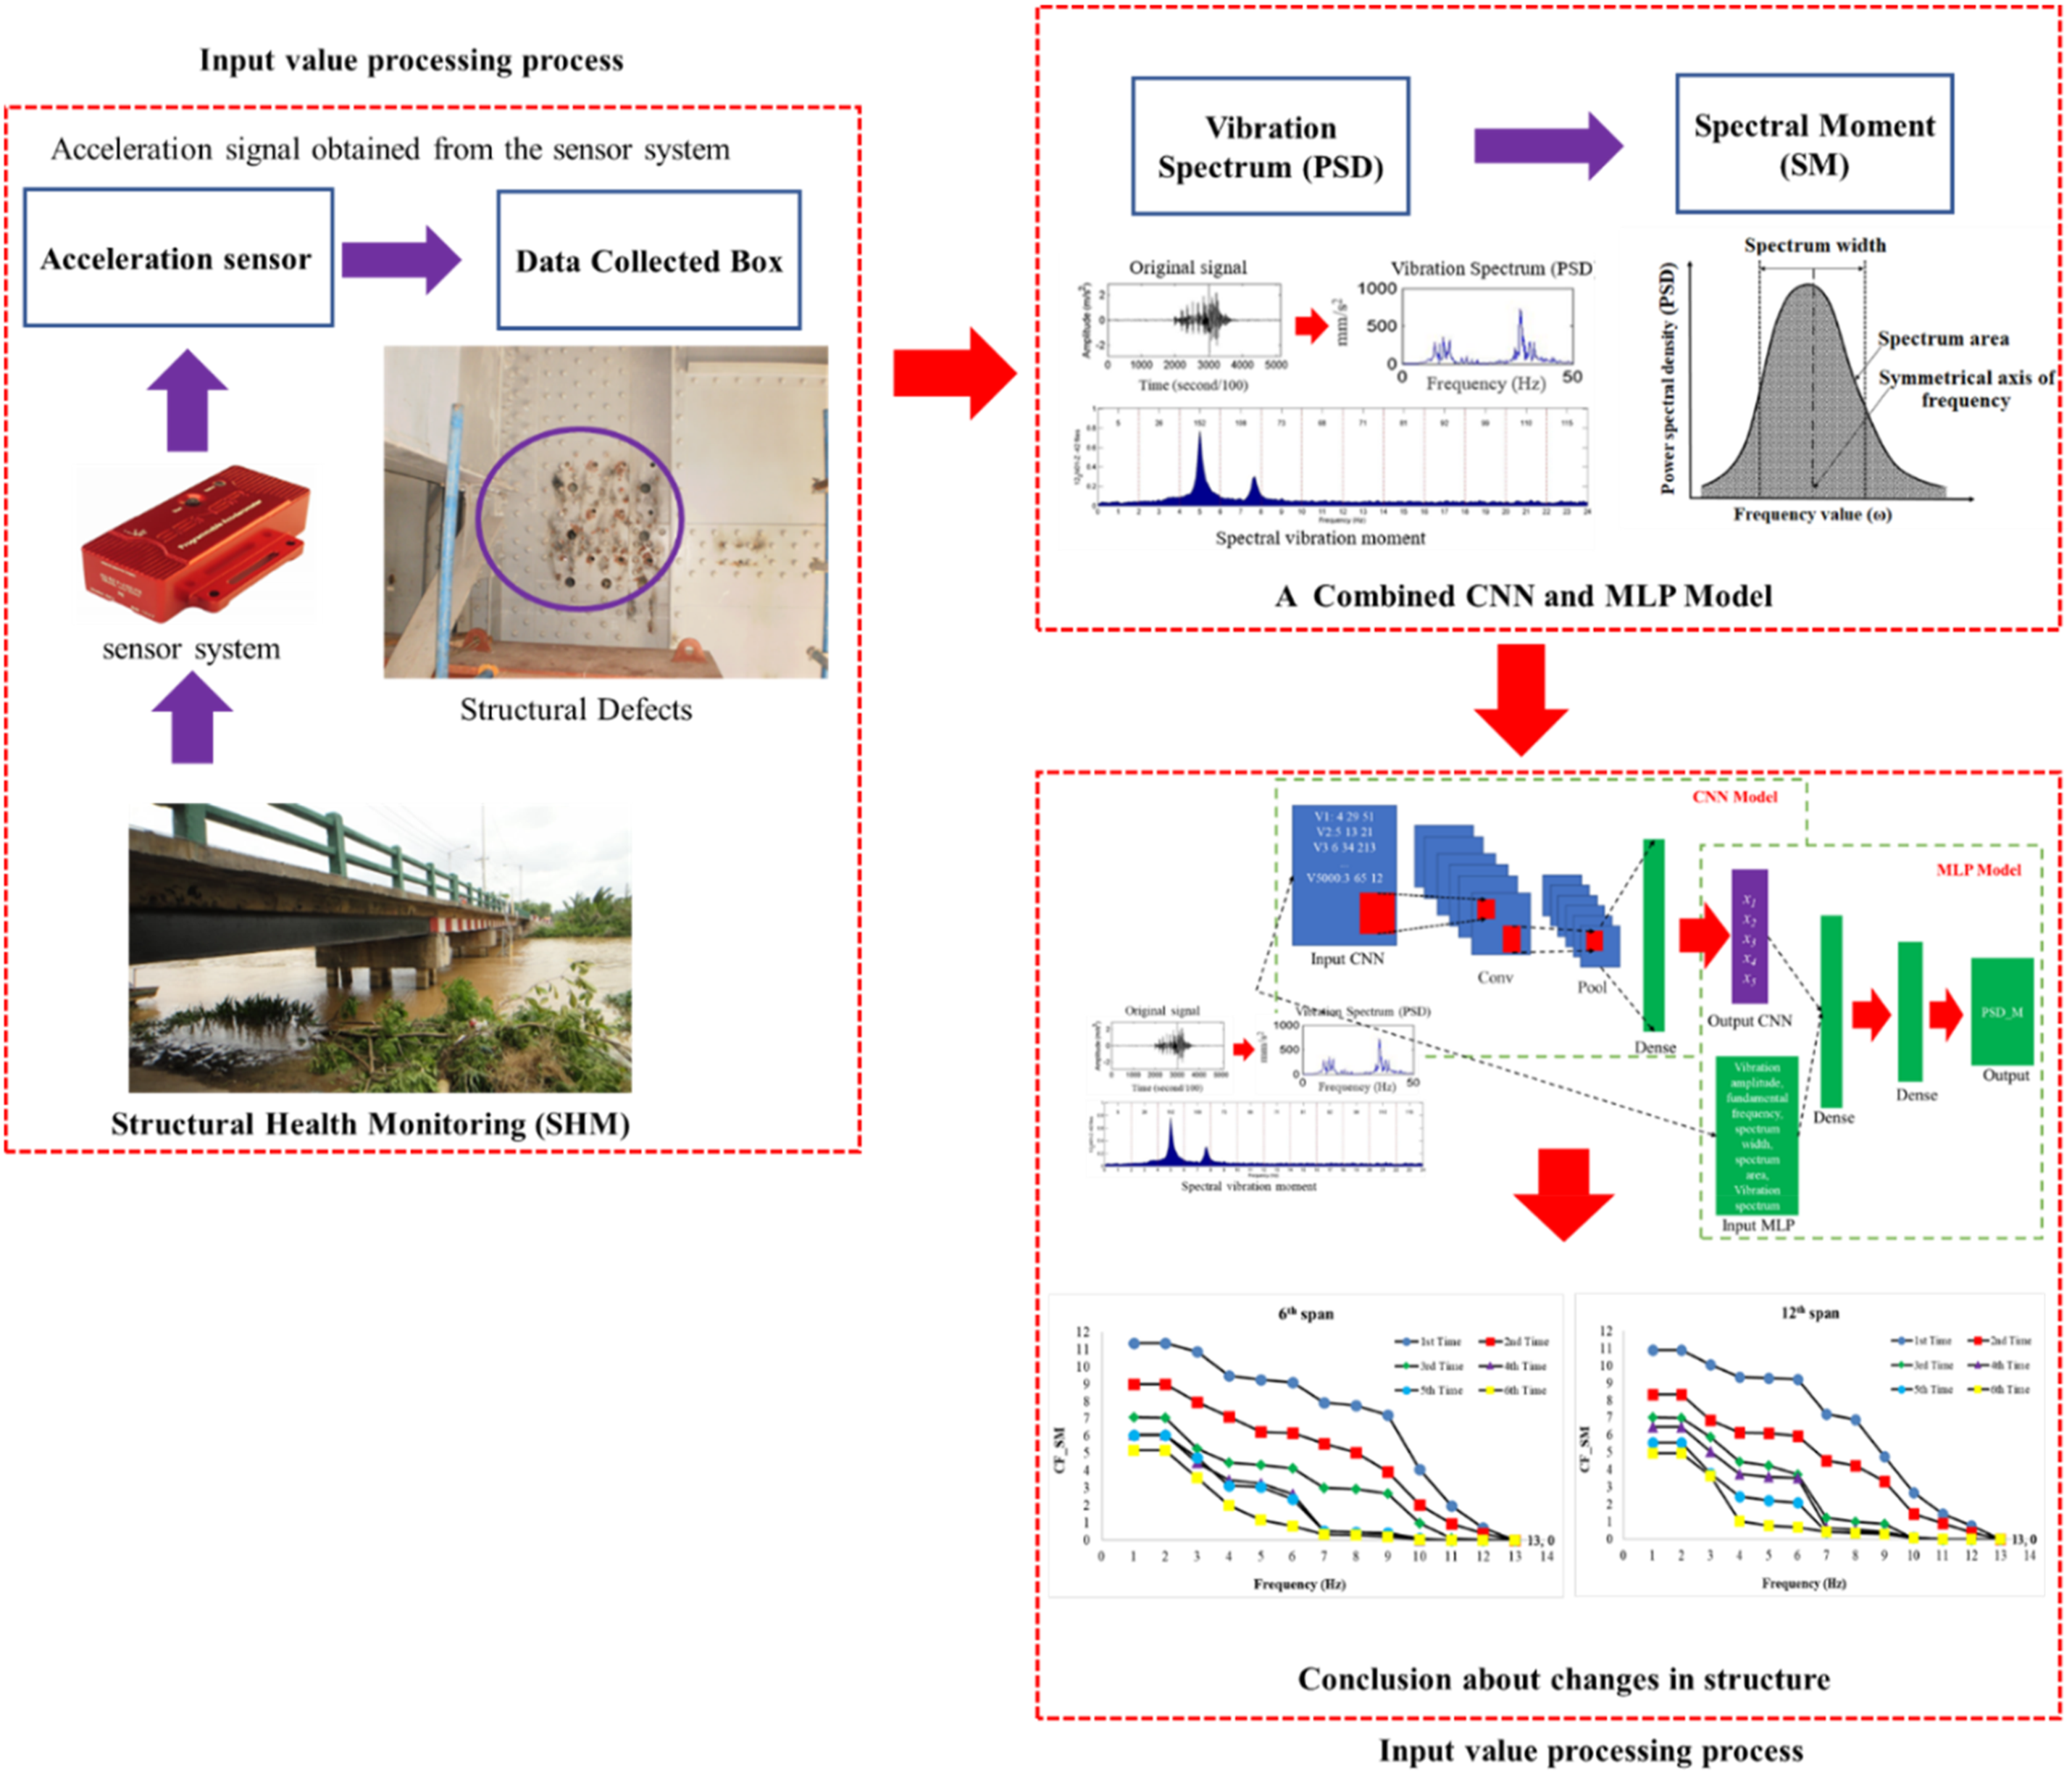
The use of AI methods, such as CNN and MLP, in this study is motivated by their ability to overcome limitations of traditional vibration-based analysis methods. While the Saigon Bridge itself may not strictly require AI for basic structural health monitoring, the complexity of its mixed structural design, long-term monitoring data, and varying environmental influences make it an ideal case study to demonstrate the advantages of AI techniques. These methods automate feature extraction, identify subtle patterns in vibration data, and provide higher accuracy in detecting damage trends, such as stiffness degradation or localized anomalies, which are difficult to discern manually. Moreover, the AI-driven approach is designed to be generalizable, allowing its application to larger, more complex infrastructure systems where traditional methods may struggle to scale. By integrating these techniques with conventional SHM practices, this study not only enhances the understanding of the Saigon Bridge’s structural health but also lays a foundation for broader adoption of AI in structural monitoring.
Materials and methods
Model to evaluate the change of structure by the PSD moment
The density function in statistical theory describes the distribution of amplitude values in the time domain. The spectral density function, on the other hand, shows the energy distribution in the frequency domain. To investigate the energy distribution characteristics of a signal in each frequency domain, the concept of spectral moment (SM) is proposed, as shown in equation (1)

In this study, SM
(n)
represents the n
th
spectrum. When examining the characteristics of the output signal, there are multiple variables to consider, such as attenuation, changes in stiffness within the structure, imbalances among connections, or temporal structural variations. Previous studies5,10,17 often concentrated solely on designated load objects applied to the structure, without emphasizing other conditions of the structure. The limitation of this approach is that the impact of the load must be entirely controlled. In this study, the authors developed this parameter based on an actual survey of the bridge span. The study also listed the featured spectral moment value in assessing the reduction of structural stiffness. These additions indicate the following: - Flexibility in Measurement Systems: The spectral moment concept demonstrates high adaptability when using responses in different measurement systems, as it can be calculated in time and frequency domains simultaneously. This opens up opportunities for continuous investigations over time and enables the application of health monitoring systems in a seamless, ongoing manner. - Suitability for Linear and Nonlinear Problems: Spectral moment proves suitable for both linear and nonlinear problems. In linear models, it can account for changes in physical properties such as mass, stiffness, and damping. In contrast, when applied to nonlinear models, the changes are not solely attributed to material stiffness or specific parameter variations. Instead, the changes are linked to physical phenomena and dynamic characteristics. - Energy Information for Generalized Structures: Spectral moment provides essential energy information across the frequency range during the active span, making it more versatile for generalized structures than response frequency alone. Additionally, spectral moment offers remarkable flexibility in determining crucial signal characteristics, making it an effective and powerful tool. - Utilization of Natural Vibrations: Spectral moments can be calculated from the frequency response function, provided that both the input and output of the system are derived from the power spectral density function. This feature allows for the utilization of stimuli from natural vibrations, such as circulation, wind, and tremors, enhancing the applicability and robustness of the method. - Independence from Vibration Phase Effects: A key advantage of spectral moment is its independence from the vibration phase effect. This quality preserves the vital properties of the signal, ensuring that the analysis of spectral moments does not significantly alter the results.
In equation (1), when the coefficient n equals zero, the resulting expression represents the calculation of the flat area, which can be observed on the power spectrum graph with the frequency axis. This area is commonly referred to as the “spectrum area” or “spectral moment” S_SM

The static moment of a power spectrum is determined by constructing an axis perpendicular to the frequency axis, which divides the spectral graph into two regions of equal areas, as depicted in Figure 5. The value of SSM can then be calculated using equation (3) Characteristics of the PSD function.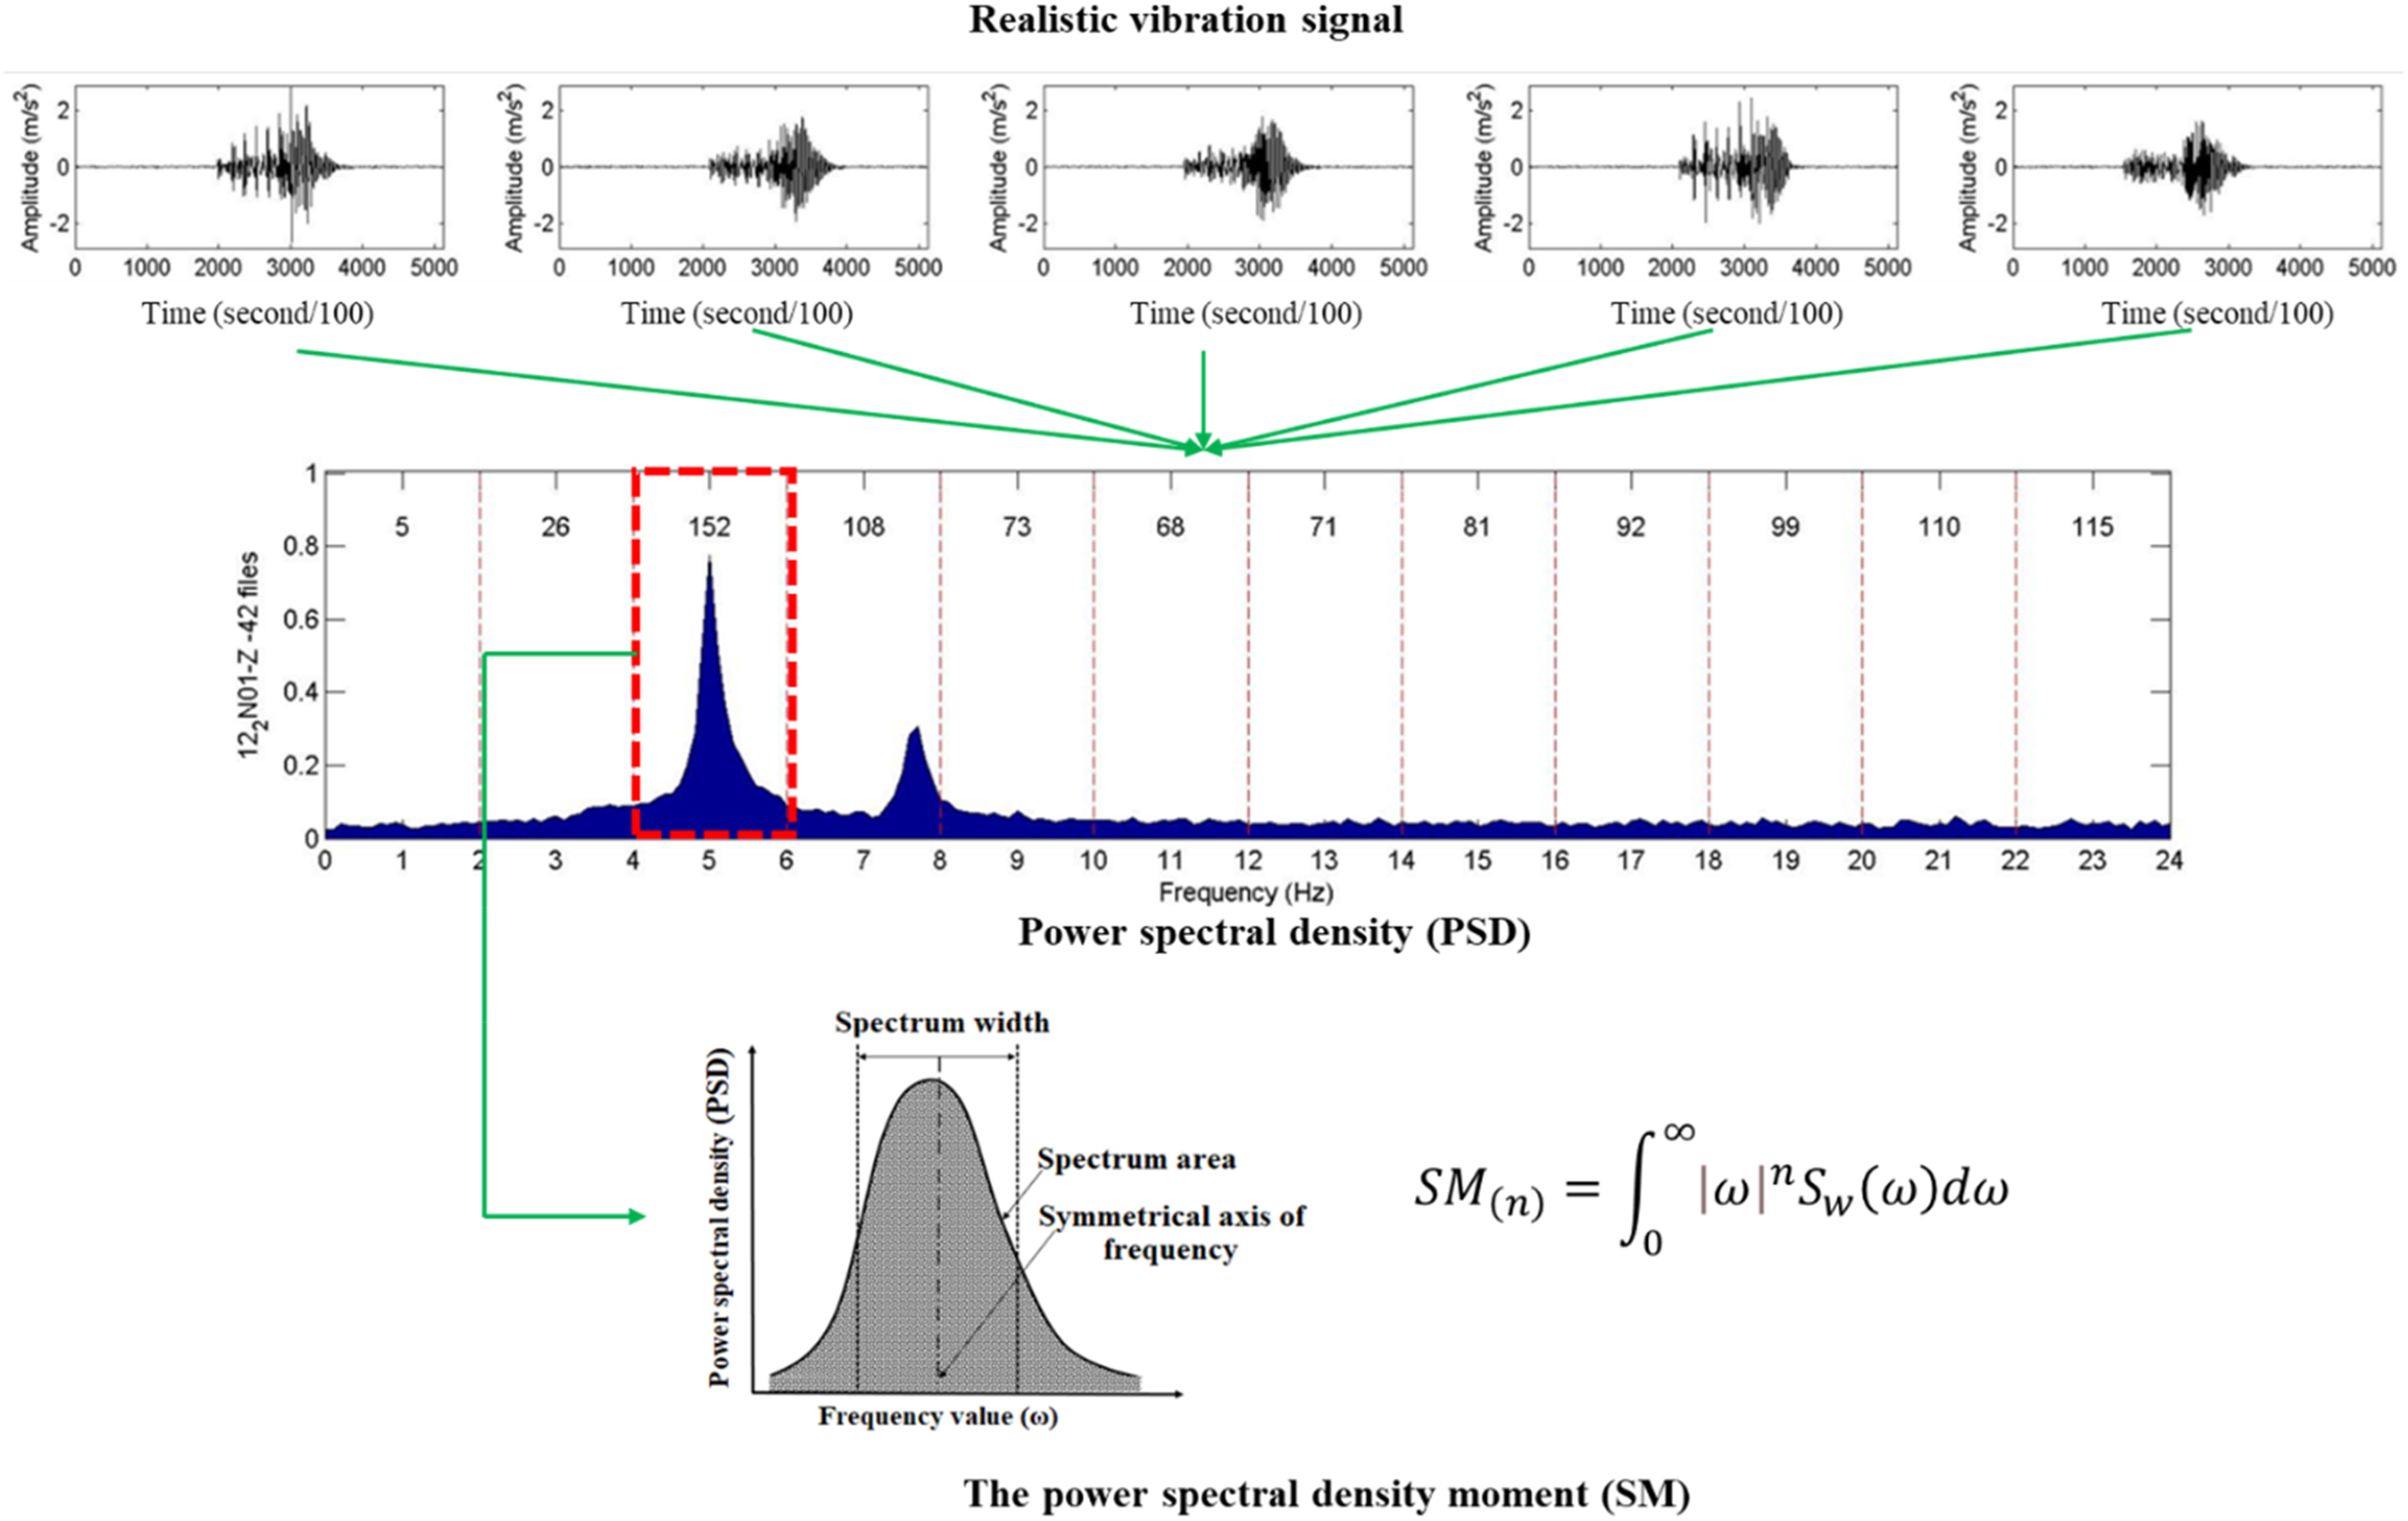

Effect of spectral moment on the change of structure
This paper critically analyzes the effectiveness of the first five spectral moments in identifying damage using a non-model-based approach, and aims to identify the most sensitive damage parameter or combination of parameters. The first five spectral moments condense the spectral information into a compact set of parameters. By reducing the dimensionality of the spectral data, it becomes more manageable for analysis and interpretation. In many practical applications, the majority of relevant information about a signal’s spectral shape is captured within the first few moments. These moments provide insights into fundamental aspects of the signal, such as its distribution, central tendency, and variability. Analyzing the first five spectral moments is computationally less demanding compared to considering the entire spectrum. This allows for faster processing of data, making it more suitable for real-time applications or large-scale analyses. These moments include the mean power (zero-order moment),33,34 mean frequency (first-order moment),35,36 dataset variance (second-order moment),37,38 skewness (third-order moment),39,40 and data kurtosis (fourth-order moment).41,42 The study then uses model-based approaches and a Bayesian statistical framework to determine the most promising spectral moments or combination of moments to be used in future structural damage identification studies. In general, for a given continuous zero-mean stationary Gaussian random process, the d
th
order non-central moments in the frequency and time domains can be calculated using the following equations (4) and (5)


The corresponding central moments can be obtained by subtracting the mean values at each frequency and time using the following formula


The d
th
order spectral moments in the frequency and time domains are represented by µ
df
and µ
td
, respectively. The response PSD or vibrational energy distribution of a random process W(t) in the frequency domain is denoted by S
ww
(f). Here, W(t) refers to the time series under consideration and f represents the signal frequency. In the case of a discrete-time signal, the non-central and central spectral moments in the frequency domain can be defined using the following expressions
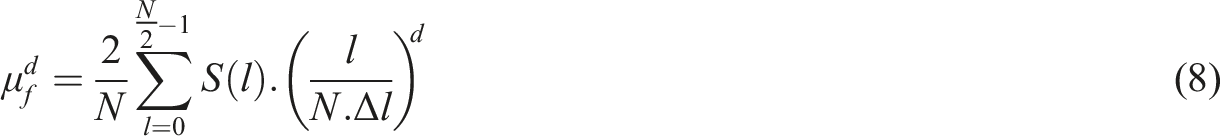
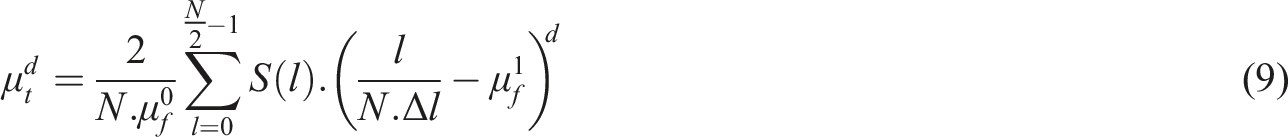
The term 2/N represents the normalization factor for the one-sided power spectrum, where N is the total number of points in the discrete signal. In particular, N is equal to the ratio of the signal observation time T to the sampling interval ∆t. The spectral moments have different statistical interpretations and significance, which can provide valuable information about the structural damage conditions. However, the level of significance should be considered in relation to the sensitivity and relationship to the physical characteristics of the structure. Hence, it is crucial to understand the significance and sensitivity of each moment to changes in the dynamic properties of the structure before using them for structural damage identification. The next section will provide definitions of the spectral moments using standard statistical terminology and their practical implications for structural damage identification.
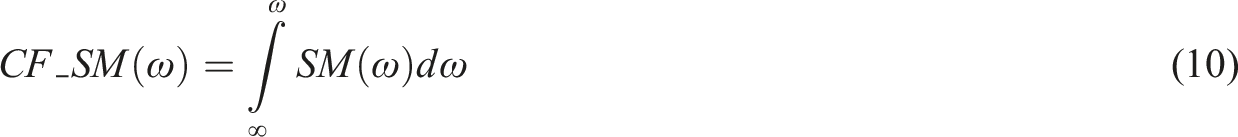
In practice, there is a significant difference in the degradation process of each span during different measurement periods. To evaluate the overall degradation between spans, the cumulative spectral moment (CF_SM) value is used to describe the process of overall stiffness degradation through equation (10)
The combination of multilayer perceptron (MLP) and convolutional neural network (CNN) models
Advantages of the CNN-MLP integration
The integration of MLP and CNN offers significant advantages in addressing the complex problem of detecting and identifying structural damage in real-world scenarios. MLP excels at learning intricate, non-linear data representations, while CNN specializes in extracting spatial features from structured data such as vibration signals or images. The combination of these models leverages the strengths of both, enhancing their representation learning and automation capabilities.
This integration allows the network to extract both fine-grained and global features from the data. CNN captures local patterns and spatial relationships from data such as PSD values or frequency-domain representations, while MLP processes these features to provide comprehensive insights into both localized damage and overall structural integrity.
The generalization and automation capabilities of the CNN-MLP integration are further enhanced. CNN automates the feature extraction process, and MLP learns the complex non-linear relationships between features and outcomes. This synergy minimizes manual intervention, providing a scalable and flexible solution adaptable to various SHM applications. Additionally, the model demonstrates robustness in handling noisy real-world data, such as vibration signals influenced by environmental factors and traffic loads.
Applications of the CNN-MLP model
The versatility of the CNN-MLP model makes it suitable for a wide range of applications in SHM: • Damage detection in bridges: The model has been applied to analyze vibration signals from the Saigon Bridge. PSD and spectral moment values were used as input features, enabling the model to detect stiffness degradation and identify hazardous regions. • Crack and puncture detection: The model is capable of processing image or video data to detect structural damages such as cracks, punctures, or deformations in bridges, buildings, pipelines, or machinery. • Integration with sensor data: The model can process data from various sensors, such as accelerometers, cameras, radar, or ultrasonic sensors, to provide accurate predictions of structural conditions and recommend timely maintenance actions.
Training and testing processes
The training and testing processes for the CNN-MLP model are carefully designed: • Input data: The input consists of time-series measurements of structural health parameters collected using vibration sensors placed on bridge spans. PSD and spectral moment values are computed from these measurements and used as input to the CNN for feature extraction. • Training phase: CNN extracts spatial features from the data, which are then processed by the MLP for stiffness state predictions. The model was optimized using the Adam optimizer, with hyperparameters fine-tuned through grid search. The training data covered multiple spans and measurement campaigns to ensure robust learning. • Testing phase: A separate dataset from independent measurement campaigns was used for testing. The model’s performance was evaluated using metrics such as Mean Squared Error (MSE), Mean Absolute Error (MAE), and R-Squared, as presented in the study.
Key contributions and novelty
While this study focuses on the Saigon Bridge, the proposed methodology is designed to be scalable and generalizable. The insights and framework developed can be extended to other types of bridges and structural systems with similar data characteristics. Future research will expand the dataset and evaluate the model’s applicability under diverse conditions, further validating its effectiveness in SHM.
The integration of CNN and MLP models represents an innovative advancement in SHM: • Novel parameter introduction: The cumulative spectral moment (CF_SM) function was introduced as a sensitive parameter for monitoring stiffness degradation over time. • Enhanced feature processing: CNN effectively extracts spatial features, while MLP handles non-linear relationships, resulting in higher accuracy and efficiency compared to traditional methods. • Improved sensitivity: The CF_SM function was shown to be more sensitive in assessing stiffness changes over time than traditional parameters such as frequency or damping coefficients.
The CNN-MLP model offers significant potential for advancing real-time SHM. By combining the strengths of two powerful neural network architectures, the proposed framework provides a reliable, scalable, and automated solution for infrastructure management and maintenance. Future studies will focus on refining this approach and expanding its application scope to achieve more comprehensive results.
The proposed method integrates CNN with MLP model to monitor the stiffness degradation of short-span bridges over time. Below, we provide detailed explanations of the input, output, training, and testing processes of the CNN + MLP model: - Input and Output of CNN + MLP: The input data for the CNN + MLP model consists of time series measurements obtained from sensors deployed on the bridge spans. These measurements capture various structural health parameters through PSD spectrum and spectral moment values as described in Section model to evaluate the change of structure by the PSD moment and Figure 5. The model’s output is a prediction of the current stiffness state of the bridge spans based on the input sensor data. - Training Process: During the training phase, the CNN extracts spatial features from the input sensor data, capturing both local and overall patterns indicating stiffness degradation through PSD spectrum and spectral moment models. These features are then fed into the MLP, which further processes the information to predict the stiffness state of the bridge spans. The model is trained using a dataset consisting of labeled examples of sensor data paired with corresponding stiffness states, allowing the model to learn the complex relationship between input features and output predictions. - Testing Process: After being trained, the CNN + MLP model is evaluated using a separate test dataset not seen during training. This test dataset includes new sensor measurements collected from bridge spans at different time points. The model processes these measurements to predict the stiffness states of the spans, which are then compared with ground truth values obtained through traditional testing methods or historical data. The effectiveness of the model is assessed based on metrics such as accuracy, precision, and recall. - Result Retrieval: The results presented in the paper are obtained through rigorous testing of the CNN + MLP model on real-world bridge data. However, we acknowledge that the article lacks clarity in explaining how these results were achieved. In the future, we will provide a detailed description of the testing process, including the datasets used, evaluation metrics, and validation techniques employed to ensure the reliability of the results.
Multilayer perceptron (MLP)
The MLP is an artificial neural network where neurons are interconnected by weights. The network output is the weighted sum of inputs, transformed into a nonlinear function through an activation function, as shown in Figure 6. Fully connected network with hidden layers.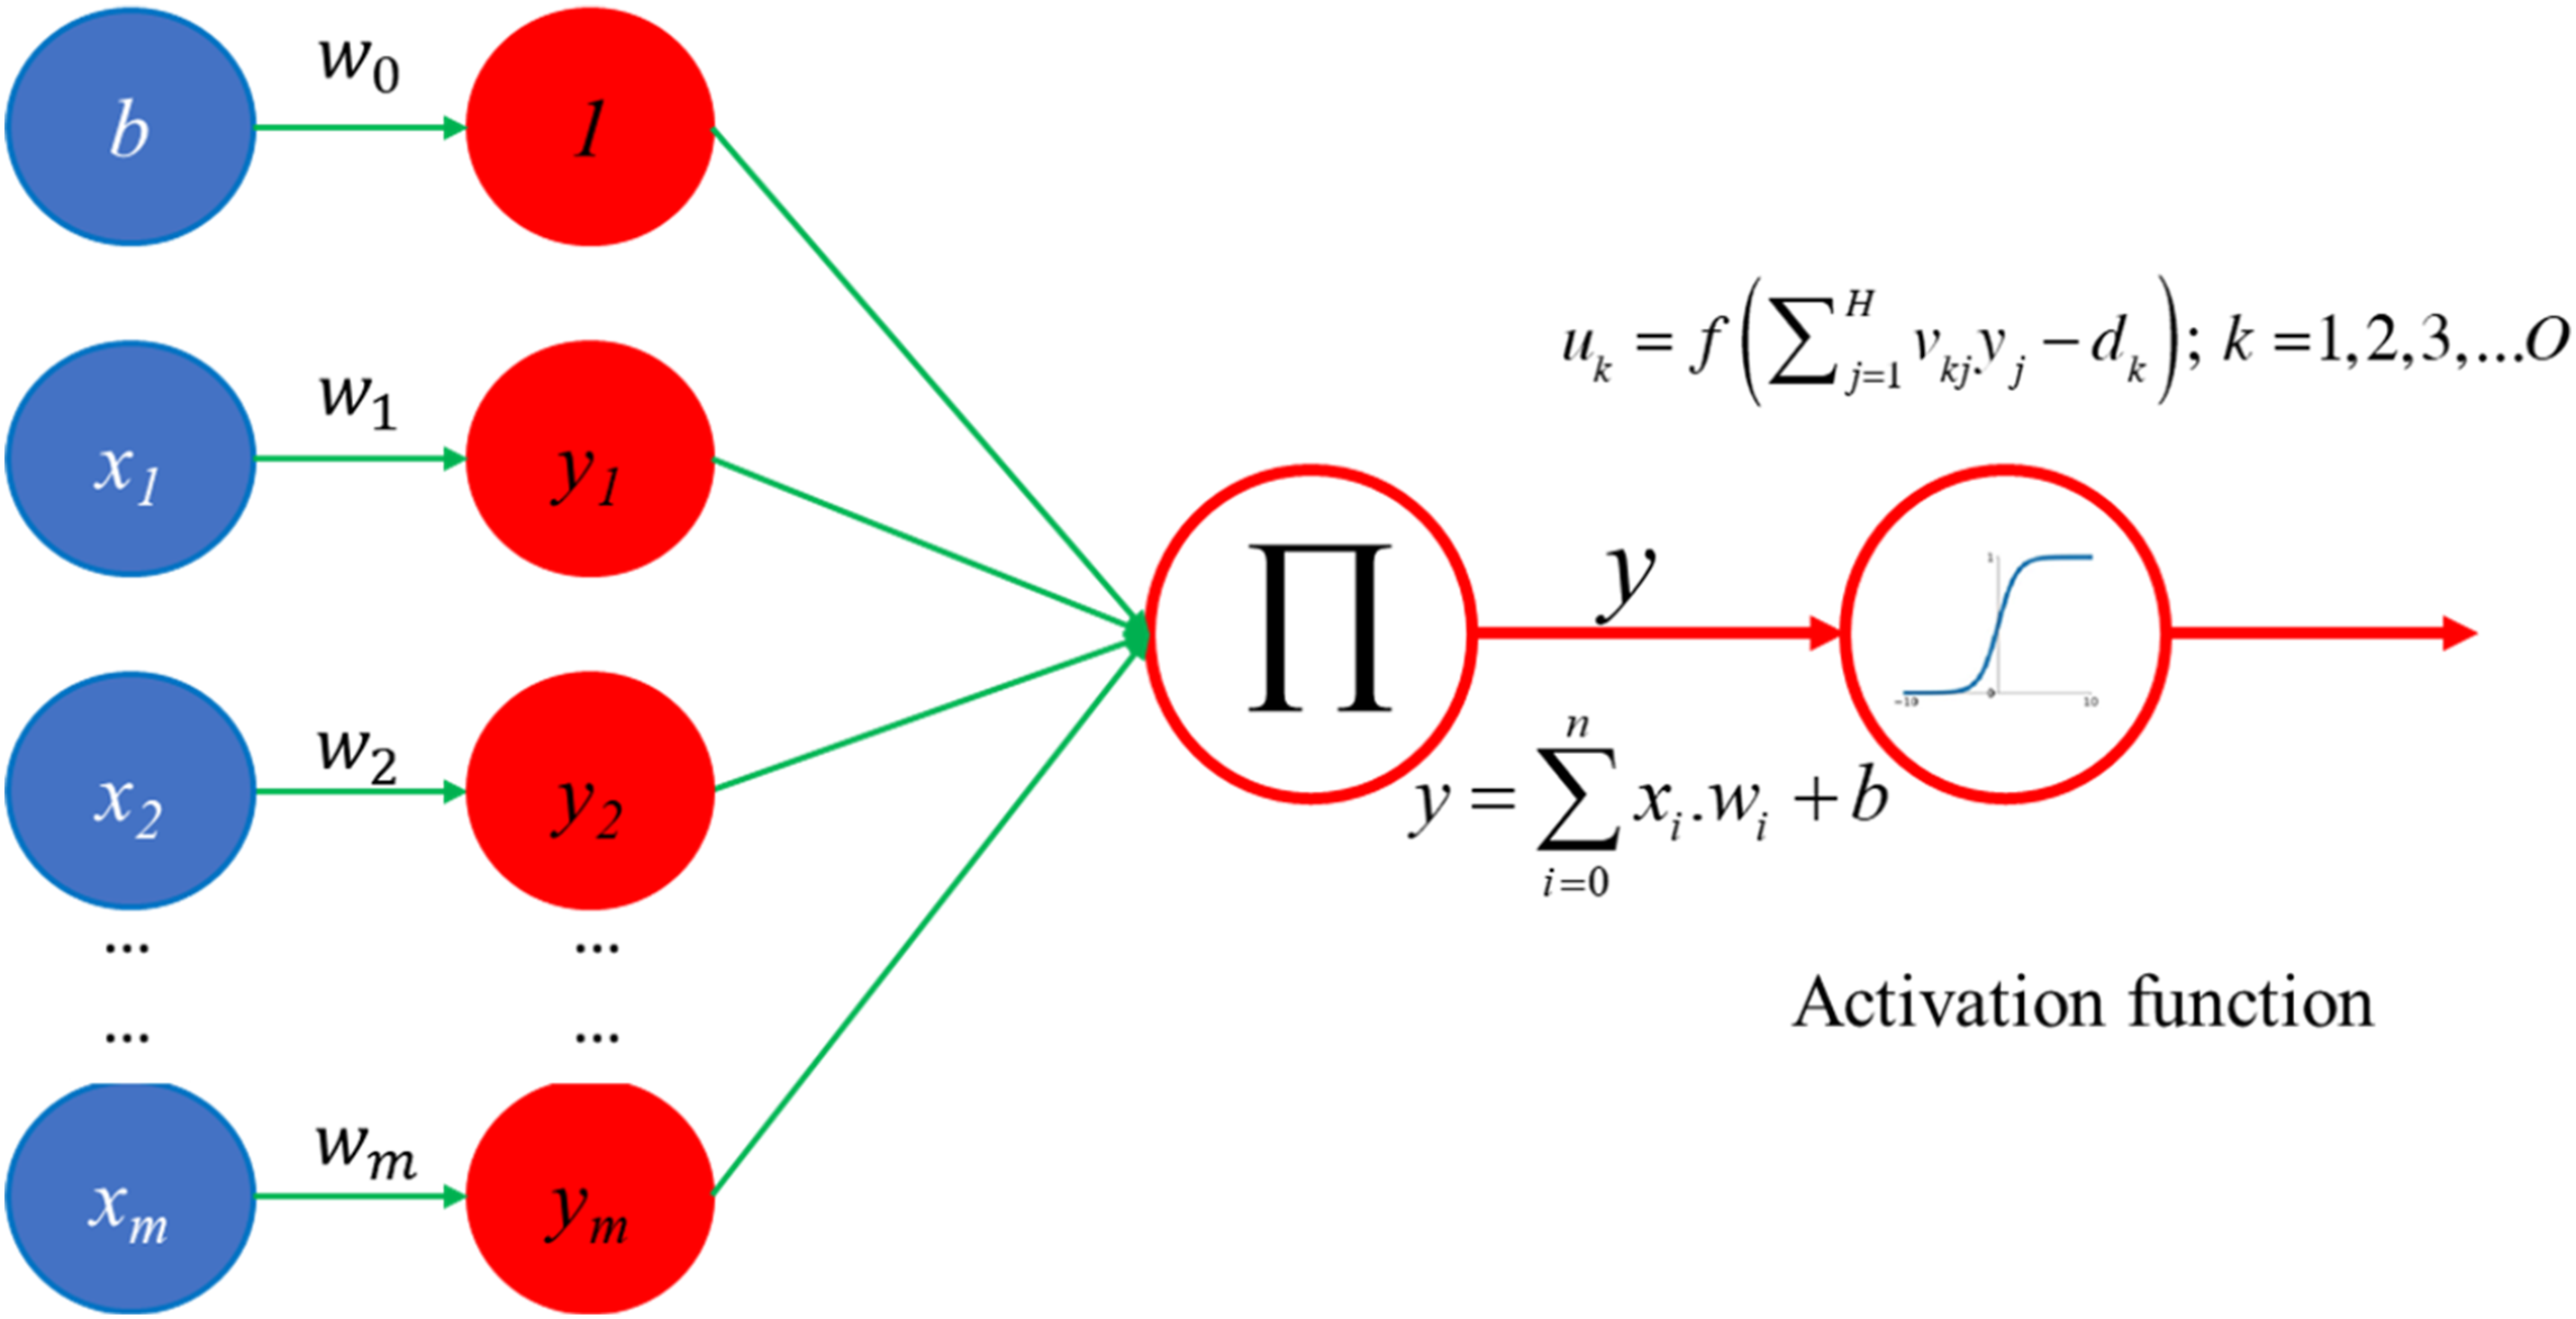
The MLP structure in this study consists of three main components: the input layer, hidden layers, and output layer. The input layer receives data vectors but does not perform calculations, while the output layer provides the final results after processing, as shown in equations (11) and (12). The hidden layers, containing varying numbers of neurons, connect through weights, with neurons operating independently within each layer. Typically, all neurons in one layer connect to those in the adjacent layers, forming a fully connected network. A valid MLP requires at least three layers: one input layer, one output layer, and at least one hidden layer, as described in equations (13)–(15). Assumed that we have N weight matrices for an MLP with N layers. These matrices are denoted by


Then, the vector representing the output of the Activation functions often used in research.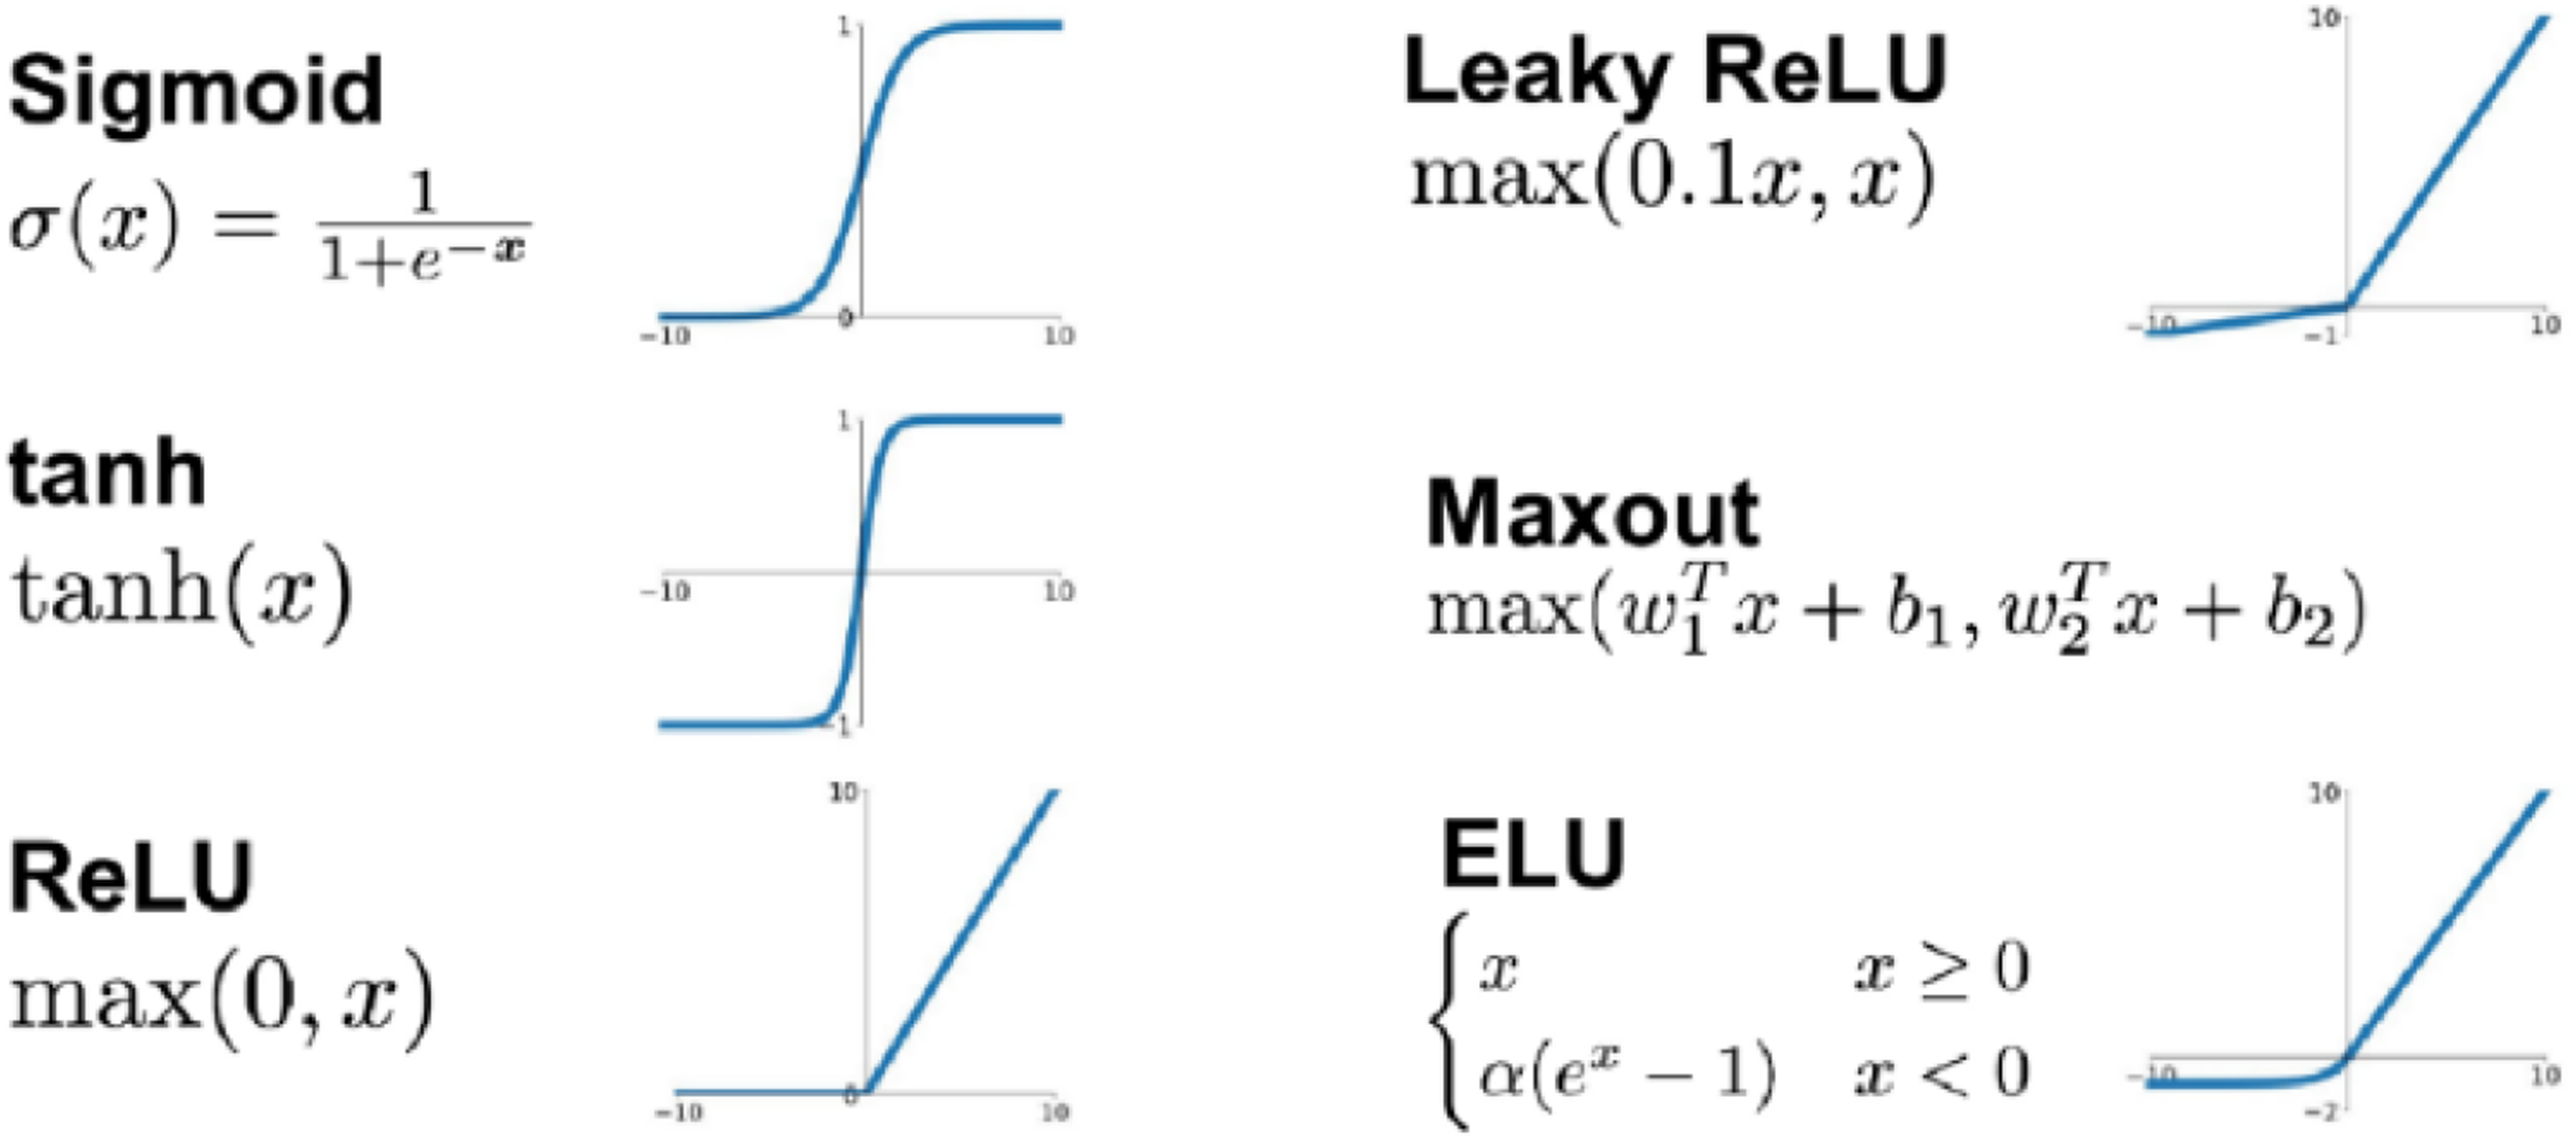


The MLP output vector is determined by the input vector and the activation function. The output is computed as the weighted sum of inputs, transformed by the activation function into a nonlinear value, which becomes the input for the next layer. Information flows sequentially from input to output, with the Mean Squared Error (MSE) calculated as shown in equation (16)

The activation function is crucial for ensuring nonlinearity in the network’s output. While linear activation limits the network to linear outcomes, the research model requires transforming these into nonlinear results. Commonly used functions like Sigmoid, ReLU, Tanh, and Maxout are effective and simple for this purpose, as illustrated in Figure 7.
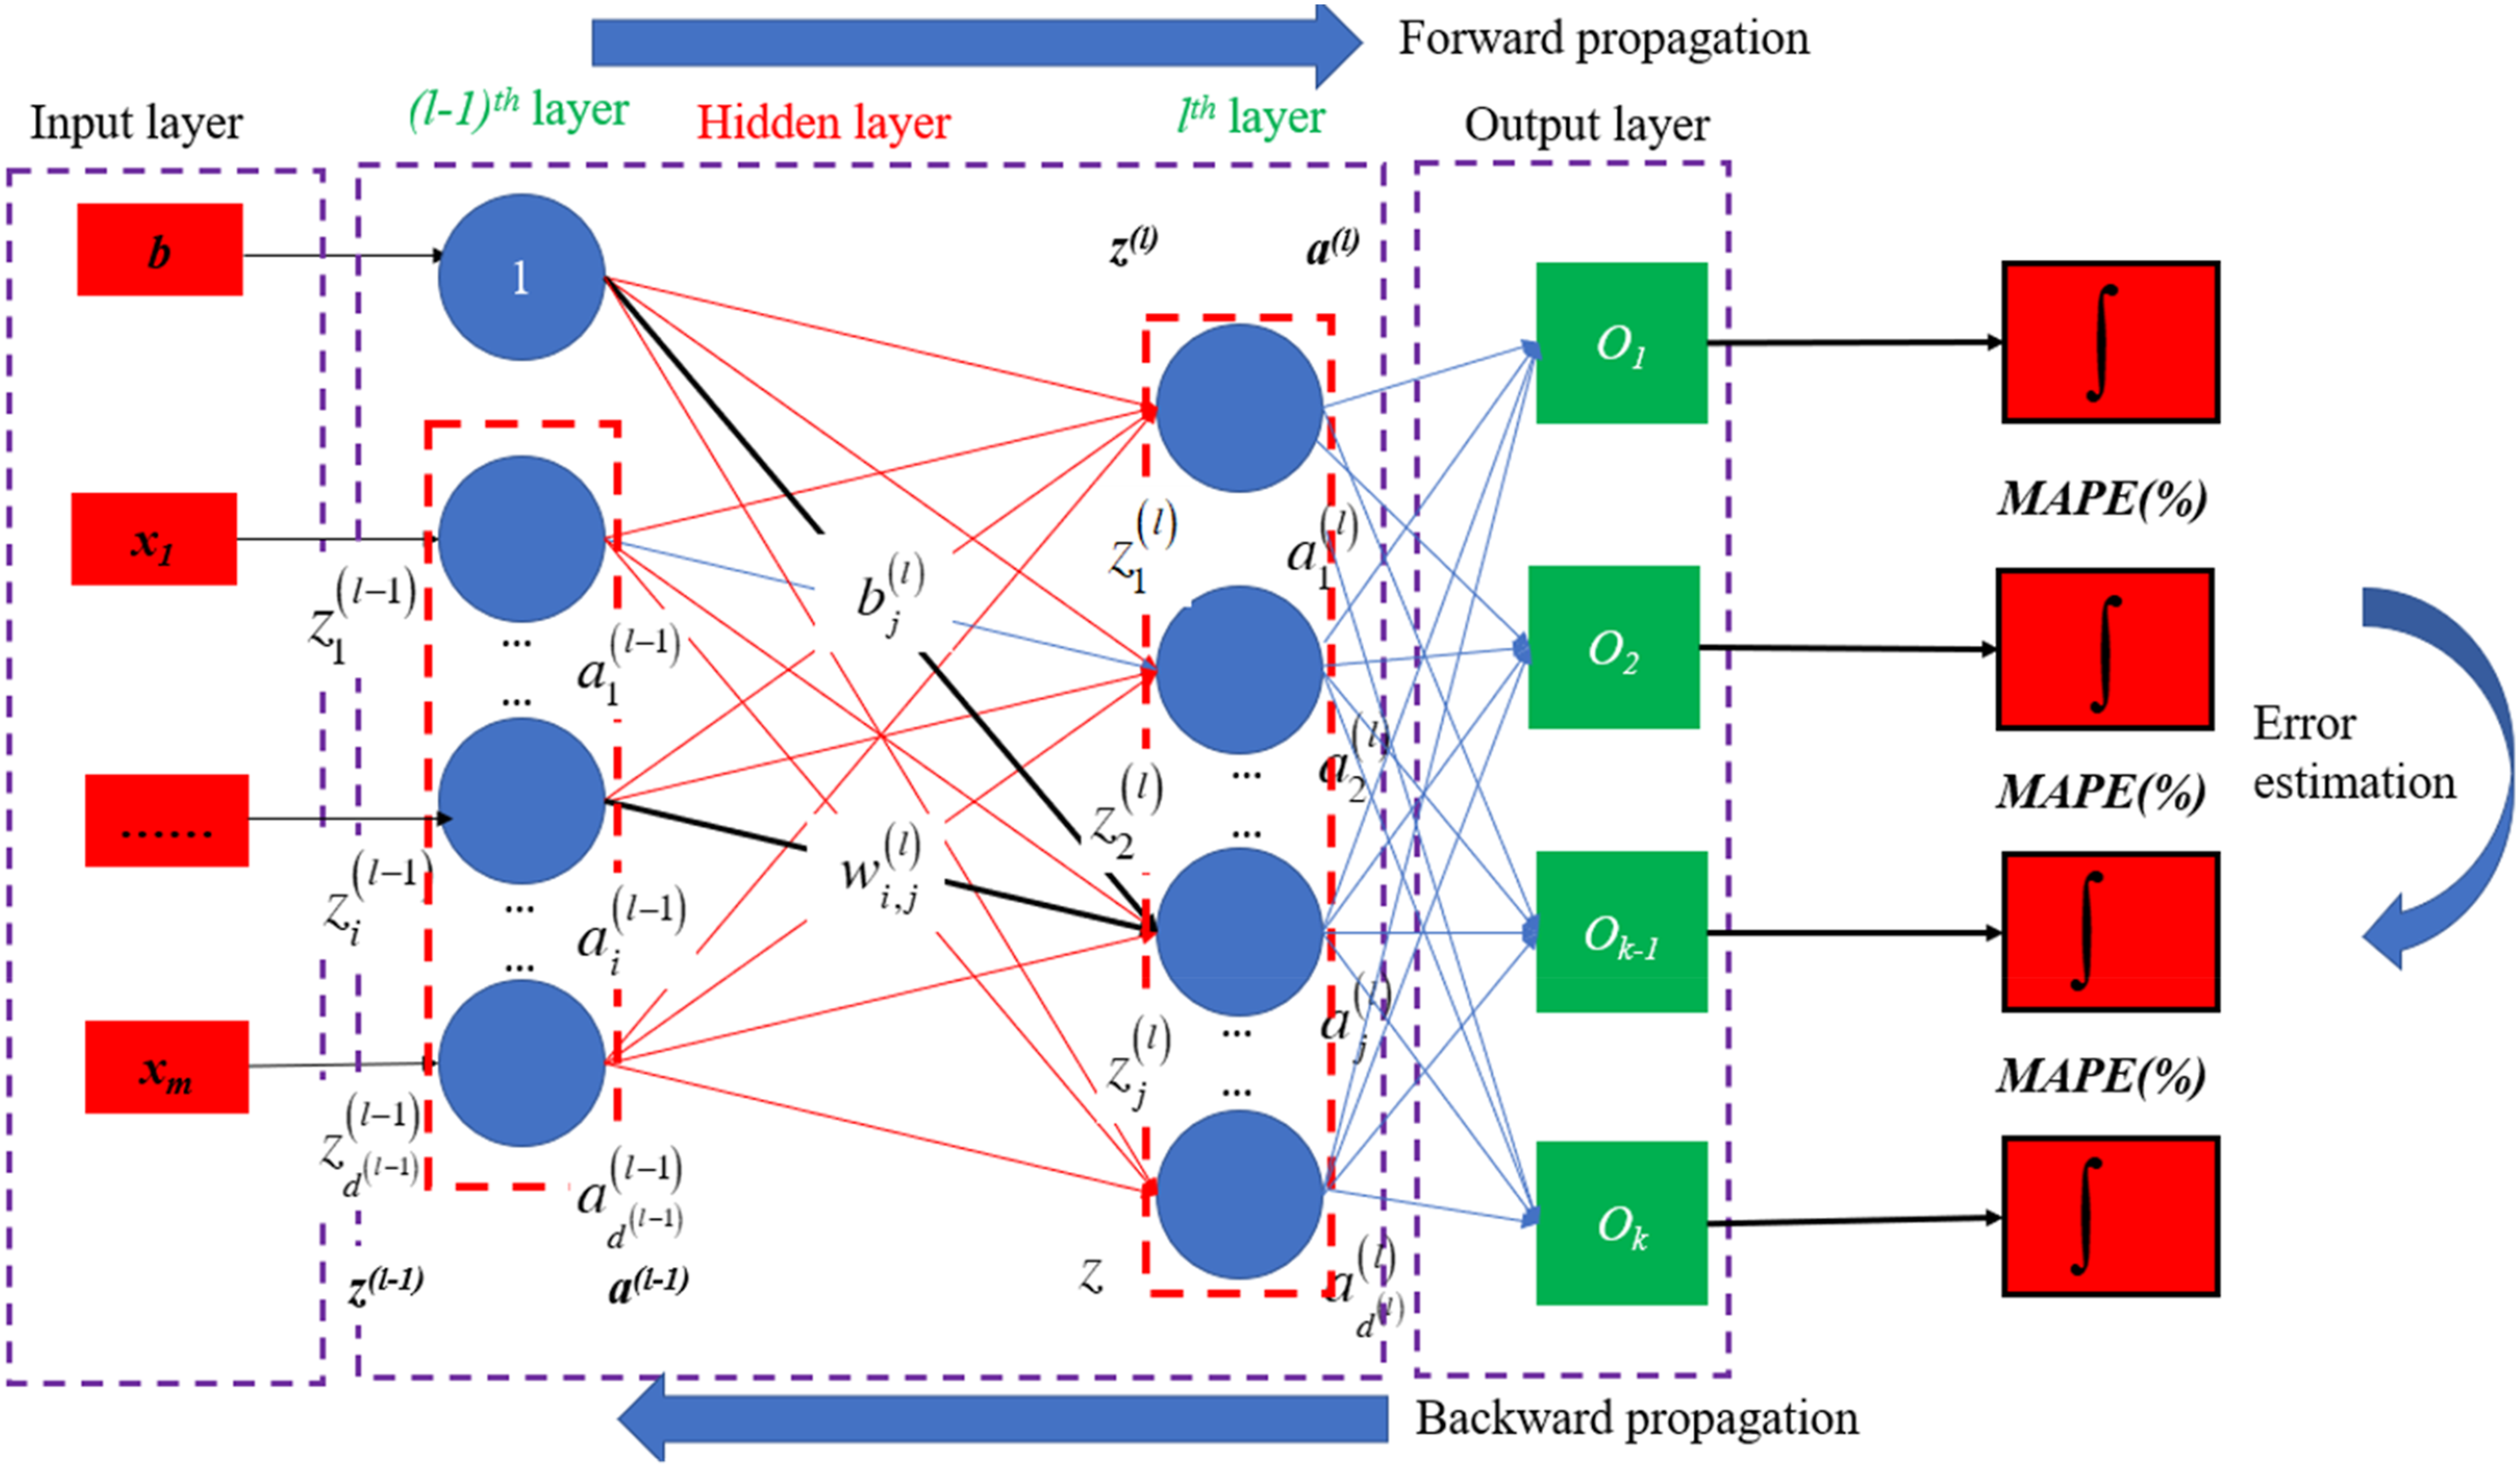
The training process of an MLP network follows a supervised learning approach, as depicted in Figure 6. It unfolds as follows, outlined in Figure 8: Step 1: Input vectors are fed into the network, yielding an output vector. Step 2: The network’s output is compared with the desired output, and the network’s weights are adjusted accordingly. This process, also termed forward propagation, involves feeding input vectors into the network individually, while automatically adjusting weight values until an output closely matching the desired output is achieved. Essentially, the training process of the network persists until the desired input-output pairs are obtained from the network’s output. Step 3: The supervised learning training process is concluded. The training process of the MLP network.
Convolution neural networks—CNN
The CNN is an MLP variant with convolutional layers as hidden layers. The convolution operation, a key feature of CNNs, performs a linear operation between matrices or functions to produce a new output, widely used in image and signal processing. The model used in this study is shown in Figure 9. The training model.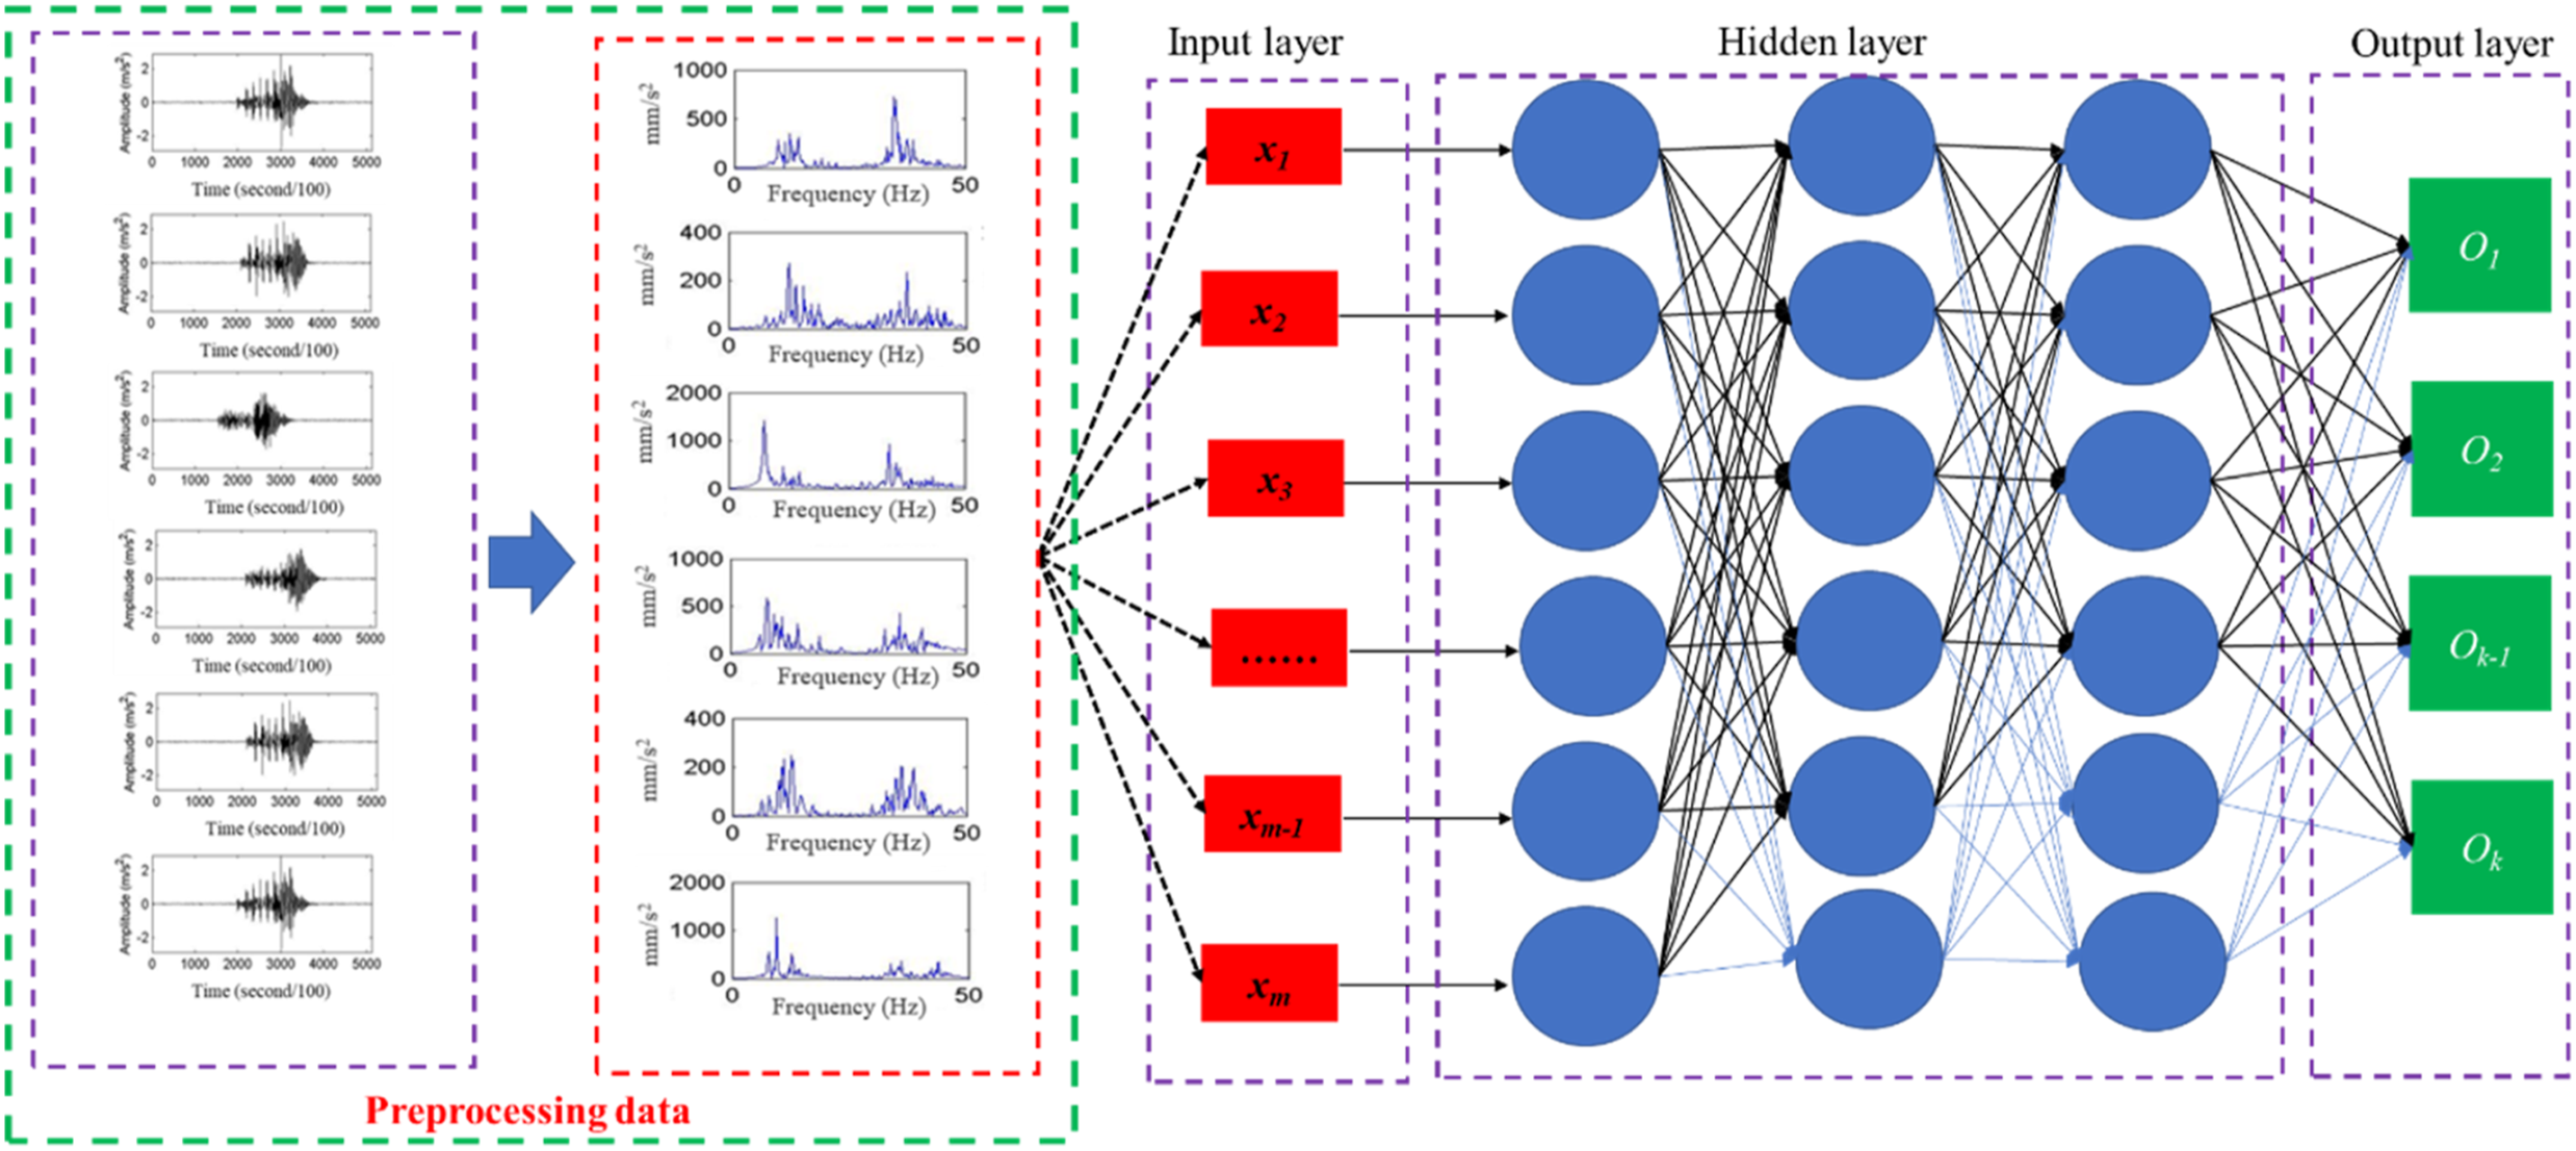
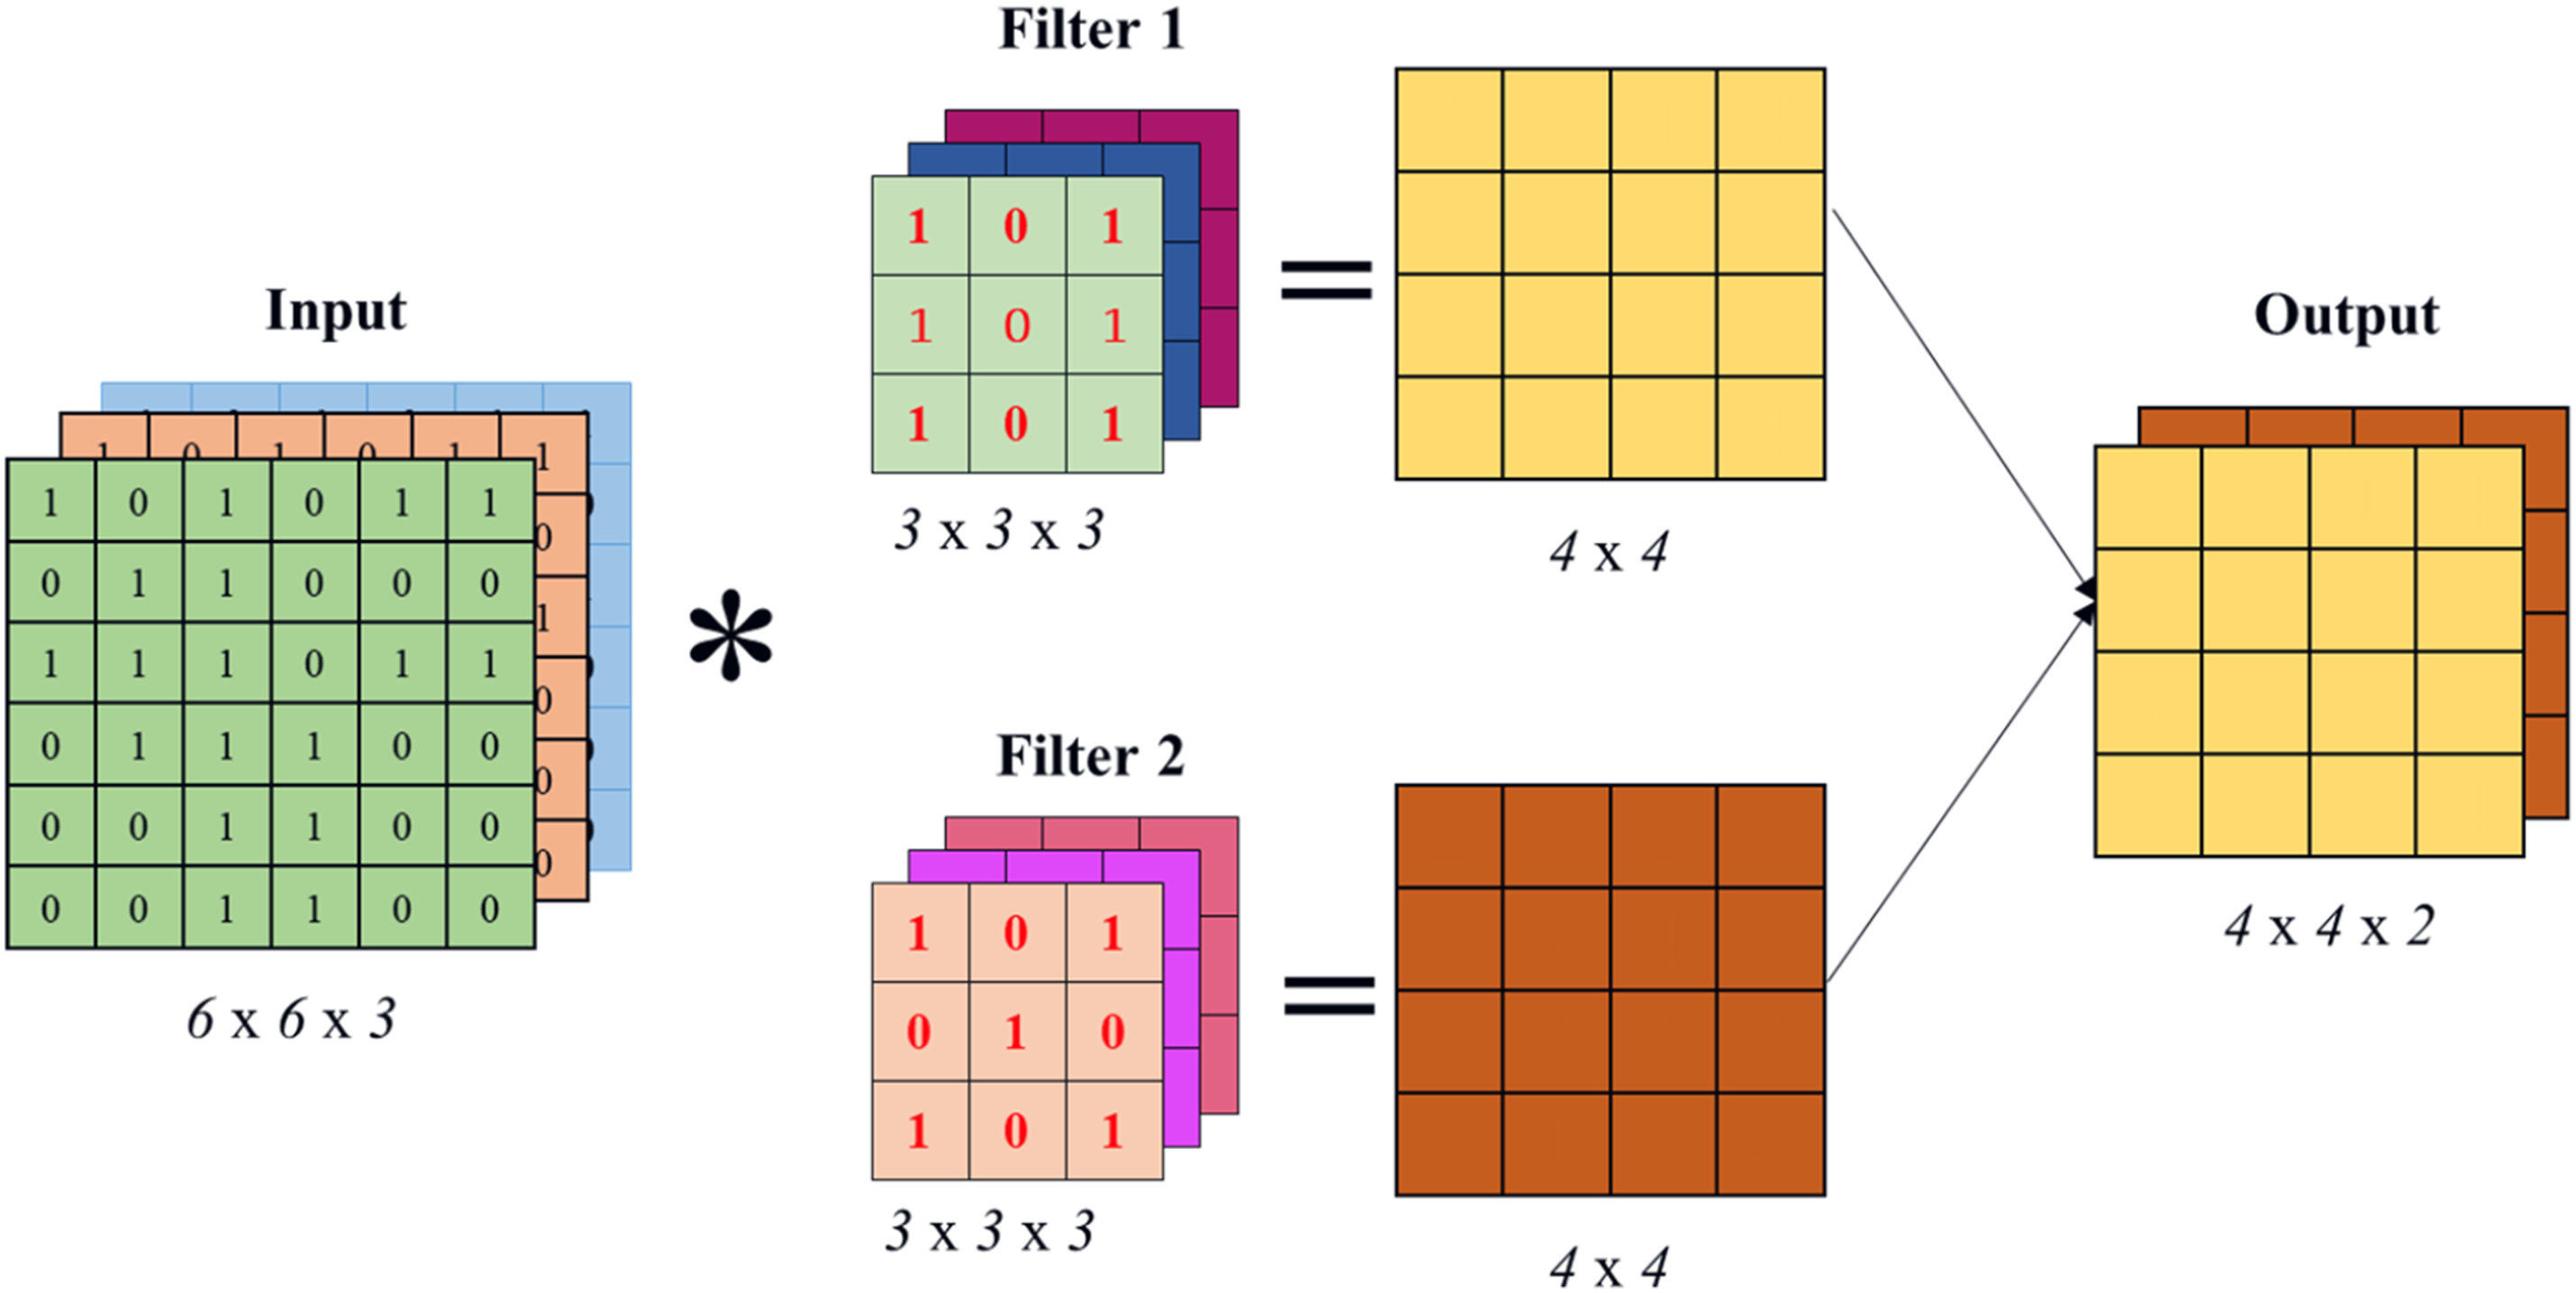
In convolution, two matrices are used: the input matrix and a filter (kernel) with fixed values. The kernel slides across the input matrix, multiplying corresponding values and summing the results at each position. This process generates a new matrix of calculated values, as illustrated in Figures 10 and 11. Computational model of kernel/filter. Two-way cross-correlation.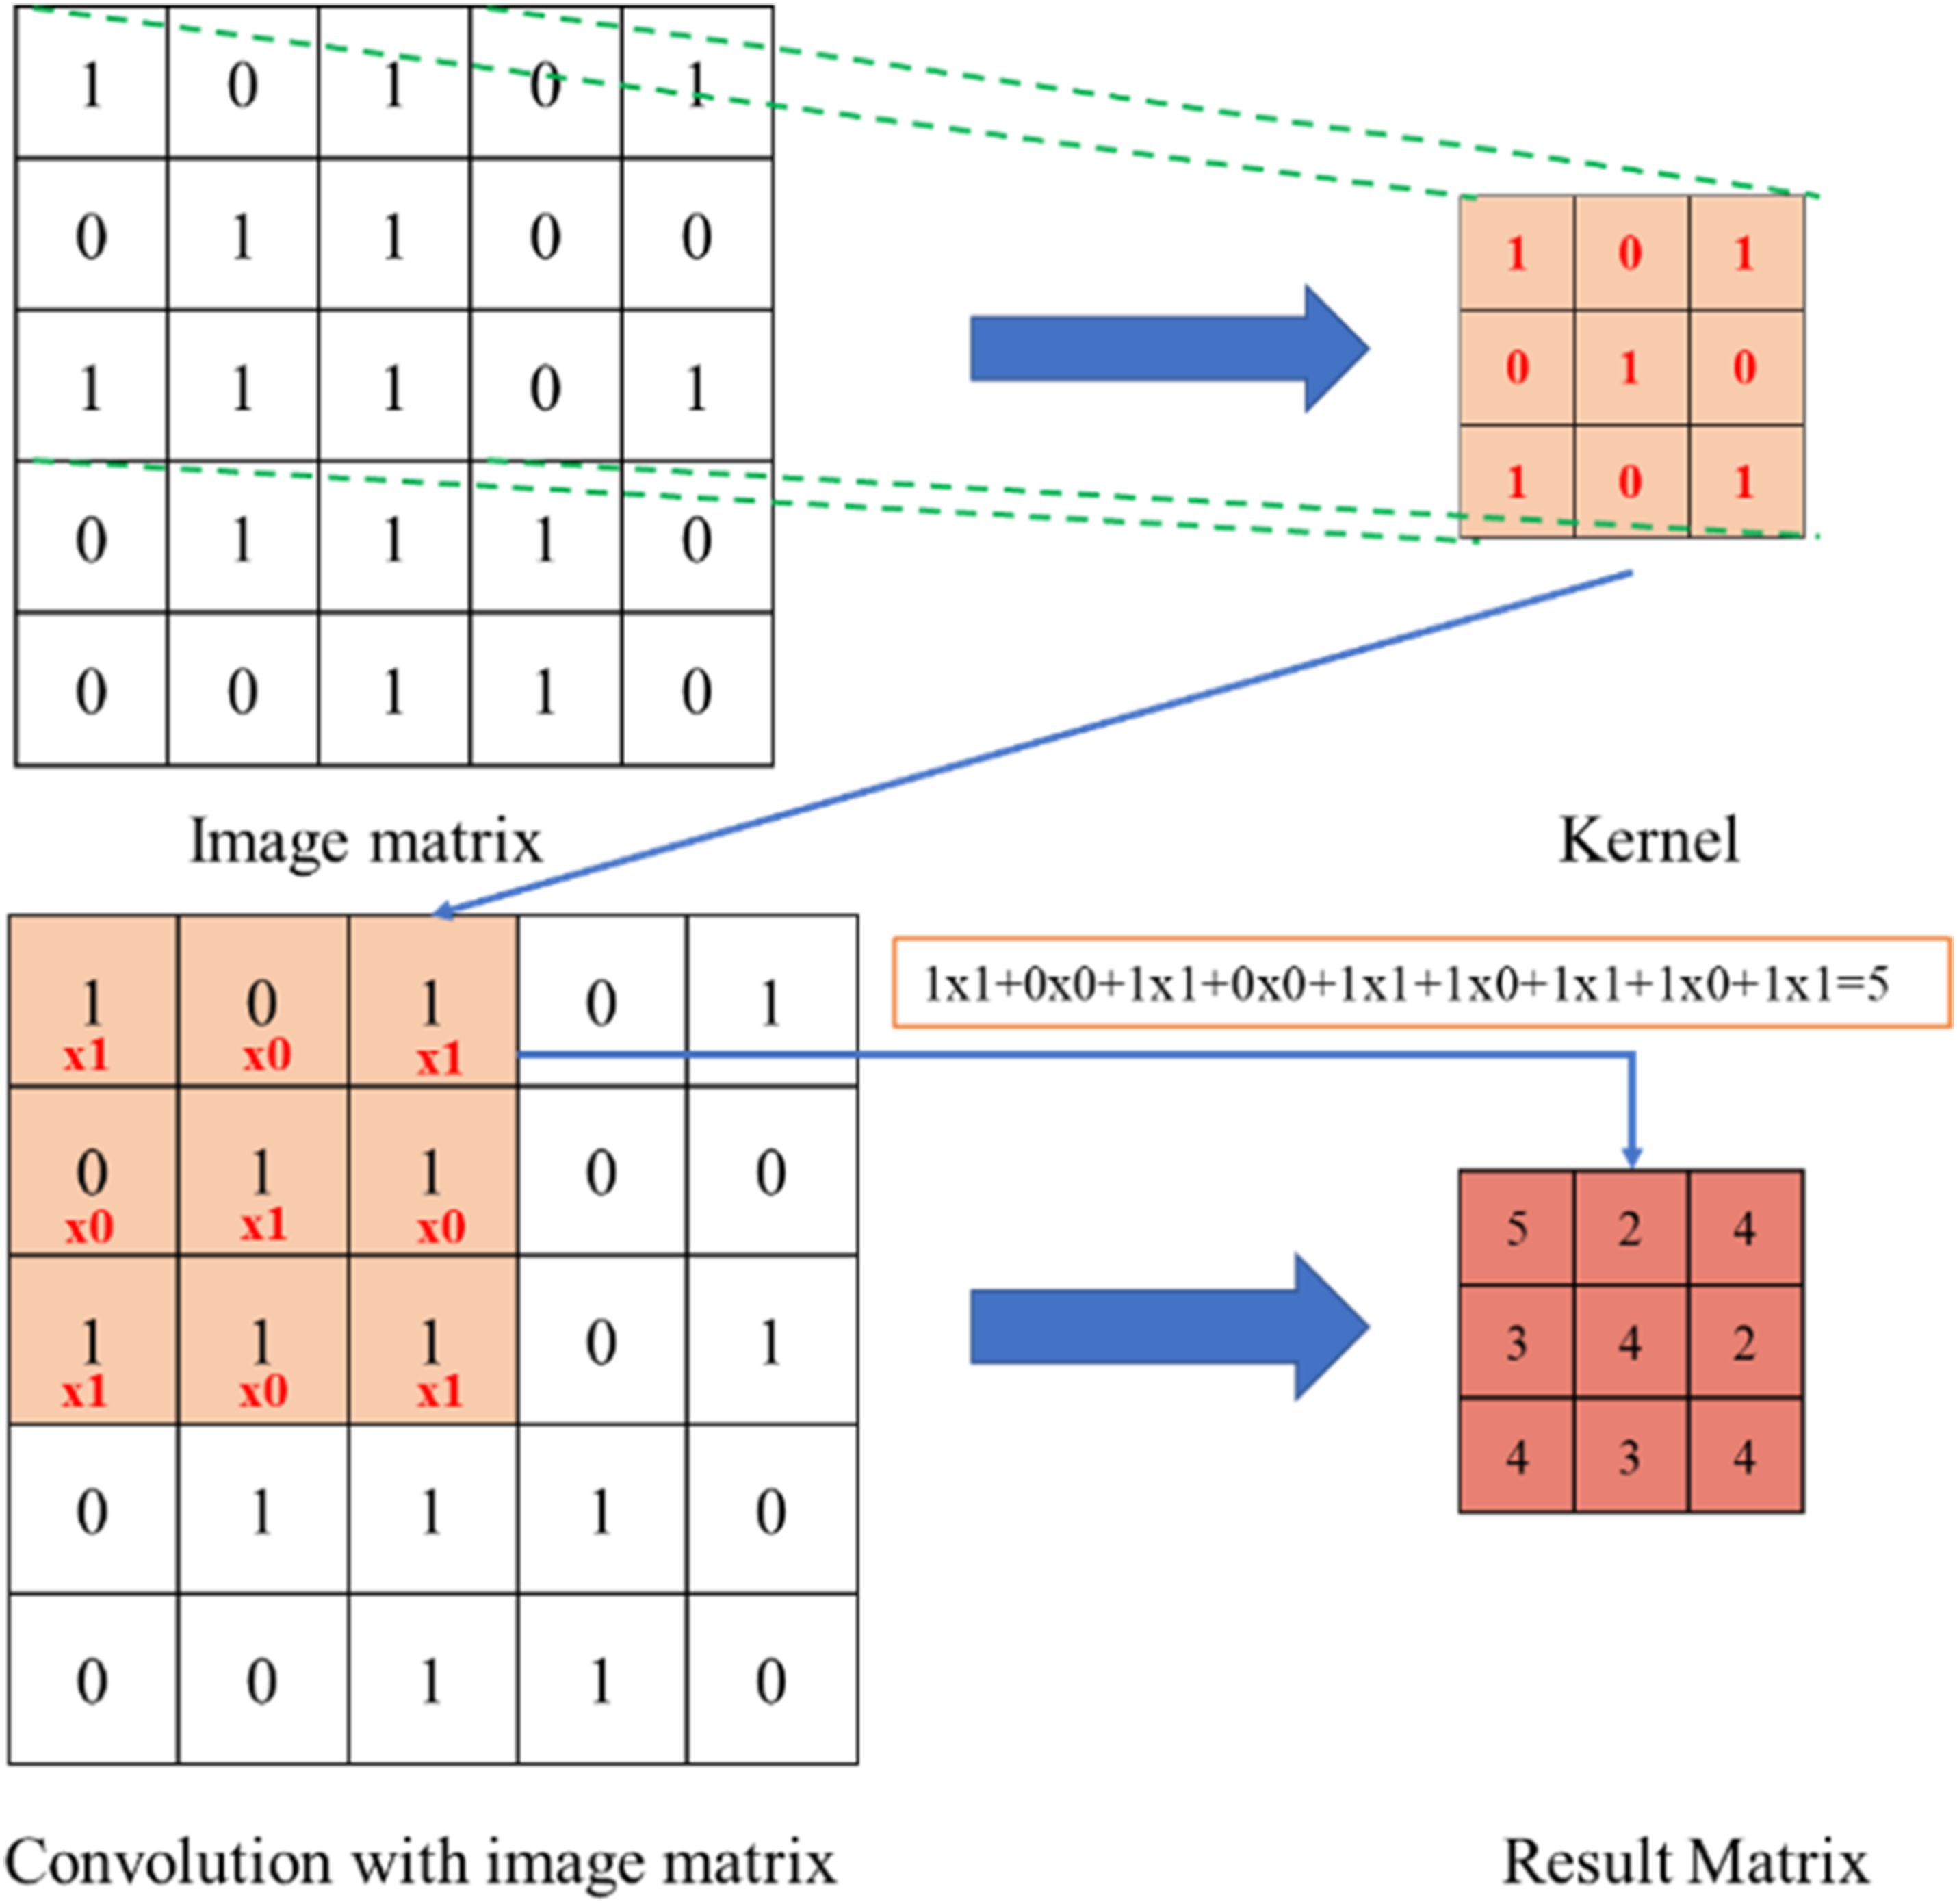
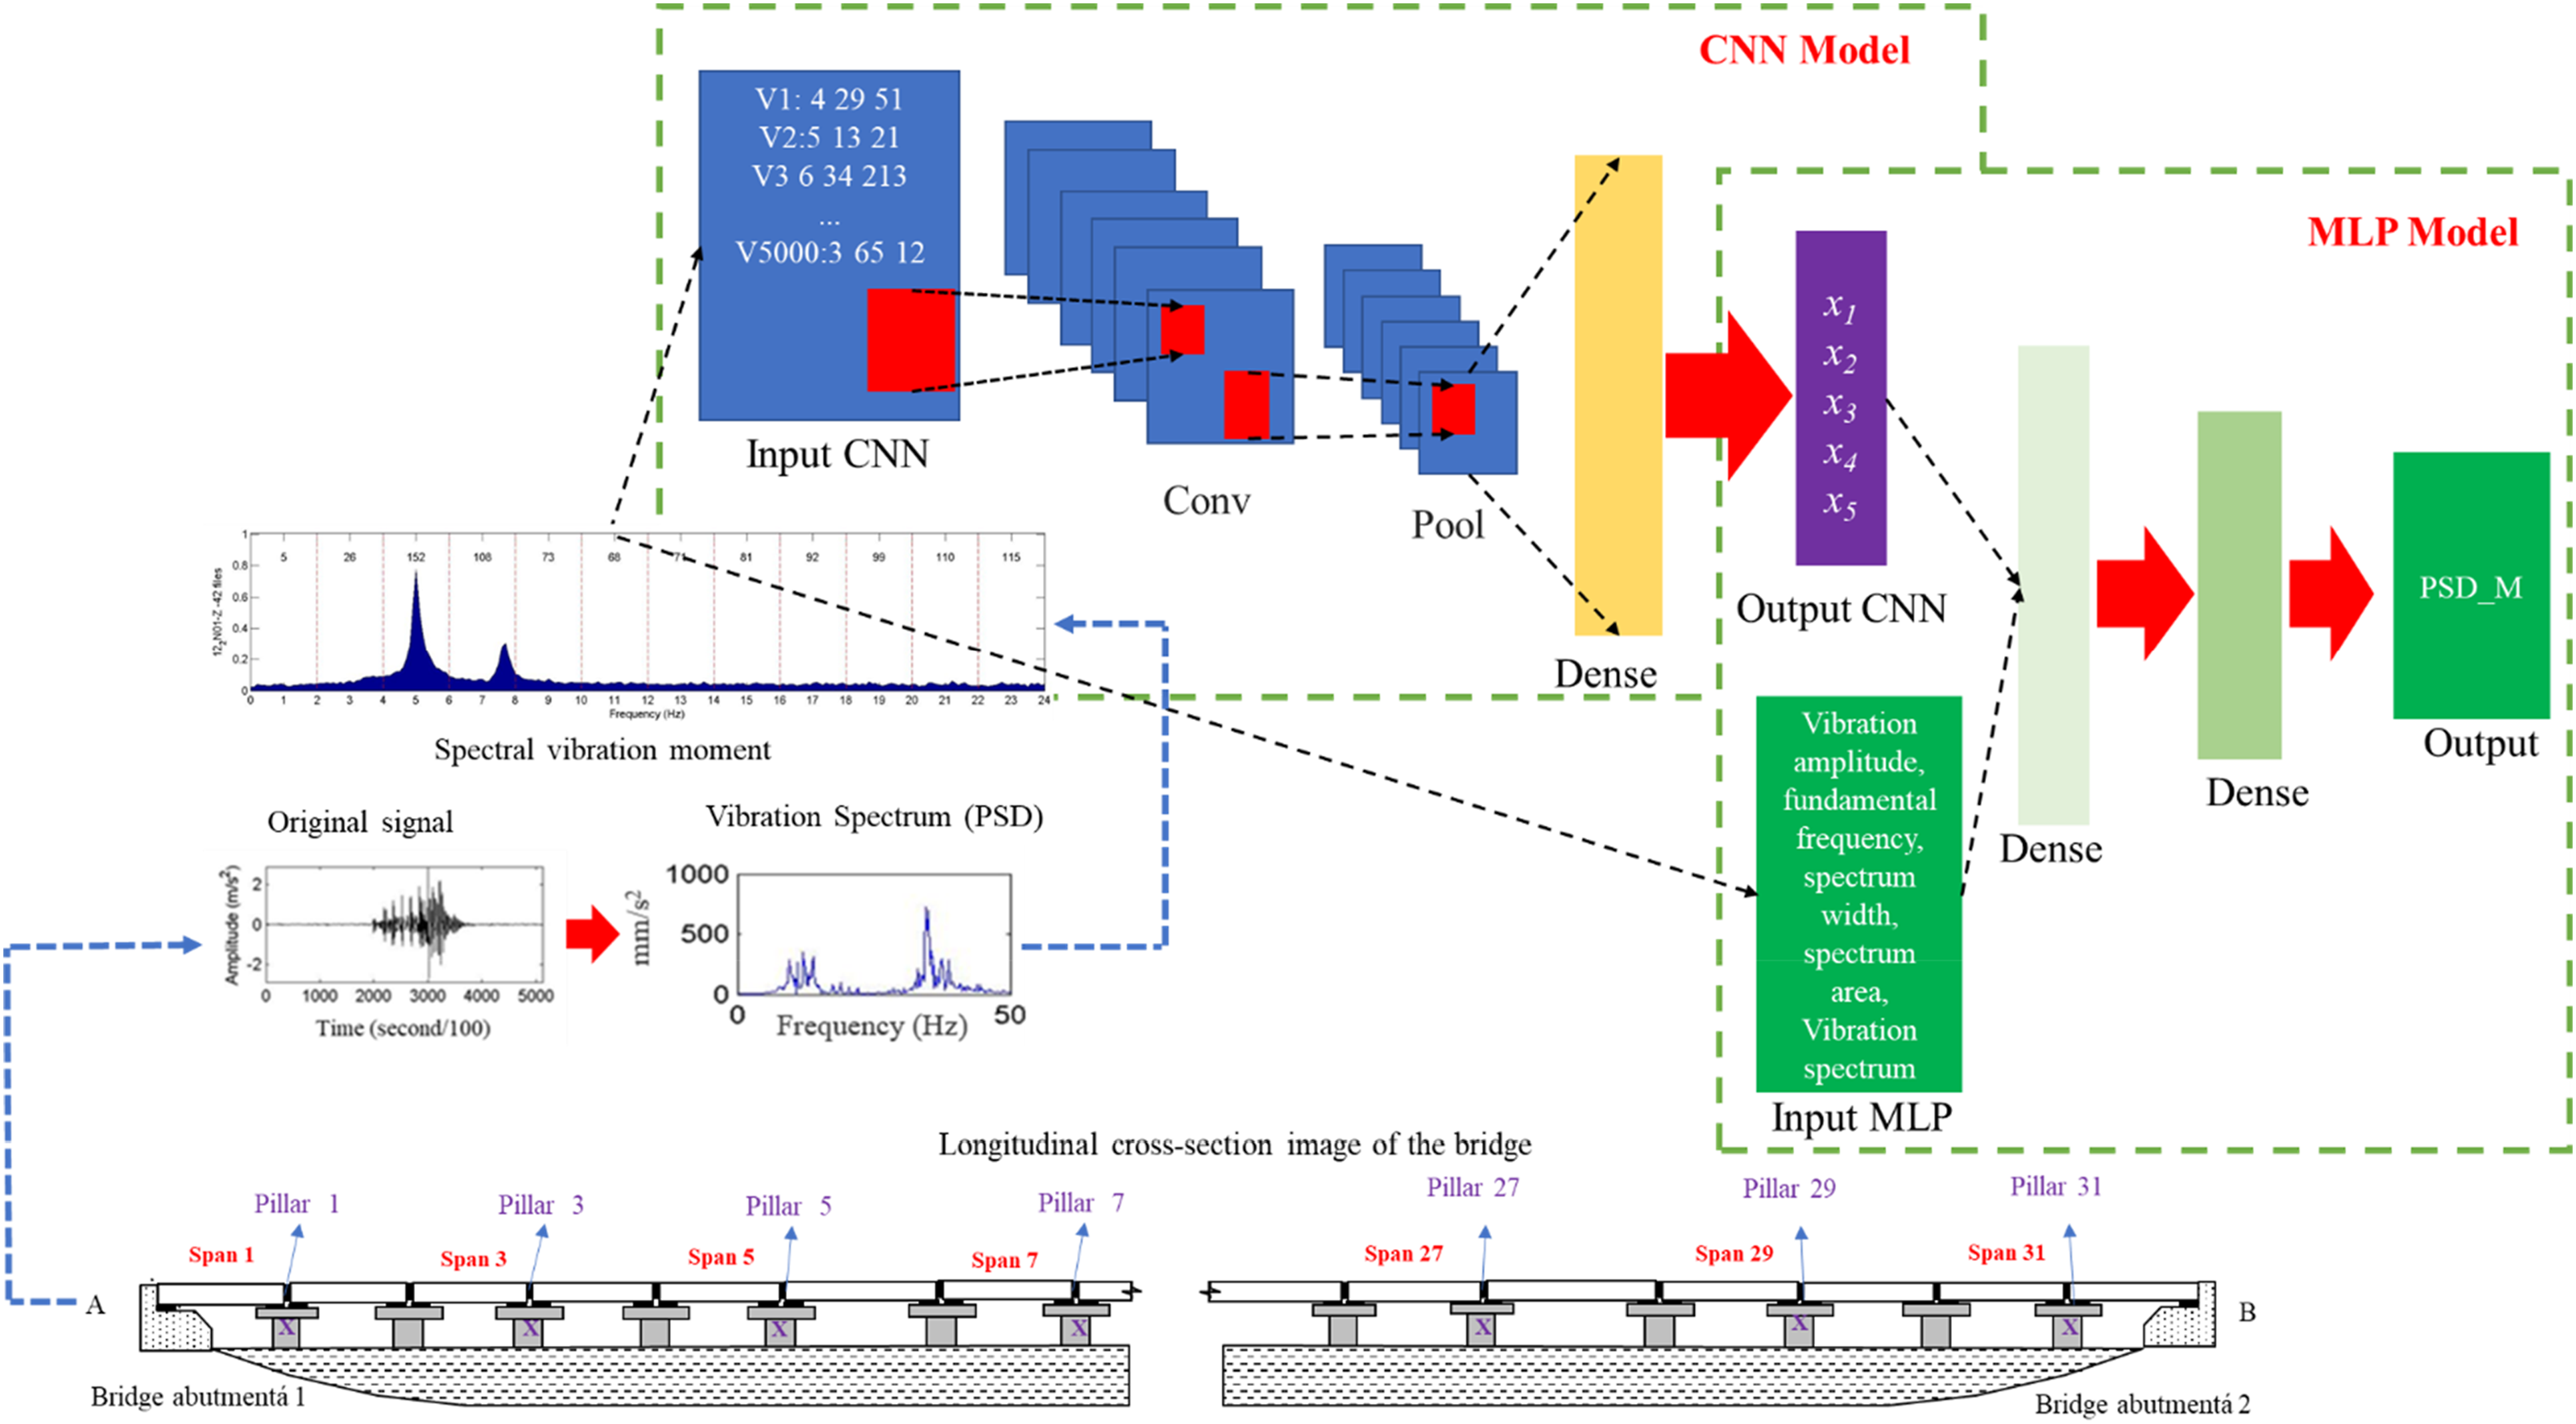
A convolutional layer acts like a fully-connected layer, performing convolution operations on inputs, applying an activation function, and passing the results to the next layer. Unlike MLP, CNN utilizes back-propagation during training, where weights are iteratively adjusted based on the difference between the predicted and expected outcomes. This process, illustrated in Figures 12 and 13, refines the network’s performance. Network training model. Combination of CNN and MLP model.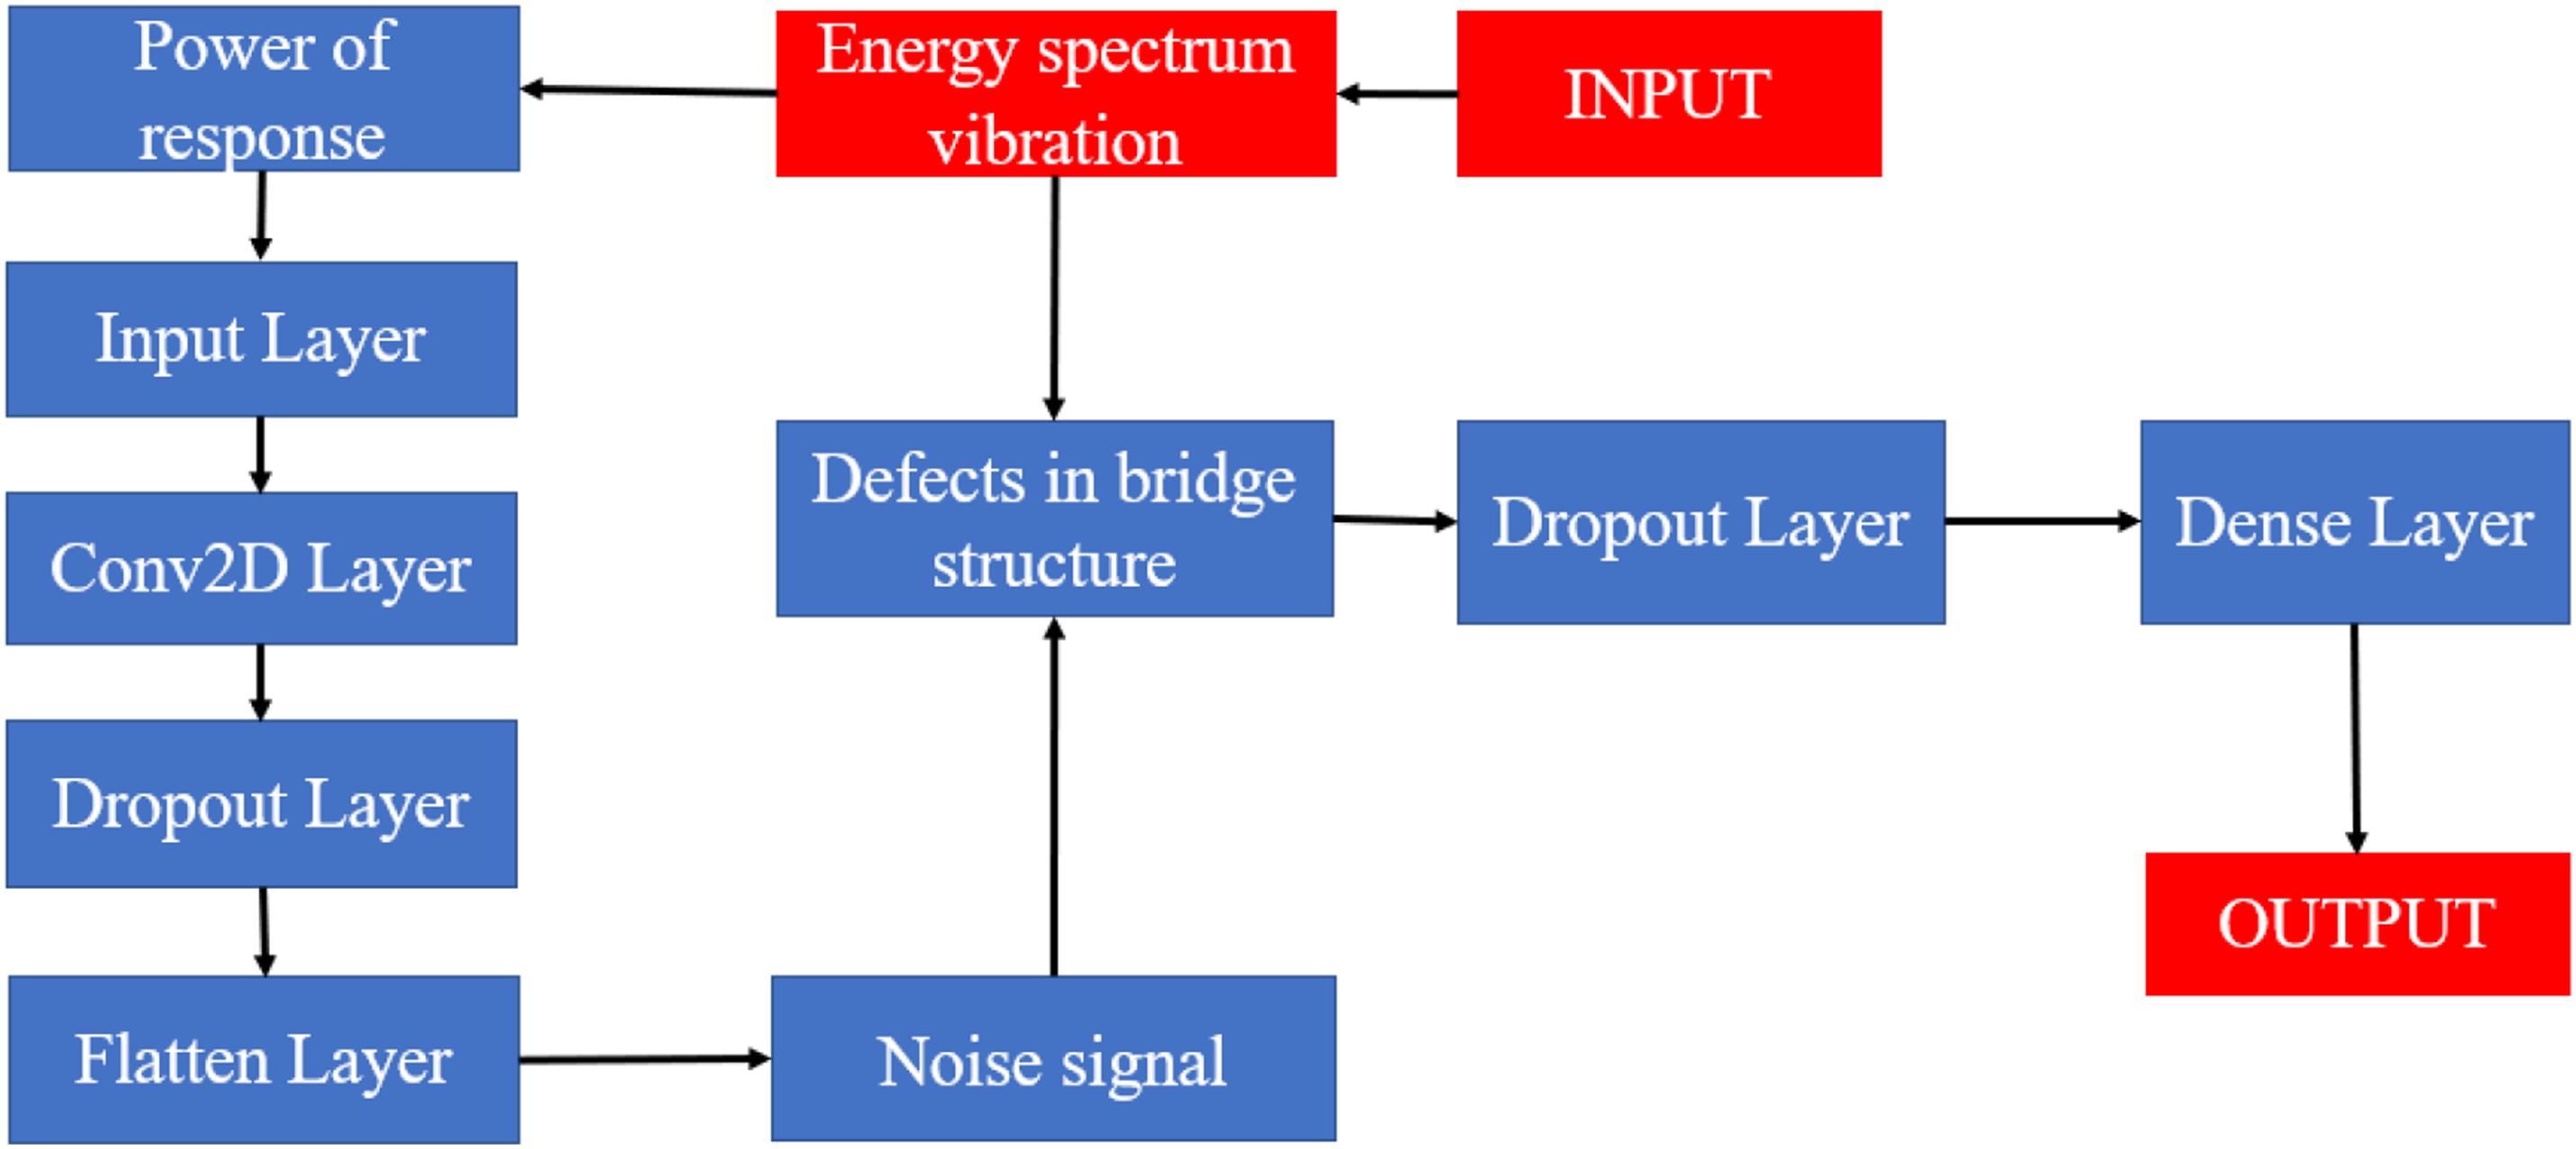
In Section 2.3.2 and Figures 12 and 13, the convolution operation on PSD indeed involves a 2-D convolution. However, the process of converting PSD to a 2D matrix is not explicitly introduced. Let me elaborate on this conversion process: - PSD: PSD is a measure of the power distribution of a signal across different frequencies. In the context of this study, PSD likely represents the distribution of power along the Ox axis, indicating the frequency components present in the structural response data. - Conversion to 2D Matrix: To perform convolution, the PSD data needs to be represented as a 2D matrix. This conversion typically involves discretizing the frequency axis and mapping the PSD values onto a grid. - Discretization: The frequency axis is discretized into bins or intervals. Each bin represents a specific range of frequencies. - Mapping PSD Values: The PSD values corresponding to each frequency bin are then mapped onto the 2D grid. This can be achieved by assigning each PSD value to the appropriate cell in the grid based on the frequency range it represents. - Padding and Stride: Depending on the specific convolution operation used, padding and stride may also need to be considered during the conversion process. Padding adds additional rows and columns to the 2D matrix to ensure that the convolution operation covers the entire PSD data, while stride determines the step size of the convolution kernel as it moves across the matrix. - Convolution Operation: Once the PSD data is represented as a 2D matrix, standard 2D convolution operations can be applied using techniques such as Fourier Transform-based convolution or direct spatial-domain convolution.
In summary, the conversion process from PSD to a 2D matrix involves discretizing the frequency axis, mapping PSD values onto a grid, and considering factors like padding and stride to facilitate the convolution operation. While the specific details of this conversion process may vary depending on the implementation, it serves as a crucial step in applying convolutional operations to PSD data in the context of the study.
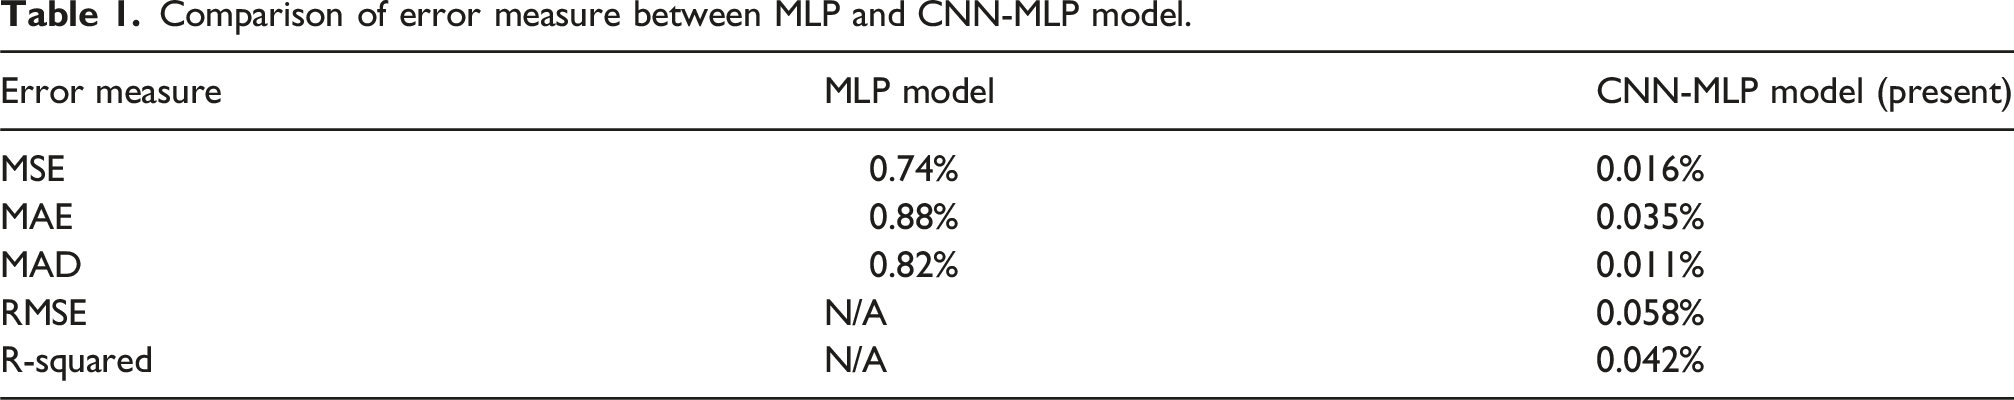
Comparison of error measure between MLP and CNN-MLP model.
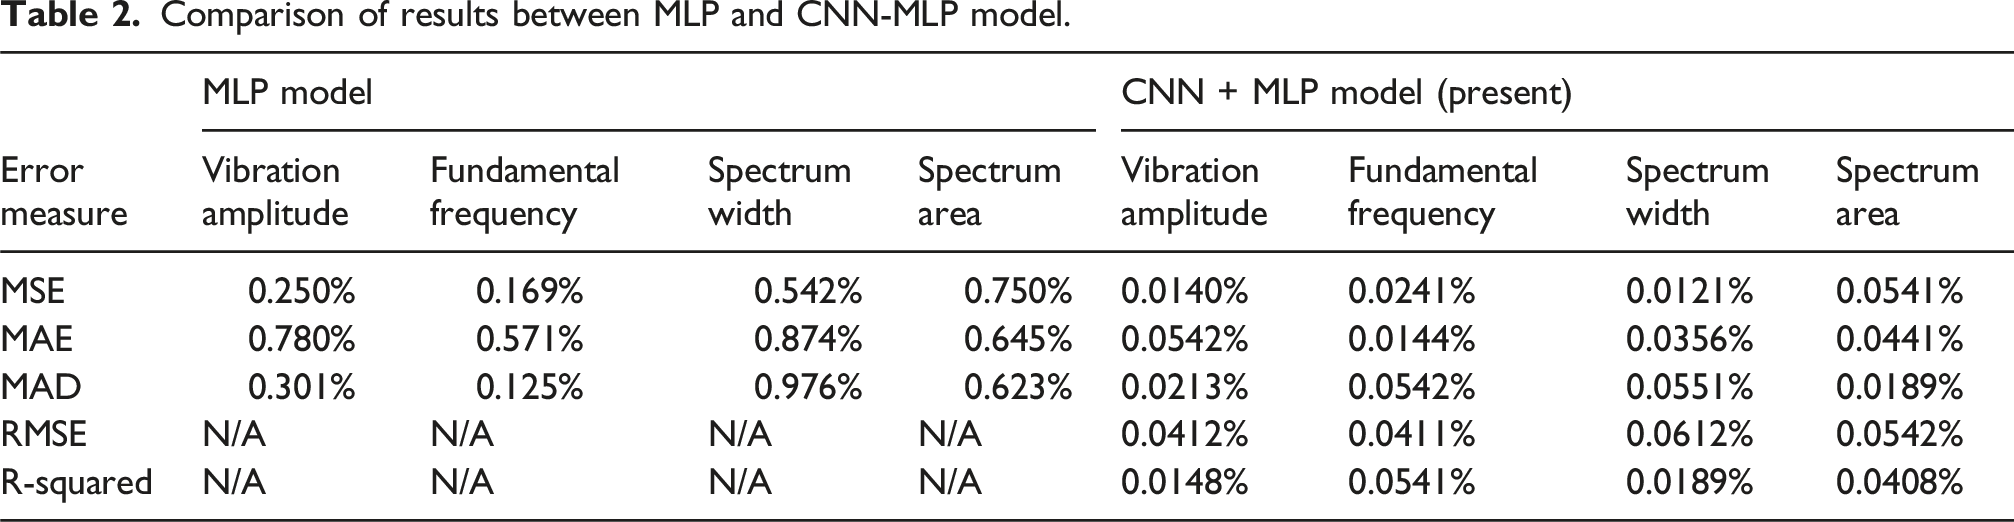
Comparison of results between MLP and CNN-MLP model.
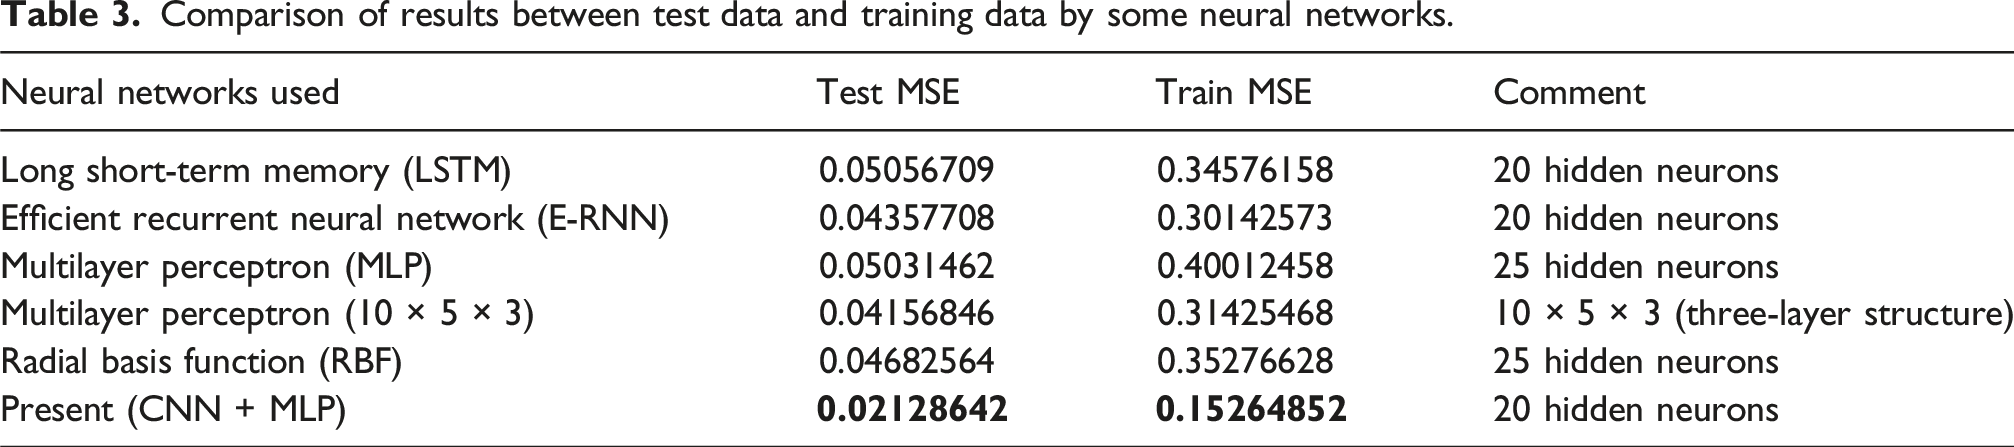
Comparison of results between test data and training data by some neural networks.
Physical insight into dynamic characteristics and mechanical properties
In bridging the gap between numerical analysis and real-world structural behavior, it is essential to understand how dynamic characteristics derived from vibration data correlate with the mechanical properties of the structure. In this study, we employ vibration signal analysis using Power Spectral Density (PSD) and spectral moment methodologies to capture the dynamic response of Saigon Bridge under operational loads.
Key dynamic parameters—such as the fundamental frequency and resonance regions—are not only numerical descriptors but also serve as indicators of critical mechanical properties, including stiffness and damping. For instance, a decrease in the fundamental frequency is typically associated with a reduction in structural stiffness, which may result from material degradation, cracking, or other forms of damage. In addition, the shape of the PSD, especially the distribution and amplitude of resonance peaks, reflects the vibrational energy distribution throughout the structure. Changes in these characteristics over time are directly linked to the deterioration processes occurring within the bridge.
The spectral moment (SM) analysis further enhances this physical interpretation. Spectral moments provide a quantitative measure of how energy is distributed across the frequency spectrum. Specifically, a shift in the cumulative spectral moment function (CF_SM) is observed when vibrational energy transitions from higher frequencies—often associated with localized damage—to lower frequencies, which characterize the overall, global structural response. Such shifts serve as sensitive indicators of the progression of structural degradation.
By integrating these dynamic features with physical interpretations, our approach ensures that the computational outputs (i.e., PSD, SM, and CF_SM values) are firmly rooted in the actual mechanical behavior of the structure. This correlation not only bolsters the reliability of our Structural Health Monitoring (SHM) methodology but also provides practical insights for proactive maintenance and damage mitigation strategies.
Experimental model
Bridges inevitably experience damage that accumulates over time, necessitating effective monitoring to ensure structural integrity and safety. This study focuses on detecting changes in bridge conditions over time by analyzing vibration signals collected through various measurements. The Saigon Bridge in Ho Chi Minh City, Vietnam, serves as the case study, as shown in Figure 14. Connecting urban and suburban areas, this bridge features 32 spans, including three steel-concrete composite spans and 29 reinforced concrete spans, demonstrating diverse structural configurations. ➢ Span Types: The Saigon Bridge combines both simply supported and continuous spans to balance cost efficiency and structural performance. The reinforced concrete spans are primarily simply supported, offering straightforward structural behavior and ease of construction. In contrast, the steel-concrete composite spans are designed with continuous behavior, enhancing load distribution and improving structural stability across joints. ➢ Cross-Section Details: Each type of span on the Saigon Bridge has unique structural features designed to meet specific functional requirements. The reinforced concrete spans consist of 12 reinforced concrete beams supporting a concrete deck with a thickness of approximately 20 cm. This design ensures sufficient load-bearing capacity and long-term durability, even under the heavy traffic conditions typical of urban areas. The steel-concrete composite spans are constructed with 12 steel I-beams and a reinforced concrete deck that is slightly thinner, measuring around 18 cm. This thinner deck reduces the overall self-weight of the span while maintaining the necessary strength and resilience for structural stability. ➢ Material Composition: The spans of the Saigon Bridge are constructed using high-quality materials to endure the demands of urban traffic and challenging environmental conditions. The reinforced concrete spans utilize high-grade concrete, which offers excellent resistance to weathering and heavy loads, ensuring their long-term durability. The steel-concrete composite spans incorporate weather-resistant steel, providing enhanced durability and structural integrity under variable conditions, making them well-suited for the bridge’s continuous operation. ➢ Bridge Configuration: The Saigon Bridge spans measure 24.7 m in length and 24 m in width, accommodating significant traffic flow between the urban center and outlying areas. The structural design efficiently distributes loads across the beams, ensuring stability and safety over time. The diverse configurations of the spans demonstrate a thoughtful balance between performance, durability, and adaptability to varying load conditions. View of Saigon Bridge in Ho Chi Minh city.

The Saigon Bridge, with its mixed structural design of reinforced concrete spans and steel-concrete composite spans, exhibits distinct dynamic behaviors due to its materials and construction. For example, the fundamental frequencies of the reinforced concrete spans are influenced by the stiffness of the beams and the thickness of the concrete deck, which remain relatively stable under typical conditions but decrease with stiffness loss due to material degradation. Conversely, the steel-concrete composite spans, with continuous structural behavior, demonstrate a more distributed response to external loads, such as traffic and wind. These characteristics are captured in the vibration analysis, enabling the identification of damage patterns linked to stiffness variations.
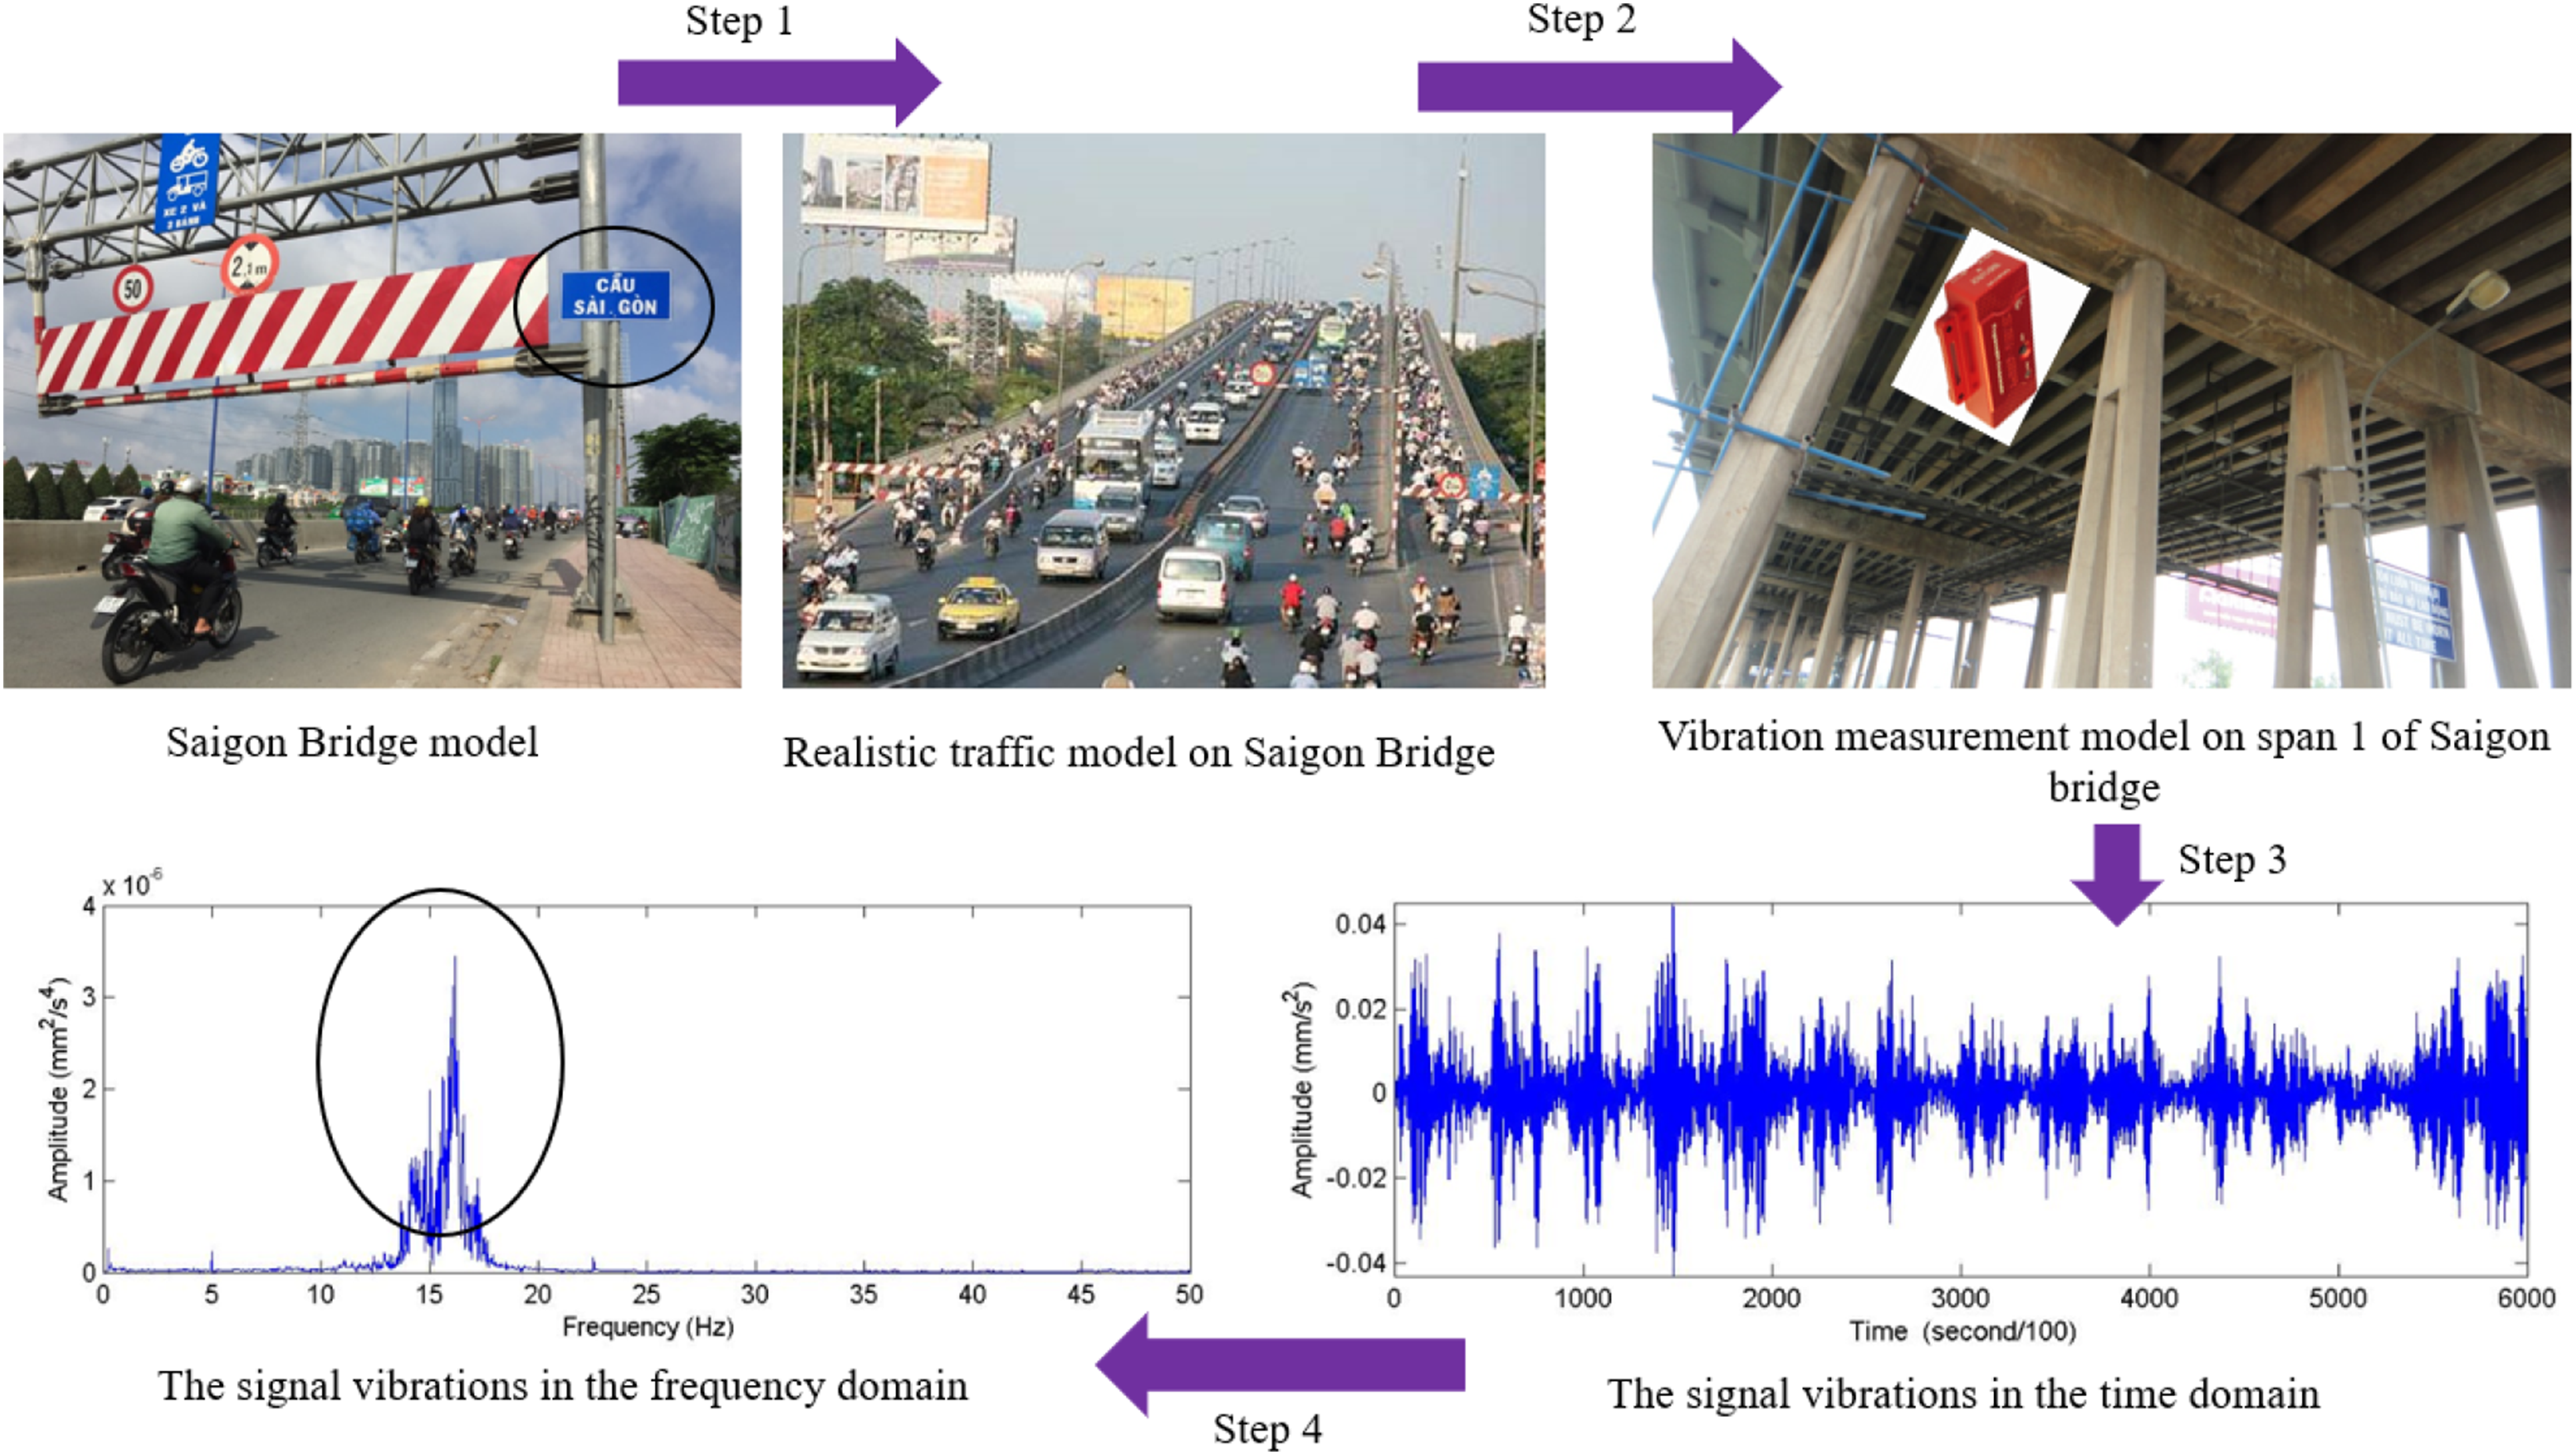
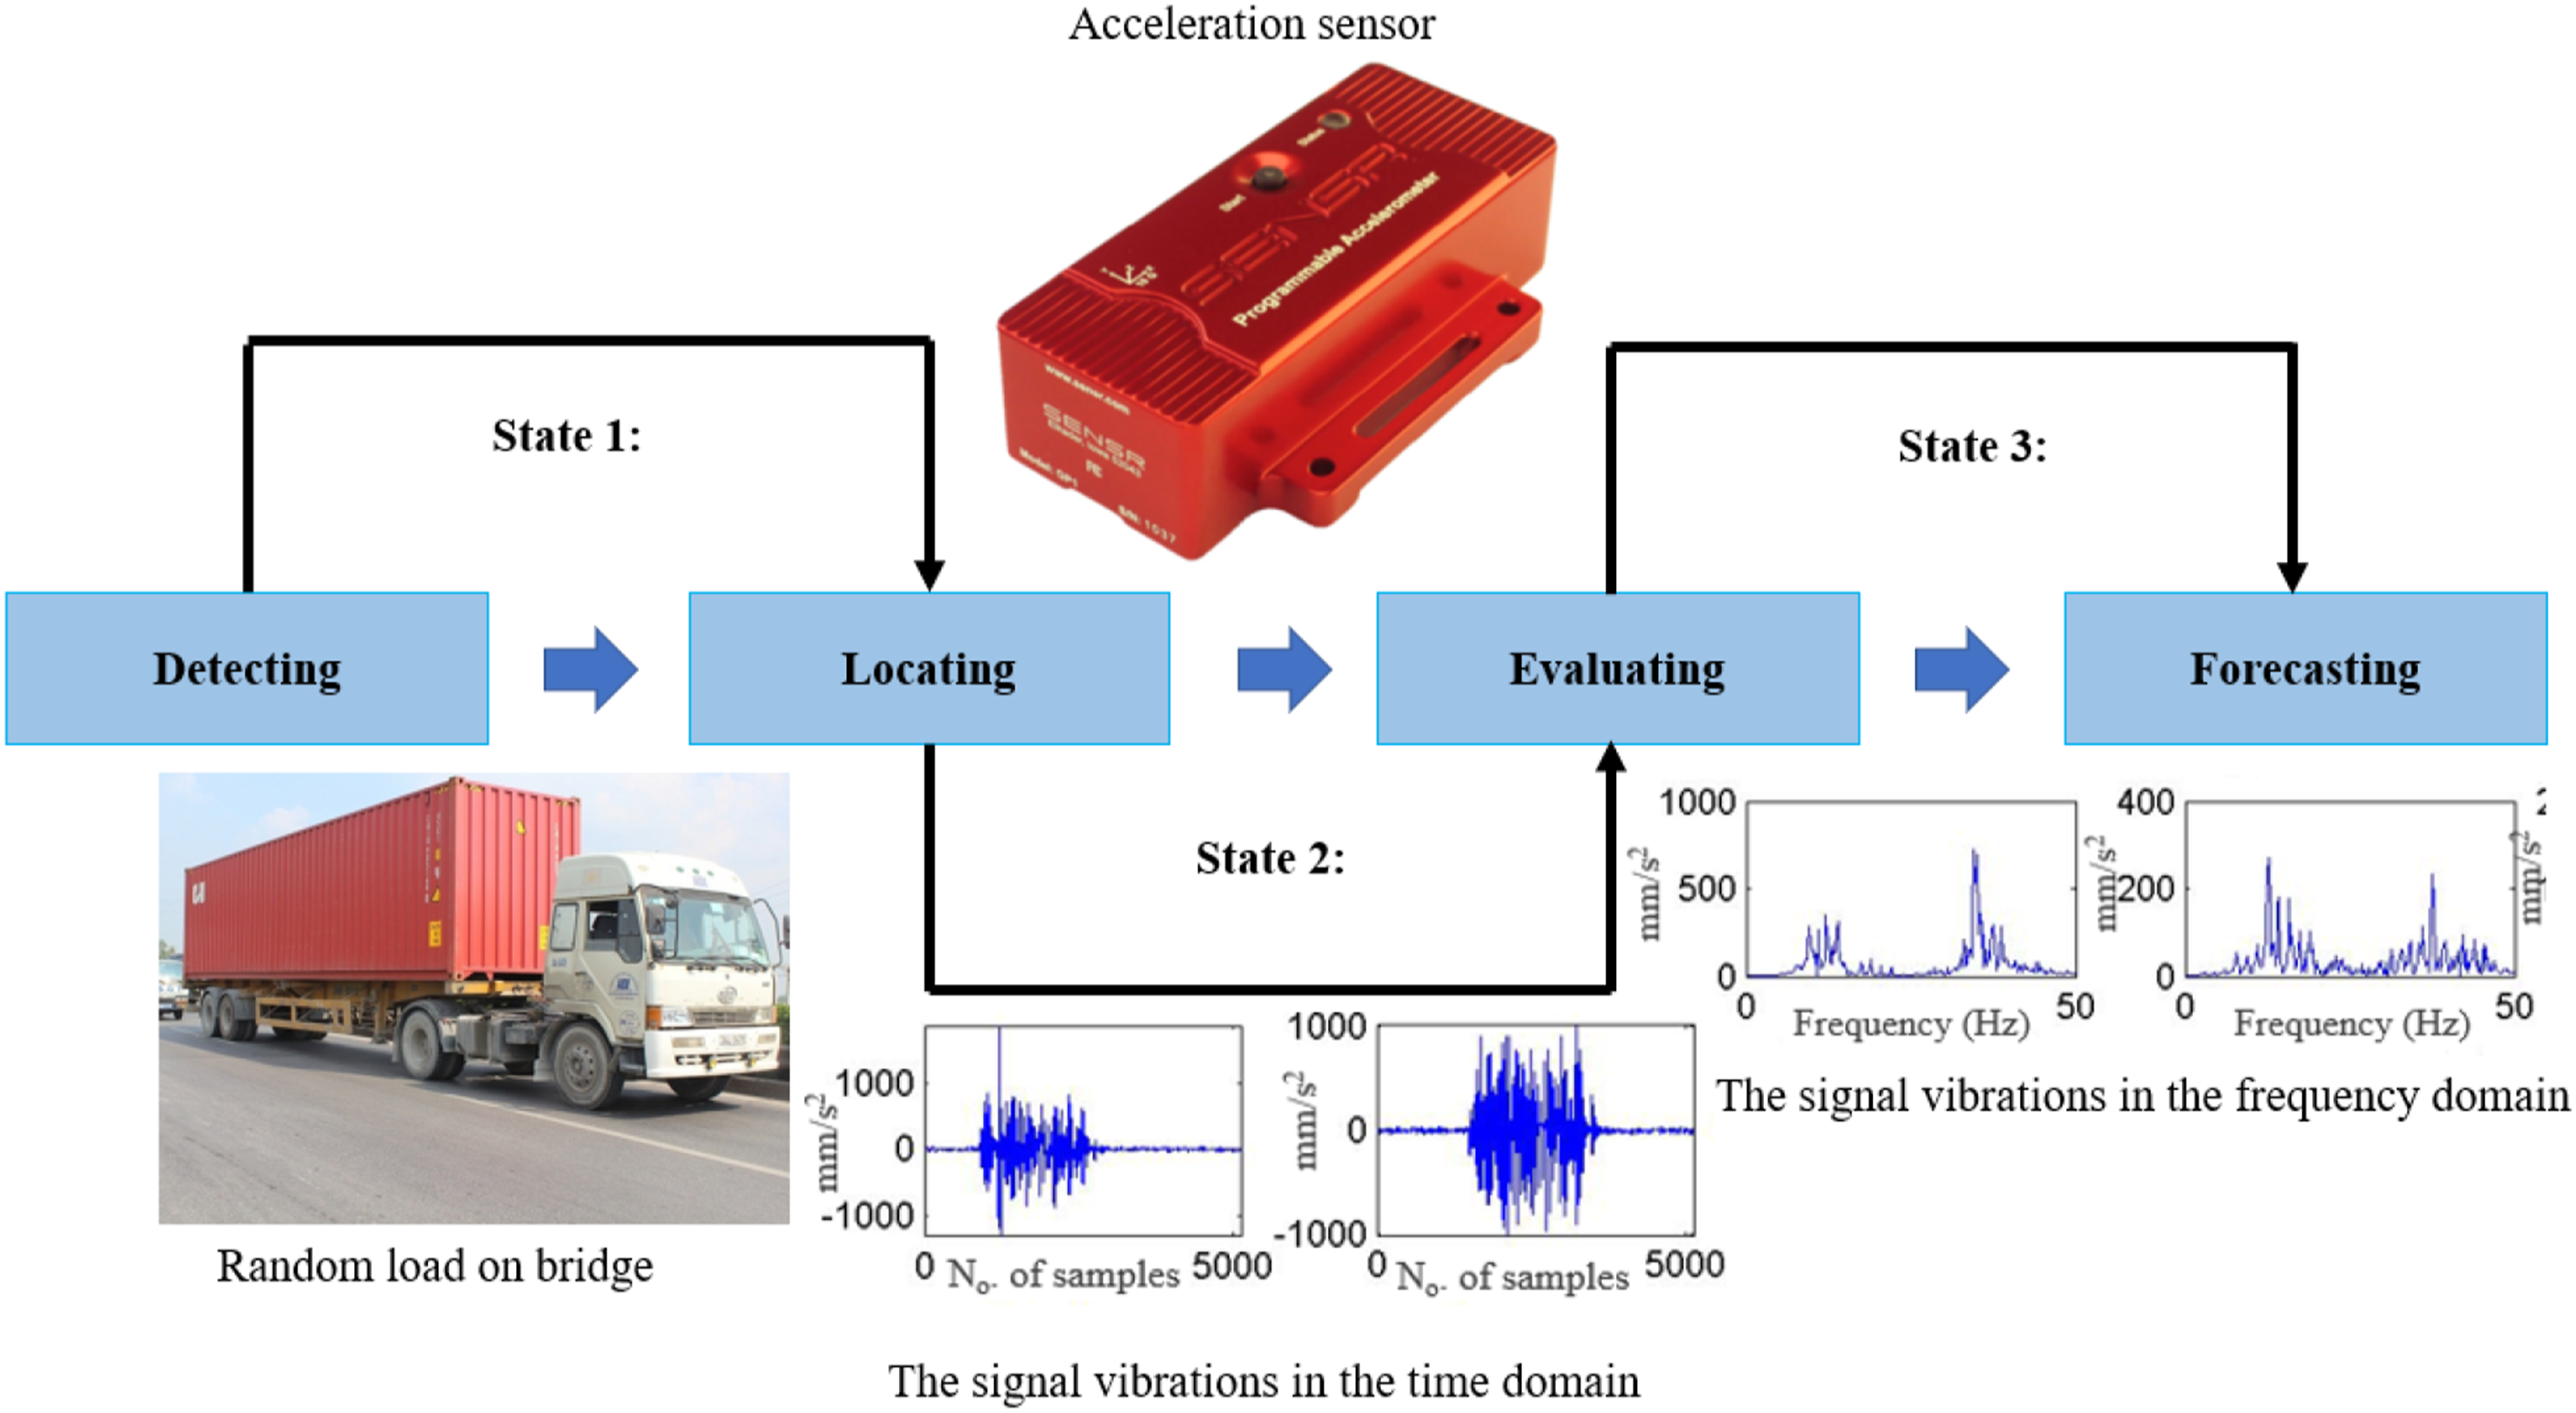
The bridge is monitored continuously using accelerometer sensor as depicted in Figure 15. This system is composed of a fixed sensor system on the bridge and a mobile measurement sensor system. The specifications of the sensors used in this study and the process for measurement the bridge in a time are detailed in Figure 15. The study utilized the SENSR GP 1P vibration accelerometer sensor, shown in Figure 15, for measurement purposes. This sensor, manufactured by Reference LLC/sensor, is identified by process number 224 and serial number 1999. It provides a general accuracy of approximately ± (50 mg ± 5% of reading). Measurements were taken at the midpoint of each span, with a sampling rate of 100 Hz, resulting in 2011 samples per file across 30 files for each position. External stimulation for these measurements was induced by traffic loads spanning from 2011 to 2020, segmented into six measurement campaigns as detailed in Table 2. The issue at hand is the utilization of the SENSR GP 1P vibration accelerometer sensor for measuring structural responses to external stimuli, particularly traffic loads. The sensor’s specifications, including its accuracy and sampling rate, are outlined. Additionally, the methodology for data collection, including the positioning of the sensor and the duration and segmentation of measurement campaigns, is described. This information is crucial for understanding how the study monitored and analyzed the structural responses to traffic loads over a specified period. Figure 16 illustrates the measurement model and outcomes for the first span of the Saigon Bridge, showcasing consecutive time intervals during the monitoring of measured bridge data, considering variations in loads and weather conditions across six distinct measurement occasions spanning from November 2011 to December 2020. The measurement and data processing procedures followed the depiction in Figure 17. To elaborate, random vibration data were gathered from the acceleration sensor placed at designated positions along the bridge span. Subsequently, the collected data underwent processing to ascertain the fundamental frequency values of the span during the measurement phase. The accelerometer sensor used in the study. Experimental procedure on Saigon Bridge. The measurement and data processing.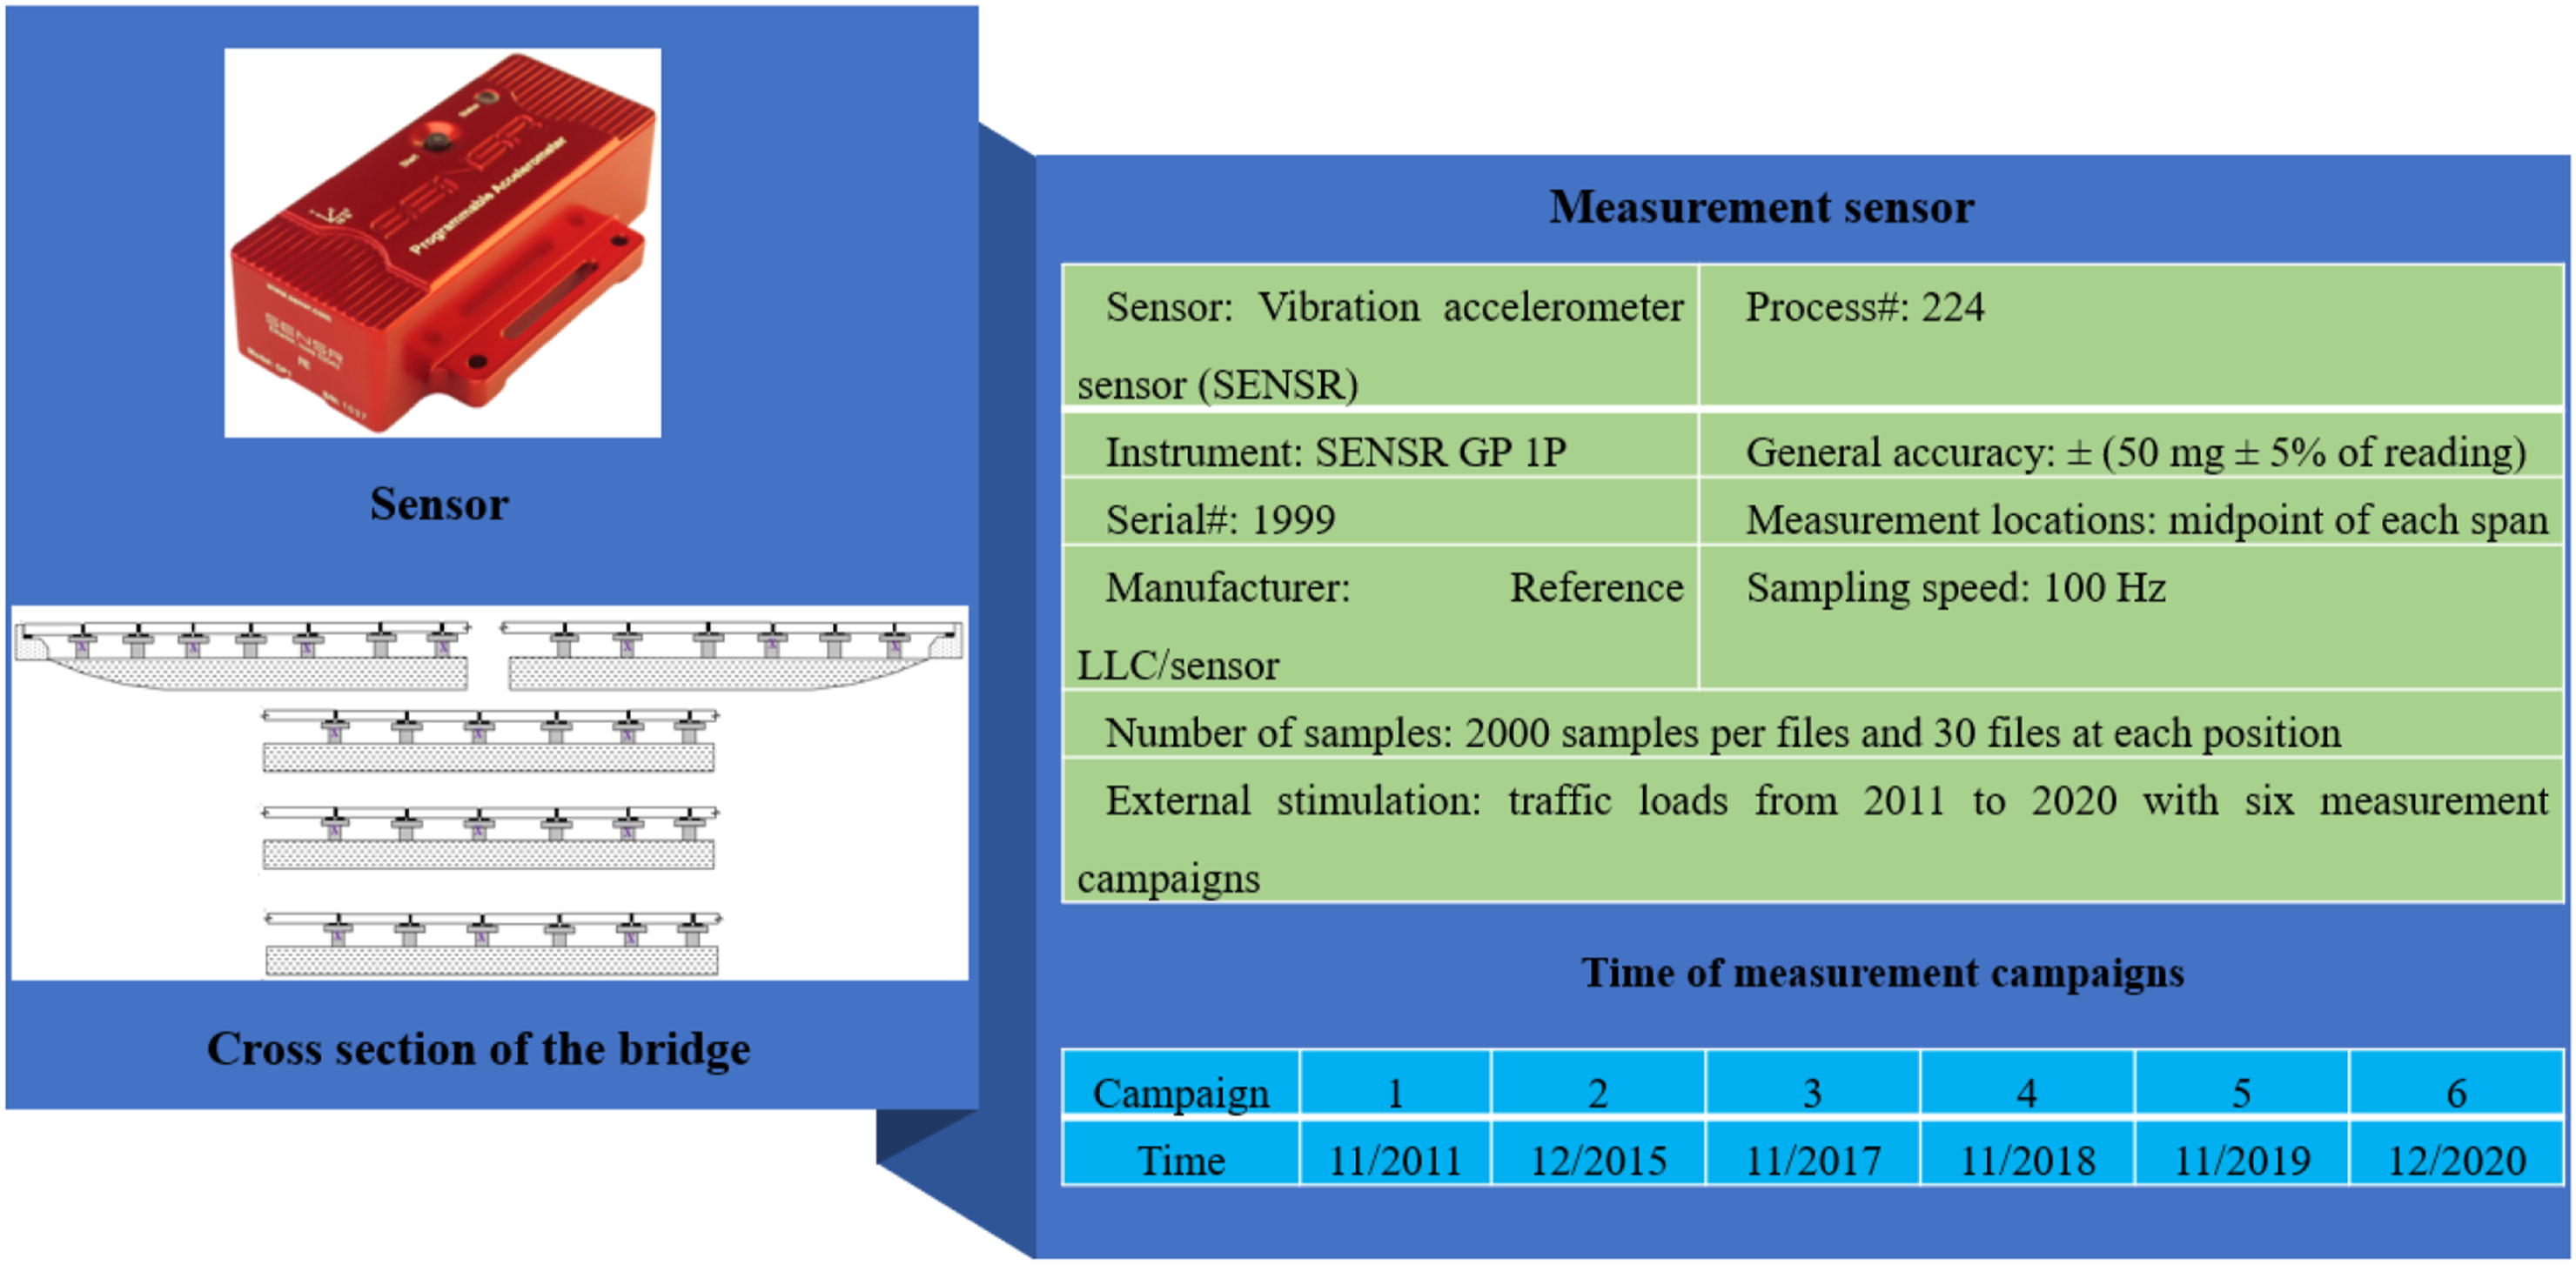
Although this study uses the Saigon Bridge as a case example, the methodology we present is based on universal signal processing principles, including Fourier analysis, PSD estimation, and spectral moment analysis. These techniques are widely applicable to any structure exhibiting vibrational behavior, irrespective of its design or material composition. Furthermore, the integration of CNN and MLP models enables flexible feature extraction that can be retrained for various bridges, making our approach adaptable across different infrastructure types. With appropriate data specific to each bridge, our method can be seamlessly applied to different structures, whether they are made of concrete, steel, or composite materials. Thus, the proposed method is scalable and suitable for broader applications in infrastructure monitoring beyond the Saigon Bridge, paving the way for future research and real-world implementation across diverse bridge systems.
While our study focuses on the Saigon Bridge as a case study, the proposed methodology leverages universal signal processing techniques—such as power spectral density analysis and spectral moment estimation—to assess structural health. The integration of a CNN-MLP framework not only enhances automatic feature extraction but also offers remarkable adaptability to different bridge types and infrastructure systems. By retraining the model with data specific to other bridges, this approach can effectively capture distinct vibrational signatures and detect structural anomalies across various configurations, whether they involve reinforced concrete, steel, or composite materials. This scalable framework thus paves the way for broad application in structural health monitoring, with further validation on diverse structures being a key focus for future research.
Results and discussion
Realistic vibration signal of the bridge span
Continuous measurement of the vibration signals on Saigon Bridge was performed, and the measurement signal is shown in Figures 18(a) and (b). Since there are multiple circulations with different loads and velocities on the bridge at the same time, the signal will create a set of variable values between the amplitude and the duration to obtain the signals. (a) The graphs of the acceleration vibration signal at first span in Saigon Bridge. (b) The graphs of the acceleration vibration signal at second span in Saigon Bridge.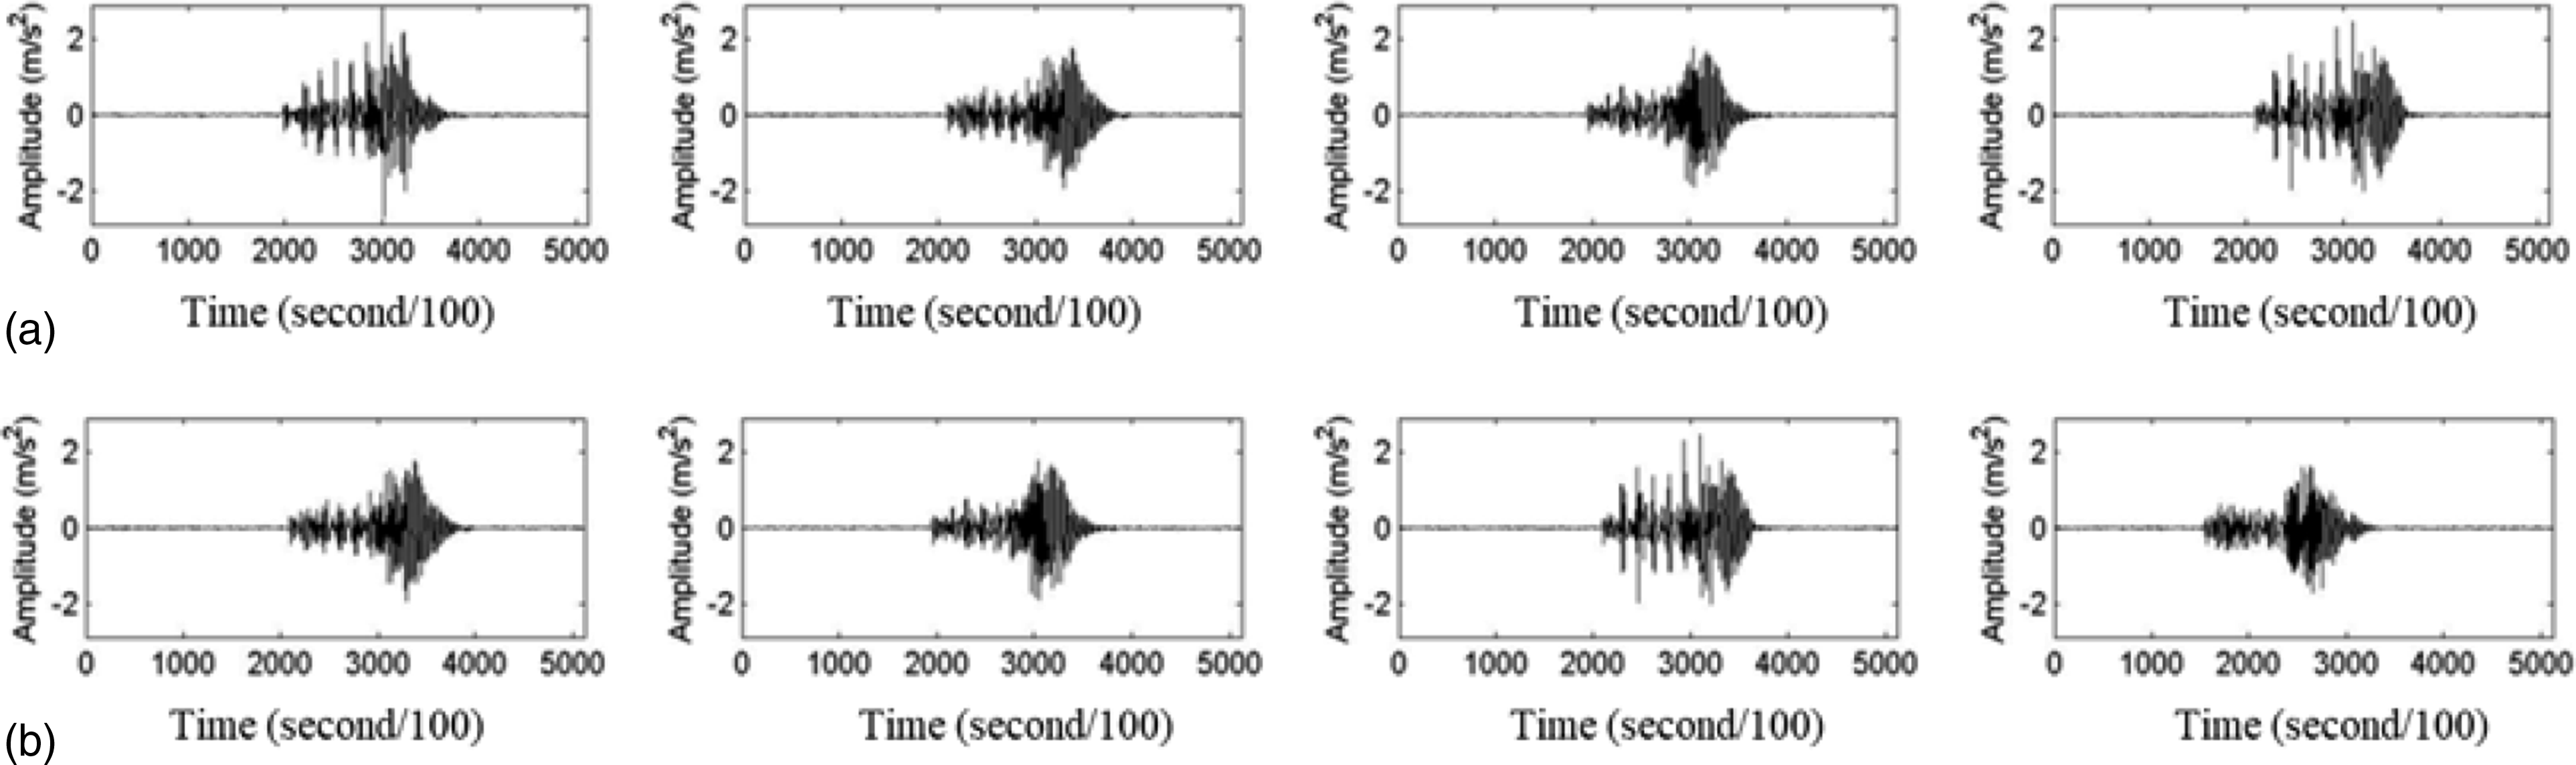
From each dataset of vibration signals on the bridge, we can build a power spectrum density based on Fourier analysis theory, as shown in Figure 19. Building power spectrum density from acceleration measurements.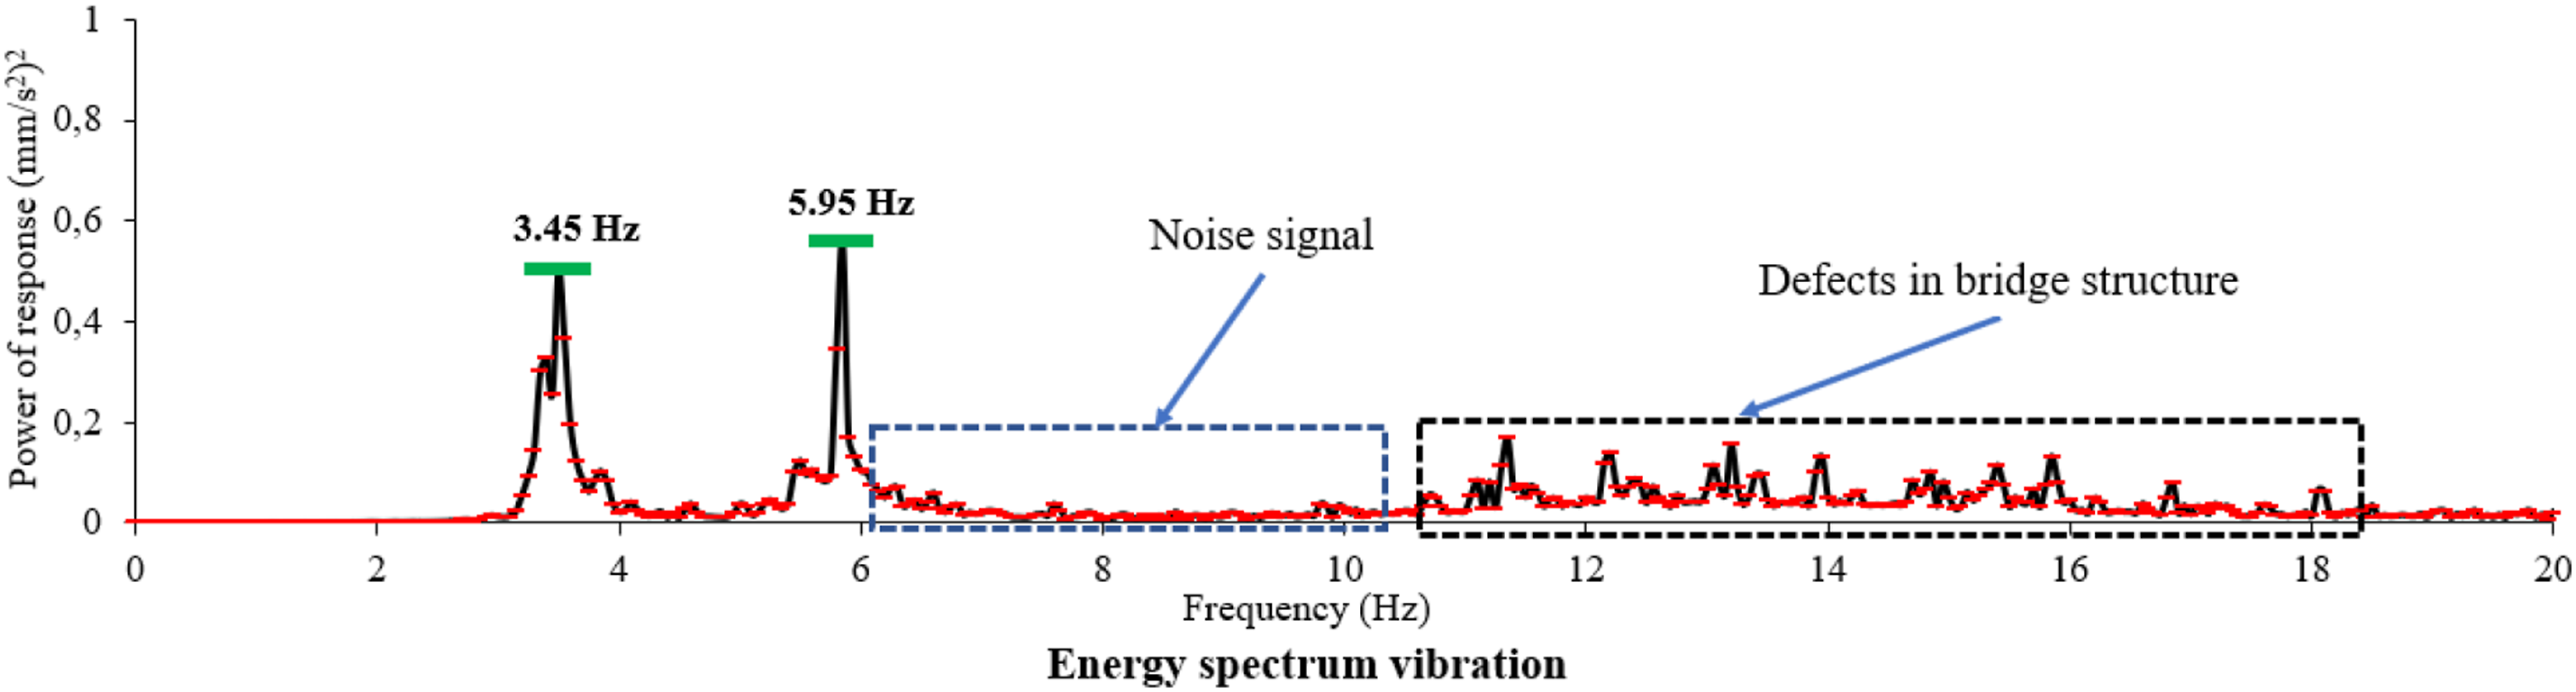
Through Fourier analysis, the vibration signal in Figure 19 can be transformed to become the power spectrum density as in Figure 20. The two peaks observed at 3.45 Hz and 5.95 Hz in Figure 19 represent the dominant vibration modes of the Saigon Bridge under specific dynamic loading conditions. The peak at 3.45 Hz corresponds to the global vibration mode, reflecting the overall structural response to external excitations such as traffic or environmental factors like wind. In contrast, the peak at 5.95 Hz is associated with a localized vibration mode, likely influenced by stiffness variations or material properties in specific spans, such as the reinforced concrete or steel-concrete composite sections. These peaks provide critical insights into the bridge’s dynamic behavior and serve as key indicators in structural health monitoring (SHM). Deviations in their frequencies or amplitudes over time could signify stiffness degradation, material fatigue, or other structural anomalies. The positioning of these peaks within the dashed-line boxes, labeled as “Noise signal” and “Defects in bridge structure,” highlights their relevance to detecting and distinguishing structural damage from external noise components. This observation underscores the importance of analyzing these frequencies to enhance the accuracy and reliability of damage detection methods. The power spectrum density by the vibration signal of one span in Saigon Bridge.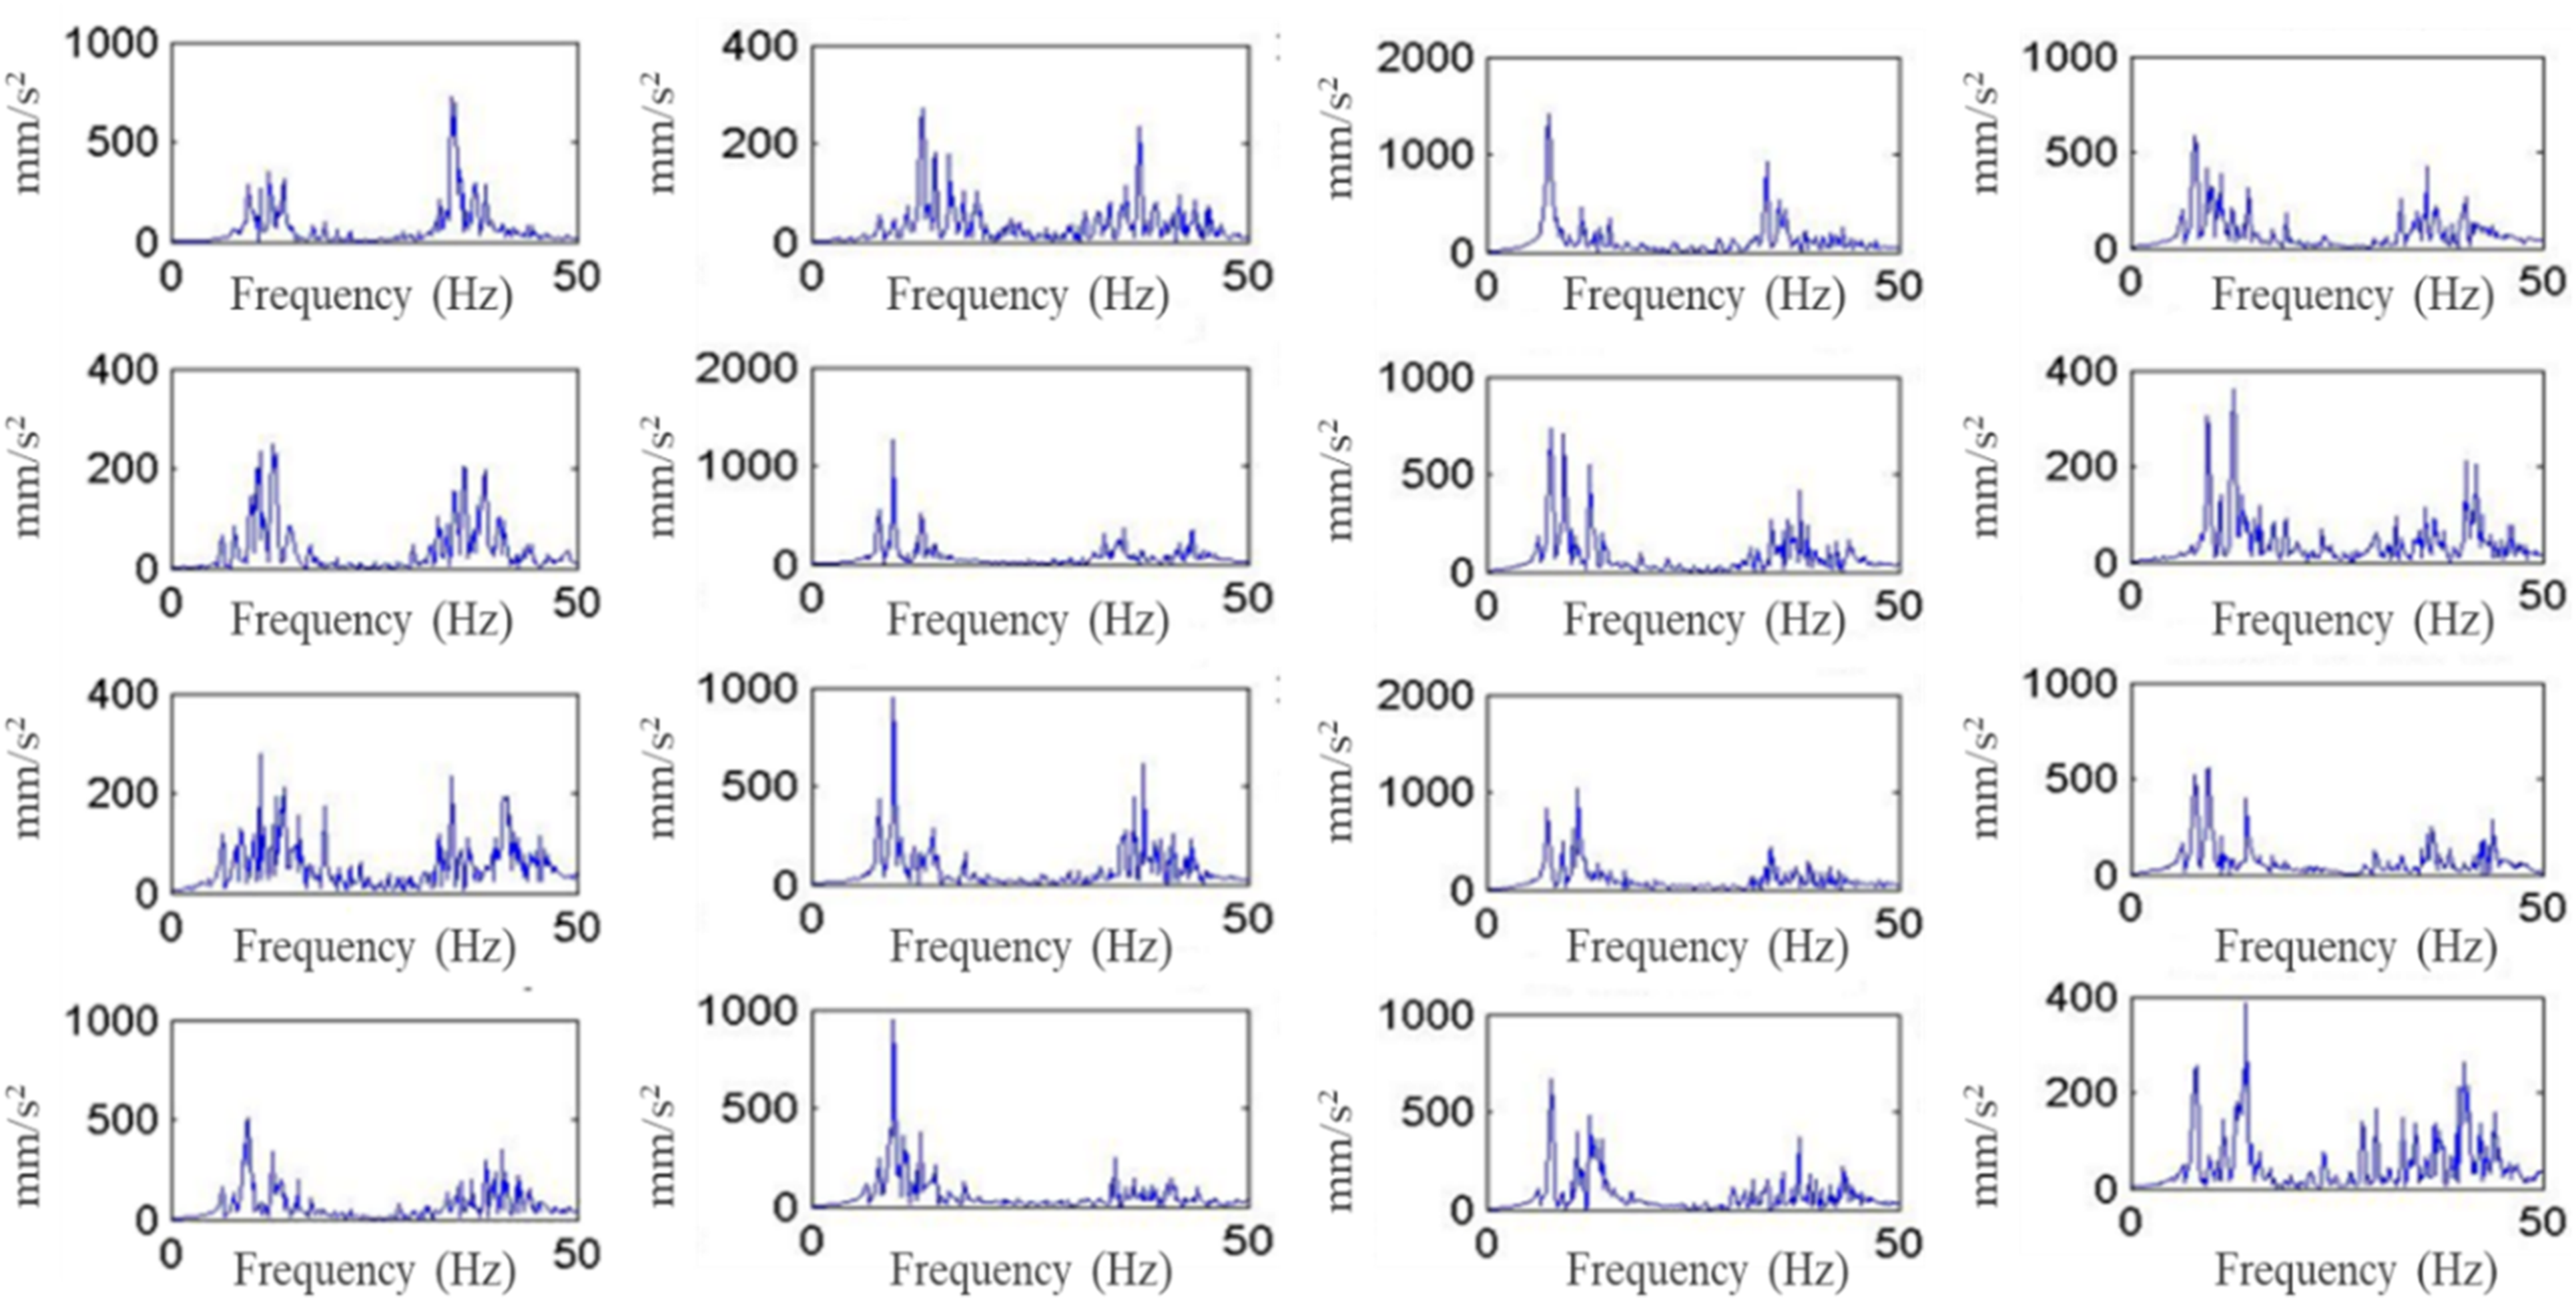
The noise signal labeled in Figure 19 is inherently included in the vibration signal and thus considered during the calculation of the power spectrum density (PSD) shown in Figure 20. Before applying Fourier analysis, preprocessing techniques such as bandpass filtering were employed to enhance the signal-to-noise ratio (SNR). This process isolates the frequency ranges relevant to structural vibrations while attenuating noise components that fall outside the targeted spectrum. In the PSD representation, the structural signals, such as the peaks at 3.45 Hz and 5.95 Hz, dominate due to their higher energy levels, whereas the noise components appear as smaller, less significant contributions, particularly in the higher frequency range. By addressing noise during preprocessing, the PSD focuses on meaningful structural responses while minimizing the influence of irrelevant noise, thereby providing a clearer representation of the bridge’s dynamic behavior.
In Figure 20, it can be seen that the change in traffic flow during the measurement period can result in relatively diverse changes in the power spectrum density of Saigon Bridge. We exhaustively characterized the change in PSD of Saigon Bridge over 10 consecutive years, and the manuscript depicts the change in PSD characteristics as follows: - There are 6 PSDs (approximately 20% of the total PSDs surveyed) where all harmonics only appear in one resonance region with a frequency value from 3 Hz to 6 Hz. Therefore, the manuscript only defines a single fundamental frequency, which is the harmonic frequency with the highest amplitude. This means that the PSDs’ shapes will be similar to the bridge’s vibrational freedom state. However, the graphs of the PSDs in Figure 15 clearly show that the frequency value in each PSD graph is not completely overlapped and there is a slight deviation (which is negligible). This can be explained by the impact of interference signals and errors in the measurement or data processing. - There are 10 PSDs (approximately 37% of the total survey PSDs) in which all harmonics are mainly focused on two resonance regions, from 3 Hz to 6 Hz and from 10 Hz to 12 Hz. This means that not only the fundamental frequency (which represents approximately 20% of the total survey PSDs and ranges from 3 Hz to 6 Hz) of the vibration freedom on the span is important but also other frequencies in the resonance region between 10 Hz and 12 Hz. - There are 14 PSDs (approximately 43% of the total PSDs in the survey) where the PSDs share harmonics ranging from 2 Hz to 24 Hz.
The clustering of fundamental frequencies observed in the analysis is attributed to the interaction of structural components with varying stiffness and material properties. For instance, frequencies in the range of 3–6 Hz correspond to the global response of the bridge under traffic-induced vibrations, while the 10–12 Hz range reflects localized behavior in specific spans influenced by structural details such as beam stiffness and deck thickness. Our analysis indicates that the lower frequency range (approximately 3–6 Hz) is predominantly associated with global bending modes, while higher frequency components (around 10–12 Hz) correspond to localized torsional and transverse deck modes. These clusters provide physical insight into the dynamic response of the bridge, highlighting areas where stiffness variations may signal potential damage or material degradation.
The conclusions drawn from the study indicate that the lowest resonance region consistently appears in all real PSDs, despite having a lower frequency value compared to other regions. It can be inferred that this frequency value is more stable than the higher frequency value regions. The results of the first survey on the Saigon Bridge show that the fundamental frequency, located at the highest amplitude of the harmonic frequency in the PSD, is always surrounded by resonance regions. The differences between the real fundamental frequency value and the PSD’s fundamental frequency value may be due to interference, measurement errors, or data processing. The PSDs of the Saigon Bridge with prestressed concrete material were surveyed at 6 different measurement times over 5 years, and the results are shown in Figure 21. The PSDs show three resonance regions with significant amplitude: the first region from 0 Hz to 8 Hz, the second from 8 Hz to 14 Hz, and the third between 14 Hz and 24 Hz. Another span with steel-concrete composite structure was surveyed on the Saigon Bridge, as shown in Figure 22, and it displays mainly two resonance regions with a significant amplitude: the first region from 0 Hz to 8 Hz and the second from 8 Hz to 18 Hz. The PSD of prestressed concrete span on Saigon Bridge through 6 different times. The PSD of steel-concrete composite span on Saigon Bridge through 6 different times.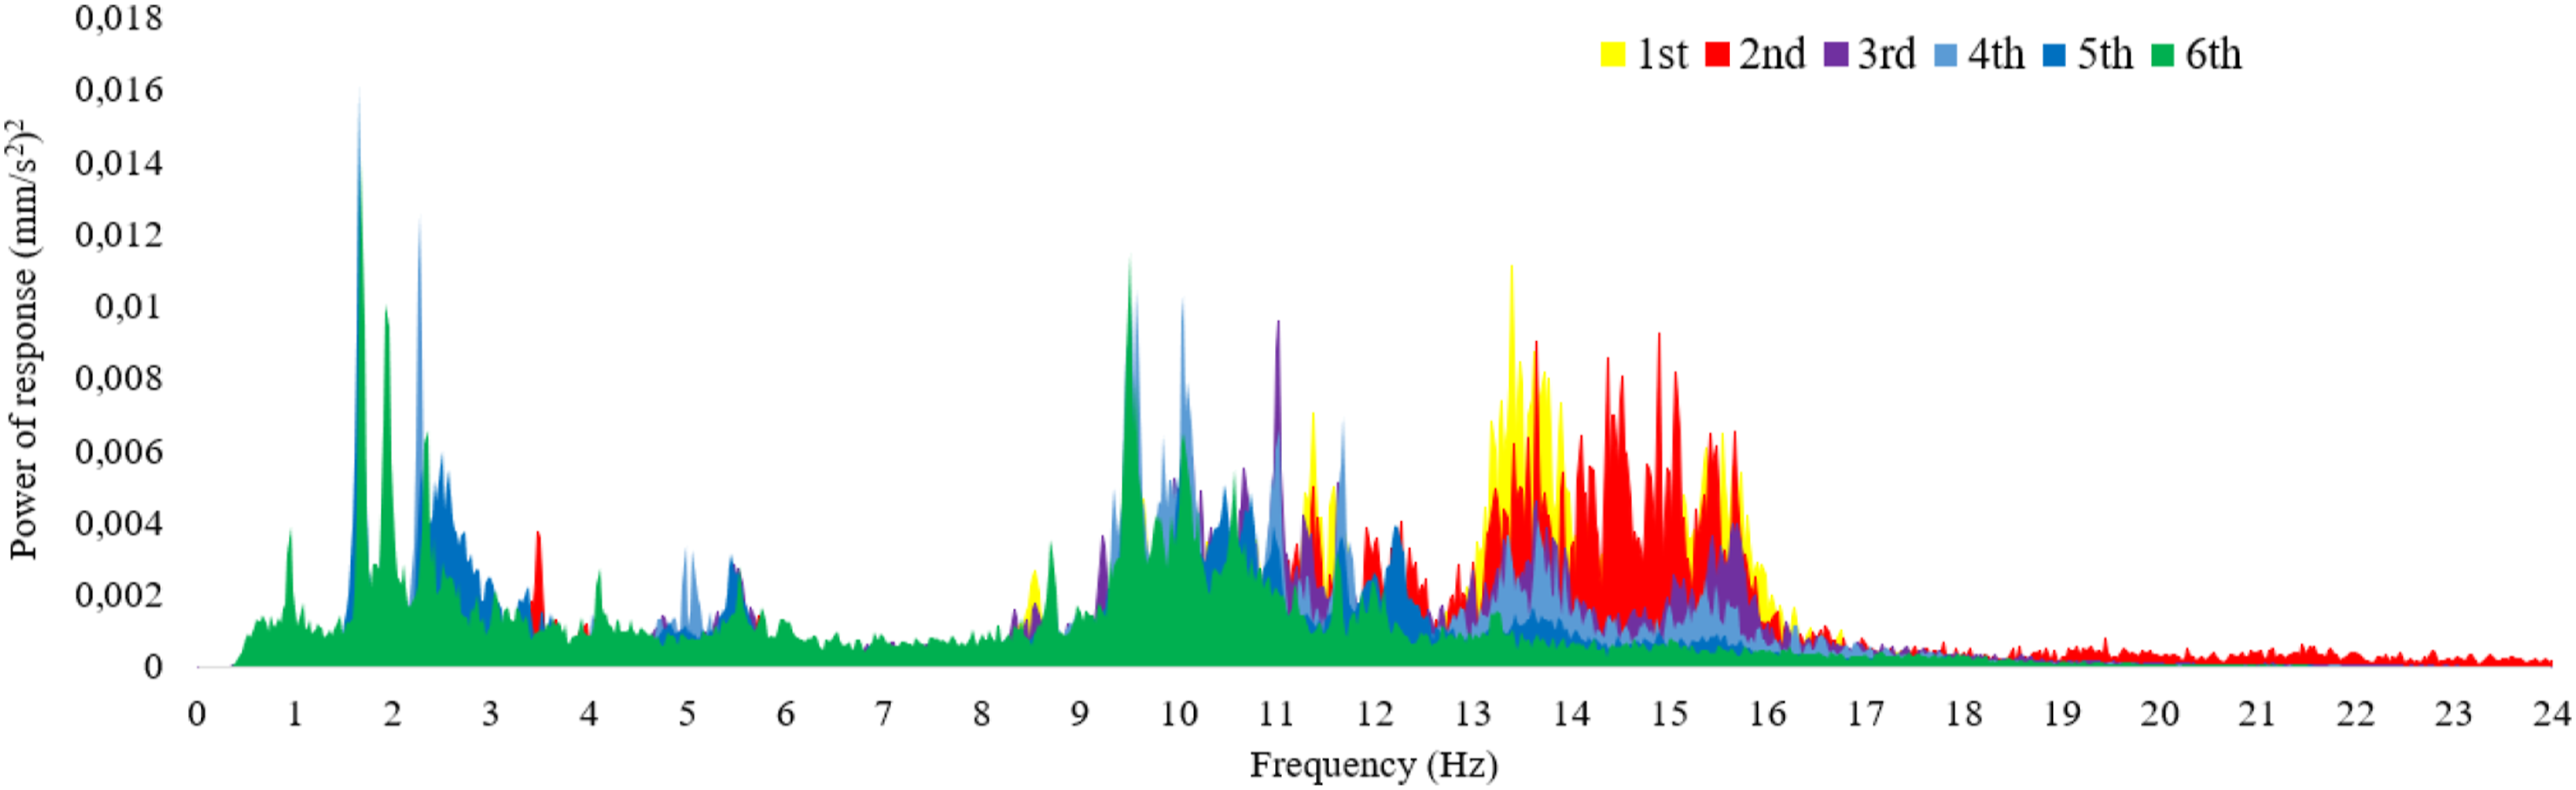
During the amplitude survey of the PSD shown in Figures 21 and 22, it can be observed that the highest amplitude is always in the first resonance region, and the lowest amplitude is in the third resonance region. Over time, the amplitude of the third resonance region dramatically decreases from the first measurement time to the third time for the PSD of the prestressed concrete material, or from the first time to the fifth time for the PSD of the structural steel material span on Saigon Bridge. The second resonance region also shows a significant decrease in amplitude and area. Finally, after six different measurement times over 5 years, the area of the third resonance region disappeared completely. Comparing the different measurements, it is clear that the first time has the significant amplitude in all three resonance regions, and then the amplitude and area of the third resonance region decrease from the second time to the fourth time. The amplitude and area of the fifth and last time are almost only in the first and second resonance regions (the low-frequency regions), so the PSD share of the span changes over operating time.
Signal spectrum characteristics of actual bridges: A case study of the Saigon Bridge in Vietnam
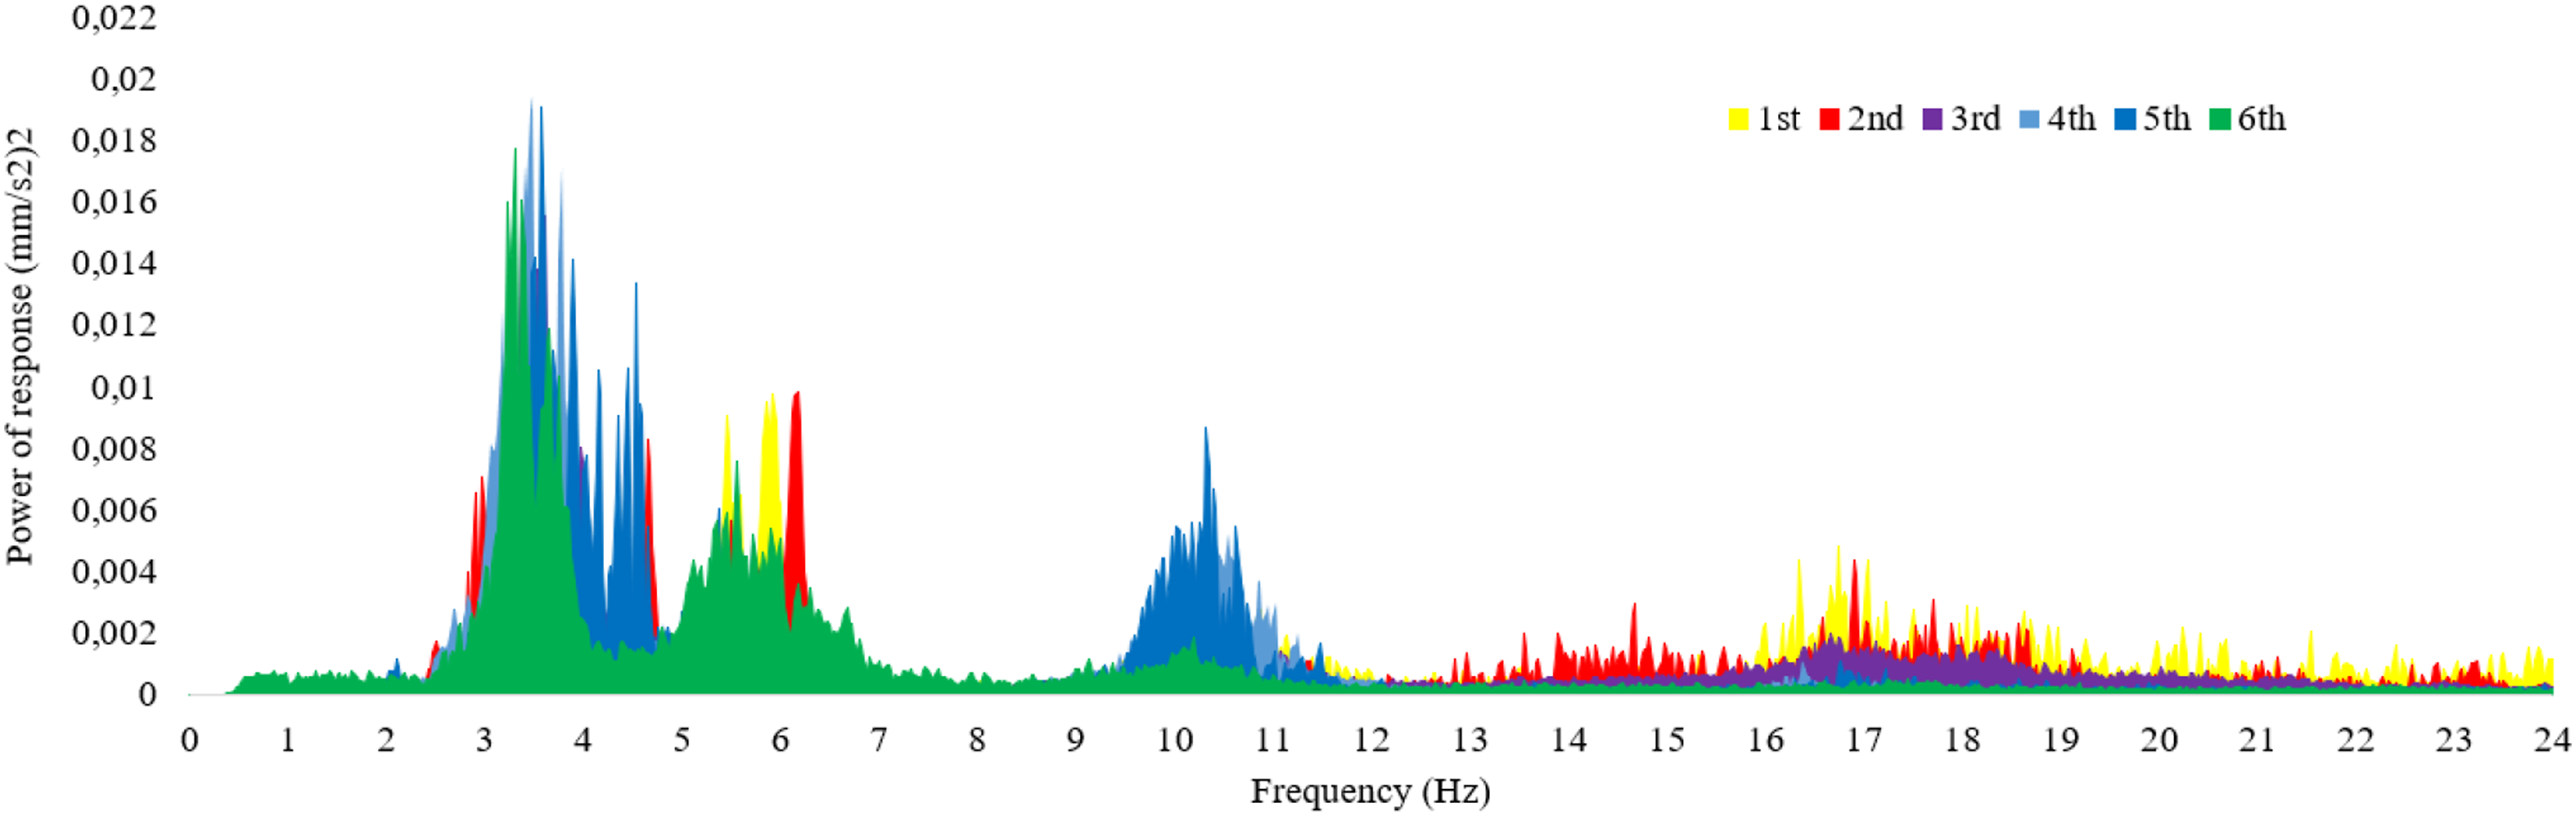
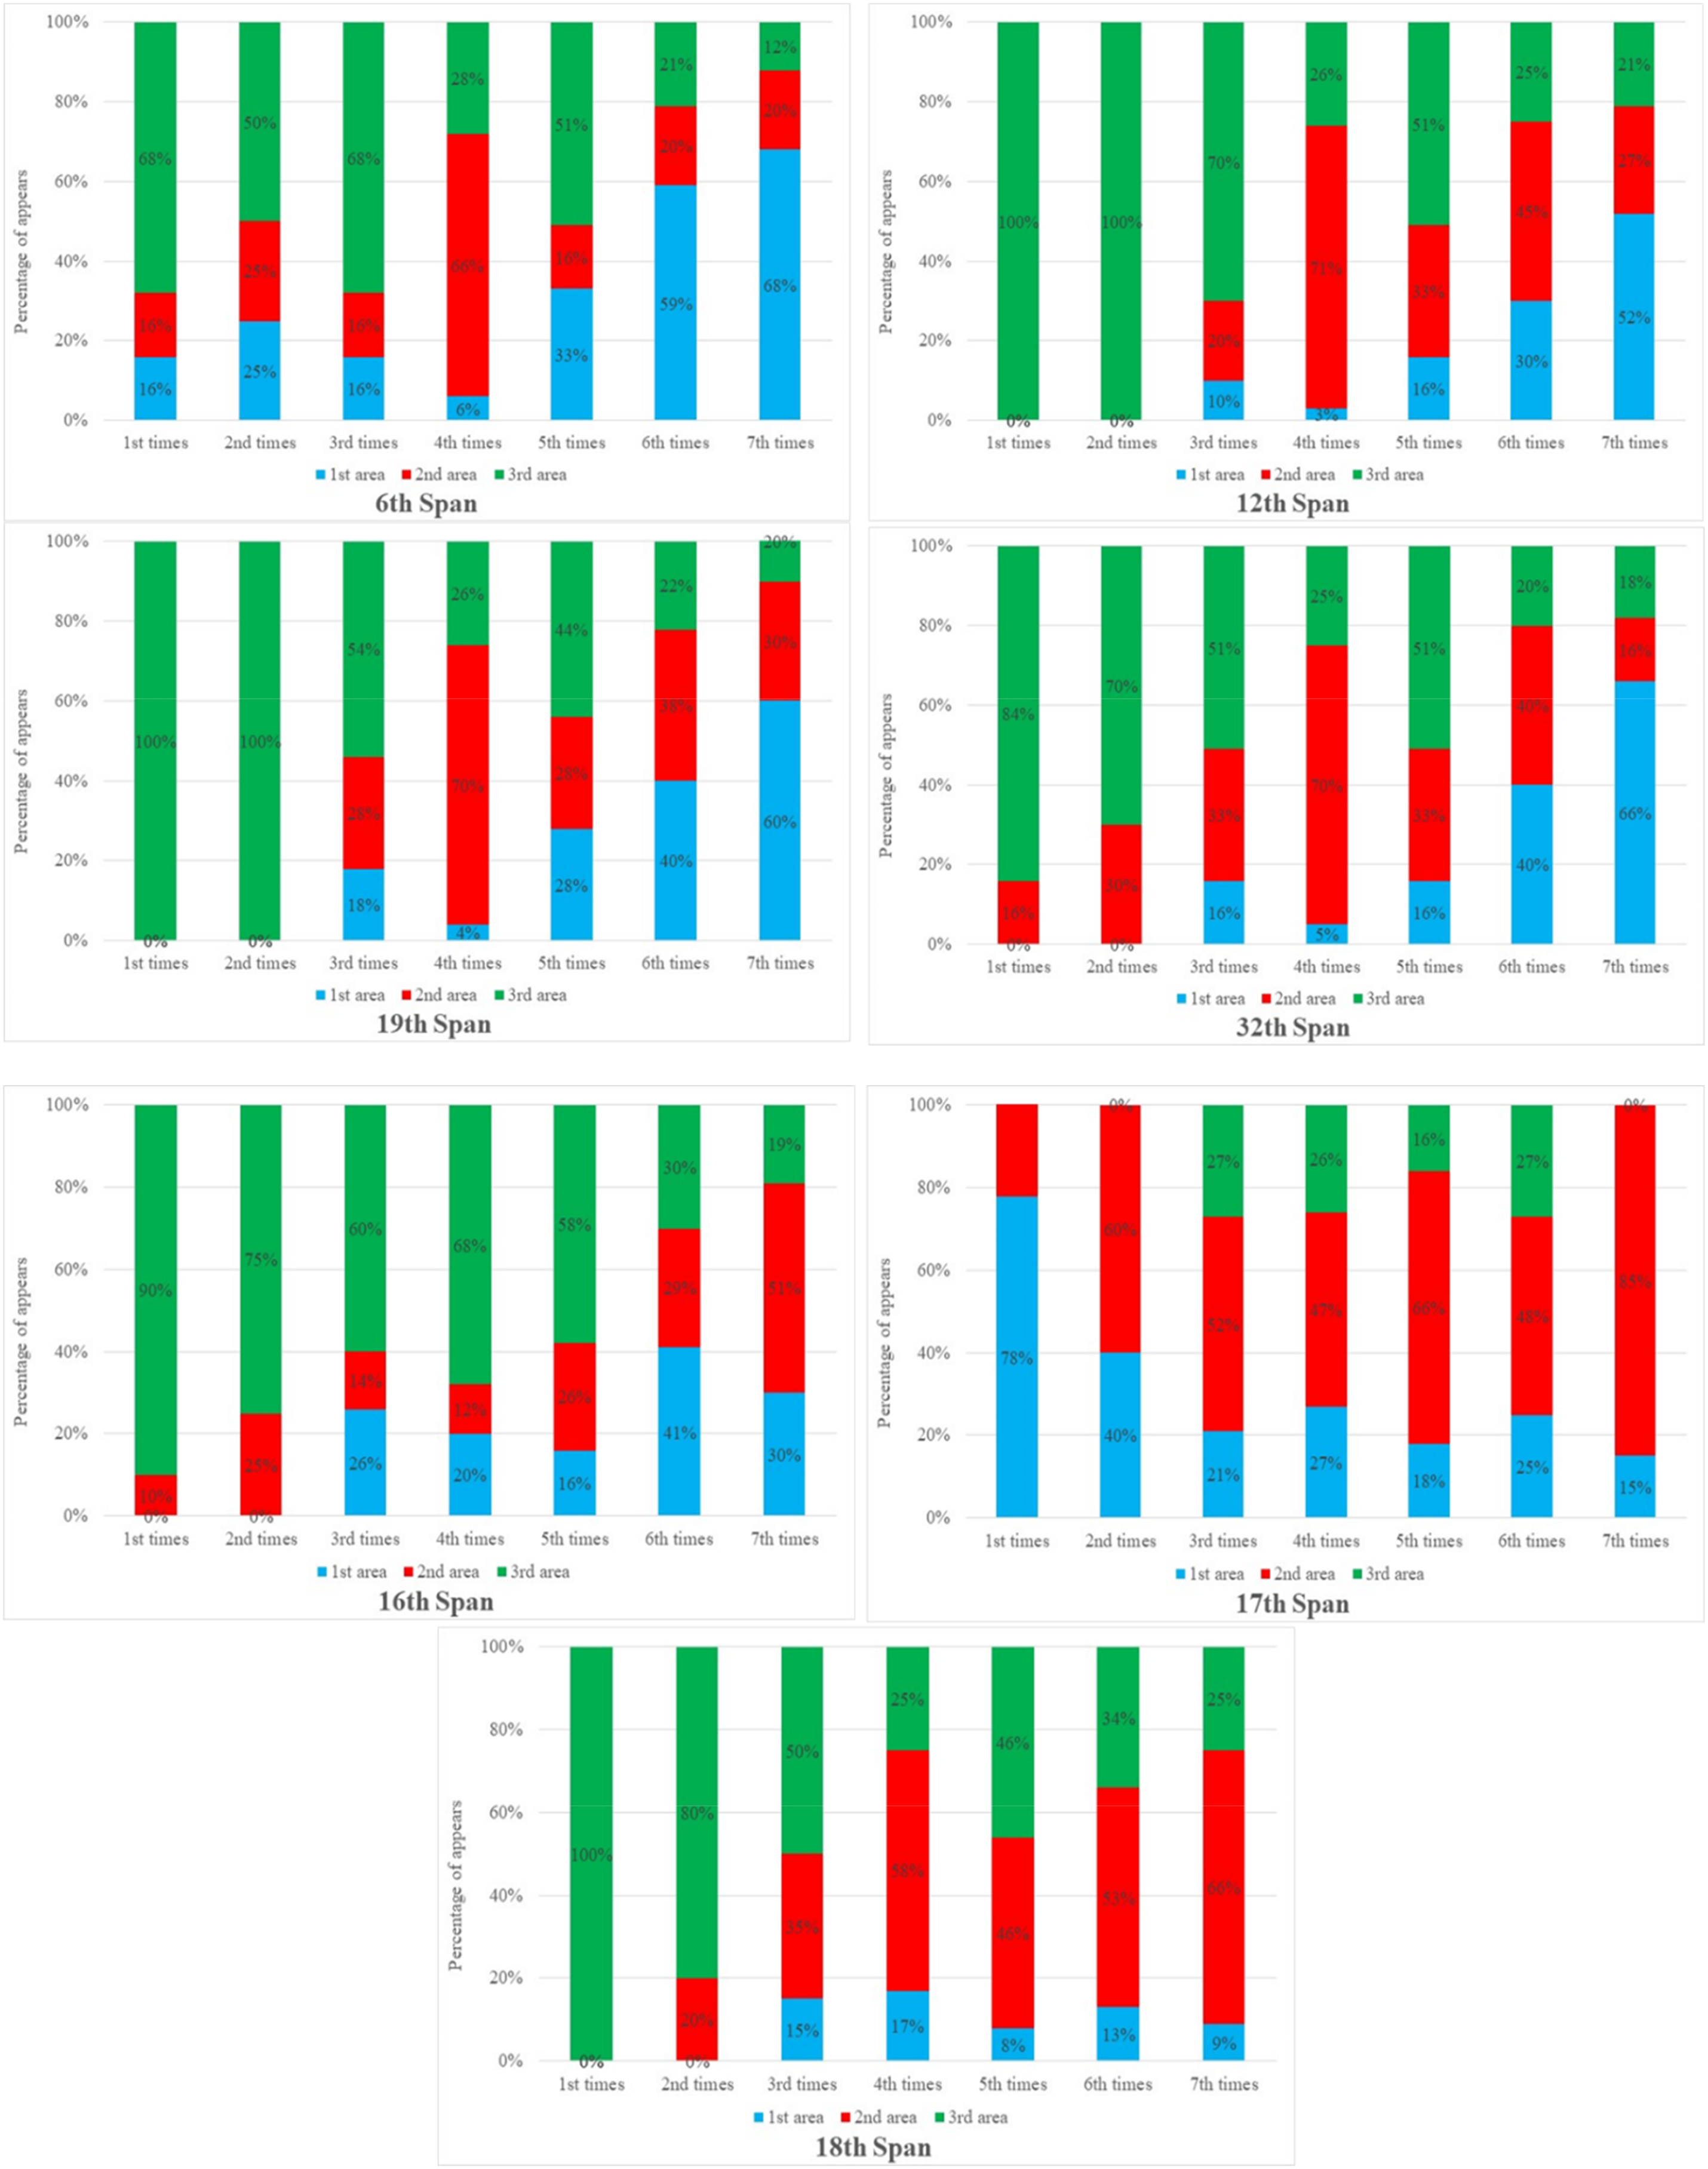
In the PSD graphs, multiple resonance regions coexisted at the same measurement times. A vibration graph was generated for each measurement time, and Fourier analysis showed that some PSDs contained only one resonance region, while others included two or three resonance regions. Figures 23 and 24 demonstrate that the percentage of PSDs with different structural materials (concrete span and steel span) on the Saigon Bridge varied significantly across the different measurement times. However, after more than 5 years of health monitoring, the PSD data with two or three resonance regions exhibited a significant downward trend, while the total PSDs with only one resonance region experienced a dramatic upward trend. Therefore, over time, the probability that PSDs will contain resonance regions at high frequencies will decrease, and they will be replaced by those with only one resonance region, even though the traffic load remains the same in the time measurement. - The probability of PSDs with three resonance regions appearing significantly decreased over the given period. According to mechanical theory, a bridge’s span weakens in bearing capacity under the same source traffic load and throughout its operating time, causing a decrease in high-level harmonic amplitude. Additionally, the vibration power of the source traffic load shifts from high-resonance regions to low-resonance ones. Figures 22 and 23 compare the span and concrete span of the Saigon Bridge, showing that the probability of appearance of the highest-resonance region of the concrete span structure changed more rapidly than that of the steel span in the same period. This finding aligns with the structure material properties, as the destruction time of steel material is longer than that of concrete. This paper offers a novel contribution by proposing a method to evaluate the bearing capacity and monitor the status of a bridge’s span during operation. - To represent the changes in the shape of the resonance regions, the study provides specific information on the area values of the resonance regions in the surveyed PSD data signal of the bridge’s span. The area values of the resonance regions in the PSD were calculated using frequency ranges with a width of 2 Hz to understand the changes in the area of each region. In terms of mechanics, the area value of a resonance region represents the total vibration energy of the harmonics in the frequency range. By dividing the frequency ranges into 2 Hz intervals, Figures 13–14 depict the changes in the area of the resonance regions in some spans of the Saigon Bridge. Percentage of total PSD with the same resonance region on concrete and steel span. The proposed model.
Changes of bridge structure through the spectral moment model based on deep learning
In the frequency spectrum of the combined vibration of a bridge deck with many parameters related to the structural change process, studies have identified the natural frequencies most susceptible to resonance in the vibration of the bridge deck under random traffic conditions, as demonstrated in sections 4.1 and 4.2. Clearly, this phenomenon depends heavily on traffic flow, and the influence of external conditions means that the frequency values of the resonance modes change unstably between different measurement periods in a short time. In addition, a certain amount of noise signals coexist with the raw signals that lack necessary information. This shows that the eigenfrequency values and the resonance frequency band are insensitive to the structural condition. These characteristics are only suitable for monitoring the condition of bridges that have been significantly weakened. In the vibration spectrum of the bridge deck, many resonance bands always appear. Mathematically, the total number of dominant frequency bands appearing in the vibration spectrum is a random variable with no rules. But from a mechanical perspective, for the same traffic load, as the bridge deteriorates over time, the ability to perform higher-order vibrations will decrease, or in other words, the amplitude of higher-order resonances will decrease. Therefore, this study proposes using the moment model of the spectrum as an evaluation parameter for the structural changes over time, as shown in Figure 24. Through the combined model of CNN and MLP, the study aims to determine the changes in the SSM value under random and practical traffic conditions.
The study aimed to determine changes in the SM value under different traffic conditions, as shown in Figures 16 and 17, by using a combined model of CNN and MLP. SM was calculated using the vertical axis (ω = 0 – symmetrical axis of frequency) of the vibration spectrum graph and the resonance region acreage, as shown in Figures 25 and 26. We surveyed the magnitude of SM of some spans of Saigon Bridge in each frequency range of about 2 Hz to represent changes in the shape of the vibration spectrum. In terms of mechanics, the SM value represents the transmission of vibration energy that becomes fast or slow for harmonics in the resonance region survey. The SM of prestressed concrete material span on Saigon Bridge through 6 different times. The SM of structural steel material span on Saigon Bridge through 6 different times.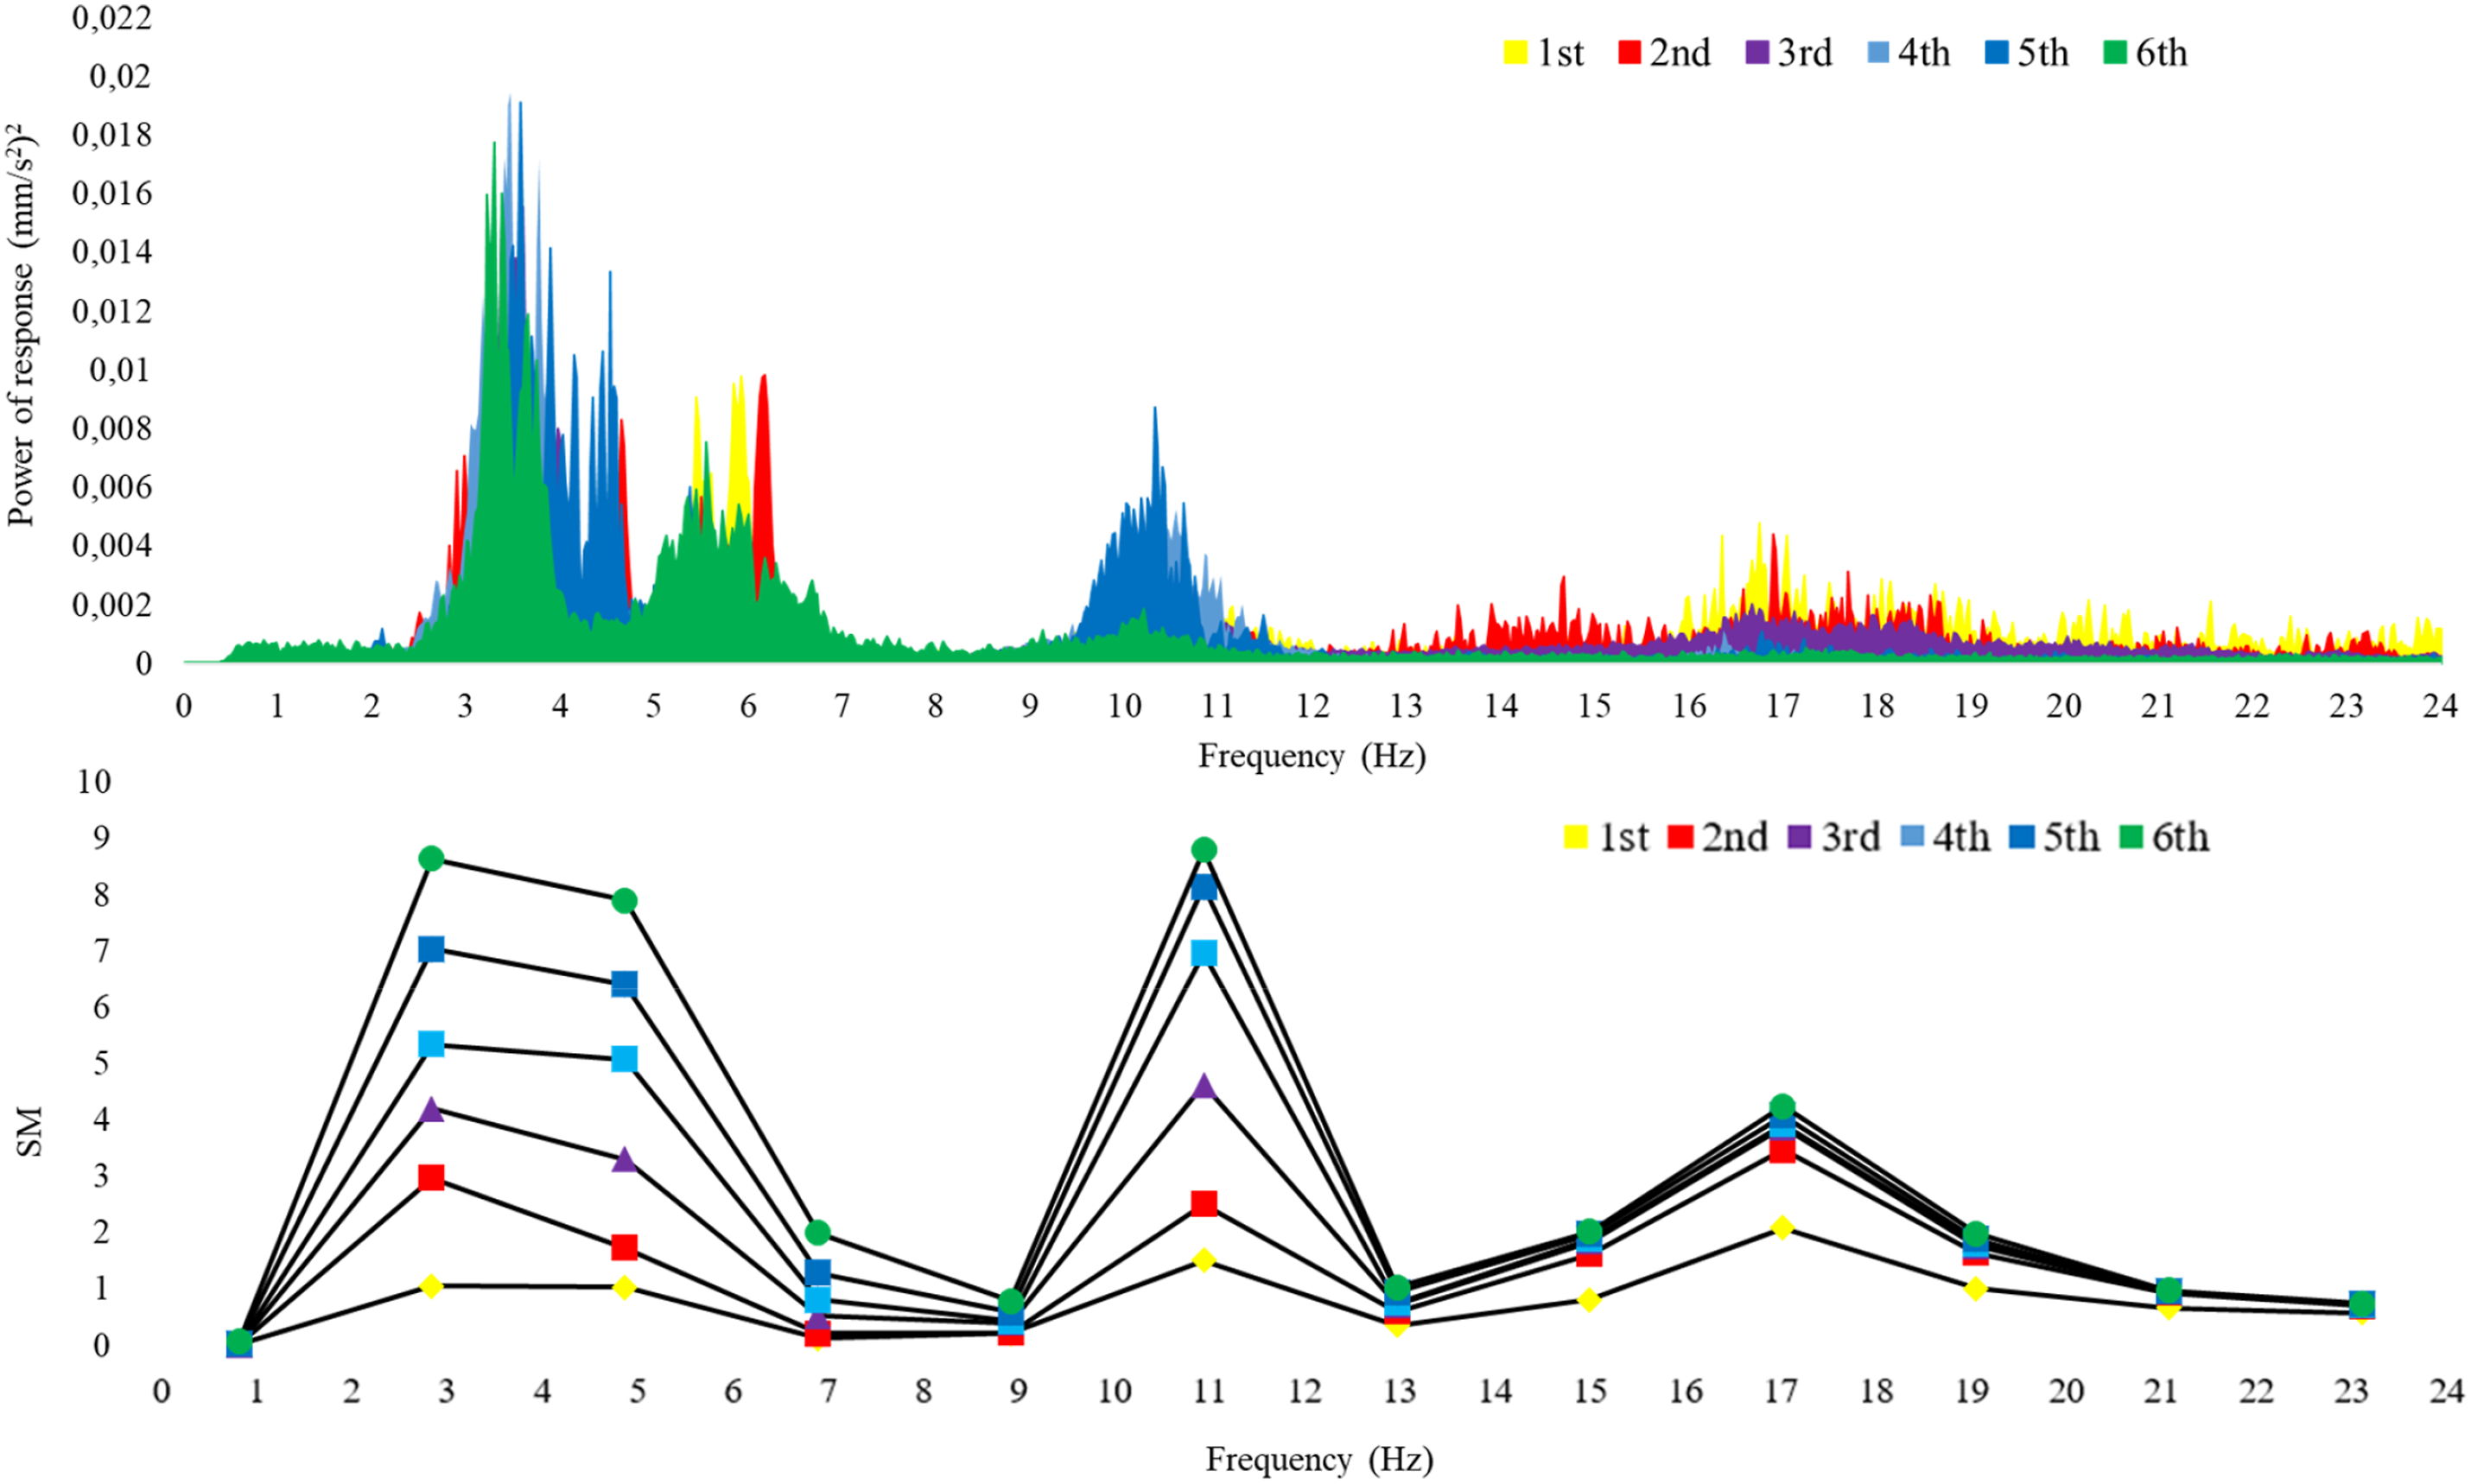
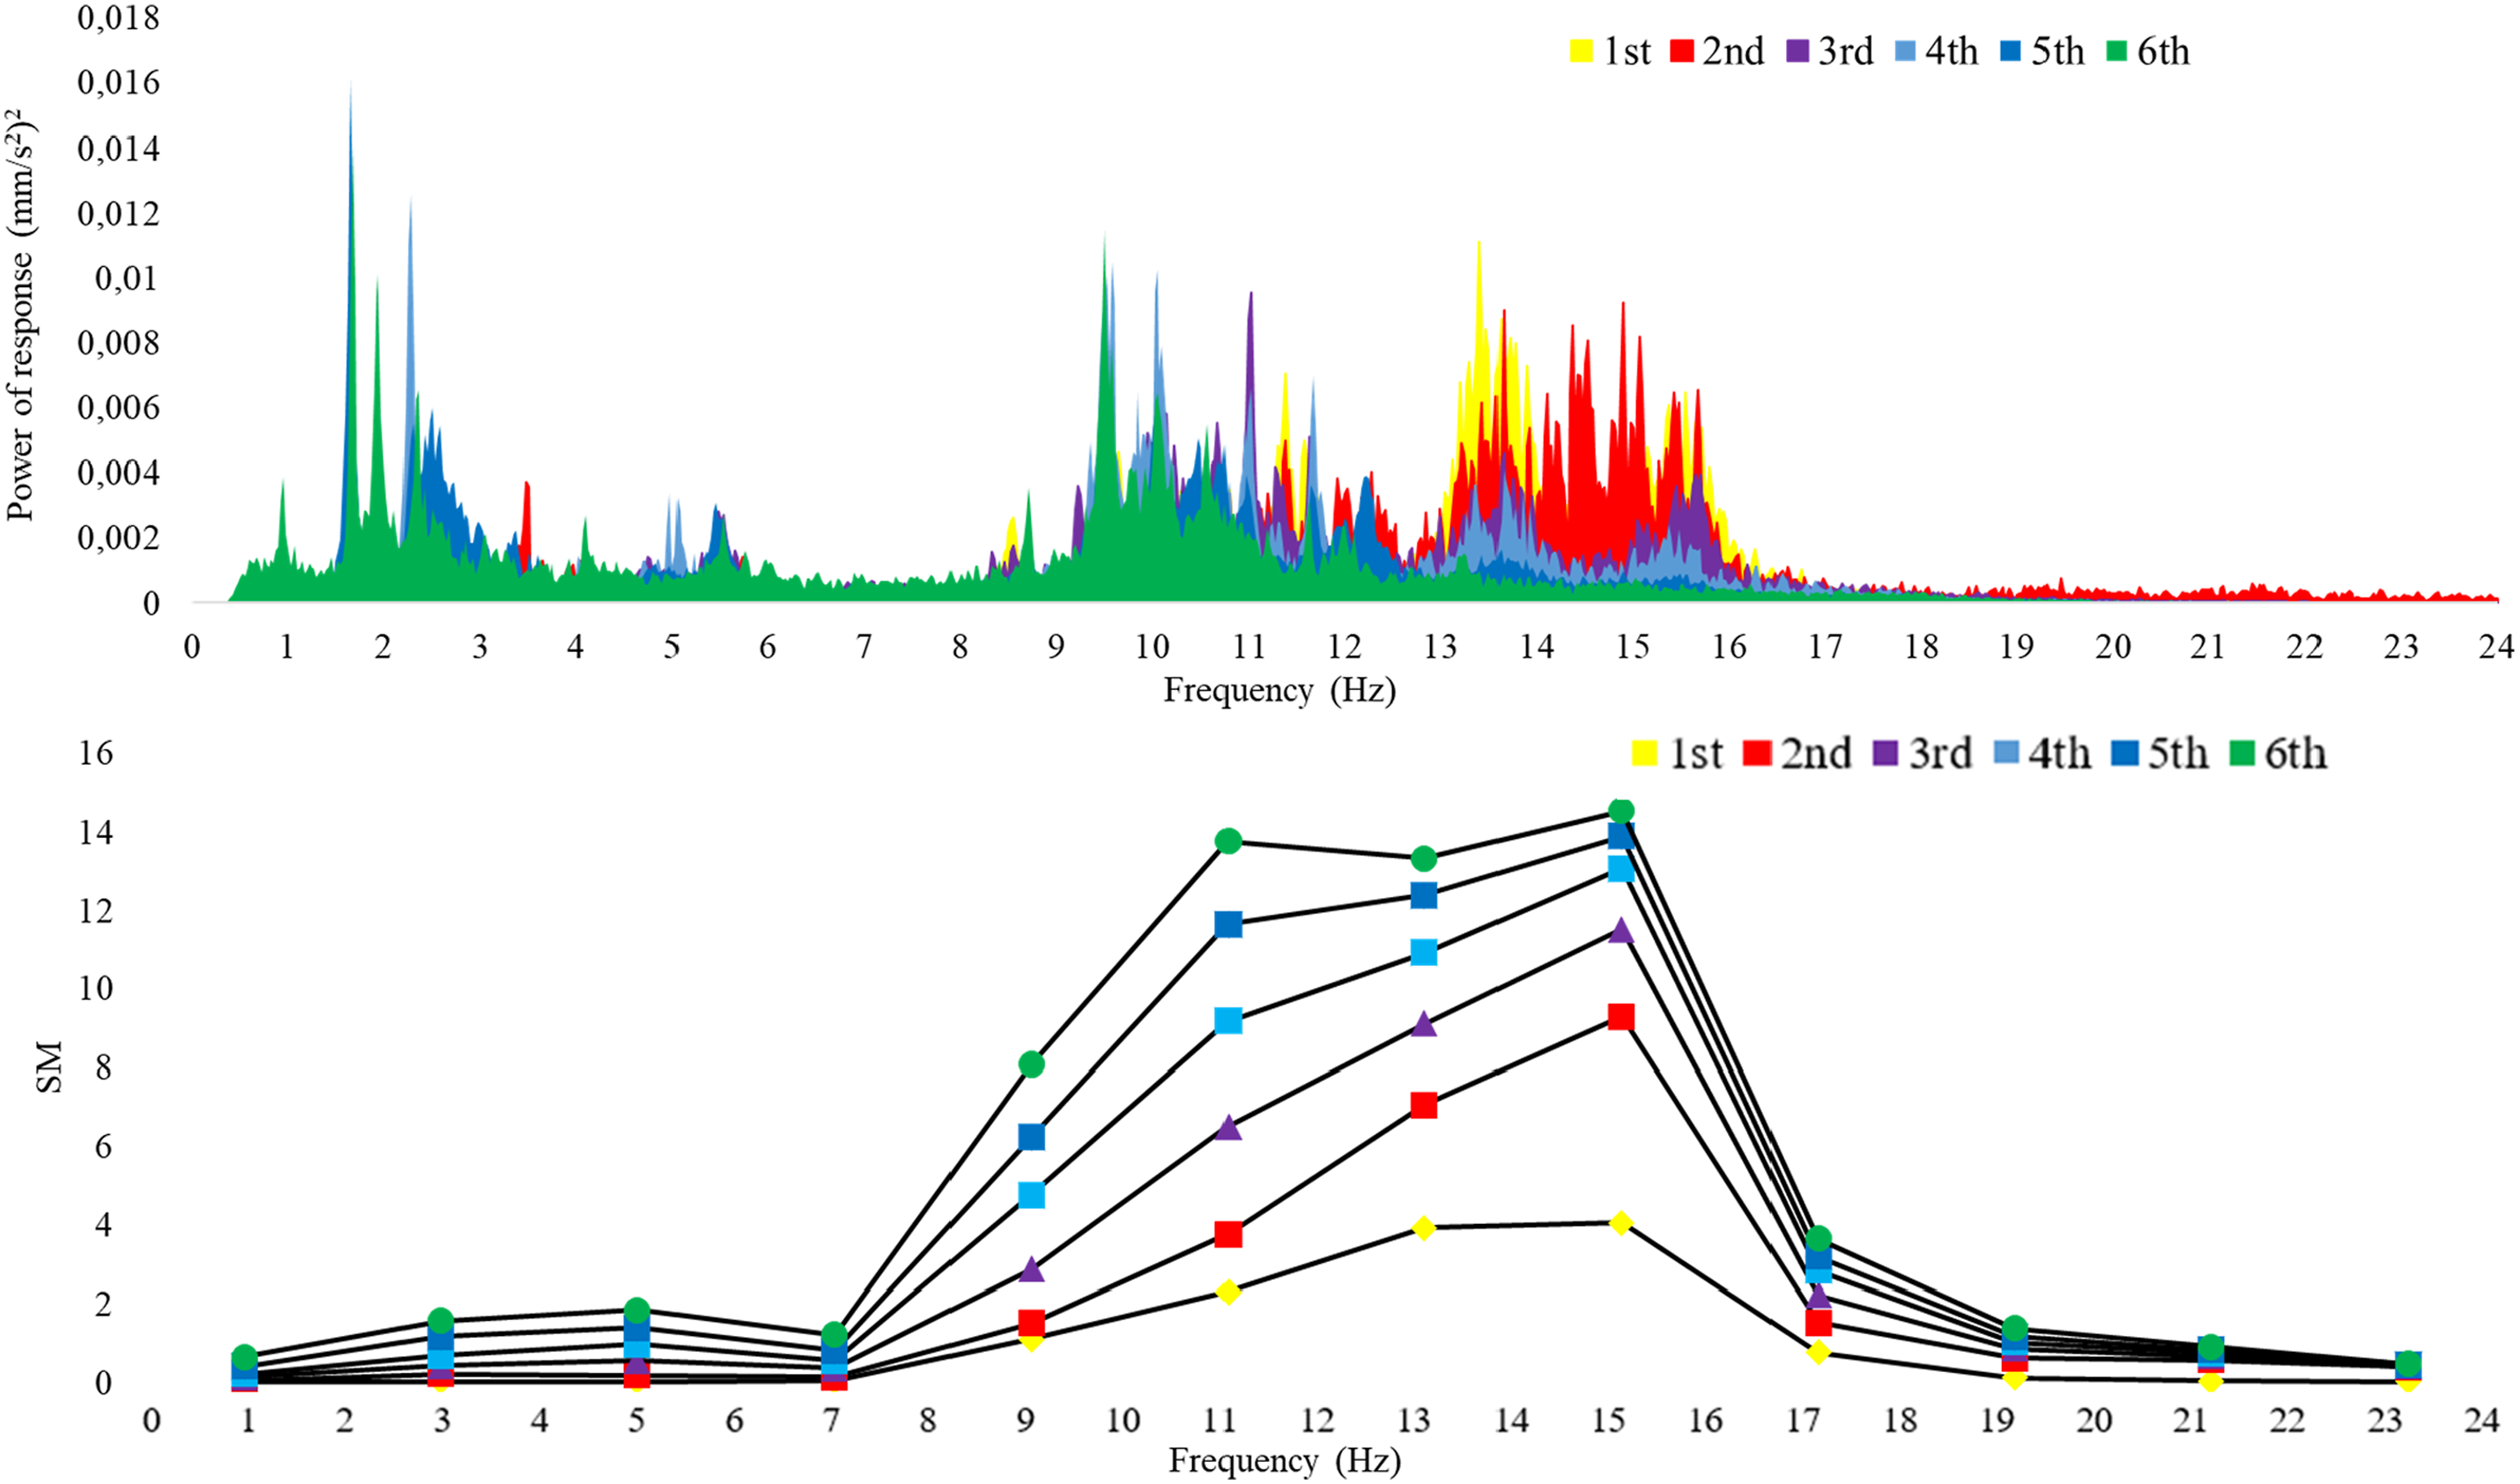
It can be observed that the SM graphs have a similar shape to the PSD graph in all three resonance regions. However, the change in SM over the given period is significantly more pronounced than the change in the PSD value. Specifically: - The SM value of the first resonance region showed an increasing trend, while the third resonance region exhibited a decreasing trend during the bridge’s operational period. - The SM value of the second resonance region did not show any significant change over the timescale of the measurements. However, in the last of the three measurement times, the SM value of the second resonance region showed a marked reduction. - The SM value in the first and third resonance regions was significantly correlated, making it easy to use this value to monitor degradation. Moreover, using the SM value would be more effective than using the PSD value, as it can clearly indicate the transmission of vibration energy from the high frequency region to the low frequency region.
Although the SM values for each dominant region allow monitoring of the changing shape of the spectrum over the bridge’s degradation time, this value only allows for evaluating the degradation of each vibration mode. This means that each region corresponds to adjacent vibration modes, rather than allowing for an overall evaluation of the structure. Through a combined CNN and MLP model, this study proposes a new parameter that can be used to assess the overall stiffness changes of each bridge span under real working conditions.
The spectral moment analysis in this study places higher weight on higher frequencies, a deliberate approach to enhance the sensitivity of the method to localized damage. Higher frequencies are particularly informative in structural health monitoring as they are strongly influenced by local stiffness variations, joint conditions, and material degradation, which may not significantly impact lower frequencies associated with global structural behavior. By emphasizing these frequencies, the method facilitates early detection of subtle damage mechanisms, such as cracking or fatigue that are critical to maintaining structural integrity. While the analysis prioritizes higher frequencies, it is complemented by the evaluation of lower frequencies (e.g., 3–6 Hz), which capture the global dynamic response of the bridge. This balanced approach ensures a comprehensive assessment of both local and global behaviors, enabling accurate and actionable insights into the bridge’s structural health.
The spectral moment analysis used in this study provides a direct correlation between frequency shifts and structural stiffness degradation. A decrease in spectral moment values corresponds to a reduction in stiffness, indicating possible damage in the spans. For example, reinforced concrete spans showing a significant decrease in spectral moment may have experienced cracking or rebar corrosion. Similarly, the steel-concrete composite spans, which are more sensitive to environmental conditions, demonstrate frequency shifts reflecting changes in joint behavior or material fatigue. This connection between computational metrics and physical phenomena enables a deeper understanding of bridge health.
While the Saigon Bridge provides a unique case study due to the availability of long-term experimental observations, the proposed method is designed to be generalizable and applicable to other bridges. The methodology leverages vibration signal analysis and spectral moment computations, which are widely used in structural health monitoring and adaptable to various bridge types with differing materials, spans, and structural configurations. The integration of AI techniques, such as CNN and MLP, enhances the ability to process complex datasets, detect subtle patterns, and automate feature extraction, making the approach scalable for broader applications. Although datasets like the one used in this study are currently rare, advances in sensor technology and monitoring systems are making it increasingly feasible to collect similar data for other structures. Future studies will focus on applying this method to additional bridges, further demonstrating its versatility and effectiveness in diverse monitoring contexts.
With spans 6th, 12th, and 19th, and 32th made from similar structural materials, Figure 27 shows that the CF_SM functions are more sensitive in indicating the difference between measurement times than the PSD value or PSD graph. The CF_SM graph indicates that the cumulative rule of the spans is similar, meaning that it is a general parameter to monitor the degradation of the bridge. The CF_SM function of the before measurement times is always located below the after measurement times, indicating degradation of both concrete and steel spans. Evidence shows that the CF_SM function is a general parameter to monitor the degradation of the bridge. During the first four measurement times, the CF_SM function graph changes less than the last two times of measurement, around over 1 year per measurement time. Therefore, CF_SM is sensitive to the operation time as the bearing capacity of the span depends on the operating time. The inclination curve of the cumulative function will express the SM magnitude value and the characteristic of mechanical behavior of the bridge’s span. Areas with a high inclination of cumulative function indicate that the SM has a high value. Figure 27 shows three regions with inclinations as 2–6 Hz, 11–12 Hz, and 14–24 Hz in the first measurement time as 11/2011. Over the given period, the inclination curve of cumulative function of the resonance region at the highest frequency witnessed a downward trend while the region at the lowest frequency experienced an upward trend. These reasons show that the CF_SM function of different spans differs, and there are conditions to determine or compare the degradation between the spans. CF_SM functions with the same resonance region on concrete span.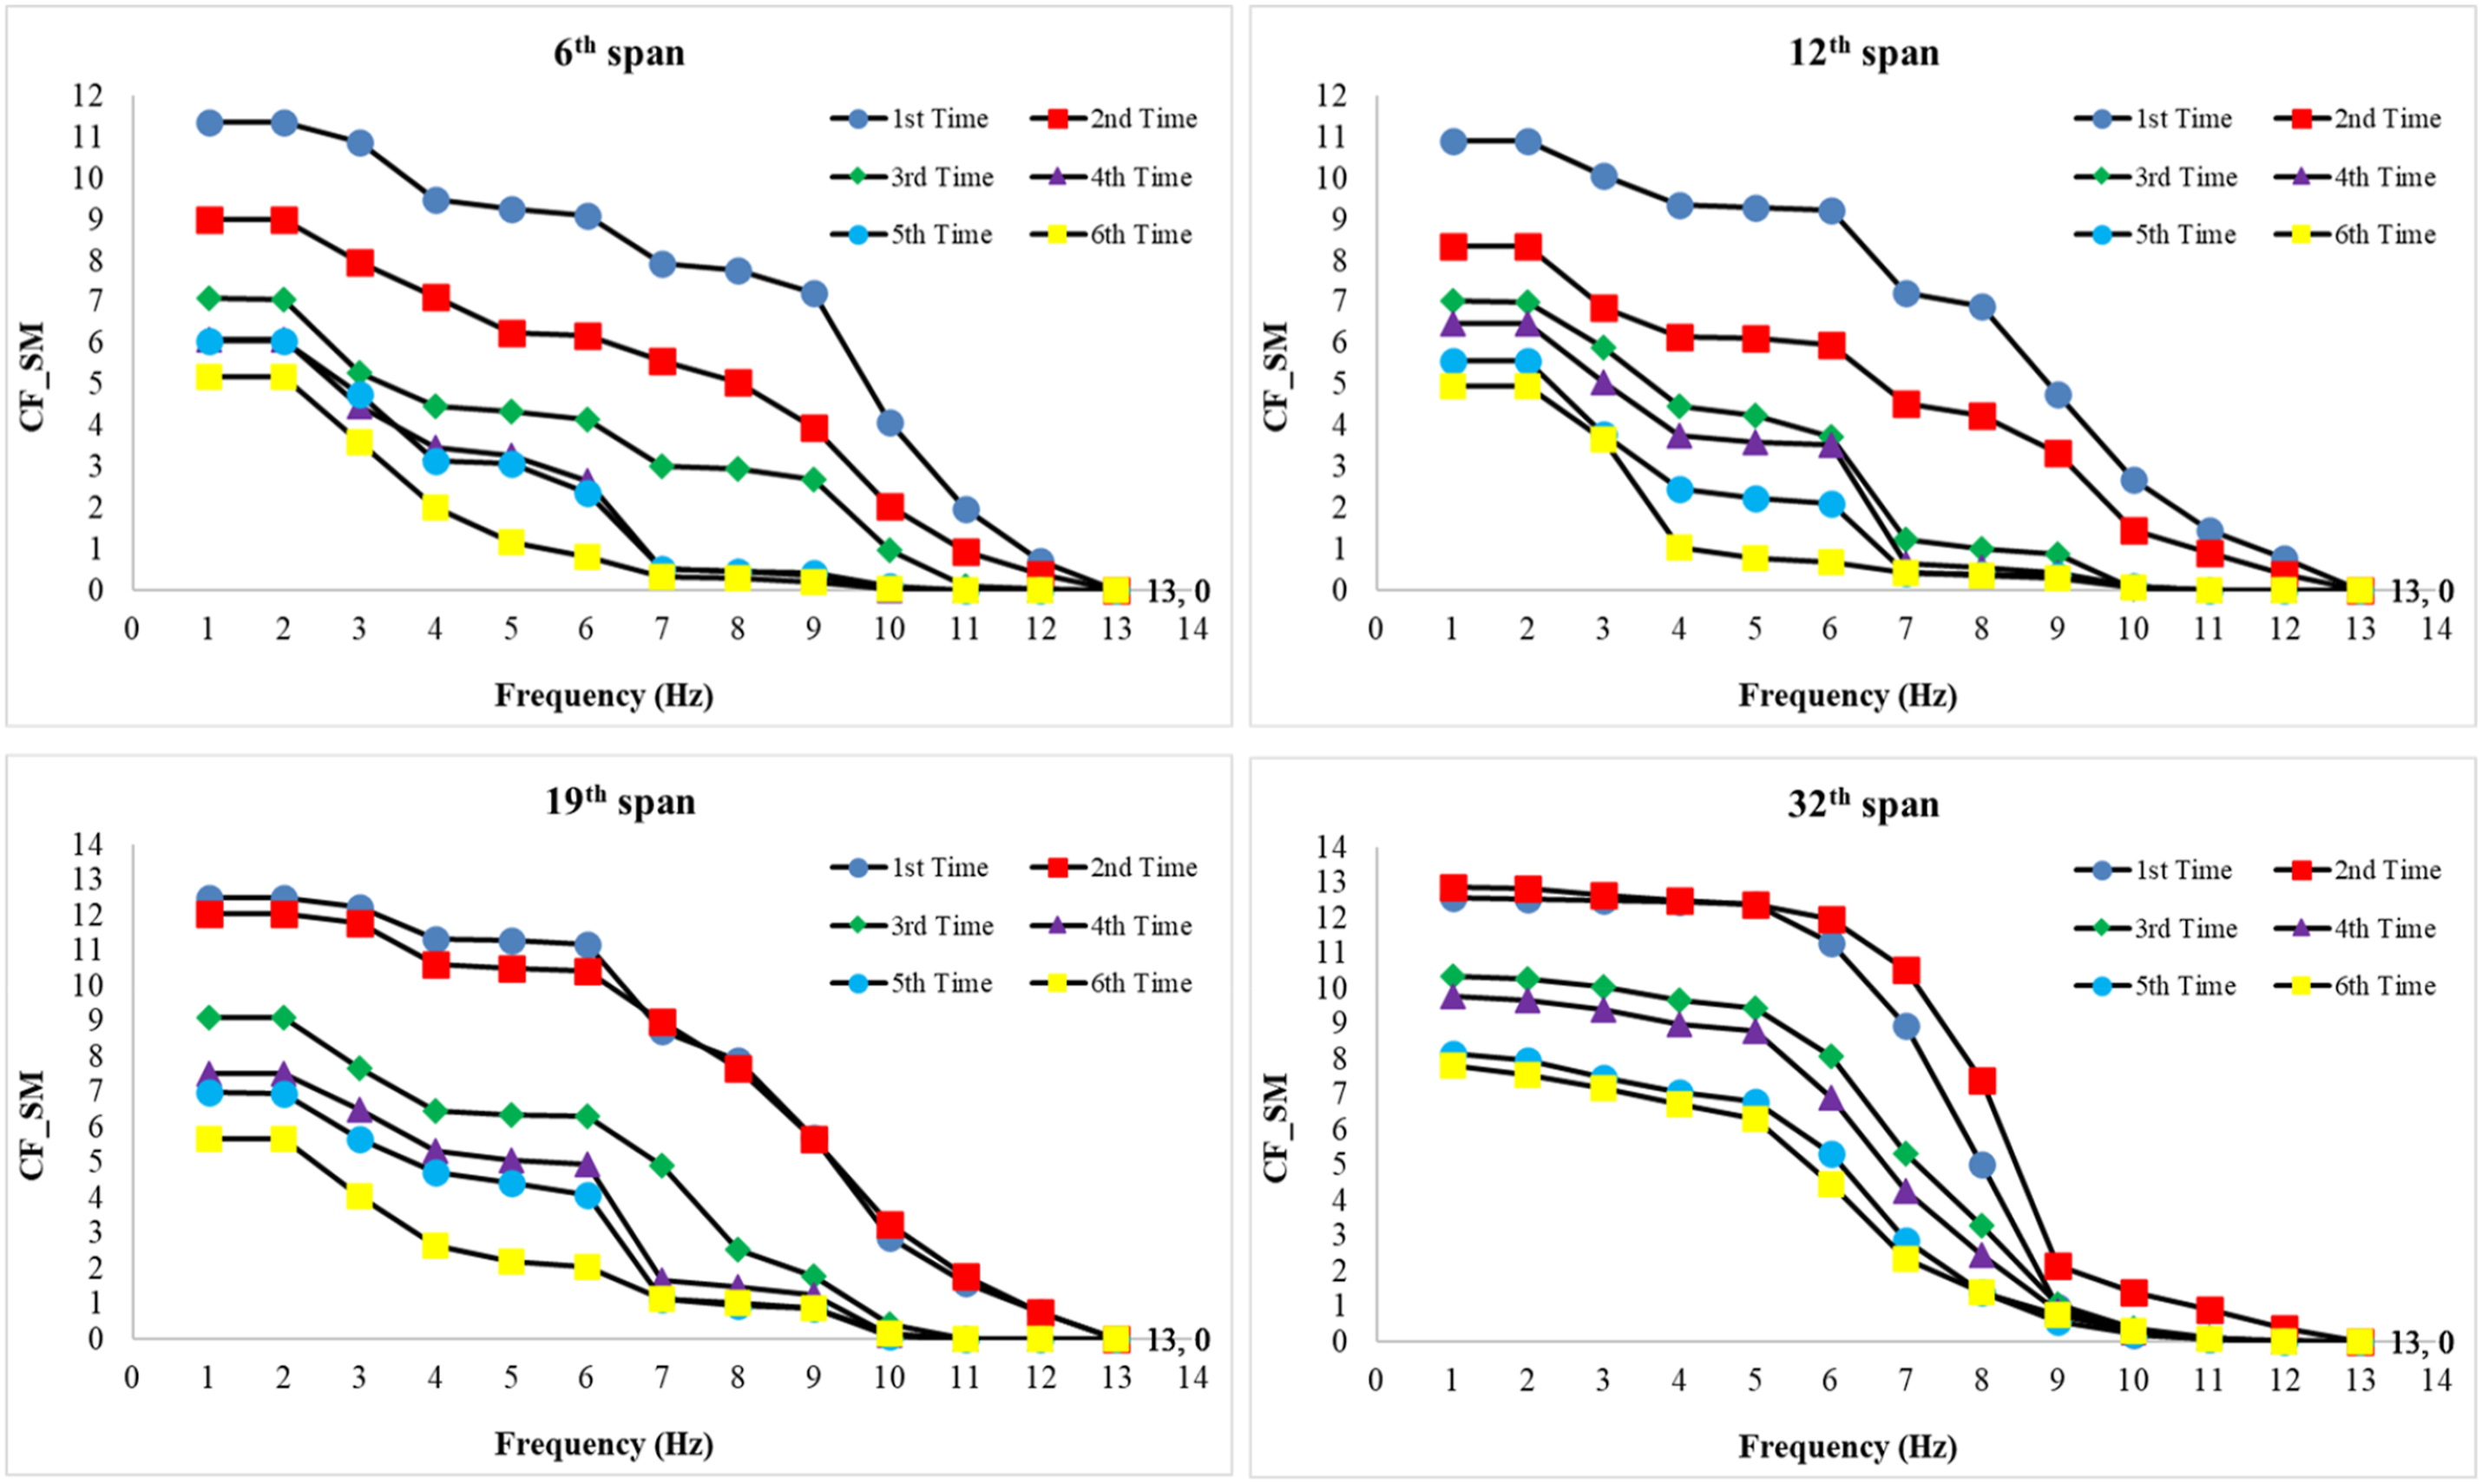
After 3 months, the CF_SM function of some spans was significantly different. Compared to other common parameters to monitor the degradation of the bridge, such as the frequency parameter, damping coefficient, and eigenvectors, the CF_SM function value was more sensitive about over 50% between the first and the last measurement time, approximately 5 years. On the other hand, with the vibration signal, the CF_SM function value was more stable than individual frequencies or fundamental frequency because the CF_SM value steadily decreased while frequency value witnessed a slight fluctuation followed by a minimal decline from the first measurement time to the last measurement time. In this study, the CF_SM function value was used to monitor the degradation of the bridge’s spans, which showed a significant decrease over the given period, as shown in Figure 27. The CF_SM value dramatically declined between the first and fourth measurement time on Saigon Bridge, around 1 year from 2011 to 2012. However, in the last two times, this value only slightly decreased over 4 years, indicating that the Saigon Bridge’s span was slightly repaired in 2012. In 2014, the second Saigon Bridge was built and operated, helping to reduce traffic flow and the degradation level.
Conclusions
This study introduces a novel theoretical framework for determining the value of the power spectrum through a moment accumulation function, employing a combined CNN and MLP model. The research outcomes have significant implications: - The research focused on the application testing to assess the operational condition of bridges in Vietnam, specifically the Saigon Bridge. Utilizing random vibration signals from various structures and materials, the study employed the power spectrum density shape as a parameter to evaluate the bearing capacity of the bridge’s spans. - Real vibration signals from the randomized traffic load model were used to extract the PSD. The findings revealed a relationship between the appearance frequency of harmonics and high-frequency regions and the gradual decrease in the stiffness of the bridge’s spans over time. This degradation occurs at a slow pace, posing challenges for real-time bridge status monitoring. While the lowest vibration frequency is consistent across different positions of the same span, the power spectral shape may vary. Notably, the power spectrum form is equal if mechanical properties of materials, stiffness equivalence, and degradation levels align; however, variations persist in the shape of the power spectrum between different measurement points within the same span or across different spans within the same bridge. - The concept of the spectral moment and the cumulative moment function were employed to evaluate changes in the power spectrum geometry, utilizing a combined CNN and MLP model. This function successfully identified differences between measurement points on the same span and between different spans within the same measurement. The sensitivity of this moment accumulation function surpasses that of other parameters in assessing structural stiffness decline. It excels in evaluating behavior at various points on the same span compared to parameters derived from alternative methods. - While the preliminary results are promising, the study acknowledges the limited scope of evaluation, focusing on a small number of spans. Future research aims to expand the evaluation to a larger sample of spans, enabling a comprehensive assessment of this parameter’s effectiveness in bridge assessment. This expansion will contribute to a deeper understanding of the moment accumulation function’s capabilities and its potential impact on bridge monitoring practices.
This study demonstrates that vibration-based methods, when combined with spectral moment analysis, offer a reliable approach to link computational results with physical phenomena. By identifying clusters of fundamental frequencies and analyzing spectral moment variations, the method provides actionable insights into the structural health of the Saigon Bridge. These findings underline the importance of connecting analytical outputs to physical damage mechanisms, such as stiffness degradation, material wear, and environmental effects, to ensure effective structural health monitoring.
Footnotes
Authors’ note
This is to certify that to the best of authors’ knowledge, the content of this manuscript is original. The paper has not been submitted elsewhere nor has been published anywhere. Authors confirm that the intellectual content of this paper is the original product of our work and all the assistance or funds from other sources have been acknowledged.
Acknowledgments
Authors confirm that the intellectual content of this paper is the original product of our work and all the assistance or funds from other sources have been acknowledged.
Statements and declarations
Funding
The author(s) received no financial support for the research, authorship, and/or publication of this article.
Conflicting interests
The author(s) declared no potential conflicts of interest with respect to the research, authorship, and/or publication of this article.
Data Availability Statement
The data copyright belongs to the Roads Management Center (RMC). This data is intended solely for the purpose of scientific research and should not be used for other matters.