
Abstract
Global warming and climate change have become an important issue that the world is focusing on due to its apparent impact on lives and economies around the world. Efforts have been put into developing more environmentally friendly vehicles ranging from hybrid to fully electrical vehicles. In addition, research efforts have been made to develop and embed energy harvesters in vehicles to reuse some of the energy usually released into the environment. This study is about the development of an energy harvesting suspension system and investigates its performance using a continuous half-width deceleration bump. A 3D vehicle model with 4 harvesters embedded in the suspension is used in the analysis. The focus is on the effect of harvesters’ parameters and speed bump’s physical characteristics on the power generation performance of the harvesters. The main objective is to maximize electricity and minimize the ride comfort efficiency index using a multi-objective optimization function in conjunction with a genetic algorithm. This study proposes an innovative self-powering method that utilizes a chassis energy harvester to convert vibrations into magnetoelectric effects. It enables autonomous green energy generation for transportation vehicles and can be applied to vehicles traversing consecutive speed bumps. In addition to effectively reducing speed, the energy harvester generates green electricity to supplement the power supply of electric vehicles.
Introduction
Climate change has been having a noticeable effect in many regions of the world leading to much more severe storms, droughts, and irregular weather patterns. Therefore, countries around the world have come together to study how to address these problems and devise solutions such as lowering emission, 1 increasing reliance on renewable energies and electric vehicles, promote energy conservation, and increase research on carbon capture and sequestration. In addition, research on energy harvesters has also prospered in the past 2 decades to recycle some of the energy that is usually released into the environment, exacerbating the problem of global warming further. Dampers in the suspension system under the chassis of vehicles release a significant amount of energy into the environment every driving second. In Ref. 2, it was shown that the damper of a sedan’s suspension system consumes 200 W of energy when driving at 30 km per hour on paved roads. In addition, Hsu 3 found that each wheel of a sedan traveling at 60 km per hour can recover about 100 W of energy. Furthermore, Zuo and Zhang 4 showed that the vibration absorber of a sedan traveling at 60 km per hour can capture about 100–400 W of power consumption usually dissipated into the environment. Consequently, harvesting energy released by suspension systems could reduce the amount of energy released into the environment and provide power another source of power for the vehicle.
Sharp and Crolla 5 explored the design of integrated suspension and energy harvesting system, Suda et al. 6 investigated active suspension and energy harvesting systems, and Xiao et al. 7 investigated the development and use of piezoelectric energy harvesting devices. Other researchers investigated other types of harvesters, for example, Kim et al. 8 explored Electro Magnetic (EM) induction energy harvester design and Choi and Wereley 9 developed energy harvesting devices using a rotor, permanent magnet, and Magneto Rheological (MR) damper. Several other researchers focused on harvesting energy from high frequency sources using cantilever beams and piezoelectric material.10–17 Other new materials such as the single-walled carbon nanotubes (SWNTs) and multi-walled nanotubes (MWNTs) which can enhance the thermal conductivity of base fluids have been designed to be nanomechanical gears, nanosensors, nanocomposite materials, resonators, and thermal materials which can be used in the energy harvesting. 18
Since most environmental vibrations are in the mid-to-low frequency range, research on using passive vibration power generation systems with spring and mass to capture low-frequency wave energy has also been conducted.19–21 The mass-spring type of energy harvesters is suitable for power generation at lower frequencies. Chiu et al.22–24 first proposed using a portable spring-mass pendulum energy harvesting device to capture the kinetic energy associated with walking motion. In addition, Chiu et al. also applied the spring-mass-based energy harvesting mechanism to optimize energy harvesting from current and ocean waves.25–28
He et al. presented a study of vibration alleviation and energy harvesting in a dynamical system of a spring-pendulum. The structure of their pendulum is modified using an independent electromagnetic harvesting system. 29 Later, Amar et al. proposed a study of a three degrees-of-freedom (DOF) dynamical system, including a dynamic part and an electromagnetic harvesting device. 30
Other researchers used different optimization techniques to design energy harvesters for vehicle suspension systems.31–33 Georgiou et al. 34 and Chiu et al. 35 conducted their optimization of the energy harvesters using a quarter-car model and different types of road profiles.
Recently, Chiu et al.
36
investigated the optimal design of the energy harvesters half-car model traveling on a saw-tooth road surface, and found that the power generation capacity is significantly increased when the road surface is continuously folded.
36
However, this study only considered the effects of the longitudinal (in the direction of travel as shown in Figure 4(a)) vehicle sway and the interaction between the front and rear wheels, but did not consider the transversal (perpendicular to the direction of travel as shown in Figure 4(b)) vehicle sway and the interaction between the right and left wheels caused by the eccentricity of the load inside the vehicle. To evaluate the energy harvesters, a full-car model and a continuous half-width deceleration bump input to model the complete suspension system (see Figure 1). In addition, this study will also explore the optimal height of the continuous half-width deceleration bump. Considering the passenger’s ride experience, a Ride Comfort Efficiency (RCE) index is used to guarantee a minimum level of comfort for all passengers.37–39 The research from Kou et al.
40
indicated that the non-smooth boundary might lead to smaller friction. A multidimensional car tire vibrates due to the continuous half-width road surface.
Using maximum power generation and passenger ride comfort as the optimization criteria, the four energy harvesters (one per wheel) will be synthesized simultaneously for the vehicle suspension system. The harvesters’ parameters within the suspension system will be optimized. A multi-objective function is developed to optimize the dimensionless regenerated power efficiency index (GE) combined with the critical ride comfort efficiency index (RCEc).
Modeling of the suspension energy harvester system
Mathematical model of the continuous half-wave length road surface
The bottom plate of a multidimensional car tire vibrates due to the continuous half-width road surface is shown in Figure 1. The plan view of the car is depicted in Figure 2. To analyze a dynamic model for a 3-D car suspension system with imbedded harvesters, the elevated views in long axis of the car’s suspending mechanism is demonstrated and shown in Figure 3(a)–(d). Also, the elevated views in analyzing the car’s swinging in both long axis and short axis is exhibited in Figure 4. Four plan views (part (a), part (b), part (c), and part (d)) and related section line for the car. The elevated views of the car’s suspending mechanism. (a) Section A-A. (b) Free Body Diagram in Section A-A. (c) Section B-B. (d) Free Body Diagram in Section B-B. The elevated views in analyzing the car’s swinging in both long axis and short axis. (a) Section C-C (rotational analysis for long axis). (b) Section D-D (rotational analysis for short axis).
The free body diagram of M1 (the 1st tire, symbolized as ①) and Mm1 (the 1st energy harvester located in the tire ①) is indicated in Figure 3(b). Using Newton’s 2nd Law yields


Equally, the free body diagram of M4 (the 4th tire, symbolized as ④) and Mm4 (the 4th energy harvester located in the tire ④) is indicated in Figure 3(d). Using Newton’s 2nd Law yields


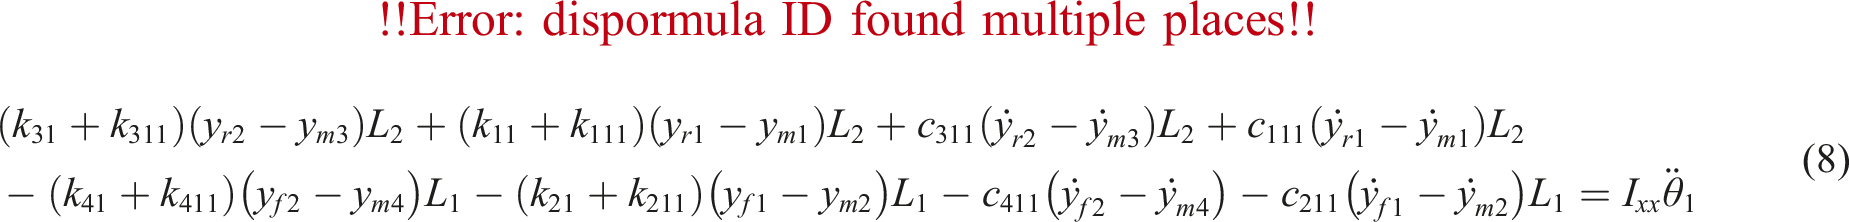
Considering the car’s swinging effect in the long axis shown in Figure 4(a), the moment analysis of the long axis using Newton’s 2nd Law yields

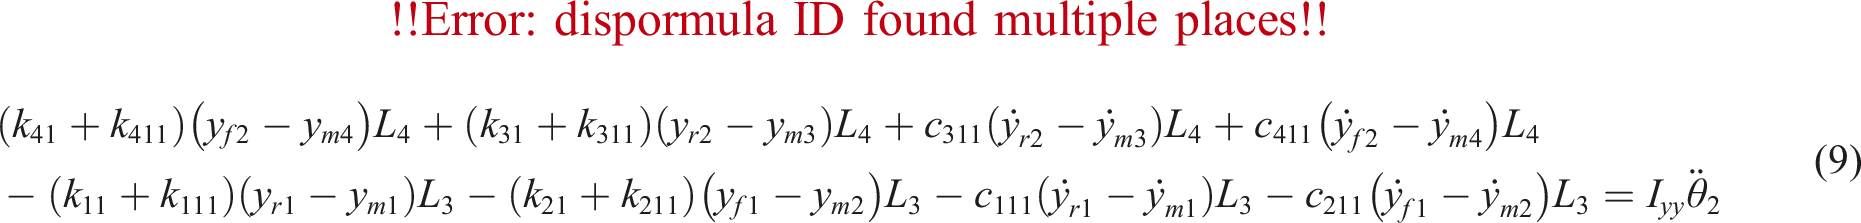
Also, from the car’s swinging effect in the short axis shown in Figure 4(b), the moment analysis of the long axis using Newton’s 2nd Law is given as
The displacements of four seats (relating to wheels ①, ②, ③, and ④), named


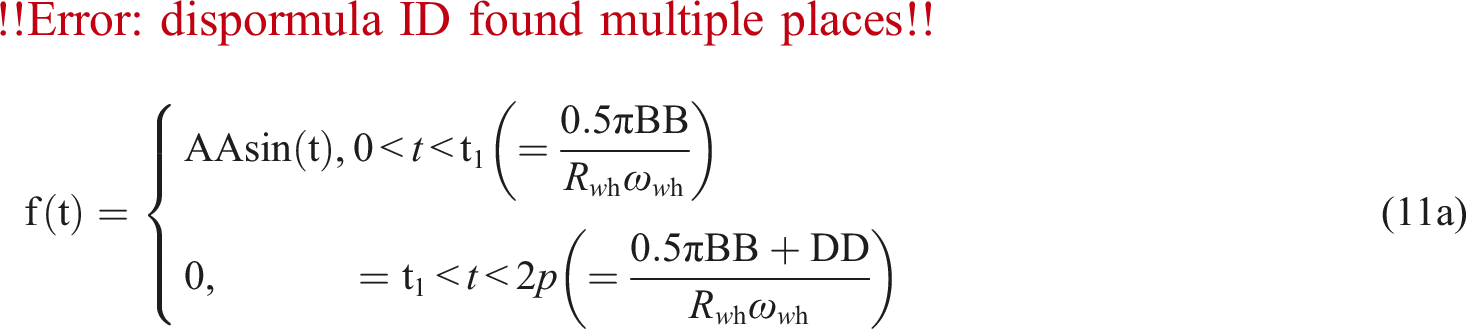
Assuming that the surface of the wheel and bump are rough, the contact point between the wheels and the surface of the bumps has no sliding. A periodic road indicated in Figure 1 can be expressed as follows:
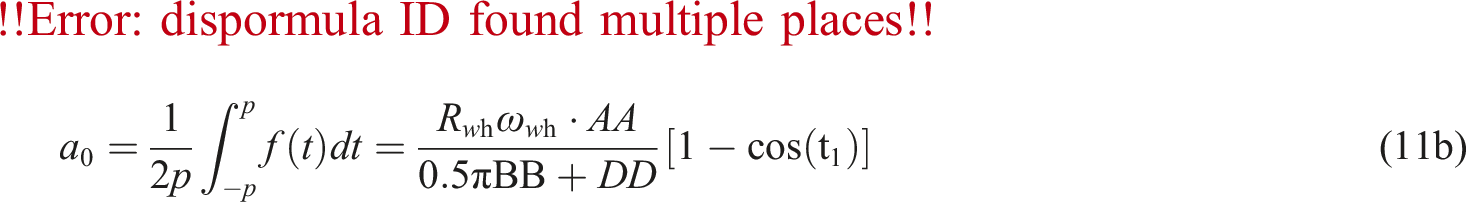
Using the Fourier Series technique, the related displacements of front and rear wheels can be expressed as


Plugging (12) into (1) (2) (3) (4) and rearranging above Equations yields
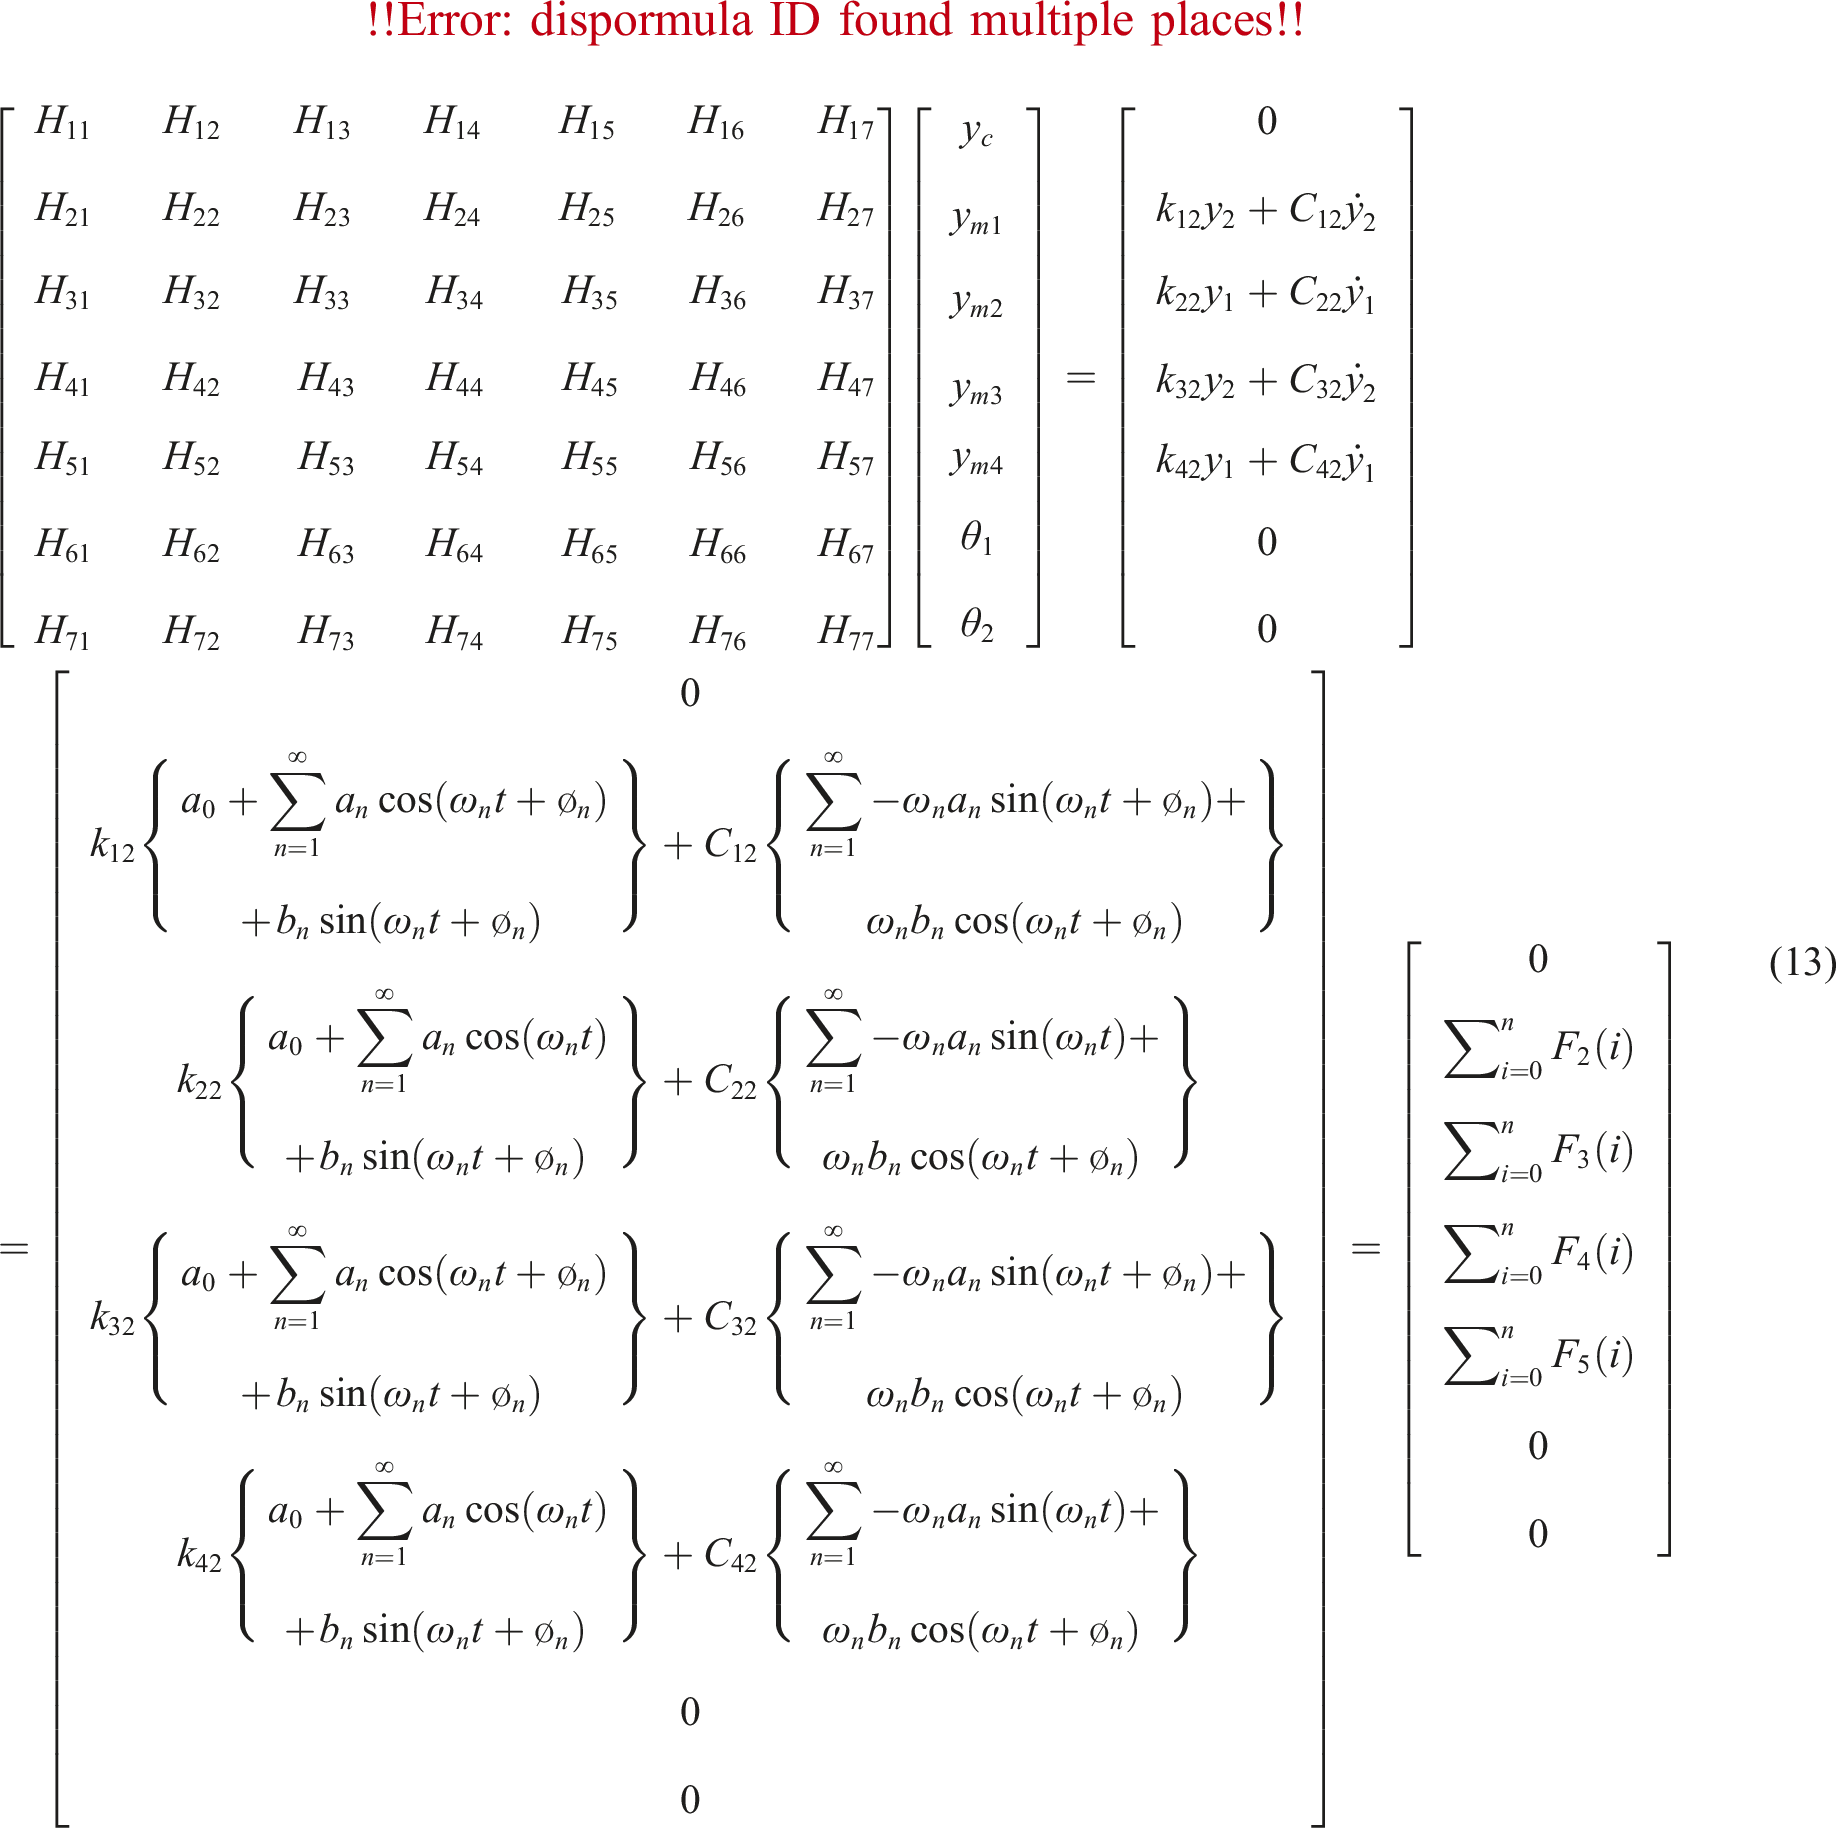
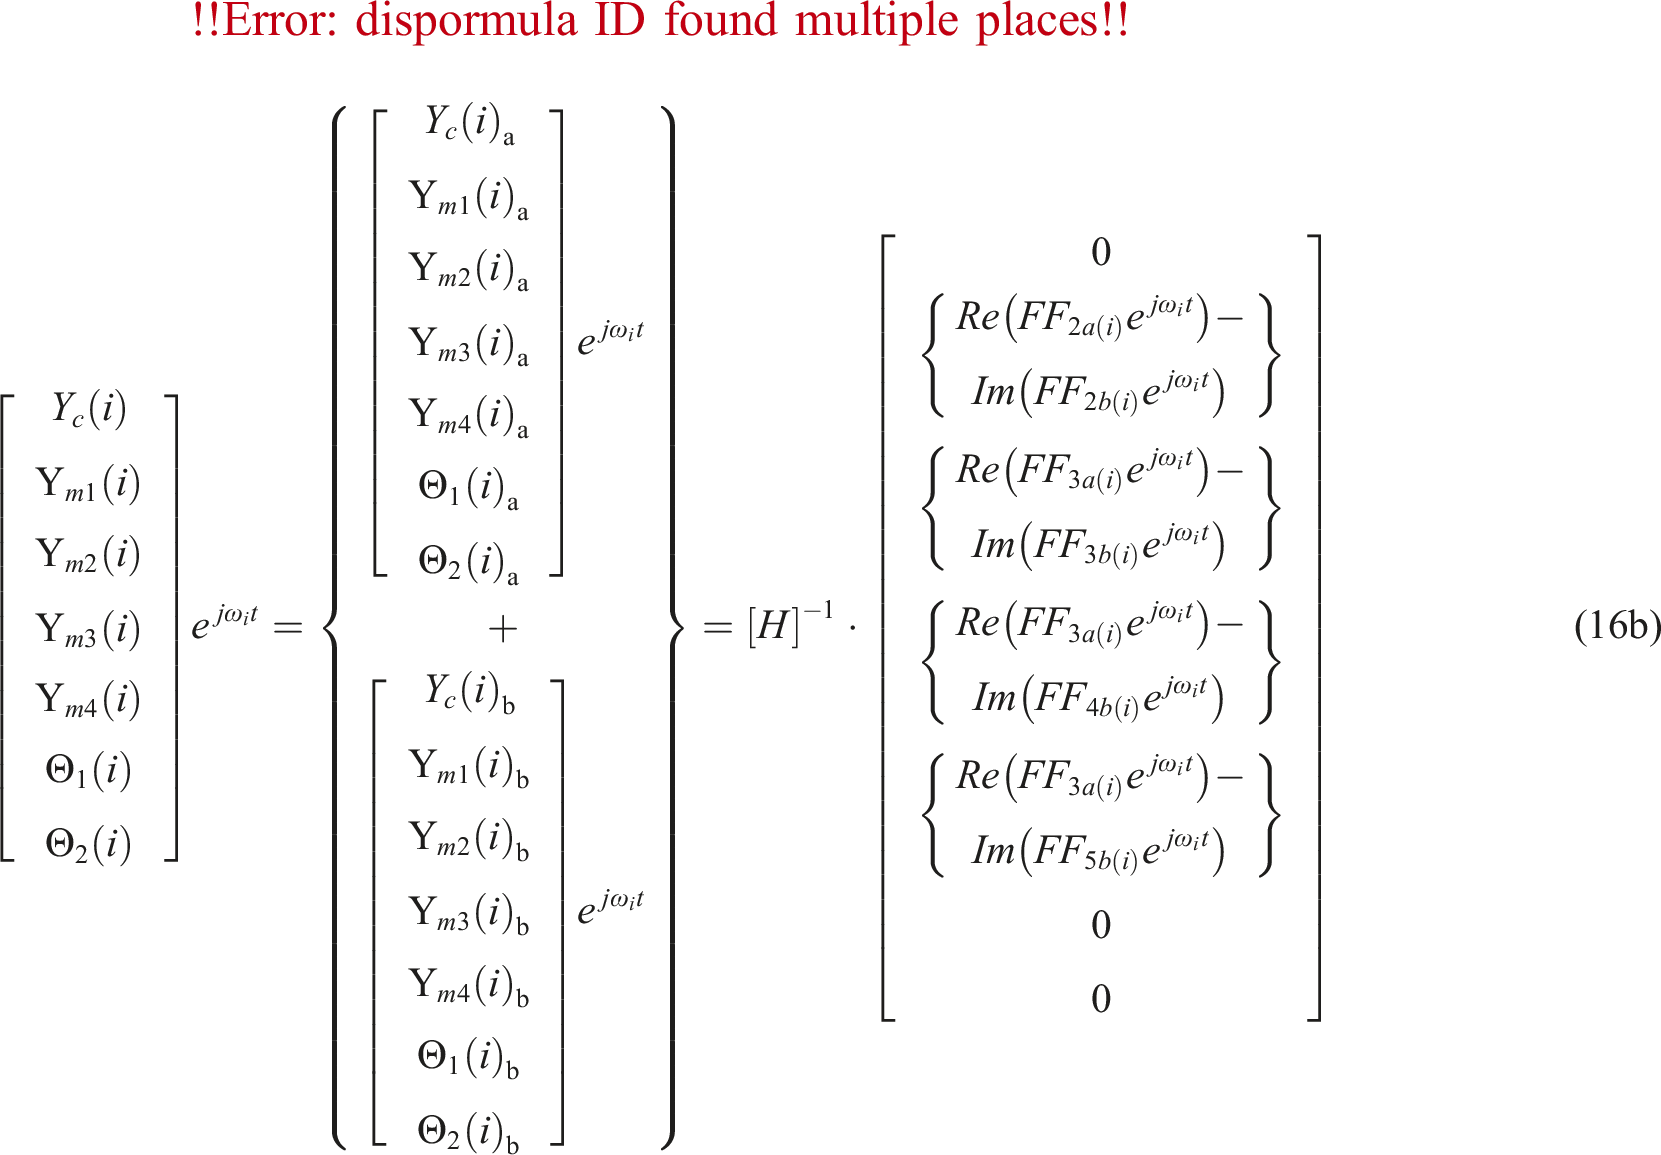
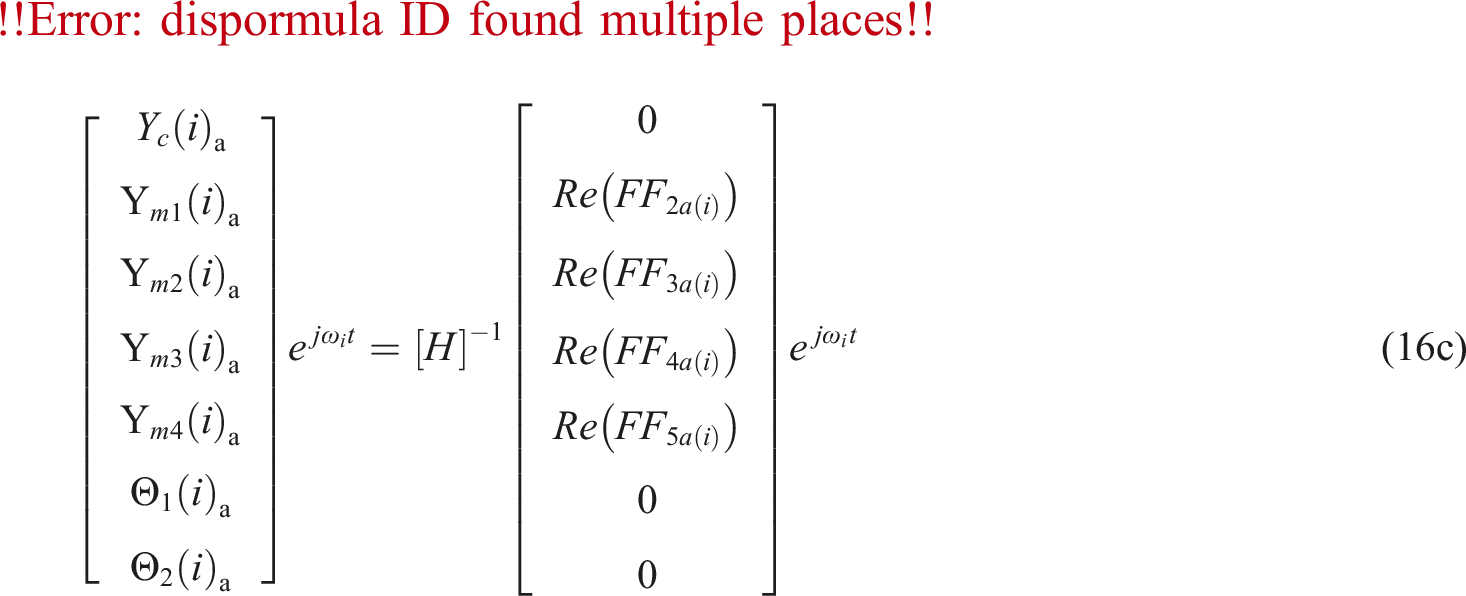
The solution can be obtained using matrix inversion as below:
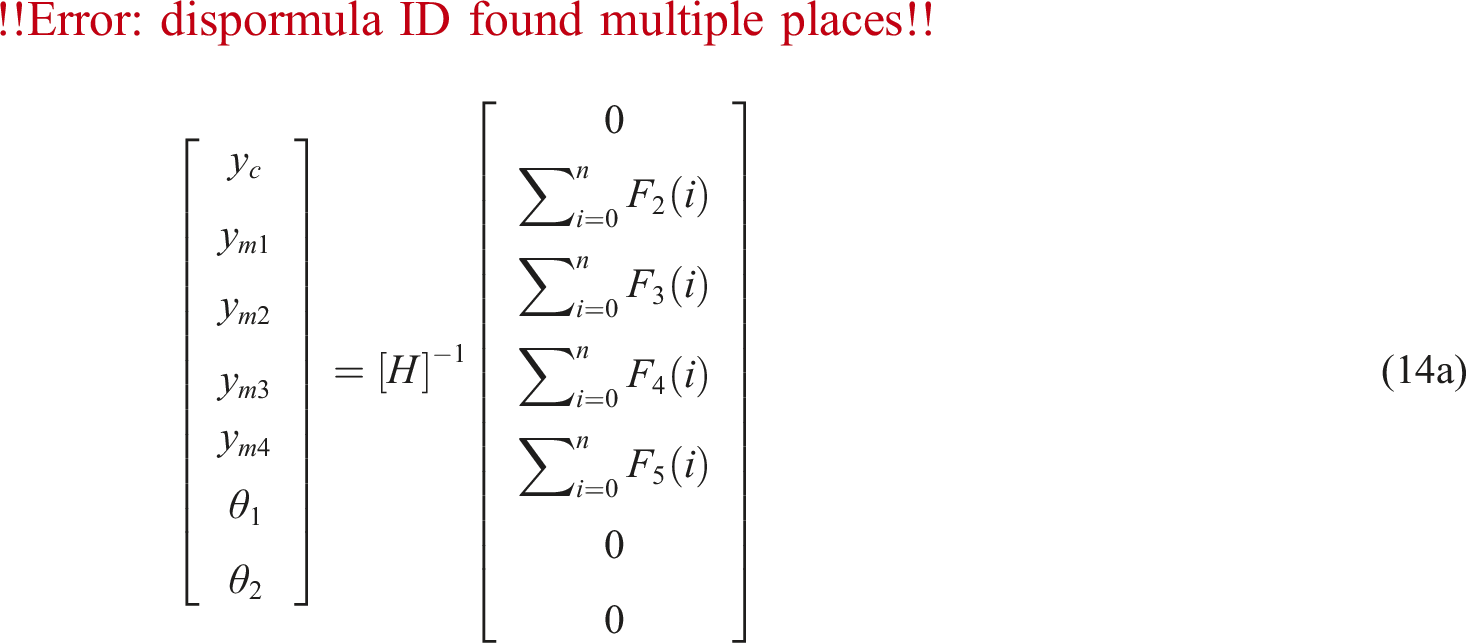
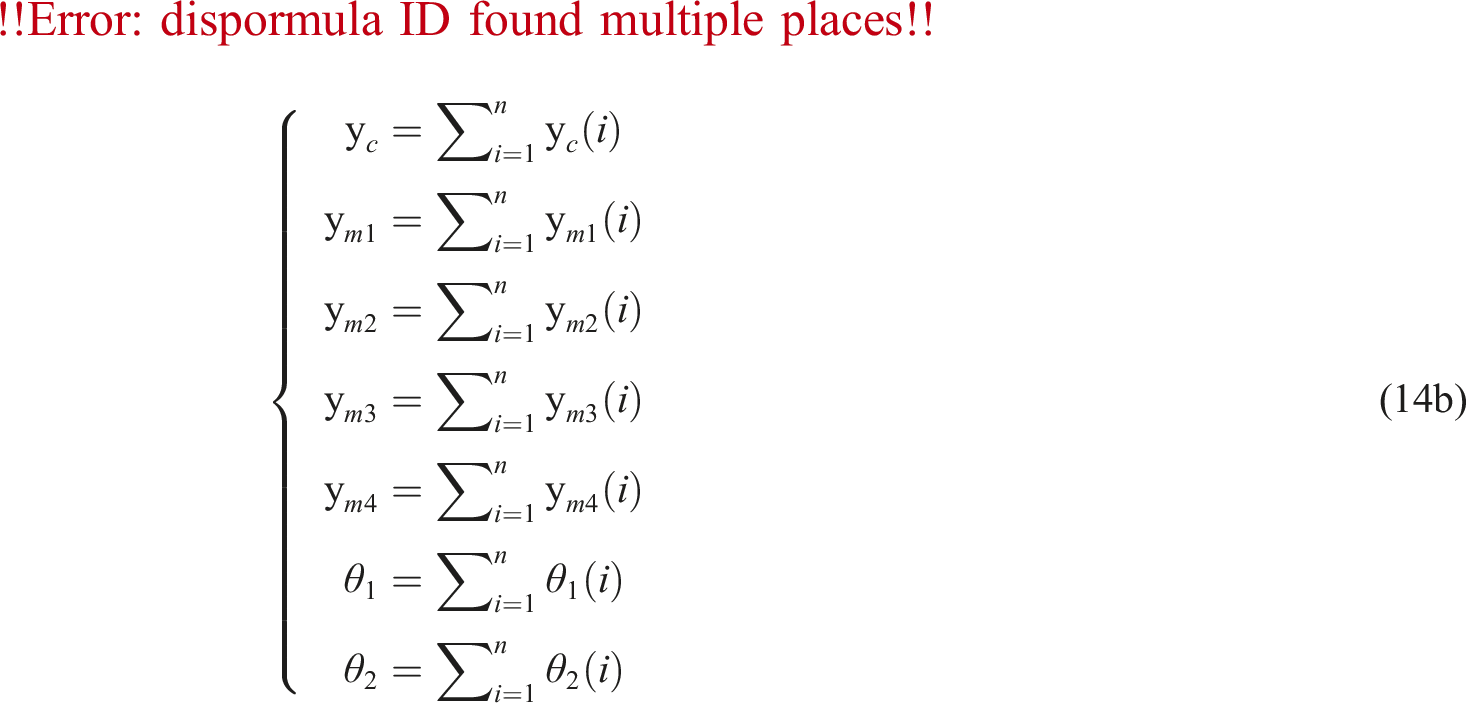


Substituting (15) into (14) yields
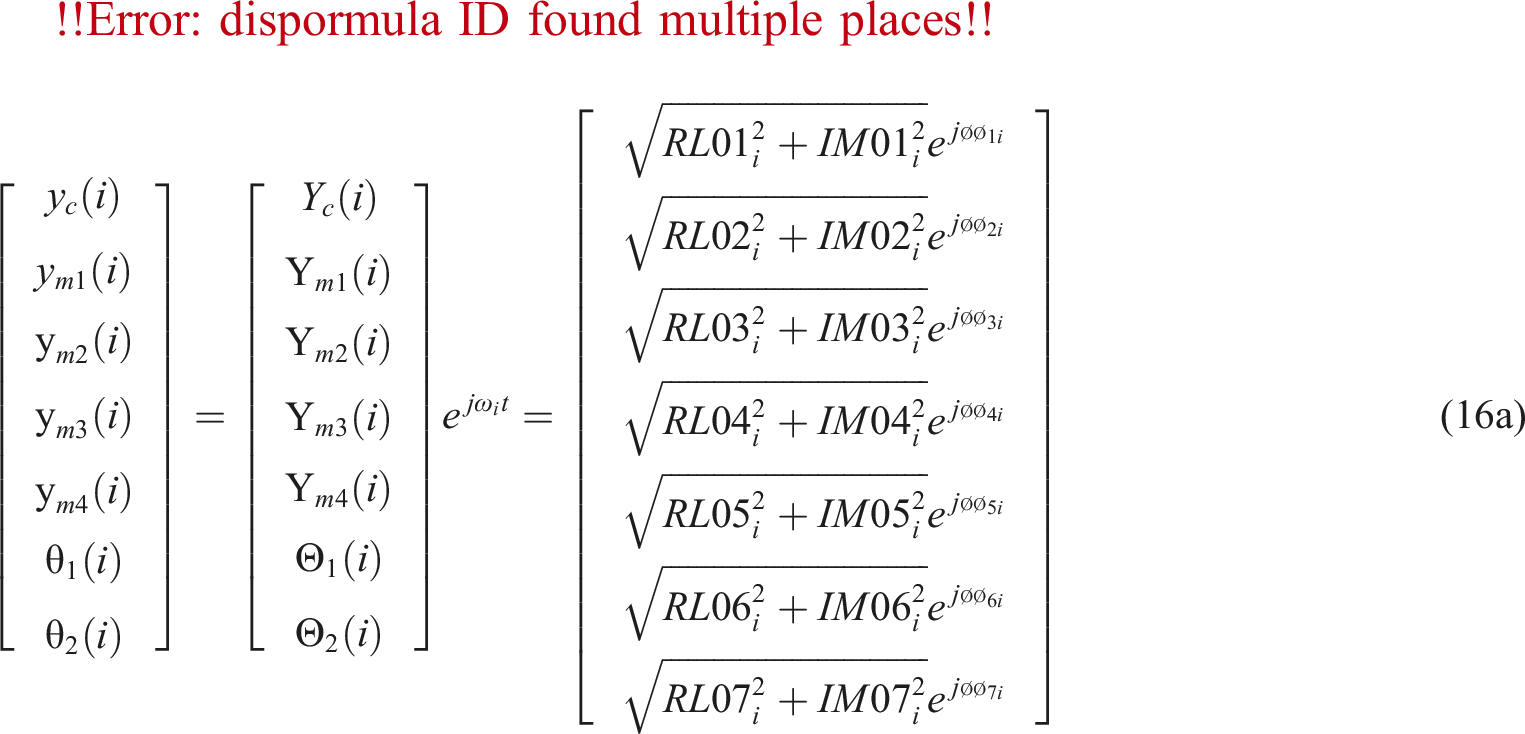

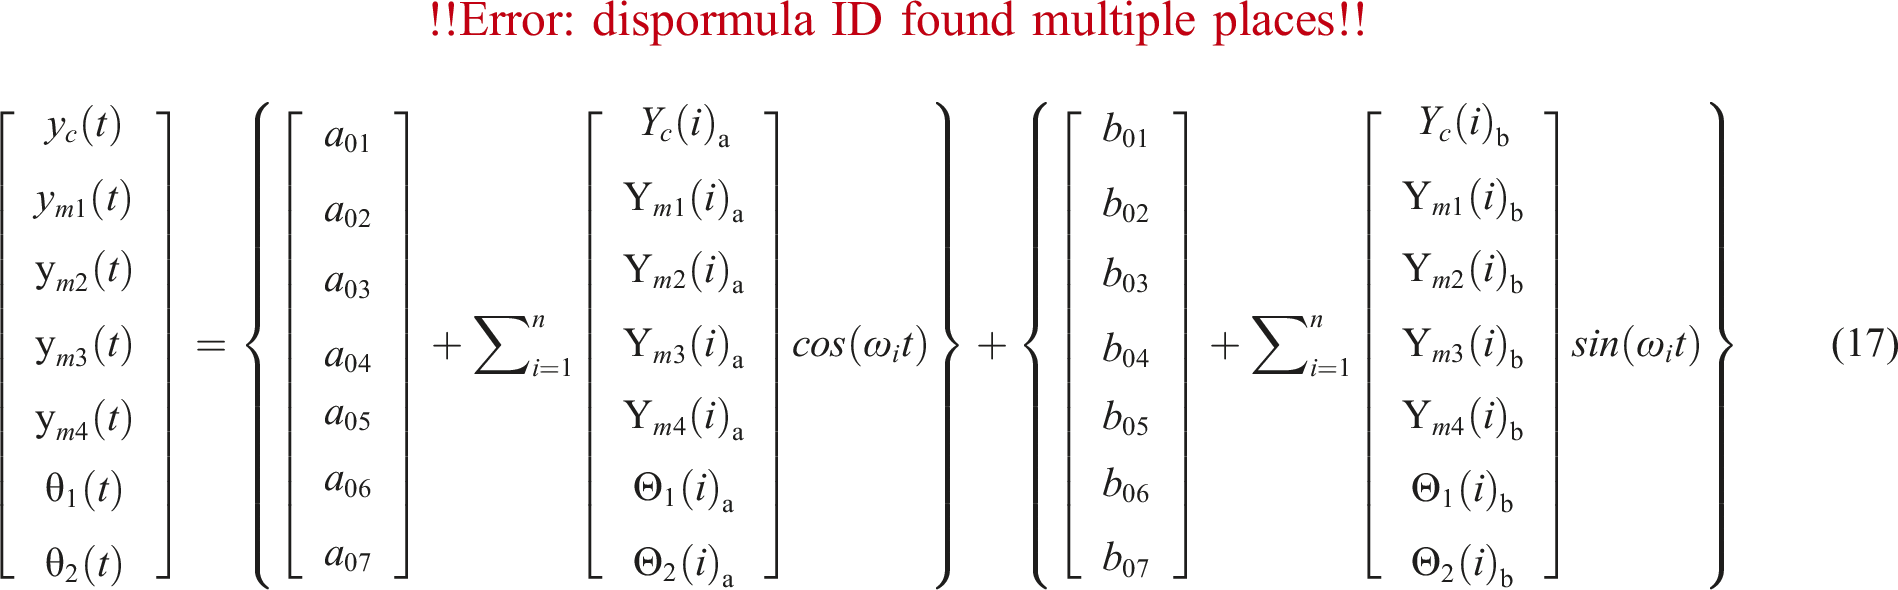
Using Fourier series and superposition, the complete solution for a vehicle traveling on a continuous half-wave speed bump is given as
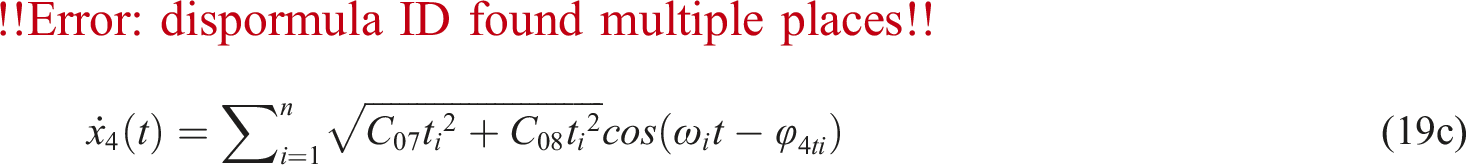
The relative displacement of the magnets to the fix plate in wheels M1 ˜ M4 parts are


The relative velocity of above magnets to the fix plate in wheels M1 ˜ M4 parts are


Regenerative voltage (root-mean-square)
Using Biot–Savart Law,
41
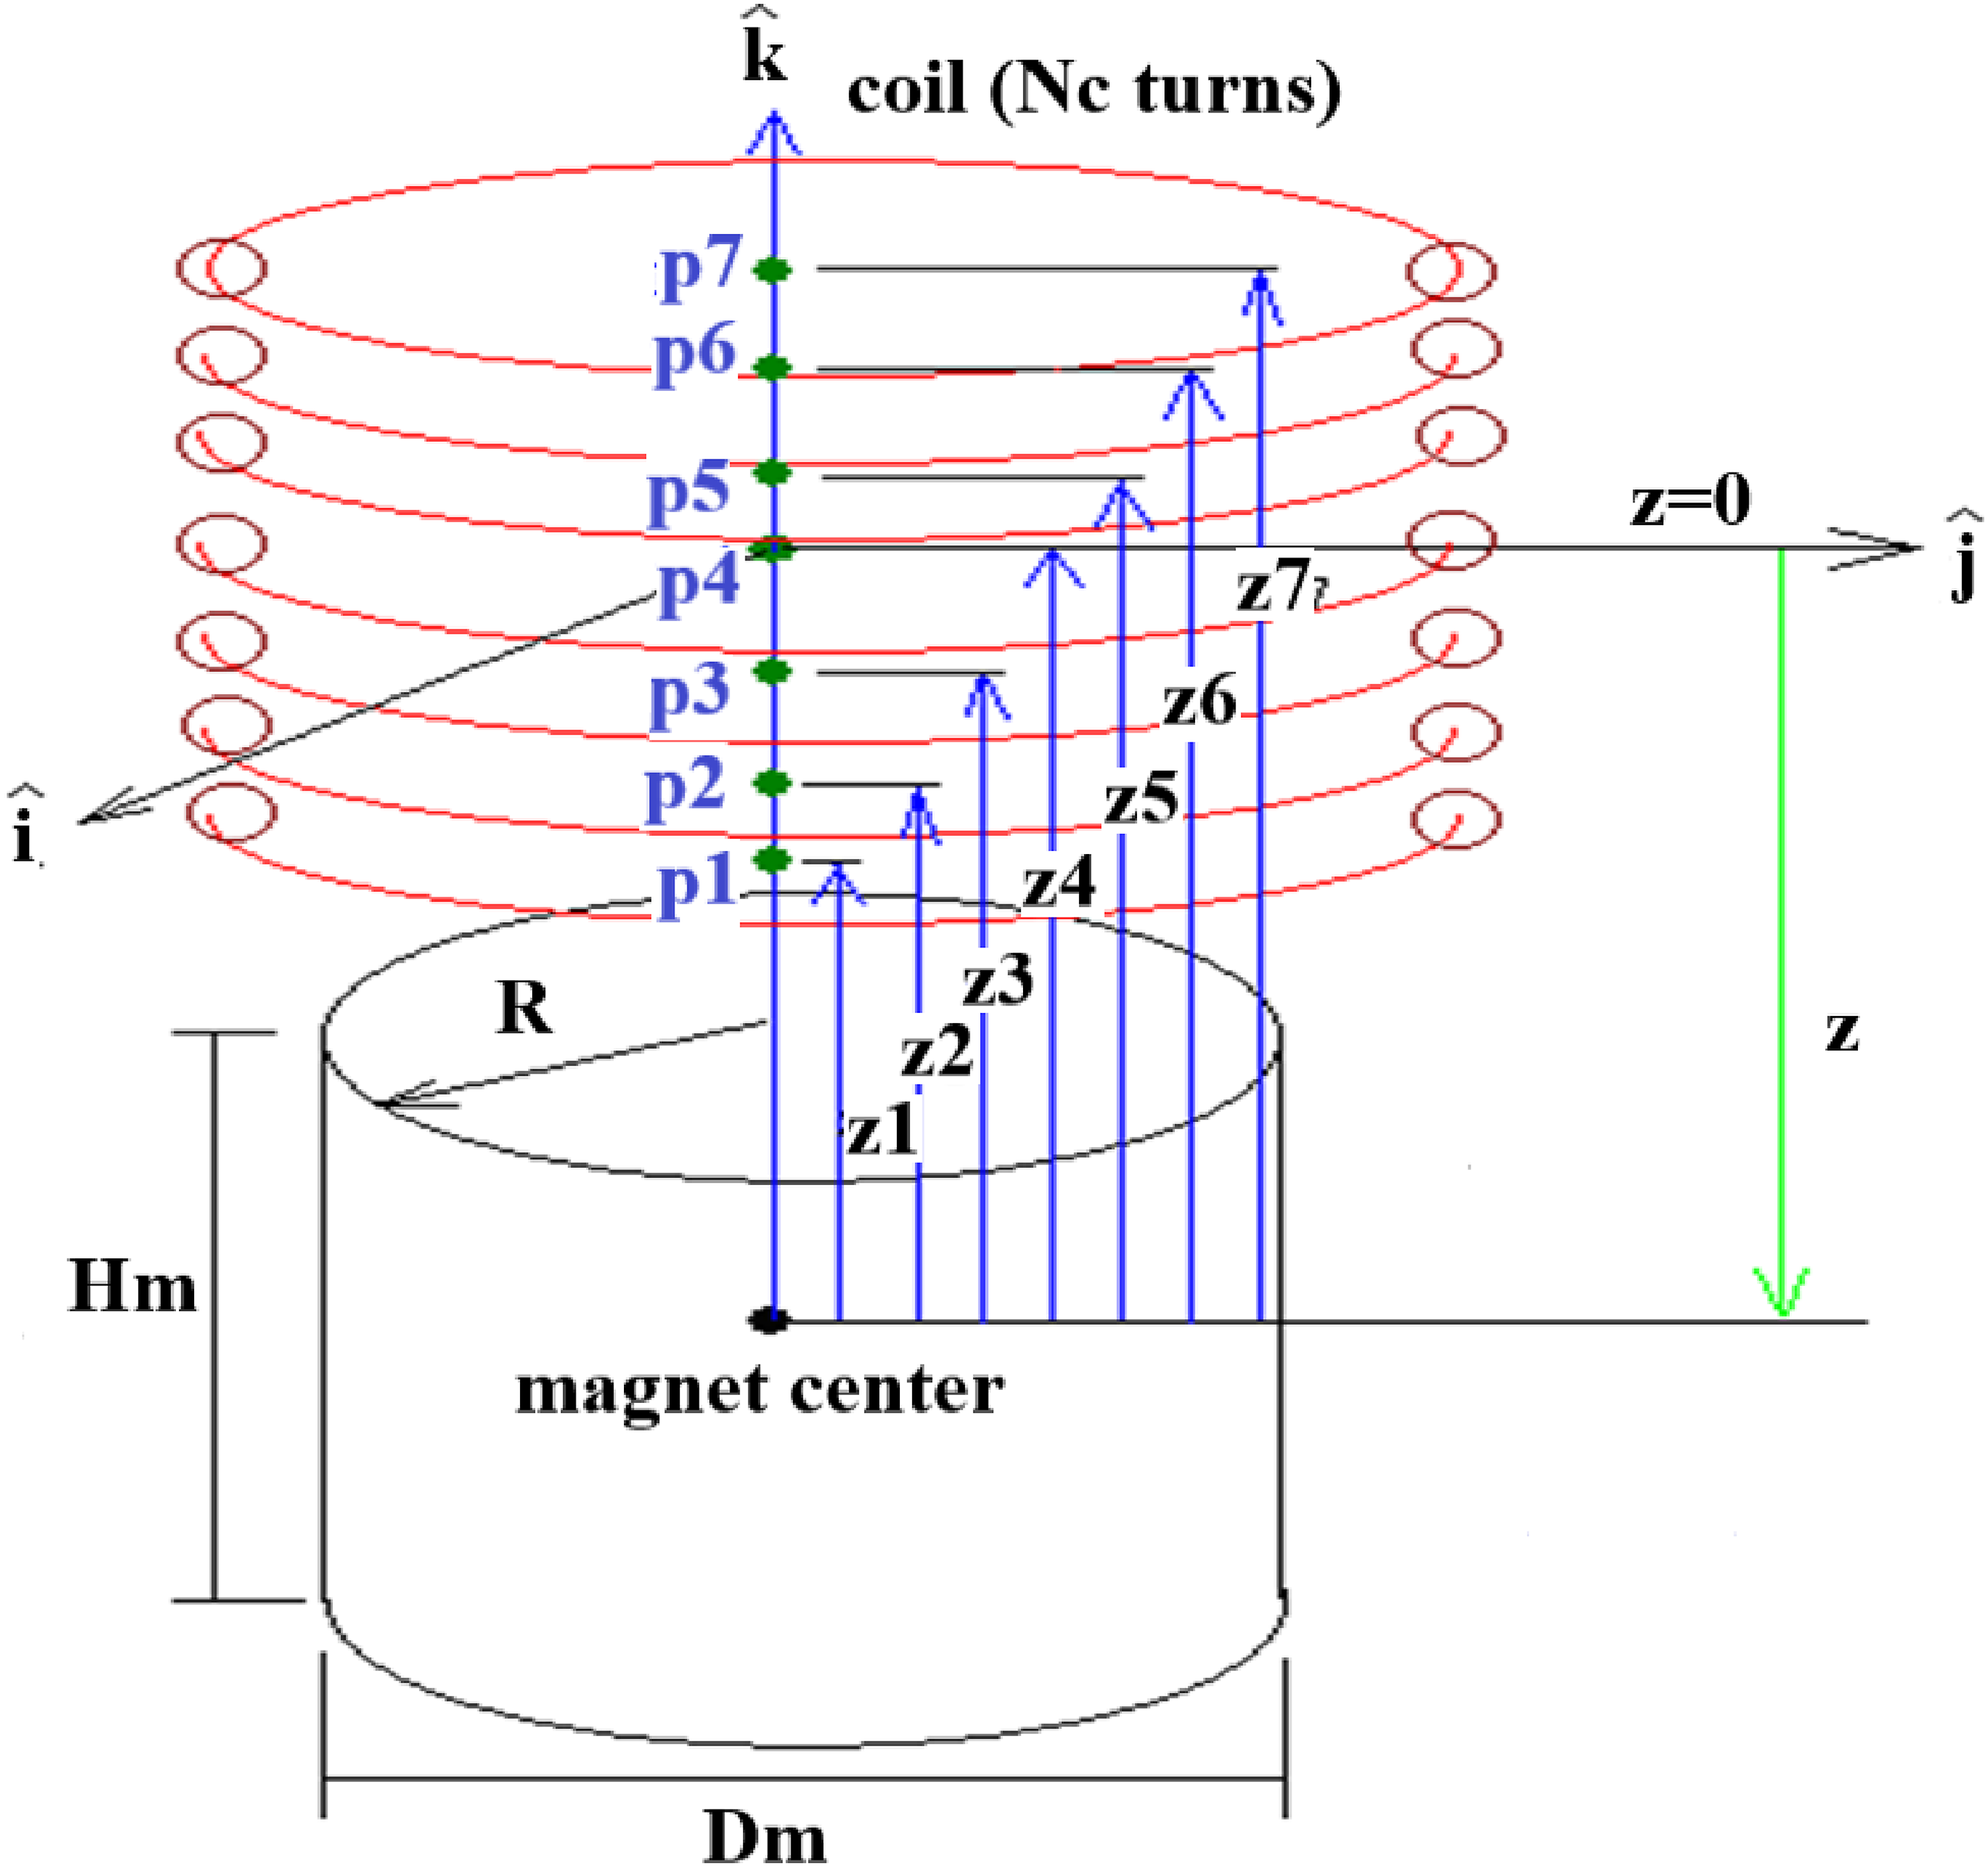
an equivalent magnetic field for a cylindrical magnet is demonstrated in Figure 5. Also, Figure 6 shows a magnet surrounded by a coil with N
c
turns which represents the embedded energy harvester.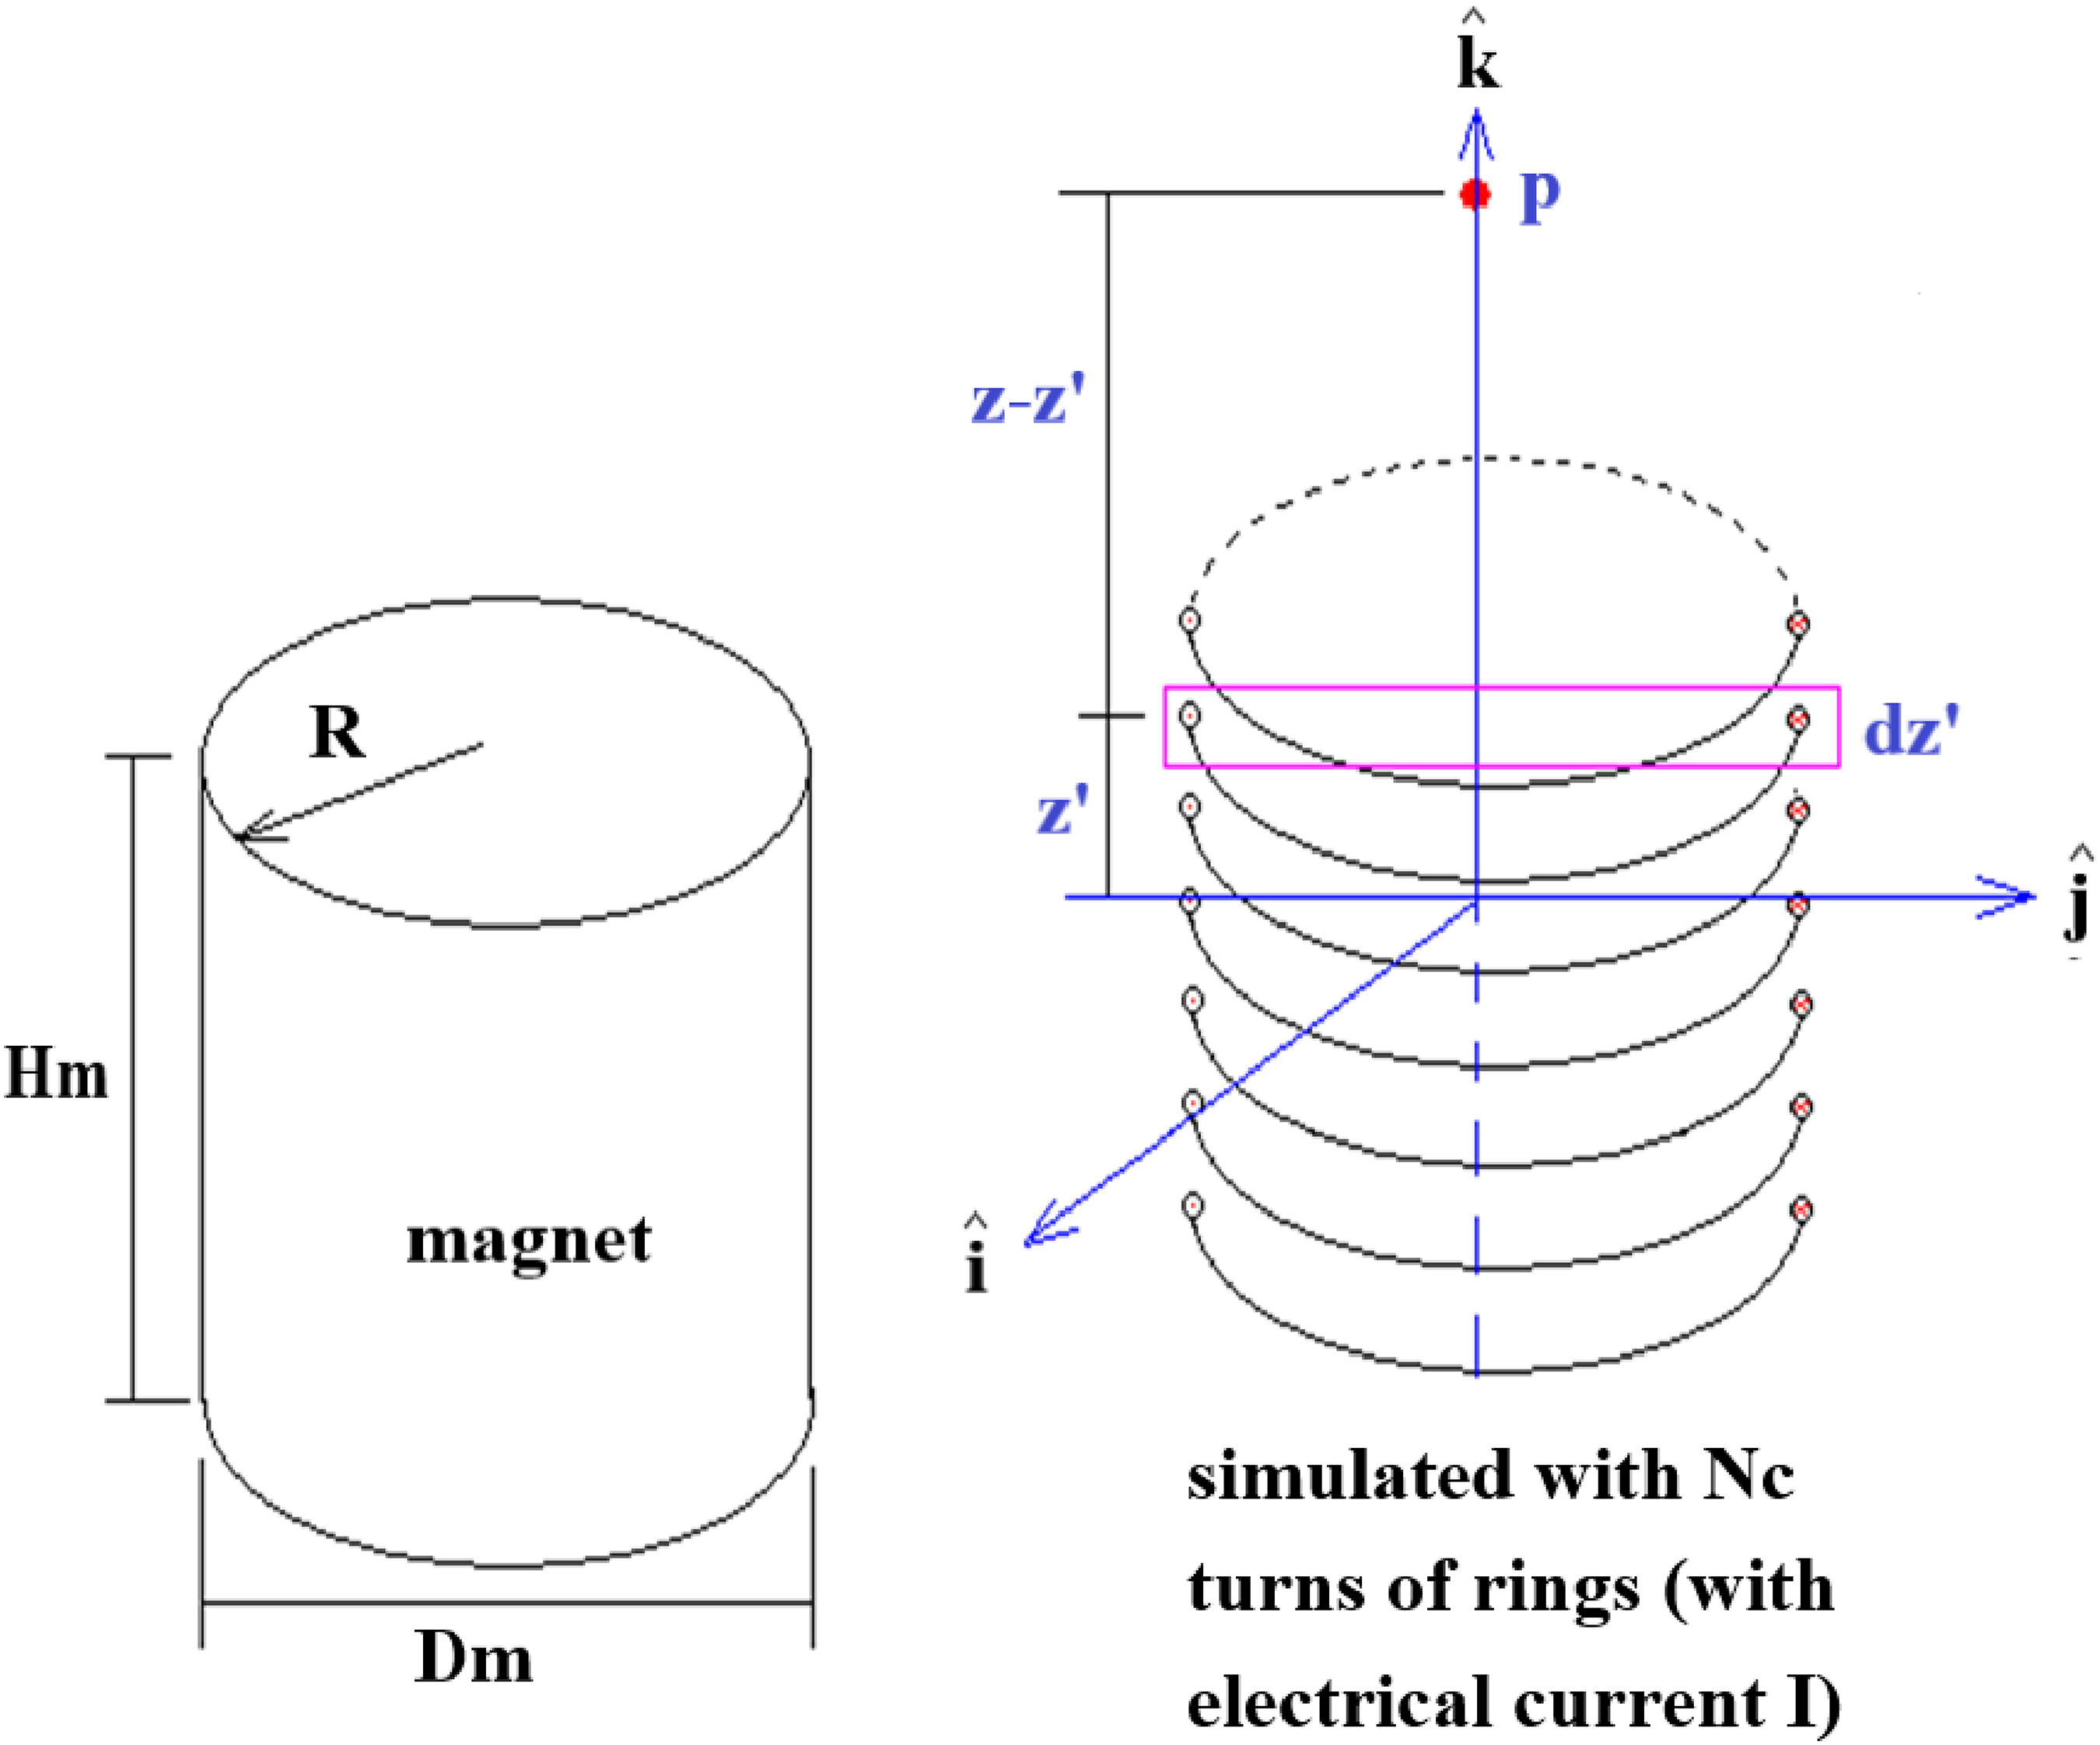
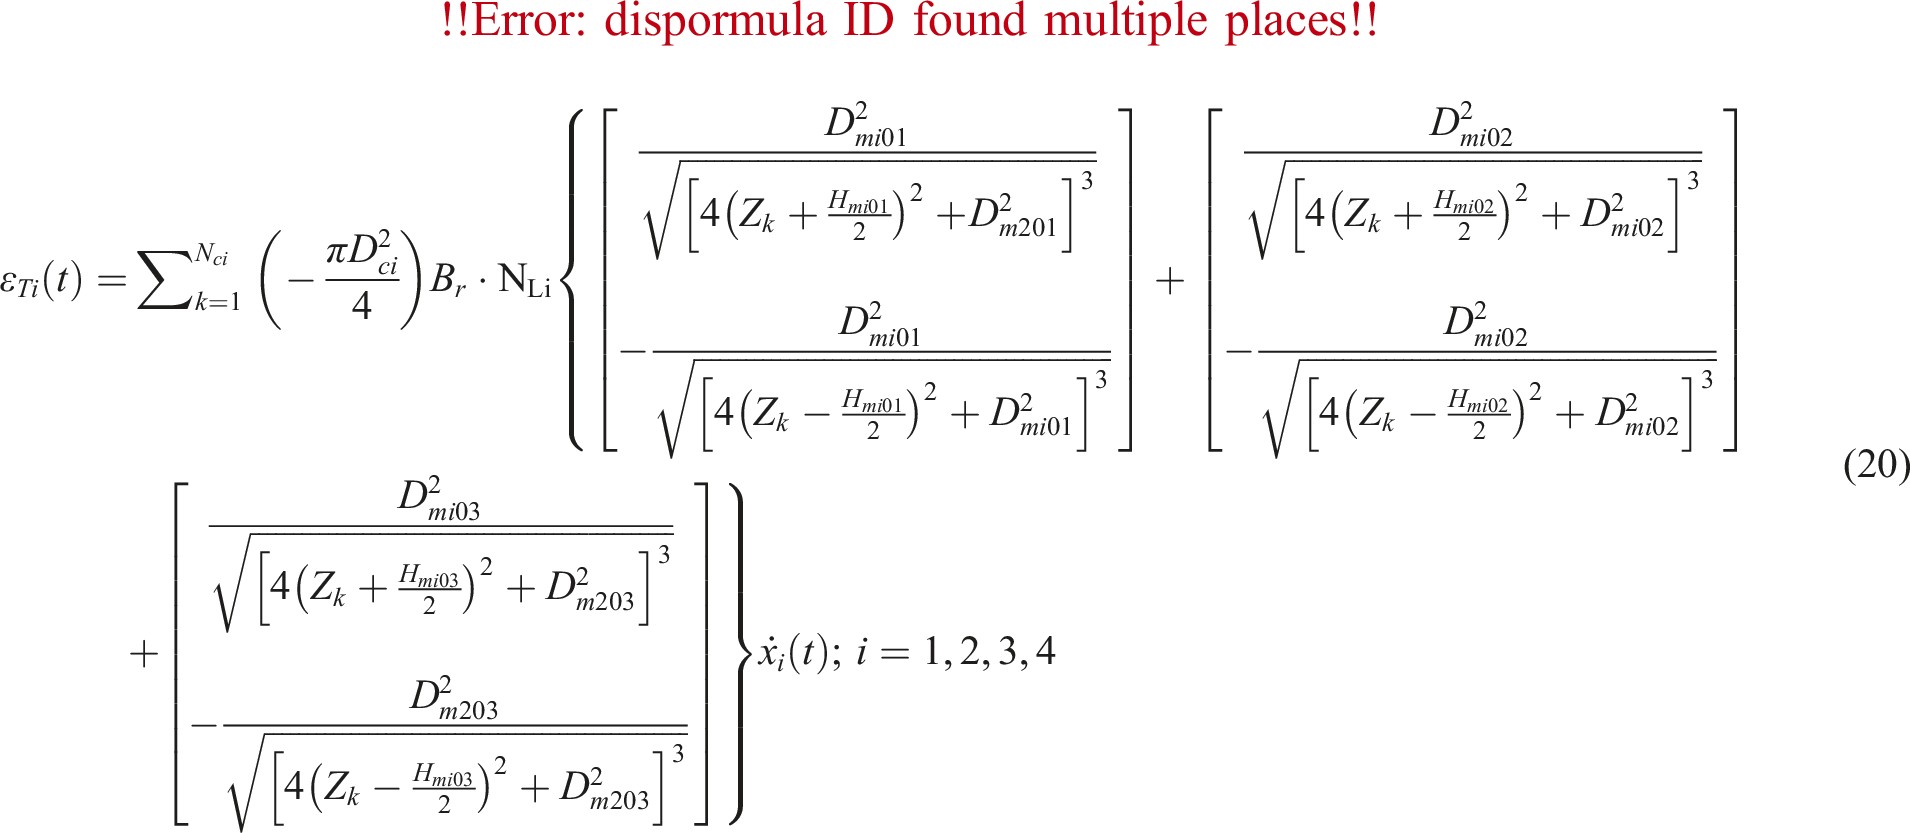
The induced electrical voltage for the right-rear, right-front, left-rear, and left-front energy harvesting devices,
The electrical power (in root-mean-square) for the right-rear, right-front, left-rear, and left-front energy harvesting devices,

Hence, the total electrical power (root-mean-square) generated by both harvesters is given by:

The transmissibility of regenerated electricity (GE) for a constant vehicle speed, defined as function of the design parameters
The acceleration of the wheels are given as

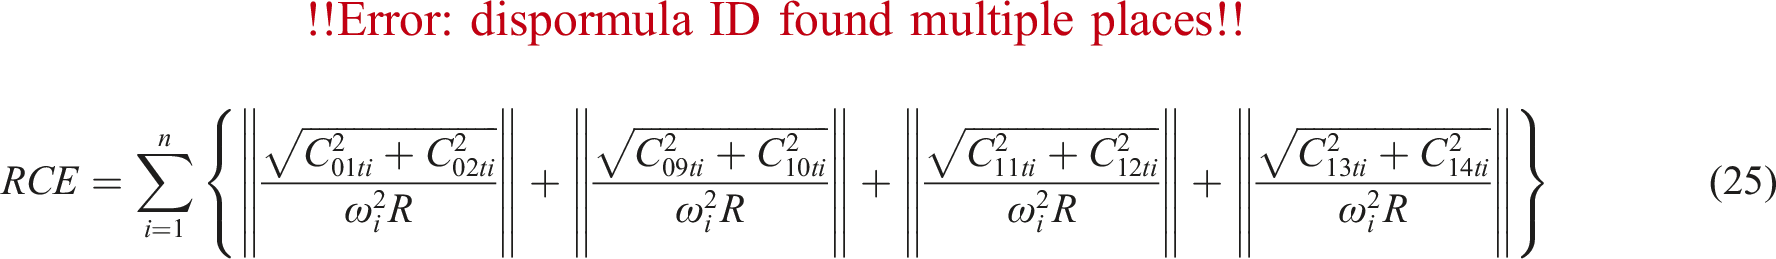
Ride comfort efficiency (RCE)
In order to optimize the design parameters of the harvesters, a Ride Comfort Efficiency (RCE) index is used to guarantee a minimum level of comfort for all passengers.37–39 The RCE is a function of
Multi-object functions
In order to find the maximum power generation of the vehicle suspension system caper under the Ride Comfort Limit (RCEc) as much as possible, the objective function of this multi-objective optimization will add a penalty factor (Fp1), when the ride comfort (RCE) corresponding to the design value is greater than the Ride Comfort Limit (RCEc), the adaptation function value (power generation) at this stage will be multiplied by the penalty factor (Penalty) to deteriorate the adaptation function to ignore the design value which cannot meet the RCEc limit value. The multi-objective function for maximizing the (1) maximum power generation rate (GE) and (2) optimal ride comfort as design objectives can be formulated as follows:

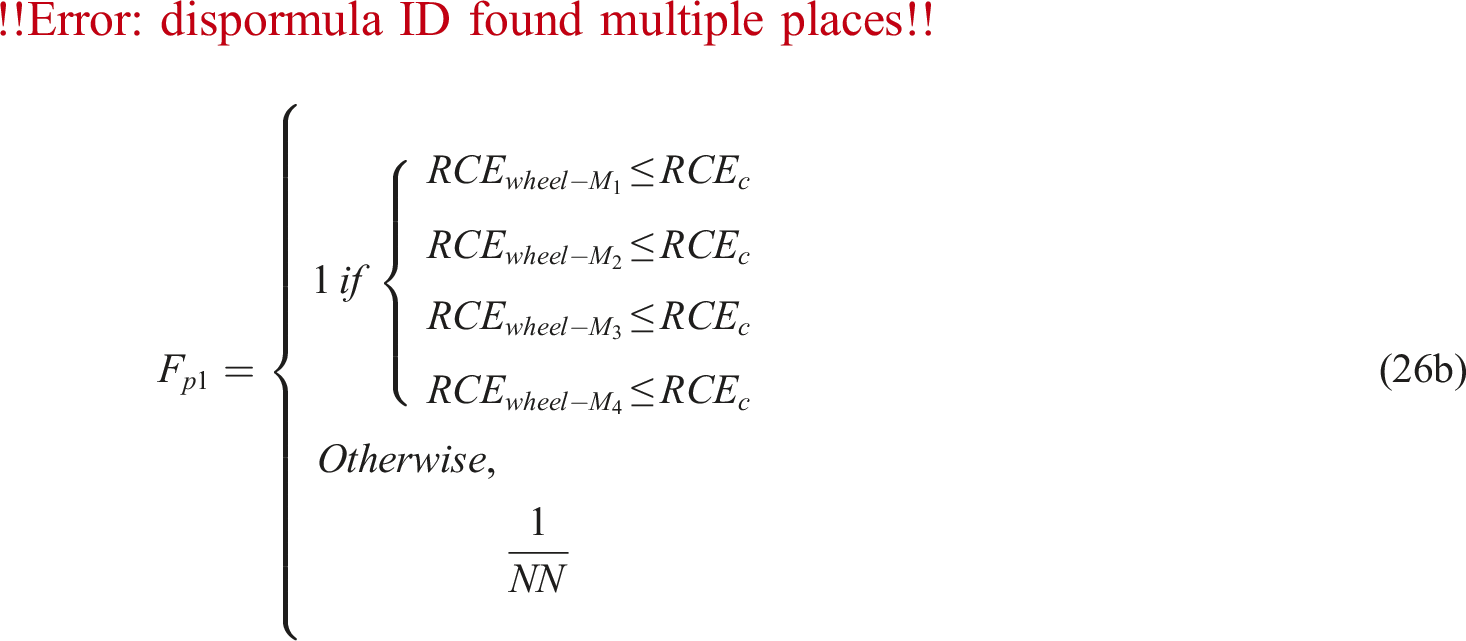
F p1 is a penalty factor for ride comfort, RCEc is a minimum threshold Ride Comfort Efficiency, and NN is the penalty order.
Sensitivity investigation
Using an example of the vehicle base plate’s length is 2.4 (m), width is 1.6 (m), Mo is 13000 (kg), and R2 (wheel radius) is 0.335(m). Under the condition that the driving speed of the 2D vehicle on the continue semi-width road is set to 60 (km/hr), and the height (AA) and width (BB) of the speed hump are the same of 0.3 (m). The sensitivity analysis of the suspension system parameters to the generated power (induced electrical power) is assessed and the results are obtained and shown in Figures 5 ˜ 9.
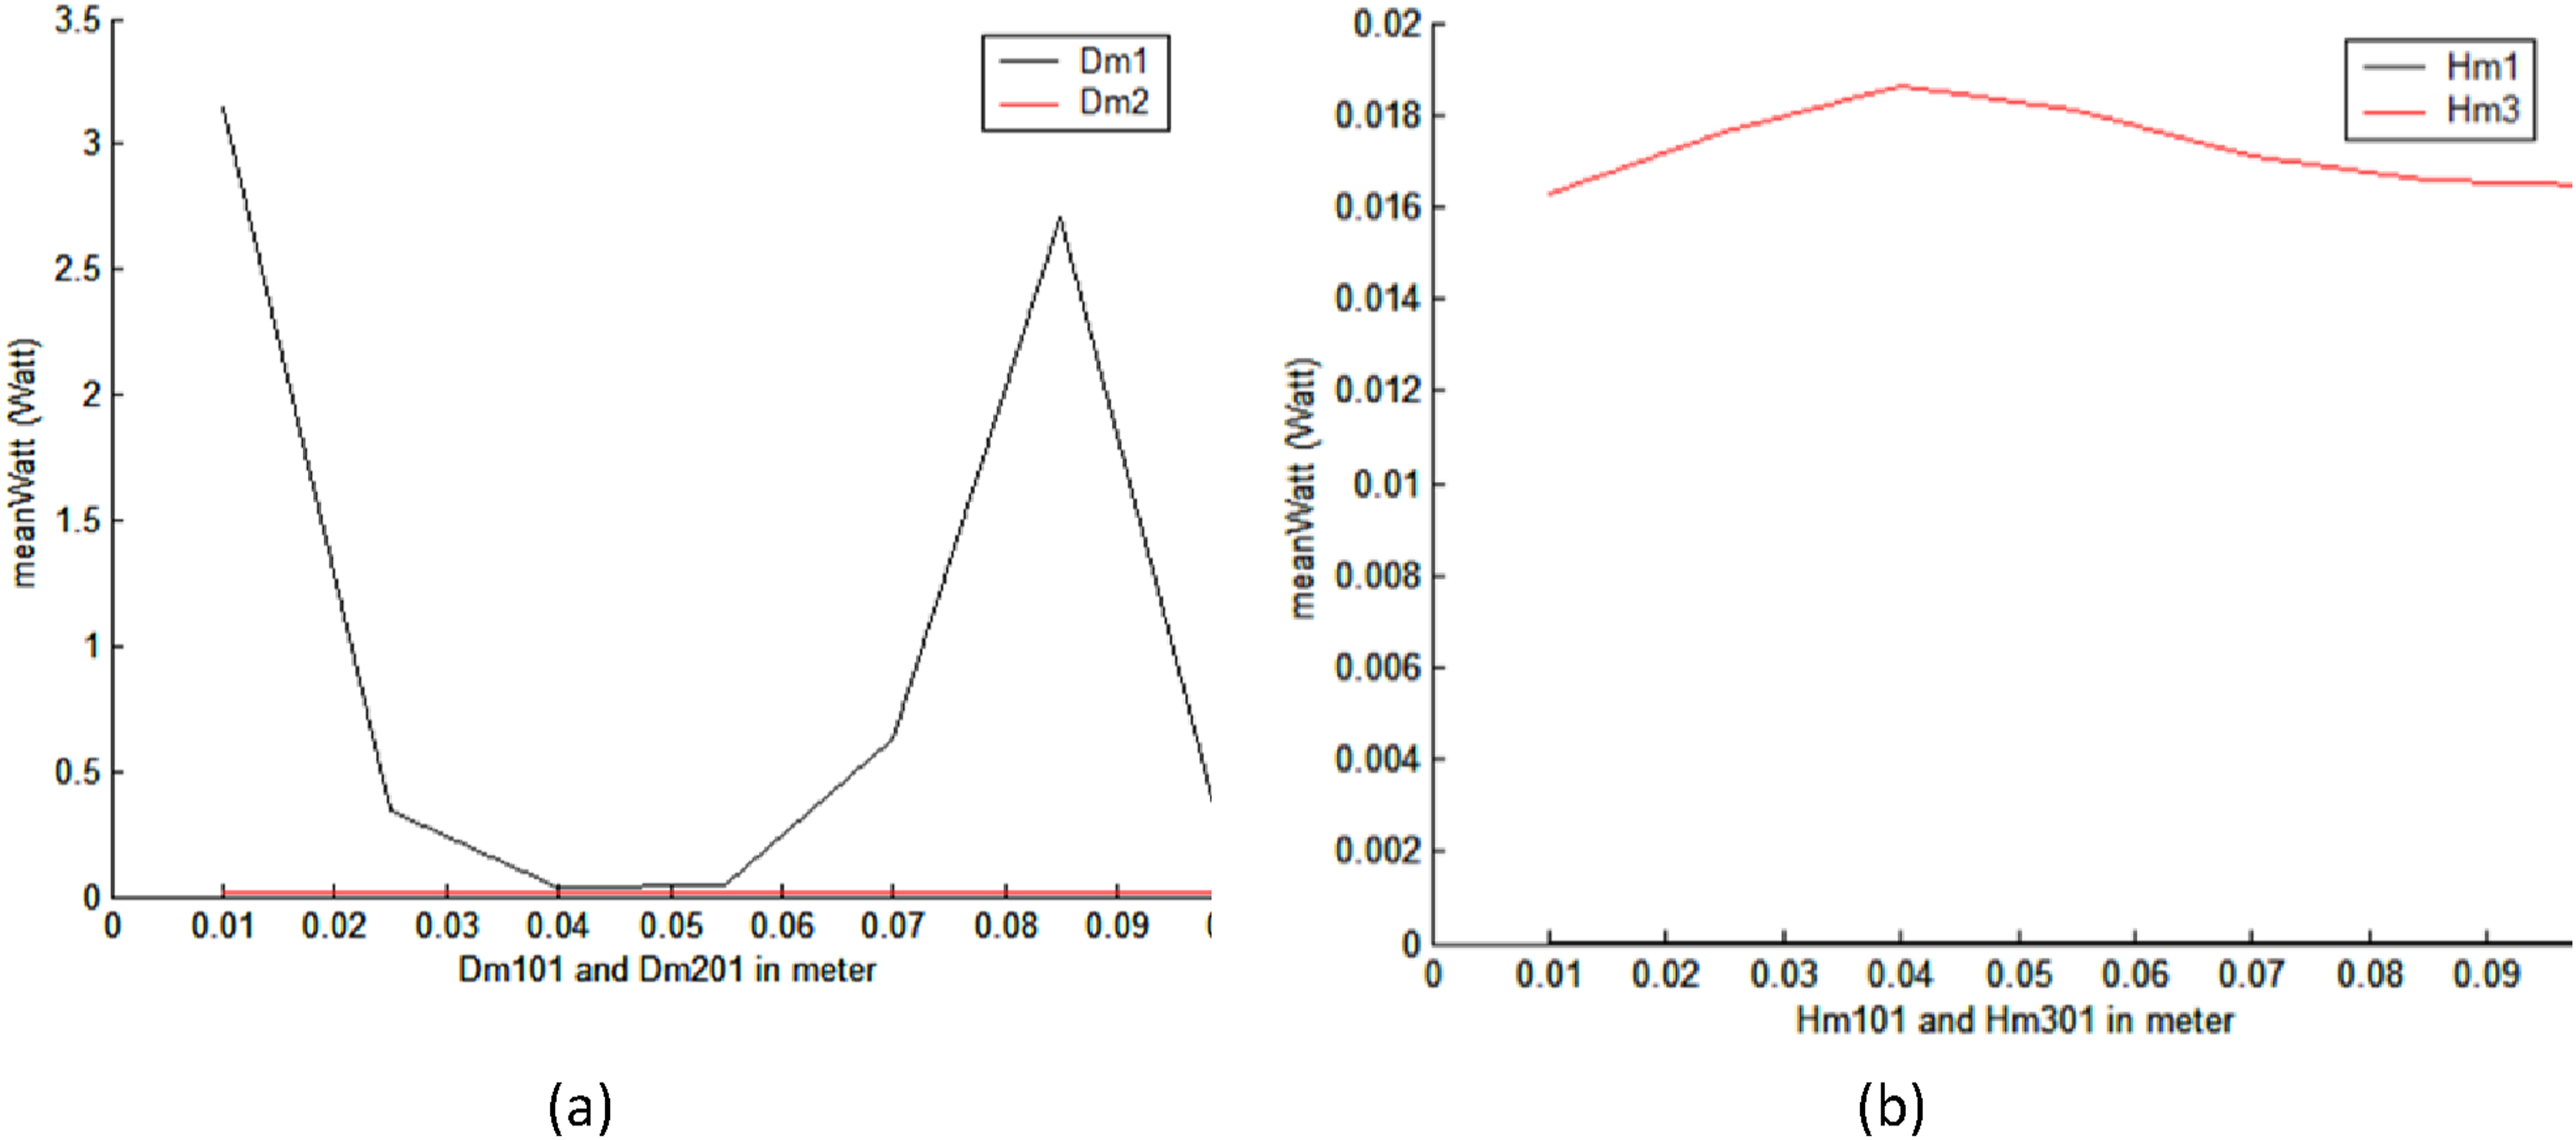
Figure 6(a) illustrates the fluctuation of the root mean square (RMS) generated electrical power of the energy harvester as the diameter, D
m1
, of magnet M
m1
is varied from 0.01 to 0.1 m. It can be observed that the response of the power output, represented by PW (RMS), to changes in D
m1
is relatively insignificant when compared to the effect of the diameter, D
m2
. Furthermore, Figure 7(b) demonstrates a nonlinear variation in power generation of the harvester as the diameter, H
m3
, of magnet M
m3
is varied from 0.01 to 0.1 m. The power output reaches its maximum value of 0.0186 W when H
m3
is equal to 0.042 m. However, the impact of the diameter, H
m1
, on power generation is relatively small. This difference in behavior could be attributed to the distinct location of each harvester and the type of motion it undergoes during the process. Relationship between the root mean square (RMS) generated electrical power and (a) diameter D
m1
and D
m2
of magnets M
m1
and M
m2
, (b) height Hm1 and Hm3 of magnets M
m1
and M
m3
.
The mass of the wheels also plays a significant role in the energy harvesting process. Figure 8(a) demonstrates that the energy harvested experiences an exponential decrease as the mass of the wheel, M
3
, increases. On the other hand, the impact on energy harvesting is relatively small when the mass of the wheel, M
4
, increases. Additionally, Figure 8(b) reveals that the energy harvested reaches its maximum power output of 310 W when the spring constant, k
21
, is set to 35,000 N/m. Furthermore, the energy function is optimized, resulting in a power output of 380 W, when the spring constant, k
41
, is equal to 68,000 N/m. Relationship between the root mean square (RMS) generated electrical power and (a) mass M3 and M4 of the back-left and front-left wheel, (b) constant k
21
and k
41
of spring located above the front-right and front-left wheel.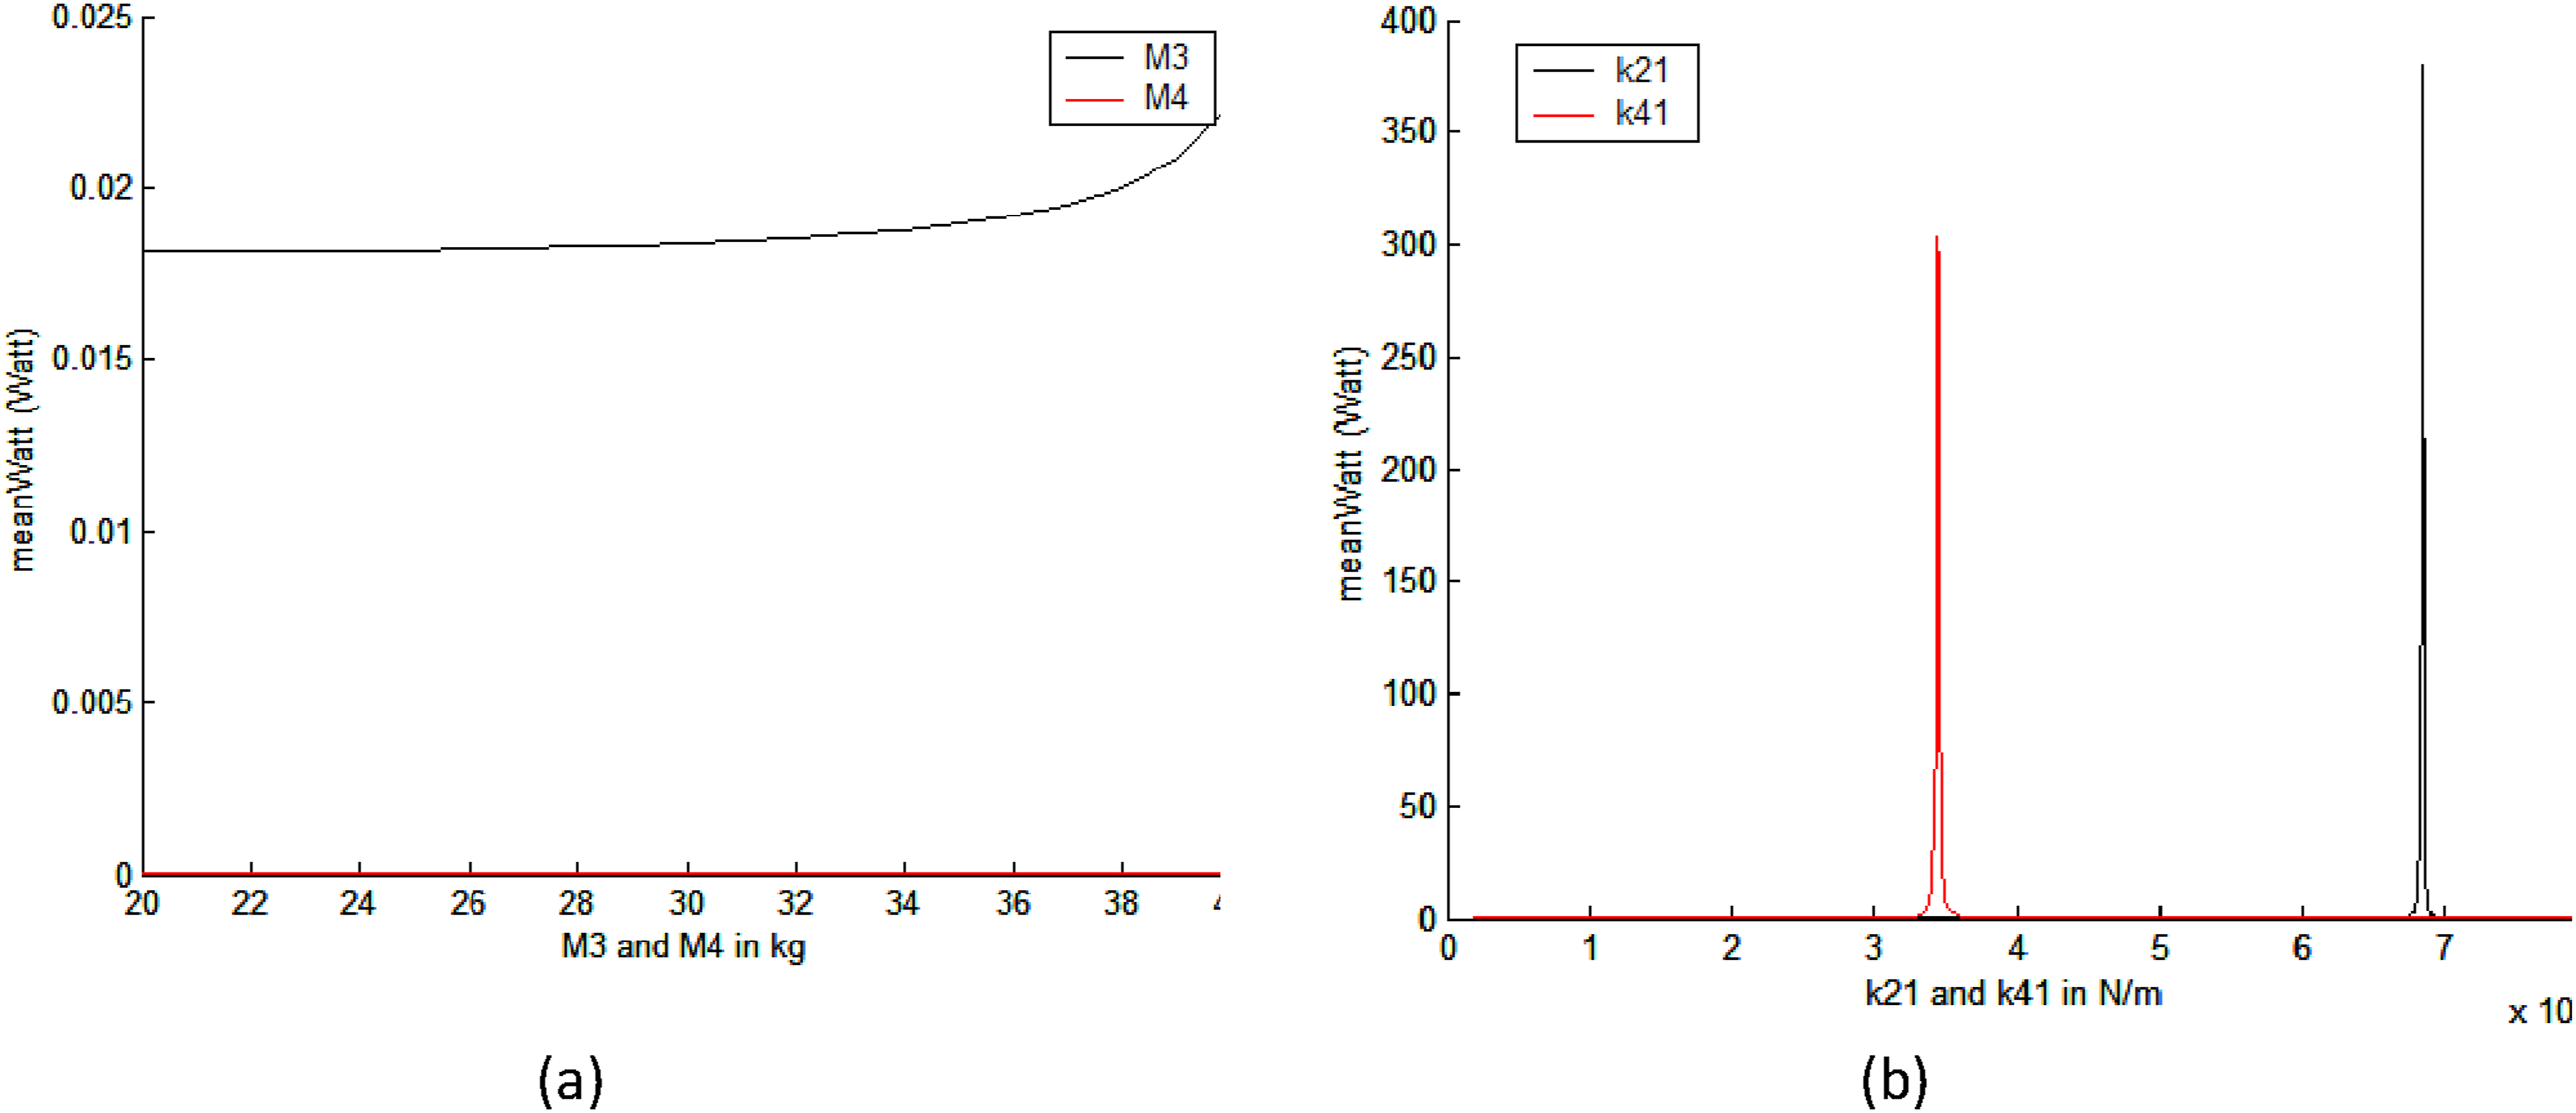
Similar to Figure 8(b) and 9(a) demonstrates that the generated power is maximized when the spring constants, k
111
and k
311
, are set to 63,000 and 6800 N/m, respectively. This observation indicates that the spring constants, k
111
and k311, exhibit resonating phenomena in relation to the generated power. Furthermore, Figure 9(b) illustrates that the generated power nonlinearly decreases as the values of the harvesters’ viscous damping, C
m111
and C
m211
, increase. Relationship between the root mean square (RMS) generated electrical power and (a) spring constant k111 and k311of the back-left, (b) viscous damping constant Cm111 and Cm211 of the back-right and front-right energy harvesters.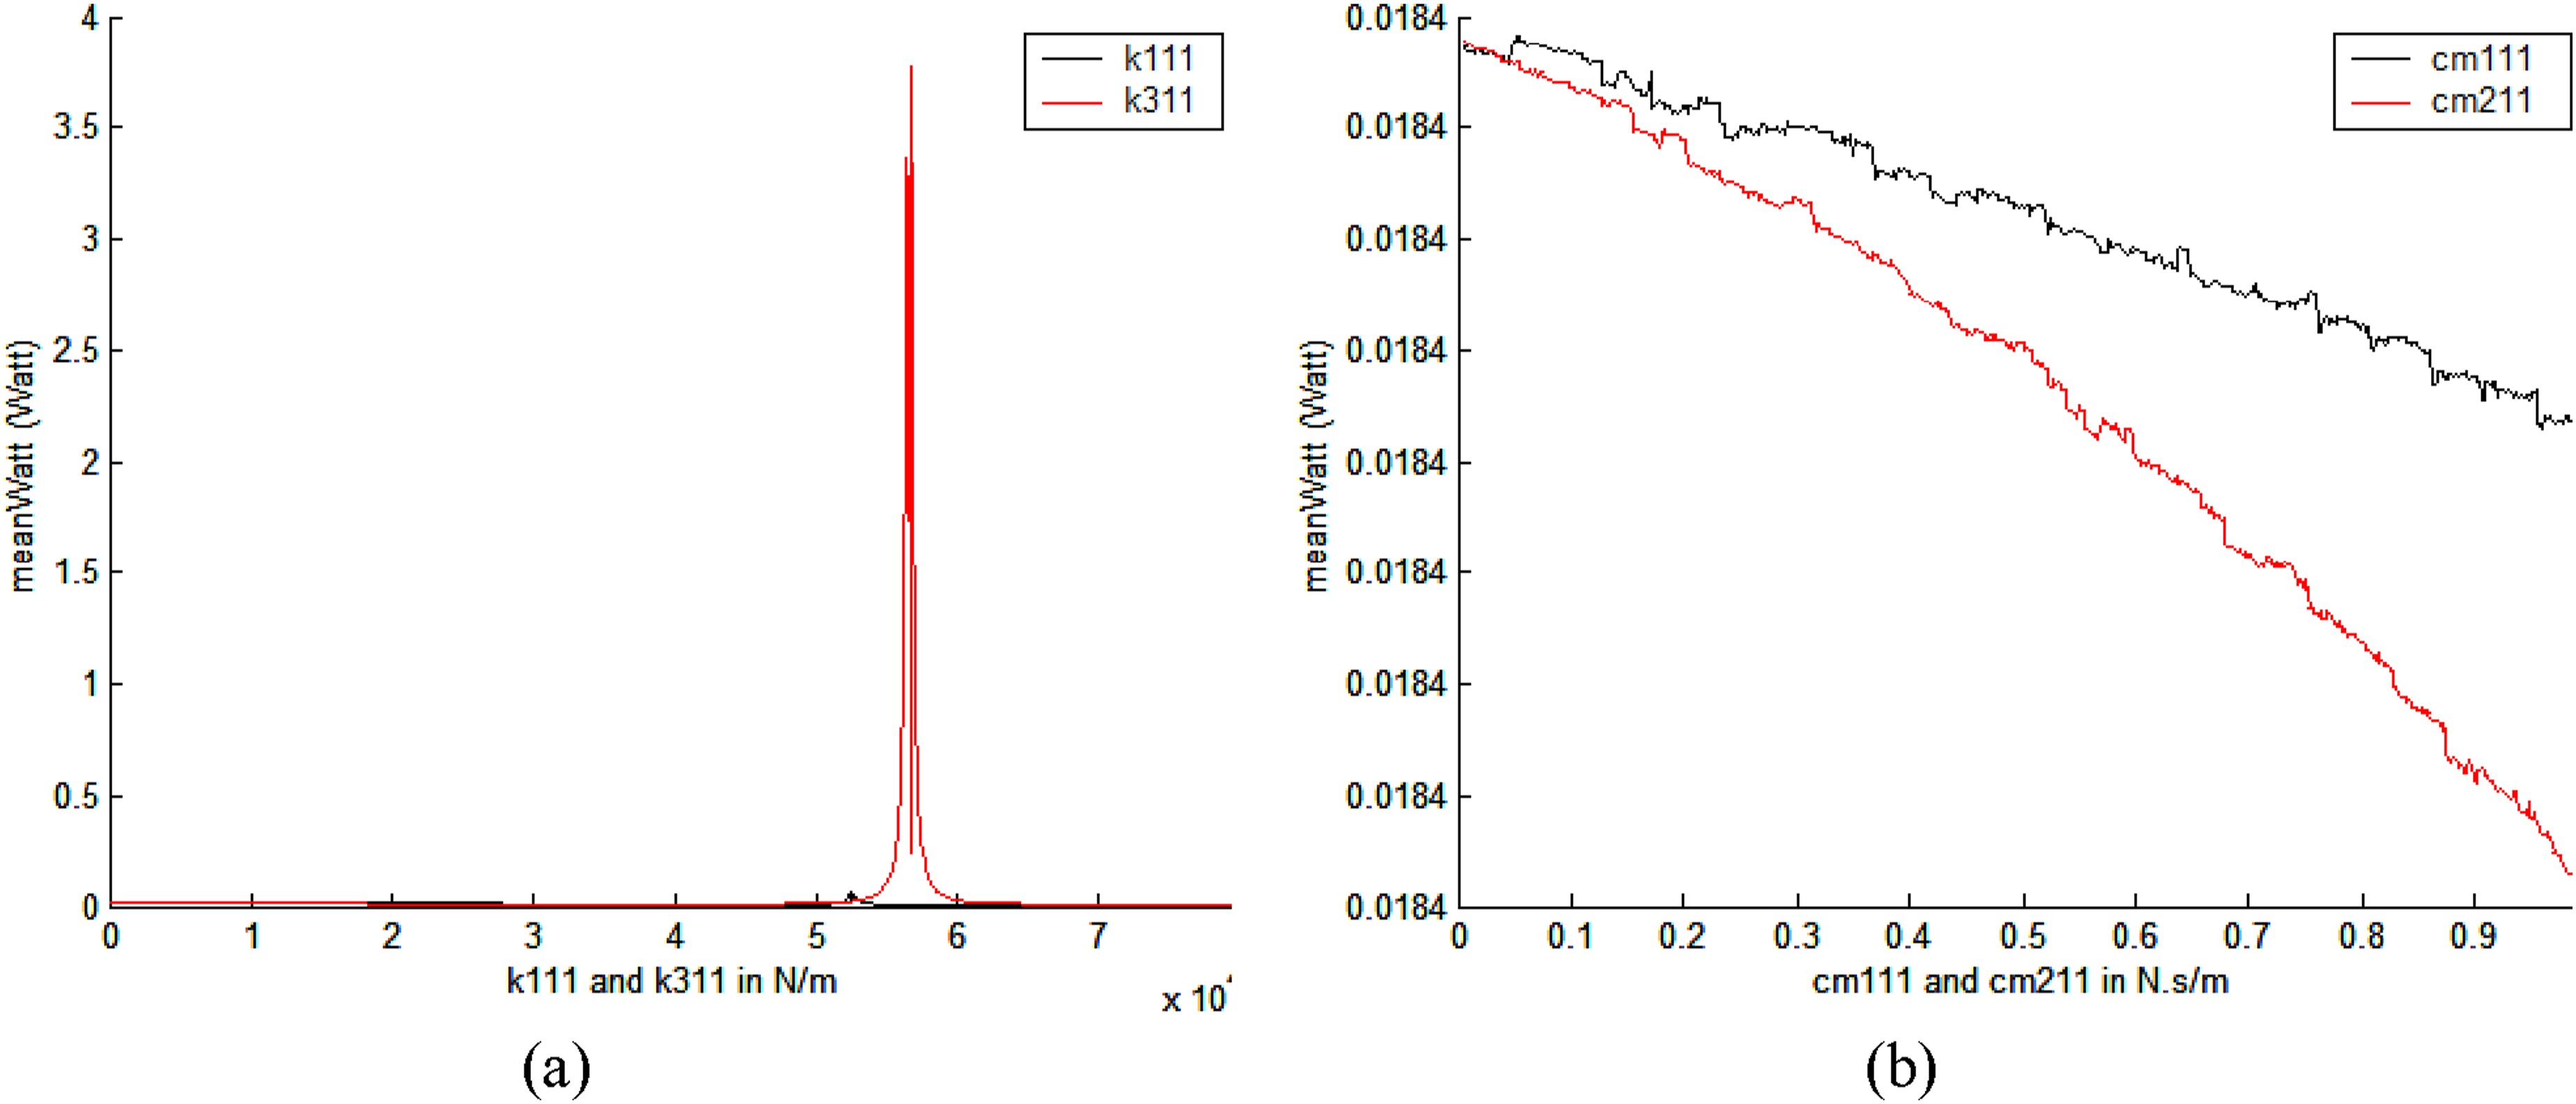
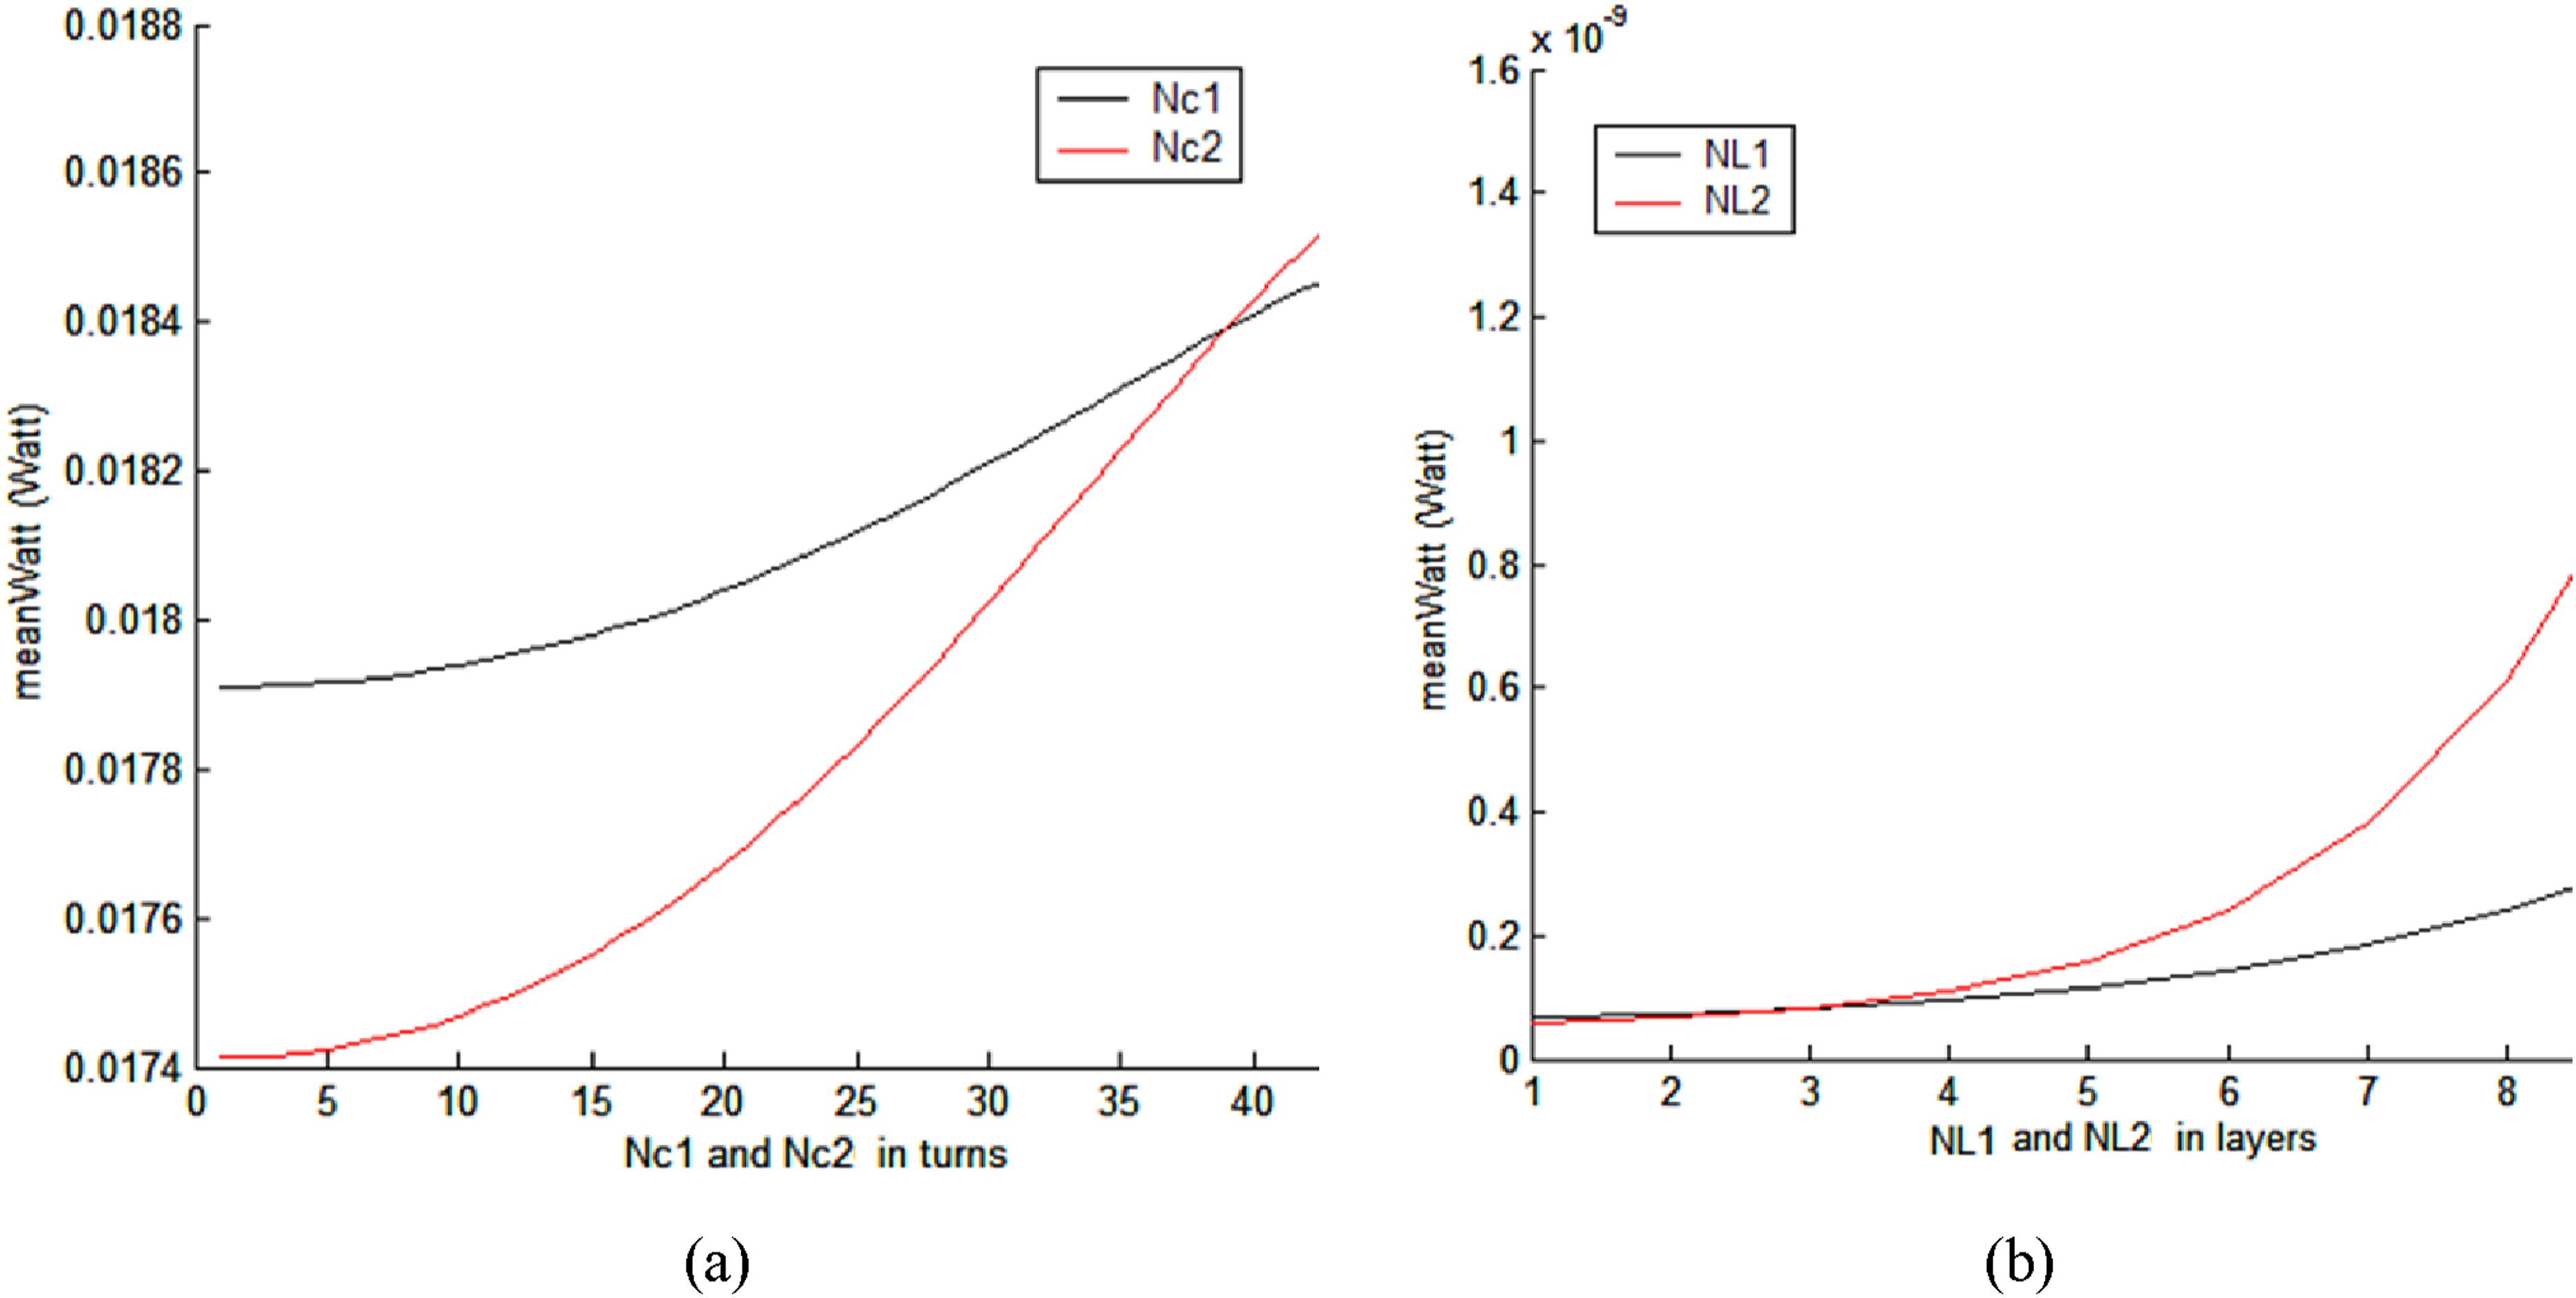
It can be seen from Figure 10(a) and (b) that as the number of turns and coil layers, N
c1
and NL1 of magnet Mm1 and N
c2
and N
L2
of magnet M
m2
, increase, the generated power increases nonlinearly. Relationship between the root mean square (RMS) generated electrical power and number of (a) coil turns N
C1
and N
C2
of magnets M
m1
and M
m2
, (b) coil layer N
L101
and N
L201
of magnets M
m1
and M
m2
.
The location of the harvesters with respect to the center of mass of the vehicle or axles also has an effect on the amount of energy harvested. Therefore, two ratios are defined to reflect the location of the harvesters: μ
1
= [L
1
/(L
1
+L
2
)] and μ
2
= [L
3
/(L
3
+L
4
)] where the variables L
1
, L
2
, L
3
and L
4
are shown in Figures 2–4. The results of the simulation of the generated power as a function of μ1 and μ2 are shown in Figure 11(a). It is observed that whenμ1is equal to 0.45, the generated power reaches 8.2*10−11. And, the generated power increases whentμ2increases.As shown in Fig. 11(b), the electrical power reaches 3.7*10−3 W and 3*10−3 as the car velocity is at 30 km/hr and 48 km/hr, respectively. As observed in Figure 11(c). And, the power function is proportional to the height of the speed bump. Relationship between the root mean square (RMS) generated electrical power and the ratio (a) μ
1
[ = L
1
/(L
1
+L
2
) vehicle’s longitudinal direction] and μ
2
[ = L
3
/(L
3
+L
4
) in vehicle’s transverse direction]under the height (AA), width (BB)of 0.3 (m), and 0.6 (m), (b) car velocity, (c) height of bump. 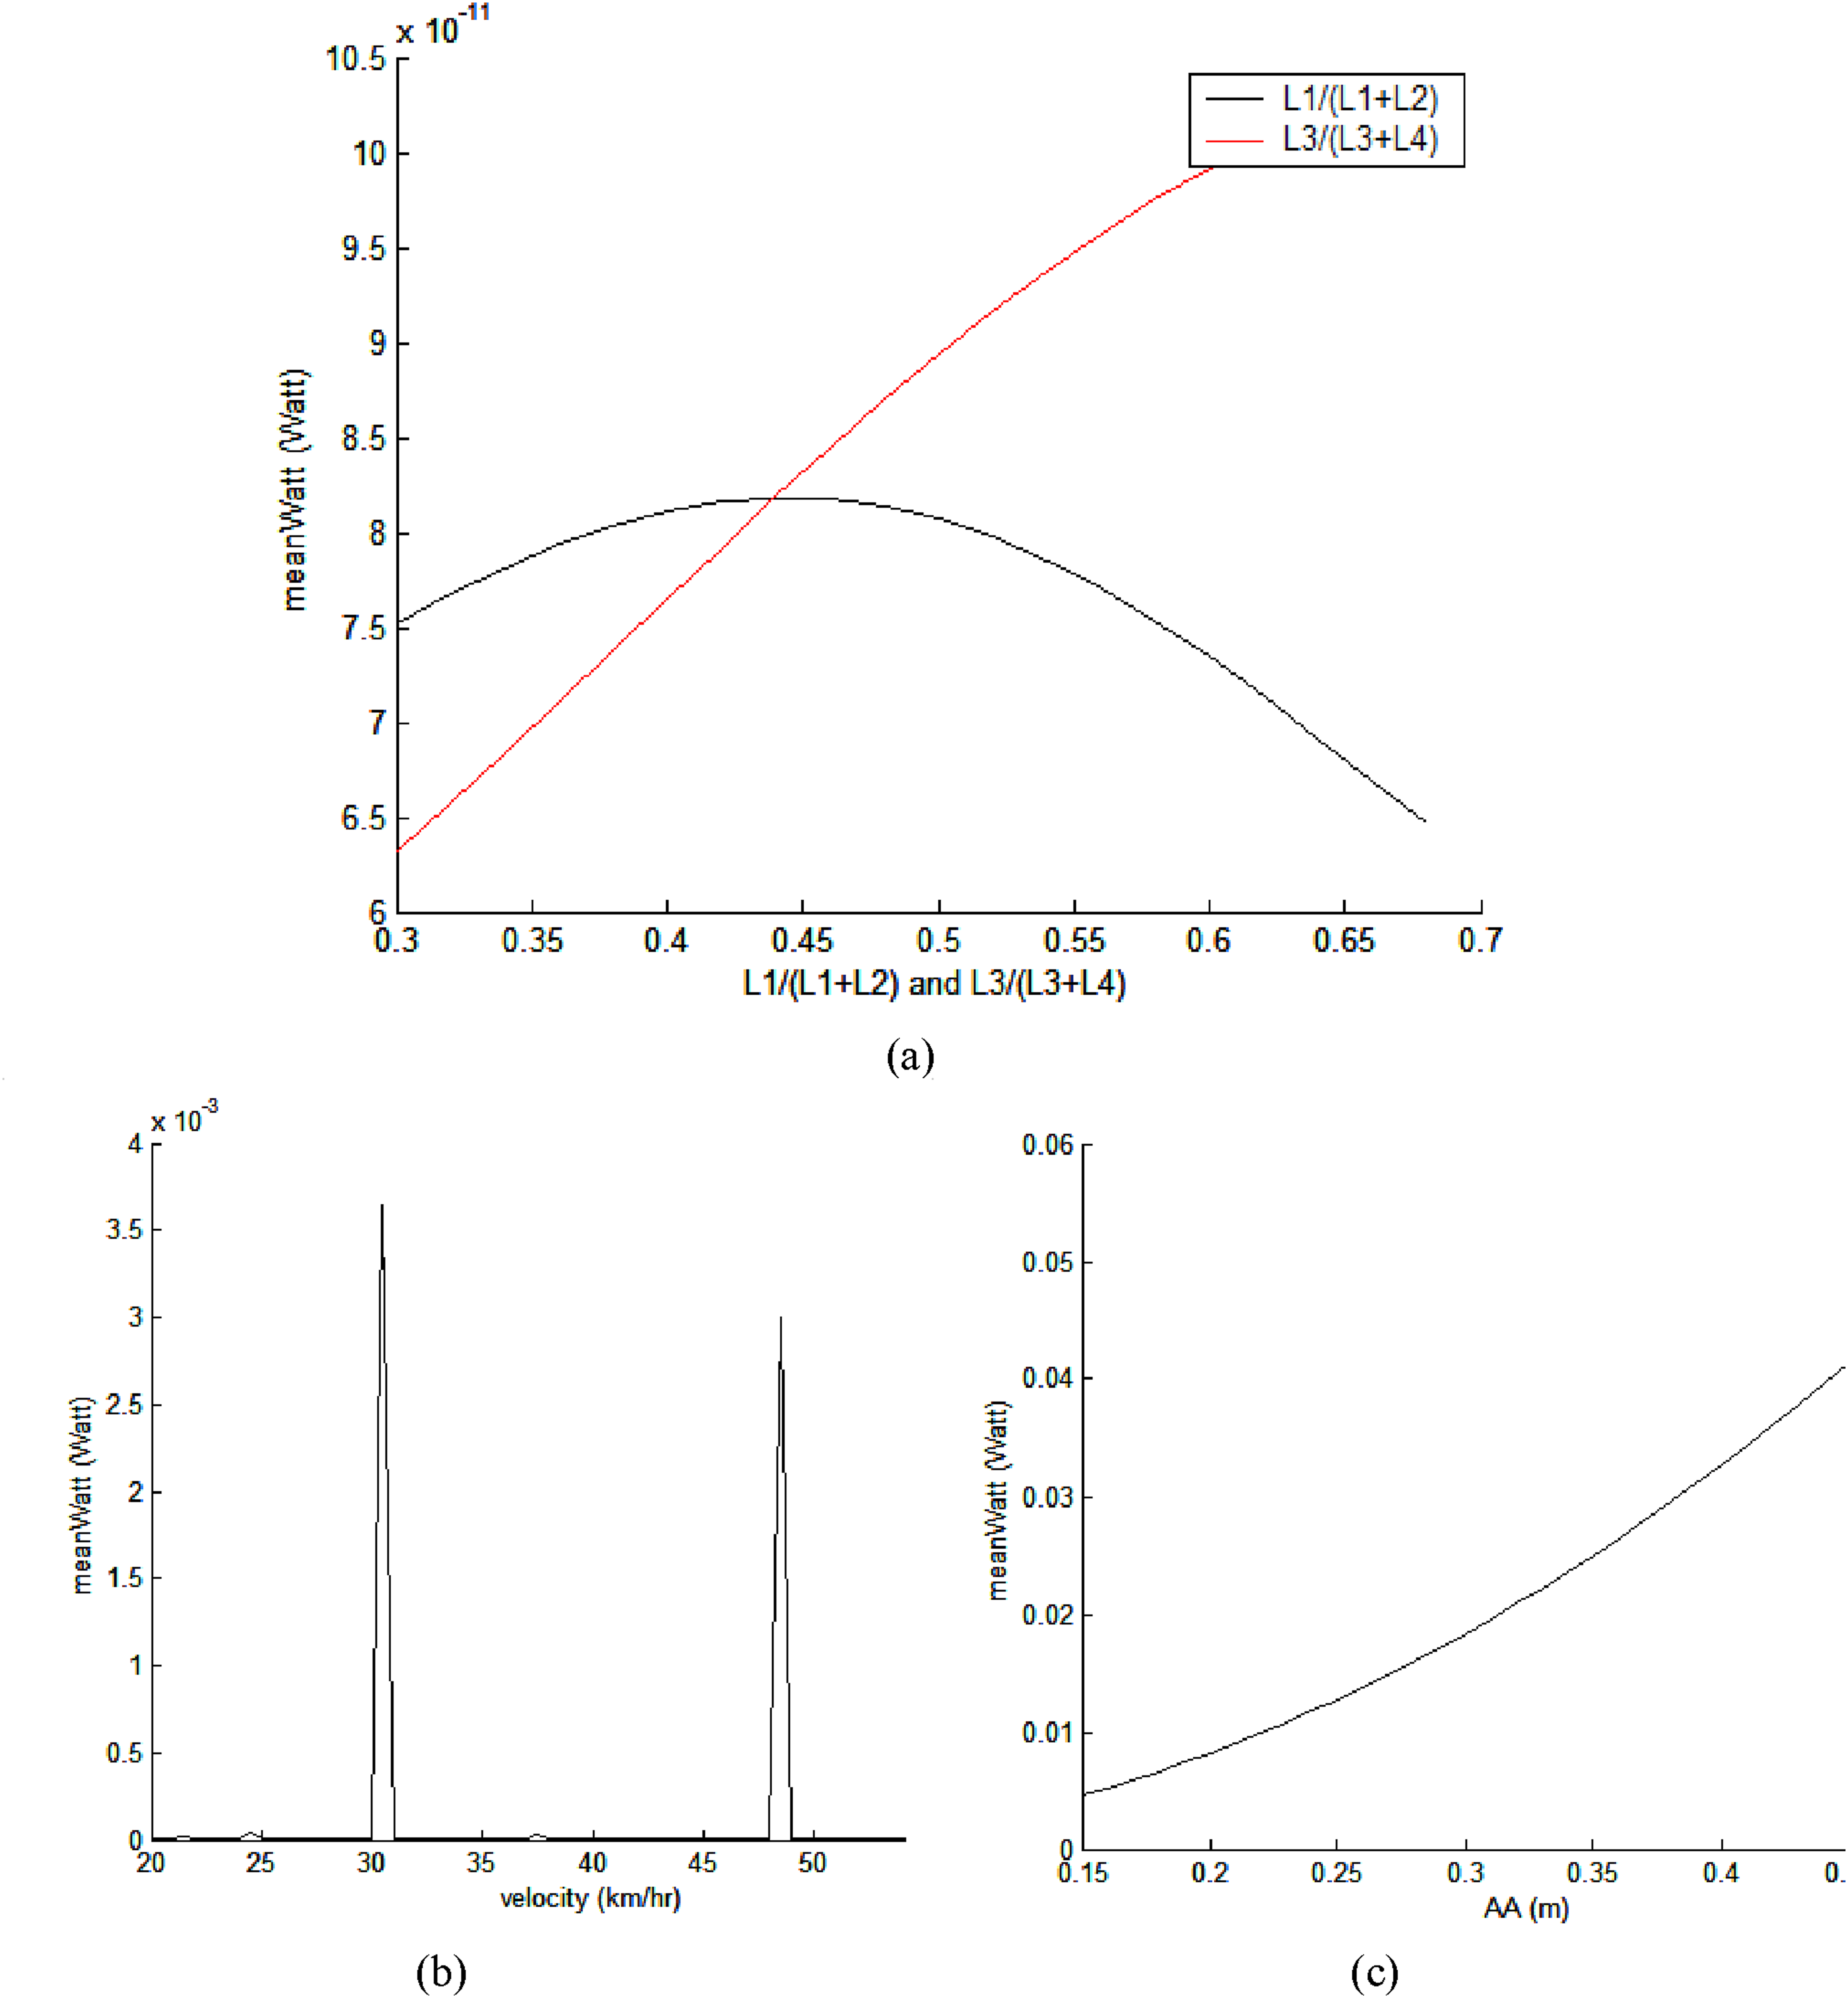
Case studies for harvester design validation
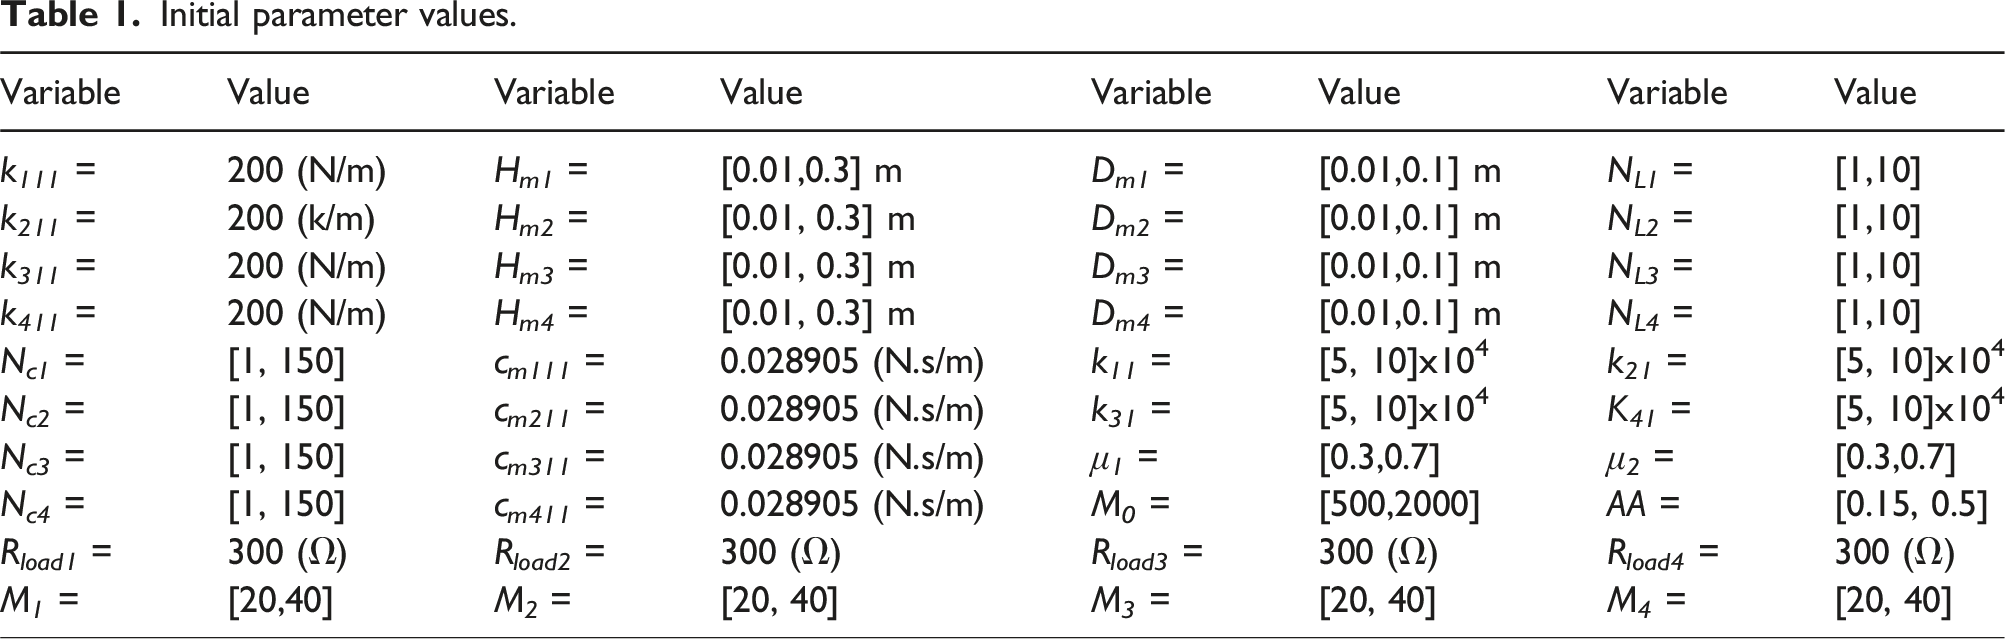
Based on the study from Lin et al., 41 k12 = 183887.0(N/m), k22 = 183887.0, k32 = 183887.0(N/m), k42 = 183887.0, C12 = 0(N.s/m), C22 = 0(N.s/m), C32 = 0(N.s/m), C42 = 0(N.s/m), cm111 = 0.028905(N/m/s), Cm211 = 0.028905(N/m/s), Cm311 = 0.028905(N/m/s), and Cm411 = 0.028905(N/m/s). The initial parameters are placed to k111 = 200(N/m), k211 = 200 (k/m), k311 = 200(N/m), k411 = 200 (k/m). The ranges of parameters are defined as Dm1 = Dm2 = Dm3 = Dm4 = [0.01, 0], Hm1 = Hm2 = Hm3 = Hm4 = [0.01, 0.3], Nc1 = Nc2 = Nc3 = Nc4 = [1, 150], NL1 = NL2 = NL3 = NL4 = [1,10], Cm111 = Cm211 = Cm311 = Cm411 = 0.028905(N.s/m), Rload1 = Rload2 = Rload3 = Rload4 = 300(Ω), and dc = 0.001(m). Using an example, the parameters of the vehicle body are L1 + L2 = 2.4(m), W = 1.6(m), and R2 (wheel radius) = 0.67(m). The maximum power generation rate (GE) are sought under the conditions of continuous half-width pavement while the uncomfortable ride is limited (RCEC). k 12 = 183887.0(N/m), k 22 = 183887.0(N/m), k 32 = 183887.0(N/m), k 42 = 183887.0(N/m), C 12 = 0(N.s/m), C 2 = 0(N.s/m), C32 = 0(N.s/m), C 42 = 0(N.s/m), C m111 = 0.028905(N.s/m), C m211 = 0.028905(N.s/m), C m311 = 0.028905 (N.s/m), C m411 = 0.028905(N.s/m).
Initial parameter values.
preset values of the parameters.
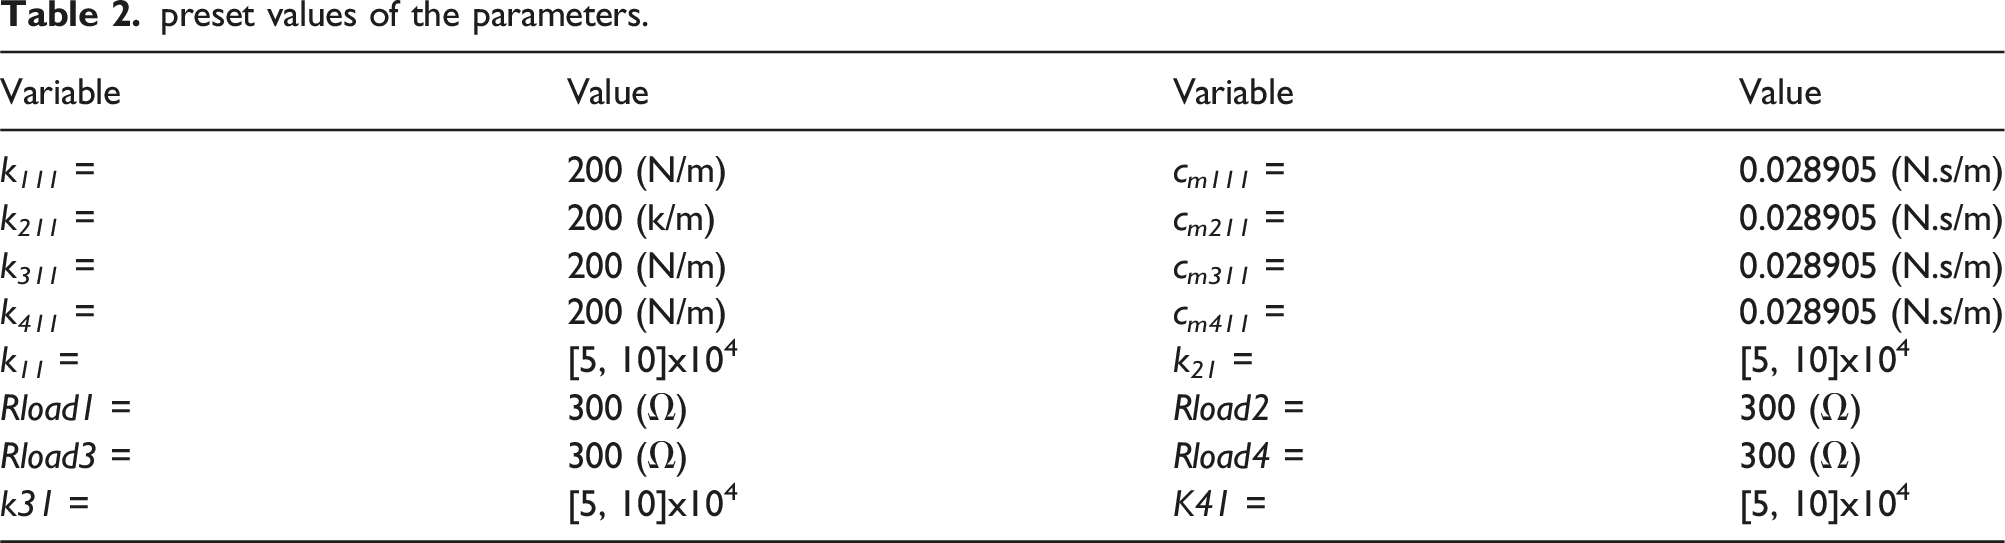
The maximum power generation and maximum power transfer rate (GE) are computed under the conditions of intermittent half-width pavement while the ride comfort efficiency index is kept above a threshold (RCEC).
Numerical assessment
GA optimize
The concept of Genetic Algorithms, initially formalized by Holland
42
and subsequently refined for functional optimization by Jong,
43
revolves around employing optimization search strategies inspired by the principles of natural selection as proposed by Darwin. To optimize the objective function (OBJ), we defined the set of design parameters (Y1, Y2, …, Yk). The bit length of the chromosome (bit) was initially selected, followed by mapping the interval [Lb, Ub]k of the design parameter Yk to the binary value range. The encoding from Y to BtoD is exemplified in equation (27)
The initial population was established through randomization. The parameter set was encoded into a string, forming a chromosome representation. Through the evaluation of the objective function (OBJ), the set of chromosomes [BtoD1, BtoD2, …, BtoDk]—which transitioned from binary to decimal form—was assigned a fitness score through the decoding of the transformation system

To incorporate genetic elitism, tournament selection—entailing a random comparison of relative fitness between pairs of chromosomes—was employed. Throughout the GA optimization, a pair of offspring was generated from the selected parents through uniform crossover with a probability of pc. The mechanism of uniform crossover is adopted. Utilizing randomly generated masked genes, internal exchange of gene information between parents occurred if the mapping gene was set to 1. In the genetic realm, mutation took place with a probability of pm, introducing a novel, unforeseen point into the search domain of the GA optimizer. Similarly, through the use of randomly generated masked genes, the mapped gene underwent conversion from 1 to 0 or from 0 to 1 if the mapping gene was set to 1.
To safeguard the retention of the optimal gene and enhance optimization accuracy during reproduction, an elitism scheme was devised. This scheme involved preserving the best gene (one pair) in the parent generation using the tournament strategy, thus contributing to the overall improvement of the optimization process. The process concluded upon surpassing a pre-selected value of itermax for the number of generations.44–48
The operations detailed within the GA method are visually represented in Figure 12, showcasing the adoption of a tournament scheme for gene elitism and employing uniform crossover for gene crossover, as depicted. Meanwhile, Figure 13 provides a block diagram depicting the GA optimization specifically applied to the energy harvesting design. The scheme of GA operation. The block diagram of GA optimization.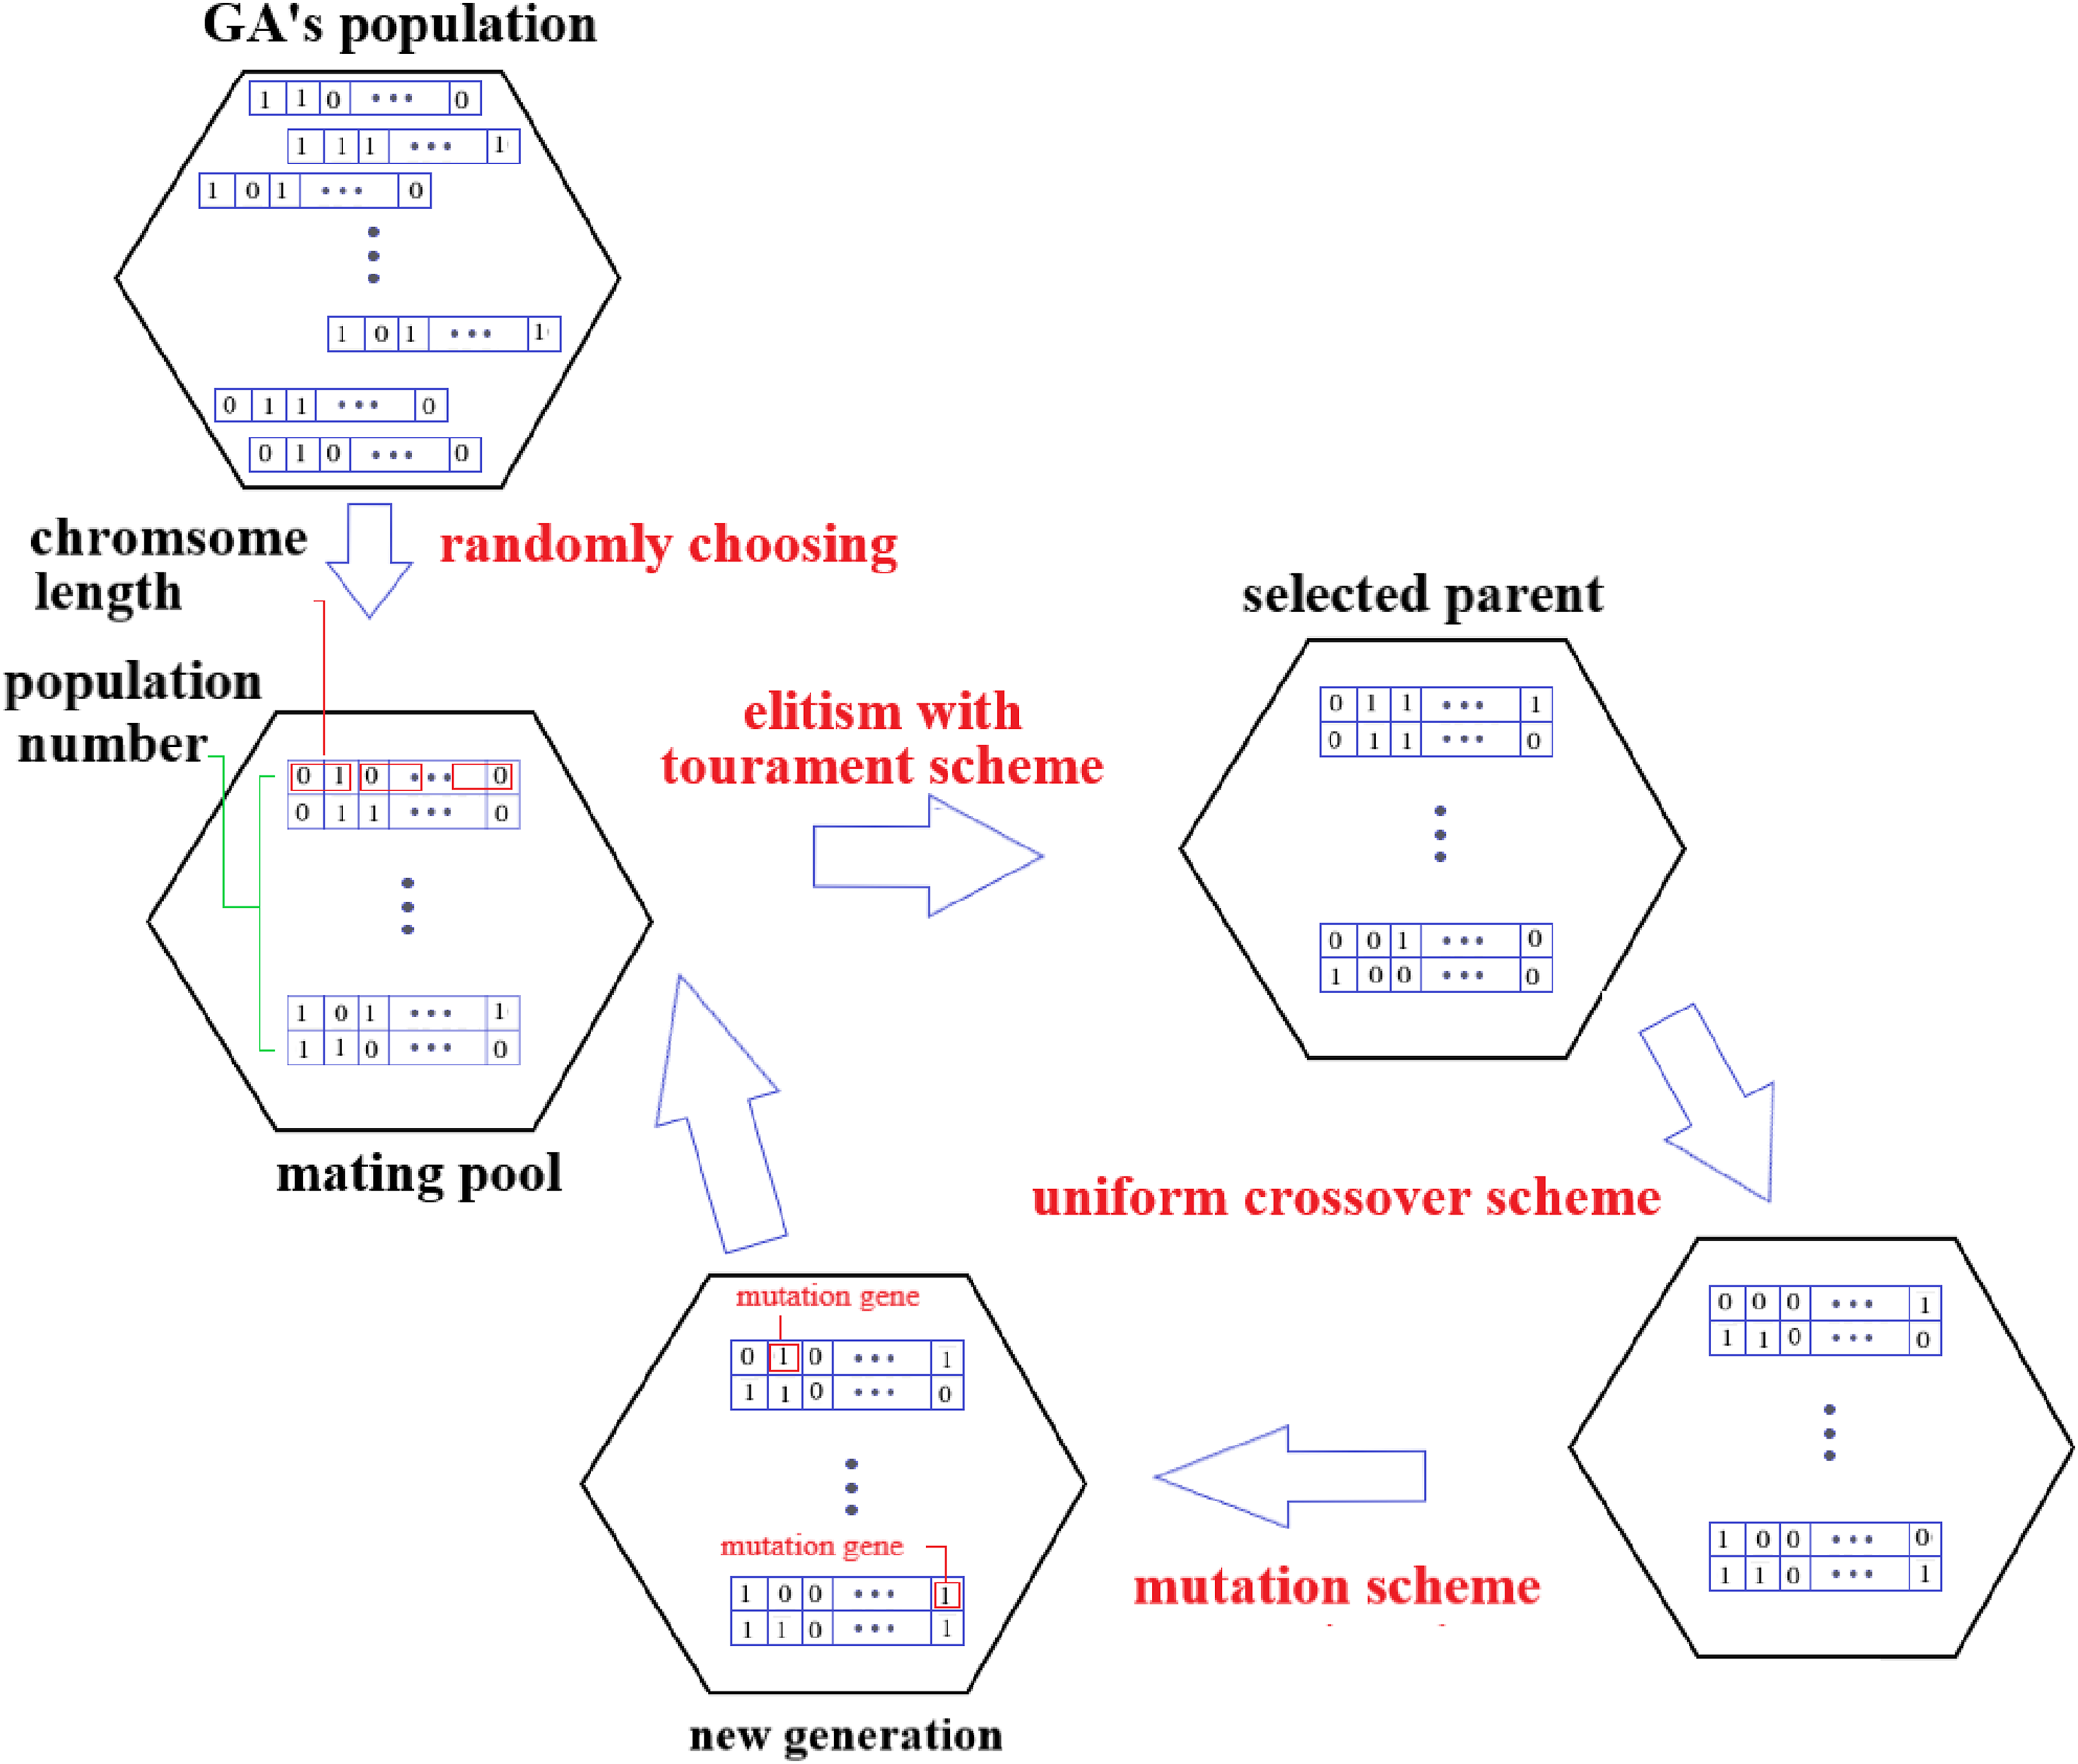
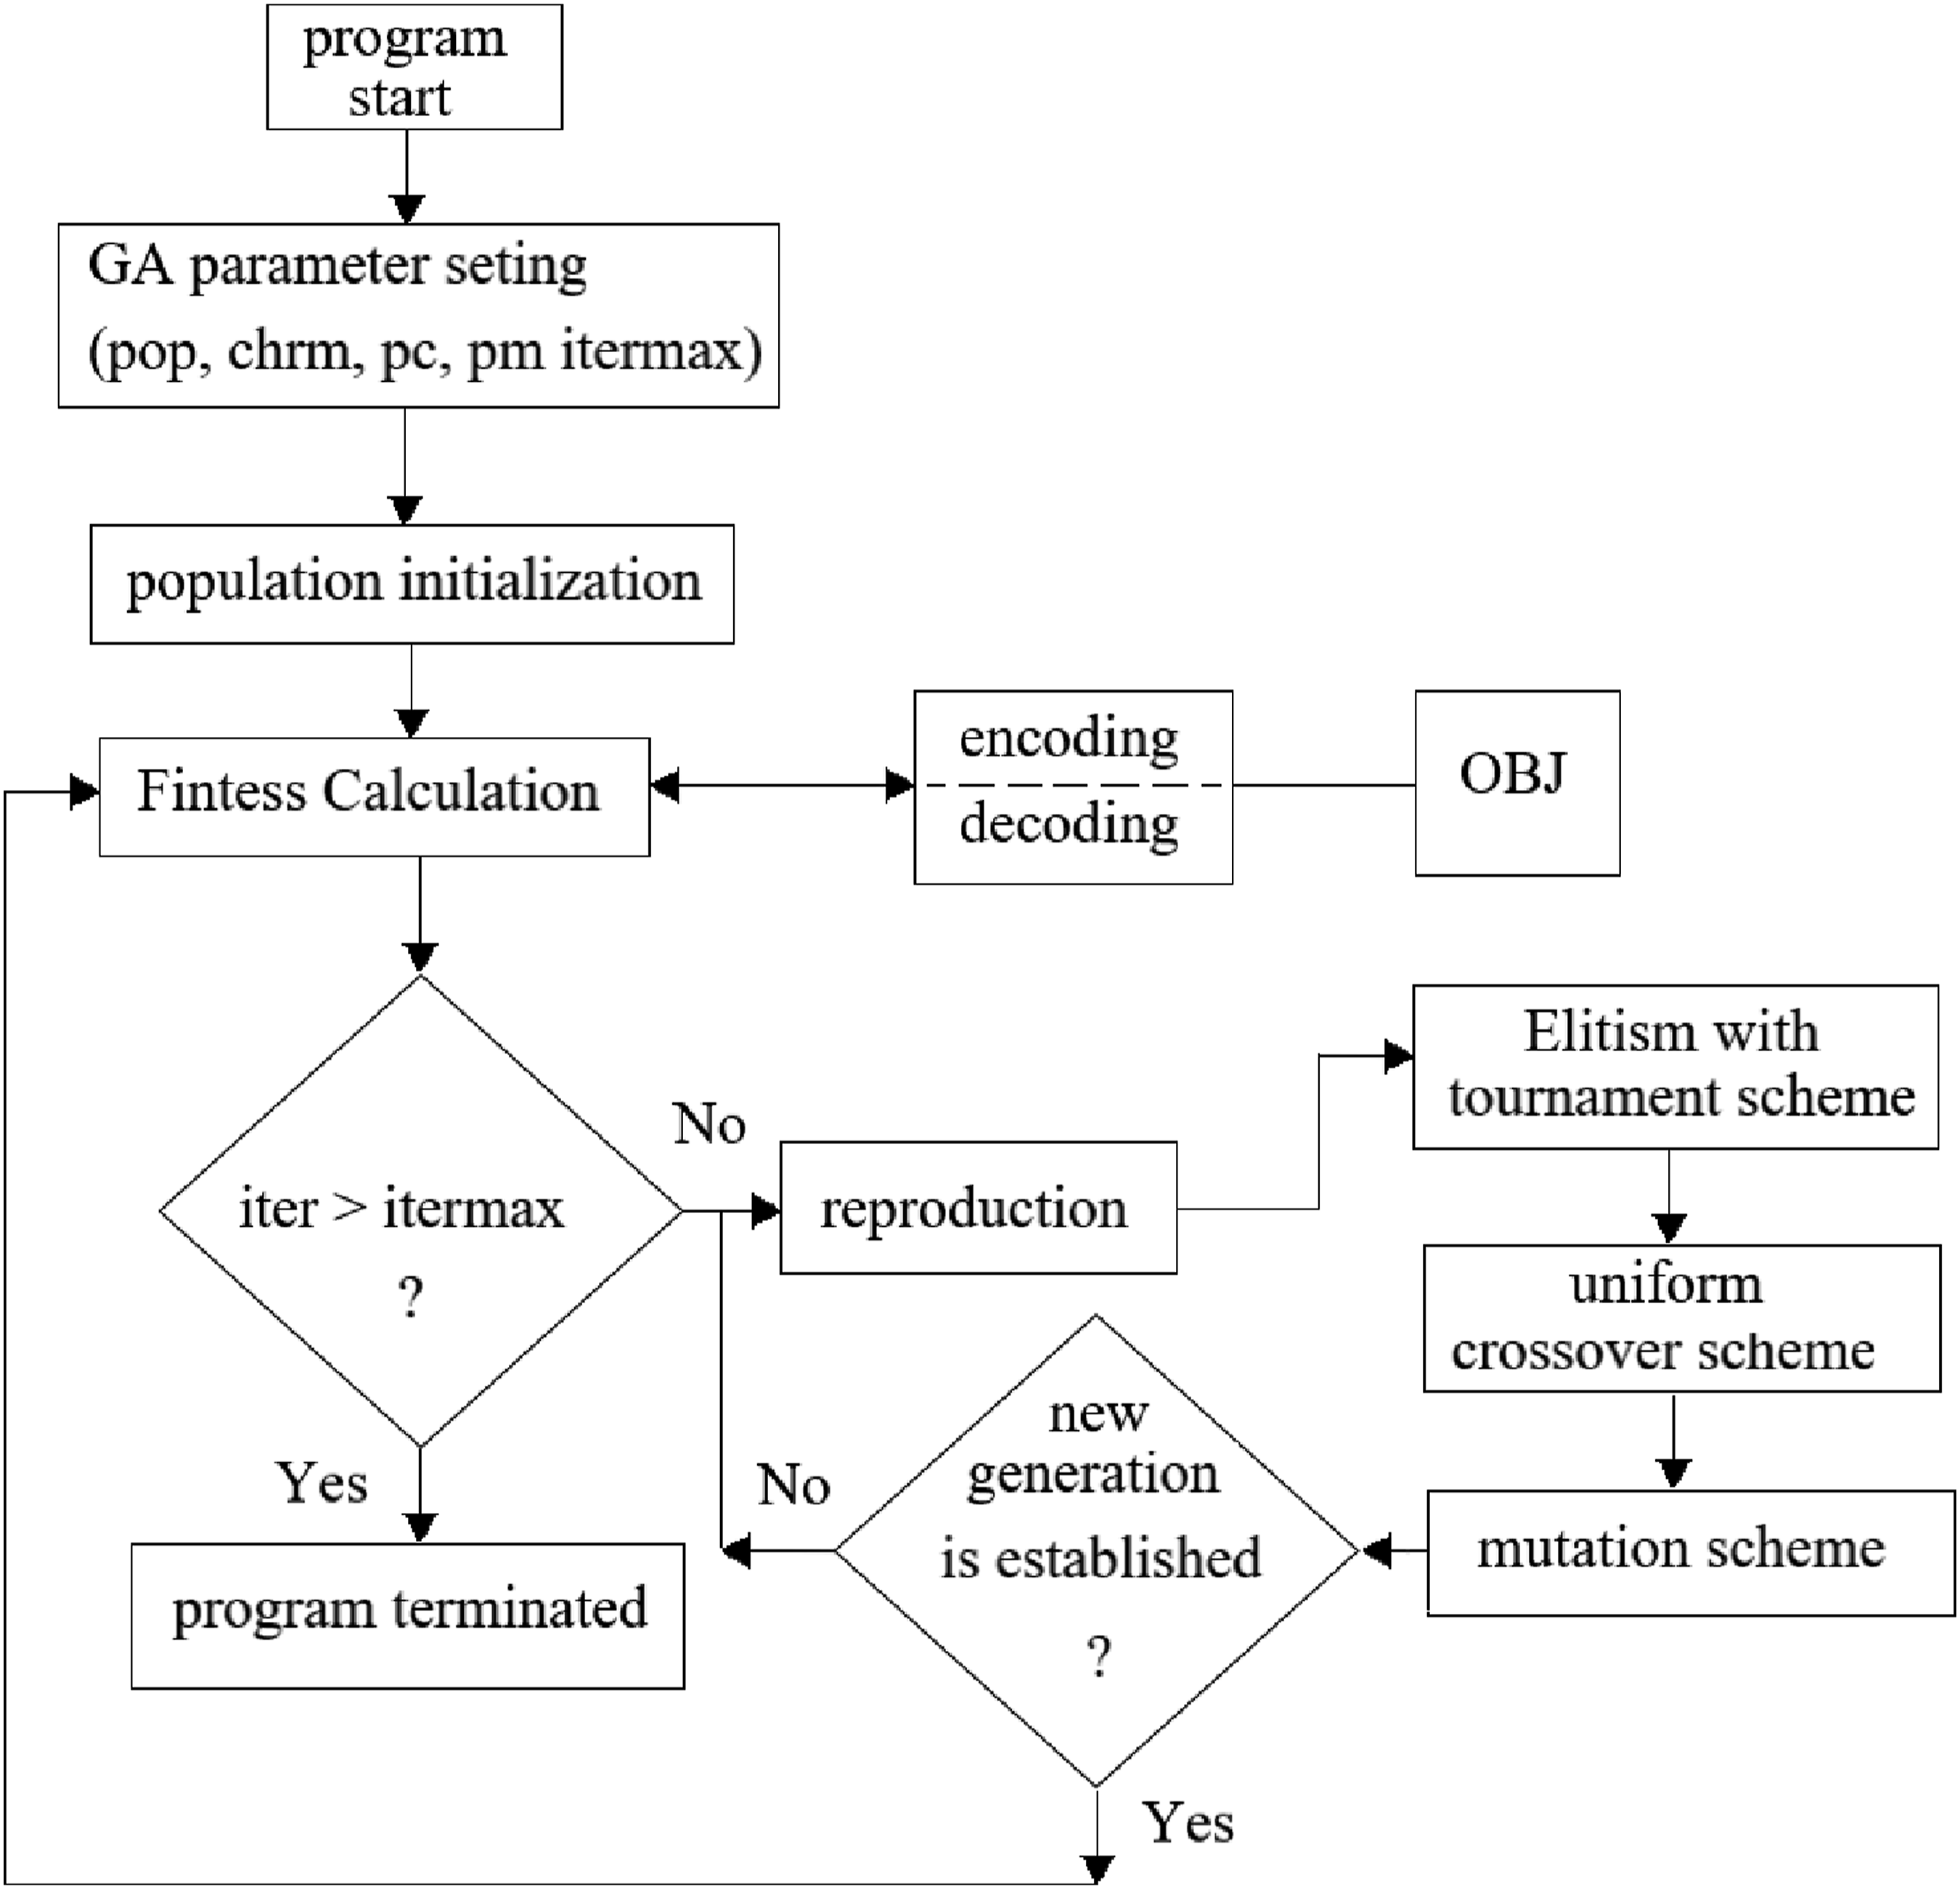
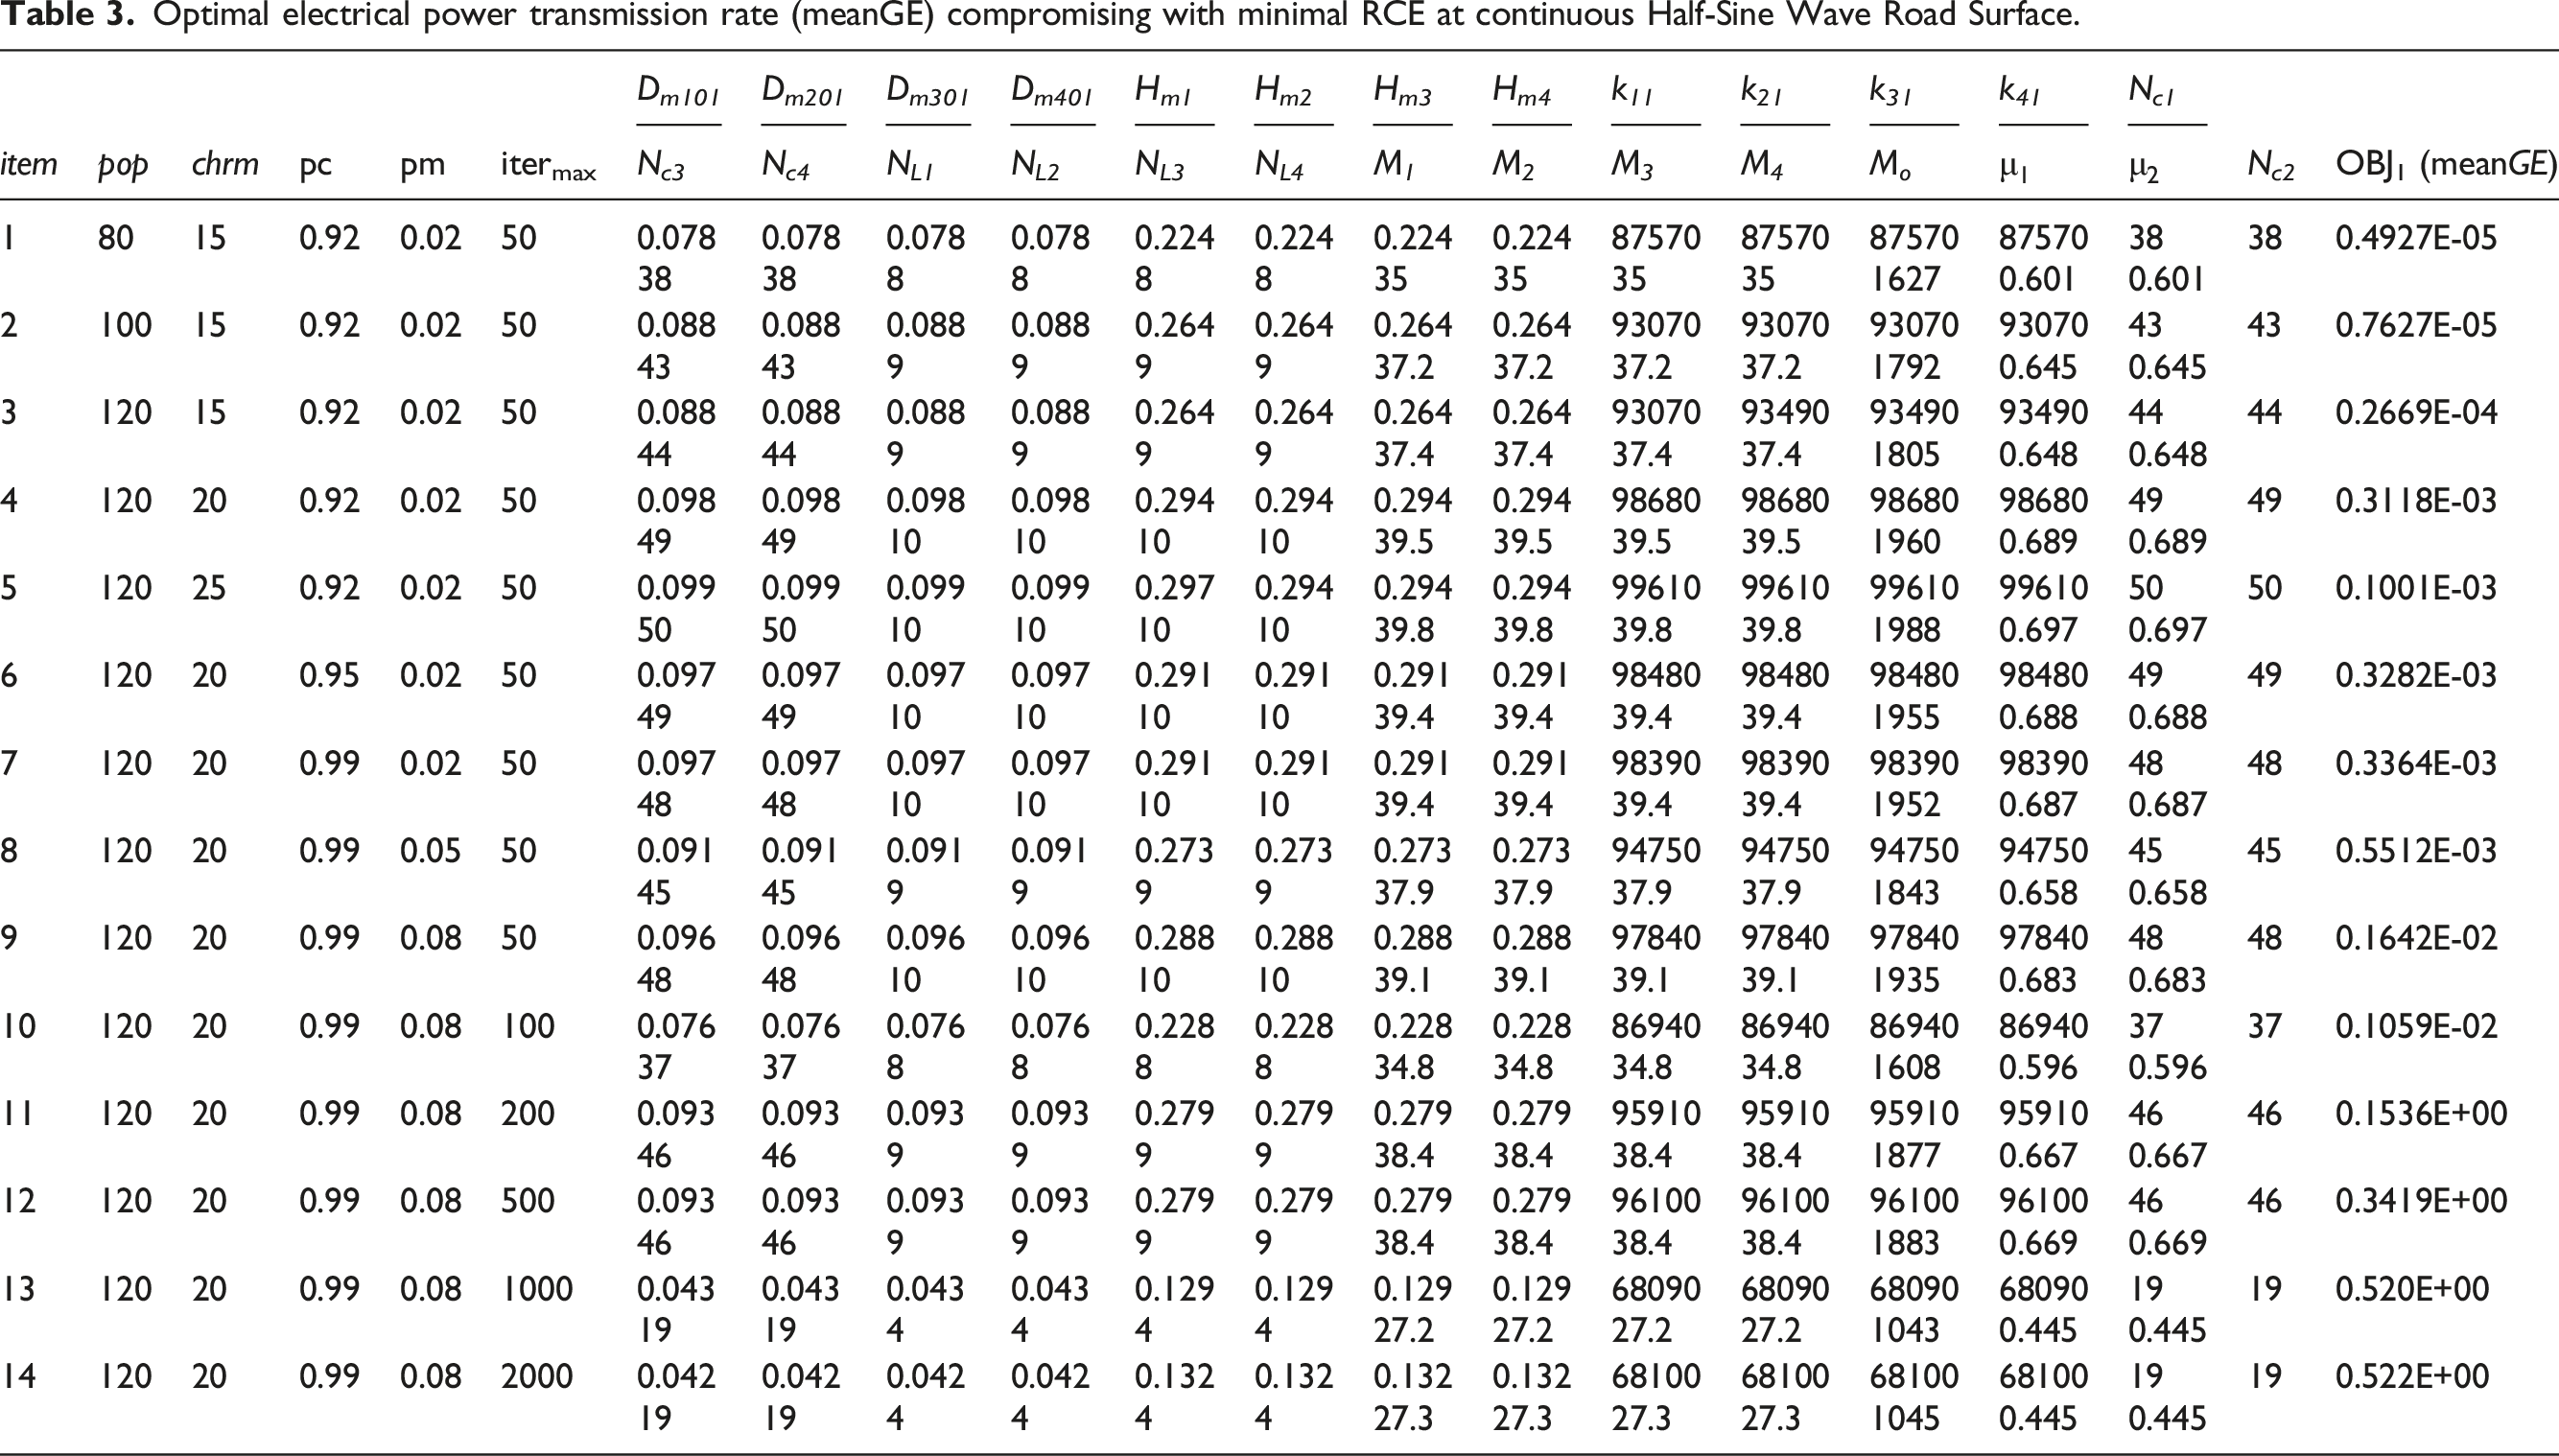
In Figure 13, the parameters are as follows: pop denotes the number of individuals for mating, chrm represents the length of the chromosome for each design parameter, pc signifies the gene crossover rate, pm indicates the gene mutation rate, and itermax stands for the maximum generation during genetic evolution. Throughout the GA optimization, an elitism scheme is chosen, and the GA’s control parameters—pop, chrm, itermax, pc, and pm—are set respectively to [80, 100, 120], [15, 20, 25], [50, 100, 200, 500, 1000], [0.90, 0.95, 0.99], and [0.02, 0.05, 0.08]. To pursue an optimal design, a methodical adjustment of GA control parameters is conducted step-by-step, altering one parameter while keeping the others fixed.
Vehicle and regenerative suspending system parameter optimization
Using the objective function OBJ1 in equation (26), the multi-objective optimization of meanGE and RCE for power generation is performed using genetic algorithm with a two-dimensional vehicle traveling at a speed of 60 km/hr on a continuous half-width road with a height (AA) and width (BB) having the same value of 0.3 m. The upper and lower limits of the relevant suspension system and energy harvester parameters are described in case studies section.
Speed bump parameter optimization
With the suspension system and energy harvester parameters (Dm1, Dm2, Dm3, Dm4, Hm1, Hm2, Hm3, Hm4, Nc1, Nc2, Nc3, Nc4, NL1, NL2, NL3, NL4, Mo, M1, M2, M3, M4, 
Among them, (Dm1, Dm2, Dm3, Dm4, Hm1, Hm2, Hm3, Hm4, Nc1, Nc2, Nc3, Nc4, NL1, NL2, NL3, NL4, Mo, M1, M2, M3, M4,
Discussion
Result
Road simulation
Taking the continuous half-width road surface with speed humps (AA = 0.2 m, BB = 0.4 m) in the mathematical simulation of road surface vibration, Fourier series approximation was used with n = 10, 20, 30, and 40. The results are shown in Figure 14, which indicates that the simulation of continuous half-width road surface with n = 40 is better than n = 10, 20, and 30. Therefore, the higher the order of n, the more accurate the simulation of continuous half-width road surface will be. Therefore, this study uses n = 40 to simulate the continuous half-width road surface. Simulation of a continuous half-width pavement using Fourier Series method at various terns.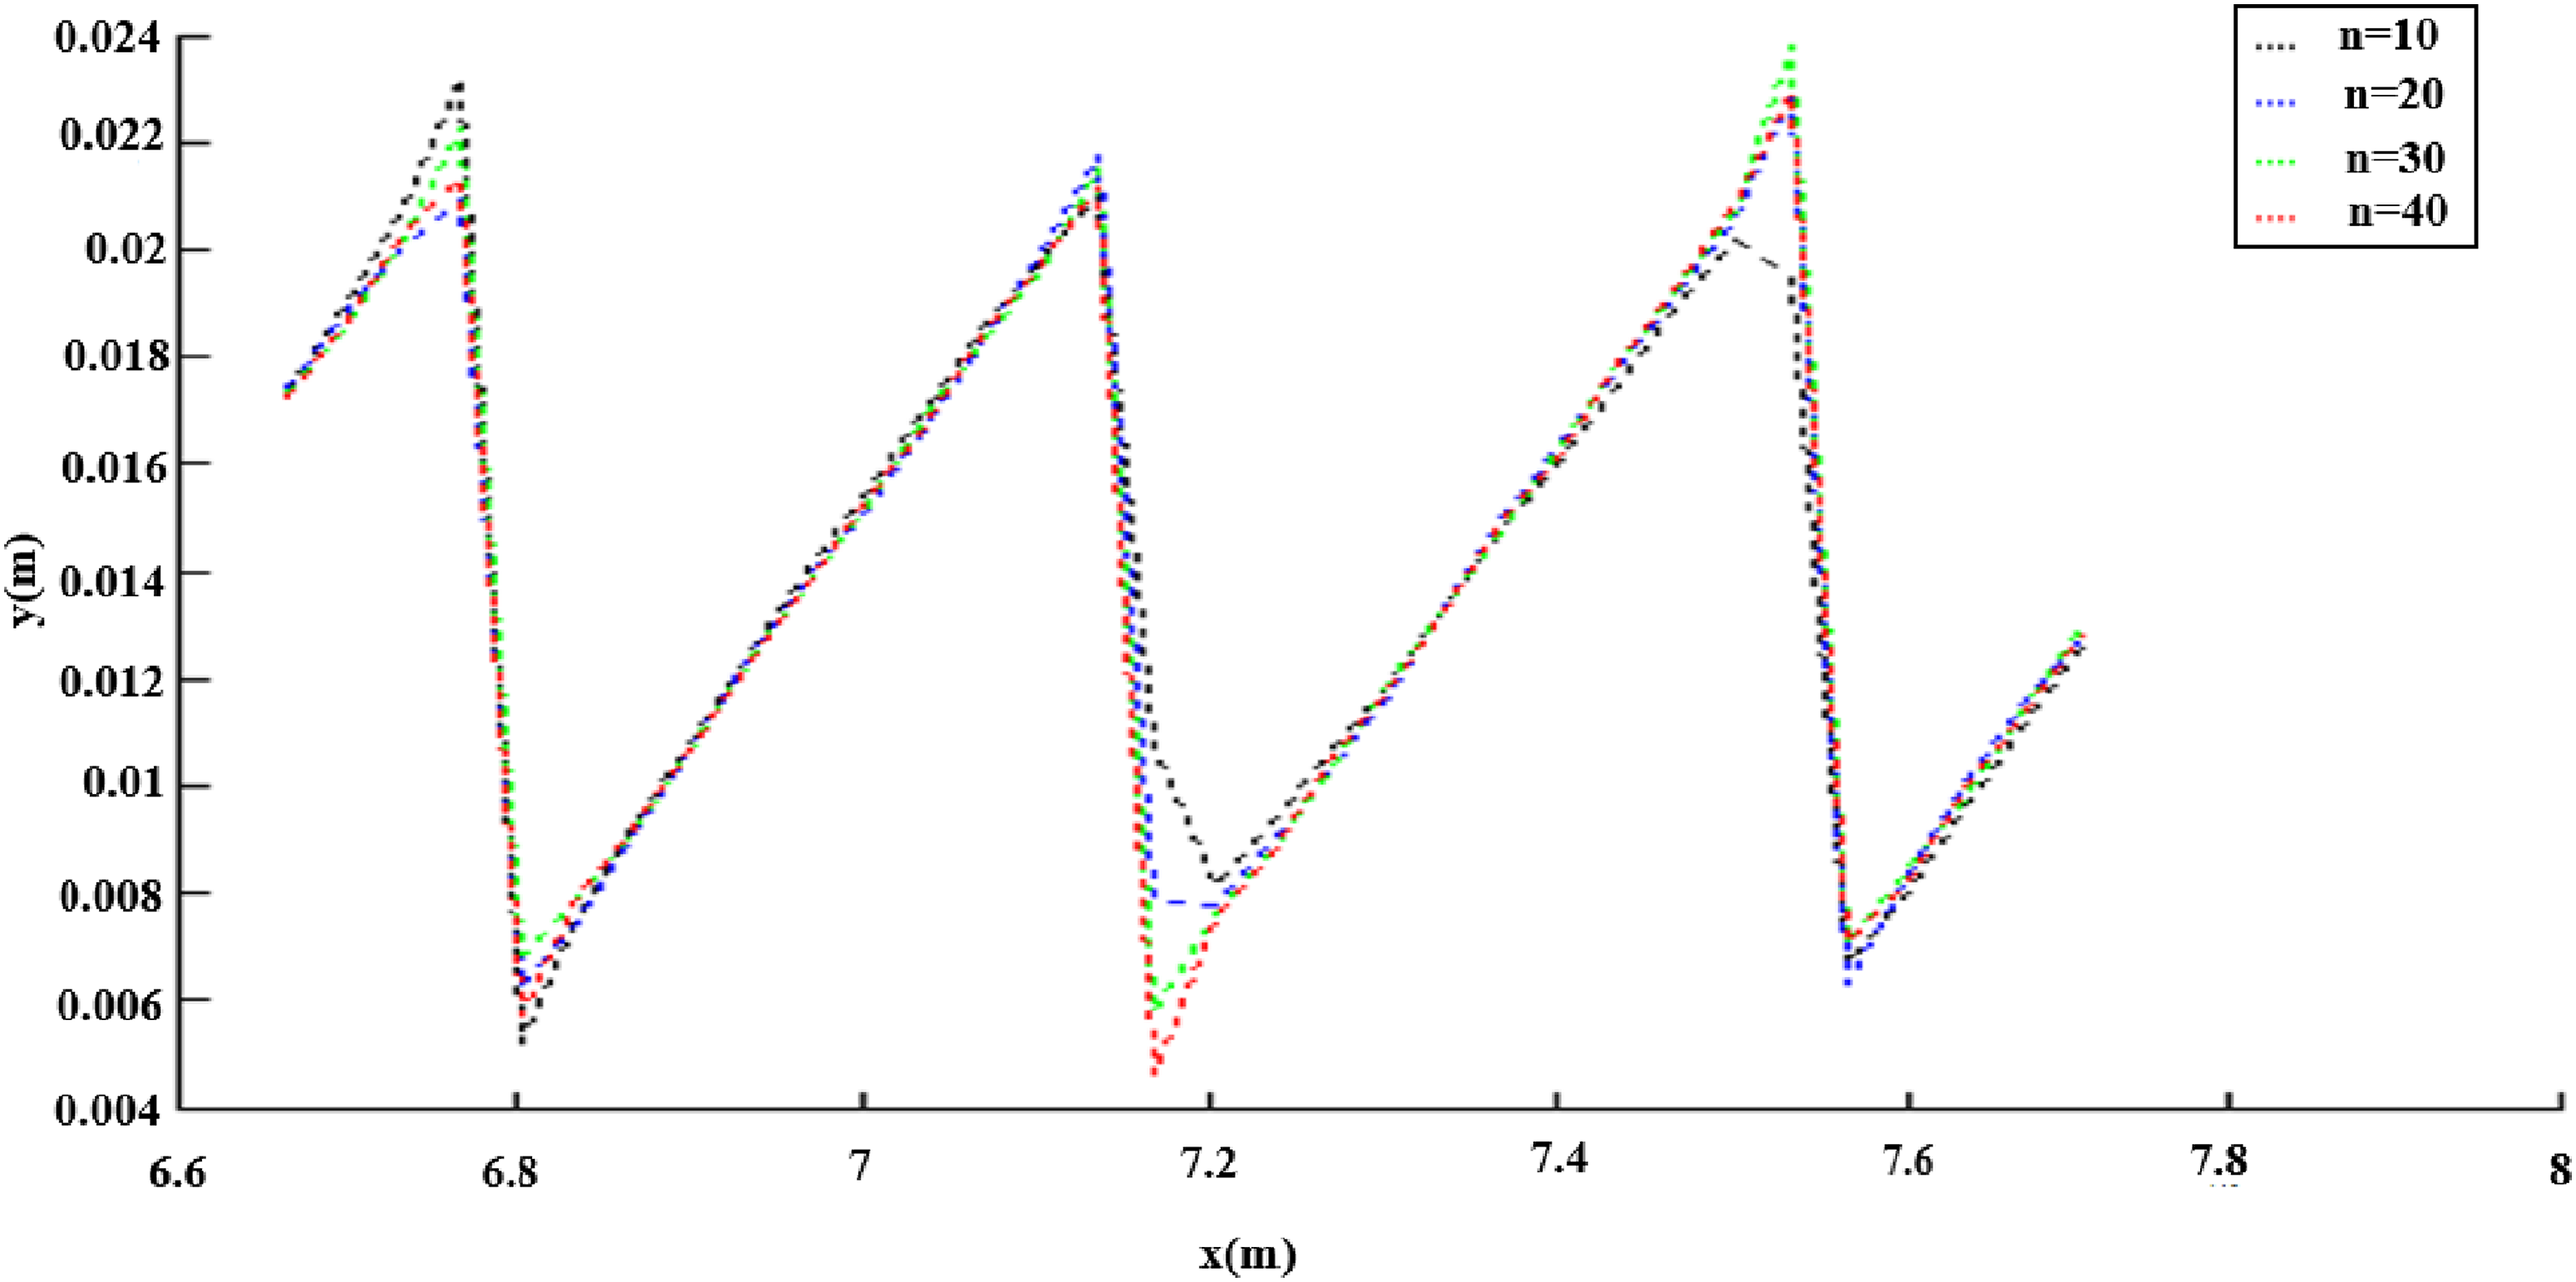
Adjusting suspension system and energy harvester parameters
Optimal electrical power transmission rate (meanGE) compromising with minimal RCE at continuous Half-Sine Wave Road Surface.
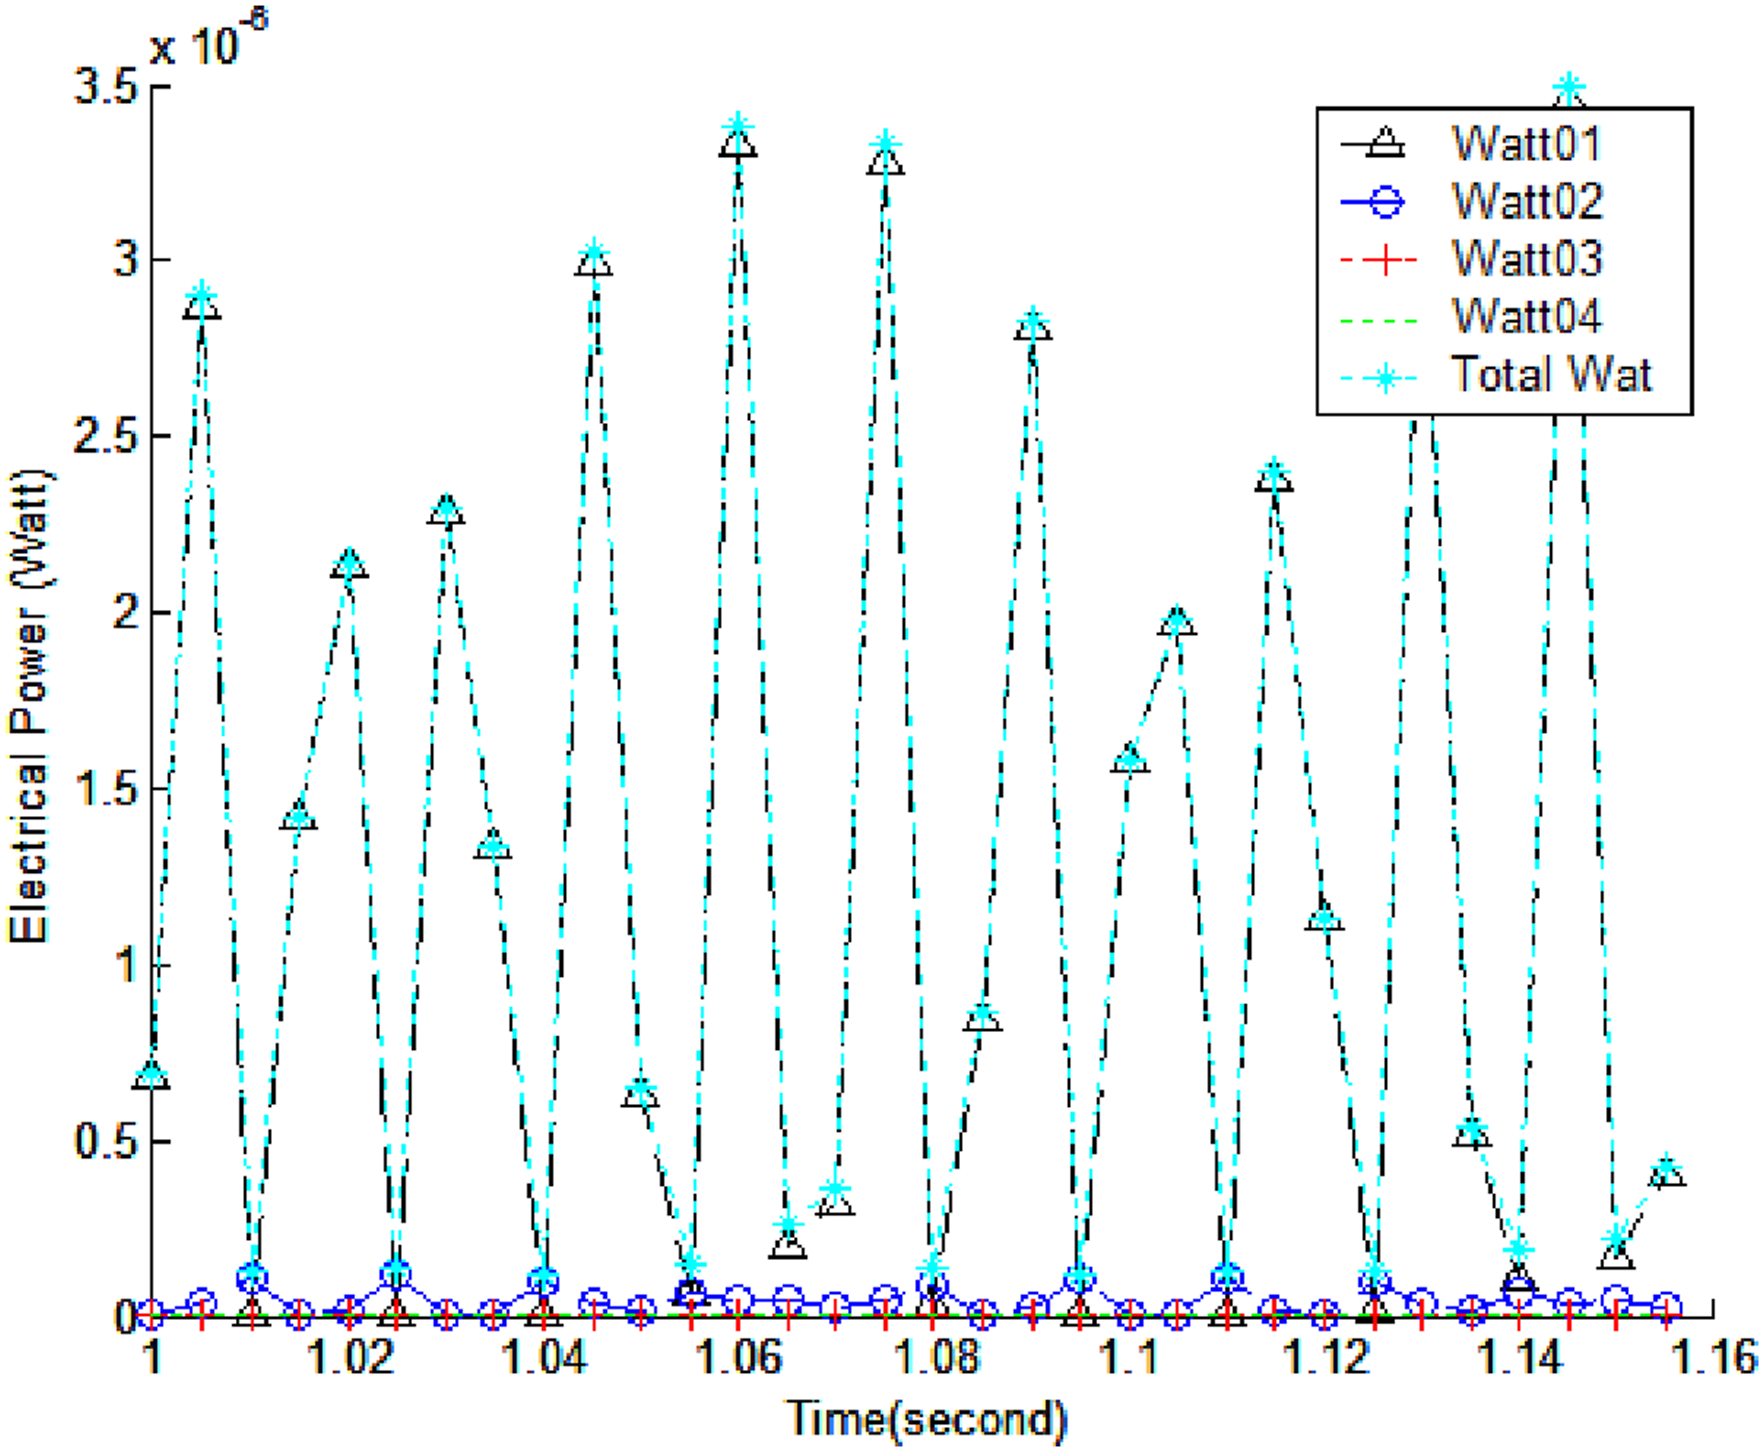
Induced electrical powers with regard to time.
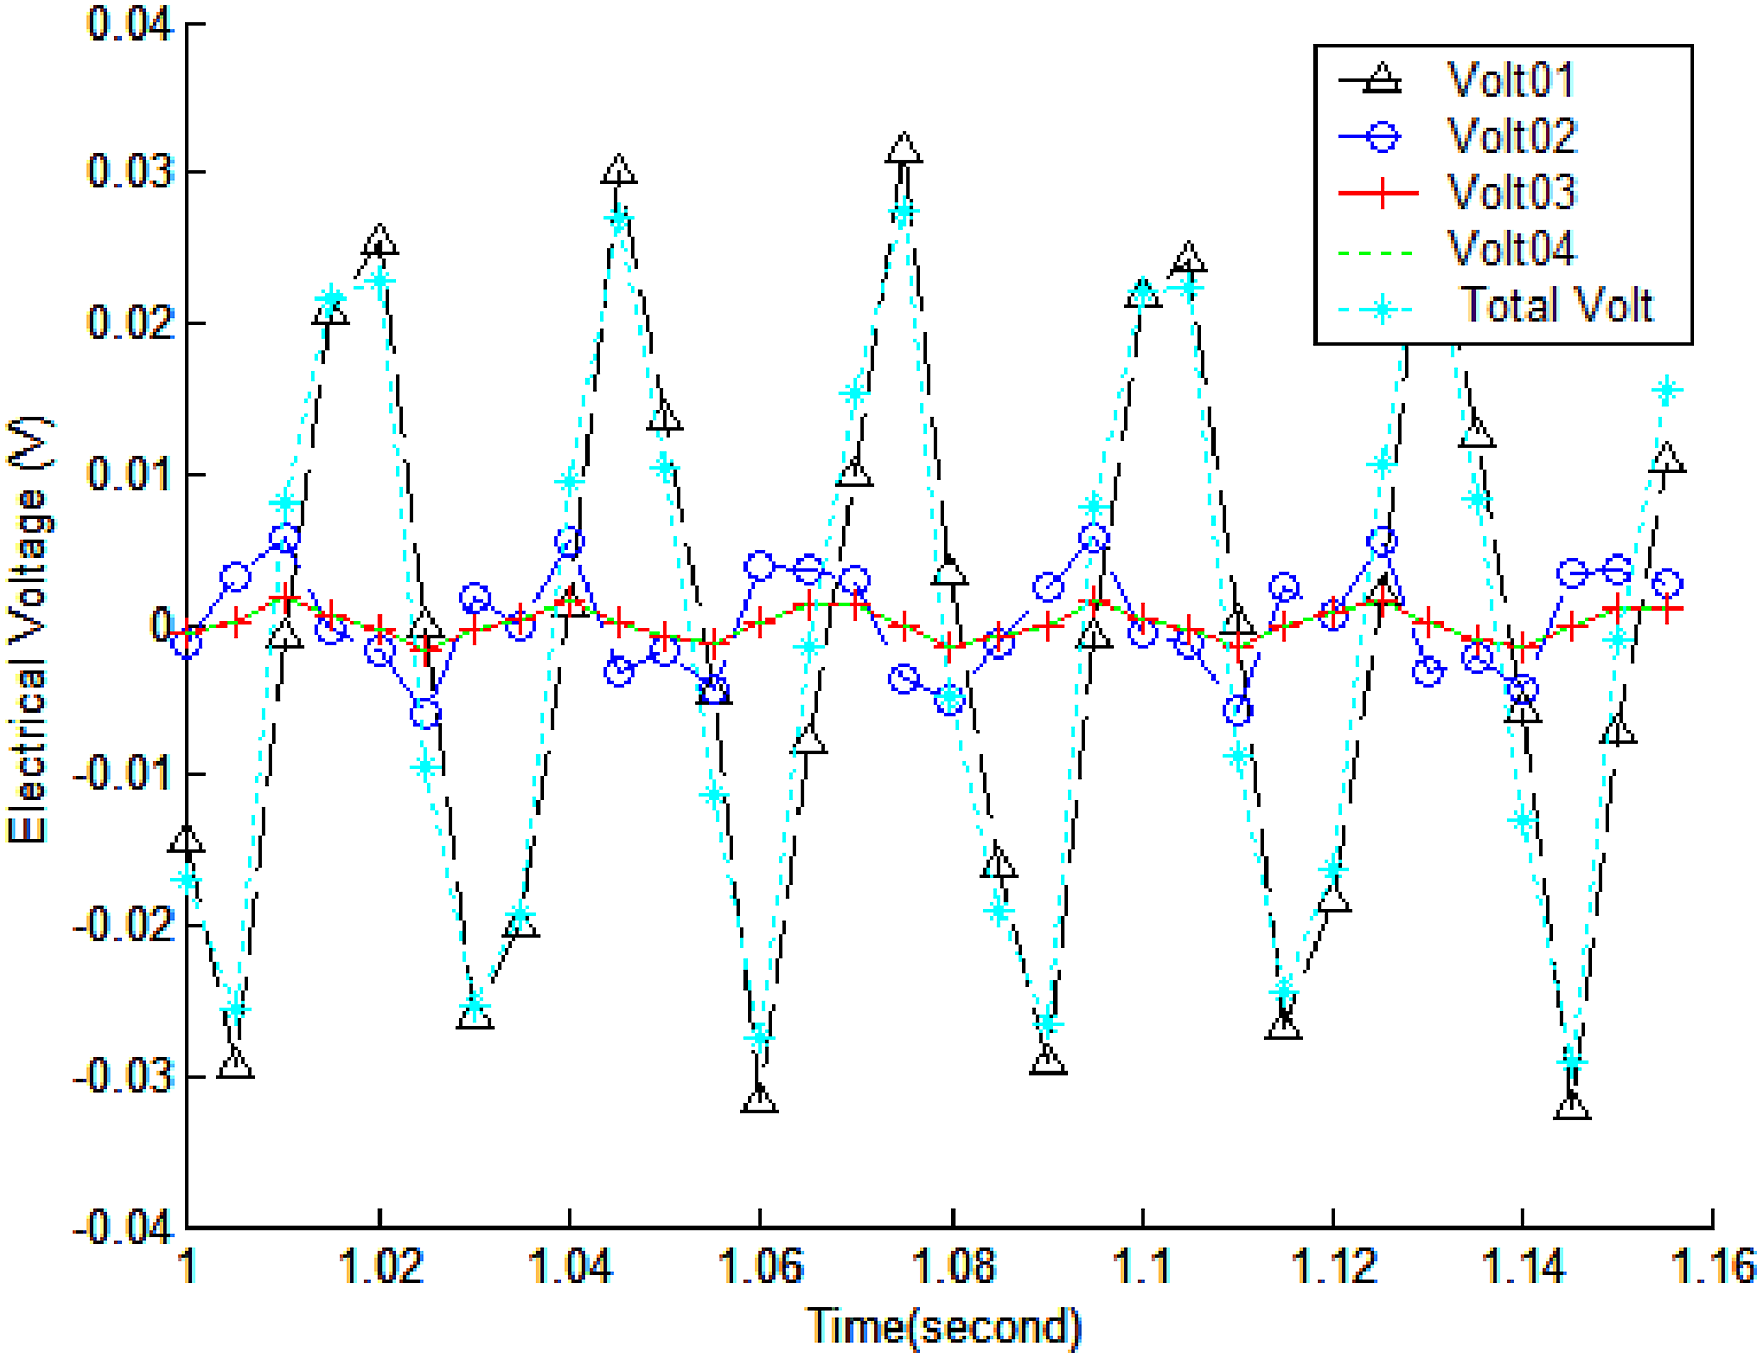
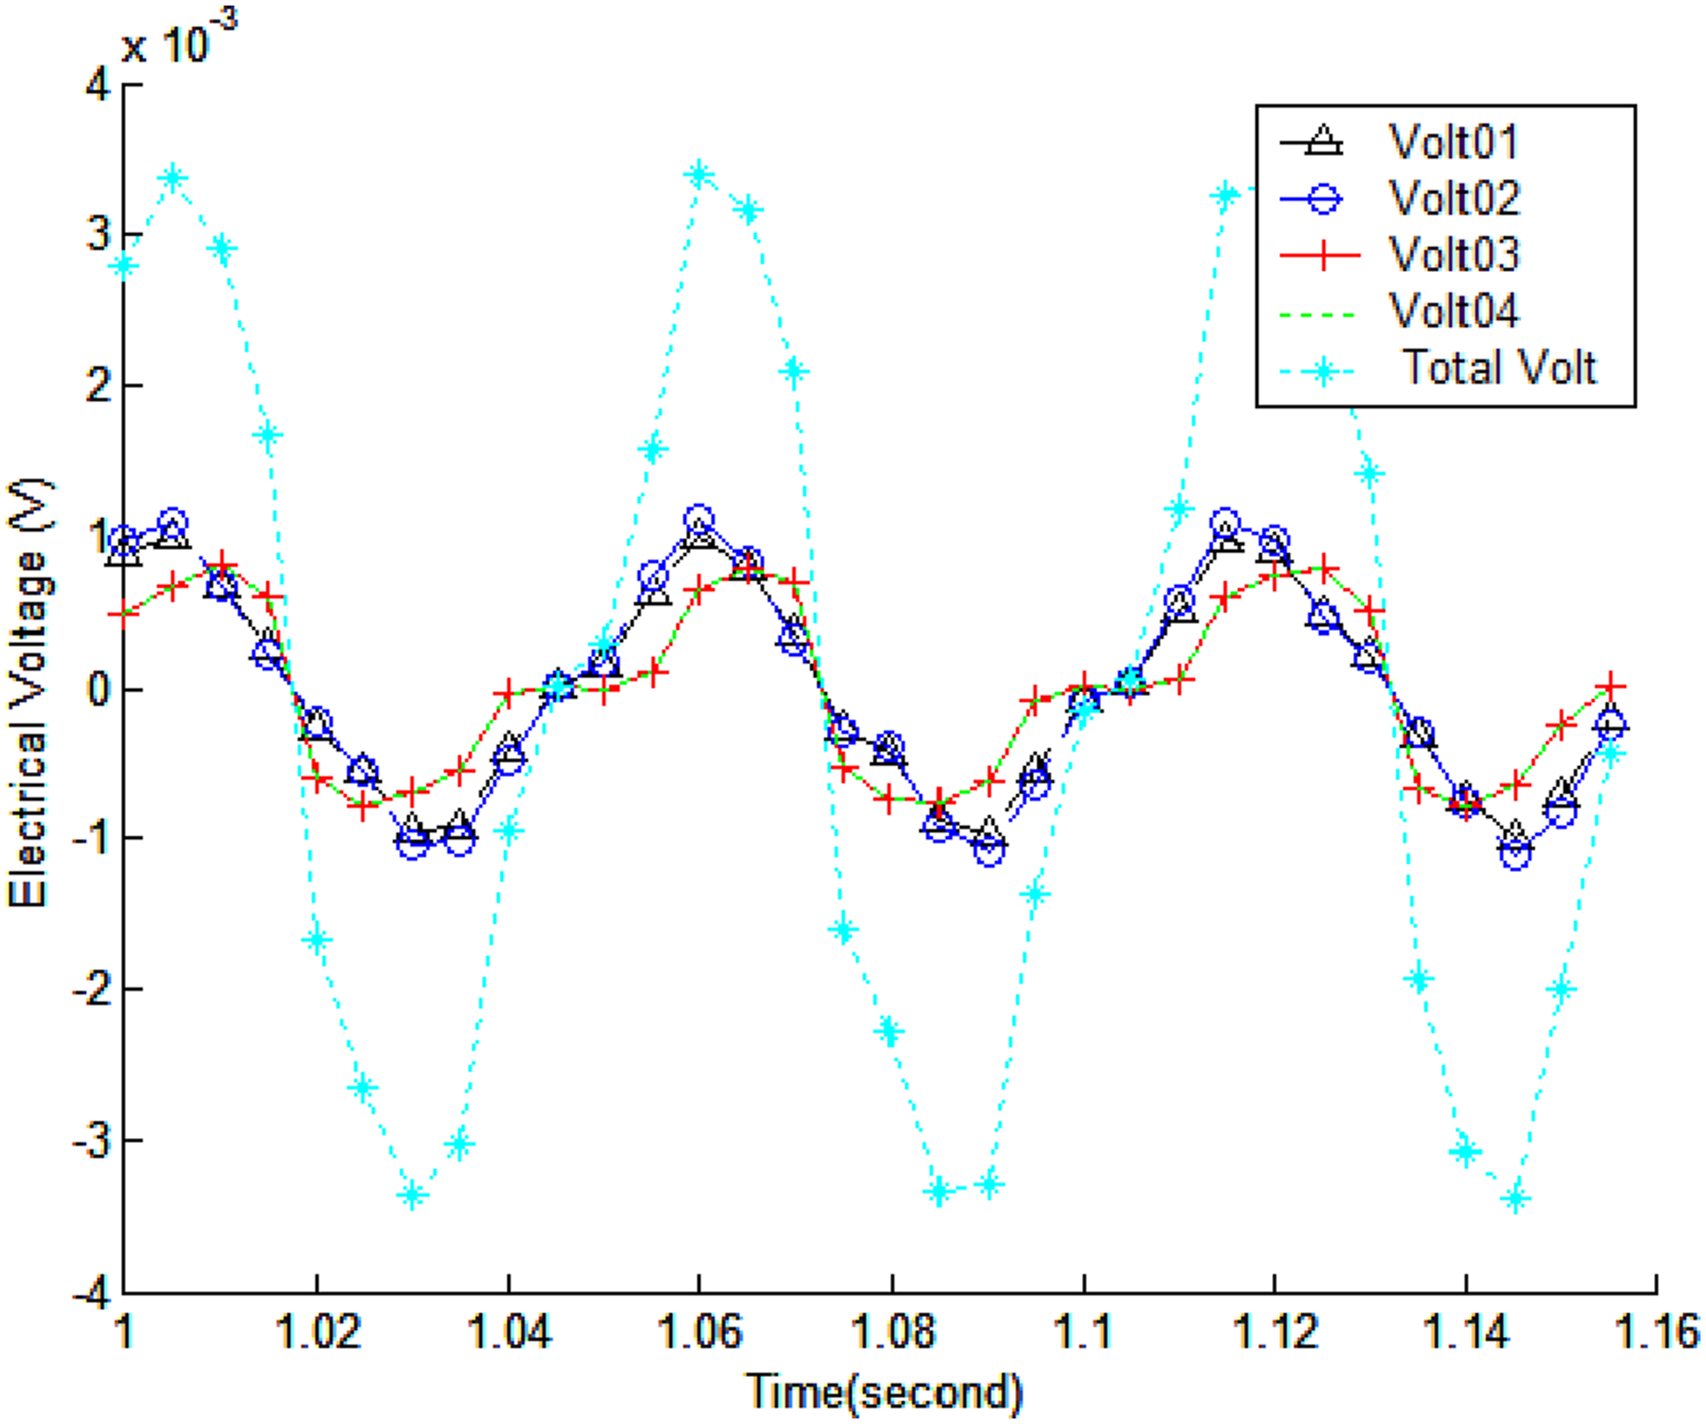
Induced electrical voltages with regard to time.
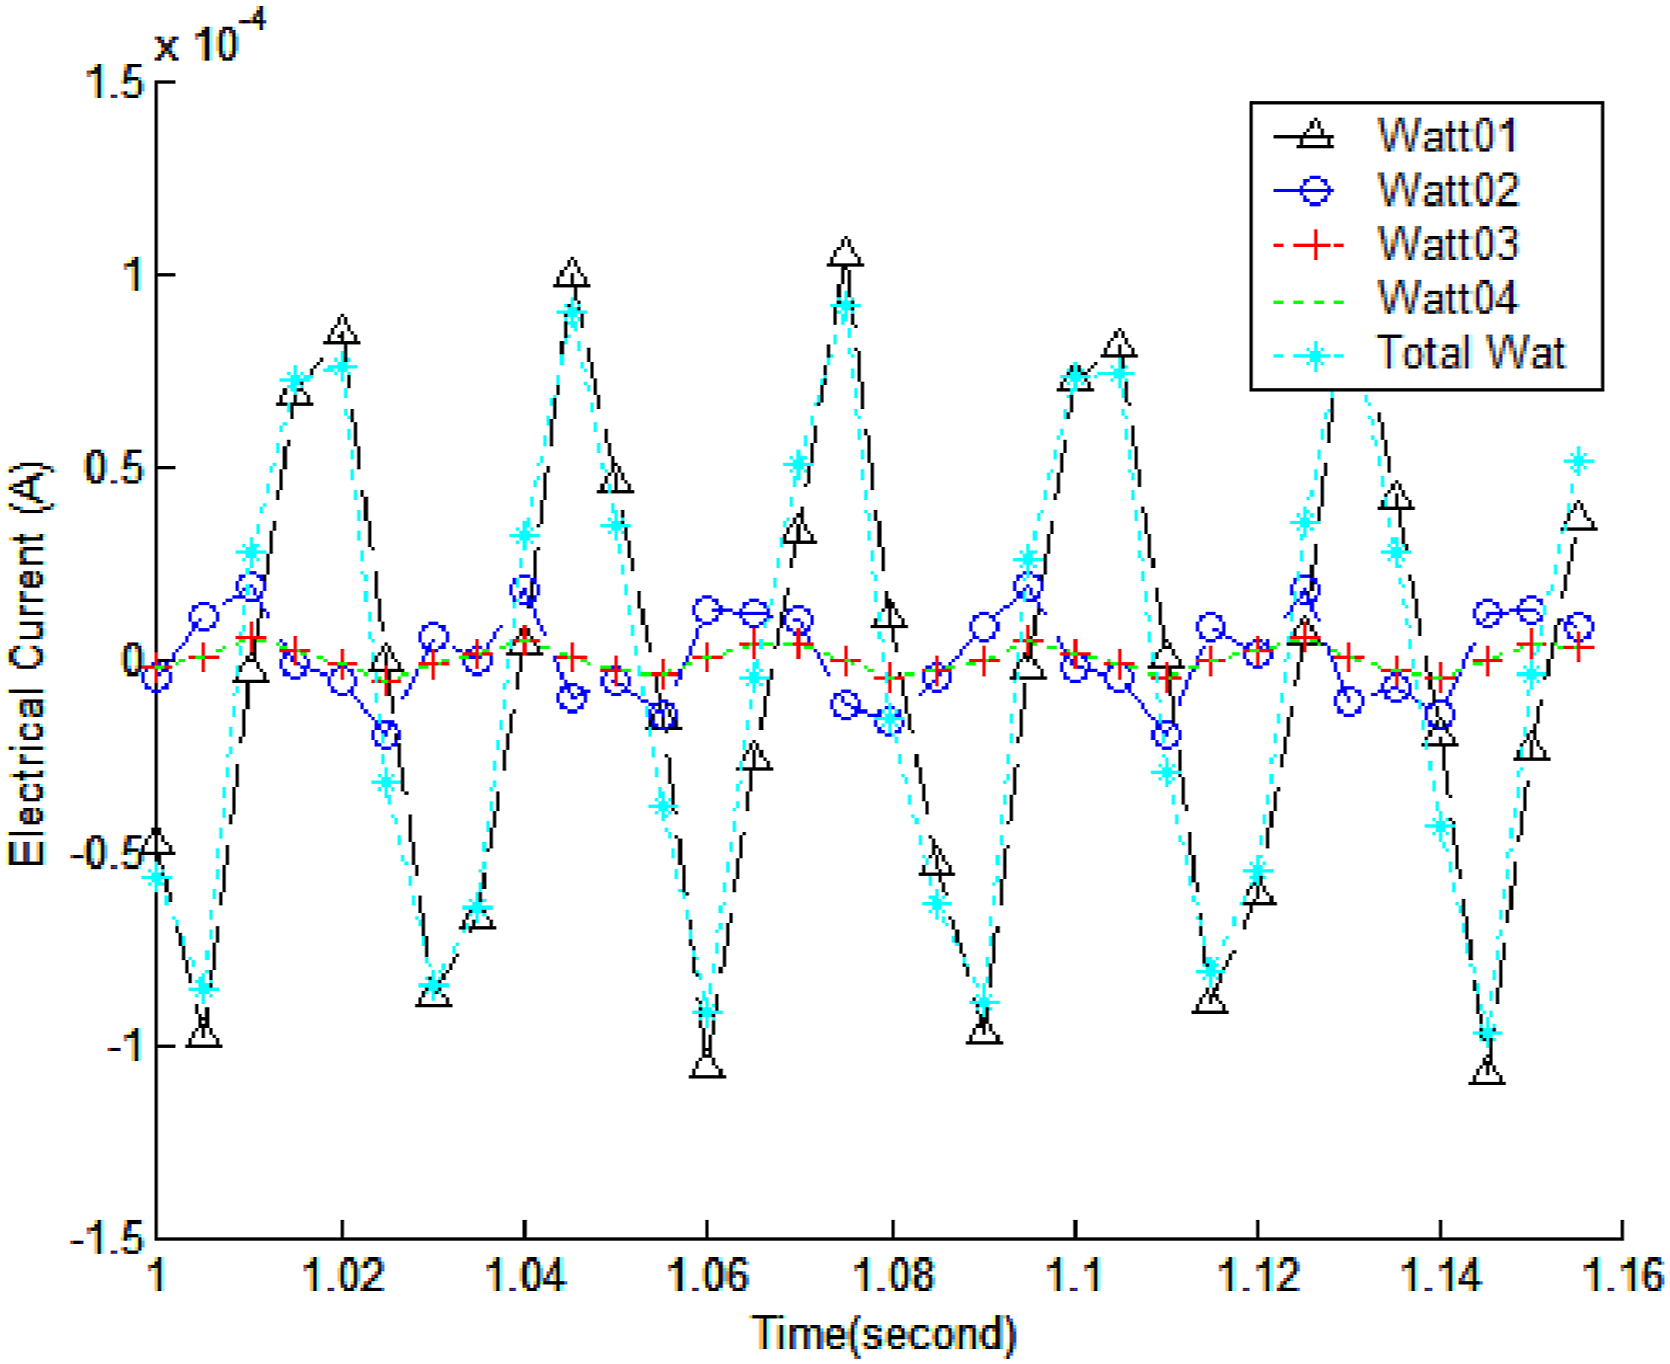
Induced electrical currents with regard to time.
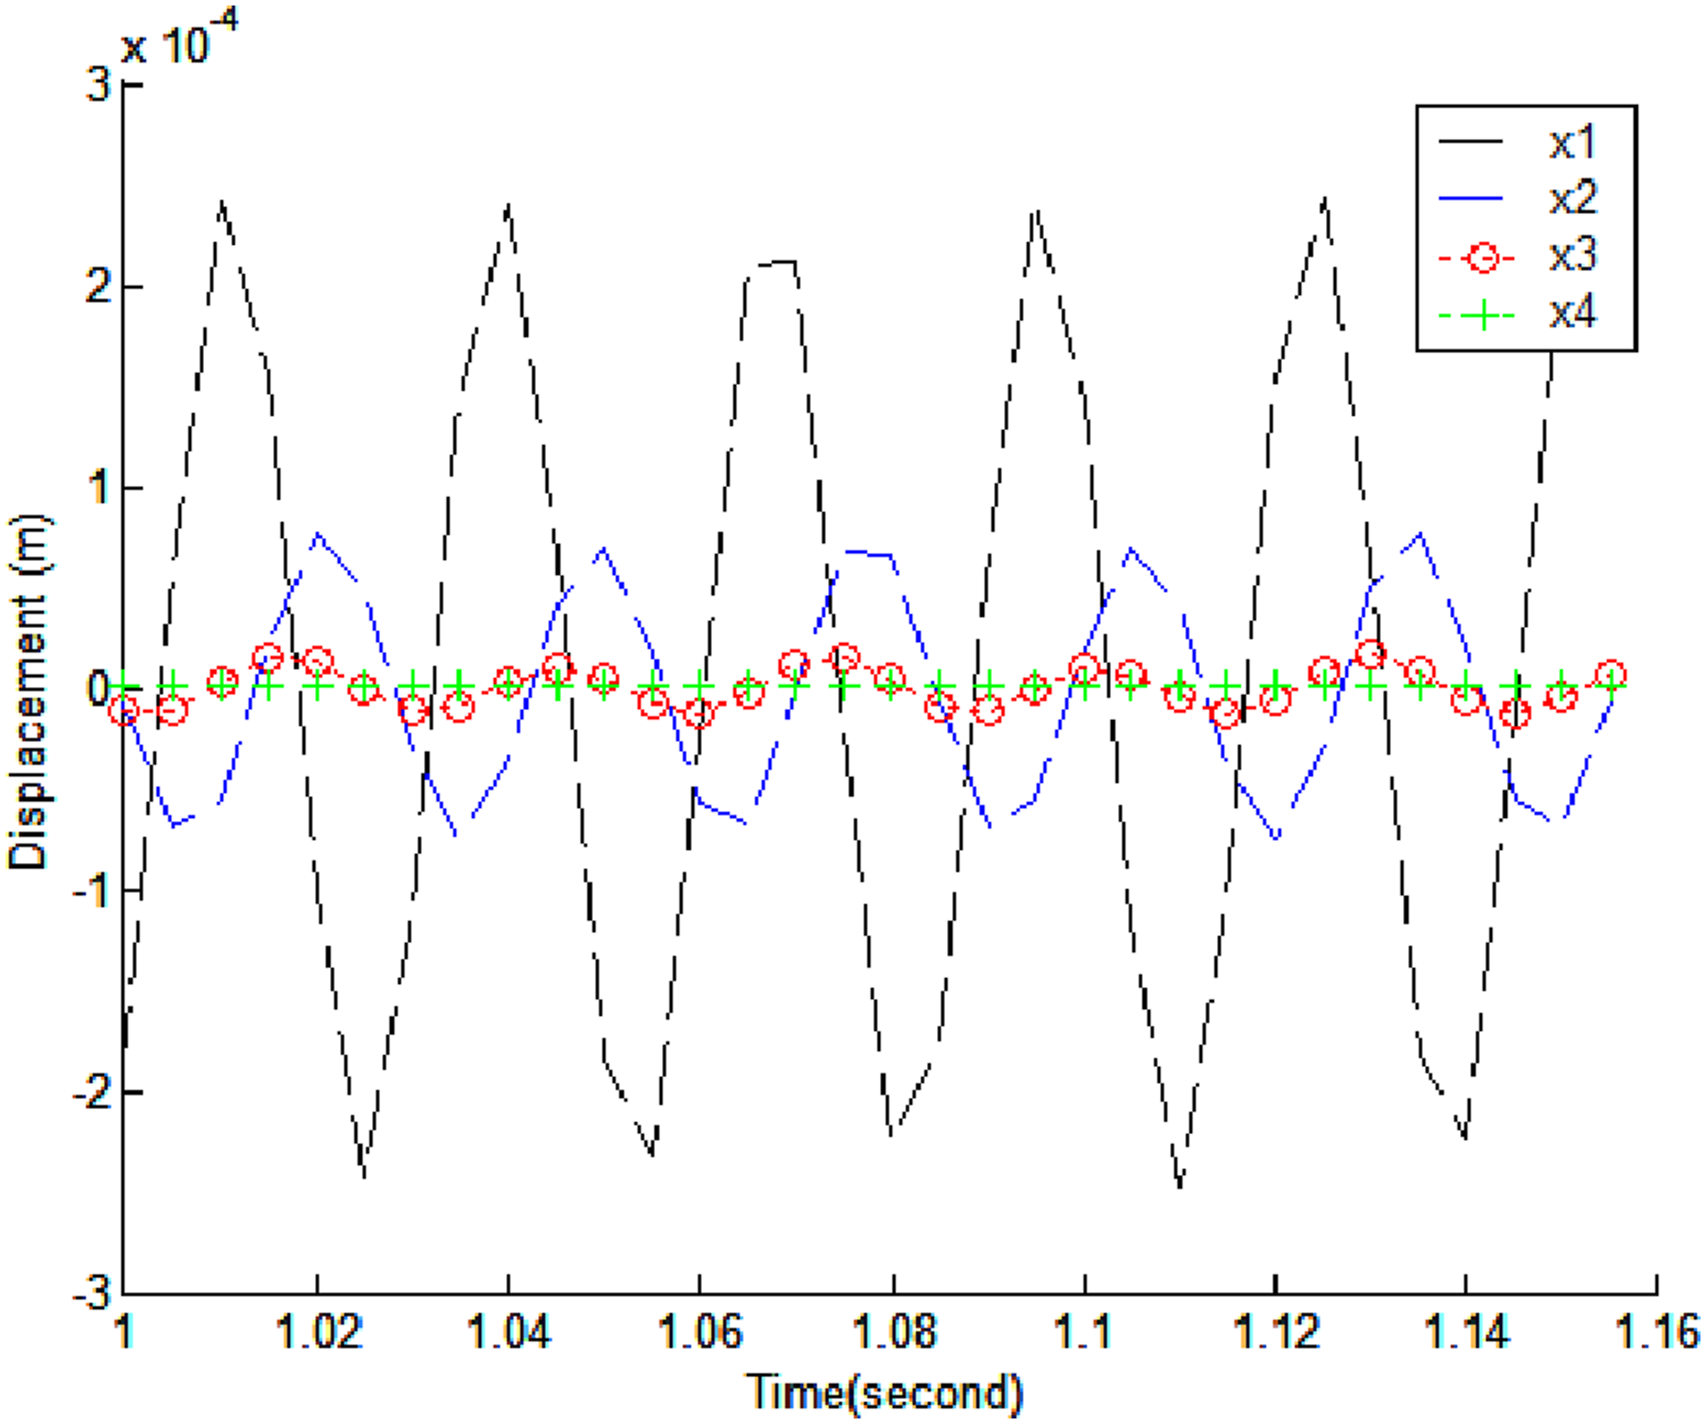
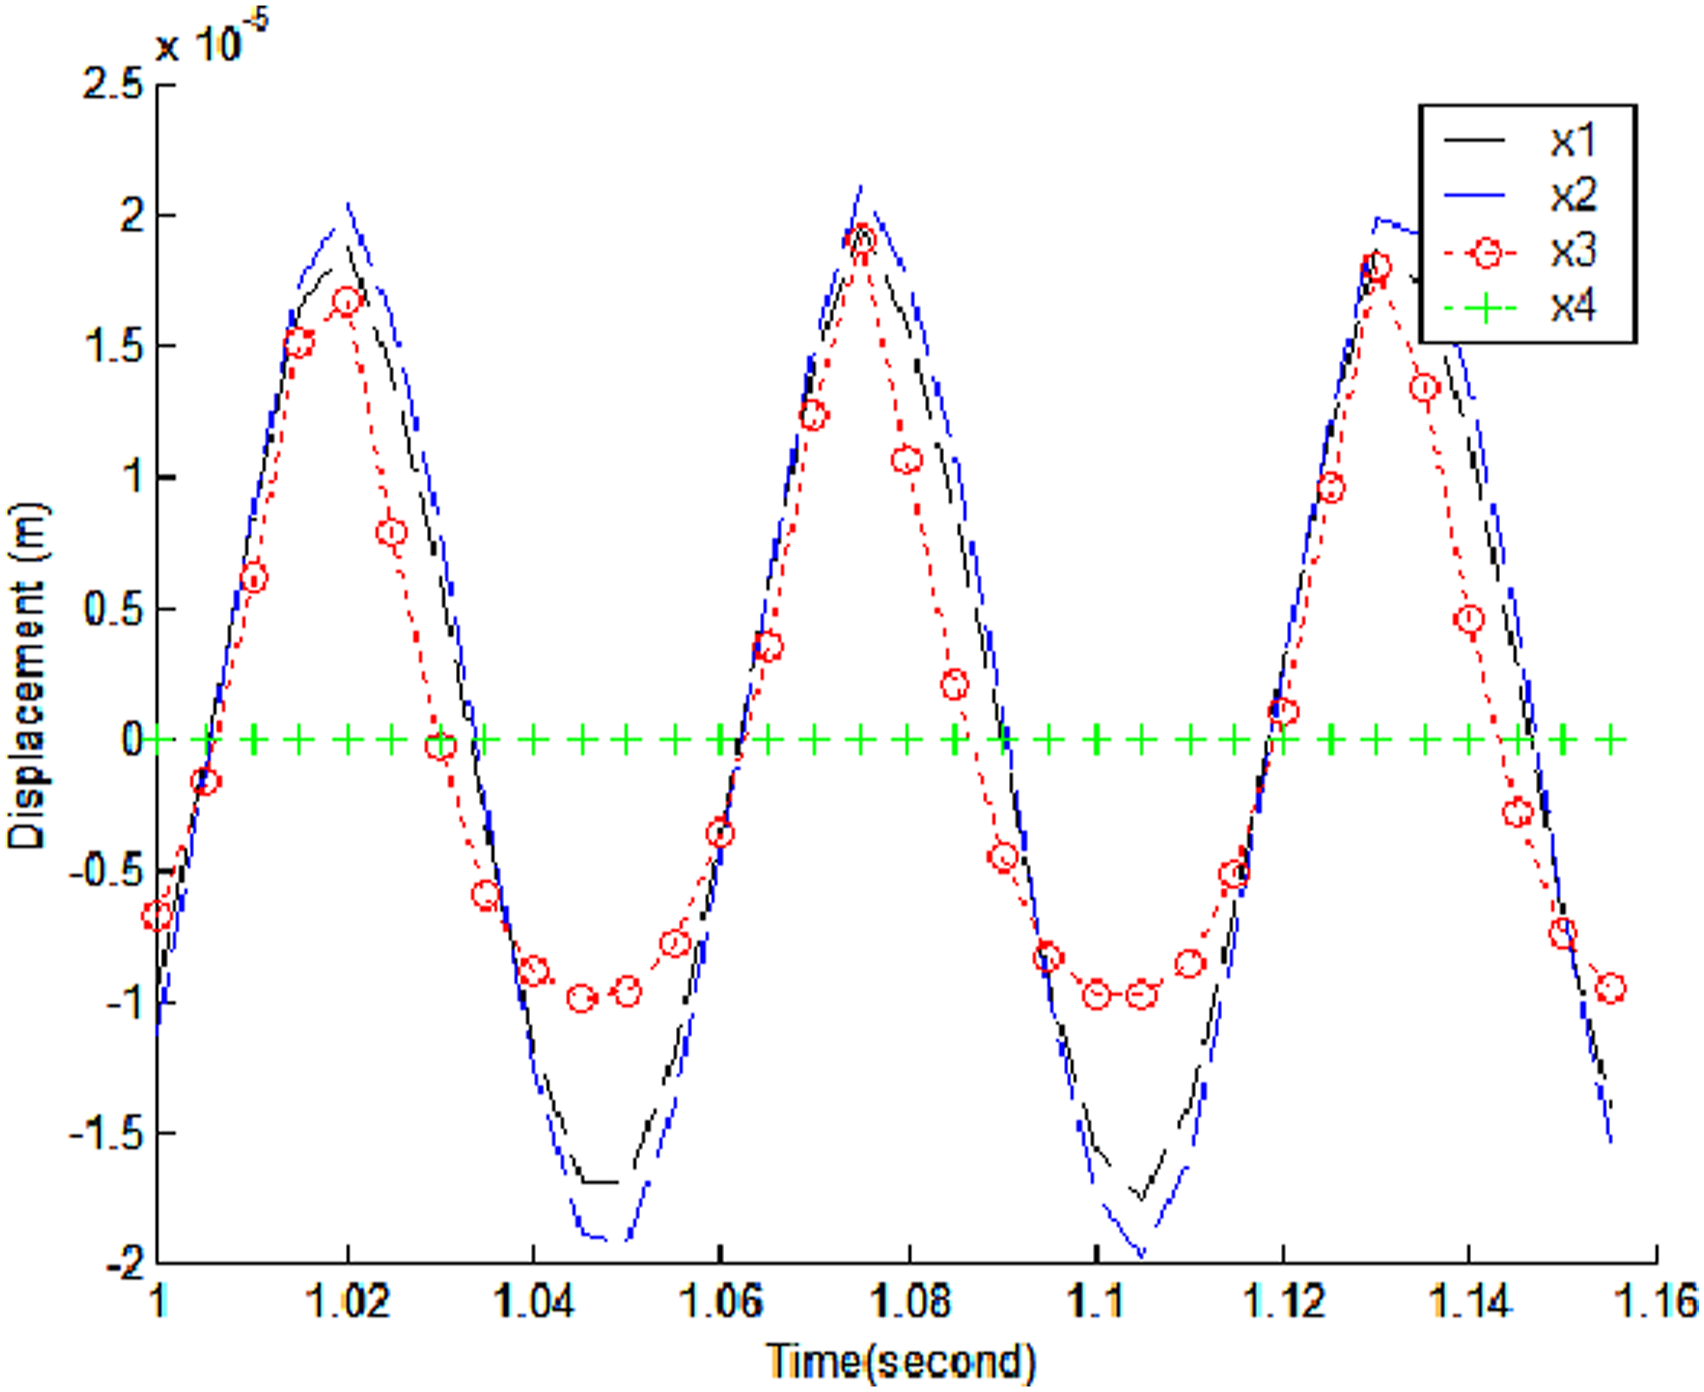
Vertical displacements of the wheels with regard to time.
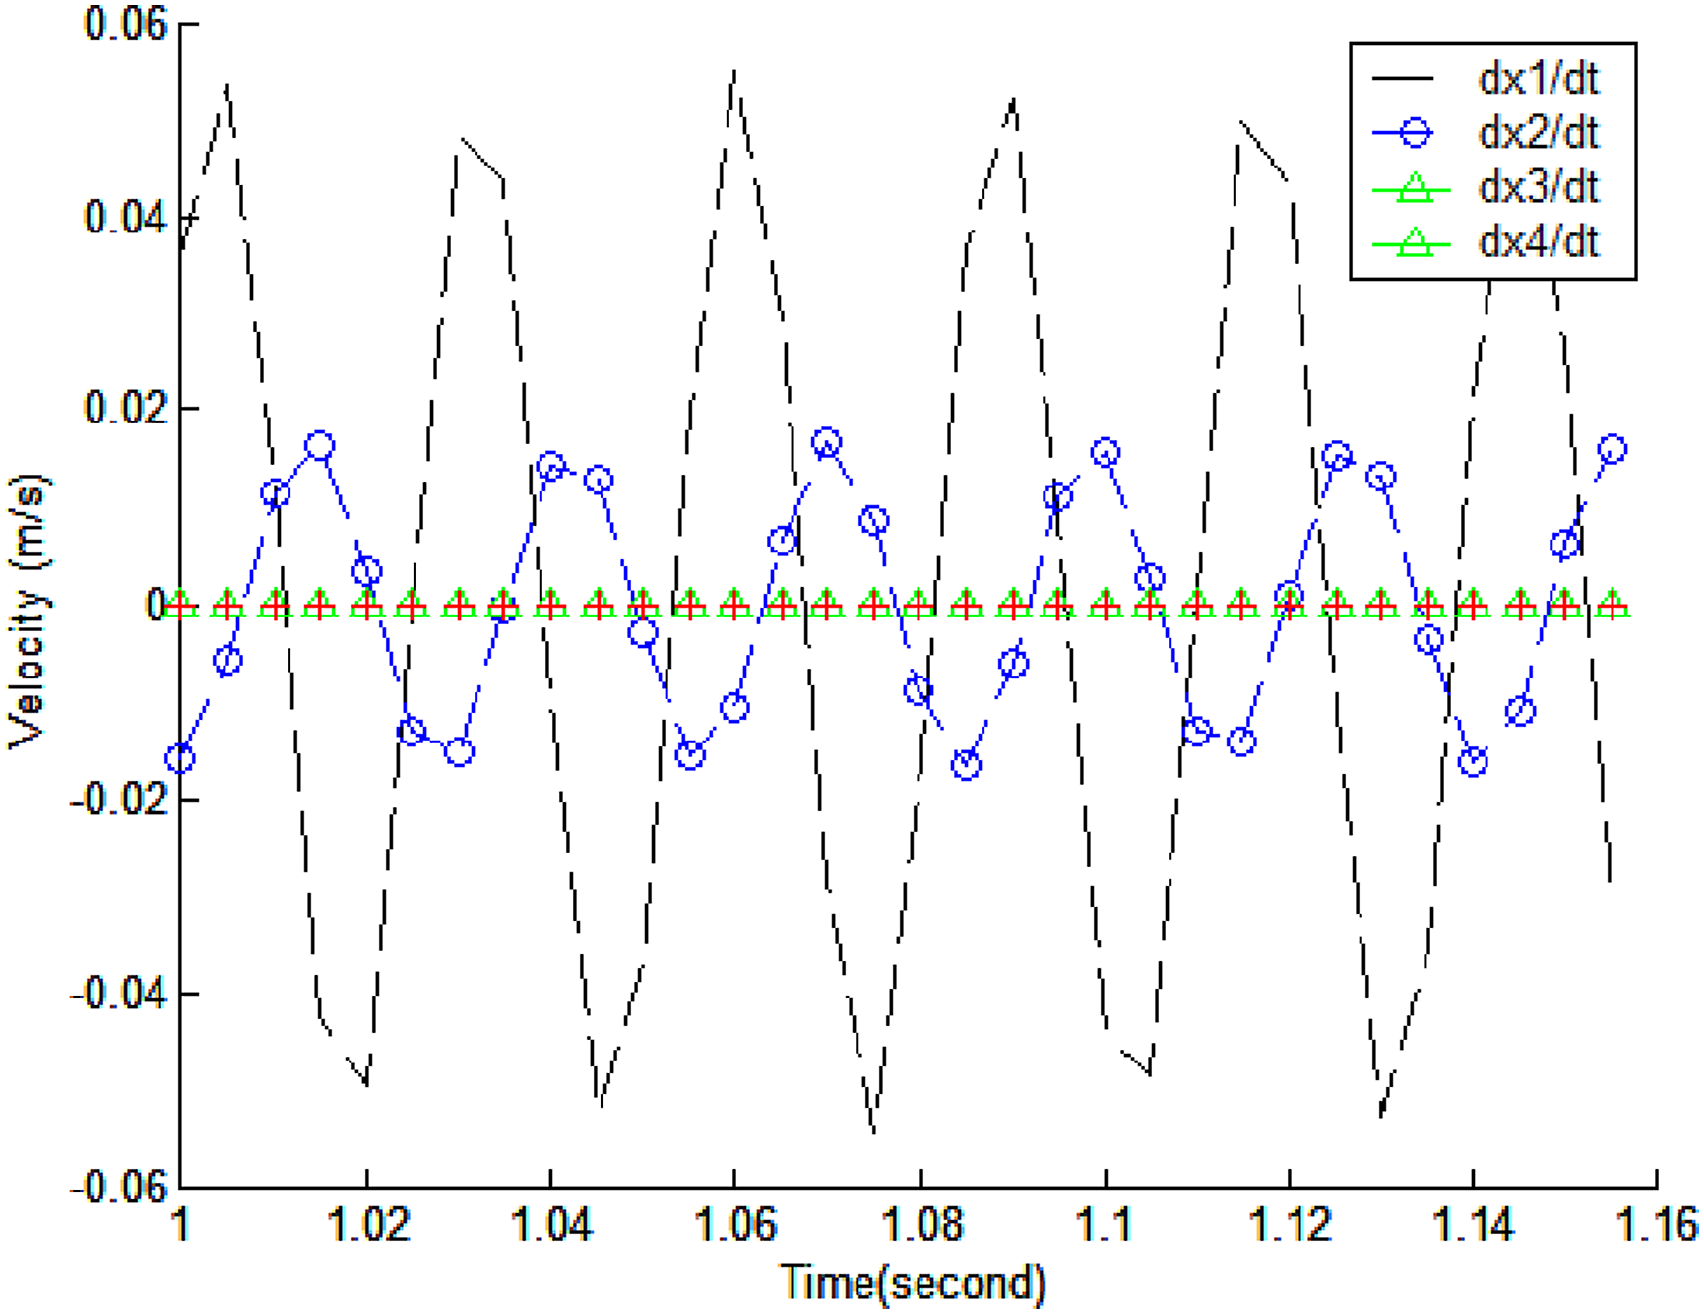
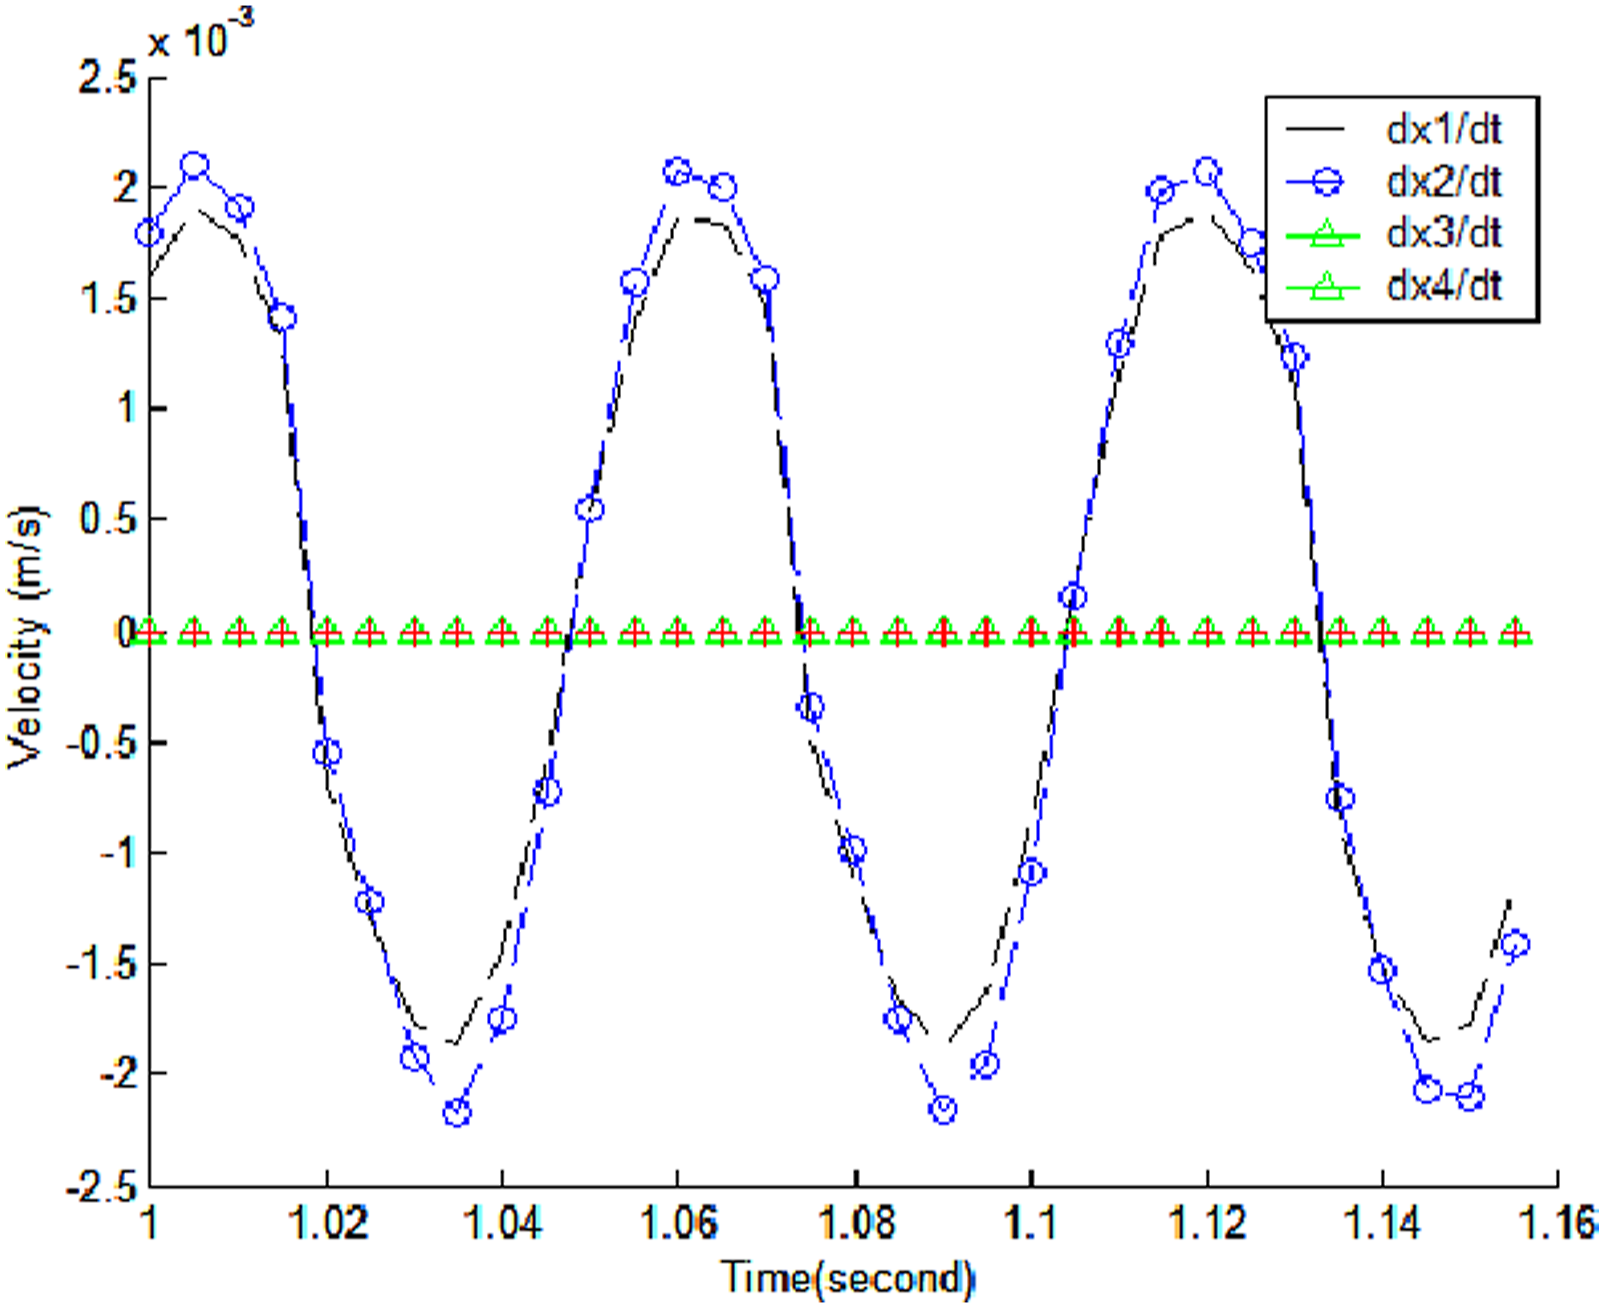
Vertical velocities of the wheels with regard to time.
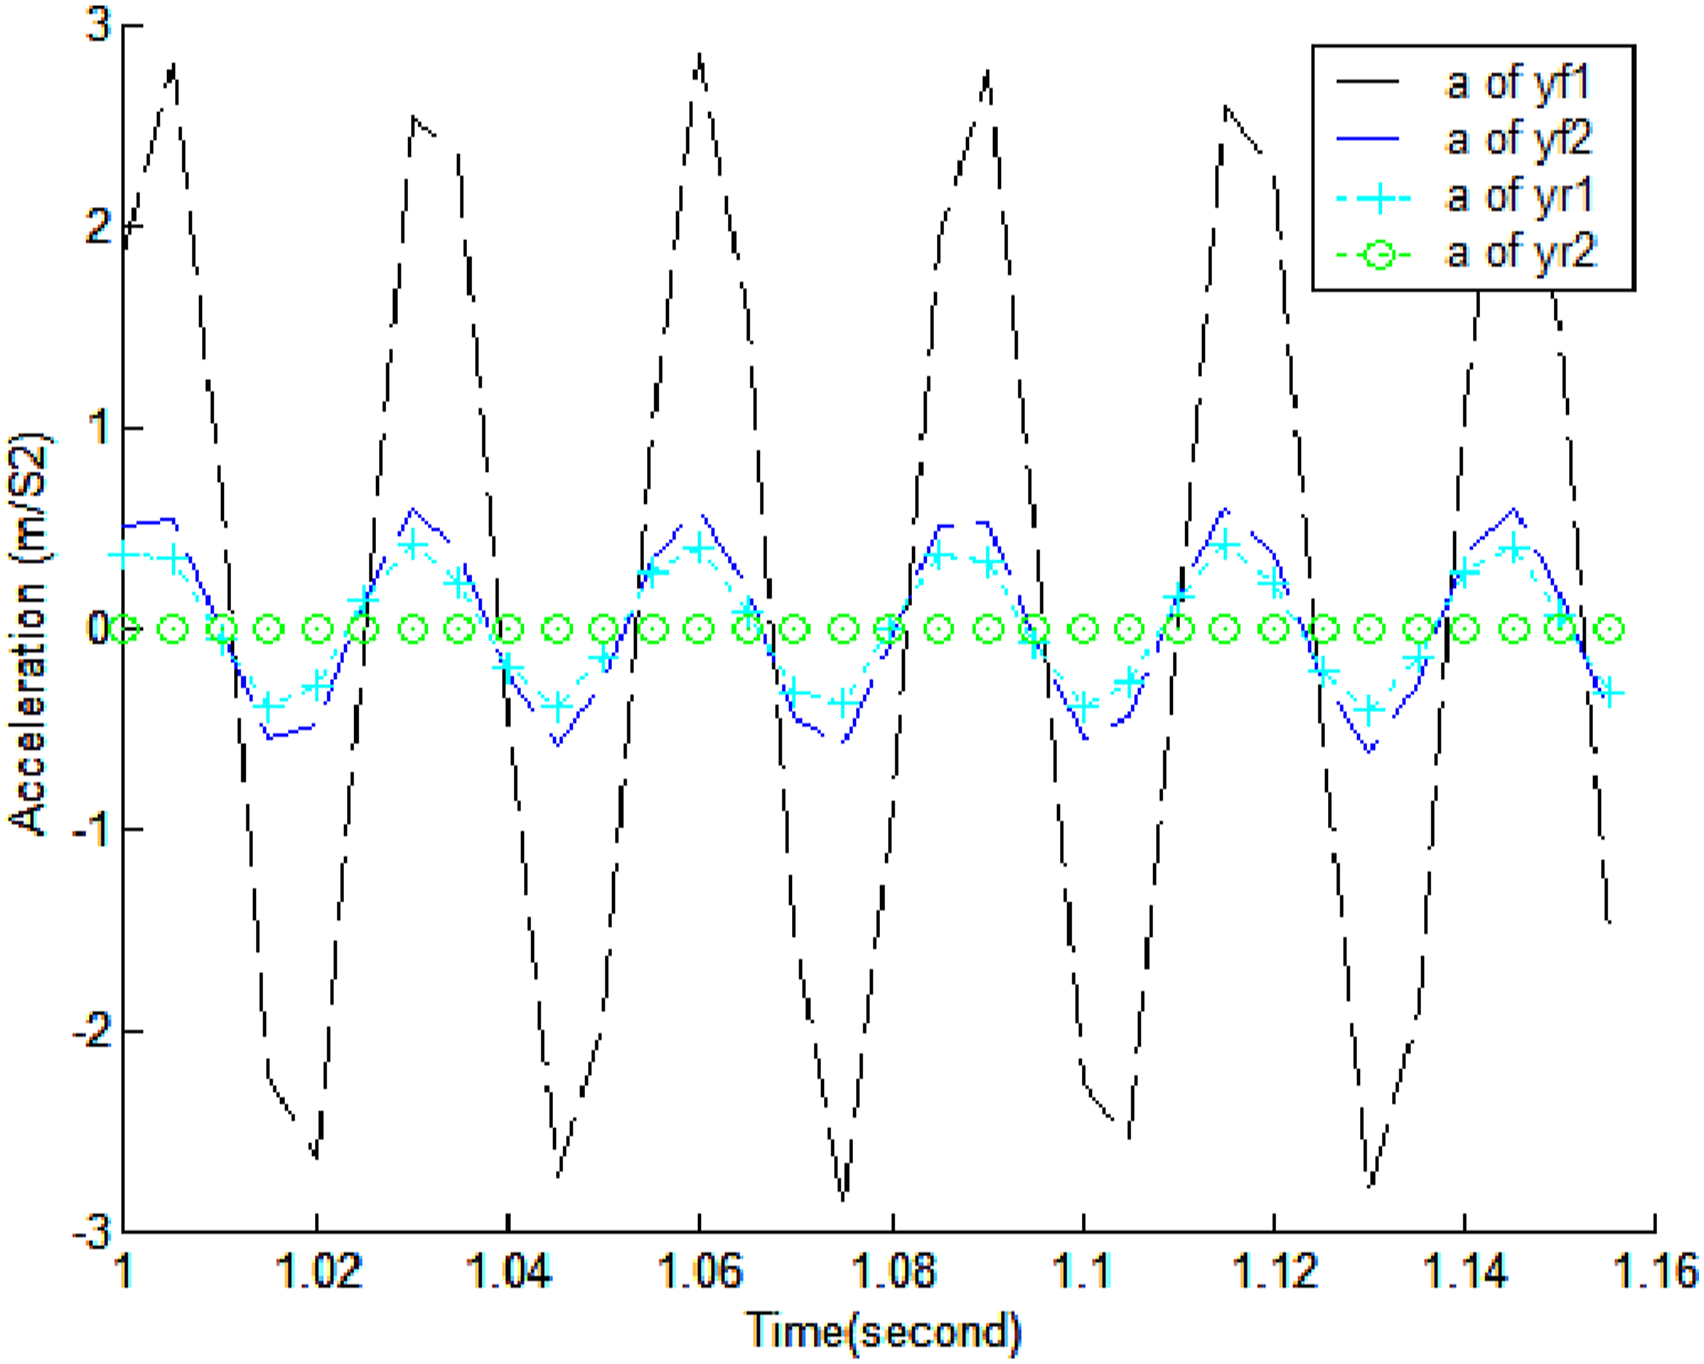
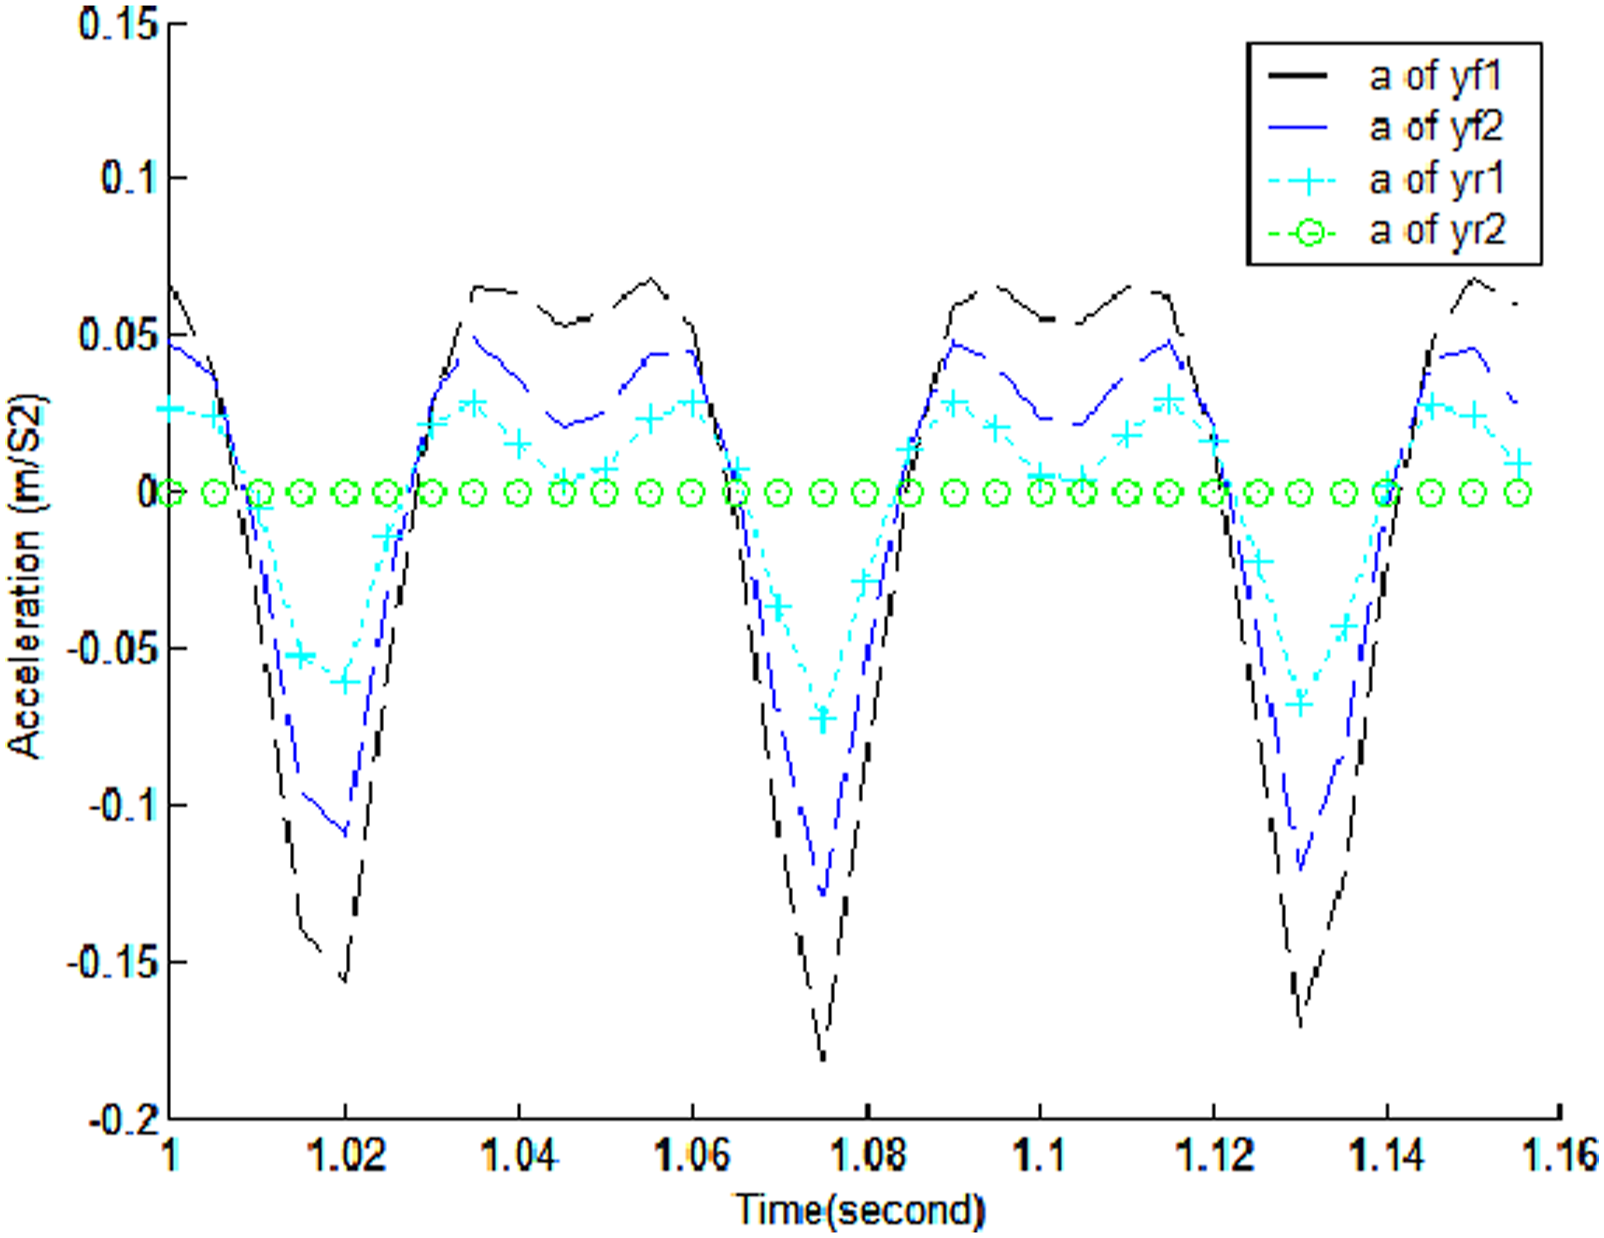
Vertical accelerations of the wheels with regard to time.
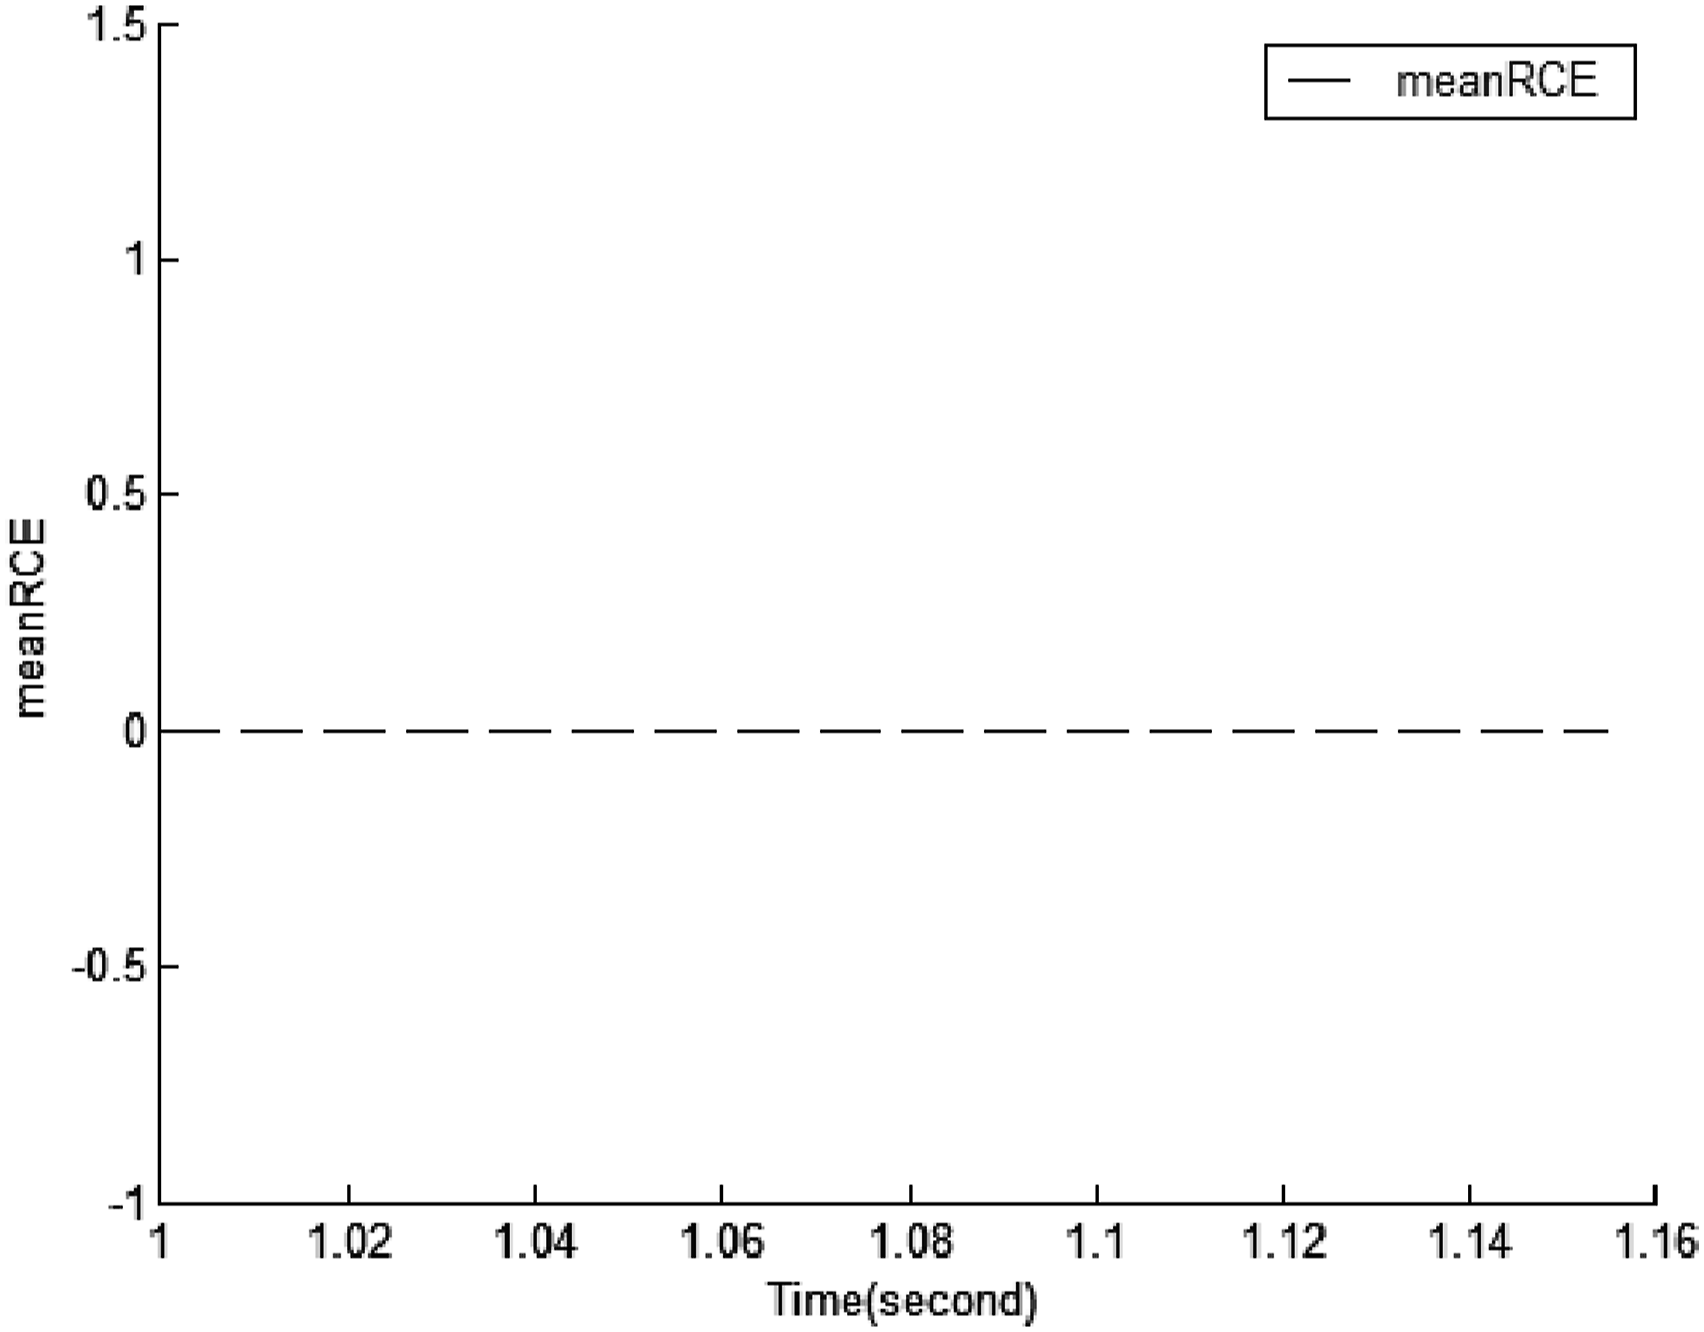
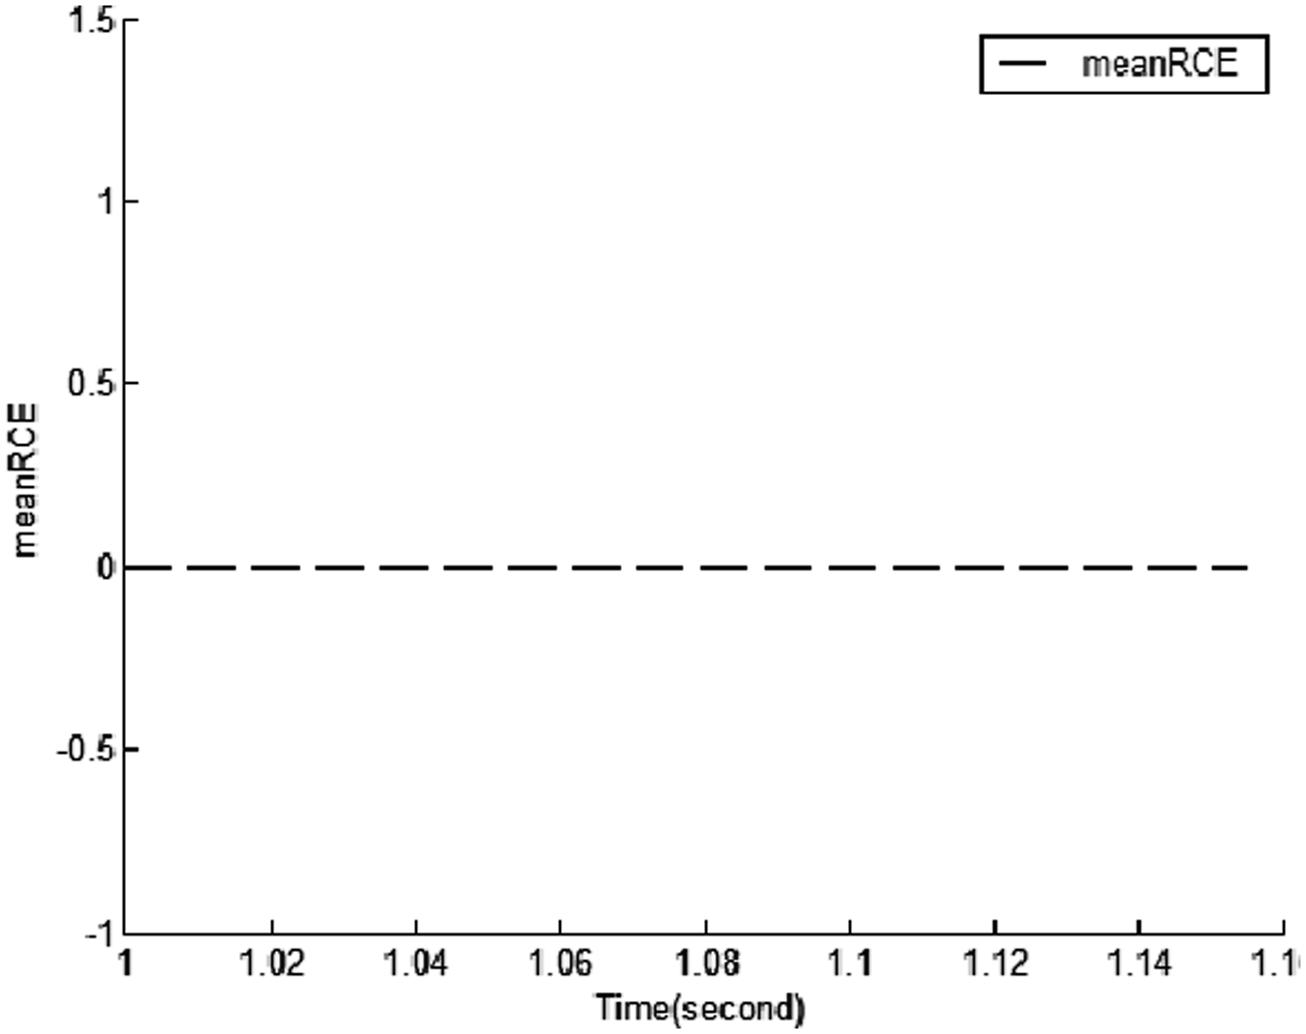
Vehical’s RCE values with regard to time.
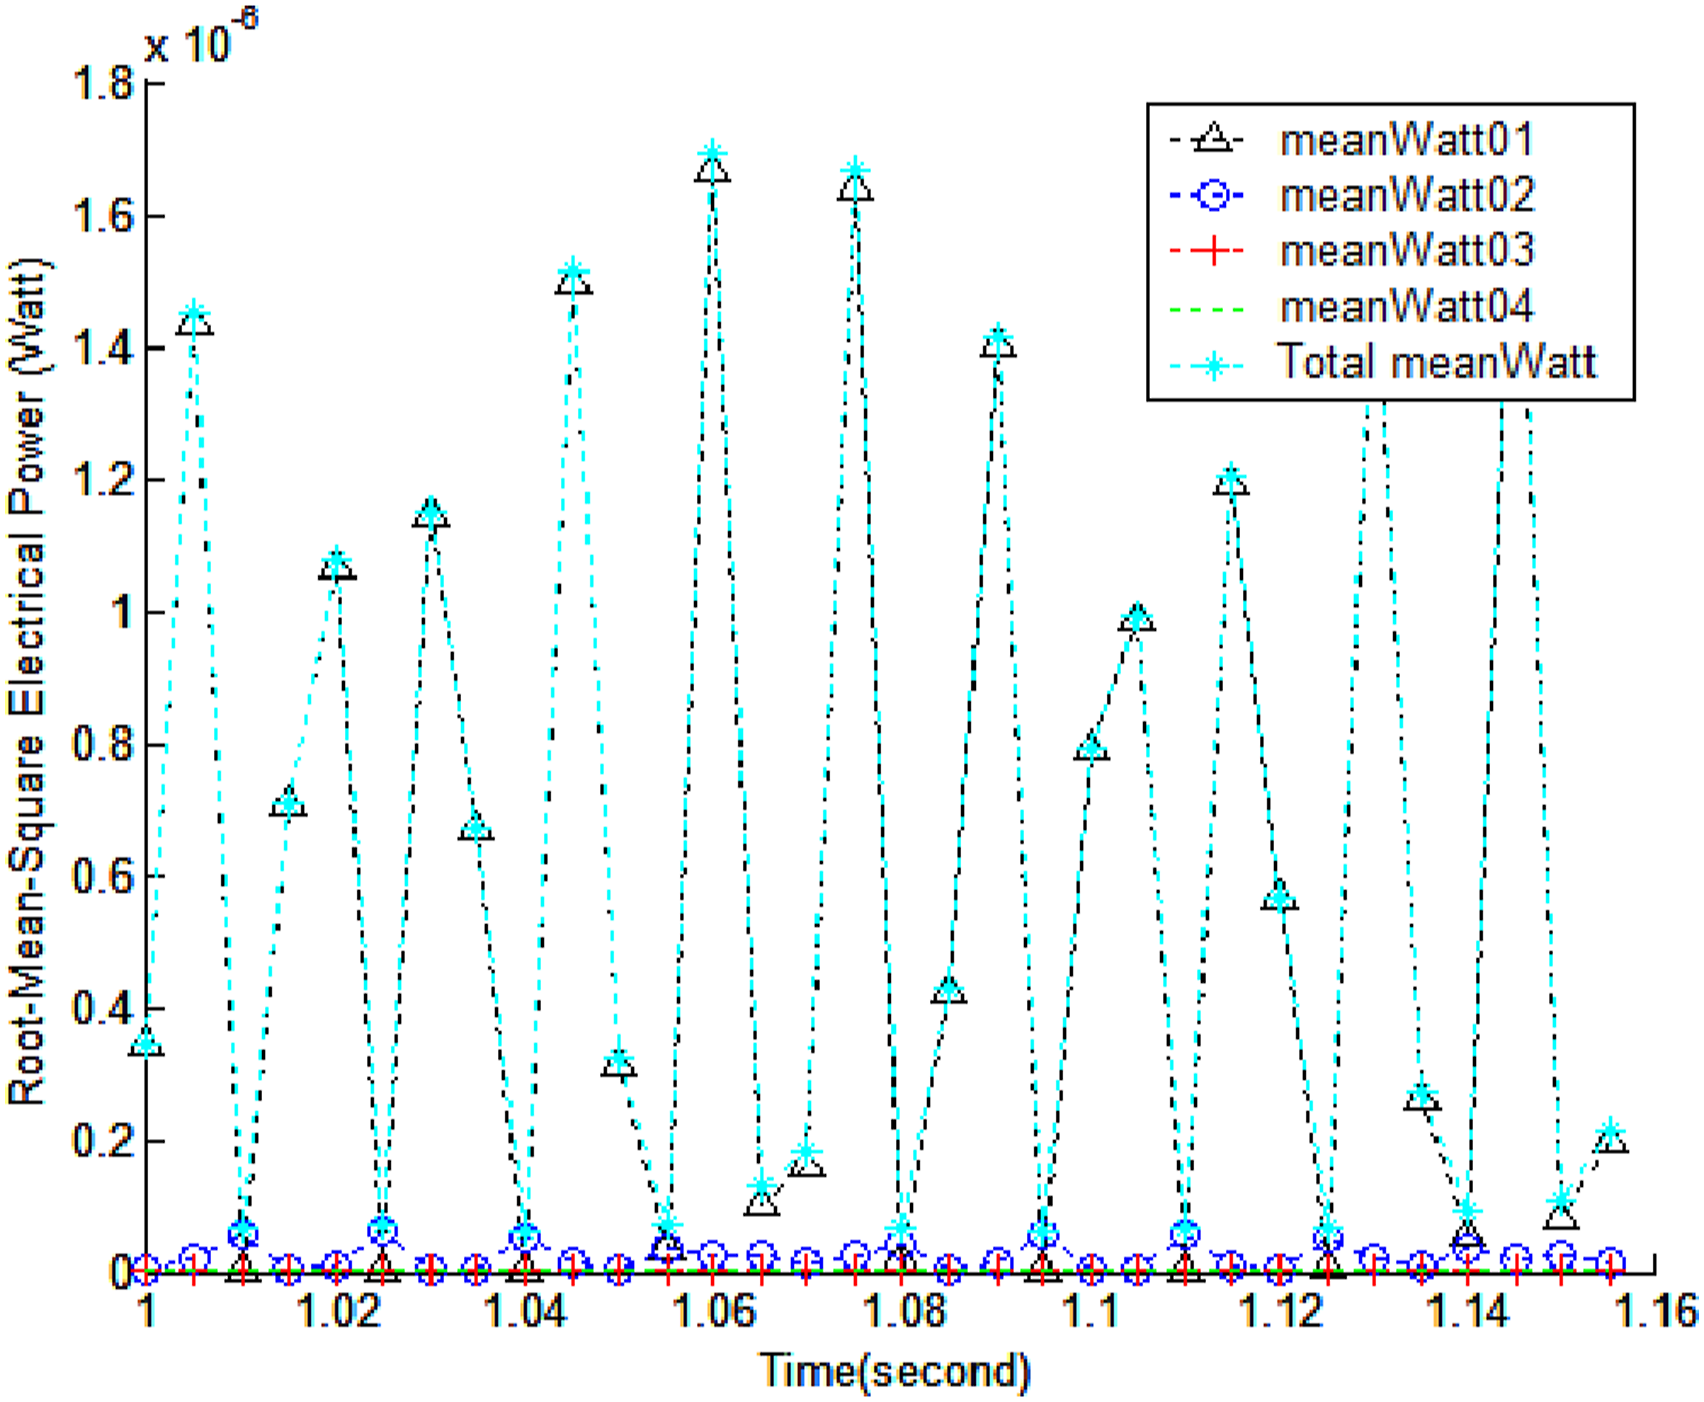
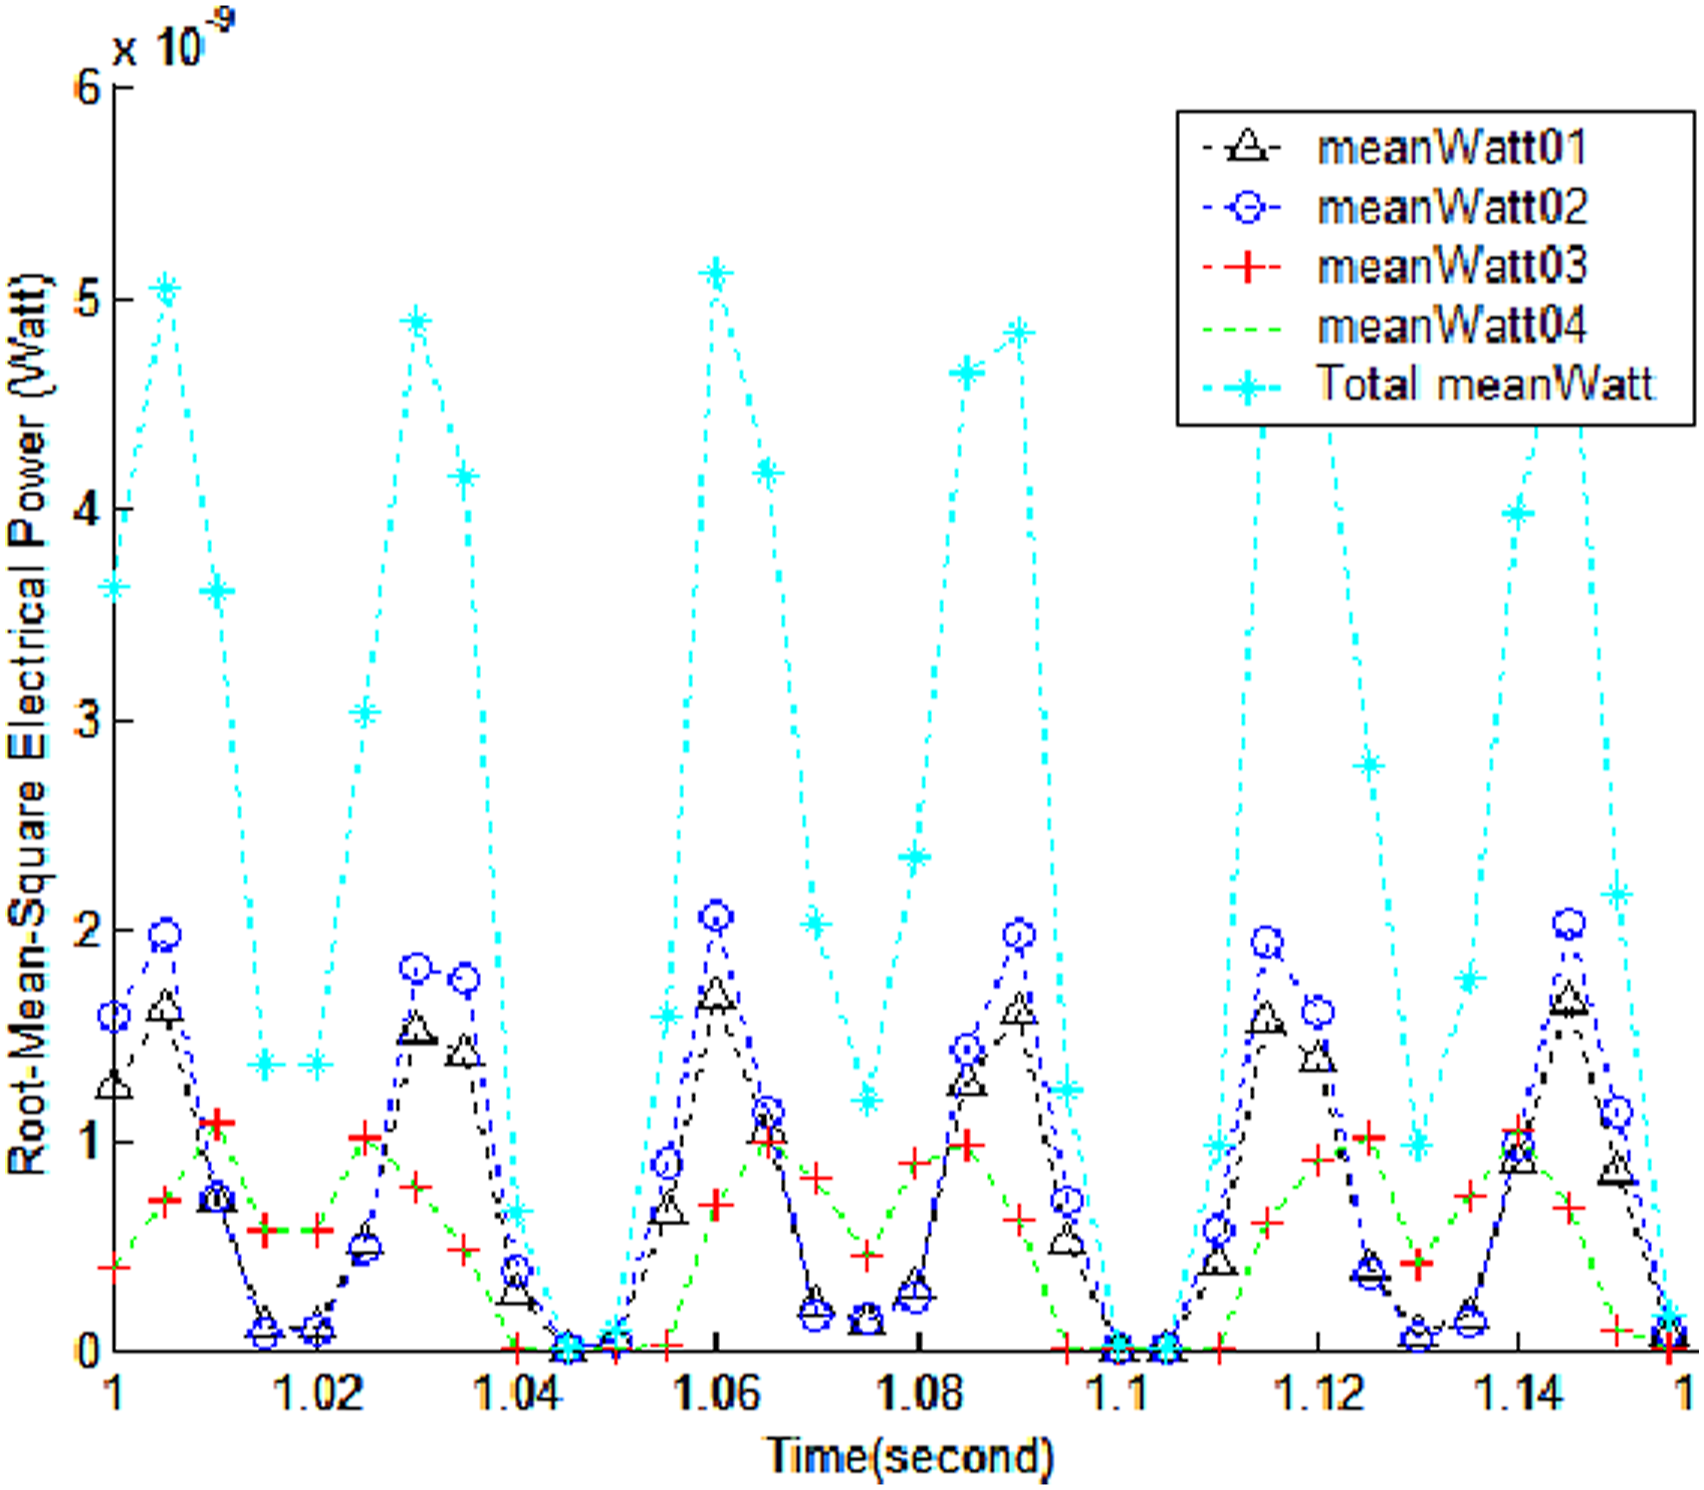
Induced mean electrical powers with regard to time.
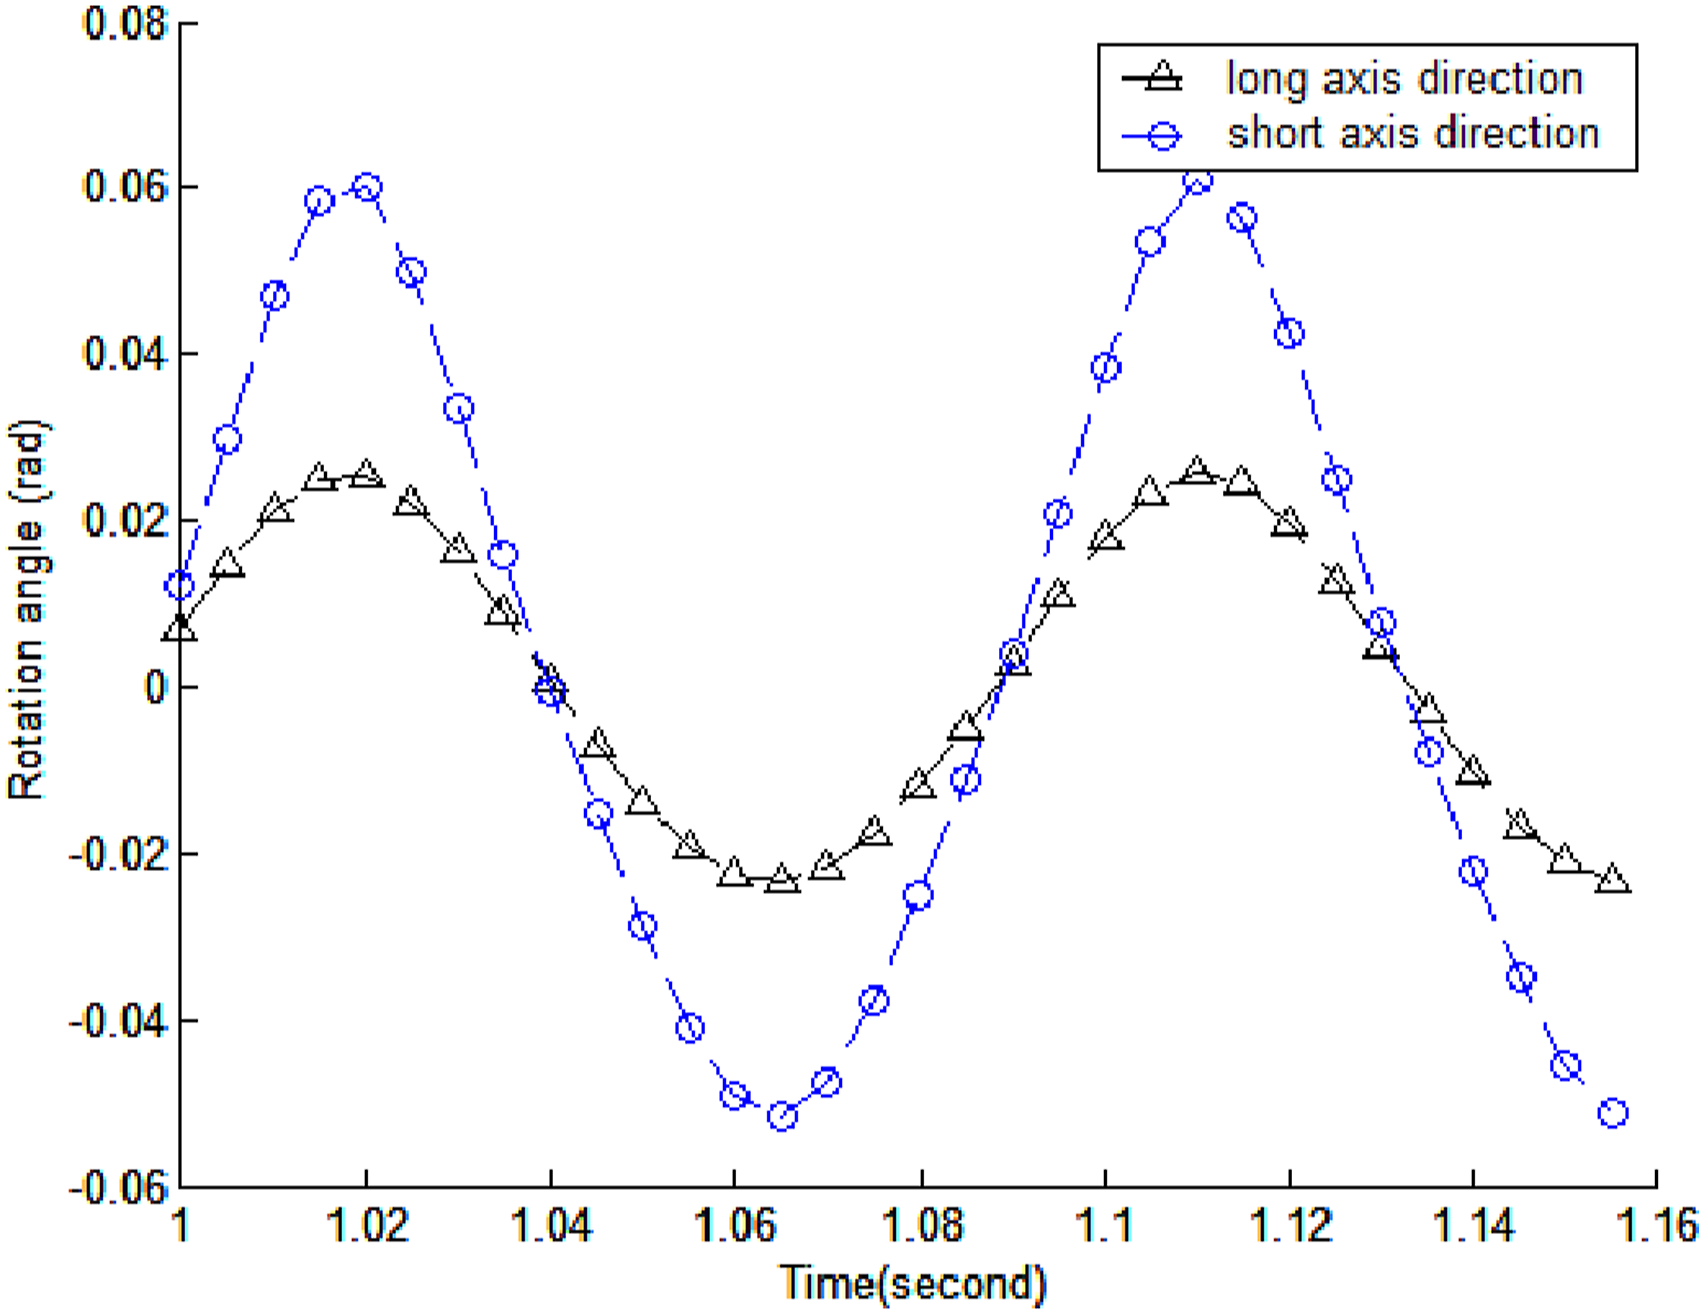
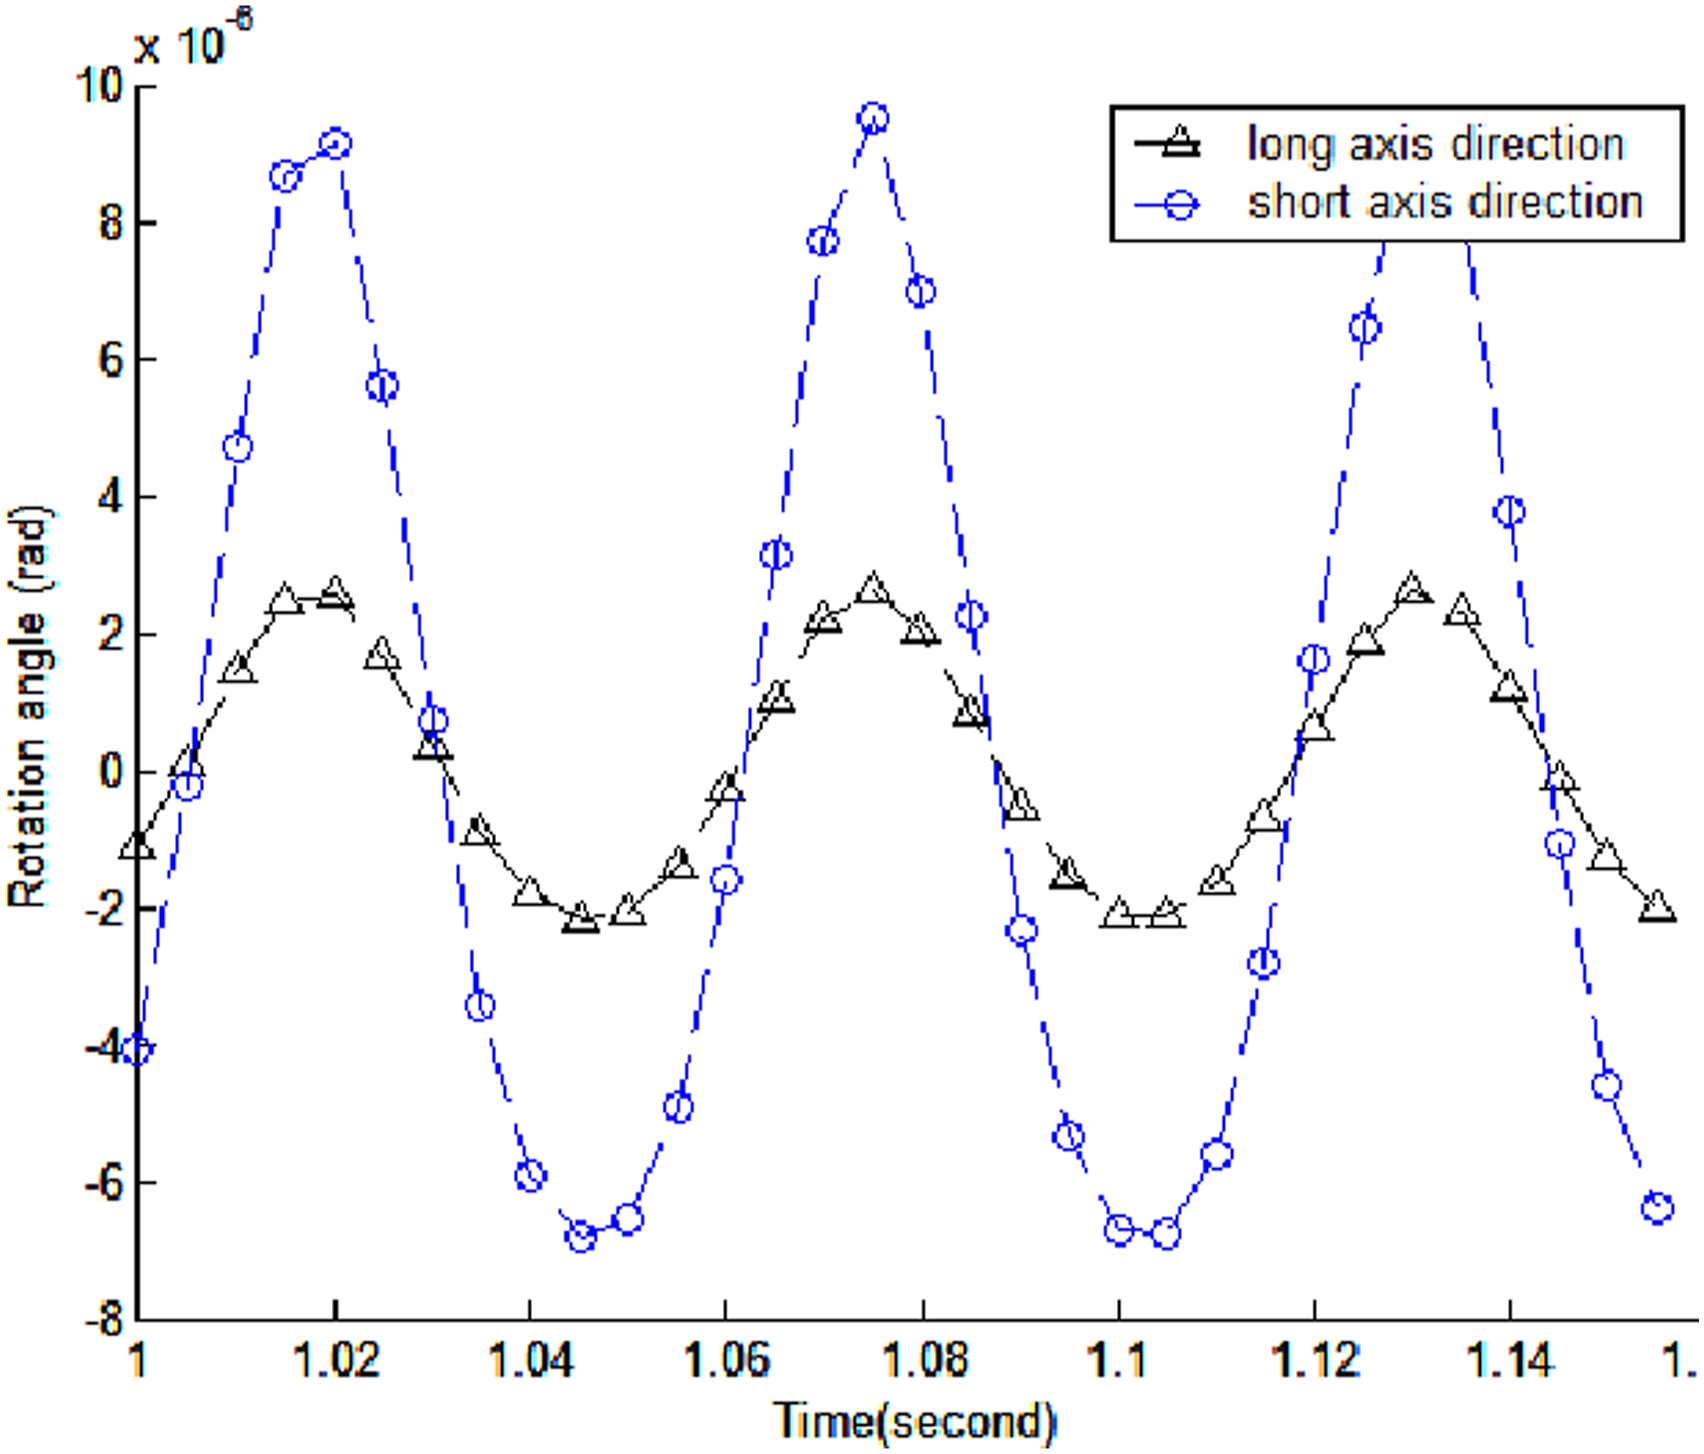
Swing angles of the long axis and short axis of the car’s suspending system to time.
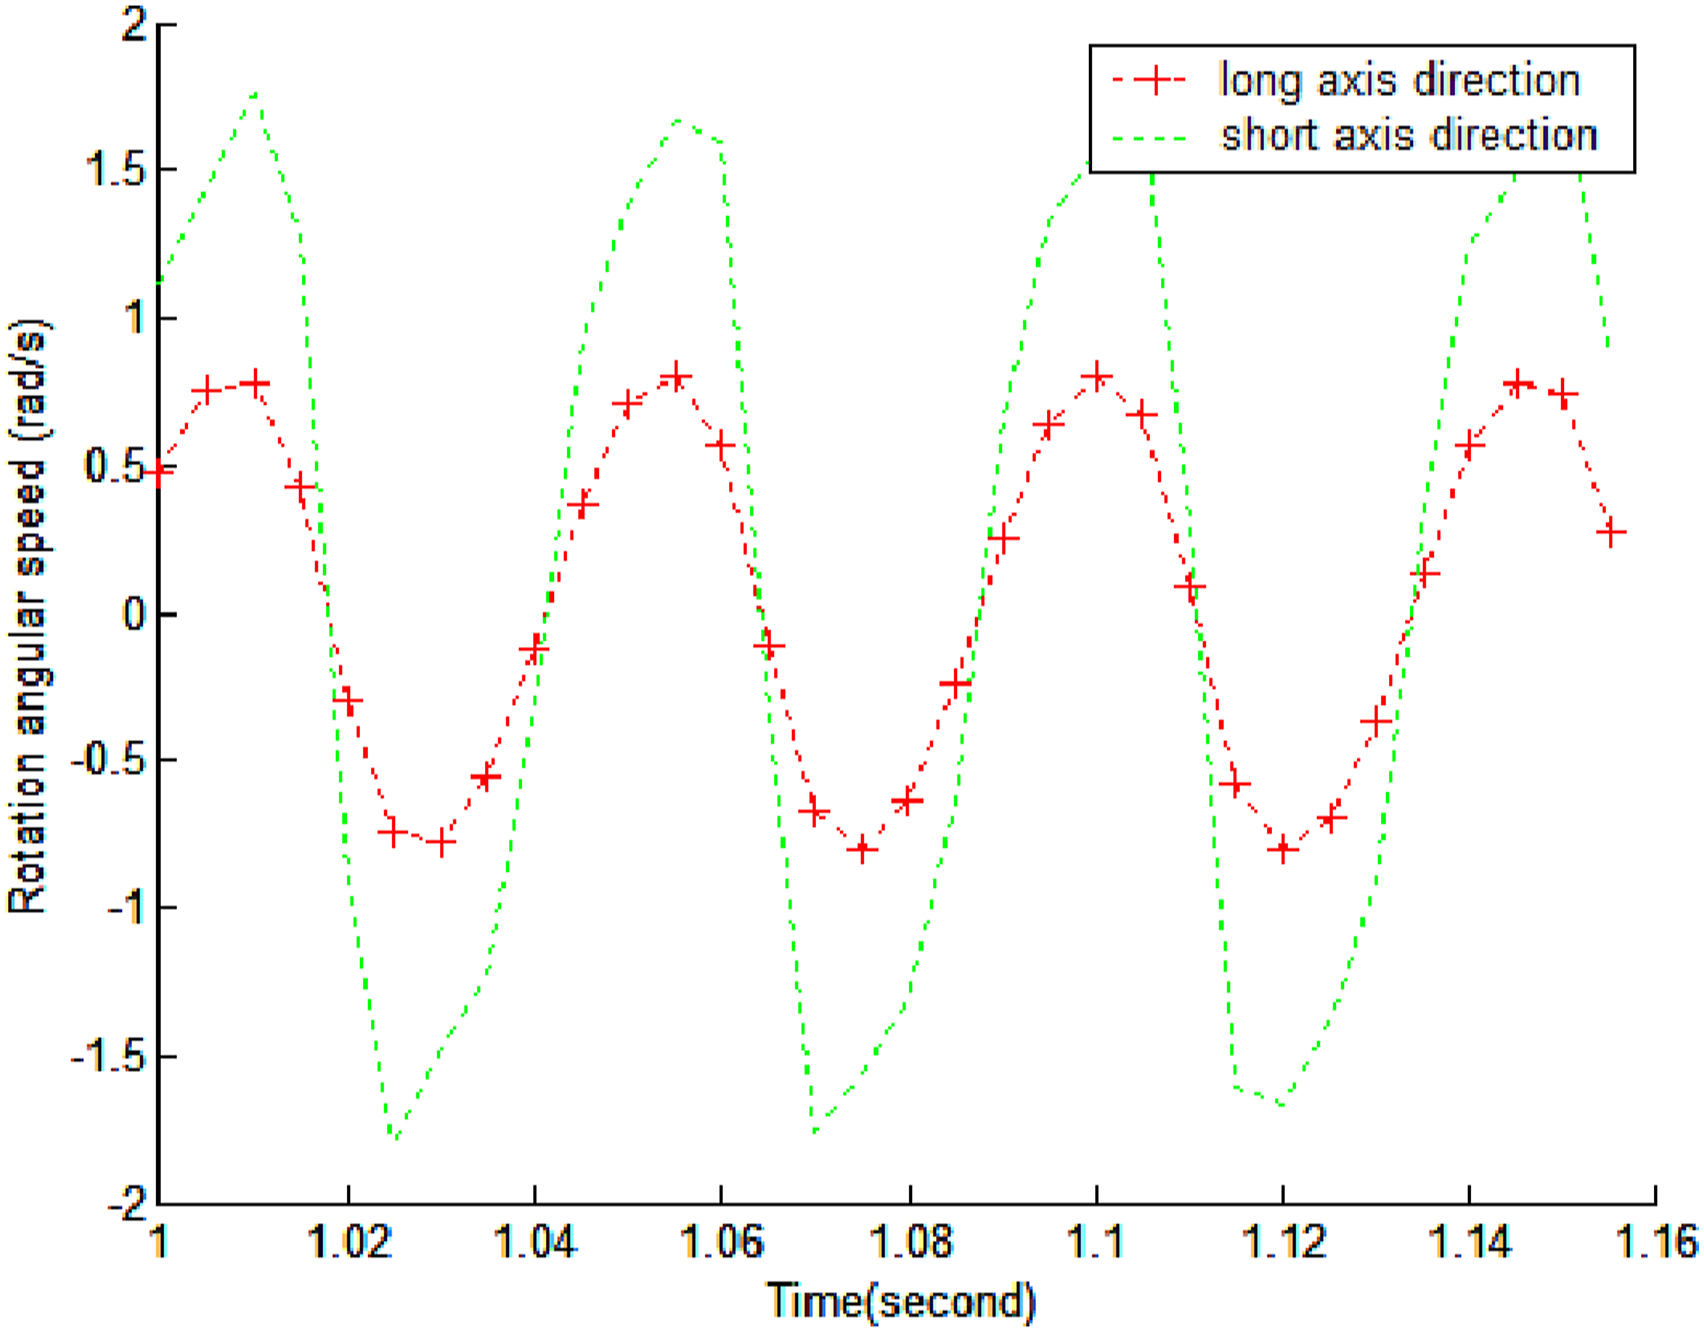
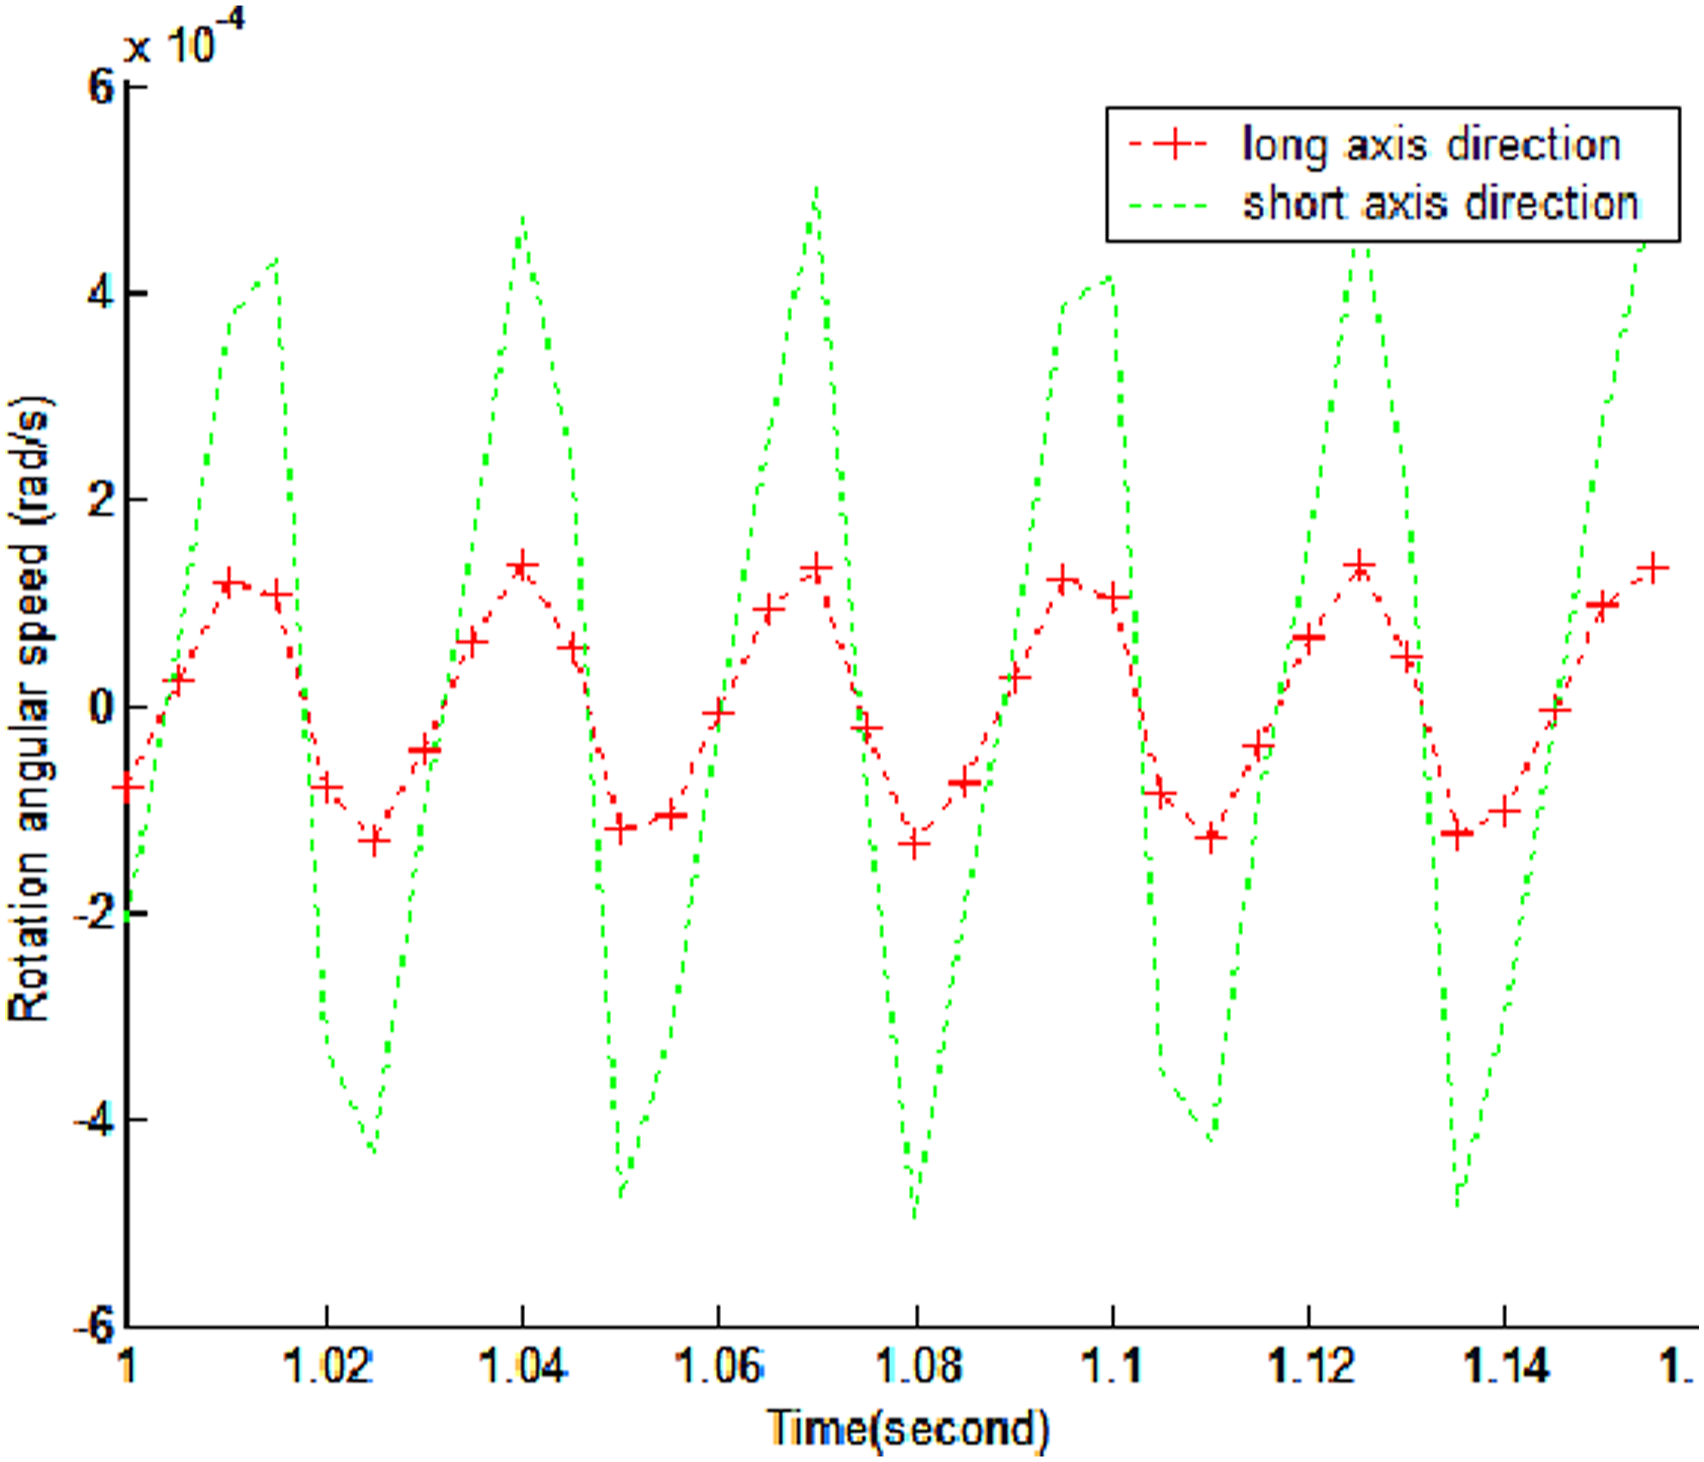
Swing angular velocities of the long axis and short axis of the car’s suspending system to time.
Induced electrical powers with regard to time.
Induced electrical voltages with regard to time.
Adjusting speed bump and road parameters
Keeping a constant speed of 60 km/h, fixing suspension system and energy harvester parameters, a two-dimensional vehicle suspension system parameter optimization is performed using genetic algorithm with the goal of optimizing meanGE and RCE. The optimal parameters obtained are AA = 0.433 (m), OBJ1 = 0.3508 E+01. These optimal parameters are shown in the graph 27–34 below.
Discussion
Vehicle suspension System’s parameter design
The optimization with the objective of minimizing RCE is combined with maximum power transfer rate (GE). Under the goal of minimizing RCE by combining maximum induction power transfer rate (GE) according to Table 1, setting the speed bump as a sine curve, BB = 2AA, and using GA control parameters (pop, chrm, pc, pm, itermax) = (120, 20, 0.99, 0.08, 2000), the maximum power generation (PW) and the corresponding optimal parameters for the vehicle suspension system and energy harvester (Dm1, Dm2, Dm3, Dm4, Hm1, Hm2, Hm3, Hm4, Nc1, Nc2, Nc3, Nc4, NL1, NL2, NL3, NL401, Mo, M1, M2, M3, M4,
The vertical acceleration amplitude of the vehicle body’s front and rear four wheels is between 0.0 and 2.8 (m/s2); the current ride comfort index of the vehicle suspension system and its time relationship are shown in Figure 21, and the average ride comfort tends to be 0.0; the average power-time diagram of the front and rear four-wheel regenerative energy harvesters is shown in Figure 22, and the peak power amplitude of the front and rear four-wheel regenerative energy harvesters is 0.0–1.7 × 10⁻⁵ (watt), with a peak total power of 1.7 × 10⁻⁵ (watt); the angle-time diagram of the front and rear (long axis) swing and left and right (short axis) swing of the vehicle body suspension system is shown in Figure 23, with an amplitude of 0.024 (rad) and 0.06 (rad) for the swing angle of the long and short axes of the front and rear four wheels of the vehicle body; the angular velocity-time diagram of the front and rear (long axis) swing and left and right (short axis) swing of the vehicle body suspension system is shown in Figure 23 ˜ 24, with an angular velocity amplitude of 0.77 (rad/s) and 1.75 (rad/s) for the swing angle of the long and short axes of the front and rear four wheels of the vehicle body.
Adjusting speed bump and road parameters
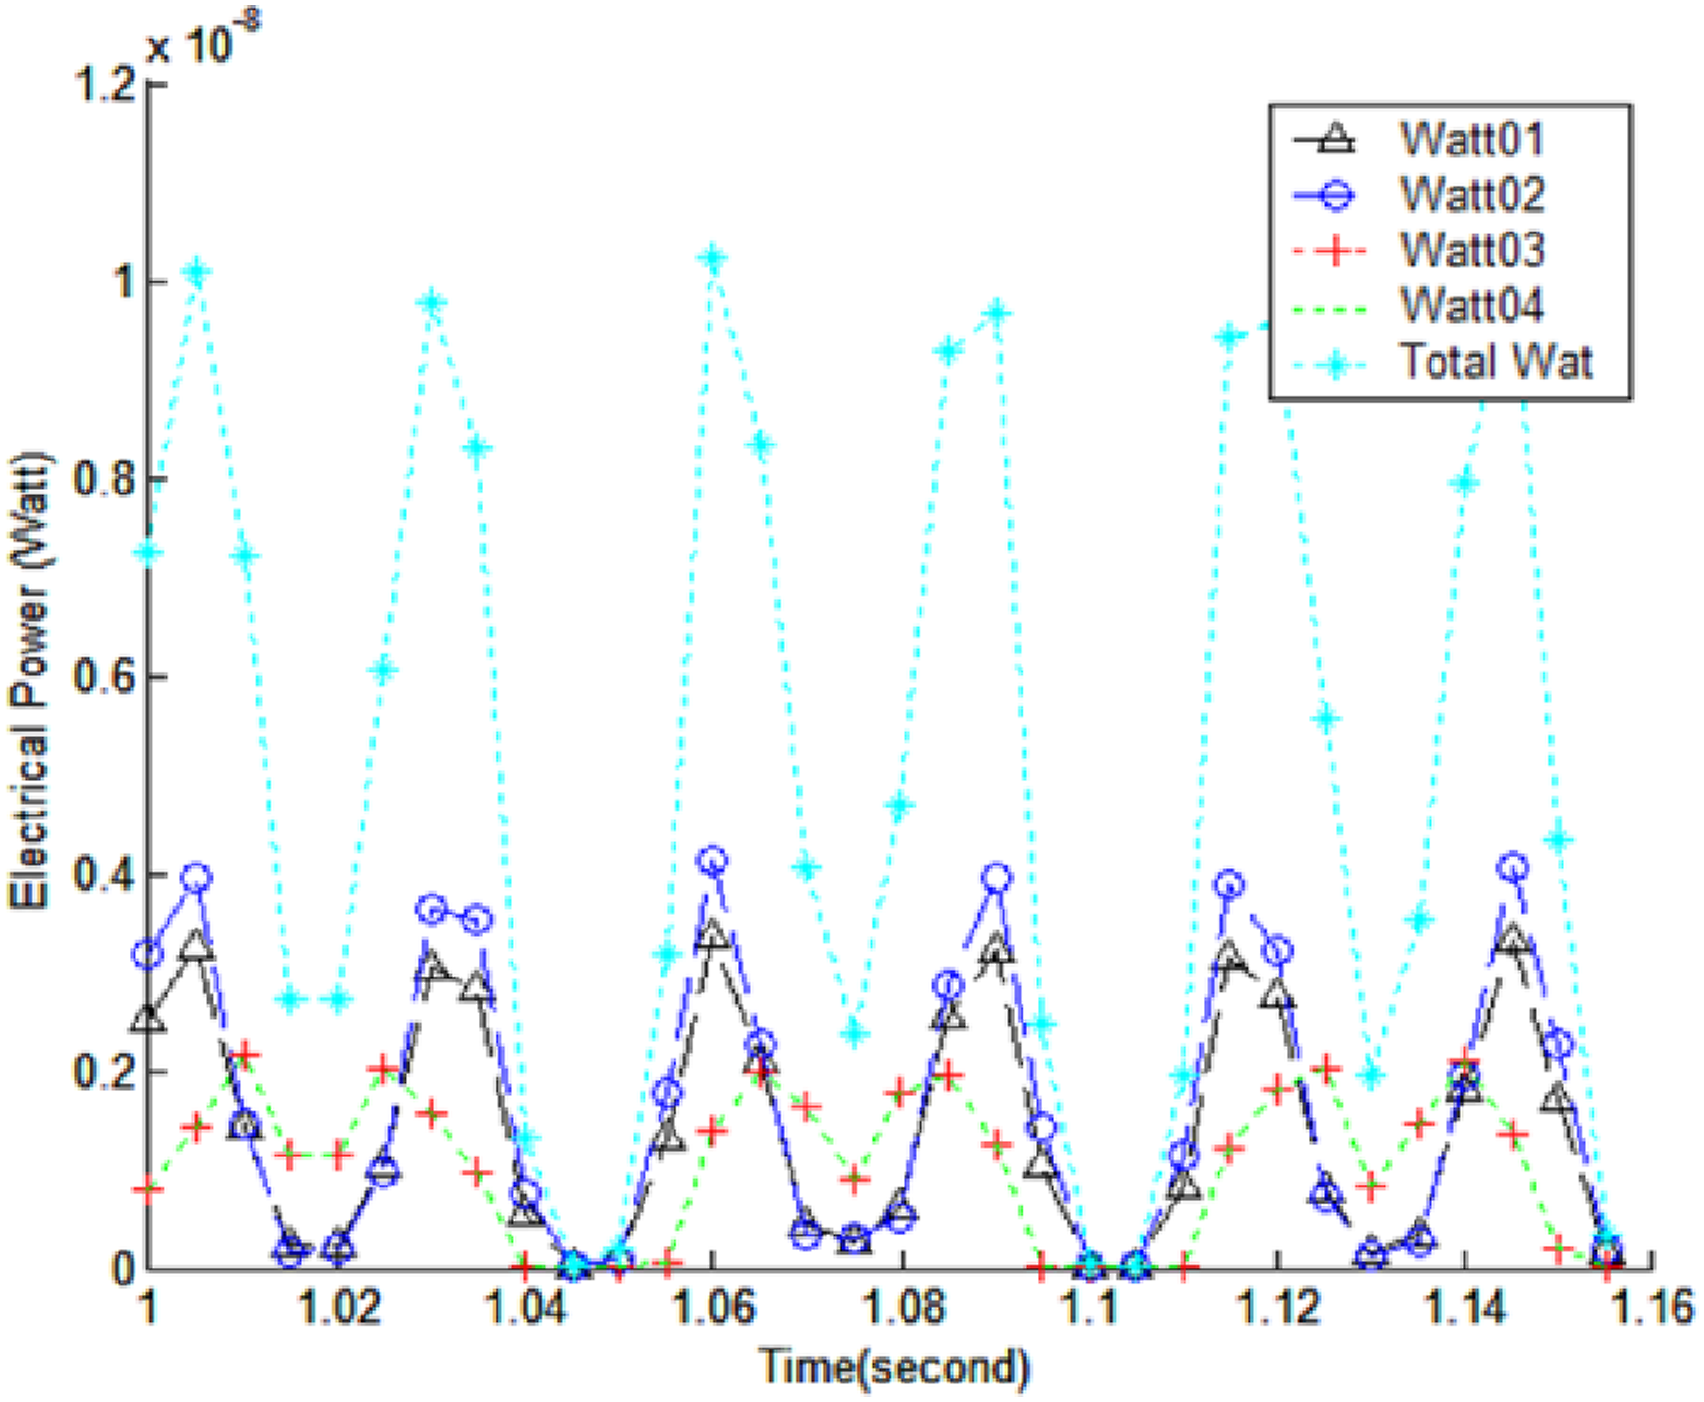
Under the condition of fixed parameters of the vehicle suspension system and energy harvester, the optimization objective is to minimize RCE with maximum induced power transfer rate (GE). The deceleration ramp is set as a sine curve and BB = 2AA. The simulation result shows that the maximum power transfer efficiency (GE) and the corresponding optimized parameter AA are 0.487(m) for the average power output OBJ1. Based on the theoretical formula, the electric power-time graph of the front and rear wheel energy harvesters under the optimized parameters is shown in Figure 25, with the peak power amplitudes of the front and rear wheel energy harvesters ranging from 0.0 to 4 × 10⁻⁹ (watts) and the peak total power of 1 × 10⁻⁸ (watts). The relationship between the induced voltage and time for the front and rear wheel energy harvesters is shown in Figure 26, with the voltage amplitude ranging from 5 × 10⁻⁴ to 1 × 10⁻³ (volts) and the peak total voltage amplitude of 3.5 × 10⁻³ (volts). The relationship between the induced current and time for the front and rear wheel energy harvesters is shown in Figure 27, with the current amplitude ranging from 2 × 10⁻⁶ to 3.5 × 10⁻⁶(A) and the peak total current of 1.2 × 10⁻⁵(A). In addition, the relationship between the vertical displacement and time of the front and rear wheel suspensions is shown in Figure 28, with the amplitude ranging from 0.0 to 2 × 10⁻⁵(m). The relationship between the vertical velocity and time of the front and rear wheel suspensions is shown in Figure 29, with the amplitude ranging from 0.0 to 2.1 × 10⁻³ (m/s). The relationship between the vertical acceleration and time of the front and rear wheel suspensions is shown in Figure 30, with the amplitude ranging from 0.0 to 0.07 (m/s2). The current ride comfort index of the vehicle suspension system over time is shown in Figure 31, with an average ride comfort approaching 0.0. The power-time graph of the average power output for the front and rear wheel energy harvesters is shown in Figure 32, with the peak average power amplitudes of the front and rear wheel energy harvesters ranging from 4 × 10⁻¹⁰ to 2 × 10⁻⁹ (watts) and the peak total average power of 5.2 × 10⁻⁹ (watts). The relationship between the front and rear (longitudinal) and left and right (lateral) swing angles of the vehicle suspension system over time is shown in Figure 33, with the amplitude of the longitudinal and lateral swing angles of the front and rear wheel suspensions being 2.7 × 10⁻⁶ radians and 9.2 × 10⁻⁶ radians, respectively. The relationship between the front and rear (longitudinal) and left and right (lateral) swing angular velocities of the vehicle suspension system over time is shown in Figure 34, with the amplitude of the longitudinal and lateral swing angular velocities of the front and rear wheel suspensions being 1.2 × 10⁻⁴ (rad/s) and 4.3 × 10⁻⁴ (rad/s), respectively. Induced electrical currents with regard to time. Vertical displacements of the wheels with regard to time. Vertical velocities of the wheels with regard to time. Vertical accelerations of the wheels with regard to time. Vehical’s RCE values with regard to time. Induced mean electrical powers with regard to time. Swing angles of the long axis and short axis of the car’s suspending system to time. Swing angular velocities of the long axis and short axis of the car’s suspending system to time.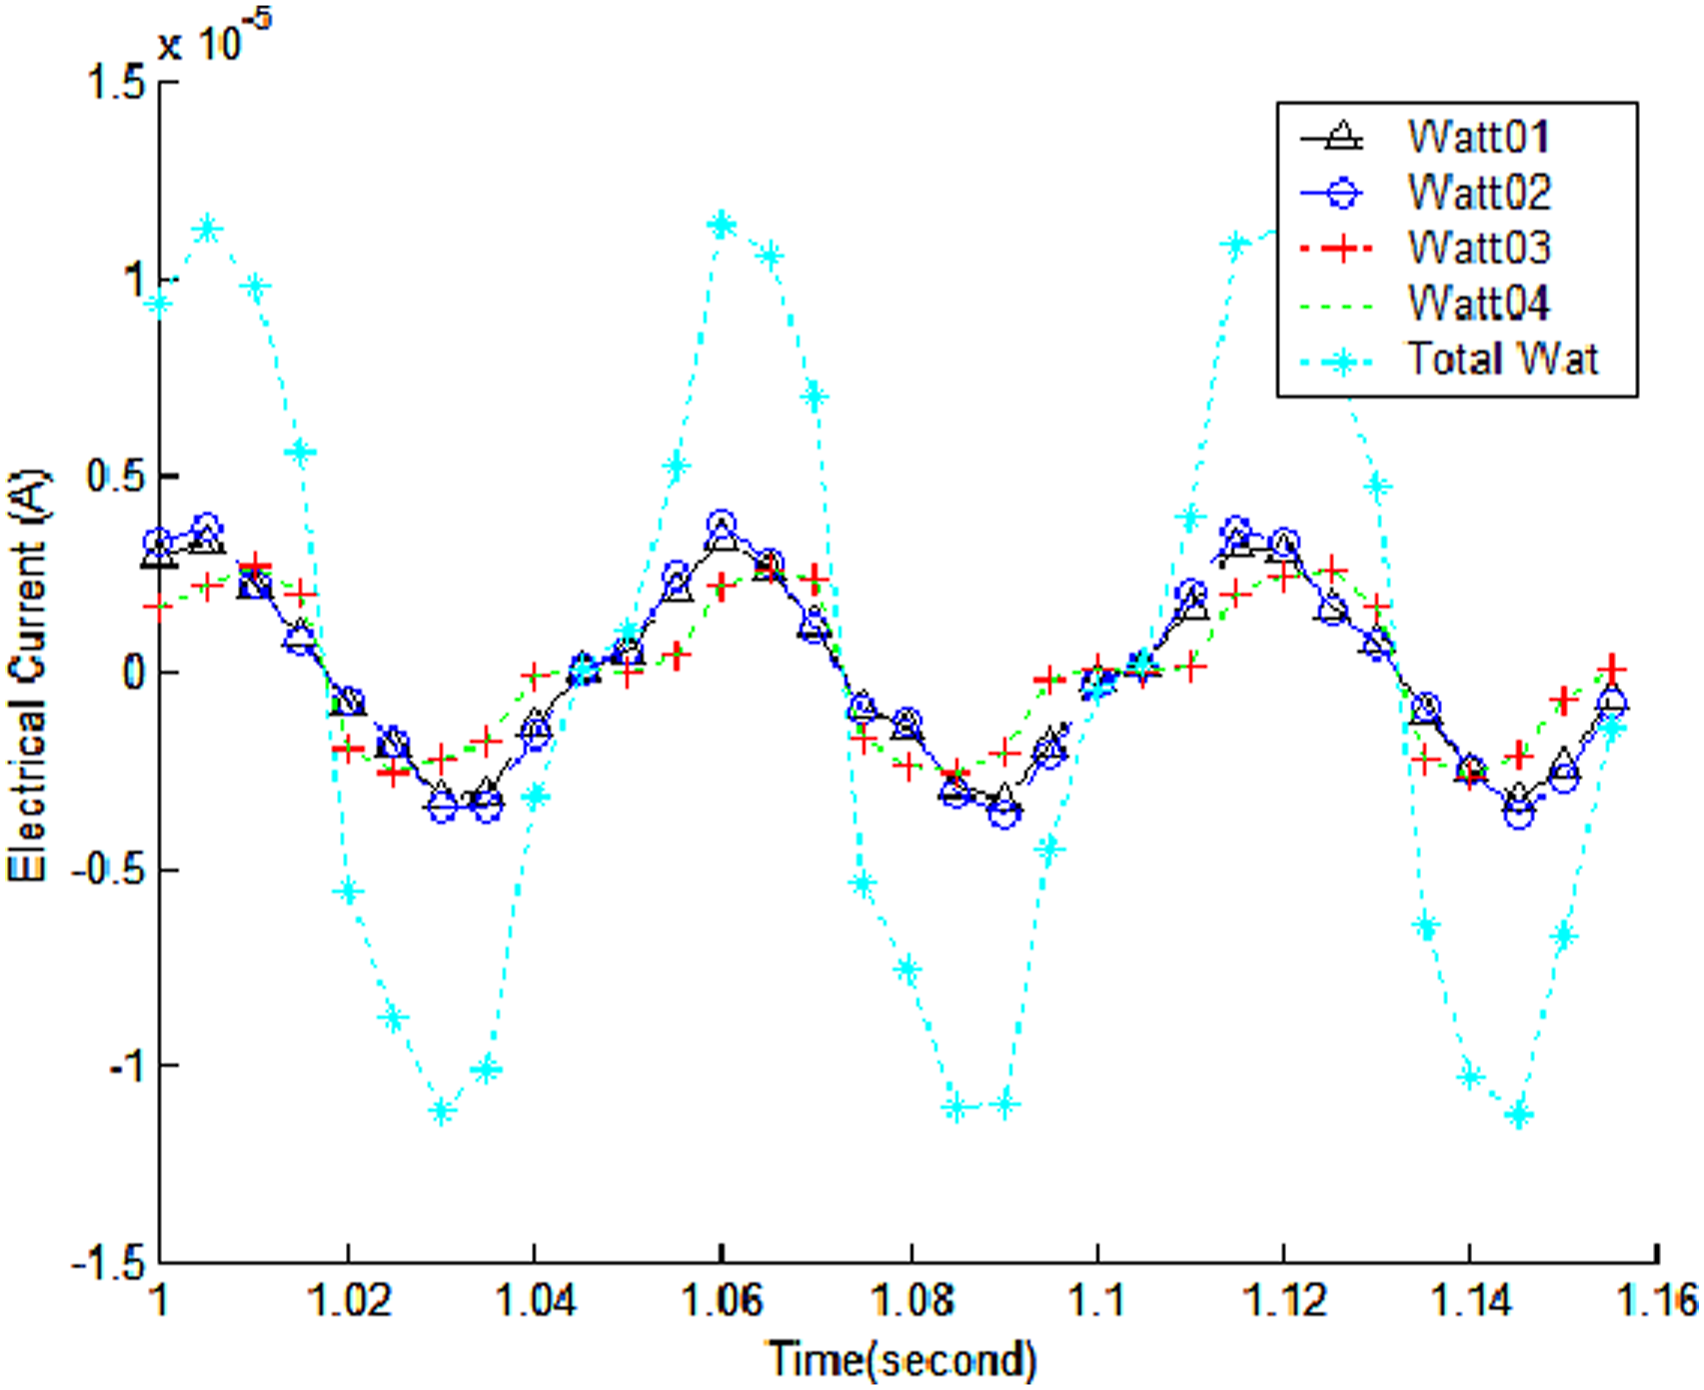
Conclusion
This study investigates the optimization design of a vibration energy harvesting device using a 3D-vehicle suspension damping system model and a continuous half-sine wave road surface (speed bump). This study uses four vibration energy harvesters to replace the existing shock absorbers above the wheels. When the vehicle passes over the deceleration strip, it induces heave and pitch motions, generating electricity through the vibration energy harvesters. The amplitudes of the front-to-rear (long axis) and left-to-right (short axis) oscillations of the vehicle body suspension system are 0.024 rad and 0.06 rad, respectively. The angular velocity amplitudes for these oscillations are 0.77 rad/s and 1.75 rad/s, respectively.
First, a quantitative analysis of the power generation performance of the relevant energy harvesters showed that the speed pump, springs, and dampers significantly affect the amount of energy generated. Changes in the number of turns of the winding coil, number of layers, and diameter of the wire also affect the performance of the energy harvesters. Based on the above analysis, several energy harvesters have been synthesized and their performance optimized using Simulated Annealing, a 3D car model, and half-sign wave road profile. It was shown that a chosen road profile produced very little electricity. This is because when the wheels of the vehicle travel on a continuous half-sine wave road surface, the road surface irregularities are small, and therefore the amplitude of the vehicle body vibration is also small. Second, a detailed investigation is conducted to adjust the parameters of the speed bump and the road. Using the objective function of maximum power transfer efficiency (GE) under the assumption of a deceleration ramp with BB = 2AA, the optimized parameter AA is determined to be 0.487 m during the optimization process. To enhance the generation of sustainable green energy from road base excitations, exploring various speed bump designs will be an important focus for future work.
This study introduces an innovative self-powering approach using a chassis energy harvester that converts vibrations into magnetoelectric energy. This technology enables autonomous green energy generation for transportation vehicles and is particularly suited for use in vehicles navigating consecutive speed bumps. In addition to effectively reducing speed and enhancing traffic safety, the energy harvester generates sustainable green electricity to supplement the power supply of electric vehicles. Consequently, this study replaces the traditional chassis damper with an energy harvester designed to convert kinetic energy into electrical energy. It serves as a reference for transportation departments and electric vehicle designers in the context of speed bump energy harvesting and self-powering electric vehicle designs.
Footnotes
Declaration of conflicting interests
The author(s) declared no potential conflicts of interest with respect to the research, authorship, and/or publication of this article.
Funding
The author(s) declared the following potential conflicts of interest with respect to the research, authorship, and/or publication of this article: The authors recognize the financial support of Ministry of Science and Technology (MOST 111-2221-E-036-006), TW.