
Abstract
The track-specific bridge has the characteristics of a large volume of passenger traffic, narrow transverse width, and large excitation. The long-term and high-frequency operating conditions put forward strict requirements for the safety and comfort of the bridge. Aiming at the problem of achieving fast, accurate, and intelligent evaluation of bridges under the coupling action of trains and temperatures, this paper proposes a method for evaluating the structural vertical stiffness of track-specific suspension bridges under the action of the no-load first train. Firstly, the
Keywords
Introduction
With the rapid development of the social economy and the advancement of urbanization, track-specific bridges have developed rapidly, and suspension bridges have been widely used because of their beautiful appearance and lightweight structure. 1 As a key infrastructure connecting various areas of the city, the structural rigidity of the track bridge directly affects the safety and comfort of train operations. At the same time, the high-frequency and long-term operation of urban rail transit put forward higher requirements for bridge structural vertical stiffness. The existing structural health monitoring system obtains the current health status information of the structure by monitoring load, environment, and structural response. It provides a basis and guidance for maintenance, repair, and management decisions. 2 However, due to the characteristics of the track-specific bridges such as large volume of passenger traffic, narrow transverse width, and large excitation, coupled with time-varying coupling effects such as environmental factors and load action, bridges’ overall and local responses are extremely complex.3,4 This complexity makes the mapping relationship between the actual monitoring value and the theoretical calculation value unclear, and it is difficult to achieve fast, accurate, intelligent evaluation and timely safety warnings based on the safety monitoring system alone.
In recent years, scholars at home and abroad have made useful explorations in the field of bridge structure state assessment. Xiao-gang L et al.5,6 believes that the structural vertical stiffness of a bridge directly determines its dynamic characteristics, which in turn has an important impact on the traffic safety and running stability of trains crossing the bridge. The permanent deformation of bridge main beams is an important manifestation of structural vertical stiffness. 7 To evaluate the vertical stiffness of a bridge and ensure its driving performance, Zheng X-L et al. 8 proposed a rapid evaluation method for the vertical stiffness of a long-span bridge based on the relationship between the amplitude of the chord measurement method, the acceleration of the vehicle body, and the coupled vehicle-bridge vibration analysis. Zhang W-M et al. 9 proposed a fast and accurate deformation evaluation method for the main beam of a suspension bridge. Based on considering the stiffness of the main beam, an analytical expression for the deformation of the main beam of a suspension bridge under concentrated live load was derived by analogy with the bending moment of a simply supported beam and the shape of the main cable. Track bridges are characterized by clear moving loads. When designing the monitoring system, Hong G et al. 10 proposed a rapid load test based on no-load train formation in the morning shift to obtain the verification coefficient as an index to evaluate the structural state of the bridge. Zheng-tong G et al. 11 tested methods such as trapezoidal integration in the time domain, Simpson integration in the time domain, and integration in the frequency domain. Through simulation and comparative study, it is found that the time-domain Simpson integral is easy to calculate, and the accuracy meets the requirements. Xiao-hong X et al. 12 proposed a method based on the Newton–Leibniz formula and Simpson formula, combined with the integral recurrence formula of odd and even sequences, obtained vibration acceleration through acceleration sensors, and then obtained vibration velocity and vibration displacement through integration, which has extremely high calculation accuracy. Machine learning algorithms perform well in detecting structural damage and defects in bridges. Many structural state detection methods based on machine learning algorithms have been proposed and applied in practice.13,14 The CART algorithm has the advantages of high classification accuracy, simple operation, and fast running speed. Through the classification and regression analysis of the damage data, the damage degree of the bridge can be accurately identified. Chang-sheng X et al. 15 extracted structural modal features by the additional mass method and used the CART algorithm for damage location and classification, which verified the accuracy and robustness of the method.
In summary, the present evaluation method is complicated, difficult, and costly, and requires many monitoring items and a wide range of data, so it is not suitable for the rapid, accurate, and intelligent evaluation of the track-specific bridge. Given this, this paper proposes a method for evaluating the structural vertical stiffness of a track-specific suspension bridge based on the action of the no-load first train. Based on Madis/Civil 2023 finite element software, the theoretical calculation value of the most unfavorable section deformation under the load of the no-load first train is simulated. The mathematical method is used to calculate the spatial relationship between the transponder and the safety monitoring system. The accurate deformation-velocity-time data of the train on the bridge is obtained, and then the regression model is established to obtain the correction coefficient. Finally, the structural vertical stiffness is evaluated by analyzing the relationship between the deformation monitoring value and the theoretical calculation value. Based on the world’s largest span self-anchored track-specific suspension bridge, this study will verify the effectiveness and practicability of this method. Then, it will realize the rapid, efficient, and accurate evaluation of the bridge and improve reliable scientific support for the healthy management of the bridge.
Working principle
Method design
To achieve rapid, accurate, and intelligent evaluation of the structural vertical stiffness of the track-specific suspension bridge, numerical simulations were performed using the no-load first train as the object to determine the most unfavorable cross section. The train track is obtained by the transponder, the functional relationship between velocity and time is established, and the spatial relationship between the transponder and the monitoring point of the safety system is calculated by numerical integration. At the same time, the regression model of the deformation monitoring value of the most unfavorable section and the train track on the bridge is established. The monitoring data is modified, and the mapping relationship between the deformation monitoring value and the theoretical calculation value is analyzed, to realize the vertical stiffness evaluation of the current state of the track-specific suspension bridge. Due to the fast velocity of rail transit trains and the short bridge crossing time, the immediate impact of temperature and wind on bridge deformation in a short time is small.
16
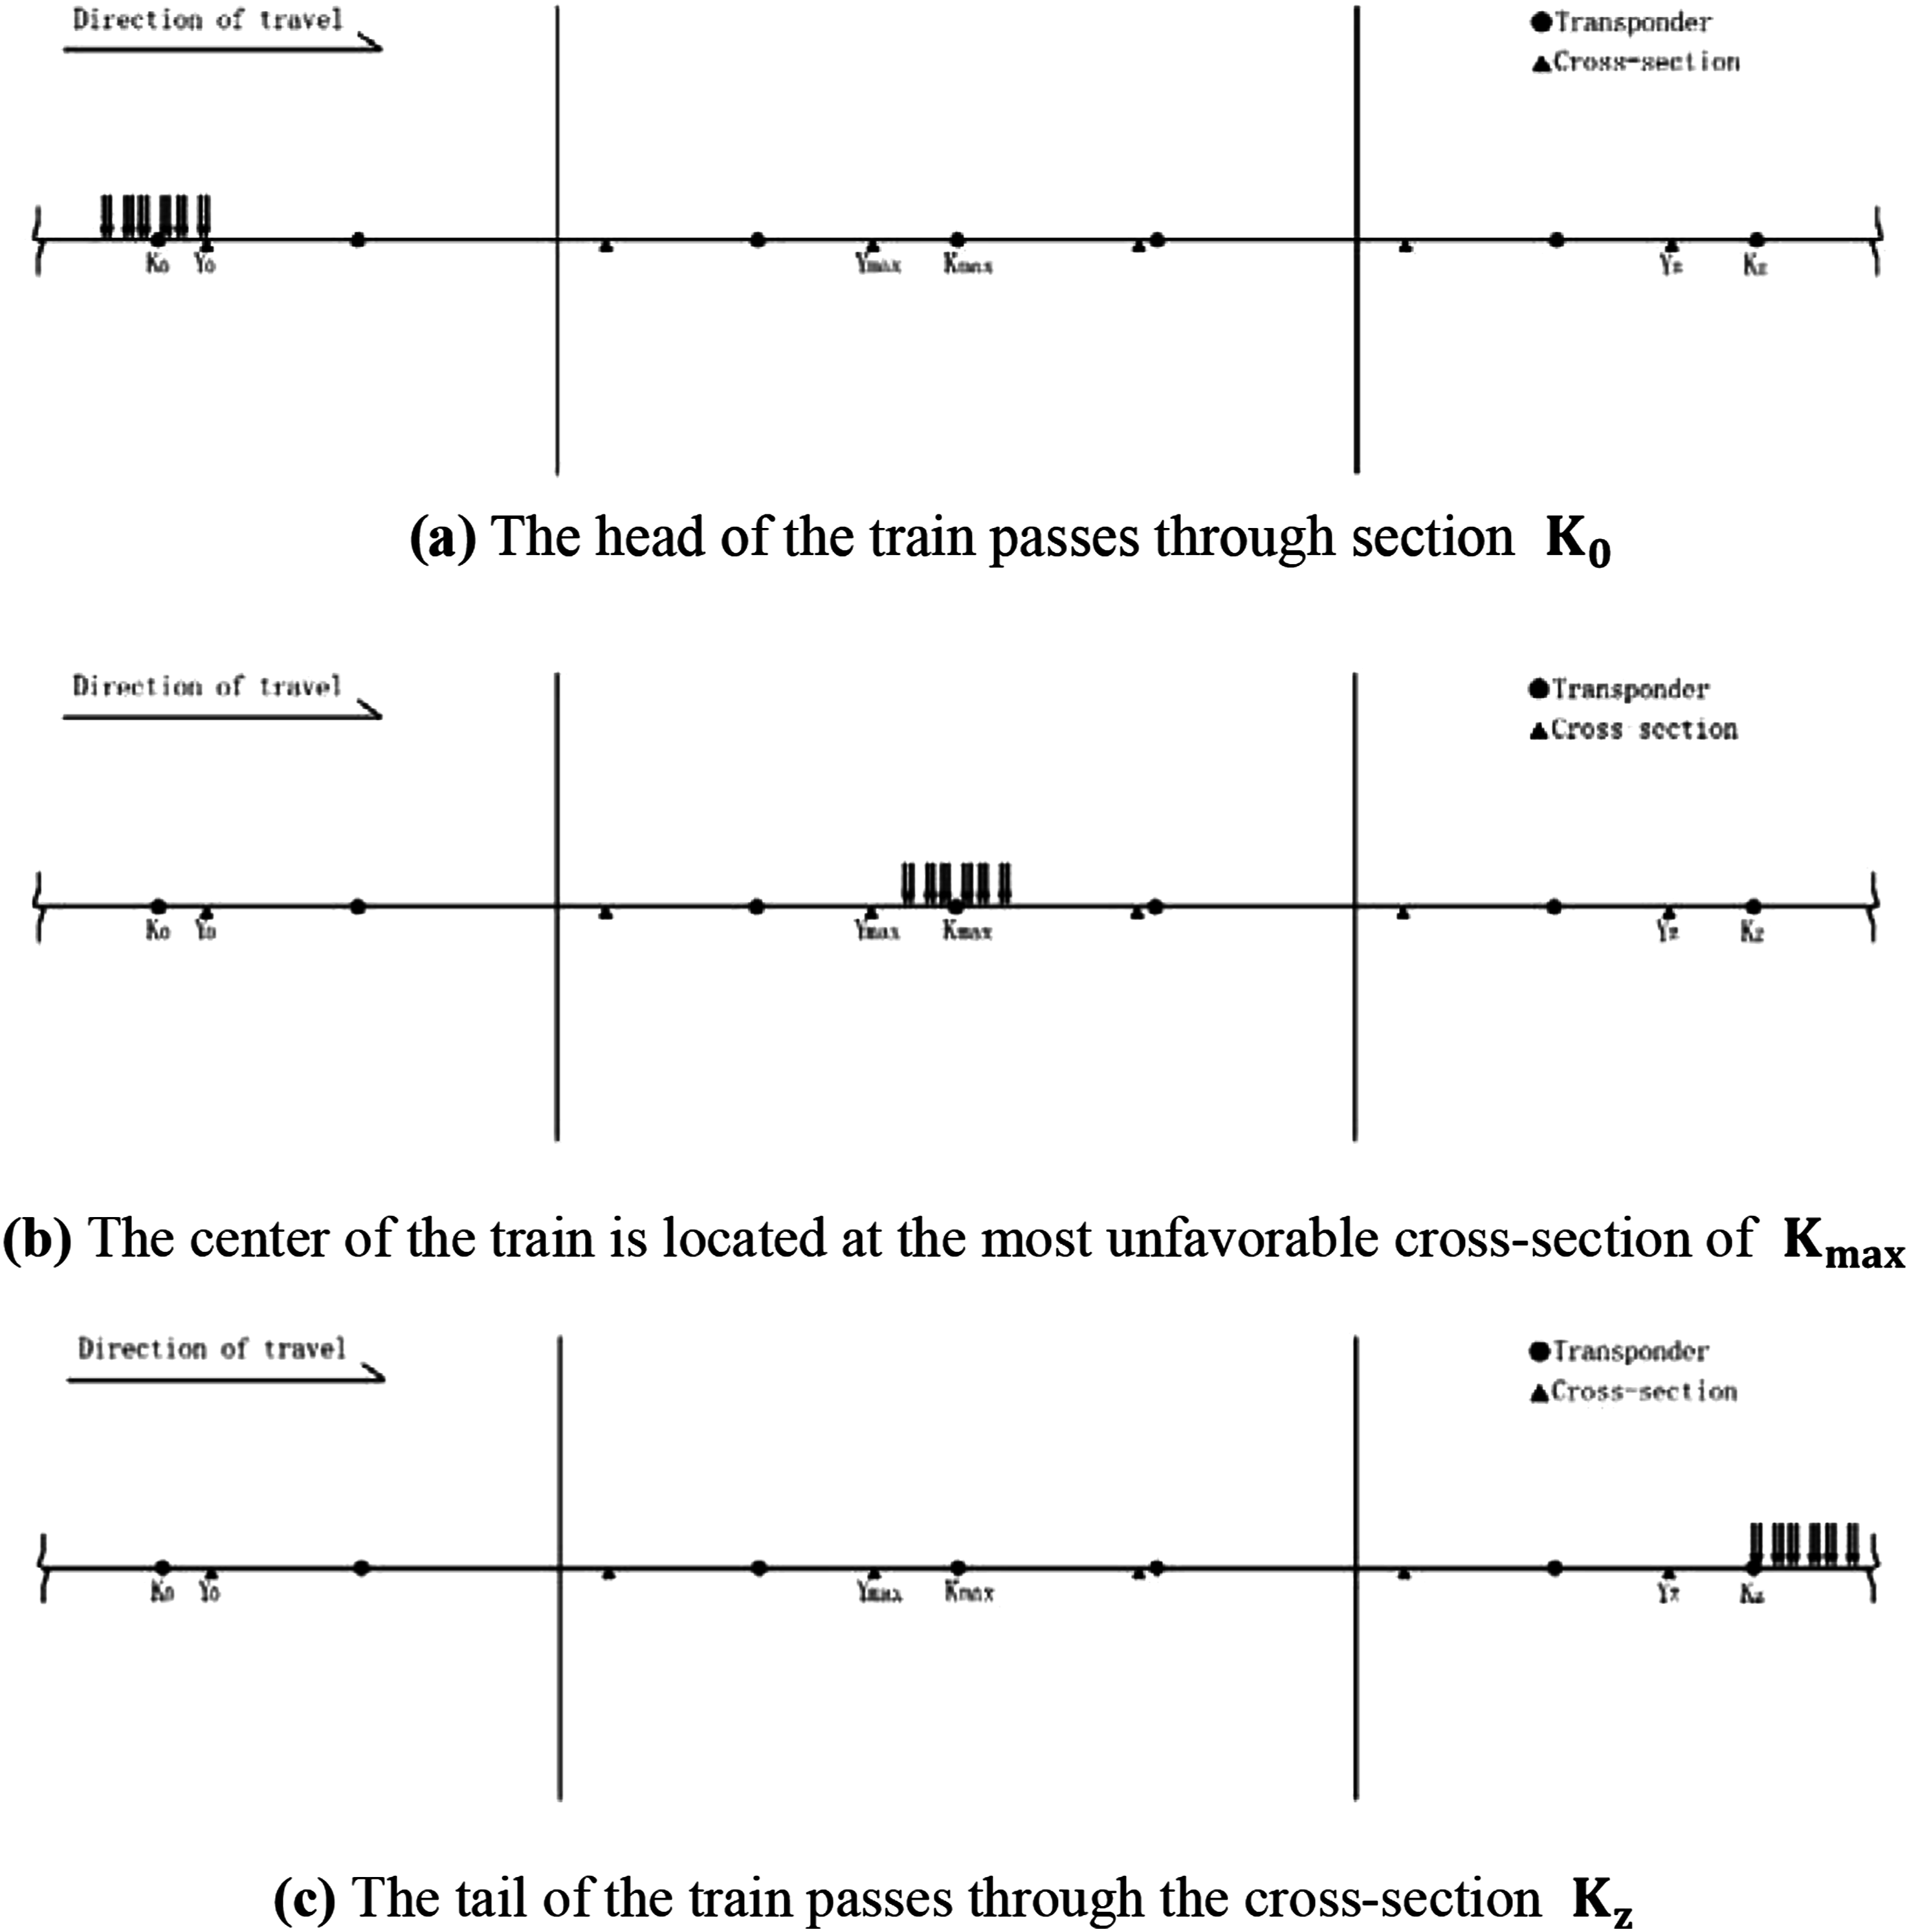
Therefore, the short-term impact of temperature and wind is not considered, thus simplifying the model and calculation. Figure 1 is the technical route of the evaluation method, and Figure 2 is the schematic diagrams of different sections of the train passing through the bridge. Technical route diagram for the stiffness evaluation method. The schematic diagrams of different sections of the train passing through the bridge.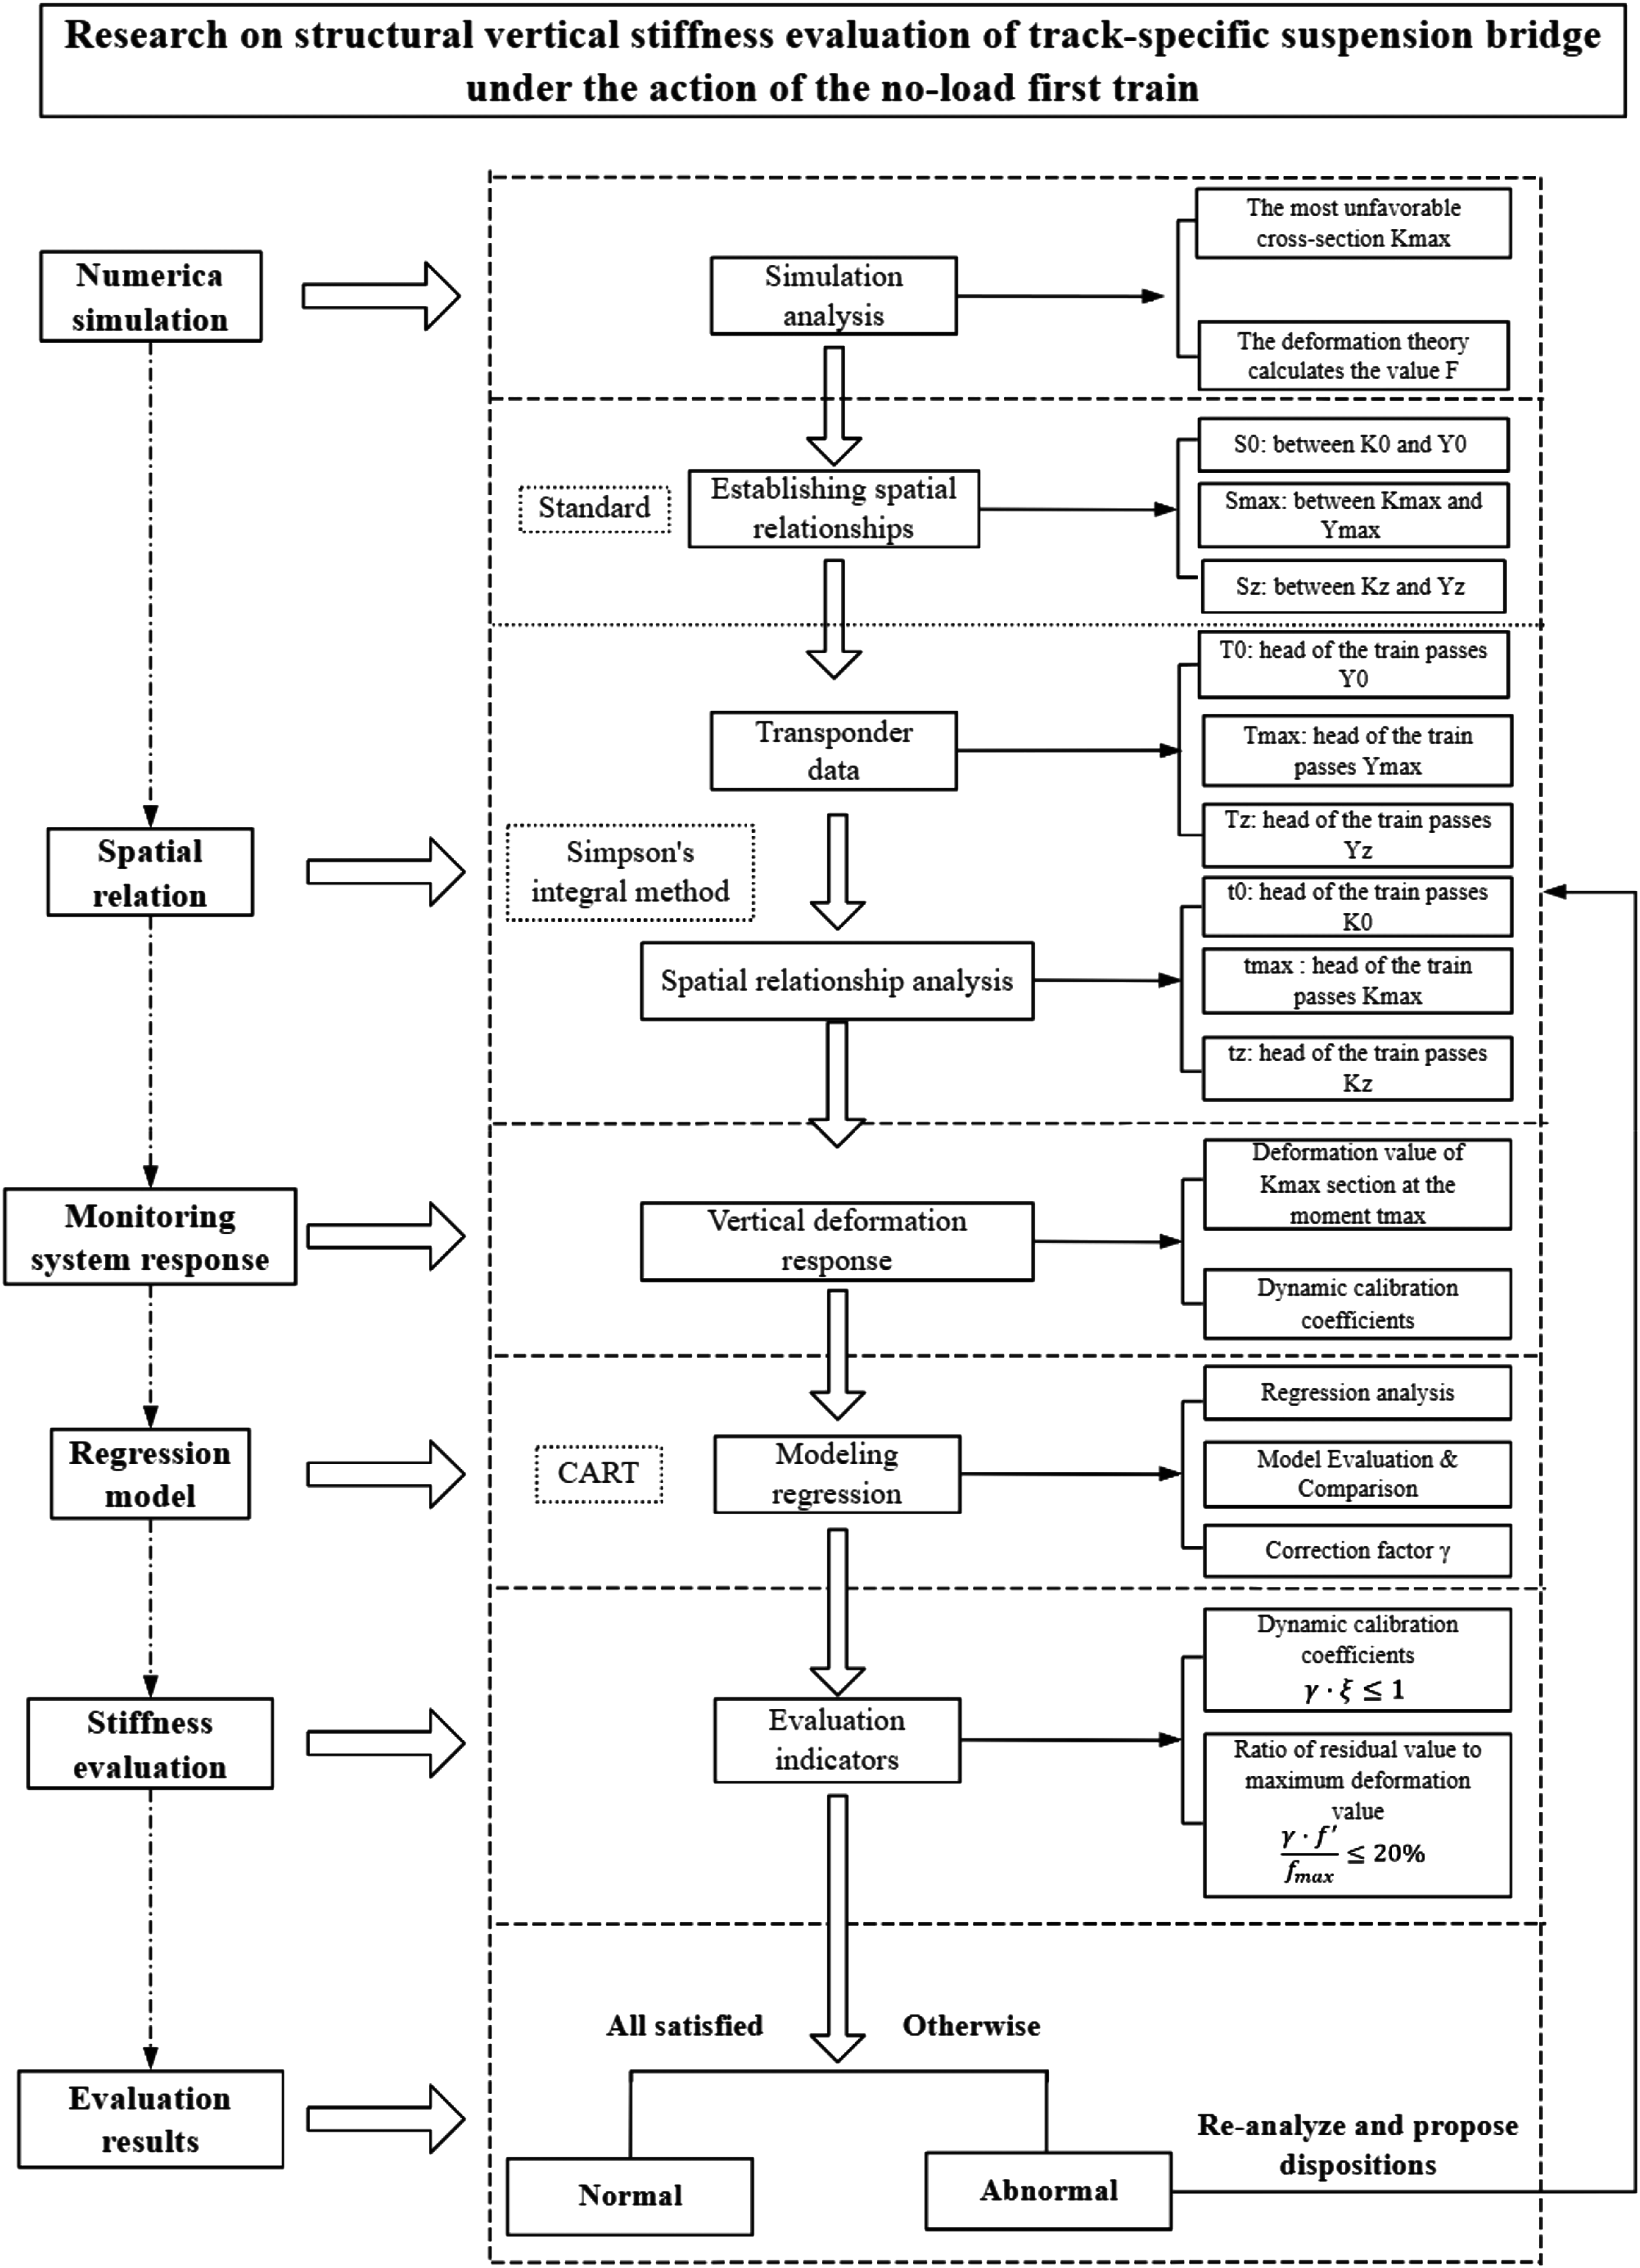
Transponder and monitoring point layout
Transponder setup
To prevent signal interference and ensure safe and efficient train operation, the standard of transponder layout in specification
17
should be followed. The spacing of the transponders in the group is Transponder group diagram.
Safety monitoring system measuring point layout
The safety monitoring system can identify the status of the bridge through environmental and load monitoring and structural response monitoring.18,19 In the monitoring process, the high frequency and long duration of vehicle operation, and complex environmental factors are important sources of excitation. Given the characteristics of the track-specific bridge, such as large volume of passenger traffic, narrow transverse width, large excitation, and high frequency, the monitoring content should comprehensively acquire the on-board load, environmental information, and dynamic parameters. 20 According to the code, 21 relevant provisions are made for monitoring items and measuring points of deformation measurement of track bridges. The longitudinal deformation of the beam should be monitored at the midpoint, quarter points, and support points at the beam ends in each span, and the measurement points should be fixed on the beam body.
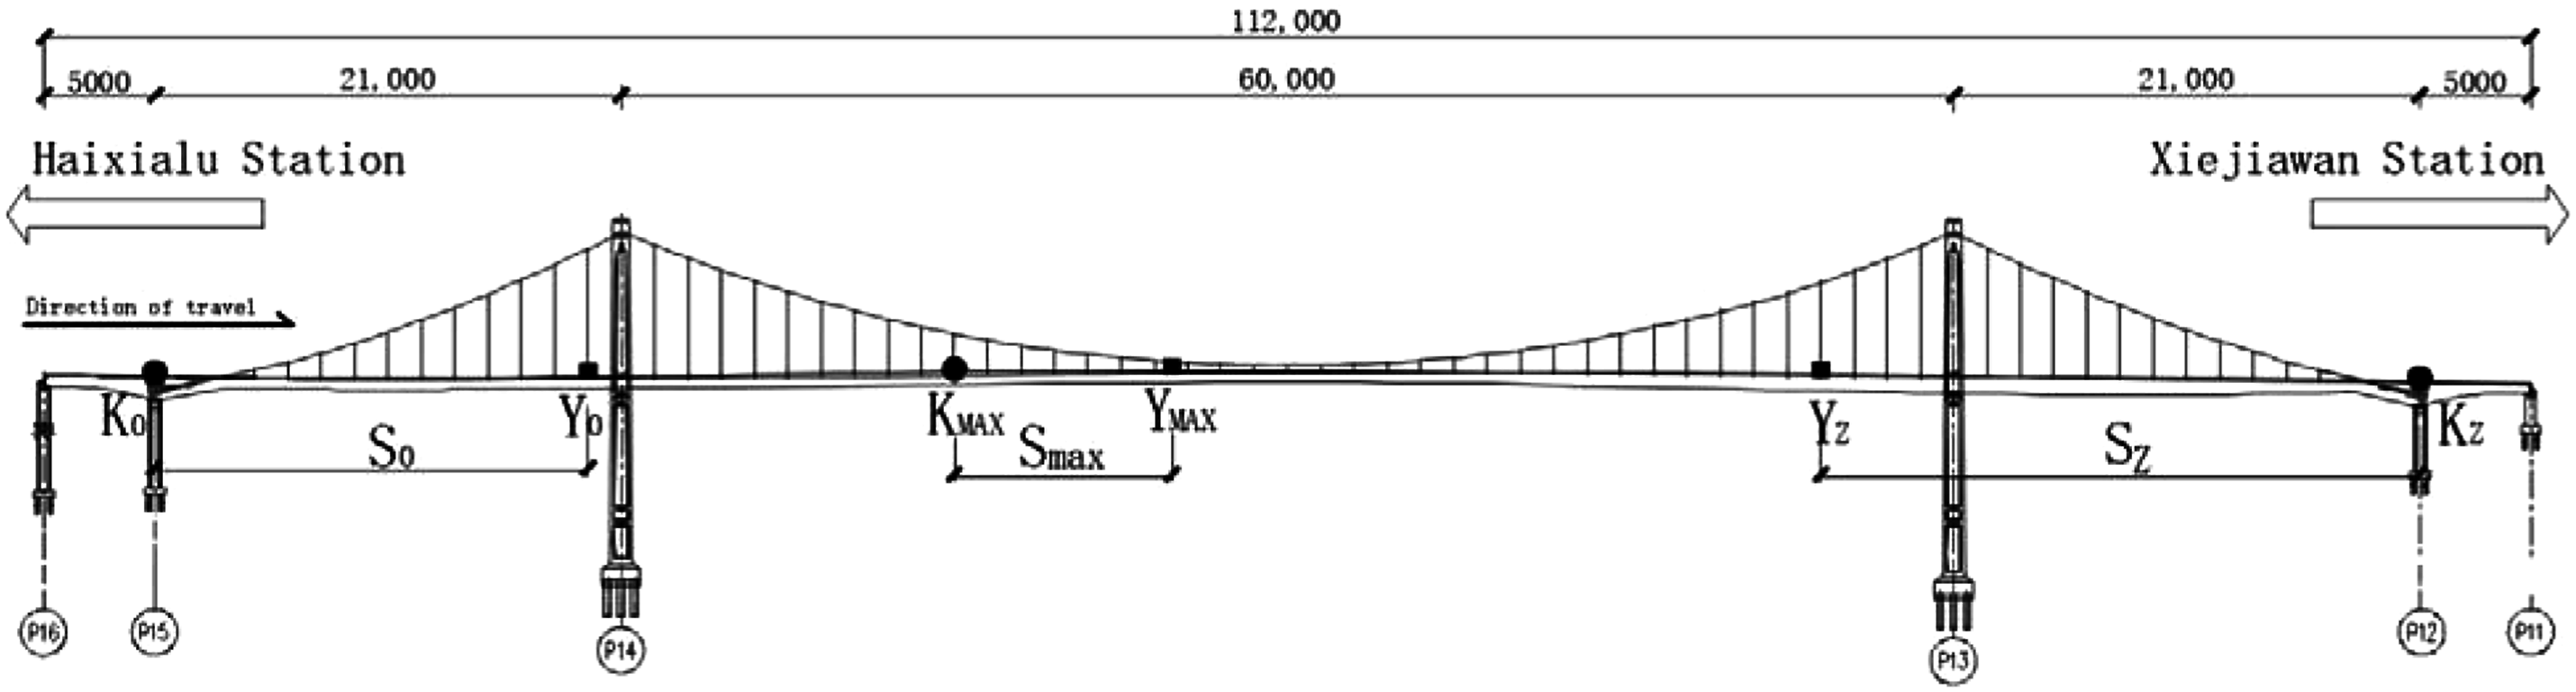
Analytical principle of spatial relationship between transponder and monitoring point
Establishment of spatial relationship
After defining the installation position of the transponder Schematic diagram of spatial relationships.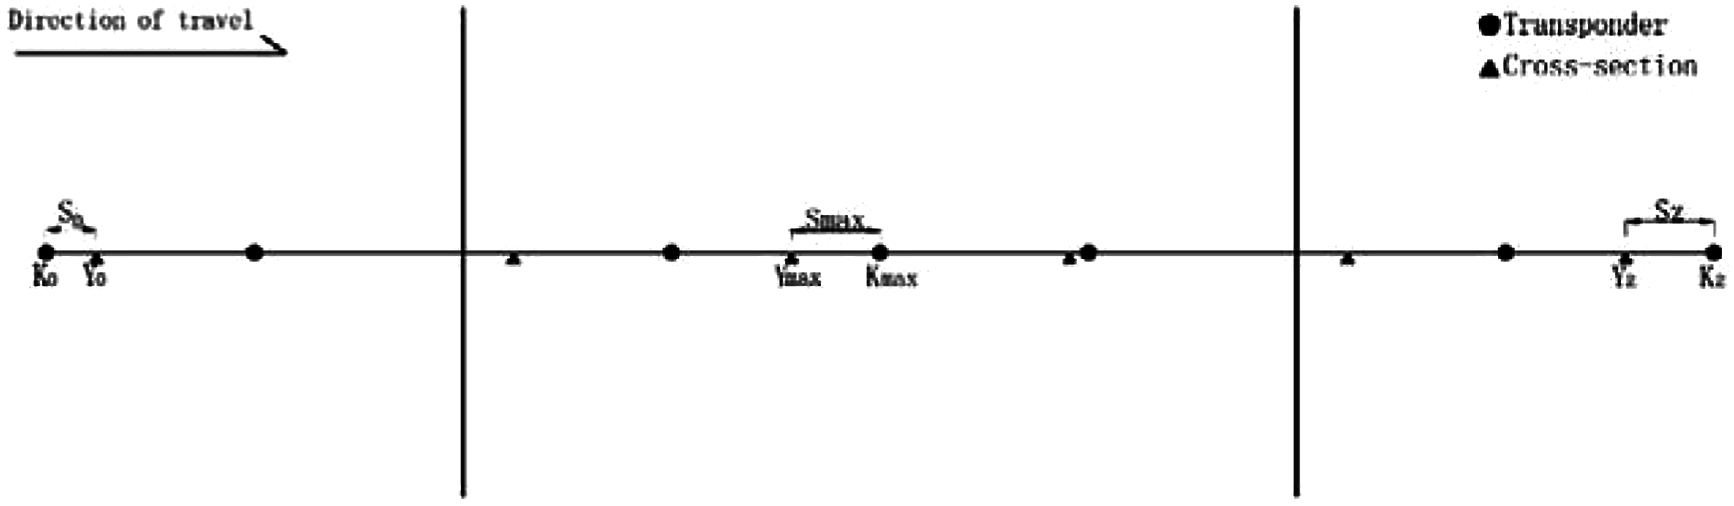
Spatial relation analysis
The train track (velocity
Simpson's integral method is to divide the integral interval

To solve the spatial relation problem, a cumulative displacement function
Cumulative displacement from

Cumulative displacement from

Cumulative displacement from

Create and define the objective function


By analyzing (6), (7), and (8), the roots obtained are the time
Regression model
The monitoring data may be biased due to equipment accuracy and environmental factors, thus affecting the accuracy of the vertical stiffness evaluation. To ensure the accuracy and reliability of the evaluation results, this study will collect the traveling data of the train on the track-specific suspension bridge and the actual deformation monitoring value
Considering that the CART model can explain the complex nonlinear relationship and interaction between deformation and influencing factors and has a high anti-interference ability against outliers or noise,
22
we adopted CART to establish the regression model
Data extraction and combination
Throughout the entire process of the train crossing the bridge from the front to the rear, the transponder captures the train’s travel time data
Defining the target variable
In this study, the target variable
Constructing the dataset
The feature matrix is composed of the time and speed data when the train crosses the bridge. For each time point
The entire dataset

The bridge deformation data exhibits continuity in both time and speed, and splitting the dataset may disrupt this continuity, affecting the model’s ability to accurately fit the relationship between train operation and deformation. Furthermore, the focus of this method is on fitting and correcting existing data rather than predicting future data. Therefore, using the entire dataset


Training the model
The CART regression model was trained using the training set


During the training of the model, the optimal split point is selected by minimizing the weighted mean square error (MSE)

Among them


The CART model measures the importance of features based on the split contribution of features in the tree


The above steps are applied recursively to each subset until a stop condition is reached (i.e., the maximum tree depth is reached or the number of subset samples is less than a certain threshold) to generate leaf nodes. The predicted value of the leaf node is the mean value of the target variable of the corresponding subset of the node

Evaluating the model performance
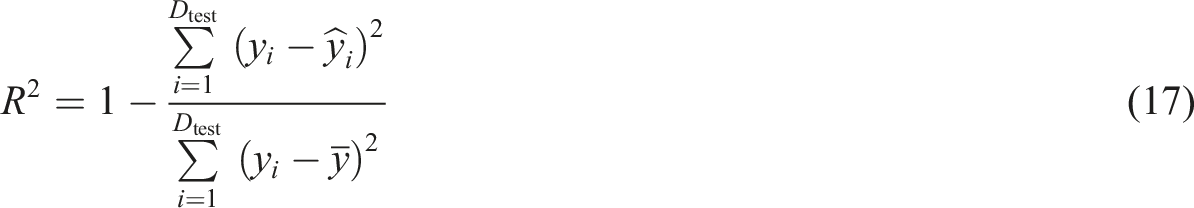
After establishing the CART regression model, the Pearson correlation coefficient R2 score was used to evaluate the model performance, representing the model accuracy and data interpretation ability. Its calculation formula is as follows
Calculation of correction coefficient
After verifying the accuracy of the regression model, the CART regression model is used to predict the deformation value corresponding to each velocity

Finally, the average of all correction factors is calculated as the final correction factor

Stiffness evaluation
Dynamic check coefficient
A load test is the most direct and effective method of traditional bridge condition assessment.
23
The ratio between the measured response and the theoretically calculated response is used to calculate the calibration coefficient to determine whether the bridge is in good condition.
24
However, this method has some problems such as being time-consuming and labor-intensive, causing traffic blocking, and being high cost. Based on the characteristic that the moving load source is clear, this paper presents the dynamic test coefficient as the index of stiffness evaluation. As expressed by

The dynamic test coefficient (1) When (2) When (3) When
Evaluation indicators
According to the monitoring data of the safety monitoring system, the actual deformation monitoring values of


Considering the error of the measured value obtained by the monitoring system, the dynamic calibration coefficient and the ratio of the residual deformation value to the maximum deformation value required by the specification are revised.
21
The evaluation criteria are as follows: If Equations (23) and (24) are met at the same time, it indicates that the structural stiffness is in a normal state; otherwise, the safety monitoring system should be relied on for structural stiffness early warning, and the disposal suggestions are put forward after analysis


Application analysis
Project overview
Egongyan track bridge is the world’s largest span self-anchored track-specific suspension bridge. Based on it, this paper will verify the feasibility of the proposed vertical stiffness evaluation method for the track-specific suspension bridge. The span arrangement of the bridge is: 50 + 210+600 + 210 + 50 = 1120 m, and the cross-section arrangement is: 2.25 (cable area, air nozzles) + 0.25 (railing) + 2.35 (sidewalk) + 0.9 (anti-collision, isolation belt) + 10.5 (track boundary) + 0.9 (anti-collision, isolation belt) + 2.35 (sidewalk) + 0.25 (railing) + 2.25 (cable area, air nozzles) = 22.0 m. The main beam is a composite structure of steel and concrete beams. The main structure of the steel beam is Q420qD, and the prefabricated bridge panel is made of C55 concrete. The main pier is a reinforced concrete structure. The bridge adopts high-strength parallel steel wire bundles as double main cables, and the main cable spacing is 19.5 m. The suspender is parallel, using zinc–aluminum alloy coating Φ7 parallel steel wire material. The anchor section and anchor span section of the main cable are made of prestressed concrete box beams, and the rest of the cable is made of steel box beams. Figure 5 show the bridge layout. Egongyan track bridge layout.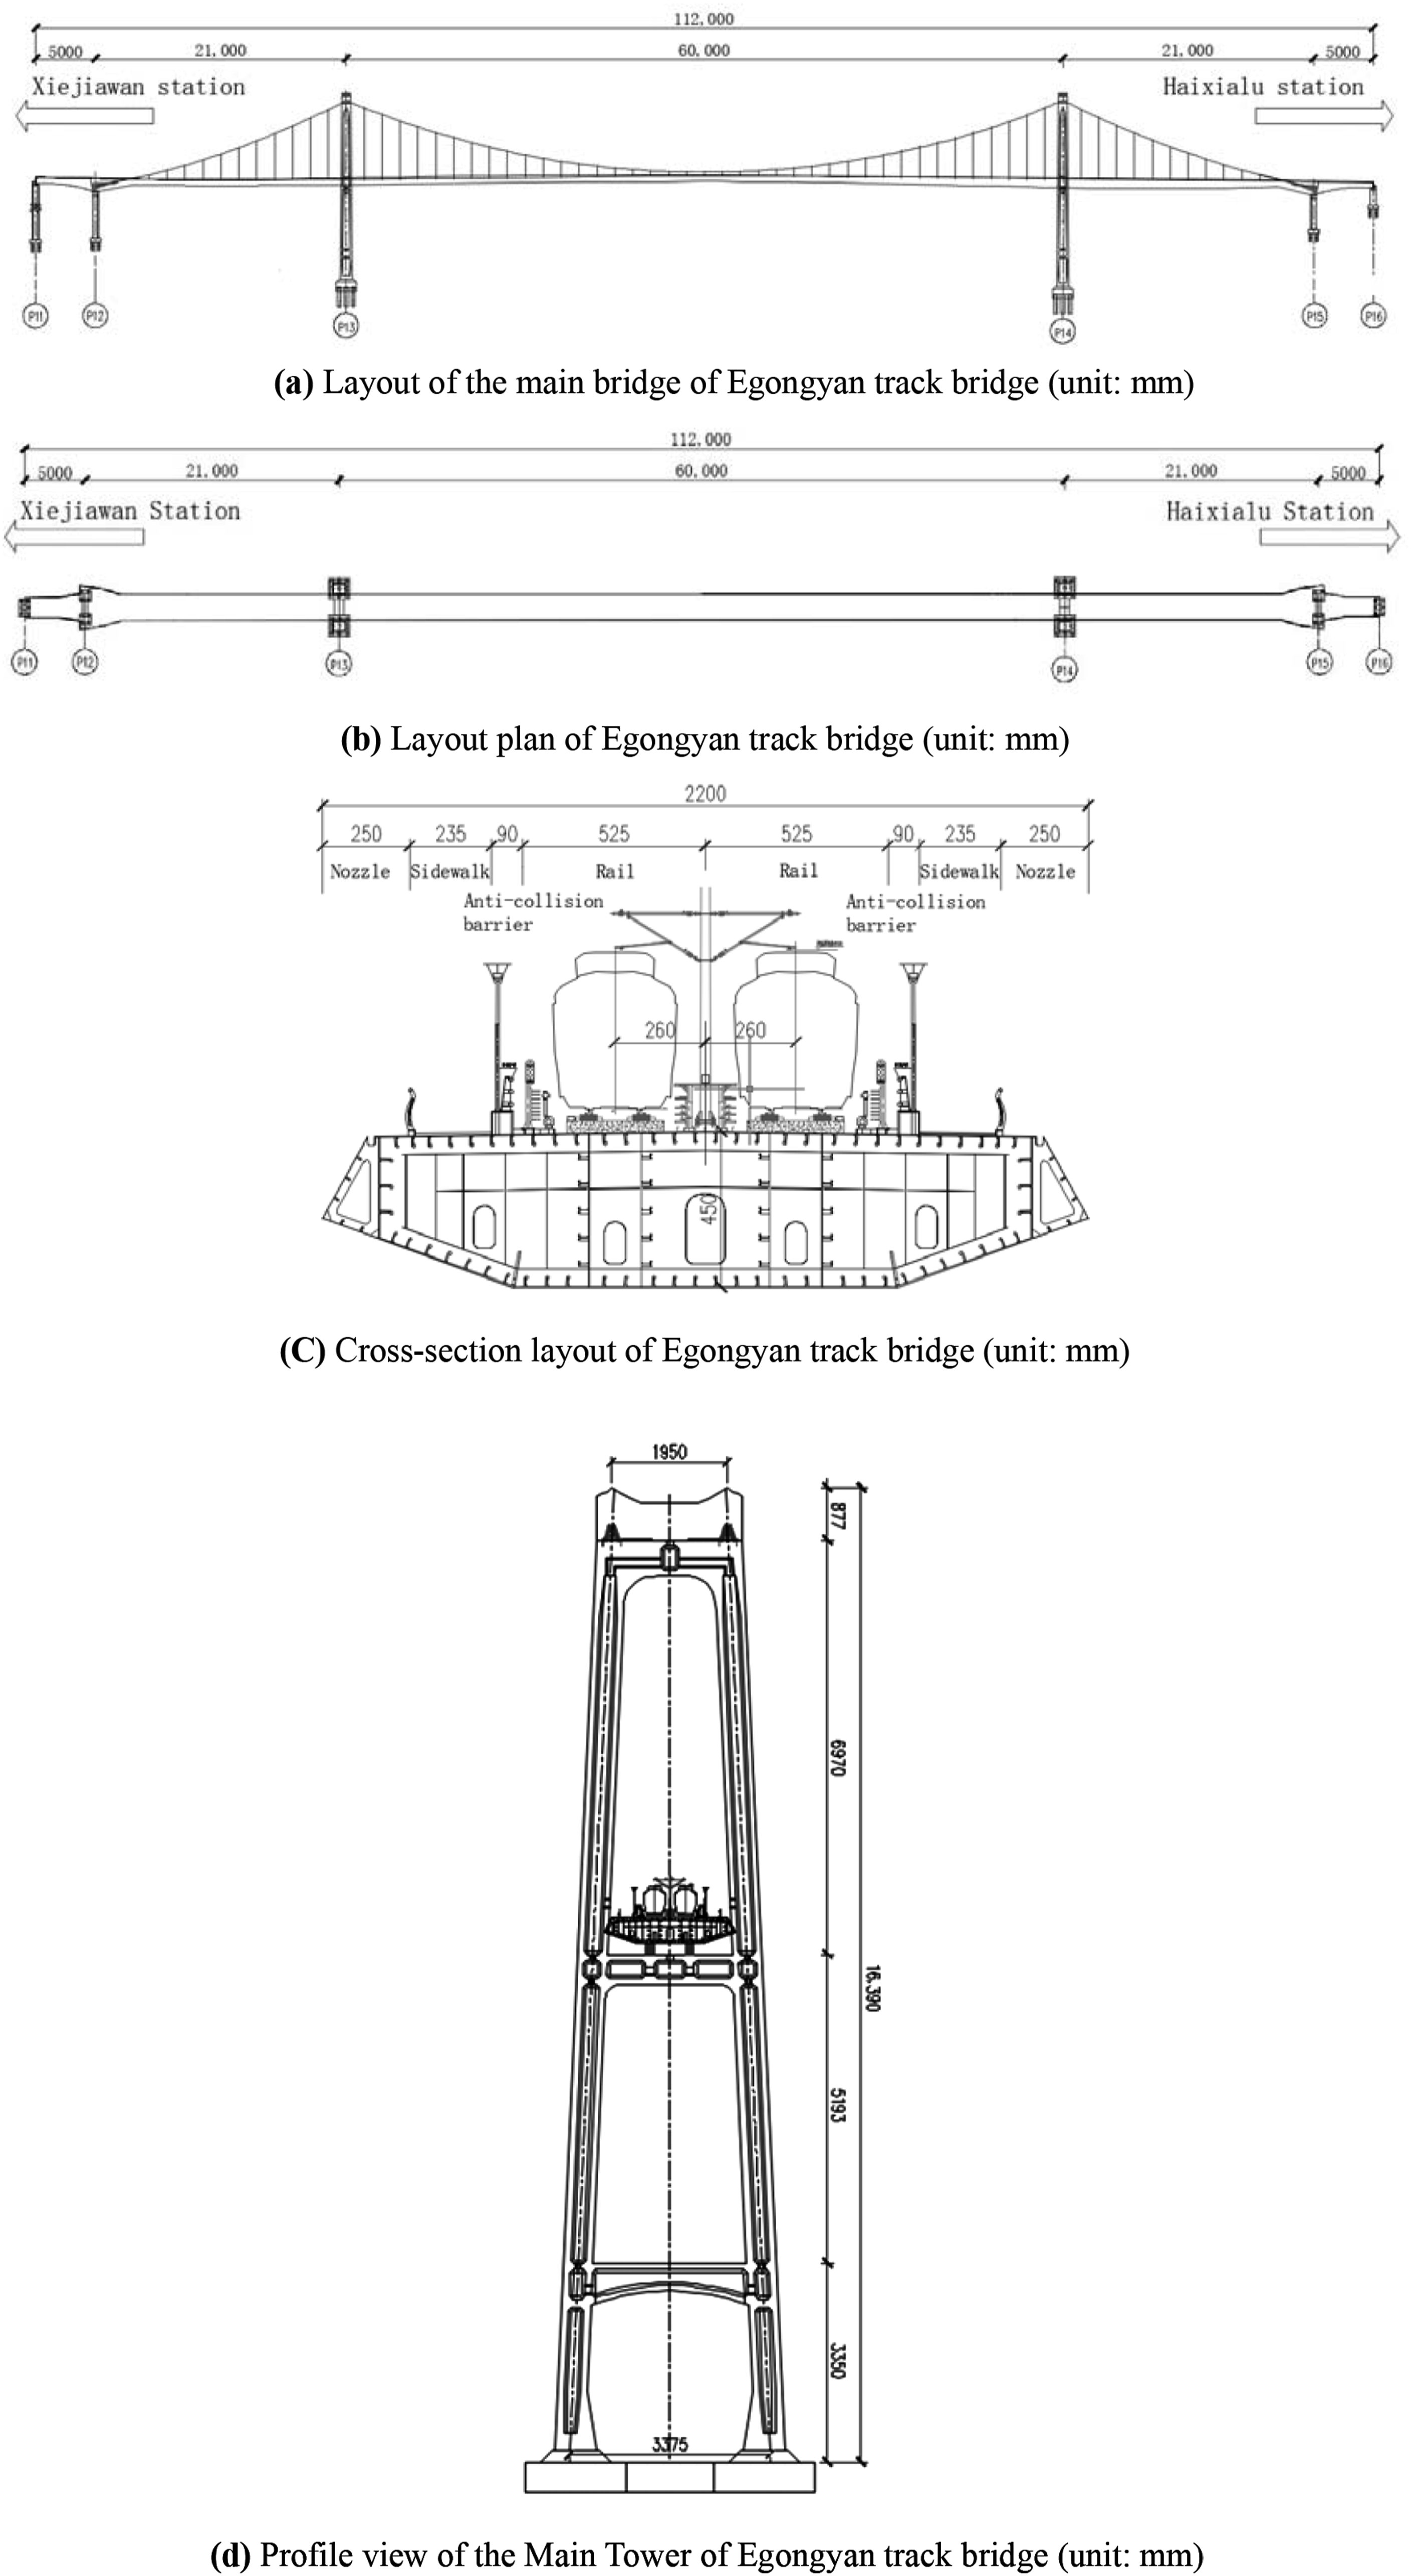
Load condition of the no-load first train
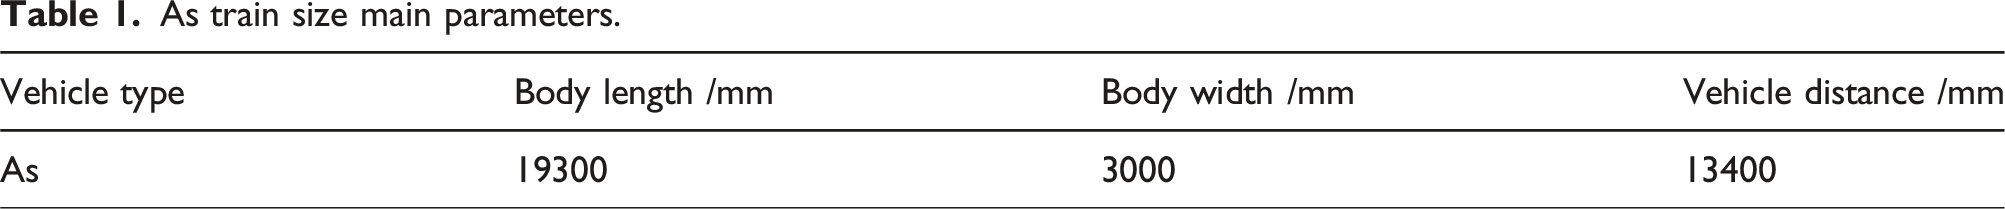
As train size main parameters.

Train formation (6 sections) schematic diagram.
According to the characteristic of clear load action of the no-load first train, the load condition of the empty train is used as the moving load of the Madis/Civil 2023 finite element model to calculate the theoretical deformation value of the no-load first train. According to the specification,
25
the no-loaded weight of Mc, Mp, and M compartments is 21363 kg, 20617 kg, and 21360 kg, respectively. Each carriage has 4 axles. The single axle weight P1 of the Mc carriage is 54.08 kN; the single axle weight P2 of the Mp compartment is 53.40 kN; the single axle weight P3 of the M car is 51.54 kN. The load diagram of the no-load train is shown in Figure 7. Load model of no-load train (6 sections) (unit: m).
Numerical simulation
Calculation model
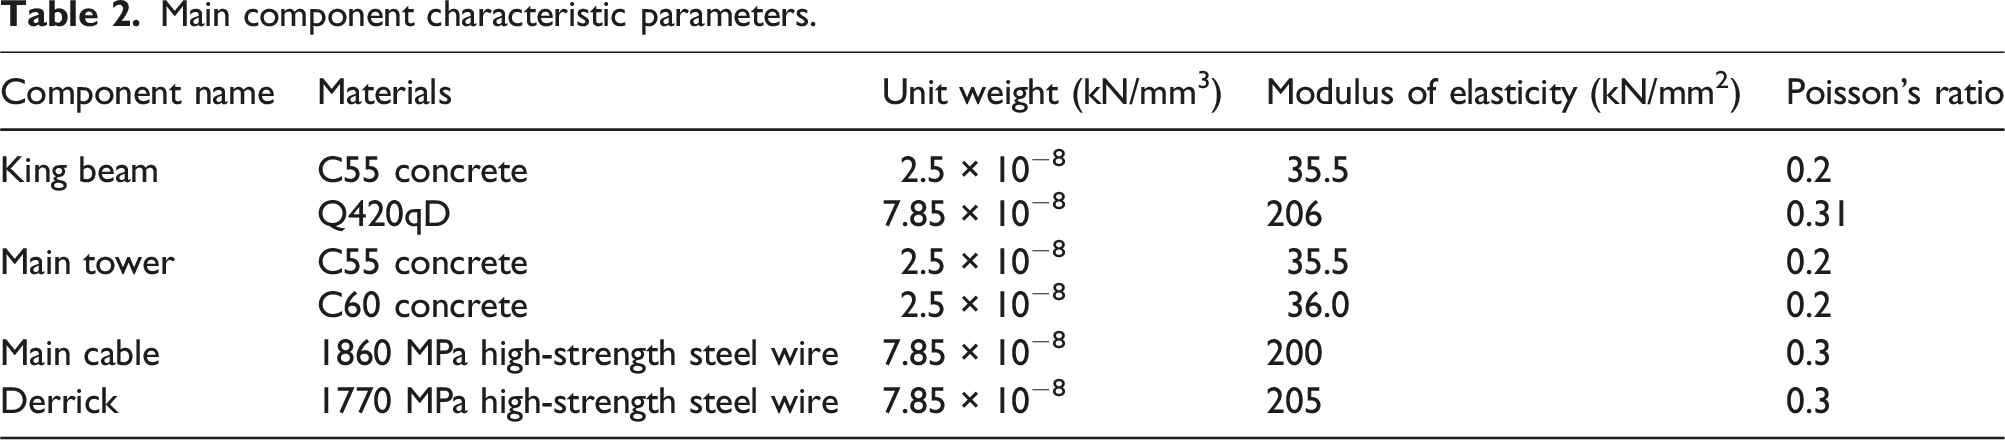
Main component characteristic parameters.
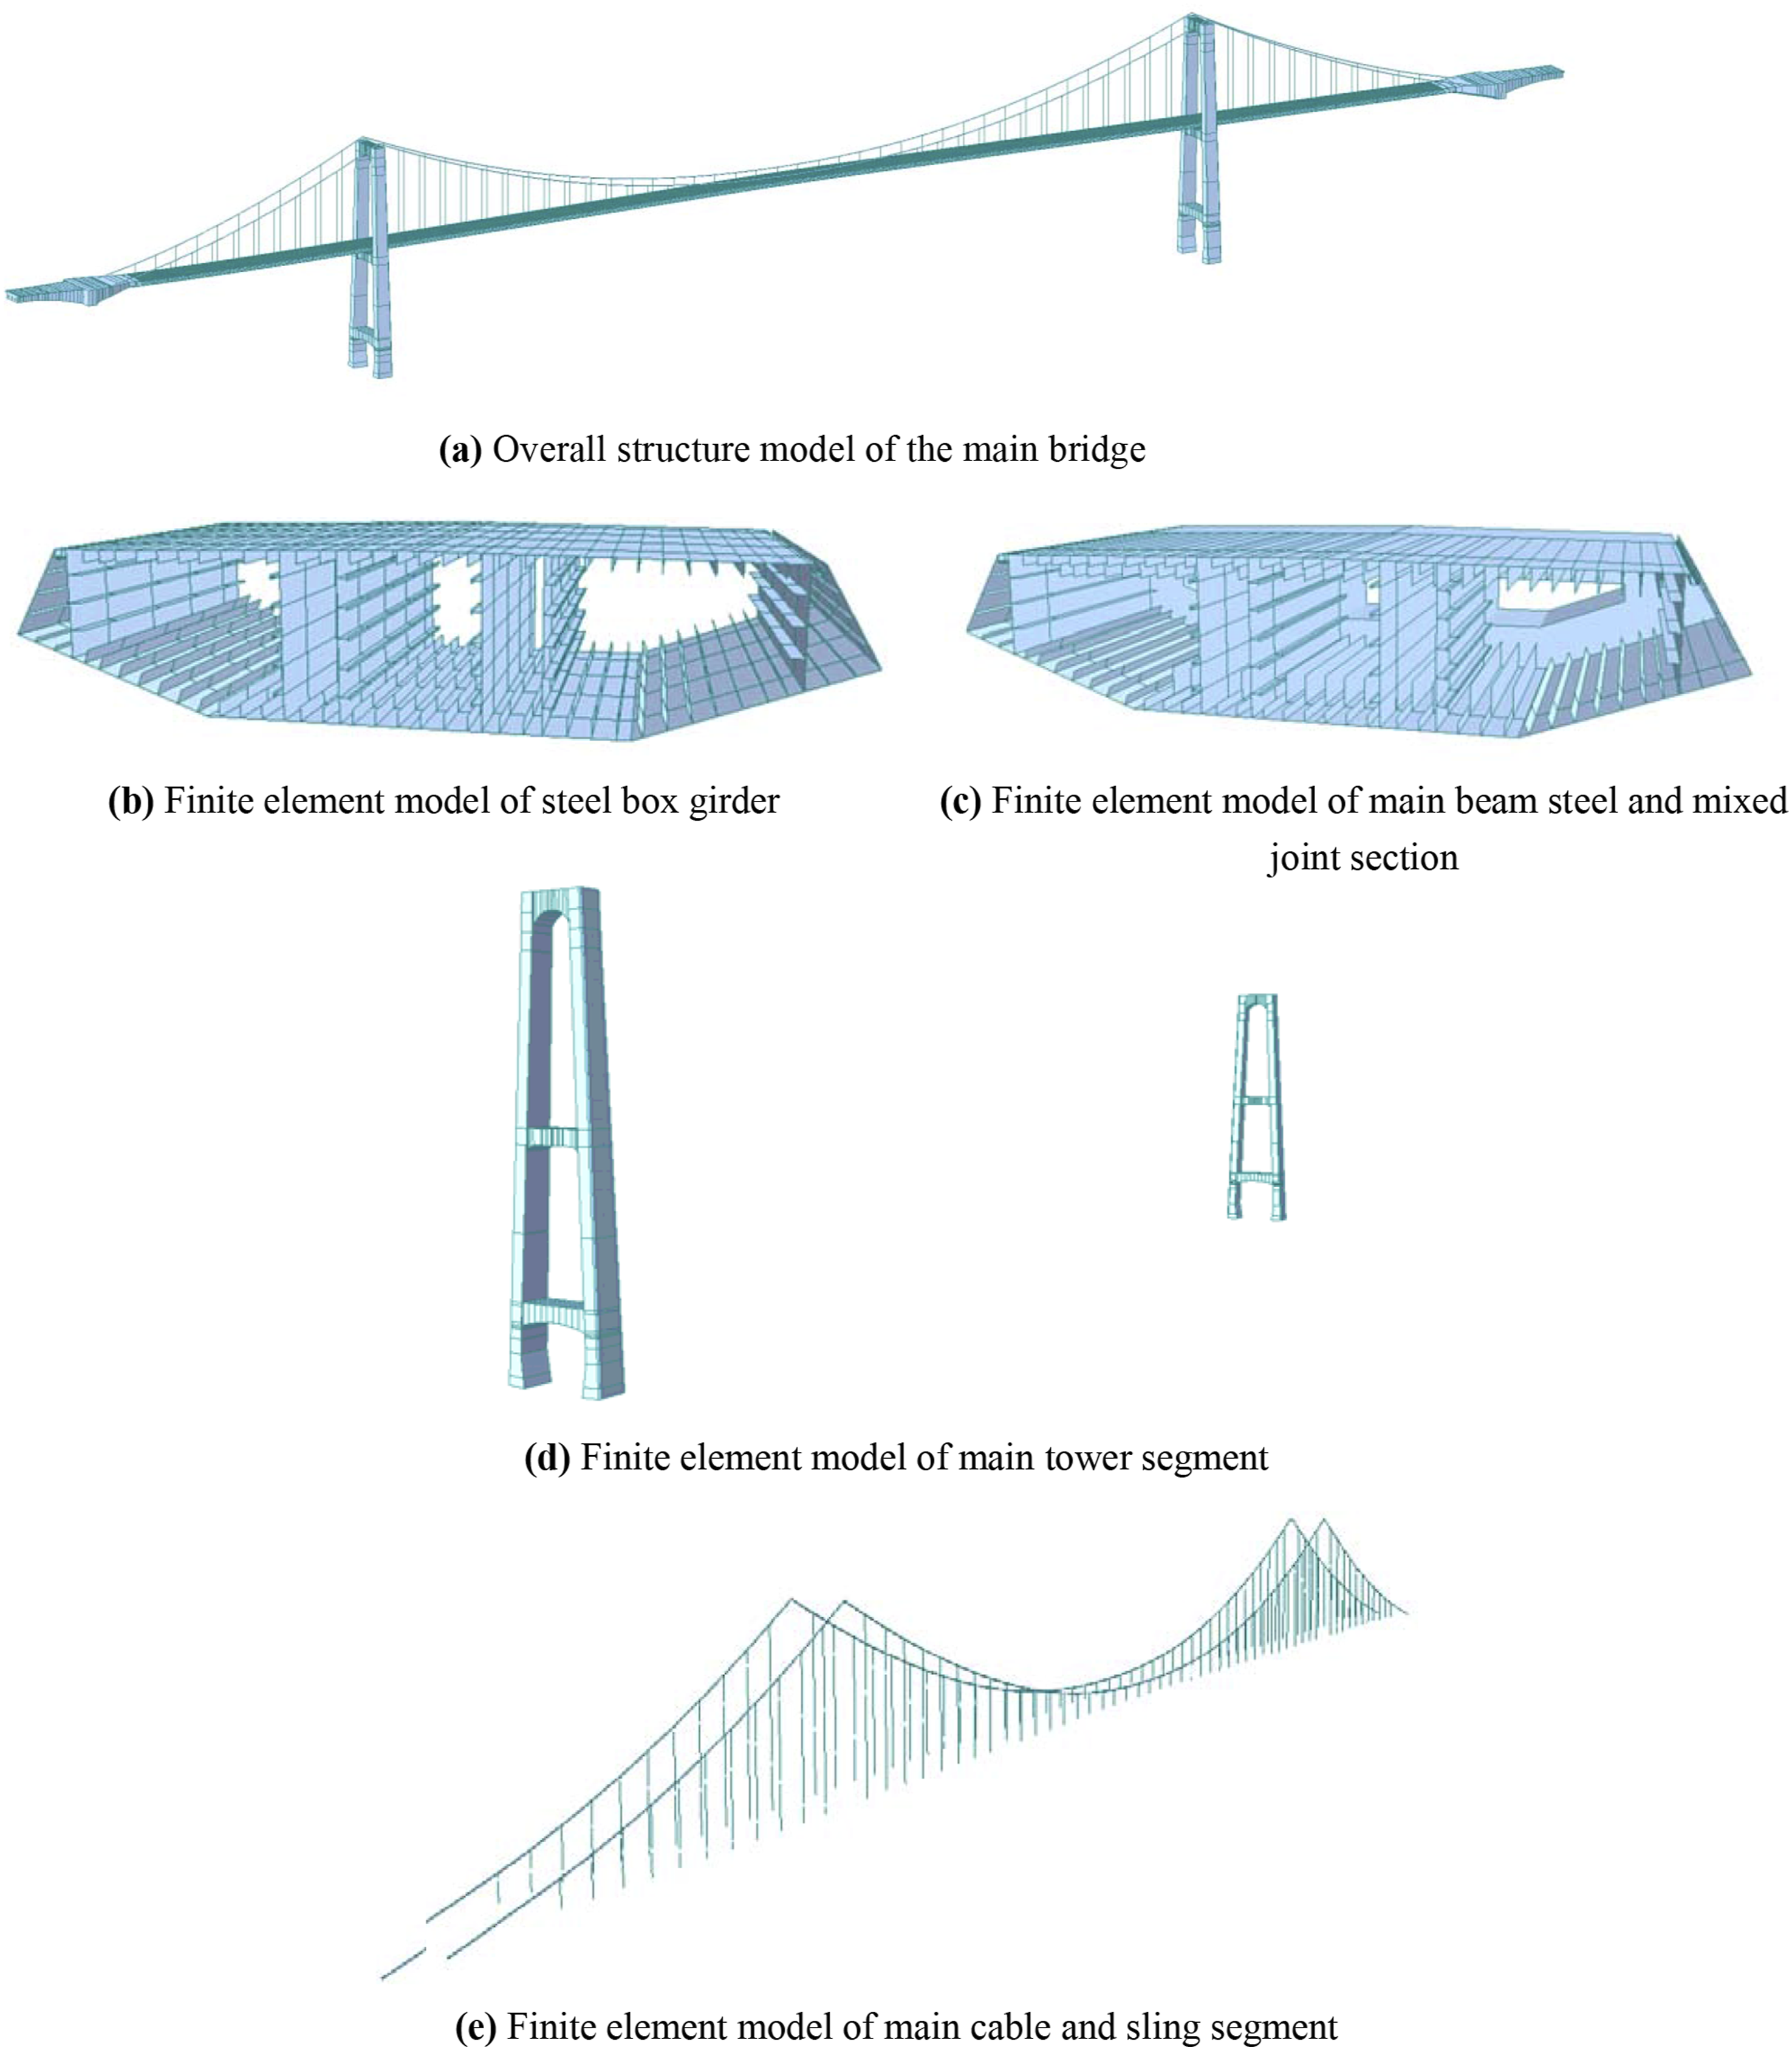
The finite element model of the track-specific suspension bridge.
Calculating the effect
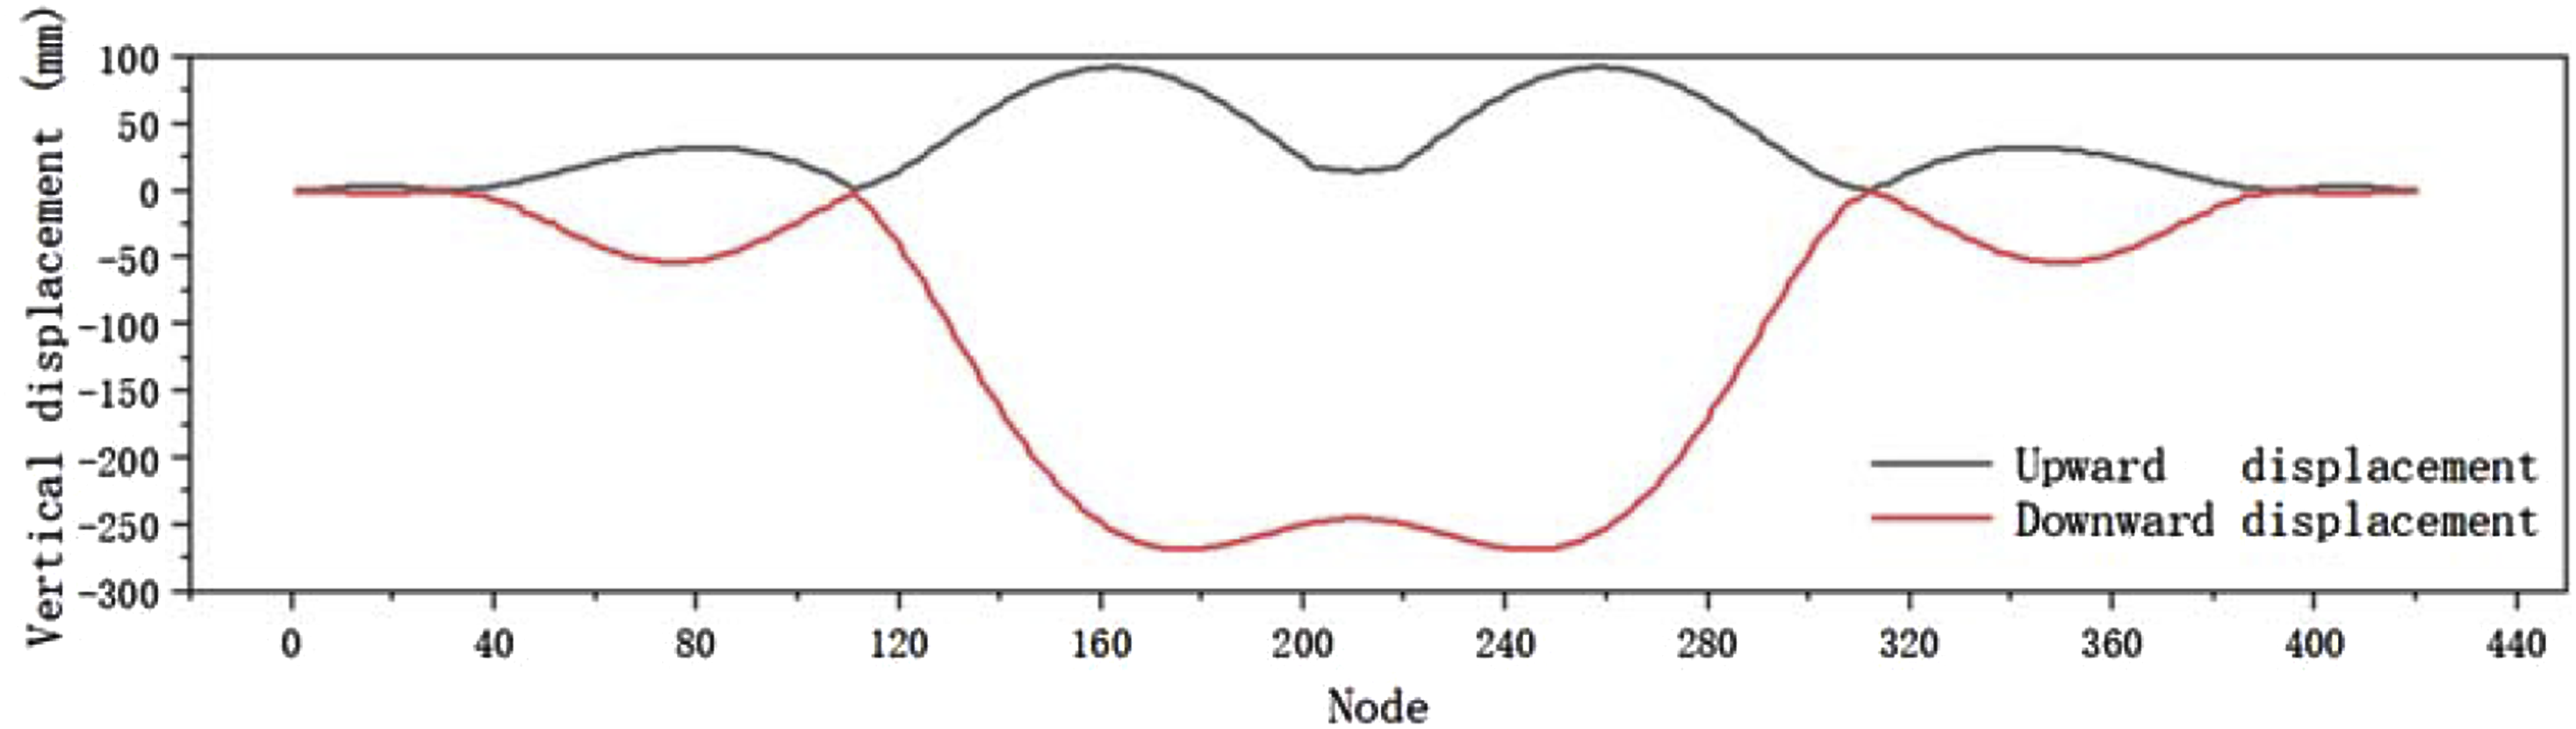
The spatial deformation of the whole bridge is analyzed by loading the no-load train. The results show that the maximum downward deflection of the main beam occurs at the 3/4 section of the middle span, and the deformation value is 268.55 mm. The maximum upward deflection occurs at the 1/4 position of the main span, and the deformation value is 92.27 mm. Therefore, it is determined that the most unfavorable section of the main beam deformation is the 3/4 section of the middle span of the main beam, and the theoretical calculation deformation value is 268.55 mm. The deformation of the main bridge under the action of trains is shown in Figure 9. The displacement of the main beam under the action of the train is shown in Figure 10. The main bridge deforms under the action of the train. Displacement of the main beam under the action of the train.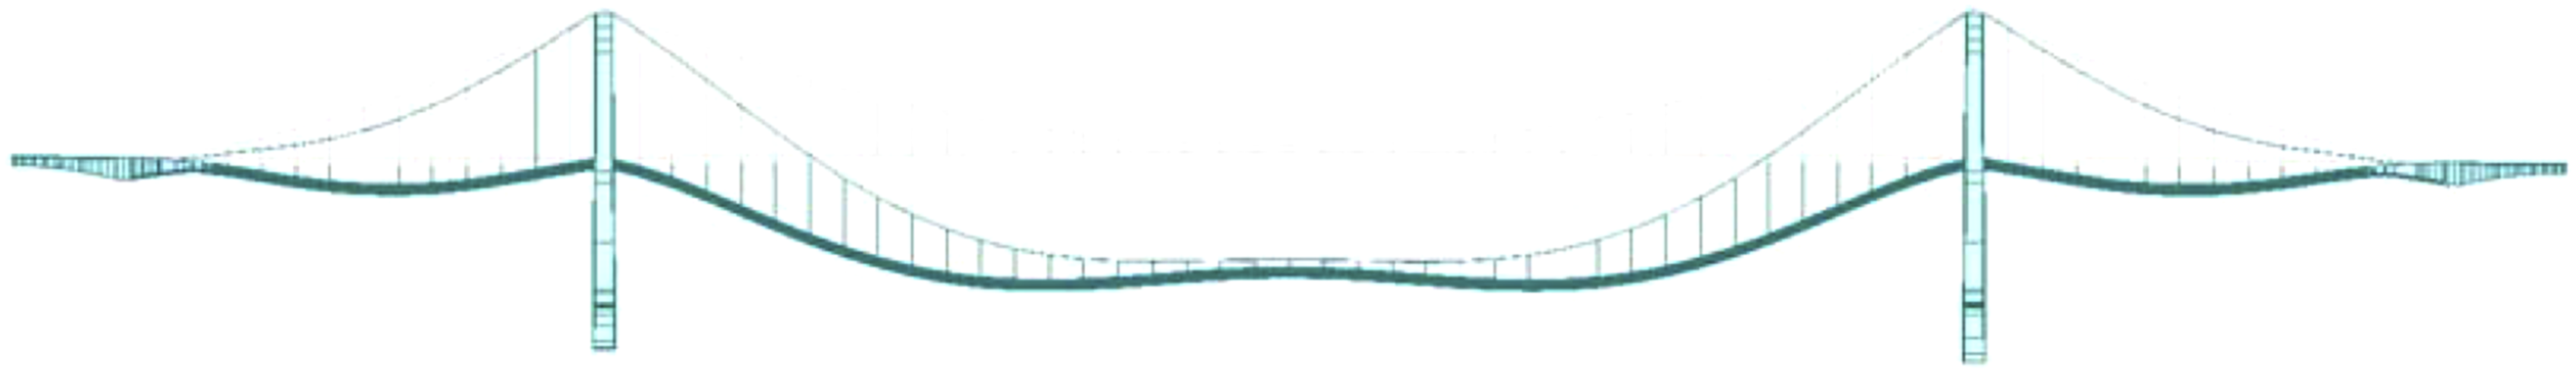
Deformation monitoring system
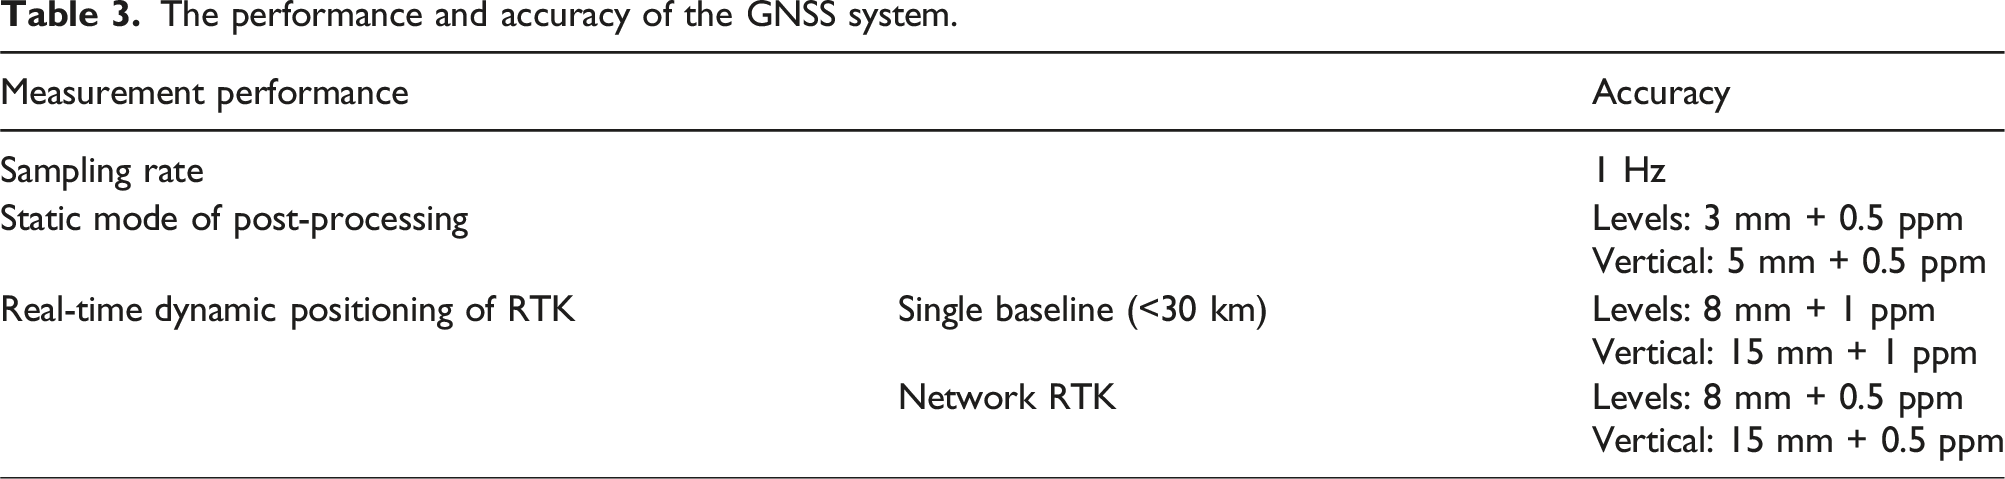
The long-term safety monitoring system of the Egongyan track bridge is mainly composed of a sensor subsystem, a data acquisition and transmission subsystem, a data processing and analysis subsystem, a data storage and management subsystem, and an early warning subsystem. The monitoring contents include load and environment monitoring, static and dynamic response monitoring of the whole structure, and local response monitoring of the structure, among which the deformation monitoring of the main beam belongs to the static and dynamic response monitoring of the whole structure.
The performance and accuracy of the GNSS system.
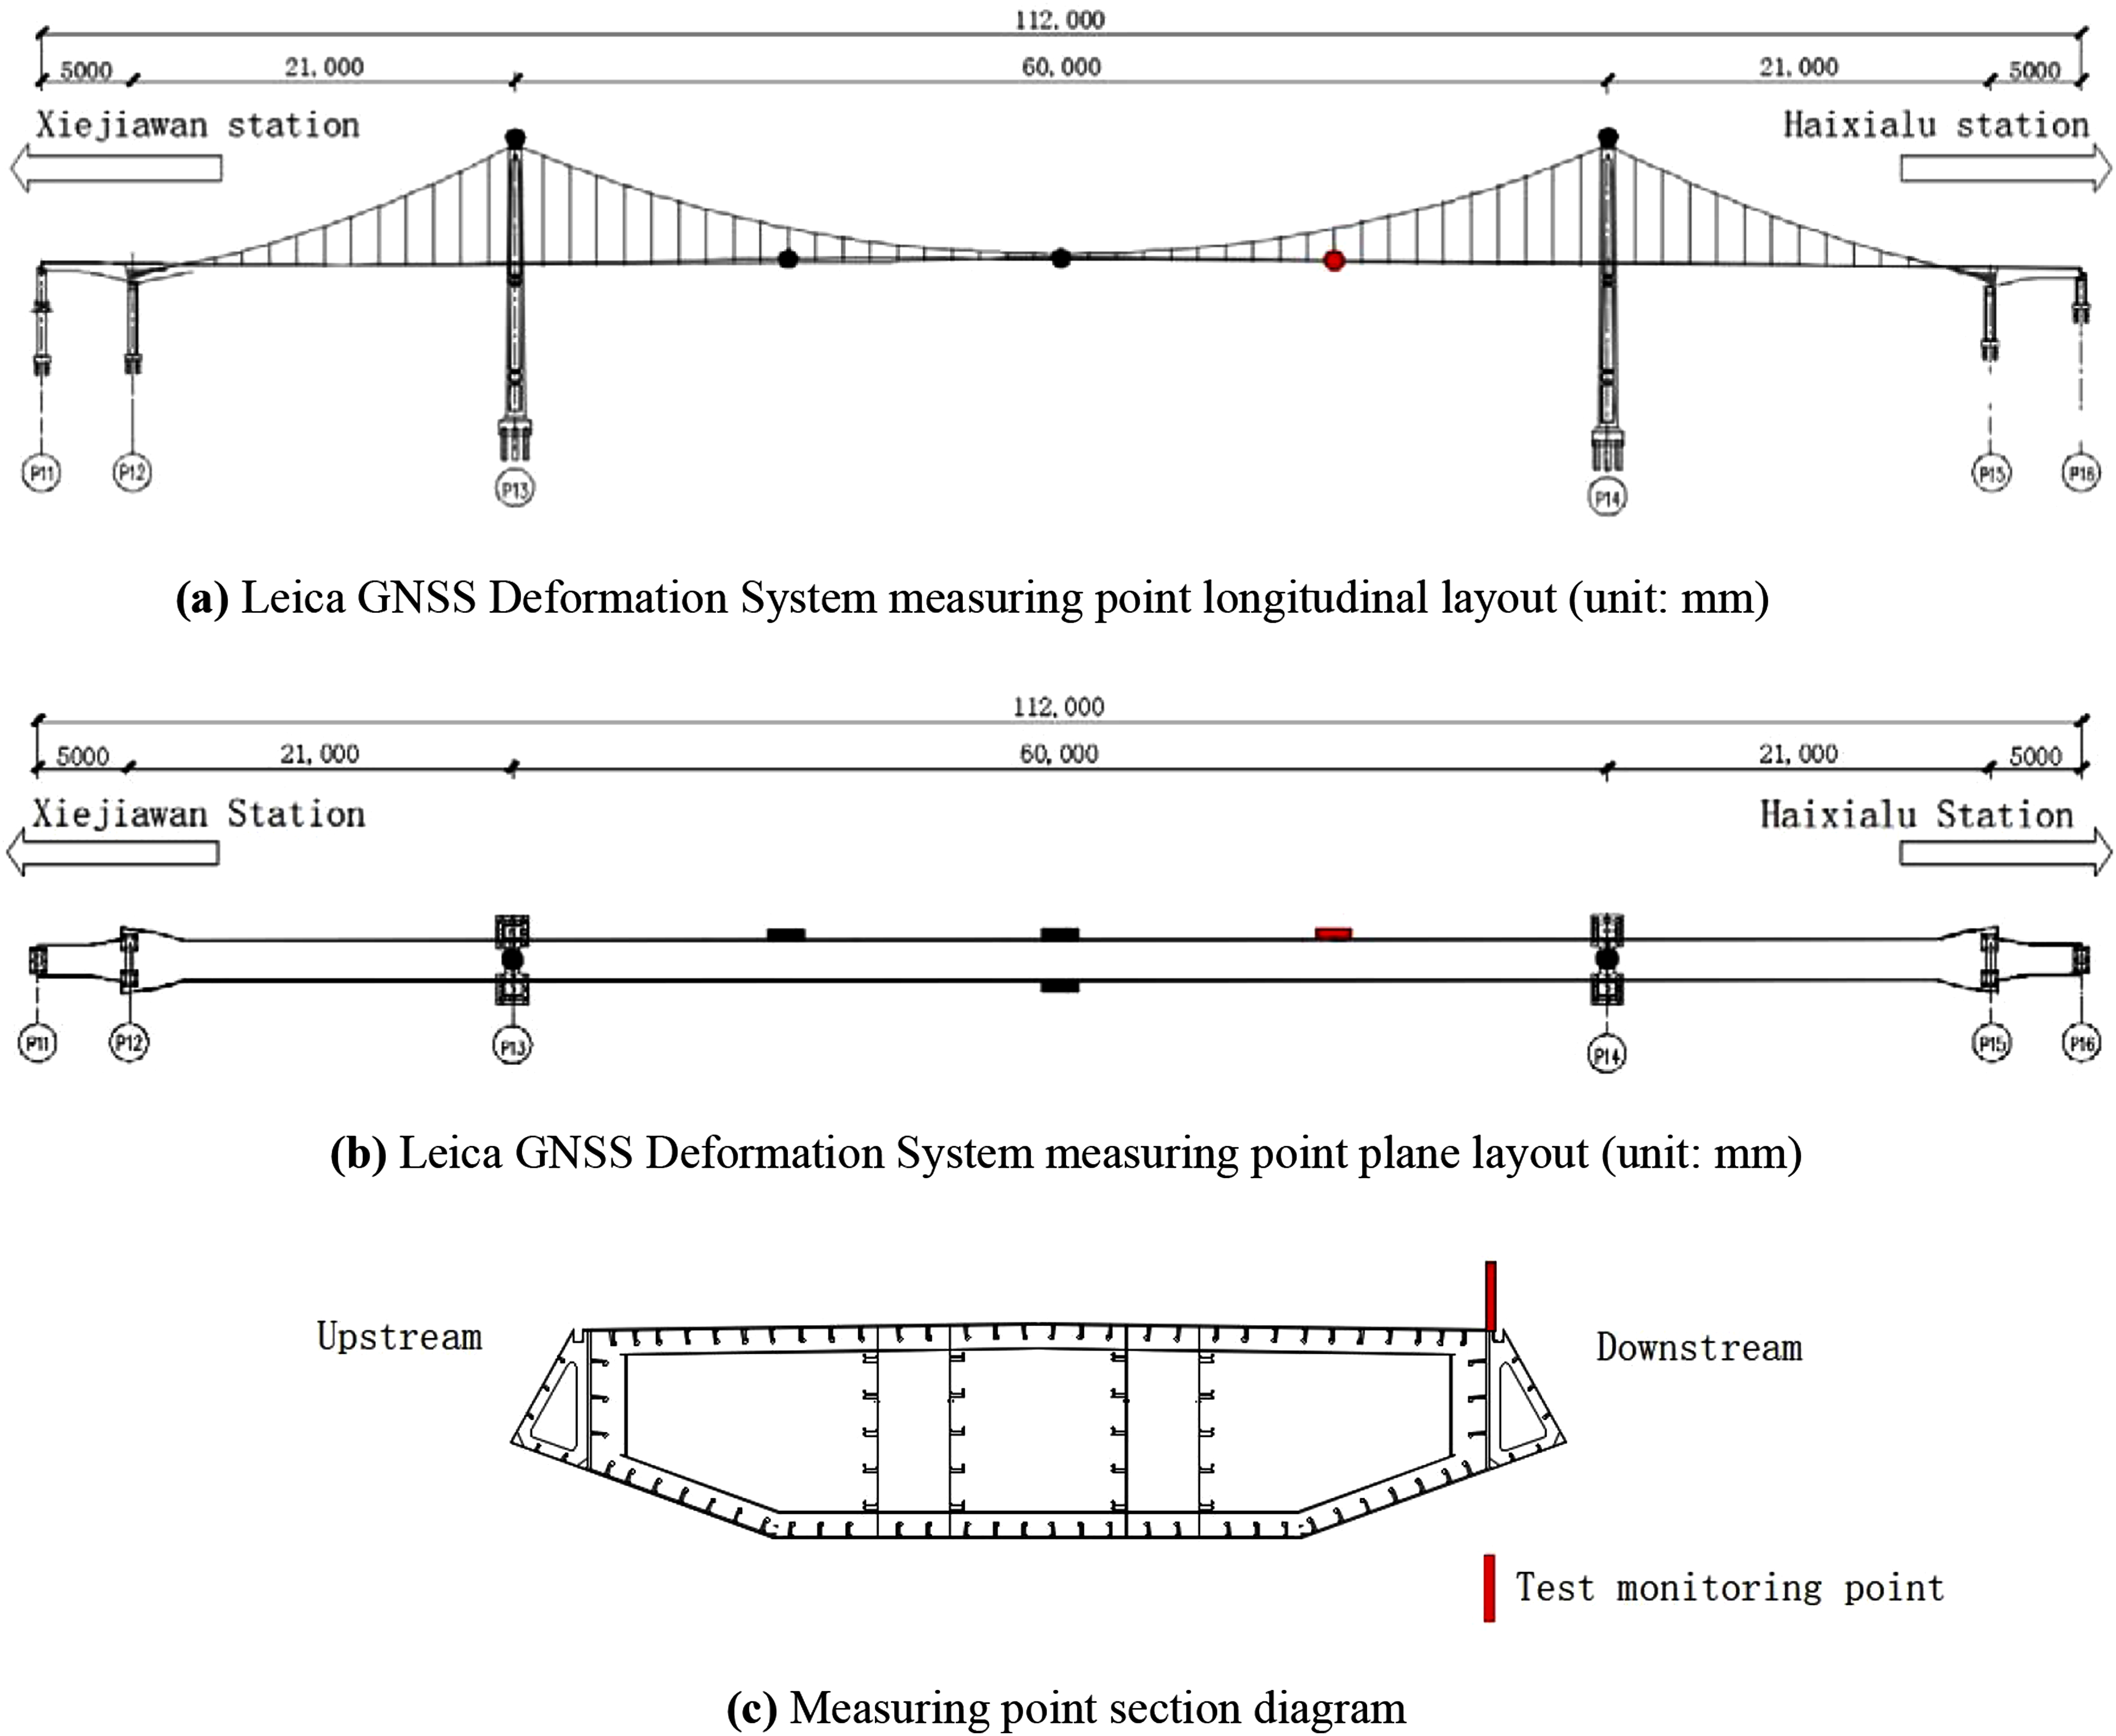
Schematic diagram of the location of the most unfavorable cross-section monitoring points.
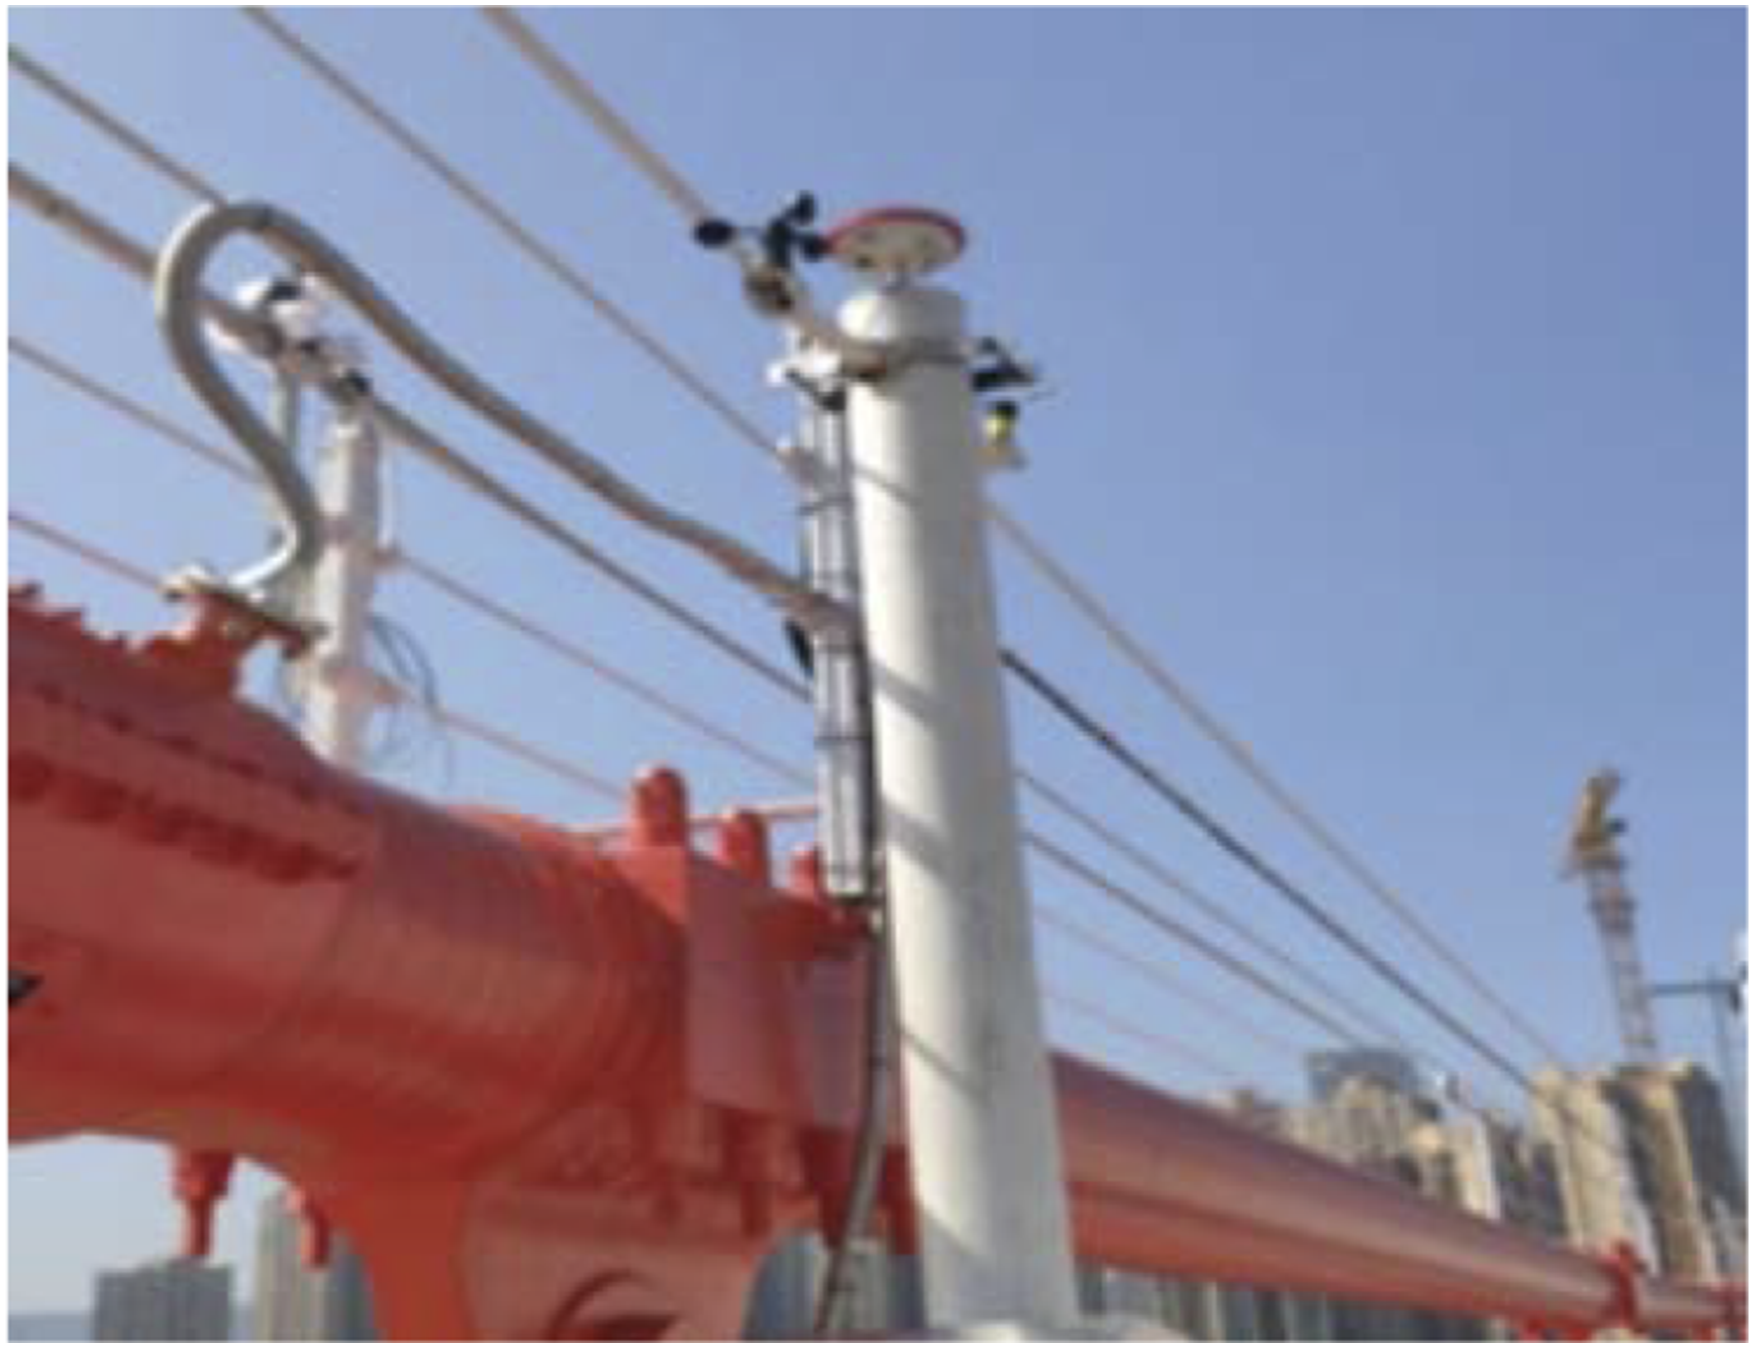
The actual photo of the monitoring point.
Method verification
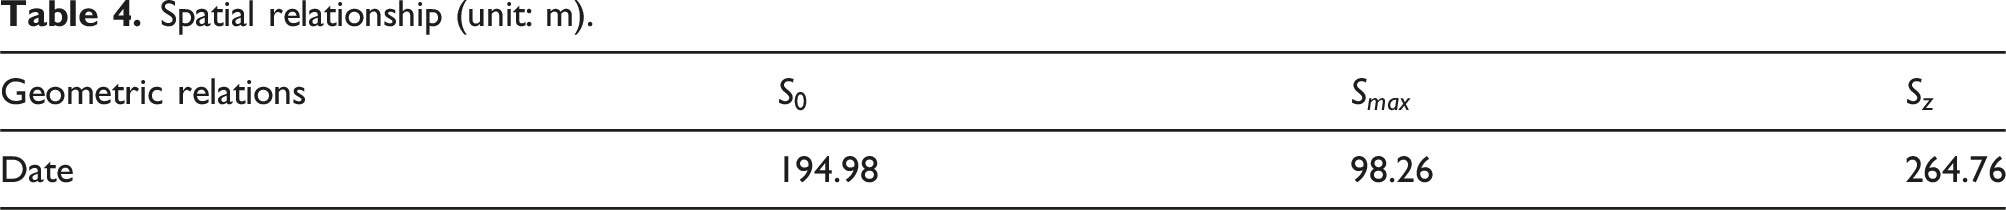
Spatial relationship analysis
Spatial relationship (unit: m).
Spatial relationship diagram between transponder and special section (unit: mm).
The data of the transponder on June 13, 2024, was selected for verification, and the running track (velocity Track of the no-load first train.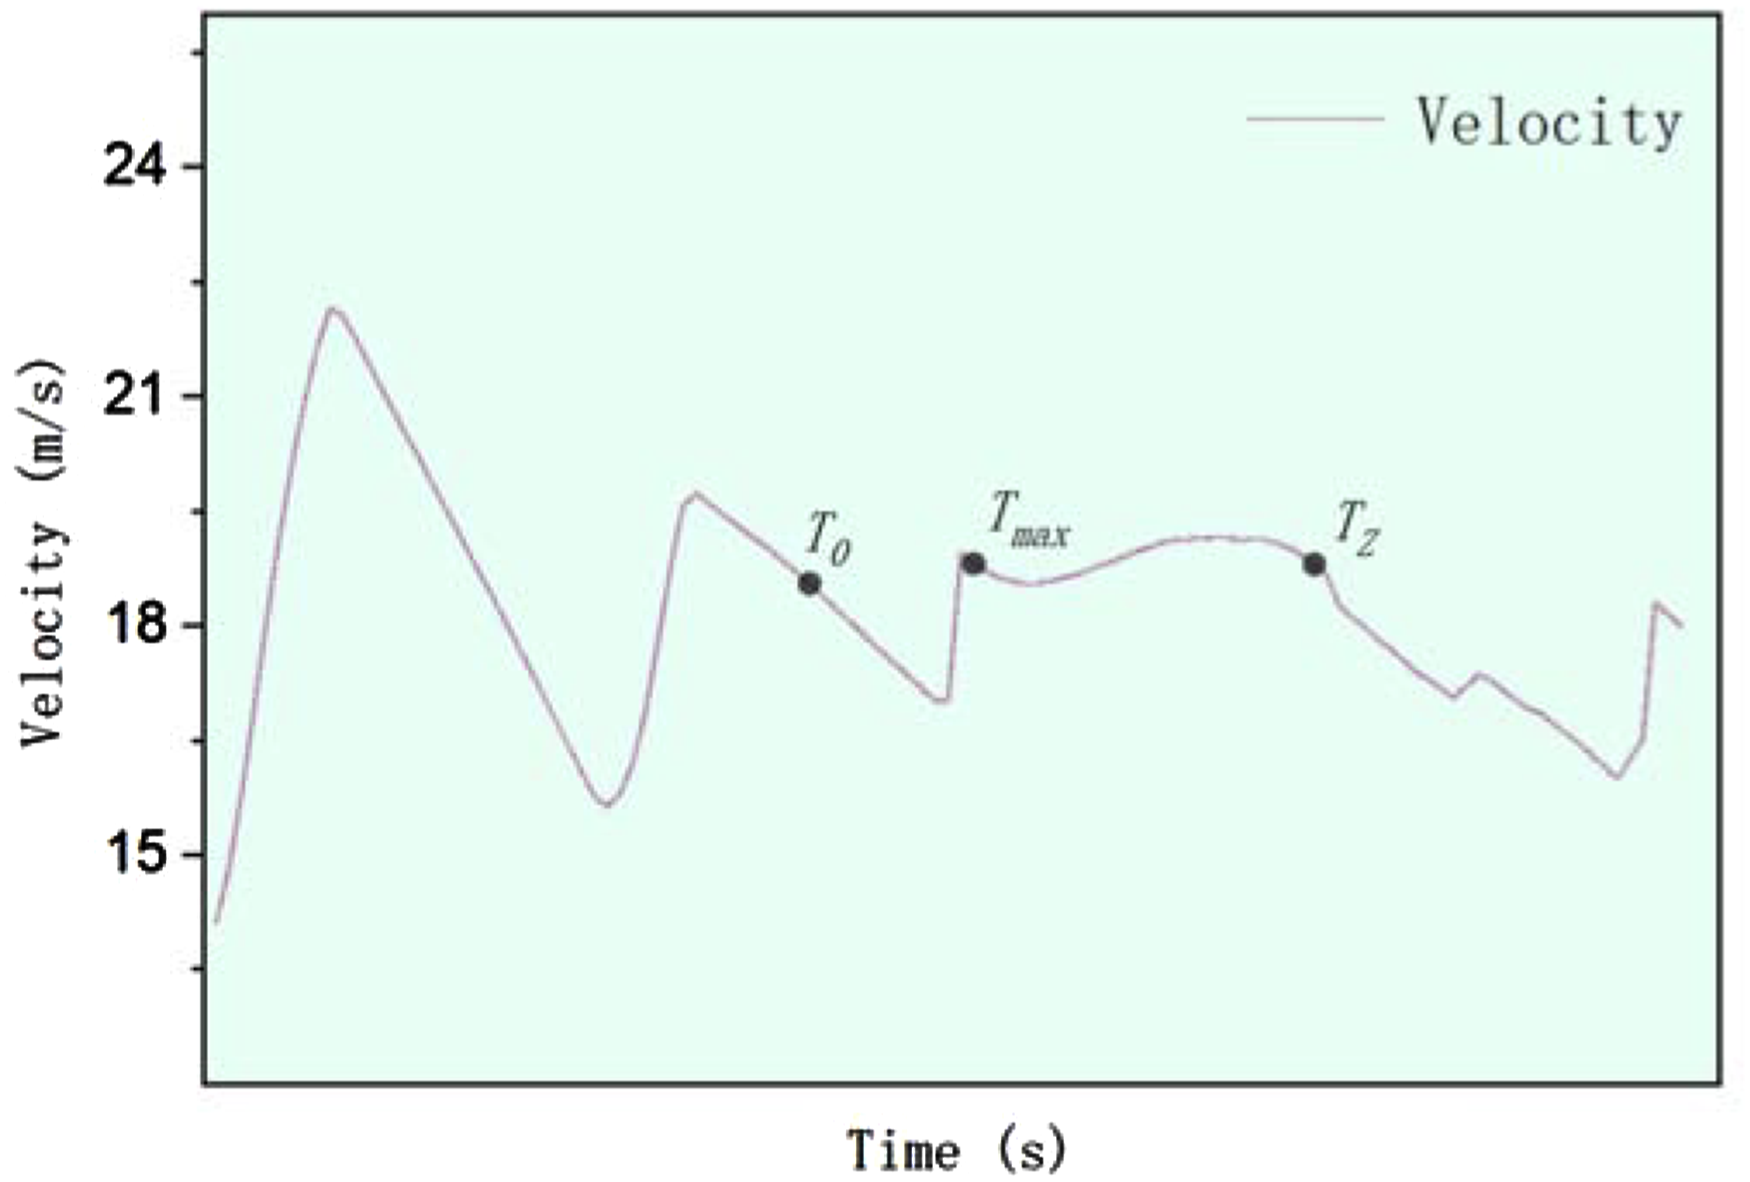
The measured value of the monitoring system
The vertical displacement monitoring data of the GNSS upstream 3/4 section of the world’s largest span self-anchored track-specific suspension bridge safety testing system on June 13, 2024, were obtained, as shown in Figure 15. Monitoring system data.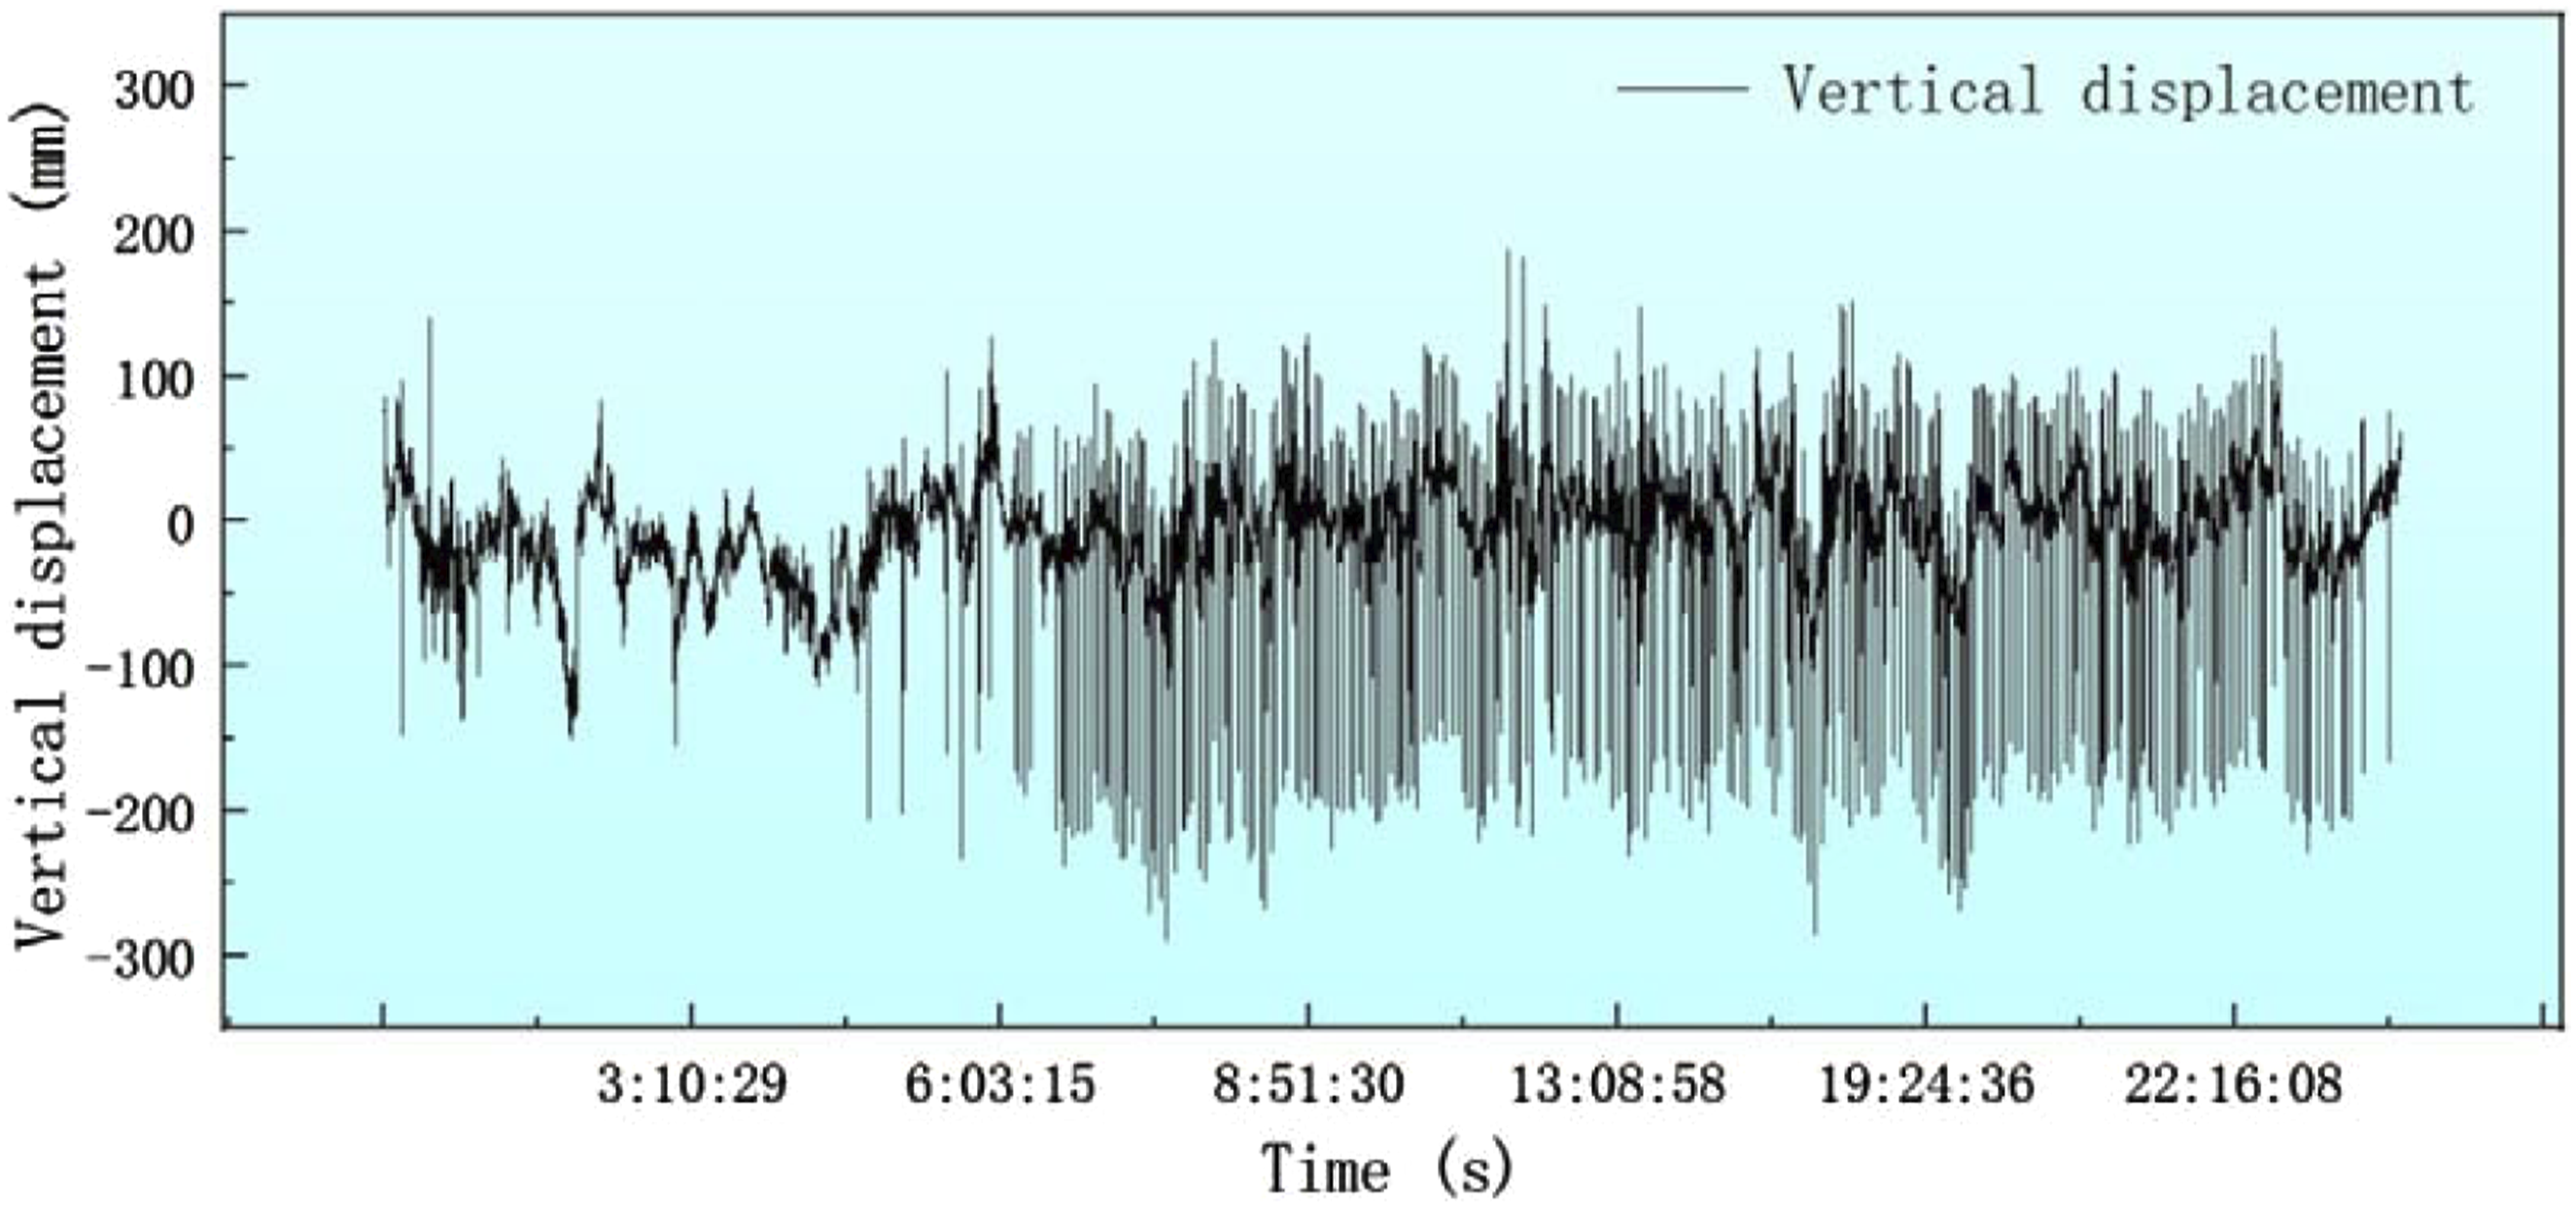
According to the monitoring data, the actual deformation monitoring values
It can be obtained from the data that the theoretical value of vertical deformation of the most unfavorable section of the main beam is 268.55 mm, the actual monitoring value is 232.80 mm, the difference is 35.75 mm, and the relative error is 13.3%. The calculated calibration coefficient is 0.89, it is preliminarily judged that the bridge structure is in good condition and the performance meets expectations.
Regression model
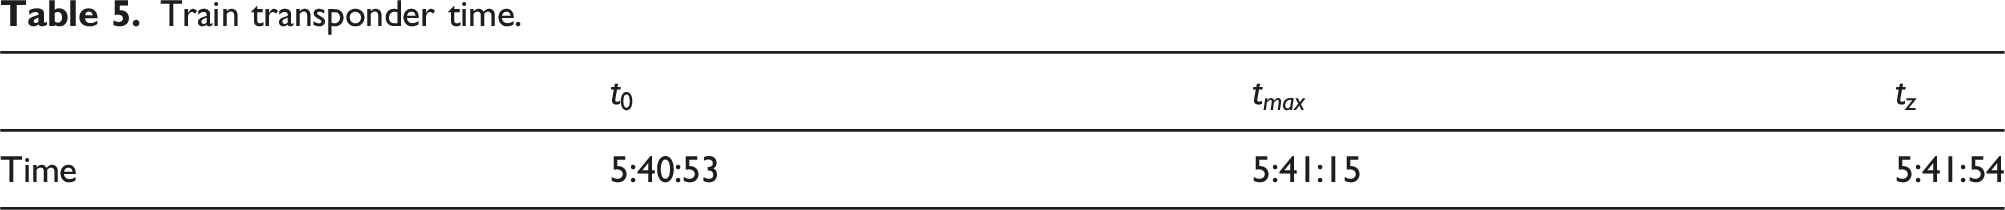
First, the operation time of the empty train on the bridge was determined to be from 5:40:53 to 5:41:54 on June 13, 2024, for a total of 62 seconds. Starting at 5:40:53, a sample set
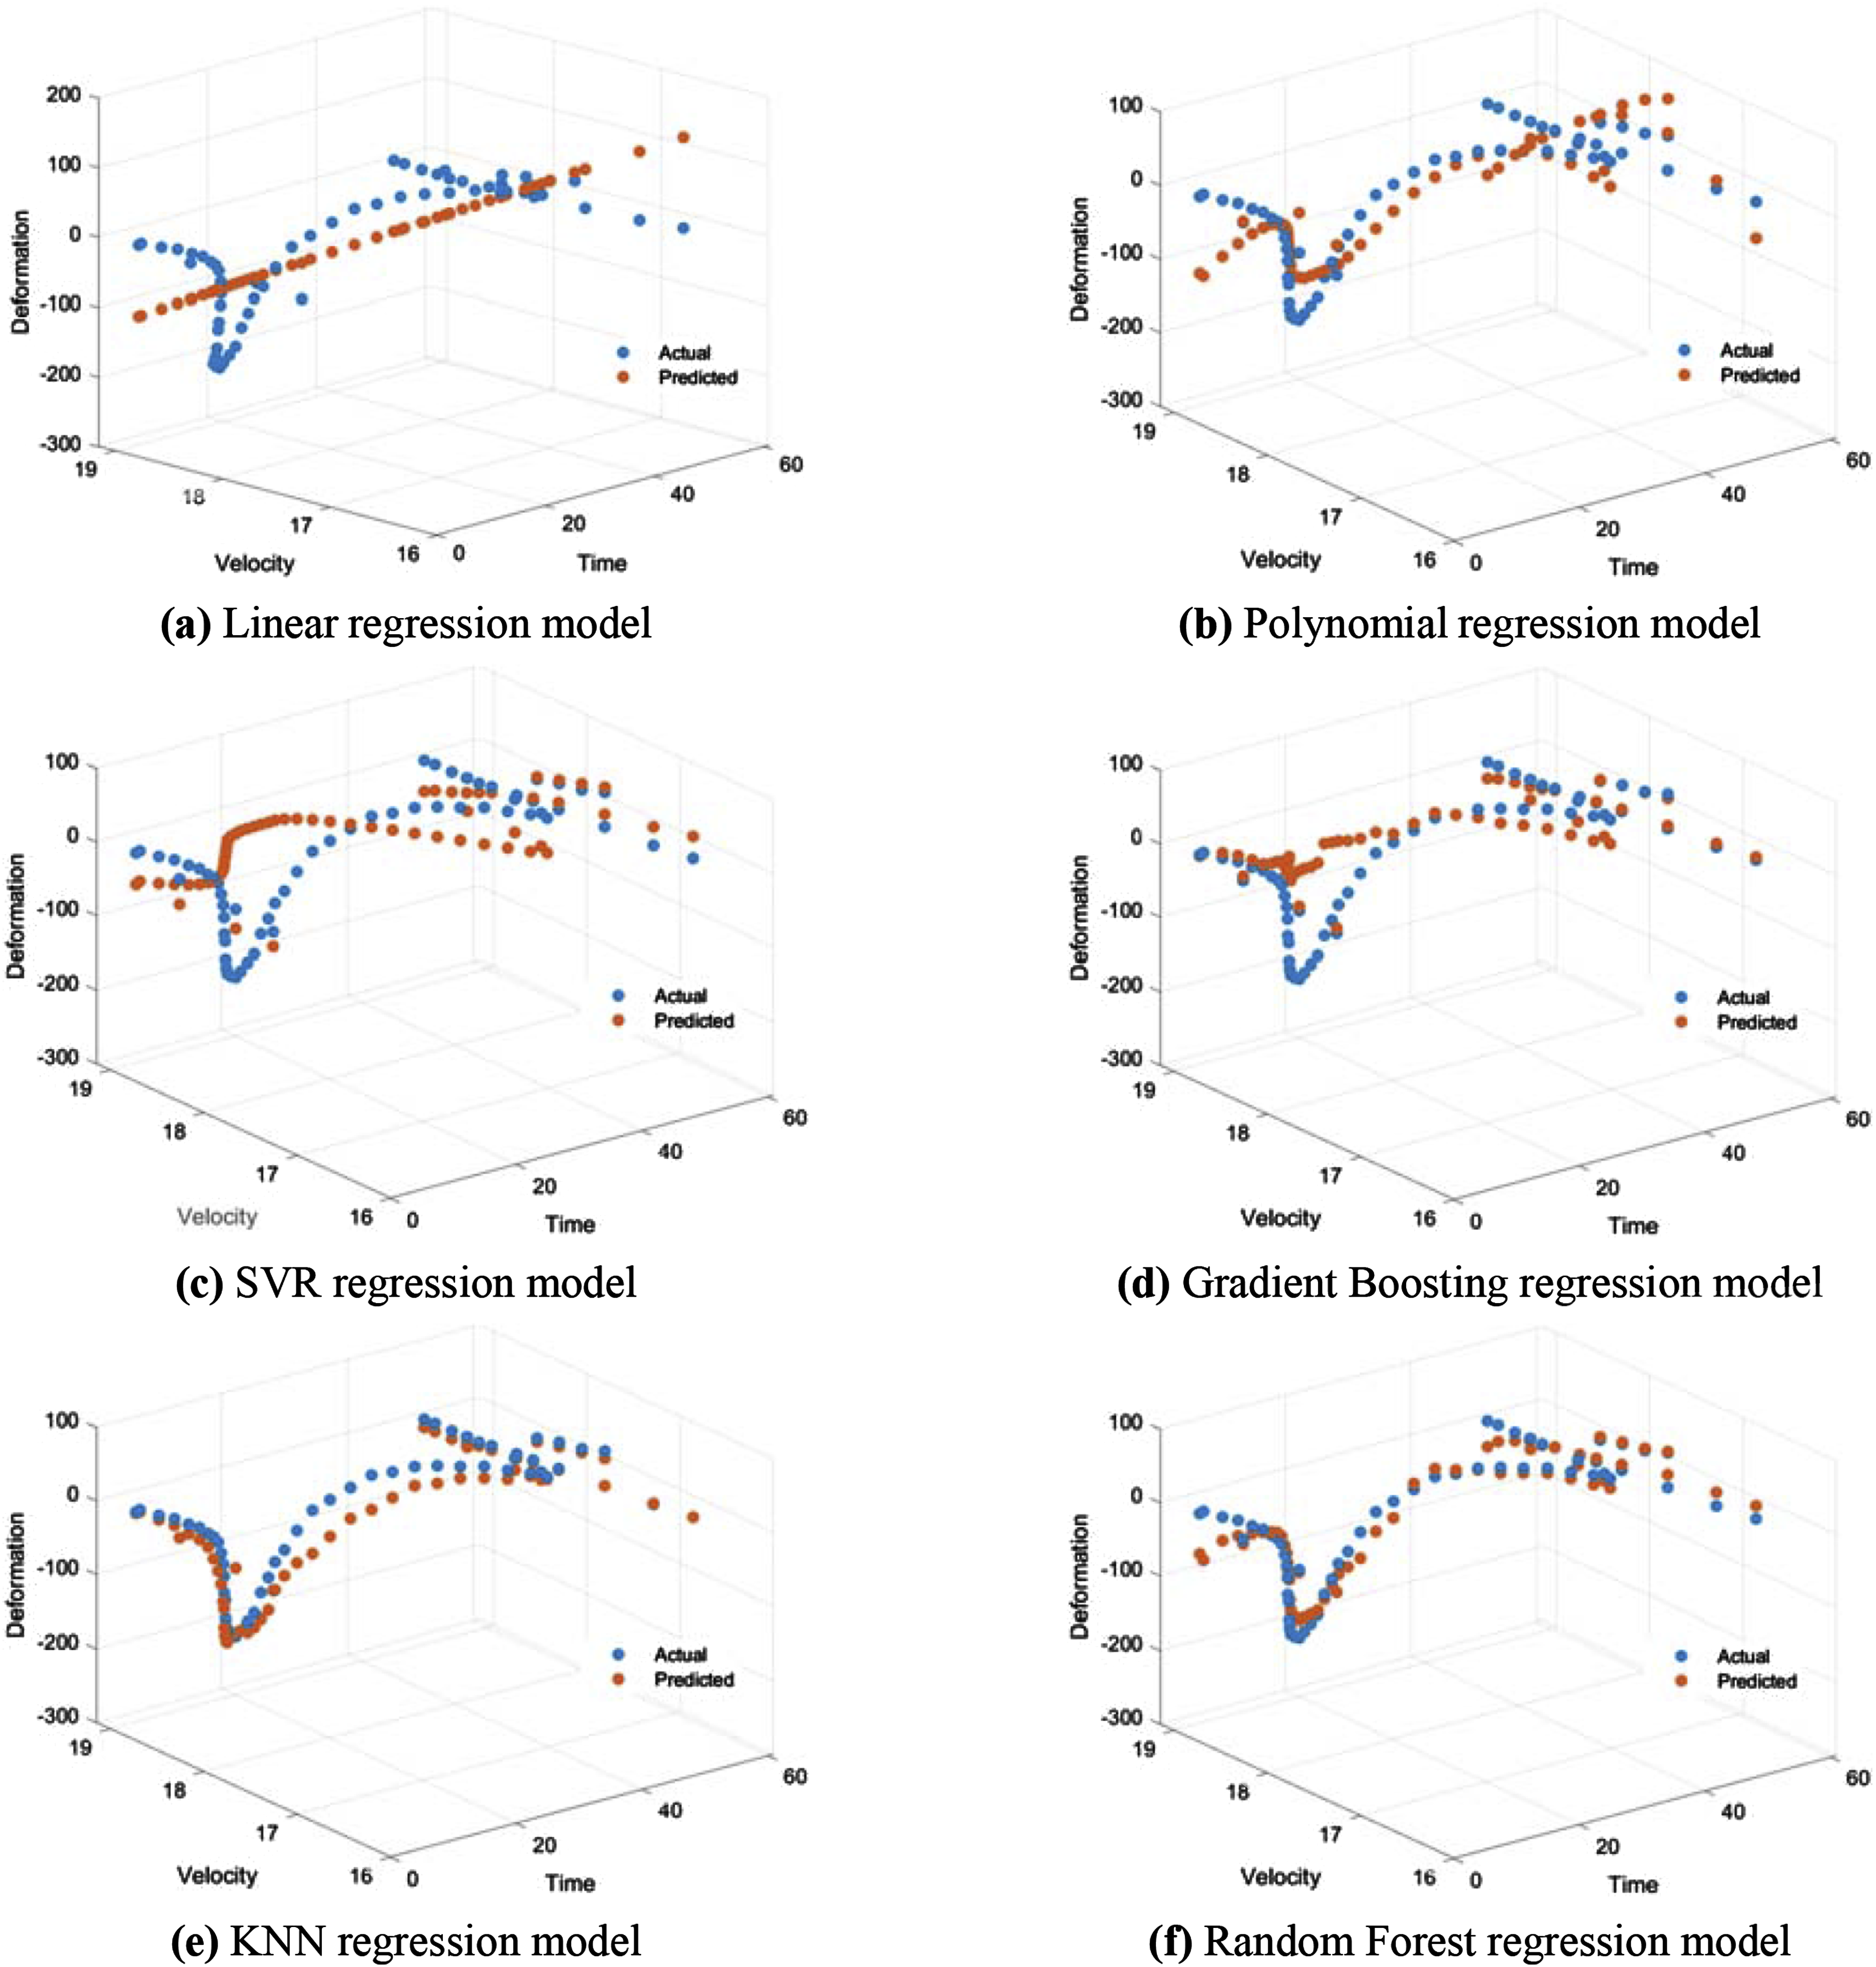
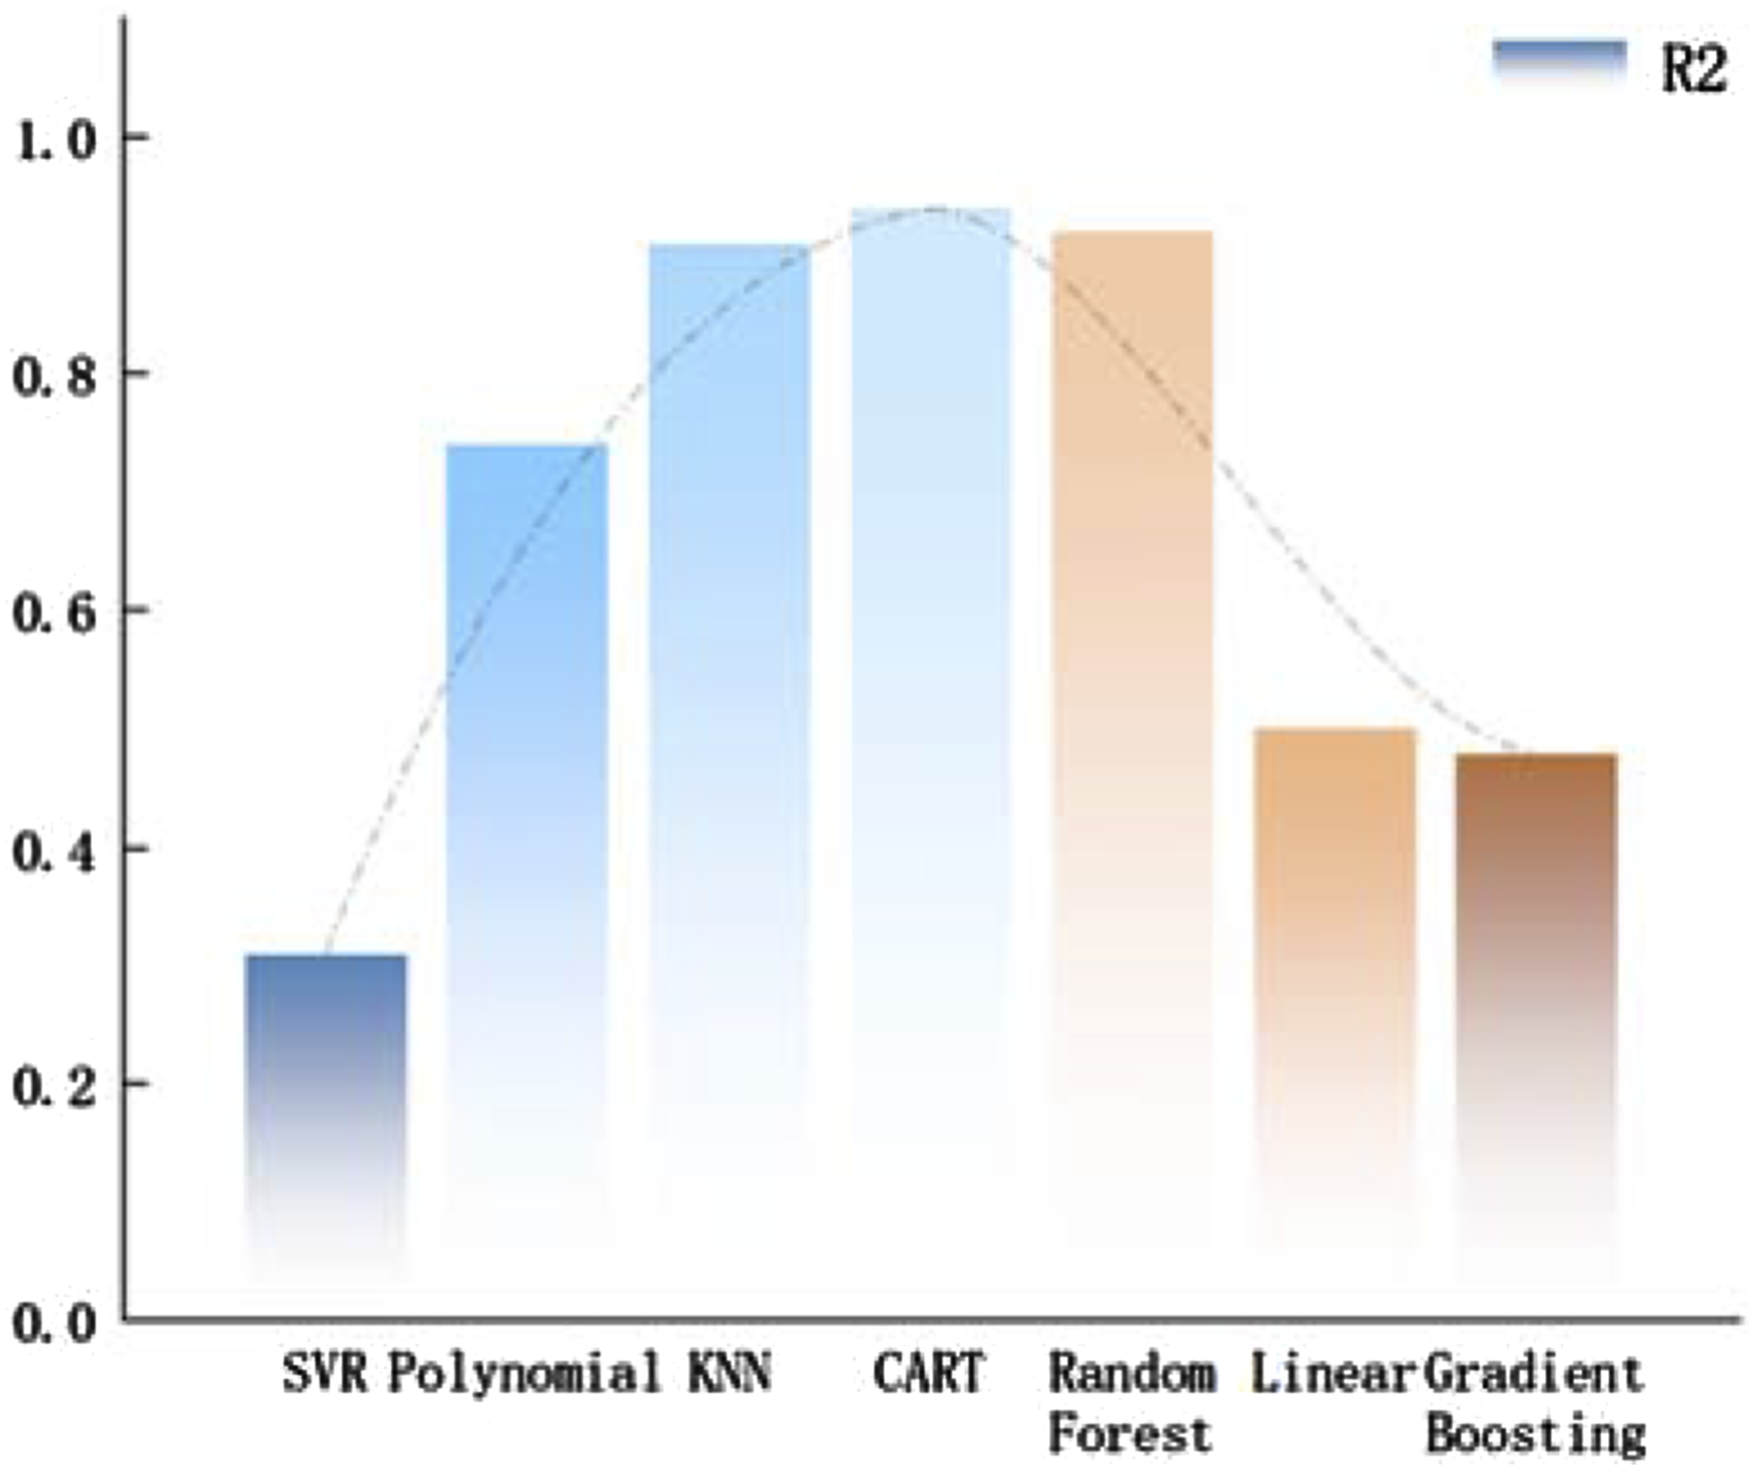
The CART regression model CART regression model. The contrast regression models. Regression model R2 comparison graph.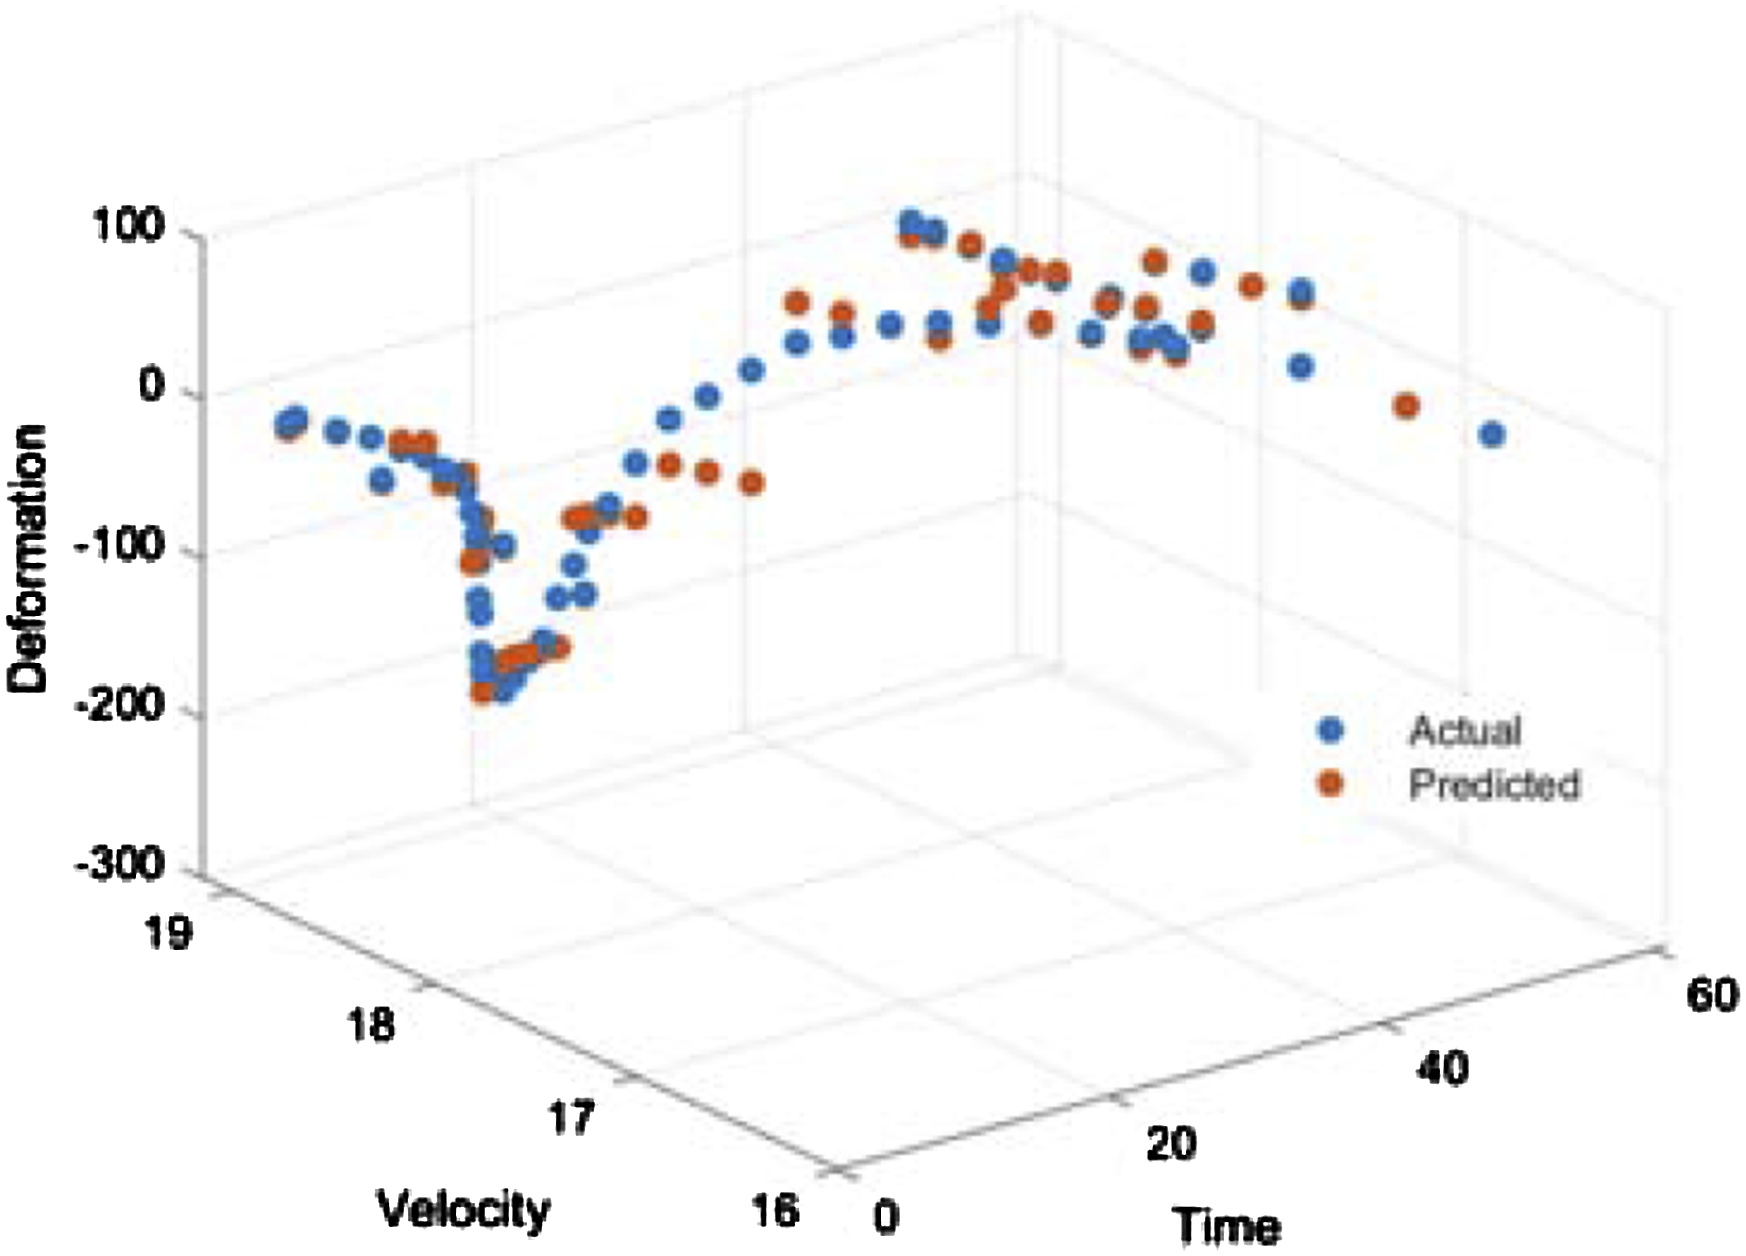
Stiffness evaluation
After the R2 evaluation of model reliability, the correction coefficients of each point were calculated according to equation (18), and the results are shown in Figure 19. Therefore, the correction coefficient of the CART regression model calculated according to equation (19) is 1.04. Correction coefficients for each point.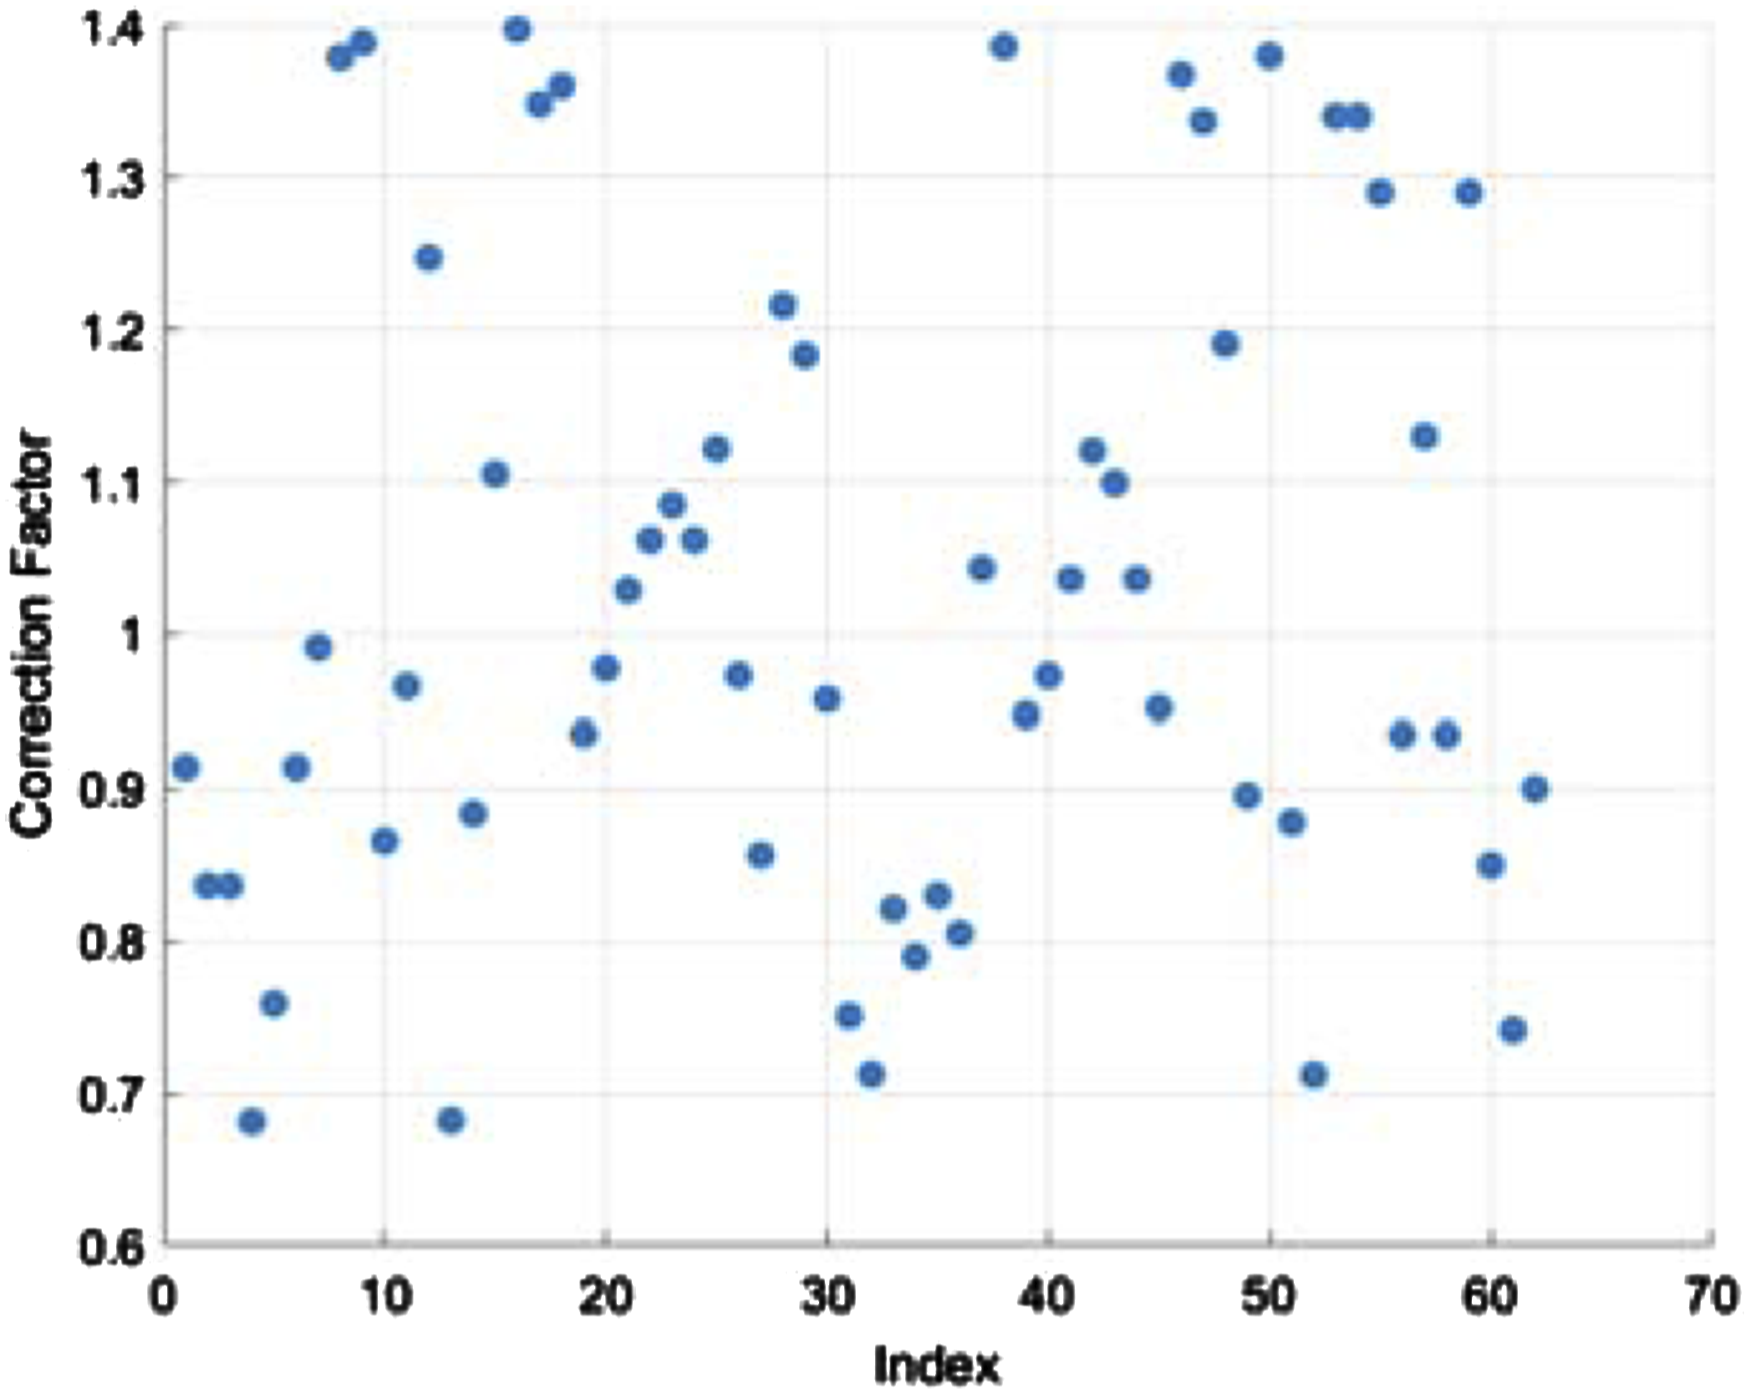
Under the same environmental factors (temperature, wind, etc.), the deformation monitoring value
According to the calculated as
Conclusions and prospects
Conclusions
In this paper, a method for evaluating the structural vertical stiffness of a track-specific suspension bridge is proposed based on the action of the no-load first train, and the effectiveness and feasibility of the method are verified on the world’s largest span self-anchored track suspension bridge. The conclusion is as follows: (1) Through the spatial relationship established between the transponder and the measurement point arrangement of the safety monitoring system, combined with the transponder travel track (velocity (2) The (3) Based on the characteristic that the moving load source is clear, the dynamic test coefficient (4) Relying on the Egongyan track bridge, through Madis/Civil 2023 analysis, the theoretical calculation value of the deformation of the most unfavorable section under the moving load of the no-load train is 268.55 mm, and the measured value of the monitoring system is 232.80 mm, the difference is 35.75 mm, and the relative error is 13.3%. The R2 score of the CART regression model is 0.94, and the accuracy is higher than that of the six comparison models. The correction coefficient calculated based on the CART regression model is 1.04. The modified dynamic check coefficient is 0.85, and the ratio of residual deformation value to maximum deformation value is 7.6%. The results show that the deformation of the main beam meets the requirements of the code, and the vertical stiffness of the structure is in a normal state.
Prospects
(1) While there is a correlation between deformation and stiffness, this study uses vertical deformation to reflect vertical stiffness. In future research, more comprehensive indicators will be considered. (2) The initial intention of this study was to conduct a stiffness evaluation based on the no-loaded train, as its load conditions are clearly defined. Since there is only one no-loaded train passing each day without affecting traffic, different speed tests and their impact on bridge stiffness were not considered. We will consider this aspect in our next research phase as a separate study topic. (3) This study proposed a stiffness evaluation method for rail bridges based on the first no-loaded train and achieved certain results. However, the study did not fully consider the dynamic amplification effect caused by track irregularities. Although the train’s speed over the bridge ranged between 55 km/h and 70 km/s, track irregularities still have some impact. In future research, we plan to combine numerical simulations with field tests to develop a more complex vehicle-bridge coupling model and systematically analyze the dynamic amplification effect caused by track irregularities.
Footnotes
Declaration of conflicting interests
The author(s) declared no potential conflicts of interest with respect to the research, authorship, and/or publication of this article.
Funding
The author(s) disclosed receipt of the following financial support for the research, authorship, and/or publication of this article: This work was supported by the Chongqing University of Science and Technology Research Grant Program (CKRC2021074) and the Chongqing University of Science and Technology Graduate Student Innovation Program (YKJCX2320612).