
Abstract
Noise pollution may induce physiological diseases. Acoustic modulation can be carried out by accurately identifying and localizing noise sources to achieve noise control. In this paper, a hyperbolic acoustic metamaterial configuration for high-precision identification and localization of noise sources is designed. The effect of hyperlens thickness on focusing imaging is analyzed with finite element analysis software. Based on the acoustic eight-layer lens configuration, the influence of the distance between the point sound source and the hyperlens on the far-field recognition resolution is studied. The acoustic metamaterials designed in this paper can flexibly modulate sound waves and effectively amplify the propagation information of swift waves. Combined with the phase conjugate method in the middle and far fields can realize the breakthrough of the Rayleigh diffraction limit problem in sound source identification. After verification, the experimental results of this paper break through the 0.5λ acoustic wave diffraction limit under 10 working conditions. So the configuration designed in this paper has high engineering practical value and good application prospects in noise source identification and localization. At the same time, the findings of this paper will also provide novel ideas for underwater target detection on a certain spatial scale.
Keywords
Introduction
The identification and localization of the radiated sound field of a noise source is the key to the control of radiated noise from the source. The difficulty of identifying and localizing the noise source lies in choosing the noise source identification technique that best matches the noise source identification according to the target frequency band. Near-field acoustic holography and beam-forming methods are the two more widely recognized methods, but both have limitations. The near-field acoustic holography method cannot break through the diffraction limit of the sound source in the far field. The beam-forming method is mainly used in the middle and high-frequency bands and has a high dependence on the test environment. There are many types of submarine underwater radiated noise sources. A single algorithm noise source identification system cannot simultaneously satisfy practical engineering applications. The submarine equipment radiation in the mid-frequency band ranges between 1 and 10 kHz. It is of great significance to identify and locate the middle and high-frequency band noise and reduce the vibration and noise in order to improve the concealment of submarine.
Acoustic metamaterials are artificially fabricated composite structures or materials that can be flexibly designed with structural parameters to solve bottlenecks in various fields. When acoustic waves propagate at a specific frequency in metamaterials, the abrupt waves therein can be propagated without attenuation or even enhanced. Acoustic metamaterials can be used to make acoustic superlenses to realize acoustic focusing in the far field, which provides a new idea to solve the problem of capturing abrupt waves in the mid- and far-field and thus breaks through the limit of acoustic source diffraction in the mid- and far-field. The special properties of acoustic metamaterials point out a new direction for the development of various fields. A lot of research results have emerged in the application of acoustic metamaterials. The current research on acoustic metamaterials focuses on coiled acoustic metamaterials, hyperbolic metamaterials, and so on.
Coiled acoustic metamaterials are designed to modulate acoustic waves by structurally coiling them to make the propagation distance longer and thus increase the refractive index of the acoustic waves during transmission. Compared with the local resonance type, the frequency range is wider and the sound absorption coefficient is higher. The coiled concept was first proposed in 2012 when Liang and his team 1 carefully designed and arranged the curled units made of rigid sheet material as triangular prisms to verify that the refractive index is -1. Adjusting the parameters of the curled structure can control the propagation path of the sound waves and realize the purpose of adjusting the refractive index. The configuration finally realized zero refractive index. In 2013, Frenzel et al. 2 extended the two-dimensional coiled acoustic metamaterials to three dimensions by designing a single-ported coiled acoustic metamaterial, which was prepared by 3D printing. They experimentally found that the phase and group velocities of this configuration were greatly reduced compared with those of air in the frequency range of 4000 Hz, thus verifying the superior acoustic isolation performance of this material. In 2016, R. Talebitooti 3 investigated acoustic behavior of the laminated composite cylindrical shell, excited by an oblique plane sound wave. In 2018, Talebitooti R 4 studied the influence of embedded porous core on Sound Transmission Loss (STL) of the structure. In 2023, Asadi Jafari MH 5 found that modeling a shell as a truss core sandwich structure either attenuates the sound transmitted into the system or shifts the first dip point of the STL curve (curvature frequency) to lower frequencies.
Acoustic hyperbolic metamaterials are artificial materials with hyperbolic dispersion properties. 6 The dispersion curves of hyperbolic metamaterials are characterized by hyperbolic functions with strong anisotropy. By changing the structure size and distribution law of hyperbolic materials, the control of acoustic wave intensity and propagation direction can be accomplished. 7 The control of the intensity and propagation direction of acoustic waves can be accomplished by changing the structure size and distribution pattern of hyperbolic materials, which is of great significance for the far-field identification and amplification of abrupt waves. Hyperbolic metamaterials have been used as a powerful tool to realize sub-wavelength super-resolution imaging. In the field of acoustics, Li 8 first achieved a super-resolution imaging of 0.33λ by placing brass interleaving in the air medium. Due to the great difference in density between the two media, an anisotropic hyperbolic dispersion relationship was obtained near 4200 Hz.
Shen et al. 9 made 13 groups of thin plate film arrays into lenses. When the lens was used to identify and locate the point sound source, the evanescent wave generated by the sound source coupled with the thin plate film lens structure, resulting in sub-wavelength imaging, achieving an imaging resolution of 0.21λ and breaking through the 0.5λ limit of acoustic wave diffraction.
In 2012, Li Yong 10 designed an acoustic superlens with gradient refractive index based on brass material by spatial coiling configuration. The refractive index in the axial direction of the lens can be adjusted by adjusting the size of the acoustic superlens. By analyzing the effective parameters of the acoustic superlens, it is found that the lens has a high refractive index and acoustic impedance matching performance.
In 2013, V. Romero-Garcia 11 of the University of Le Mans in France designed acoustic hyperlens based on an axially symmetric structure, which is coupled by air to a rigid scatterer surrounding the structure. Due to the large size of the lens, it is well-matched with the sound source. The refractive index can be adjusted by adjusting the filling rate of the radial plane of the lens. Moreover, the lens has the property of hyperbolic material. A comparison of finite element simulation and experimental results shows that the acoustic superlens have excellent acoustic wave focusing and amplification effects.
In 2014, He 12 made an acoustic lens that can be used to focus underwater sound sources by wrapping tungsten in rubber and placing it in water. In order to make the sound source recognition effect better, the surface adjustment mode is used to arrange the lead columns on both sides of the lens according to the same size. The focusing resolution is 0.35λ, which breaks the limit of sound wave diffraction.
In 2021, Hu Chengbo 13 from Nanjing University proposed a perforated spherical shell-type acoustic hyperbolic lens based on the typing method to achieve the acoustic focusing effect. The spherical acoustic hyperbolic lens can achieve super-resolution imaging in a 4600–9000 Hz wide band. The configuration has been verified by experiments to be suitable for focusing higher frequency sound waves when scaled by equal scale.
The acoustic wave carrying acoustic information can be divided into propagating waves and evanescent waves. Evanescent wave has a large spatial frequency and will decay exponentially in the far field beyond one wavelength. Its decay speed is so fast that it cannot participate in imaging in the far field. The attenuation of important acoustic information by evanescent waves leads to the diffraction limit of sound waves, which makes it difficult to break through 0.5λ resolution.
The acoustic diffraction limit is the key to influencing the resolution of acoustic source recognition. In this paper, the introduction of acoustic metamaterials with anisotropy combined with fractal theory to utilize its negative refraction properties, a kind of acoustic focusing lens is designed based on hyperbolic metamaterials, and then discussing the influence of each structural parameter on the focusing effect and carrying out the noise-focusing imaging research in submarine at a frequency of 2271.5 Hz. Through the finite element software COMSOLMultiphysics simulation, the preparation was made based on 3D printing technology. The experiment was verified in the semi-anechoic chamber.
Metamaterial design and simulation
Modeling
Hyperbolic metamaterials have excellent properties in sub-wavelength super-resolution imaging, which provide ideas for the configurations with high-precision recognition resolution superlenses to be designed in this paper. However, the development of acoustic hyperbolic metamaterials in current research faces many bottlenecks. For example, the designed complex configurations are difficult to be prepared by 3D printing and the experimental conditions are limited. This paper proposes an acoustic hyperbolic metamaterial for noise source identification and localization based on the theory of matched hyperbolic metamaterials. The hyperbolic configuration proposed in this paper has a simple structure that can be prepared by 3D printing technology.
In the configuration diagram, h represents the height of the configuration of 24 mm; w represents the width of 24 mm; the wall thickness of the structural arms is 1 mm, the small opening gaps in the upper and lower parts are represented by a, their size is 1.5 mm; the gap s between the structural arms is 1.5 mm and the length of the structural arms d is 20.5 mm. This configuration is composed of two symmetrical fractals and the interval c between the two parts is 2 mm. The configuration of hyperbolic anisotropic acoustic metamaterial units designed in this paper is shown in Figure 1: Schematic diagram of an acoustic hyperbolic configuration metamaterial.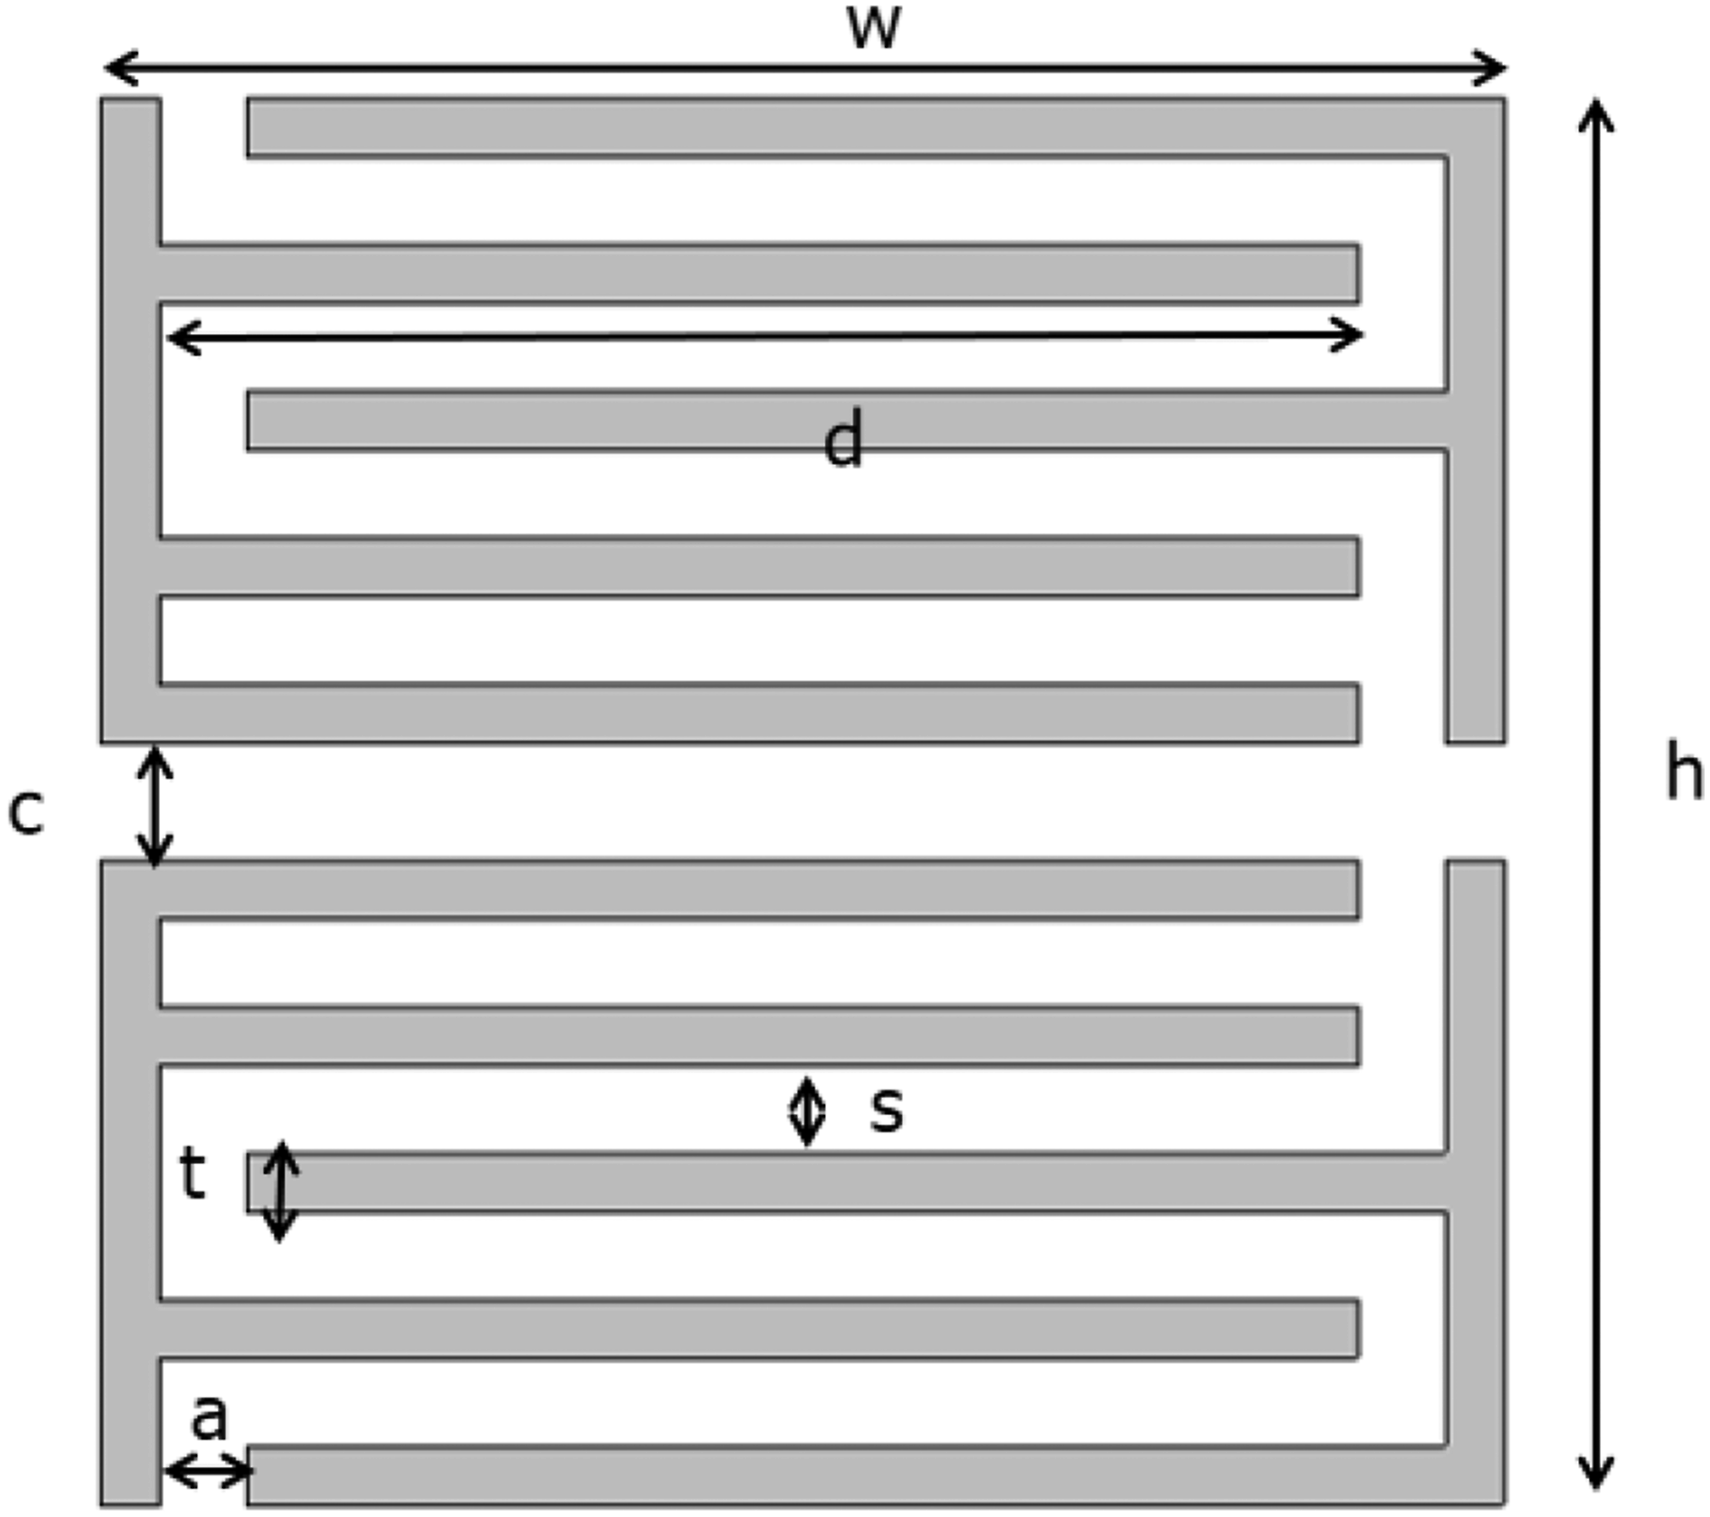
The highlight of the acoustical metamaterials designed in this paper is that there are interlocking structural arms in the phononic crystal through the structural characteristics of folded space. When the sound wave passes through, it can extend the transmission path of the sound wave, and then extend the total propagation time of the sound wave, and finally realize the phase regulation of the sound wave. Since the structural parameters of the acoustic metamaterial configuration proposed in this paper are controllable, the effects of the structural parameters of this configuration on the acoustic focusing effect will be further discussed below.
Principle of acoustic superlens imaging
Dispersion characteristics
In two dimensions, the distribution of isofrequencies of acoustically hyperbolic metamaterials can be described by the acoustic dispersion equation.

The hyperbolic configuration designed in this paper has hyperbolic isofrequency distribution at 2271.5 Hz. The hyperbolic dispersion curve is shown in Figure 2. The dotted circles in the figure represent the isofrequency lines of sound waves in the air. The yellow dashed line is the auxiliary line indicating the tangent of the hyperbola and perpendicular to the X-axis. k
i
indicates the incidence direction of the sound wave from air into the hyperbolic medium. k
r
is the refraction direction of the sound wave. v
g
represents the direction of the group velocity and you can see that the direction of the group velocity in the hyperbolic medium is perpendicular to k
r
. θ is the angle between the group velocity v
g
and the vertical direction. Diagram of hyperbolic configuration dispersion curve.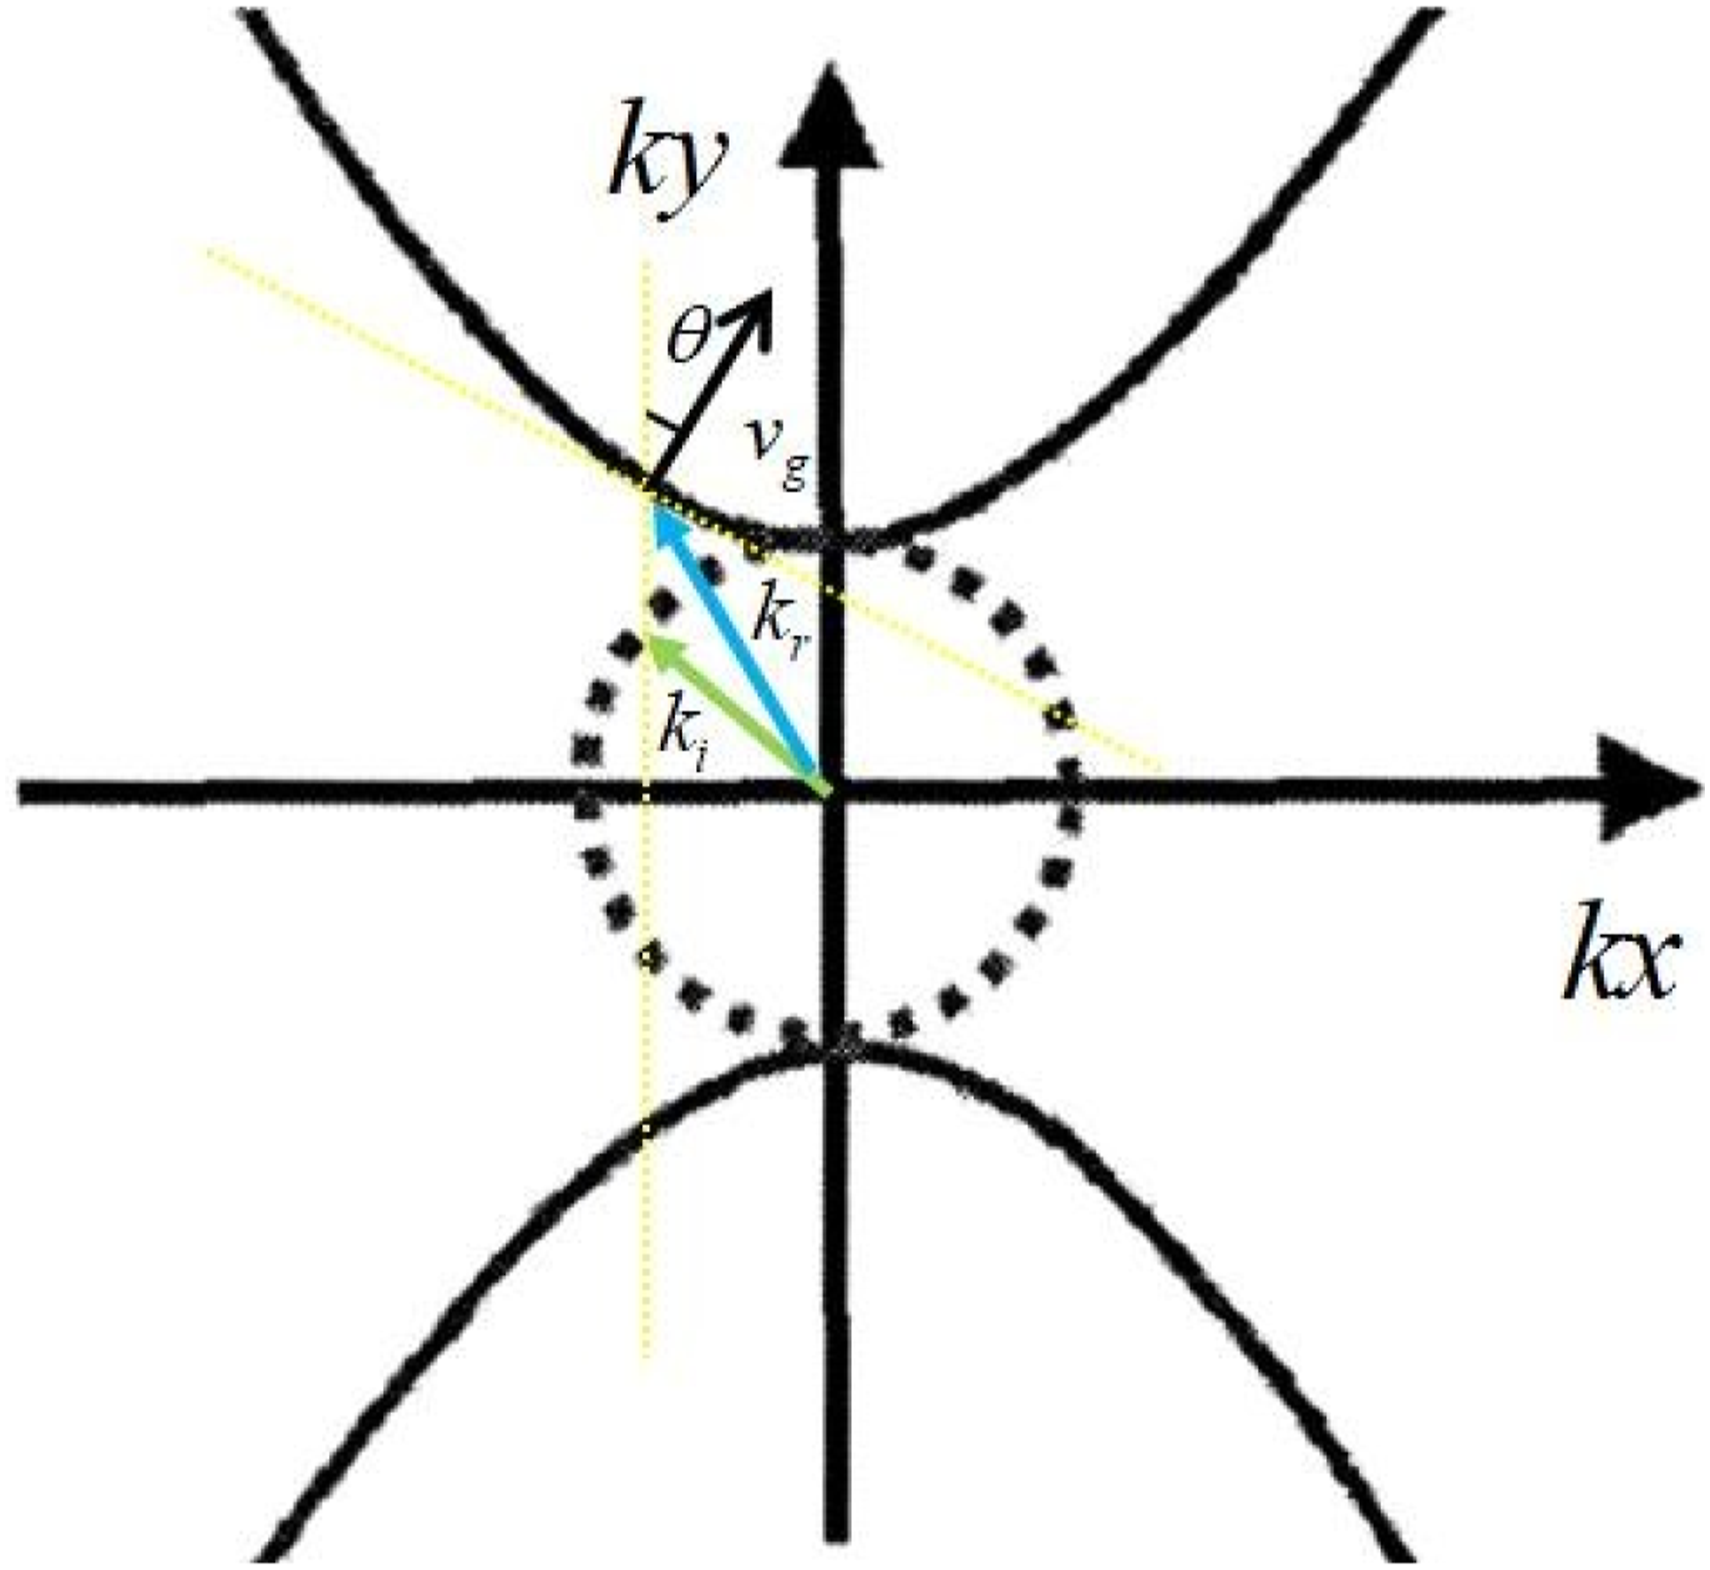
Due to the excellent anisotropic properties of acoustic hyperbolic metamaterials, when an acoustic wave is incident on an acoustic metamaterial medium, the direction of propagation of the incident wave 𝑘𝑖 and the direction of refraction of the acoustic wave 𝑘𝑟 and the group velocity direction in the hyperbolic medium v𝑔 as shown in Figure 2. It can be seen that its group velocity direction is perpendicular to the wave vector k r along the normal direction of the dispersion curve. Although the phase velocity of the refracted wave is positive, the energy flow of the incident wave and the refracted wave are on the same side as the normal. The group velocity is opposite to the phase velocity, so negative refraction occurs. The negative refractive properties of the hyperbolic configuration metamaterials proposed in this paper will be verified in subsequent simulations.
Calculation of refractive index
The refractive index of the hyperbolic metamaterial determines whether the hyperbolic configuration has the ability to focus imaging and is also the basis for whether the configuration can break through the 0.5 λ acoustic diffraction limit and realize high-resolution imaging. The refractive index of the hyperbolic configuration is calculated by the pressure acoustics-frequency domain module of COMSOL Multiphysics. The calculation schematic is shown in Figure 3. The perfect matching layer can effectively avoid the acoustic wave reflection back to interfere with the calculation accuracy. The background pressure field provides the incident plane wave with an amplitude of 1 Pa. The four red dots in the figure indicate that the four microphones are arranged in the direction of acoustic wave incidence and the sound pressure values of the four points are extracted. The acoustic metamaterials have the periodic property and thus the periodic boundary is introduced at the right side, which is generalized to the whole space of the hyperbolic material through the computation of refractive indices of one single cell. In order to avoid echo interference on the other side, the periodic boundary is also blocked by simulating a perfect absorbing boundary with a perfect matching layer. COMSOL calculation of refractive index diagram.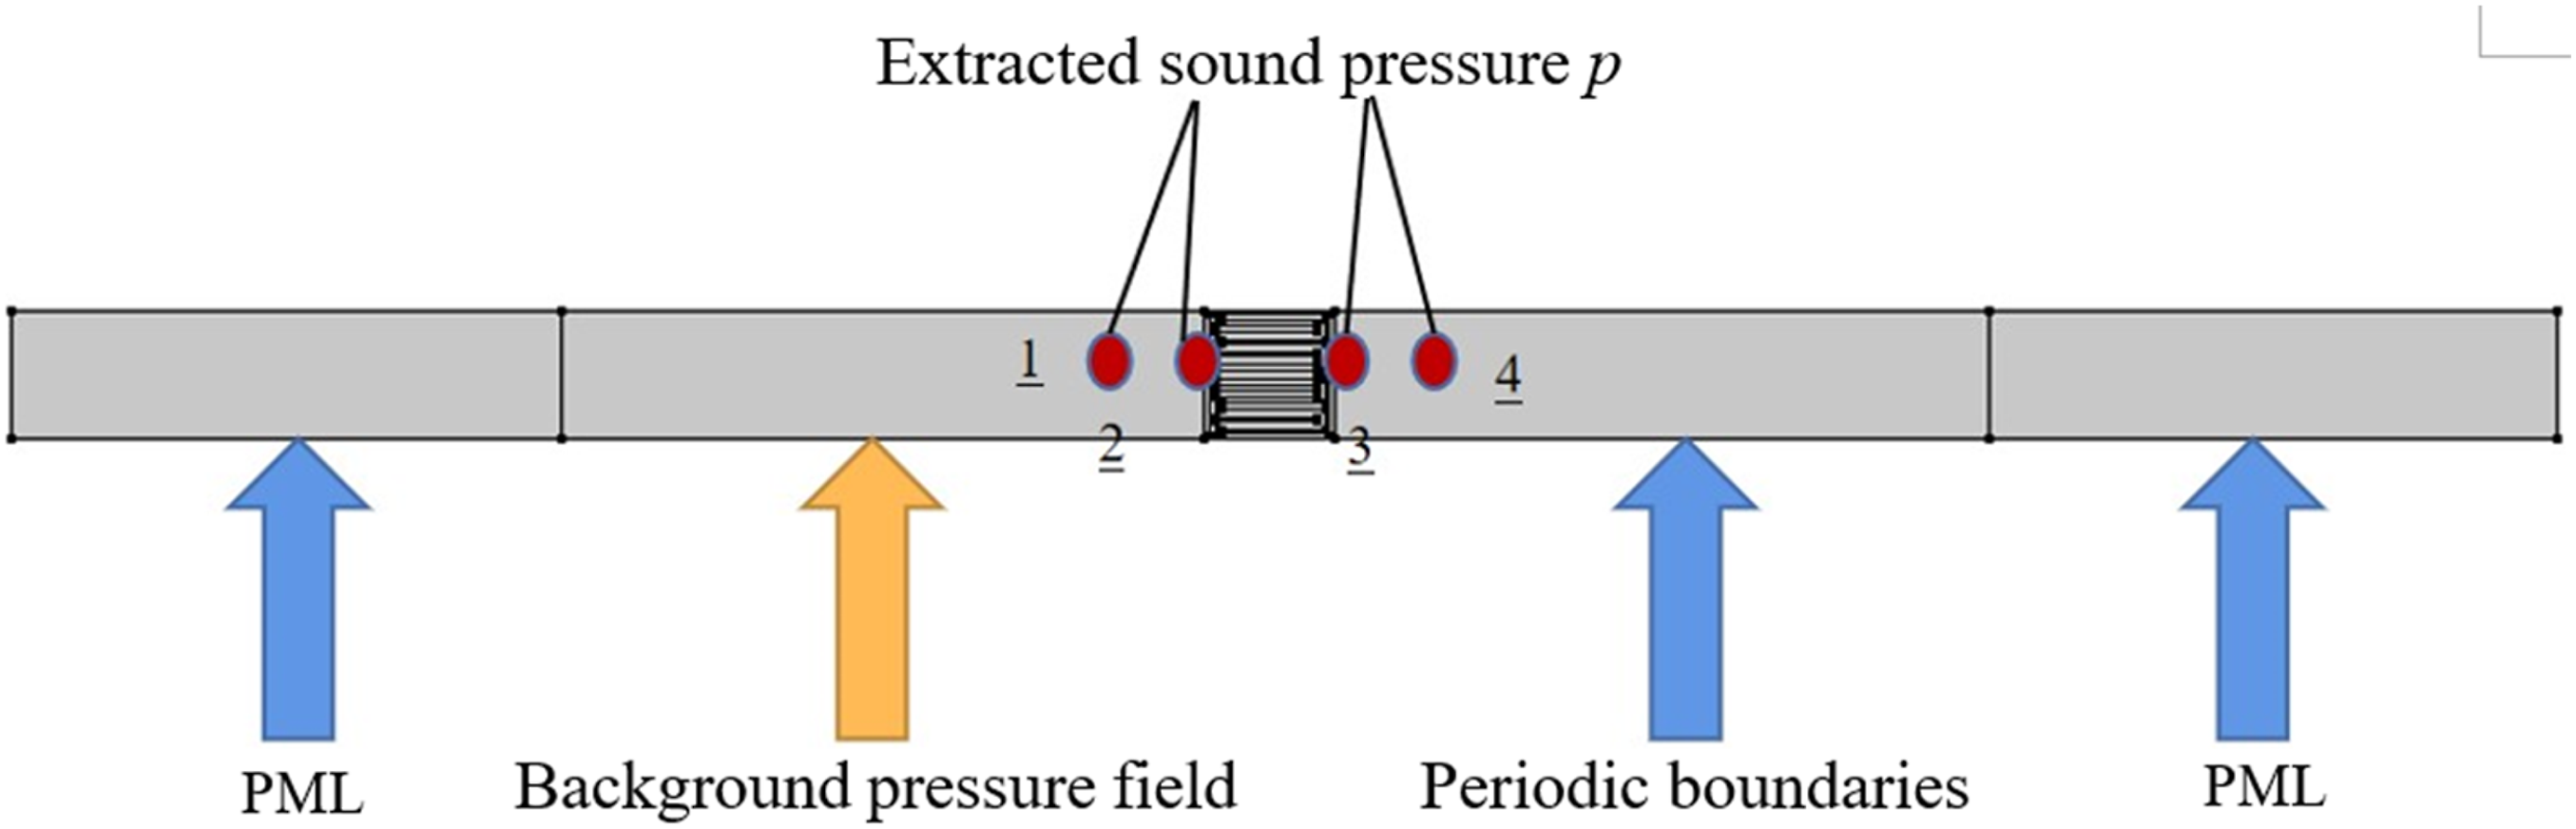
The calculated single-cell size of the hyperbolic configuration is chosen as 26 mm × 26 mm.
In the COMSOL Multiphysics pressure acoustic frequency domain, the speed of sound is set to c = 343 m/s, the density of air is ρ = 1.21 kg/m3, and the parameter of the hyperbolic material configuration is photosensitive resin is set to its mass density ρ = 1300 kg/m3, and the propagation of the sound wave in the photosensitive resin has a speed of sound of 716 m/s.
Firstly, the acoustic hyperbolic configuration is analyzed by sweeping in the frequency range of 2000–3000 Hz. The dimensions of the acoustic field are calculated to be 510 mm × 26 mm. The incident sound pressure at the left boundary of the configuration and the incident sound pressure at the left boundary are extracted to get the transmission coefficient and the reflection coefficient of the hyperbolic material. The refractive index can be obtained by getting the expression of the transmission coefficient and the reflection coefficient.
14


The refractive index of this hyperbolic configuration is calculated by COMSOL Multiphysics as shown in Figure 4. It can be seen that the refractive index of this configuration is -1 when the excitation frequency of the point source is 2271.5 Hz. Combined with the theory of negative refraction, it can be determined that the hyperbolic configuration proposed in this paper possesses the property of negative refraction. The acoustic wave transmits through the hyperbolic superlens when the excitation of the source is issued by the point source at 2271.5 Hz. After the lens, the image point S focused by the point source and the position point D of the point source and the thickness L of the lens, satisfy the full-angle refraction of S = L − D. Schematic diagram for calculating refractive index of hyperbolic configuration.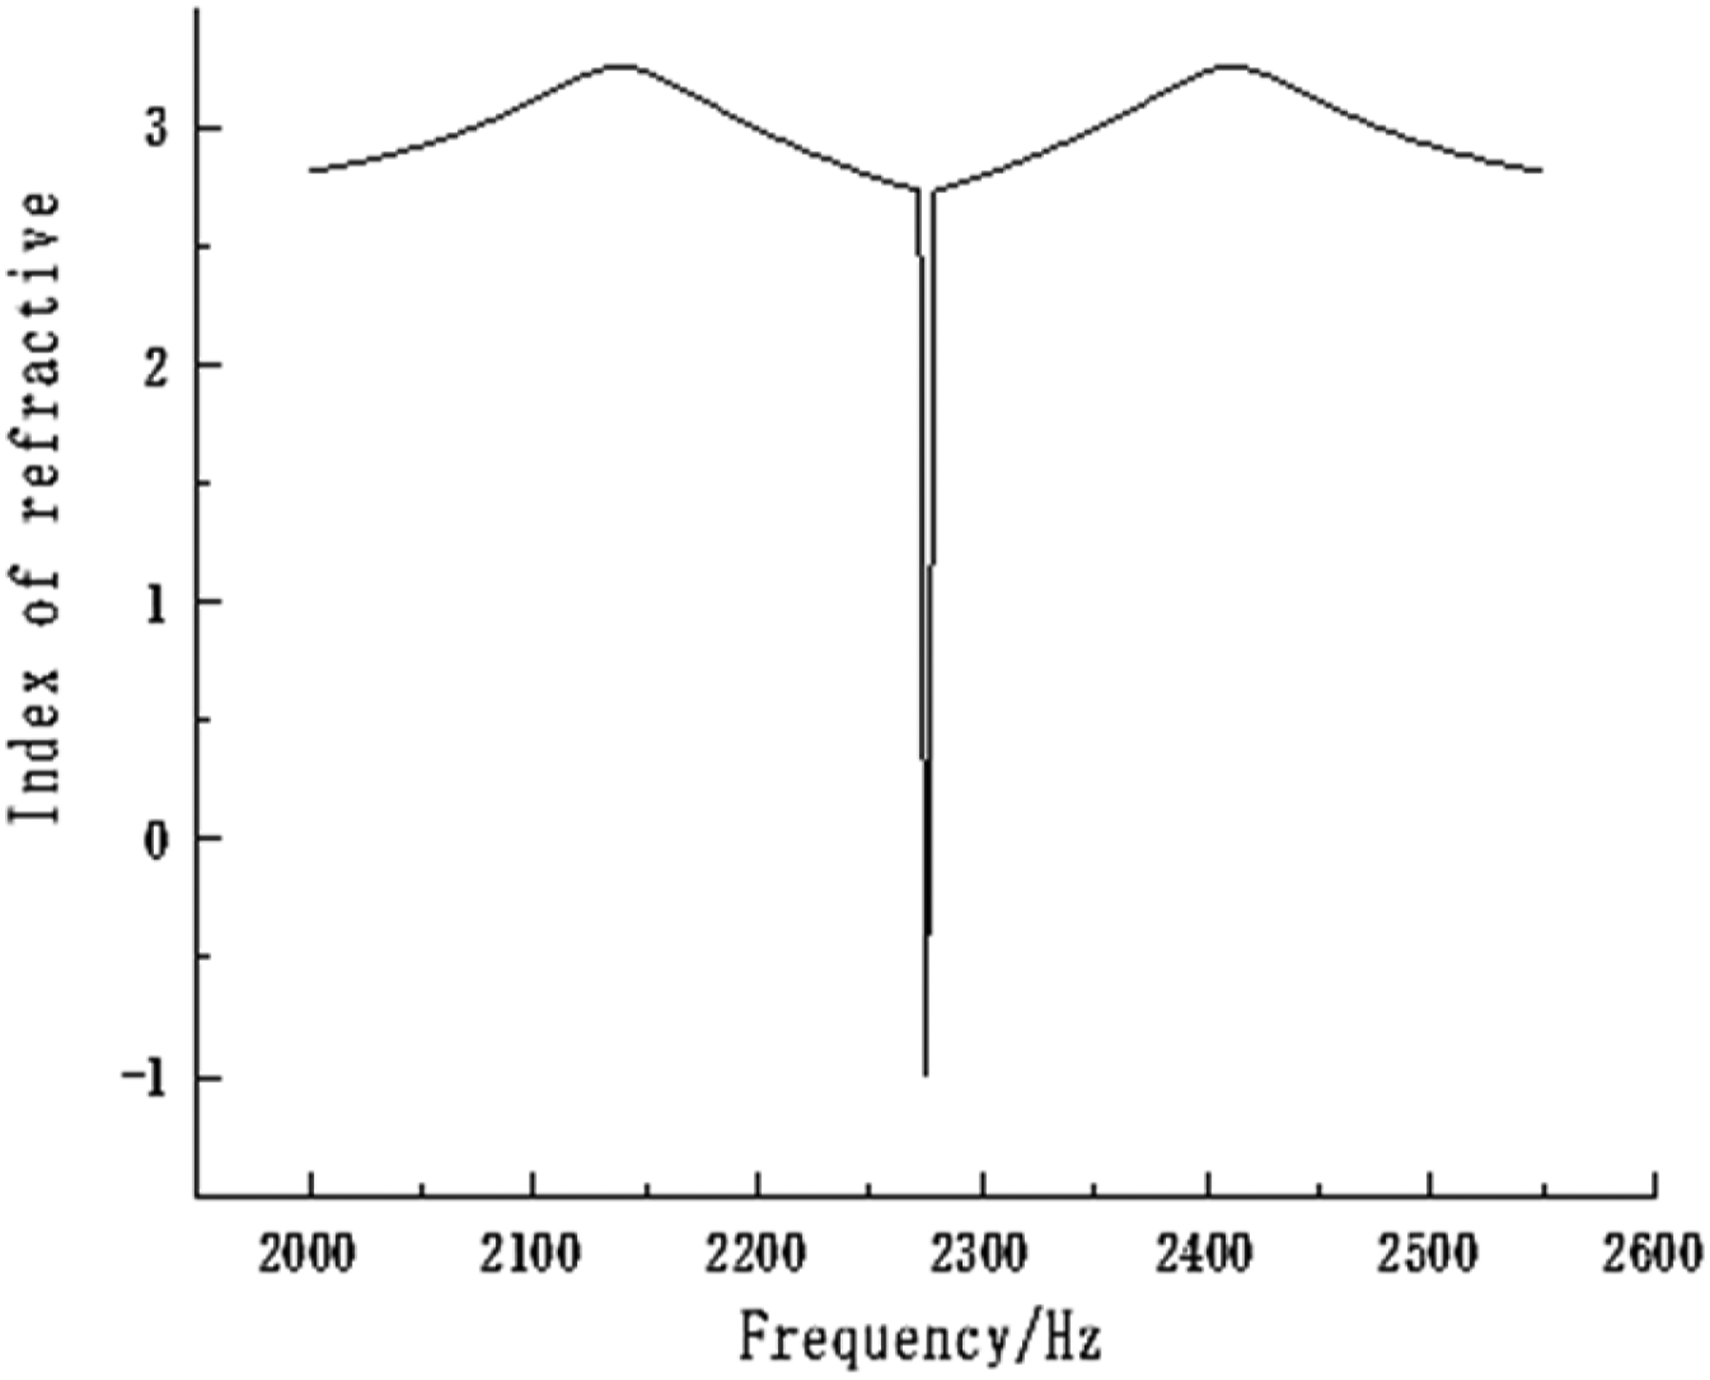
Structural analysis of the energy band
Ideal acoustic metamaterials are usually infinite periodic, which is not possible when complete additive preparation is done via 3D printers. Periodic structures can be approximated as infinite-periodic models for simulation. Based on energy band theory and Bloch’s theorem, it is possible to reduce the overall model to the study of a single cell with an energy band diagram describing the elastic wave bandgap properties of the infinite-periodic structure. Bloch wave vector represents the phase change of electron wave function between different primitive cells, and its magnitude only meets the one-to-one correspondence with the wave function within a reciprocal lattice vector, so only the wave vector in the first Brillouin region is usually considered. For a given wave vector and potential field distribution, the Schrodinger equation of electron motion has a series of solutions, called the energy band of the electron, which are often distinguished by the subscript n of the wave function. The energy of these bands has a gap of finite size at the boundary of each single value region of k, which is called the energy gap. When an acoustic wave is incident from all directions into an acoustic metamaterial, there are certain frequency bands in which the wave cannot continue to propagate forward and these bands are the bandgap. The generation and size of the bandgap are affected by factors such as the size of the geometric structure, the filling ratio of the scatterer and the substrate, and the impedance ratio.
Combined with the design configuration characteristics of this paper, a square lattice is used to calculate its energy band diagram. As shown in Figure 5, the sweeping direction is M → Γ → X → M. The boundary condition of this configuration is chosen as the Floquet cycle. Schematic diagram of irreducible Brillouin region of a square lattice.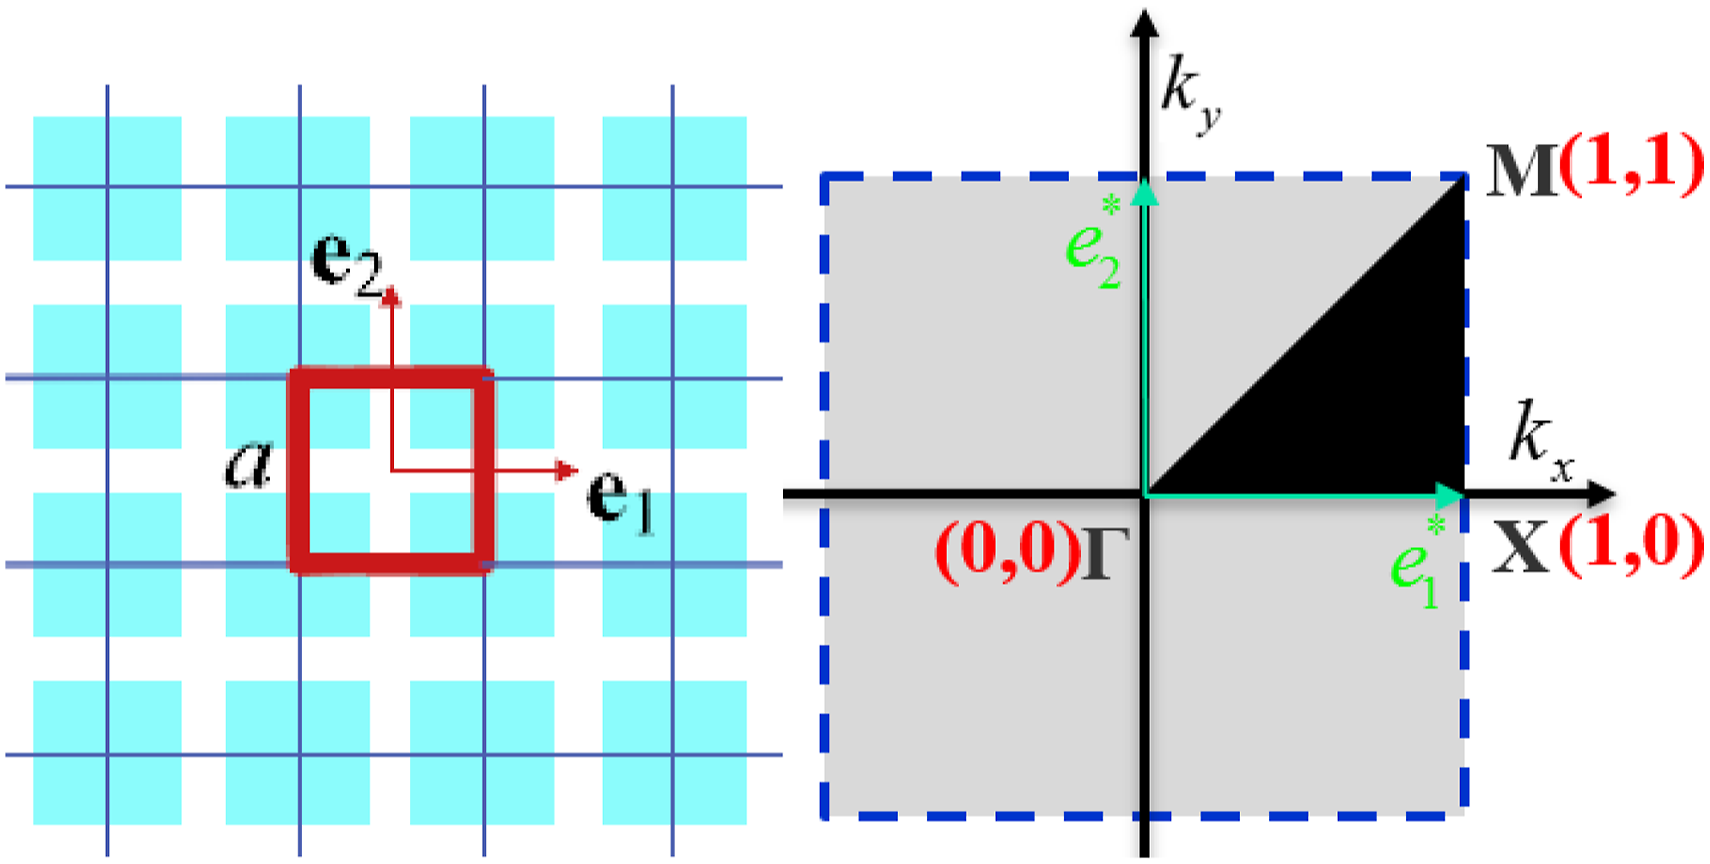
Before determining the hyperbolic configuration in this paper, each parameter is discussed. The influence of each structural parameter on the band structure in the hyperbolic configuration will be discussed in detail from the band diagram and the vibration modes corresponding to each band frequency
Effect of gap spacing on energy band structure
In studying the effect of gap c between hyperbolic fractal structures on the energy band structure, the gap c is taken as 0.5 mm, 1 mm, 2 mm, and 3 mm for simulation calculations. The lattice constant is uniformly taken as a = 26 mm.
The hyperbolic configuration acoustic metamaterial designed in this paper is selected as photosensitive resin as the material for simulation. The parameters of photosensitive resin are Poisson’s ratio 𝜎 = 0.41, modulus of elasticity 𝐸 = 2450Mpa, wave velocity 𝑐1 = 716 𝑚/𝑠, and density 𝜌1 = 1300 𝑘𝑔/𝑚3. The air material parameters are density, modulus of elasticity, wave velocity, and density. Air material parameters are density 𝜌2 = 1.21 𝑘𝑔/𝑚3 and velocity 𝑐2 = 343 𝑚/𝑠. The energy band structure obtained from the simulation is shown in Figure 6: Schematic diagram of single cell band structure.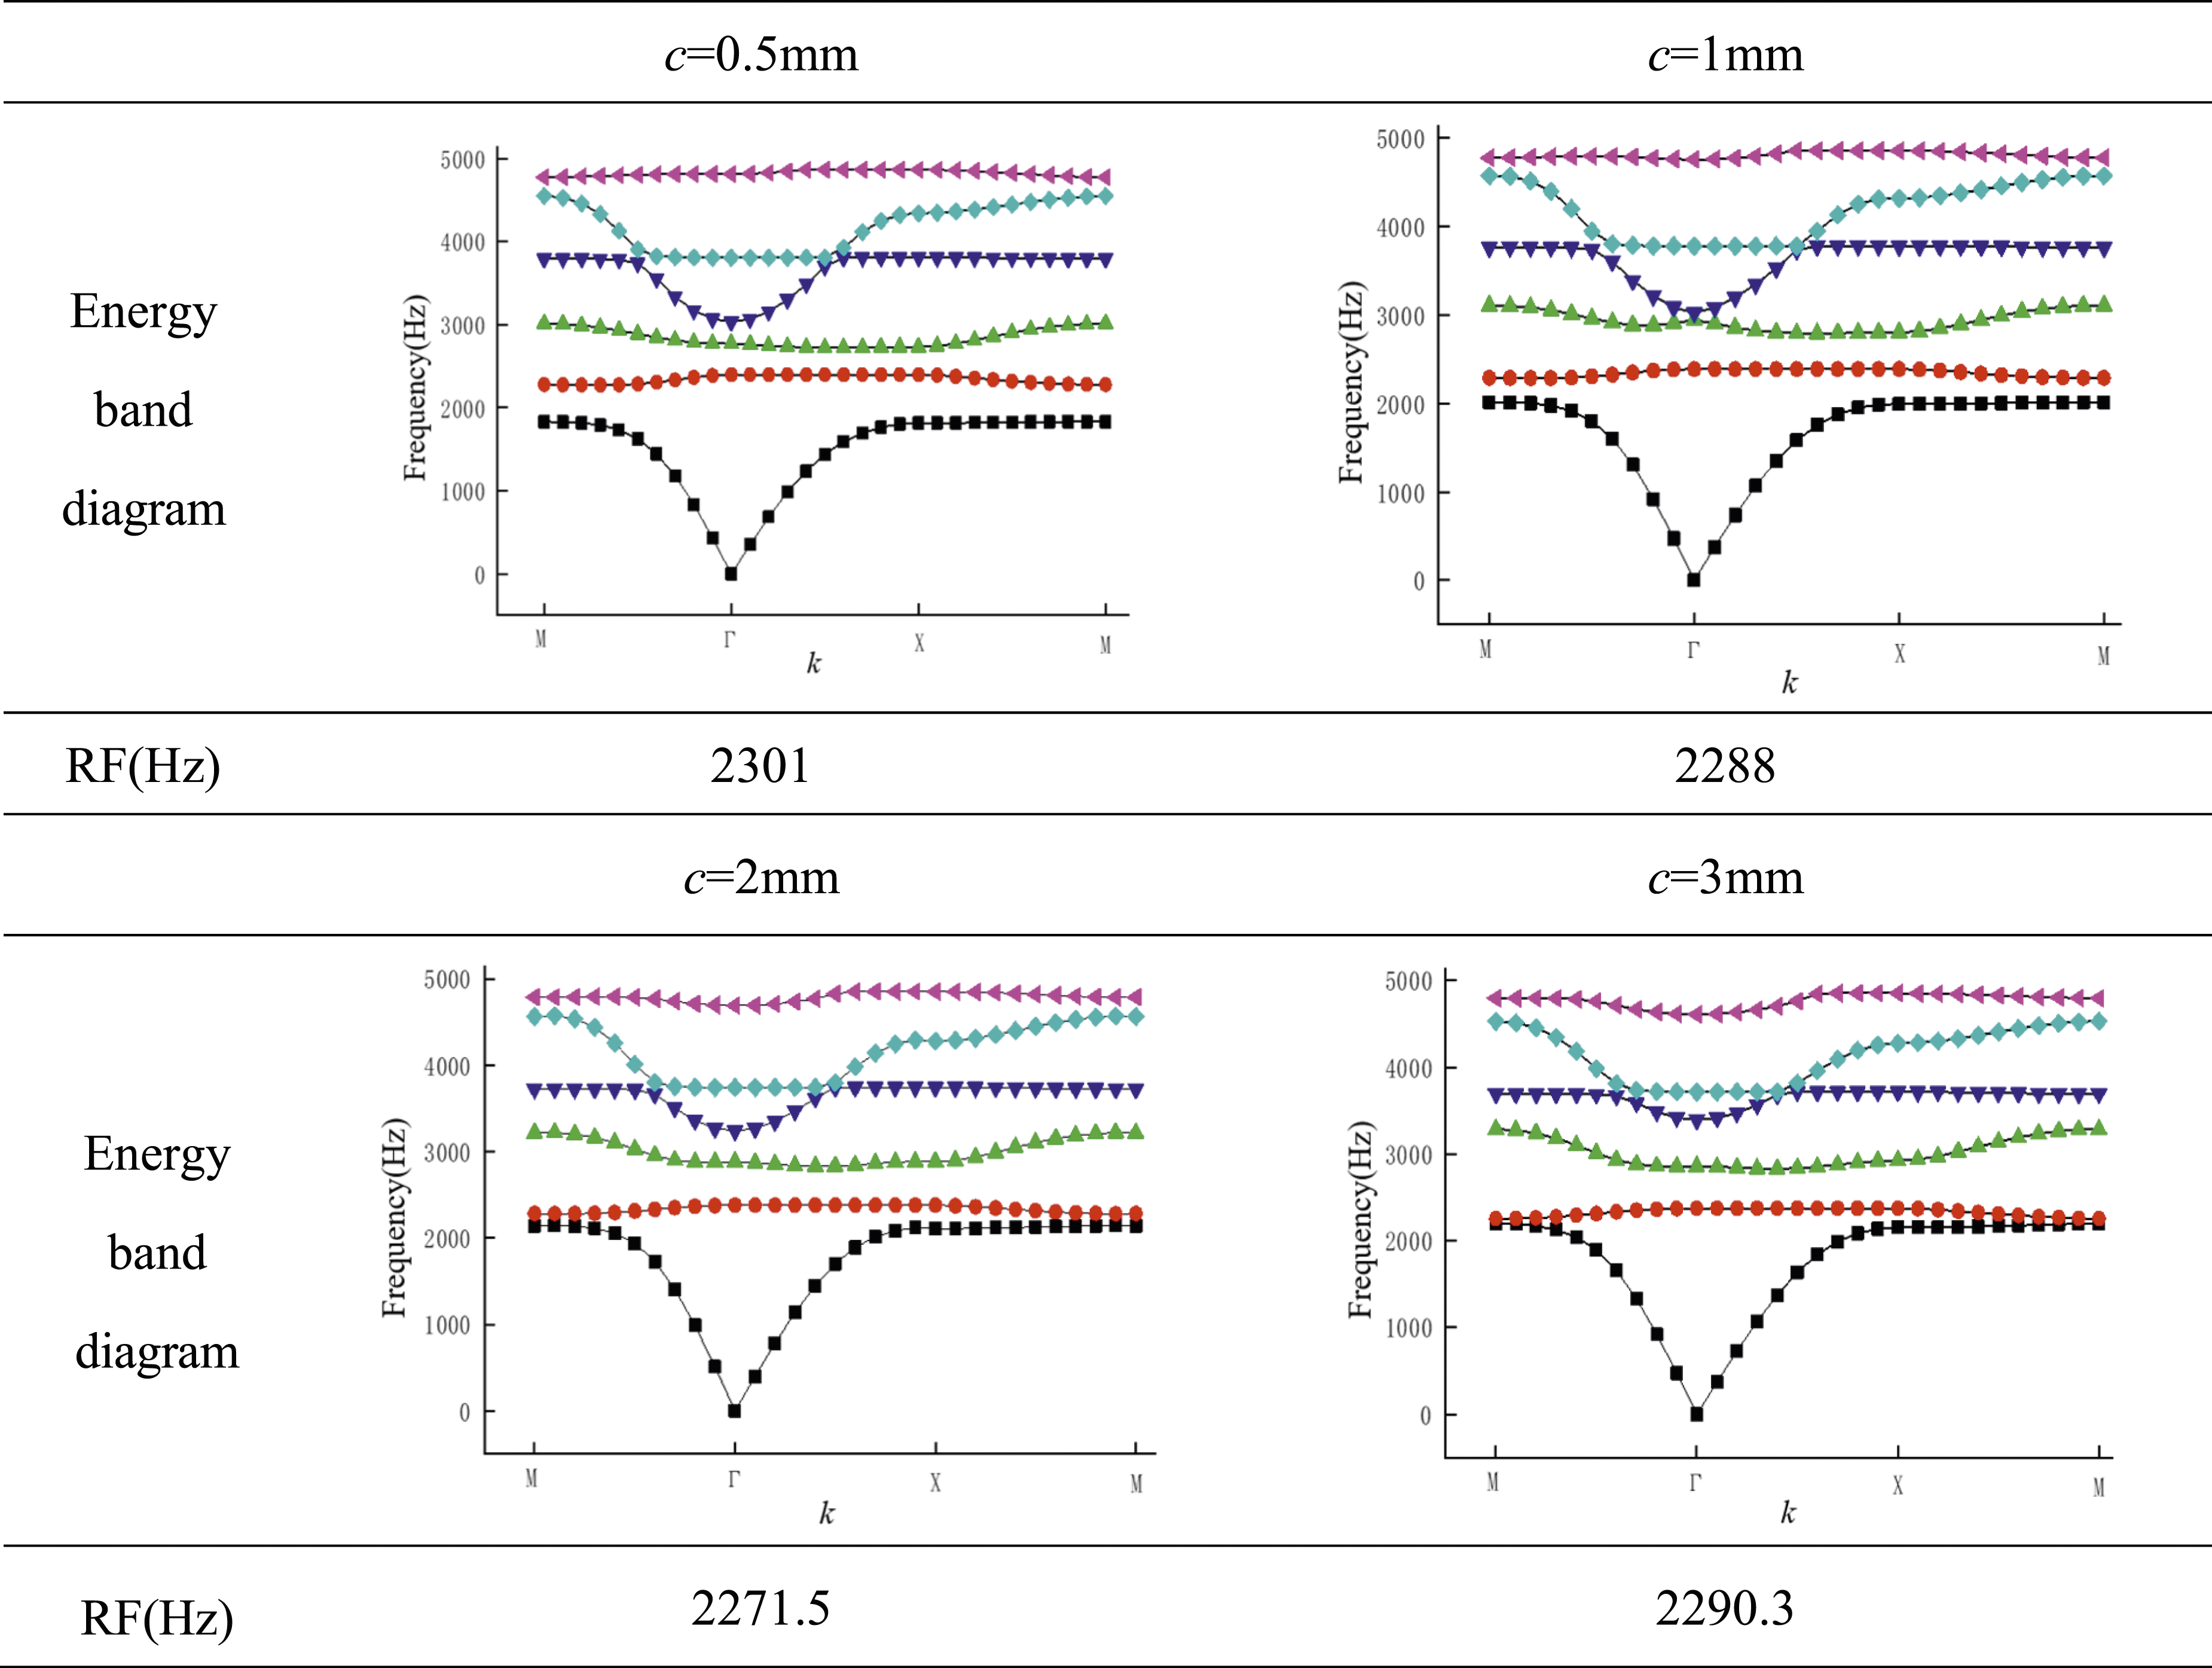
By comparing the bands of phonon crystals with different gap spacing, it can be seen that the bands of acoustic hyperbolic metamaterials appear between the first curve and the second curve. Compared with the band map of the acoustic hyperbolic metamaterial with the gap c = 0.5 mm, the band frequency of the acoustic metamaterial with the gap c = 1 mm, c = 1.5 mm, and c = 2 mm is lower. When the gap is 2 mm, the resonance frequency is the lowest compared with the other three working conditions, the top of the second band is flatter, and the symmetry near the point is better, which indicates that the acoustic metamaterials have more branches and longer propagation paths, so negative refraction will appear near this frequency. In the subsequent parameter discussion, the phonon crystal gap c of the acoustic hyperbolic metamaterial is taken as 2 mm.
Effect of inner wall structure arm length on energy band structure
The structural arm length d of the inner wall of the phonon crystal directly determines the transmission path and the transmission distance of the sound wave inside it. When discussing the influence of the structural arm length of the phononic crystal on the energy band structure, d is taken as 10.5 mm, 15.5 mm, 20.5 mm, and 21.5 mm, respectively. The energy band diagram and the sound pressure diagram are shown in Figure 7: Schematic diagram of single cell band structure.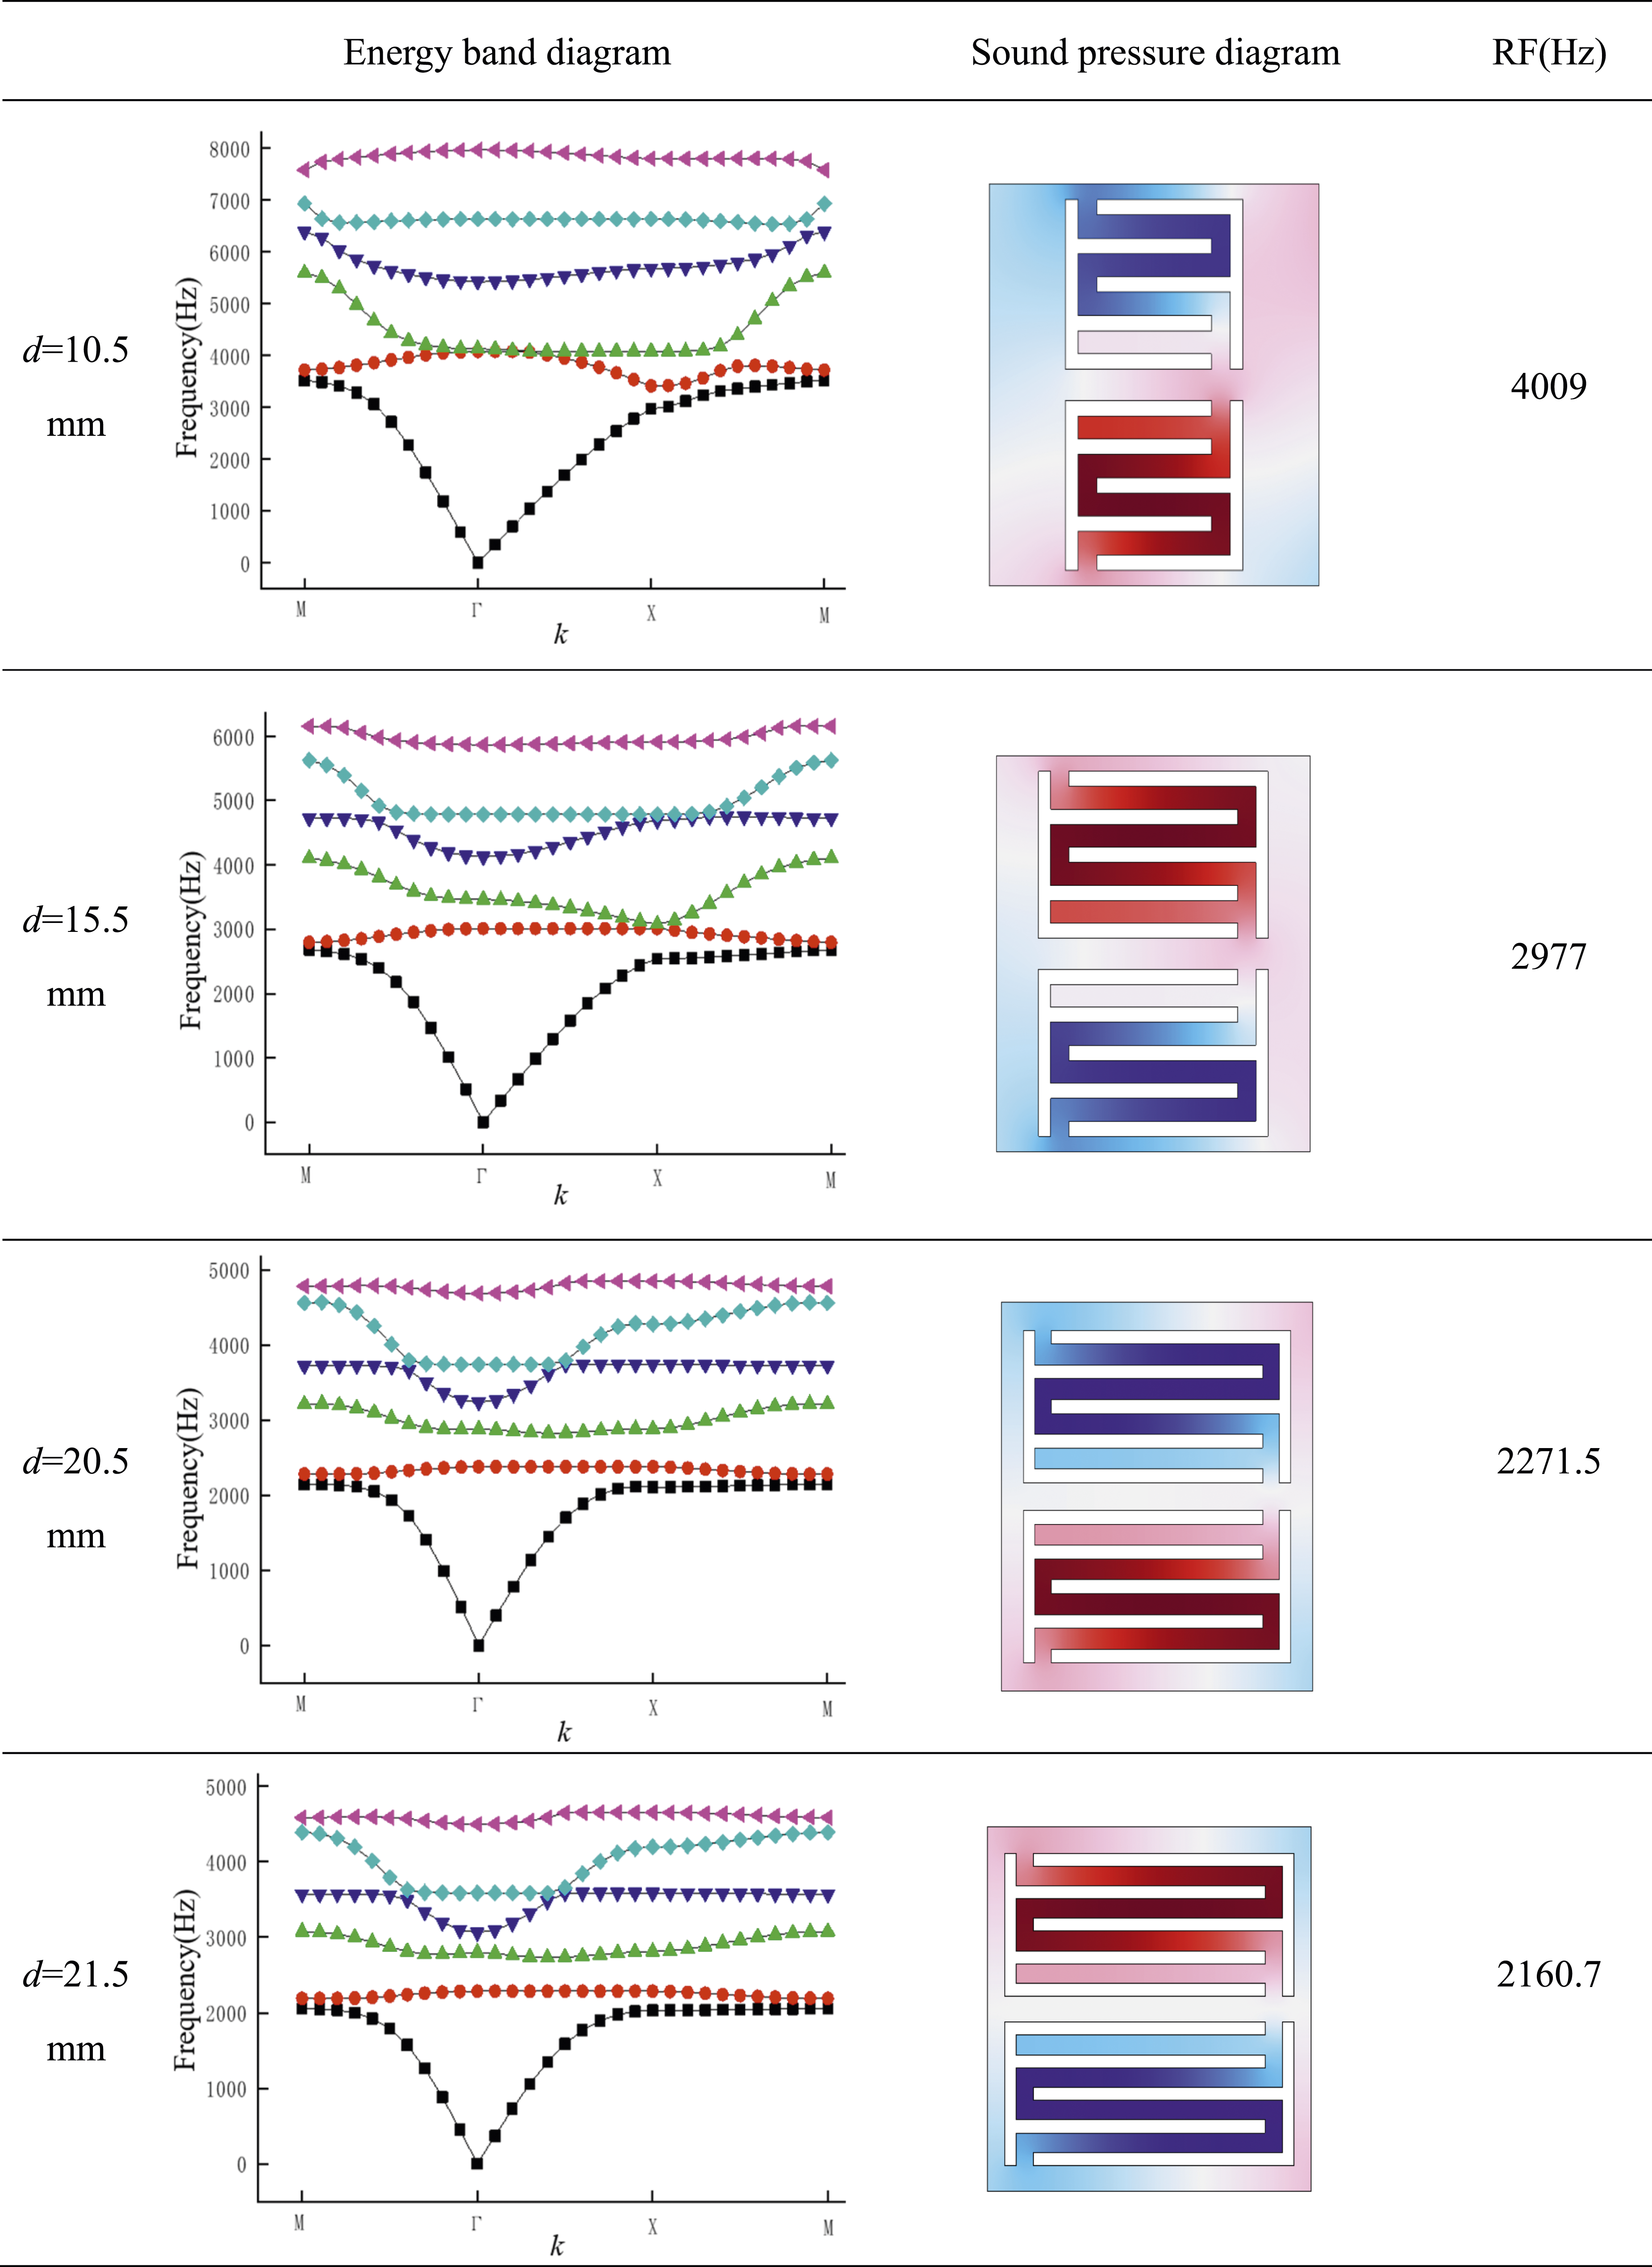
Combined with the band diagram and the sound pressure diagram, it can be seen that the length of the inner wall structure of the phonon crystal has a great influence on the band structure and the resonant sound pressure characteristic frequency of the structure. When the configuration d = 10.5 mm, the band gap of the structure disappears and the characteristic frequency is 4009 Hz. With the extension of the arm length of the structure, the transmission path of the sound wave increases. It can be seen from the sound pressure diagram that when the sound wave is transmitted inside the configuration and the sound wave control is realized.
The symmetry of the structure as a whole is best when d = 20.5 mm. Though the resonance frequency is not the lowest at this time, d = 20.5 mm is considered to be the best due to the considerations of the stability of the structure, 3D printing preparation consumables, and so on. From the energy band diagram, it can be seen that the band top of the second energy band is flatter and has better symmetry about the point near Γ, which indicates that the acoustic metamaterials will have negative refraction near this frequency. In the subsequent parameter discussion, d is taken as 20.5 mm.
Effect of gap width on energy band structure
The effect of the phonon crystal configuration on the band structure when the aperture width a is 1.5 mm, 2.5 mm, and 3 mm are studied. The energy band structure and vibration patterns are shown in Figure 8: Schematic diagram of the band structure of a cell.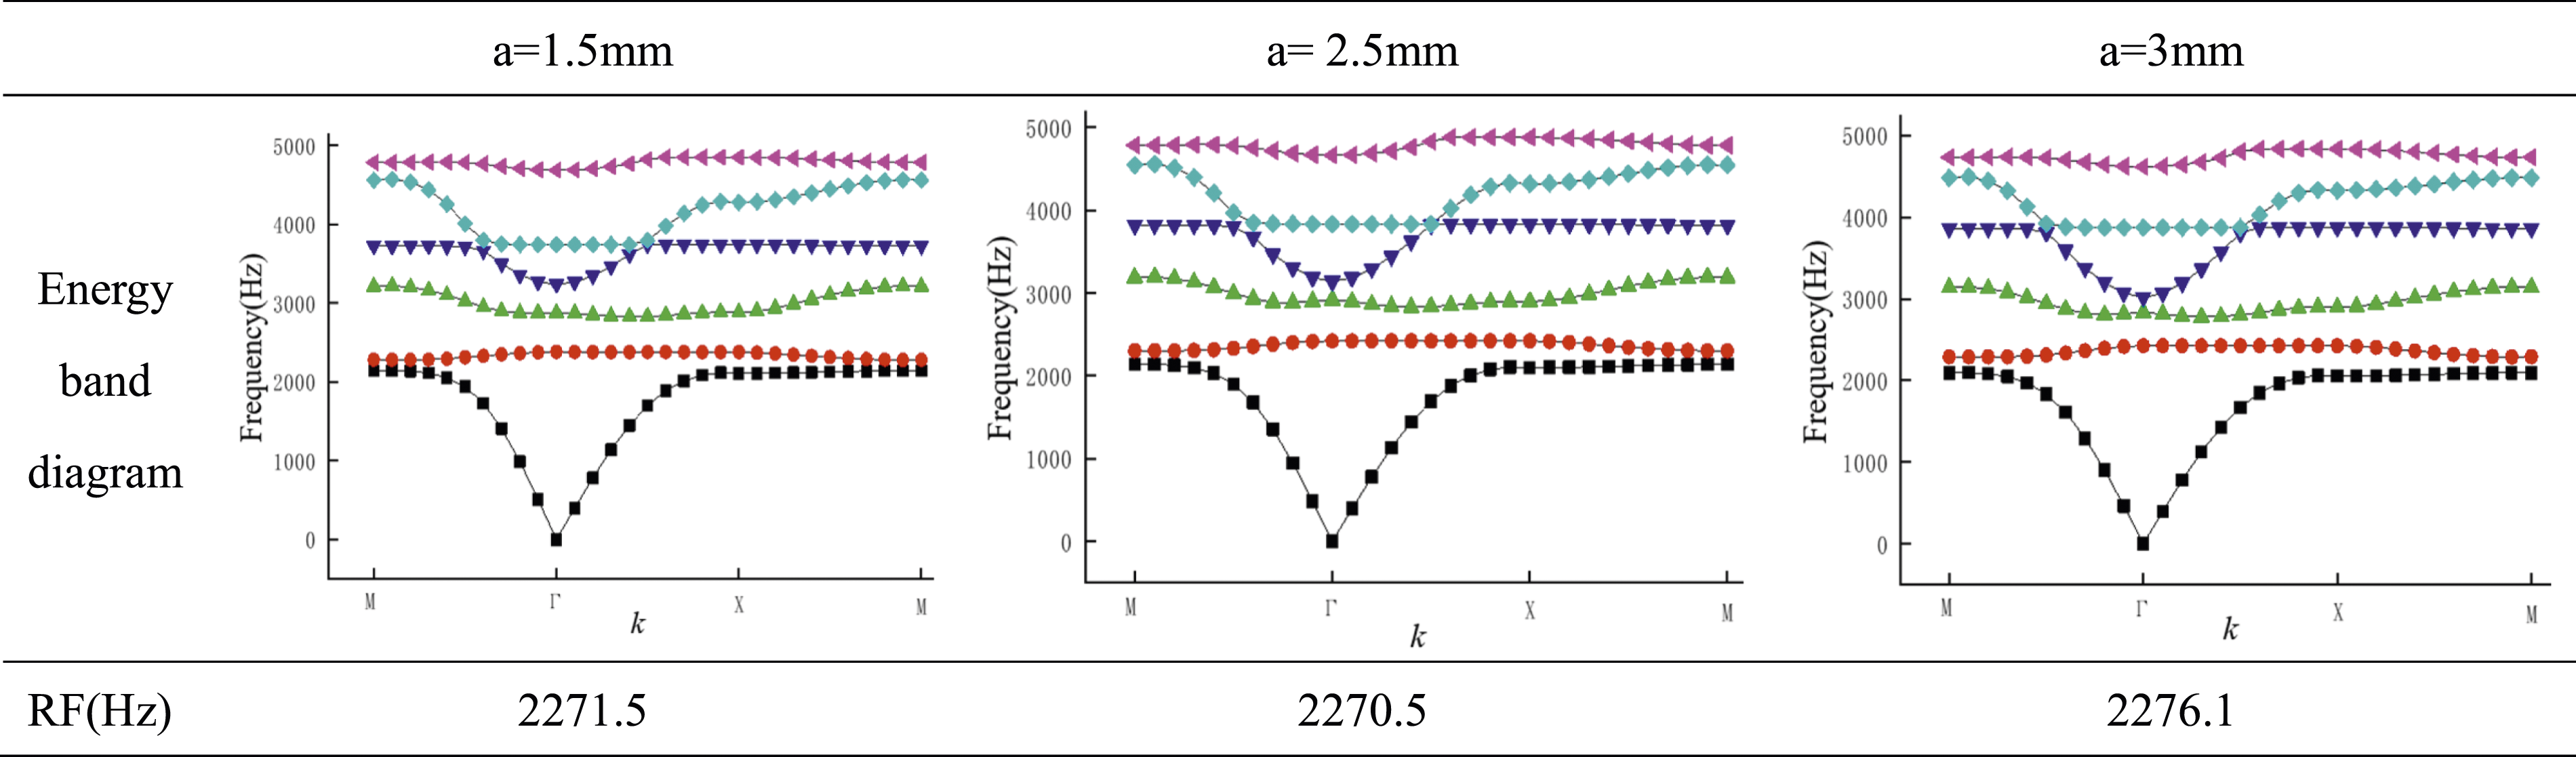
From the figure, it can be seen that the air gap width a has little effect on the resonance frequency and the trend of the second energy band. The effect of this parameter on the energy band structure of the phononic crystal can be neglected. And the air gap width is taken as 1.5 mm in the subsequent study.
After the simulation study of the structural parameters of the designed configuration on the energy band structure and resonance eigenfrequency, it can be learned that when the air gap c = 2 mm, the structural arm length of the inner wall of the phononic crystal d = 20.5 mm, and the width of the air gap a = 1.5 mm, the band top of the second energy band is relatively flat and the symmetry is better about the point Γ. The resonance frequency is 2271.5 Hz. The acoustic hyperbolic metamaterial configuration realizes a low-frequency focusing frequency of 2271.5 Hz, which provides an idea for the subsequent research on realizing the focusing imaging of acoustic waves in lower frequency bands.
Numerical simulation verification of negative refraction characteristic
According to the above study, it can be found that the refractive index is -1 when the excitation of the point source is 2271.5 Hz. 2271.5 Hz is the main frequency of interest for the configuration to realize the full-angle incidence. In order to complete the negative refraction verification, the pressure acoustics-frequency domain module of the finite element analysis software COMSOL Multiphysics is used for the numerical simulation. The designed hyperbolic phononic crystal is arranged as a triangular prism with two right-angled edges consisting of an array of 20 hyperbolic configurations for the subsequent analysis. The triangular prism edge size is 461 mm, as shown in Figure 9: Schematic diagram of a hyperbolic configuration prism.
In the finite element simulation, the triangle prism is placed in the free field and the perfect matching layer is used around it to create a good sound absorption effect and avoid echo interference. On the left side of the prism, the plane amplitude of the background pressure field with the medium as air is set to be 1 Pa. The right part of the triangular prism is set as the air domain. The physical field arrangement is shown in Figure 10. Schematic diagram of negative refraction verification.
The incidence direction of the plane wave is to the right along the left side of the prism. It can be seen that the acoustic wave is modulated by the triangular prism and negative refraction occurs. COMSOL Multiphysics frequency domain module calculates the sound field distribution as shown in Figure 11. When the computational domain conditions are the same, the plane wave propagates uniformly in the sound field when the triangular prism is removed. Schematic diagram of plane wave incident sound field of triangular prism.
It can be seen from the figure that the hyperbolic medium with a refractive index of -1 plays a regulatory role in the plane wave propagation. When the sound wave passes through the lens, the propagation direction of the sound wave is changed. After the incident sound wave is regulated by the hyperbolic medium, the refracted wave and the incident wave are located on the same side of the normal. It verifies the negative refraction property of the designed acoustic hyperbolic metamaterial, which indicates that the hyperbolic configuration designed in this paper can be used for the focusing of subsequent acoustic lenses.
Hyperbolic acoustic superlens focused imaging study
Imaging effects of hyperbolic acoustic superlens thicknesses
The thickness of the acoustic superlens determines whether the sound wave can image after passing through the lens. If the lens is too thin, it cannot reach the size required for the focus of the sound beam. If the lens is too thick, the incident sound wave will be focused several times in the lens, affecting the quantitative amplification of the acoustic parameters of the evanescent wave emitted by the sound source. Considering the feasibility of the experiment and the accuracy of the simulation, a single-point sound source is selected. The size of a single cell in hyperbolic metamaterial configuration is 24 mm and the thickness of a single cell is defined as a lens. The speed of sound c in the air is 343 m/s, so the wavelength of the sound wave is 151 mm. The lens thickness selection principle is between
The effect of hyperbolic hyperlens calculation on focusing and positioning is shown in Figure 12. The sound lines generated by the sound source at different incident angles will be focused at the same point behind the lens. Since the thickness of the 6-layer lens L is 139 mm and the distance of the point source from lens D is 100 mm, it can be inferred that if the thickness can be focused, the imaging point will be located at 44 mm behind the lens. Schematic diagram of acoustic focusing imaging system.
After simulation and calculation with the finite element software COMSOL Multiphysics, the normalized sound intensity distribution in the y direction at the theoretical imaging focus was extracted, as shown in Figure 13: Schematic diagram of focusing and positioning.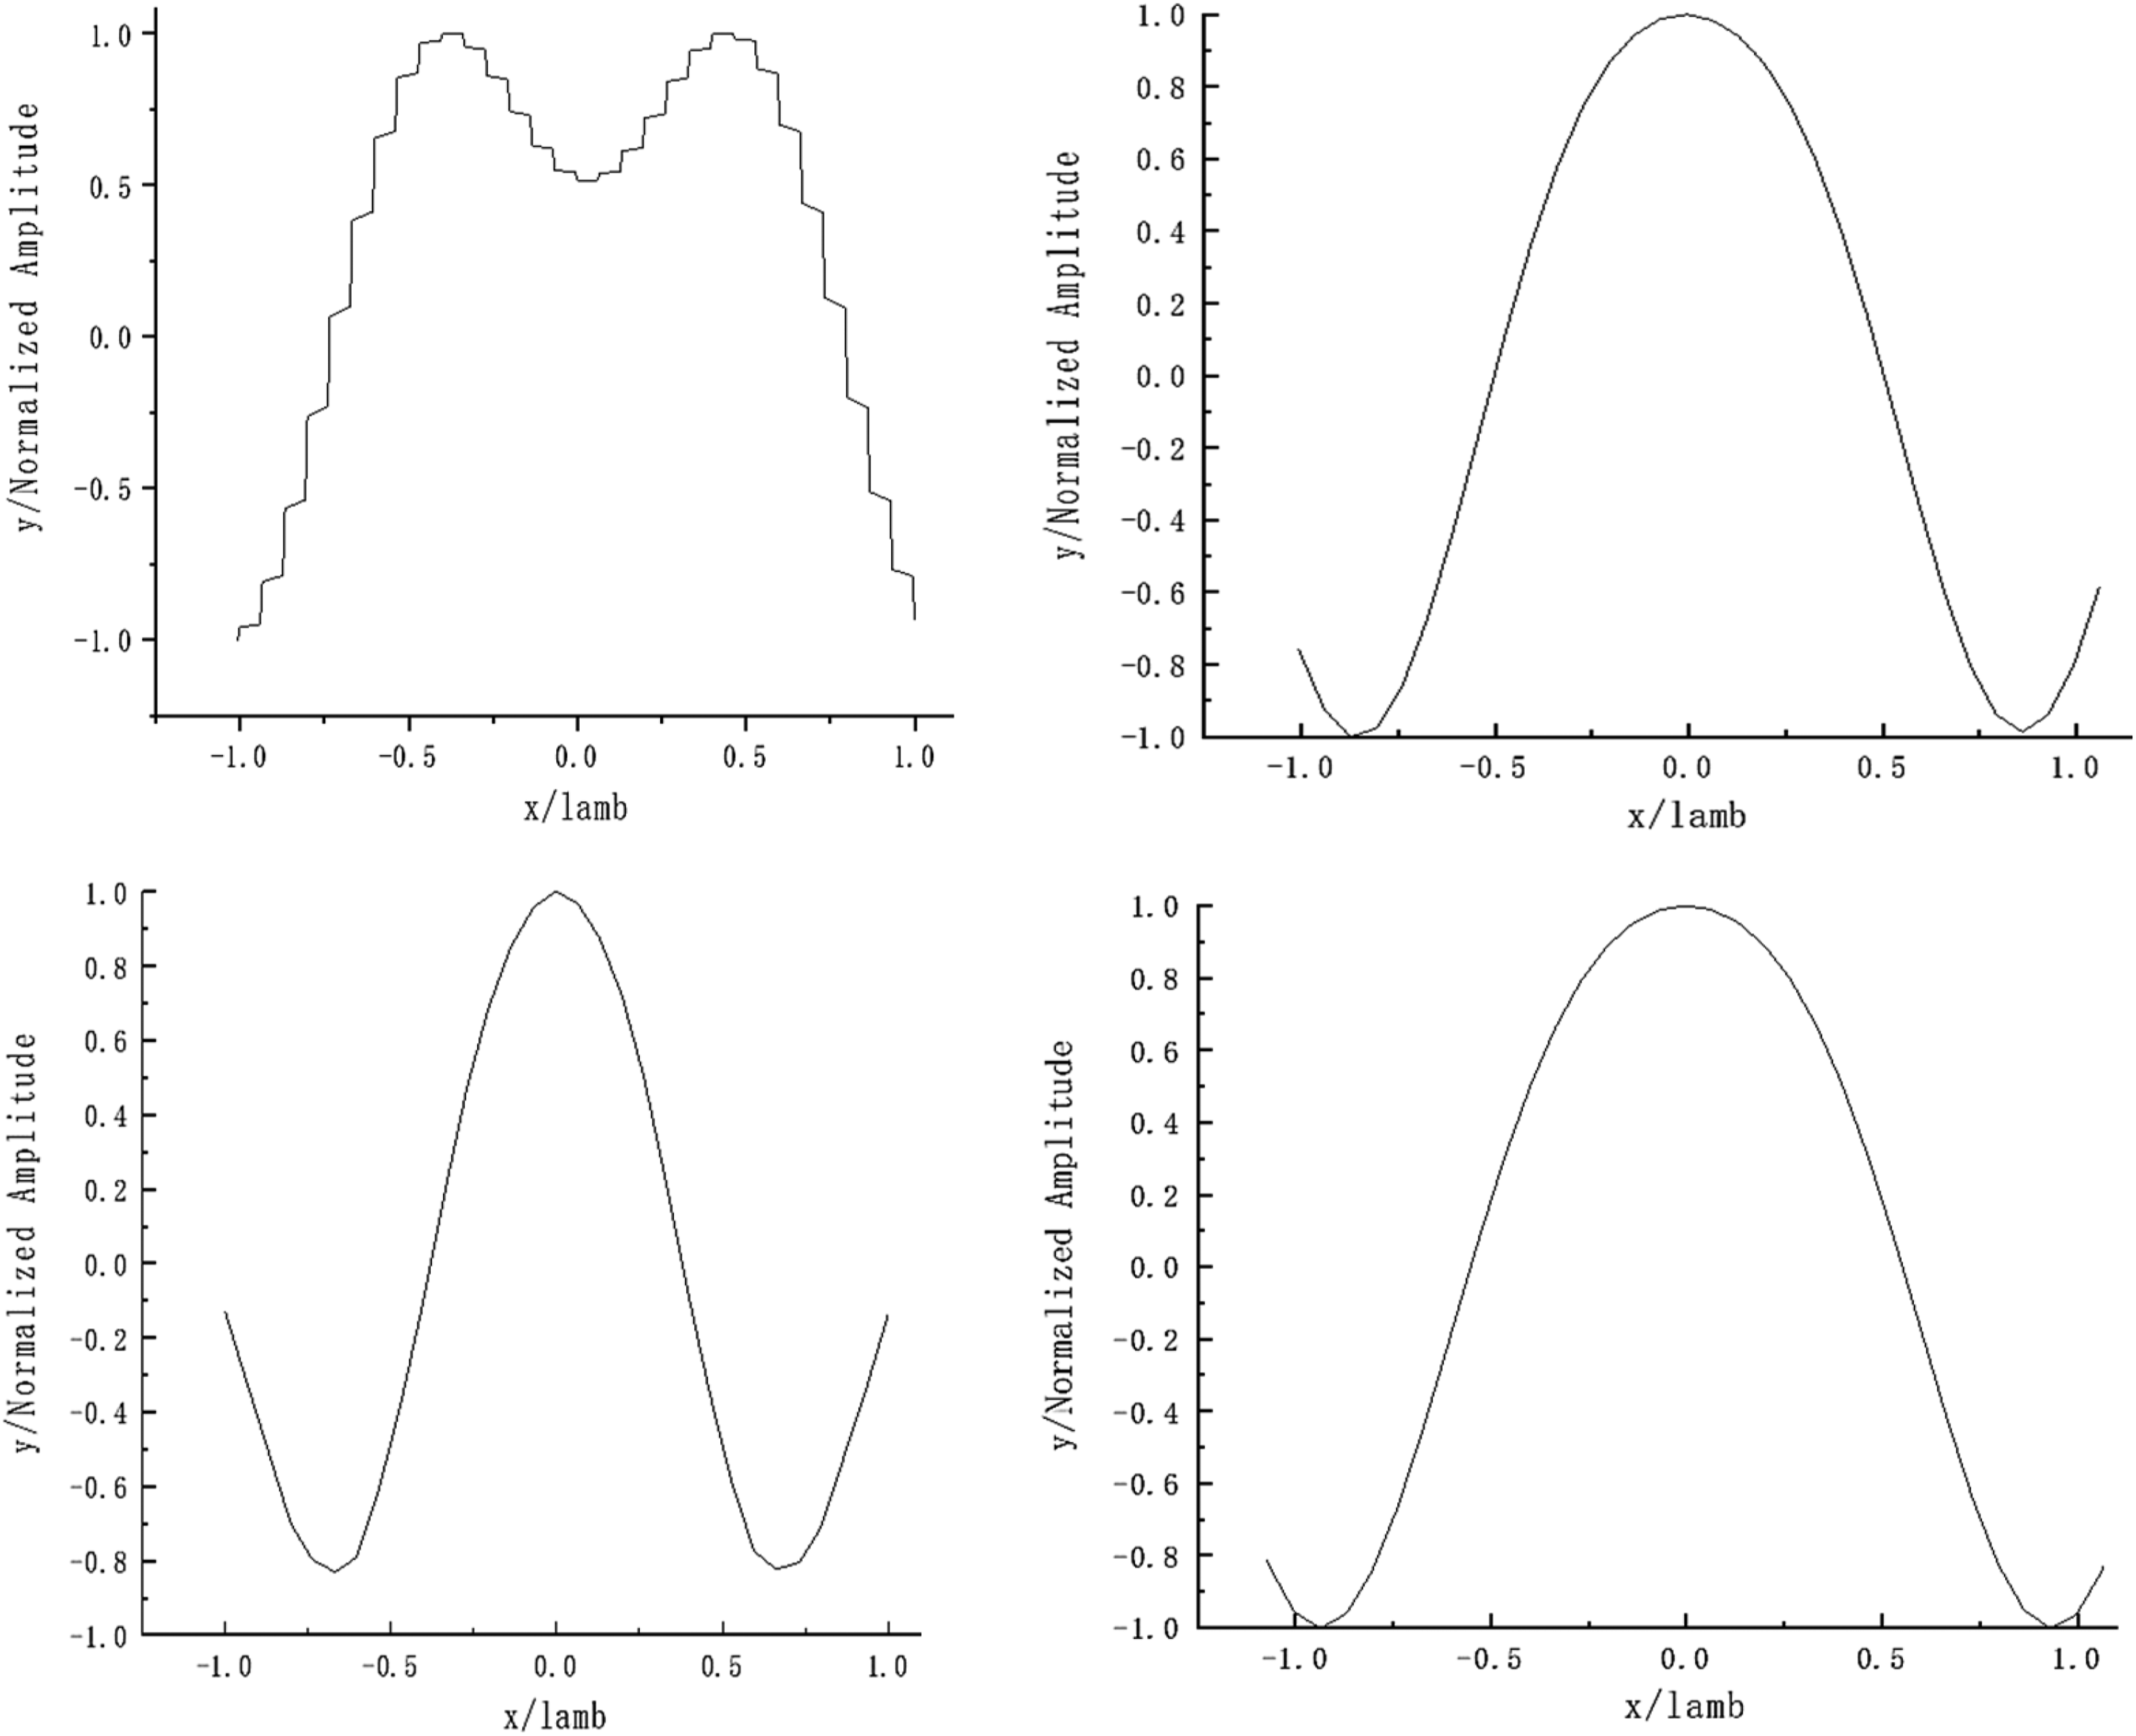
When sound waves propagate from free space to hyperbolic medium at a certain angle because the group velocity

If the thickness of the hyperbolic medium is too small, the refraction Angle will become very small or even close to zero, and negative refraction will not be observed.
Based on the acoustic hyperbolic lens in this paper, keeping the distance of the point sound source from the lens 100 mm unchanged, the focusing imaging effect of the six-layer lens, the seven-layer lens, the eight-layer lens and the nine-layer lens are investigated respectively. After simulation calculation, the thickness of the six-layer lens does not reach the standard of sound source focusing imaging and the focusing localization phenomenon does not occur. Although the seven-layer lens focuses the imaging after the lens, the focusing imaging resolution is 0.52
λ, which does not break through the diffraction limit of the sound source of 0.5 λ. The focusing imaging resolution of the eight-layer lens is 0.4 λ, which breaks through the diffraction limit of the sound source. The nine-layer lens has an identification resolution of 0.53 λ, which does not break through the diffraction limit of 0.50λ. After the above discussion, it can be seen that the eight-layer lens is the best thickness to realize far-field super-resolution imaging.
In this study, the target frequency is 2271.5 Hz, the lattice constant is 26 mm, the working environment is air, and the sound speed is 343 m/s. The propagation wavelength of the sound wave in this configuration is 151 mm by combining the relationship between the wavelength, frequency and sound speed of the sound wave. According to Formula (5), if the lens is too thick or too thin, it will affect the refraction Angle and affect the focusing imaging effect. The optimal lens imaging size should be between one and two times the wavelength, and the thickness of the eight-layer lens is 185 mm, which conforms to the expectation of theoretical derivation.
Impact of point source to superlens distance on imaging
The previous discussion identified the 8-layer lens thickness of 185 mm as the optimum parameter. At a point source operating frequency of 2271.5 Hz, the wavelength of sound waves in air is 151 mm. The evanescent wave only exists in the near field of one wavelength. If it is in the far field of more than one wavelength, the evanescent wave will decay exponentially rapidly. So the distance between the point source and the superlens is discussed to be within one wavelength. However, under the action of the superlens designed in this paper, the sound wave is radiated to the far field and the evanescent wave is captured in the far field so that the far-field sub-wavelength super-resolution imaging is realized.
The doubled wavelength is divided into 0.1 λ, 0.2 λ, 0.3 λ, 0.4 λ, 0.5 λ, 0.6 λ, 0.7 λ, 0.8 λ, 0.9 λ, λ. The discussion of the focusing imaging resolution is developed under 10 point source distance lens conditions.
It is calculated that when the thickness of the hyperlens is 185 mm eight-layer lens, the distance between the point sound source and the hyperlens is less than 0.9λ. Sub-wavelength super-resolution imaging can be achieved. When the distance between the point source and the lens is maintained at 0.2λ to 0.7λ, the imaging resolution is about 0.27λ. The resolution breaks the diffraction limit of the sound source and the focusing imaging effect is very good. When the distance between the point source and the lens is maintained at 0.8λ to 0.9λ, the resolution is 0.35λ, which is slightly worse than the resolution of 0.27λ. But it is still possible to break the diffraction limit of the sound source. There is no focusing imaging effect at the distance between the point sound source and the superlens is λ. The reason is that the evanescent wave begins to decay beyond one wavelength (including one wavelength) and the acoustic hyperbolic lens does not work.
By using the finite element software COMSOLMultiphysics simulation calculation, it is found that the hyperbolic configuration designed in this paper has an excellent imaging effect. Then additive preparation was carried out by 3D printing technology and the focusing imaging effect of hyperbolic acoustic hyperlens was verified by experiments.
Experimental validation of acoustic superlens-focused imaging
Experimental program
In order to verify the accuracy of the theoretical formula analysis and simulation calculation, the experimental materials were selected and the experimental program was developed according to the parameter settings and boundary conditions of the simulation calculation. The sample 3D printed using photosensitive resin is shown in Figure 14: Sample and experimental layout.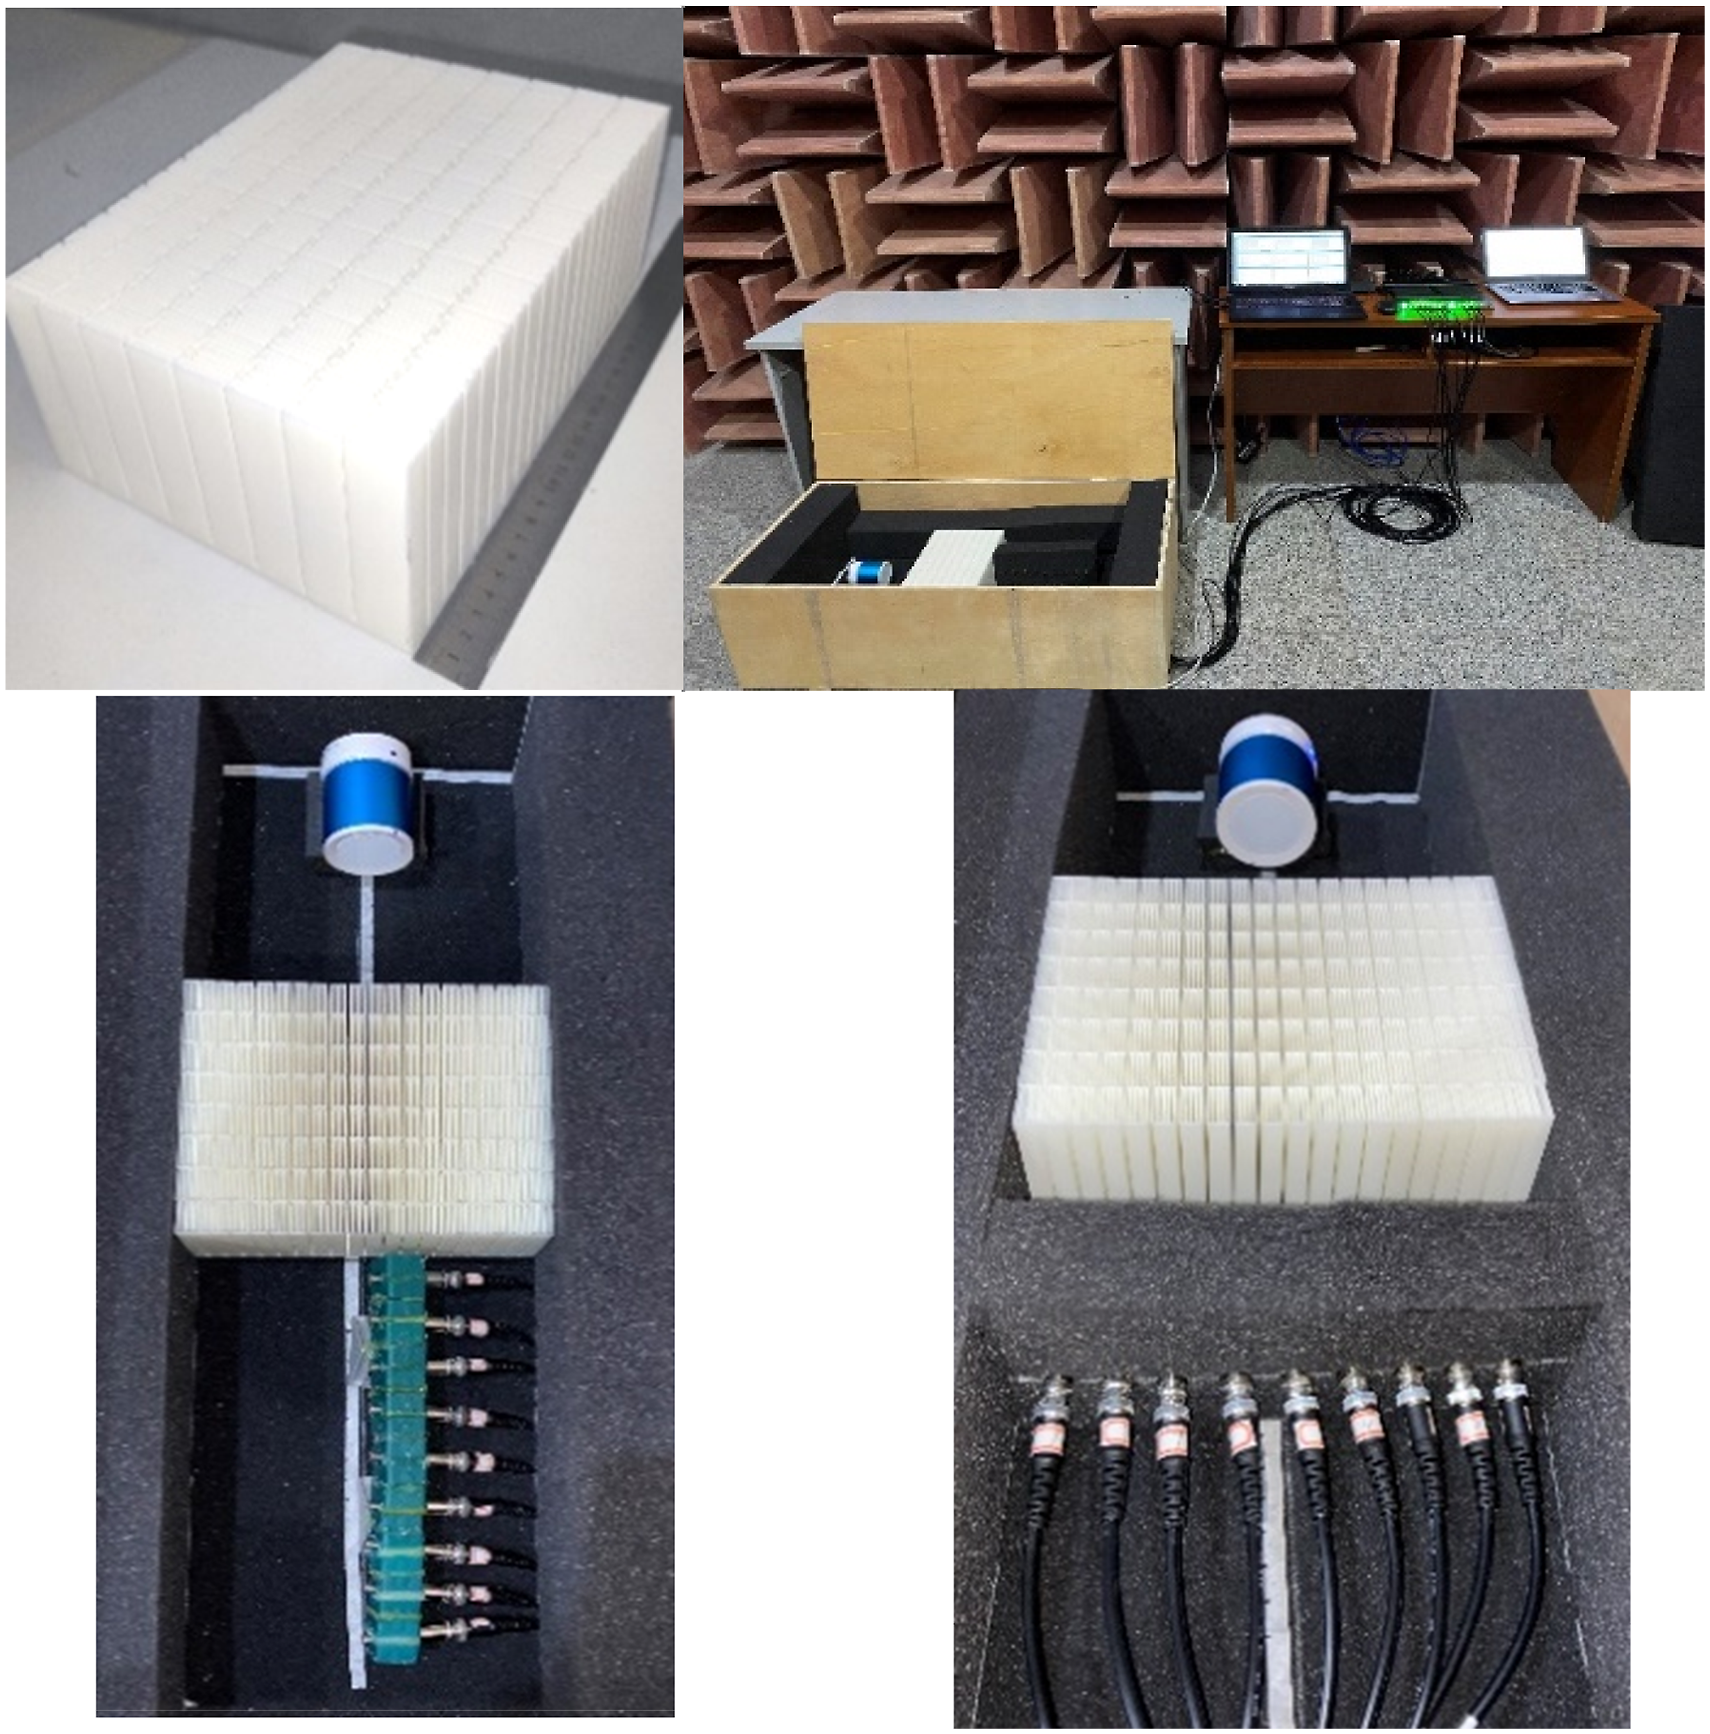
In order to avoid the influence of echo generated by the wall of the room and other objects, the experimental verification of hyperbolic lens focusing imaging is carried out in the semi-anechoic chamber. Due to the small size of the component and the large space size of the semi-anechoic chamber, a simple anechoic box is designed. And the sound absorption boundary is realized with a 10 cm thick sound absorption sponge. According to the frequency emitted by the point sound source is 2271.5 Hz, the sound absorption coefficient of the sponge should be comprehensively considered in the selection of the sound absorption sponge. The sound absorption coefficient of the sponge in this experiment was measured experimentally as shown in Figure 15. The sound absorption effect reached 91.2% at the working frequency, meeting the experimental requirements. Schematic diagram of sound absorption coefficient of sponge.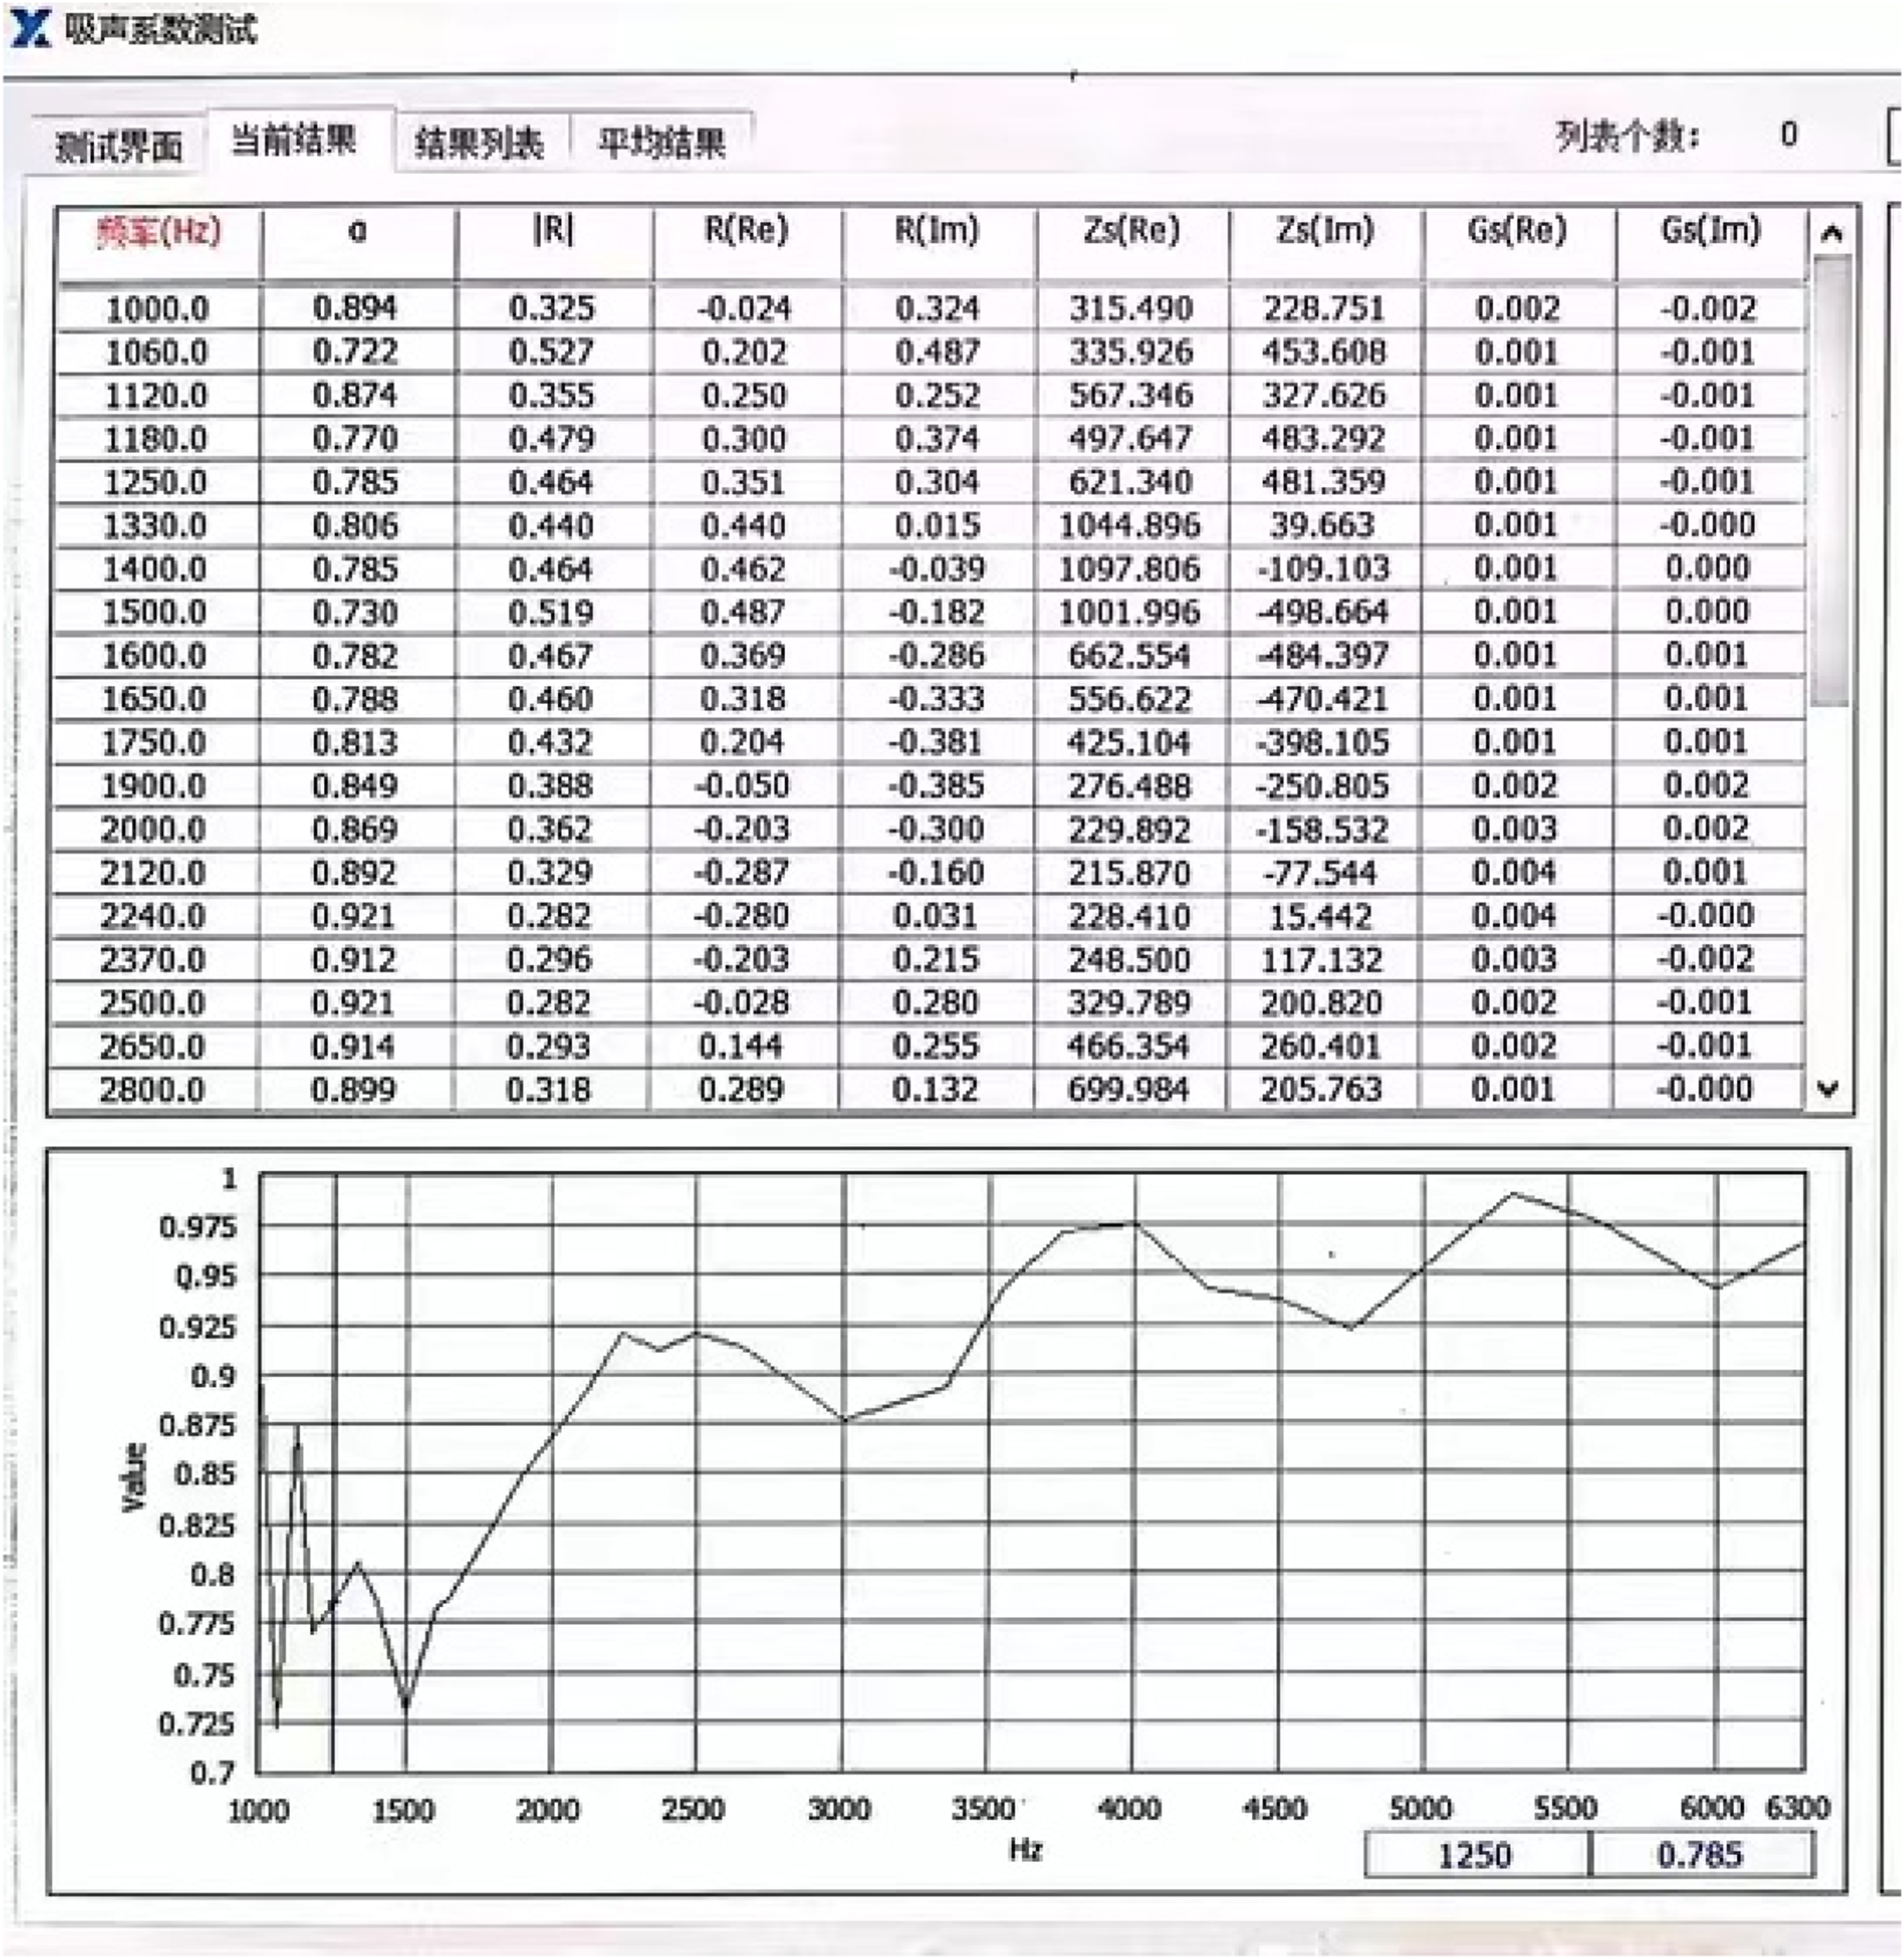
The point source sounding was programmed by MATLAB to produce the sounding code. The sinusoidal sound source excitation of 2271.5 Hz was realized by Bluetooth audio. The main experimental apparatus includes a PCB microphone (130E20); B&K distributed data acquisition module (3050-A-06); sound source (Kunodi A3); and PULSE acoustic analysis software.
The experimental process is as follows: the sound source is arranged on the left side of the anechoic box, the microphone array is arranged on the right side, the hyperbolic superlens model is placed in the center and the sponge is used around to simulate the sound absorption boundary. During the experiment, the point sound source continues to sound for 10 s, and the microphone is connected to the distributed data acquisition module through the BNC wire. After receiving the signal, the data acquisition module transmits it to the computer through the network cable. The PULSE acoustic analysis software in the computer processes analyzes the measured signal and saves the test data after the measurement results of the microphone are stable.
The position of the point sound source is moved back and forth. And 9 microphone arrays are arranged horizontally on the right side of the superlens to verify whether the image point position is the difference between the lens thickness and the point source position. The focus position is determined by observing the corresponding sound pressure of 9 microphones. On the basis of determining the focus position, the sound intensity distribution along the y direction is also scanned by 9 microphones array. The experimental data are post-processed and compared with the simulation data. The experimental arrangement is shown in Figure 14. The experimental arrangement of focal point of point sound source is determined and the distribution diagram of sound intensity at the focal point is shown in Figure 14.
Comparison of simulation and experimental data
The comparison between the recognition resolution of hyperbolic acoustic hyperlens calculated by COMSOL Multiphysics and the recognition resolution measured by experiments under various working conditions is shown in Figure 16: Comparison of resolution of experimental and simulation sound sources.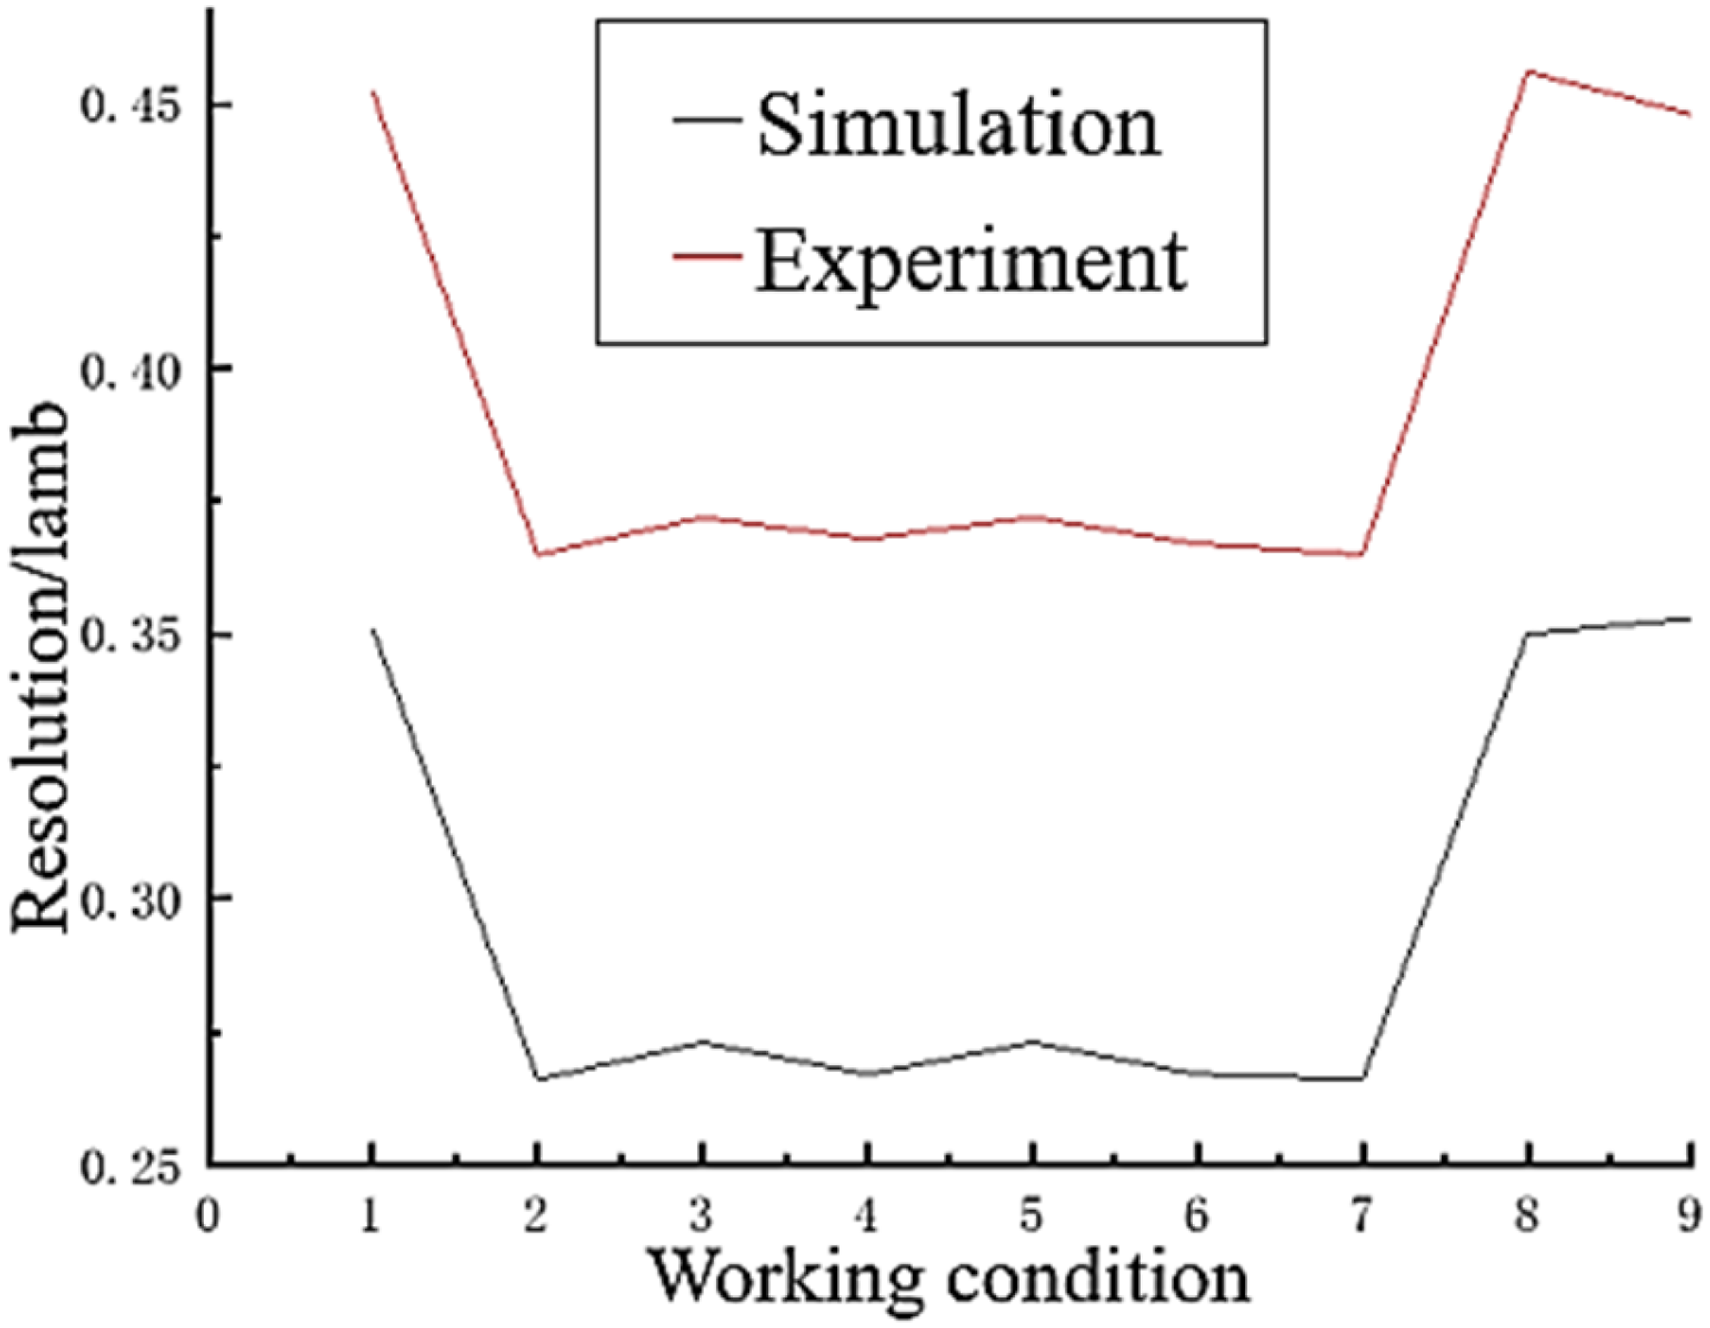
As can be seen from the figure, when the point sound source is 0.1λ away from the lens, the sound source identification resolution is 0.452λ, which breaks the acoustic diffraction limit but has a lower resolution than other working conditions. When the distance of the sound source from the lens is 0.1λ in the finite element calculation, the imaging is focused at 169 mm behind the lens. The reason for the low resolution of the analysis experiment is that when the experiment is arranged, microphone No. 6 is 187 mm away from the lens, and microphone No. 5 is 154 mm away from the lens, so the actual focus of the point sound source should be between the microphone No. 5 and 6. When the point sound source is 0.3λ away from the lens, the sound source identification resolution is 0.372λ and the image is focused at the No. 4 microphone (120 mm away from the lens). The image is focused at 140 mm during the finite element calculation and the recognition resolution is 0.273λ. The resolution decreases by 36.26%. The actual focusing position should be between the No. 4 and No. 5 microphone. For the same reason, the actual focusing position should be between No. 3 and No. 4 microphones when the sound source distance is 0.5λ from the lens. When the point source is 0.7λ away from the lens, the actual focus position should be between No 2 and No 3. Because the microphone is fixed and arranged, the spacing distance is determined by the size of the microphone. It is also the root cause of experimental error.
The error generated by the experiment is unavoidable. But it is proved through the experiment that the acoustic superlens designed in this paper is indeed able to realize far-field super-resolution imaging and can break through the acoustic diffraction limit of 0.5λ. The configuration designed in this paper is of practical value.
Sound source localization based on the phase conjugate method
Phase conjugation resolution of different working conditions.

The sound pressure signals radiated from the acoustic superlens to the far-field forward propagation under nine working conditions were captured and analyzed by the line array. The sound pressure P 1 and P 2 at positions 0.3λ and 0.3λ+10 mm away from the virtual source were measured in the experiment and the sound pressure gradient was calculated. Based on the PCD method, the resolution of the sound source location is calculated. It is found that the recognition resolution breaks through the acoustic diffraction limit of 0.5λ under nine working conditions, which fully meets the engineering accuracy.
Conclusion
Aiming at the problem of far-field noise source identification limited by the Rayleigh diffraction resolution of 0.5 λ, combined with the excellent modulation effect of acoustic metamaterials on acoustic waves, this paper introduces hyperbolic metamaterials, which can be a powerful tool to realize sub-wavelength super-resolution imaging, and utilizes its negative refractive property to design an acoustic focusing lens with an operating frequency of 2271.5 Hz. By analyzing the hyperbolic dispersion properties of the configuration proposed in this paper, it can be seen that the configuration has the property of negative refraction and the negative refraction simulation verification was completed by finite element analysis software. Combined with 3D printing, the acoustic superlens are prepared. It is experimentally verified that the hyperbolic acoustic superlens in this paper can realize far-field super-resolution imaging, effectively amplify the propagation information of abrupt waves and break through the Rayleigh diffraction limit in the identification of acoustic sources in the mid-range and far-field by combining with phase conjugation method. It confirms that the configuration designed in this paper has a high engineering practical value and good application prospect in the field of noise source identification and localization, which provides a way to realize the focus of other acoustic metamaterials.
Footnotes
Declaration of conflicting interests
The author(s) declared no potential conflicts of interest with respect to the research, authorship, and/or publication of this article.
Funding
The author(s) disclosed receipt of the following financial support for the research, authorship, and/or publication of this article: This work was supported by Project of the National Natural Science Foundation of China: Research on the Separation and Identification of Multi target Noise Sources in Complex Sound Fields Based on Phase Conjugation Method (No. 51609037); Basic Research Business Fee Project of Dalian University of Technology: Research on Location and Imaging of Ship Radiated Noise Sources in Complex Marine Environment (No: DUT22GF206).