
Abstract
This article presents an efficient method for analyzing the dynamic reliability of maglev vehicle-bridge coupled systems by combining a theoretical model with an adaptive surrogate model and the probability density evolution method (PDEM). First, a refined theoretical model of a maglev vehicle-bridge coupling system is established. Next, an adaptive surrogate model of the equivalent extreme value of the system dynamic response is established by combining an adaptive sampling method with radial basis functions. Finally, the adaptive surrogate model and PDEM are combined to further improve the efficiency of the dynamic reliability analysis. In the numerical example, the theoretical model of the maglev vehicle-guideway system was first validated by comparing with the measured data from the Shanghai high-speed maglev line. Then, by treating the controller parameters as normally distributed random variables, the accuracy and efficiency of the proposed reliability method were verified through comparison with the Monte Carlo method and the one-stage sampling surrogate model. Additionally, the impact of the randomness of each controller parameter and the coefficient of variation of the controller parameters on the system’s dynamic reliability was discussed.
Keywords
Introduction
As an innovative mode of transportation, maglev systems have attracted attention from researchers in the area of diversified rail transit due to their advantages, such as high-speed, small turning radius, little mechanical wear, safety, and ease of maintenance.1,2 Many countries in the world, including Japan, South Korea, and China, have built their own commercial maglev lines.3–5 The world’s first and only high-speed commercial maglev line is located in Shanghai, China, and has a maximum operating speed of 430 km/h. 6 To further improve the operating speed of maglev trains, China has launched the development of a high-speed maglev transport system with a speed of 600 km/h. Maglev trains have broad prospects for future applications all over the world. 1
Due to various factors, the dynamic response of a maglev vehicle-bridge system exhibits significant randomness, meaning that reliability methods need to be used to accurately evaluate the dynamic performance of the system.7–9 Several analysis methods have been developed for the dynamic reliability of vehicle-bridge coupled systems, including the (improved) Monte Carlo method (MCM),10,11 the pseudo-excitation method,12,13 the probability density evolution method (PDEM),14–17 and the explicit time-domain method. 18 PDEM, based on the conservation of probability, has advantages such as clear mathematical principles, high efficiency, and wide applicability, meaning that it has good potential for use in this study. However, it is worth noting that due to the complexity of the vehicle-bridge system, obtaining calculation results that meet the accuracy requirements usually requires 300–600 sets of samples, 19 and the greater the number of random variables involved, the larger the sample size needs to be.
In recent years, with the development of computational science, surrogate modeling methods such as the Kriging model, radial basis function (RBF), Gaussian process regression (GPR), and artificial neural network (ANN) have been applied to improve the efficiency of structural dynamic reliability analysis.20–22 When constructing a surrogate model, the sampling method has a significant impact on the accuracy. 23 Sampling methods can be divided into two types: one-stage and adaptive methods. The one-stage sampling method determines the number and location of all sample points before establishing a surrogate model. Xiang et al. 24 proposed an ensemble method based on the nonlinear autoregressive with exogenous input (NARX) surrogate model and the subset simulation with splitting (SS/S) method, and verified its effectiveness in predicting the vertical dynamic response of vehicle-bridge systems. Li et al. 25 presented an approach to analyzing the random vibration of bridges under a coupled vehicular load using Bayesian deep learning. Zhang et al. 26 proposed an efficient method based on NARX-ANN to predict the nonlinear wheel-rail force of trains on bridges caused by track irregularity. Aloisio et al. 27 verified the effectiveness of the surrogate model in predicting the dynamic response of a vehicle-bridge system under braking conditions by comparing it with a physics-based model and experimental data. The studies described above24–27 used the one-stage sampling method to construct surrogate models. Although this approach can minimize the deviation of the sample point set, it cannot reasonably allocate the position of the sample points based on the objective function, resulting in duplicate sample information and low utilization of the training set. In addition, this type of sampling method cannot determine the appropriate number of training samples in advance. 23 In contrast, an adaptive sampling method first considers a small number of initial sample points to construct a rough surrogate model, and then uses the rough model and a criterion function to select new sample points from the candidate sample set, which are added to the training set to update the surrogate model. This process is repeated until the surrogate model meets the accuracy requirements. 28 Although researchers have demonstrated in previous studies that the adaptive surrogate model (ASM) can effectively improve the efficiency of railway vehicle-bridge random analysis, 29 the effectiveness of this method still needs to be verified for maglev vehicle-bridge systems.
In general, maglev trains can be divided into three categories: electrodynamic suspension (EDS), electromagnetic suspension (EMS), and high-temperature superconducting (HTS) levitation.
30
Of these, EMS trains are currently the most widely used. The suspension system of an EMS train is an inherently unstable open-loop system, which requires a controller to maintain the suspension clearance within the allowable range.
31
Research and practice show that the controller parameters have an important influence on the formation of vehicle-guideway coupling vibration
2
; unsuitable controller parameters may result in poor passenger comfort, poor running stability and high noise levels. Li et al.
32
established a single-electromagnet proportional-derivative (PD) controller-flexible bridge coupled vibration model and analyzed the effects of the controller parameters and the delay of the signals on the self-excited vibrations of the system. In order to study the influence of track short wave length irregularity on low-speed maglev train, a vehicle model including a PD controller and five independent bogies was simulated by Yu et al.
33
Their results showed that a reasonable adjustment to the PD controller parameters was beneficial in terms of gap fluctuation at the optimal wavelength. Wang et al.
34
established a maglev vehicle with five suspension frames and studied the effect of the inner loop current gain coefficient P on the static stability. Xu et al.
35
proposed a model that can be used to analyze the dynamic behaviors of high-speed maglev trains on curved viaducts. To investigate the influence of control loop faults on the dynamic responses of the vehicle and guideway, Guo et al.
3
and Xiang et al.
4
established a spatially coupled vibration model that includes a three-dimensional (3D) maglev train, a guideway bridge, and a PD controller. Zeng et al.
36
studied the influence of controller parameters on the vibration of the vehicle-bridge coupled system and found that mismatch between the rail parameters and the controller parameters can lead to severe system vibrations. Taking into account the delay in the control system, Feng et al.
37
analyzed the effects of running speed and control parameters on the vibration of the maglev vehicle-guideway system. Based on the Hopf bifurcation criterion, Sun et al.
2
investigated the influence of the proportional-integral-derivative (PID) controller parameters
Several advanced controllers have also been proposed, such as a fuzzy controller 38 and an intelligent controller39,40, which can adjust the controller parameters in real time to achieve optimal control effect. However, it is important to note that the studies discussed above2,4,32–40 focused on control algorithms or parameter analysis. Currently, few scholars have investigated the impact of the randomness and combinations of controller parameters on the system’s dynamic response. Given that controller parameters are typically determined based on experience, it is crucial to examine the influence of these parameters on the system’s dynamic response from the perspective of random vibration analysis.
In this study, we propose an efficient method for the dynamic reliability analysis of a high-speed maglev vehicle-bridge system. This method combines a theoretical model with a surrogate model and PDEM. Using the Shanghai maglev line as the engineering context, we first verify the correctness of our theoretical model for a maglev vehicle-PD controller-bridge system. Next, we assume that the control parameters are random variables, the accuracy and efficiency of the proposed method are then verified by comparison with MCM and the one-stage sampling surrogate model (OSM). Finally, we explore the impacts of the randomness in each controller parameter and the coefficients of variation of the controller parameters on the dynamic reliability results, such as the probability density function (PDF) and the probability of exceedance (POE).
Dynamic model and equation of motion for the EMS high-speed maglev vehicle-bridge coupled system
Maglev train model
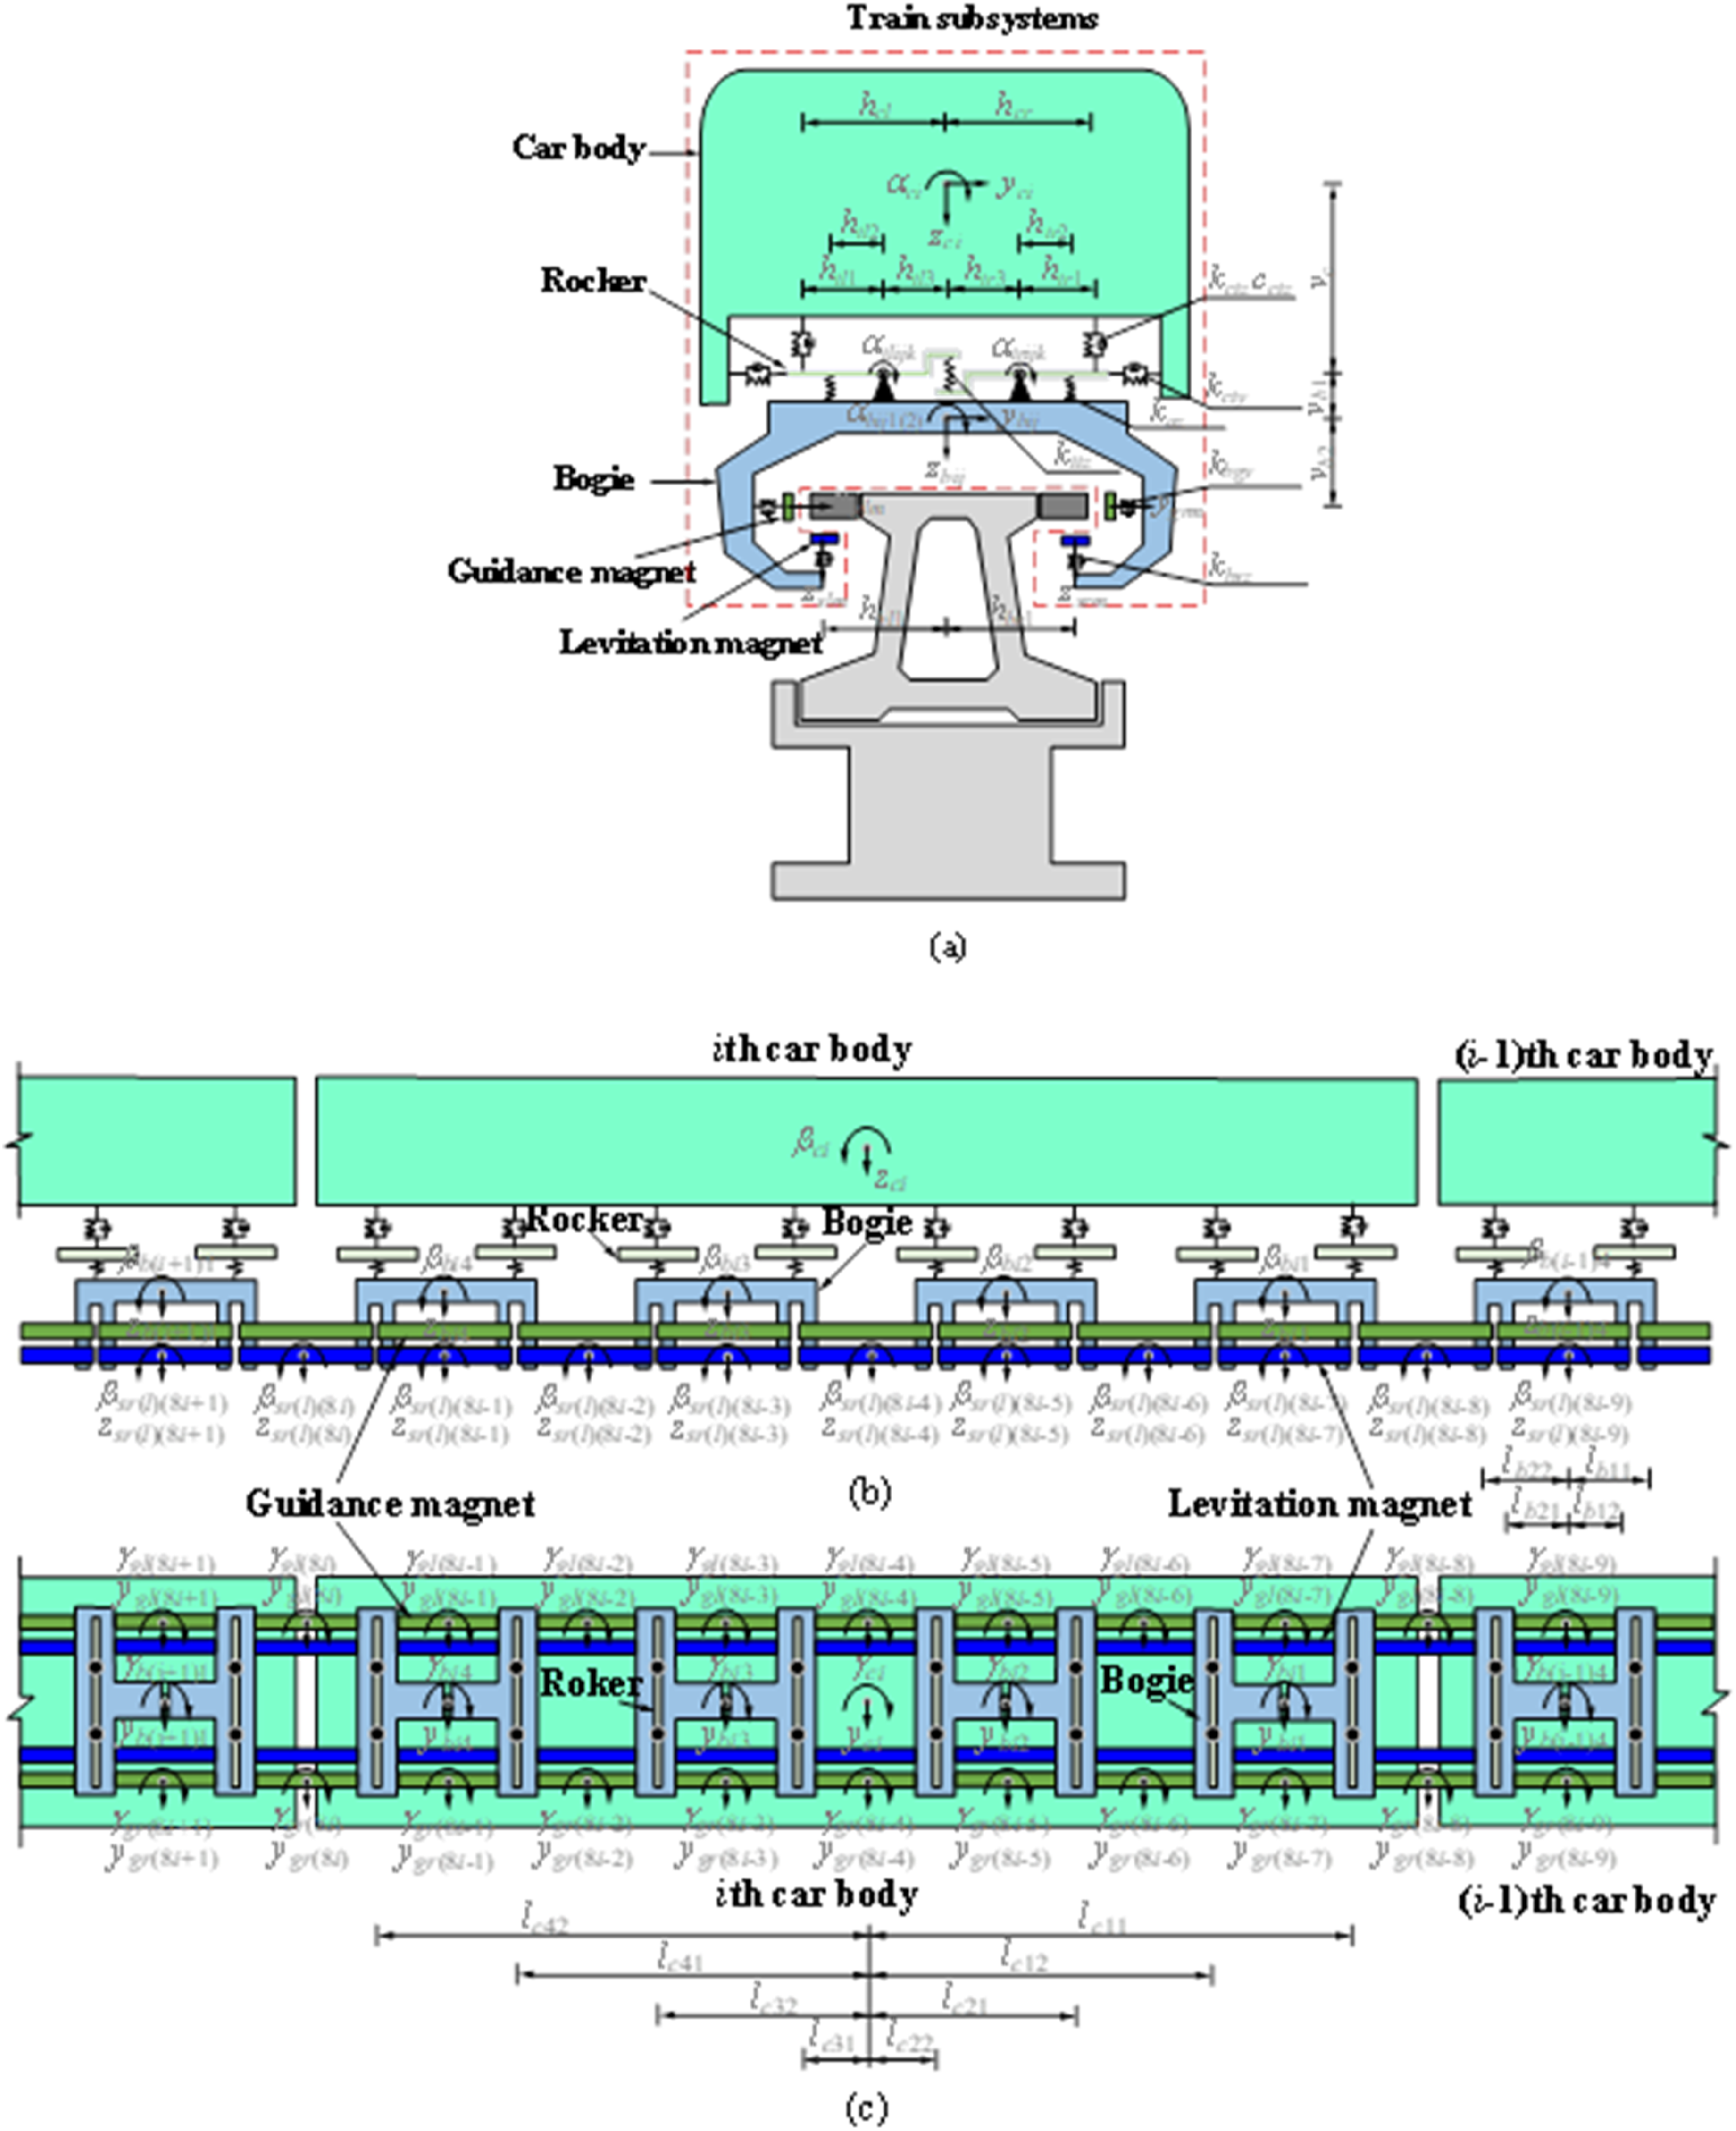
In this study, we take the Shanghai EMS high-speed maglev train, as depicted in Figure 1, as an example to establish a dynamic train model. In this type of train, each car comprises 1 car body, 4 bogies, 16 rods, 14 suspension magnets, and 14 guidance magnets. Additionally, there are 2 suspension magnets and 2 guidance magnets between the front and rear bogies of adjacent cars. The bogies are composed of 2 C-shaped frames connected by a longitudinal axis. The suspension magnets have 12 magnetic poles, with a center-to-center spacing of 0.258 m, and the guidance magnets have 3 guidance magnetic poles, with a center-to-center spacing of 1.032 m. The multi-body dynamics method is employed to simulate the vibration of the vehicle model, where the car body, rockers, bogies, and magnets are modeled as rigid bodies, and the suspension system is modeled as a linear spring or damping element. Each vehicle model has 101 degrees of freedom (DOFs), and detailed information about the train model is illustrated in Figure 2. A Shanghai EMS high-speed maglev train traveling on guideway bridges. Train dynamic model: (a) front view; (b) side view; and (c) top view.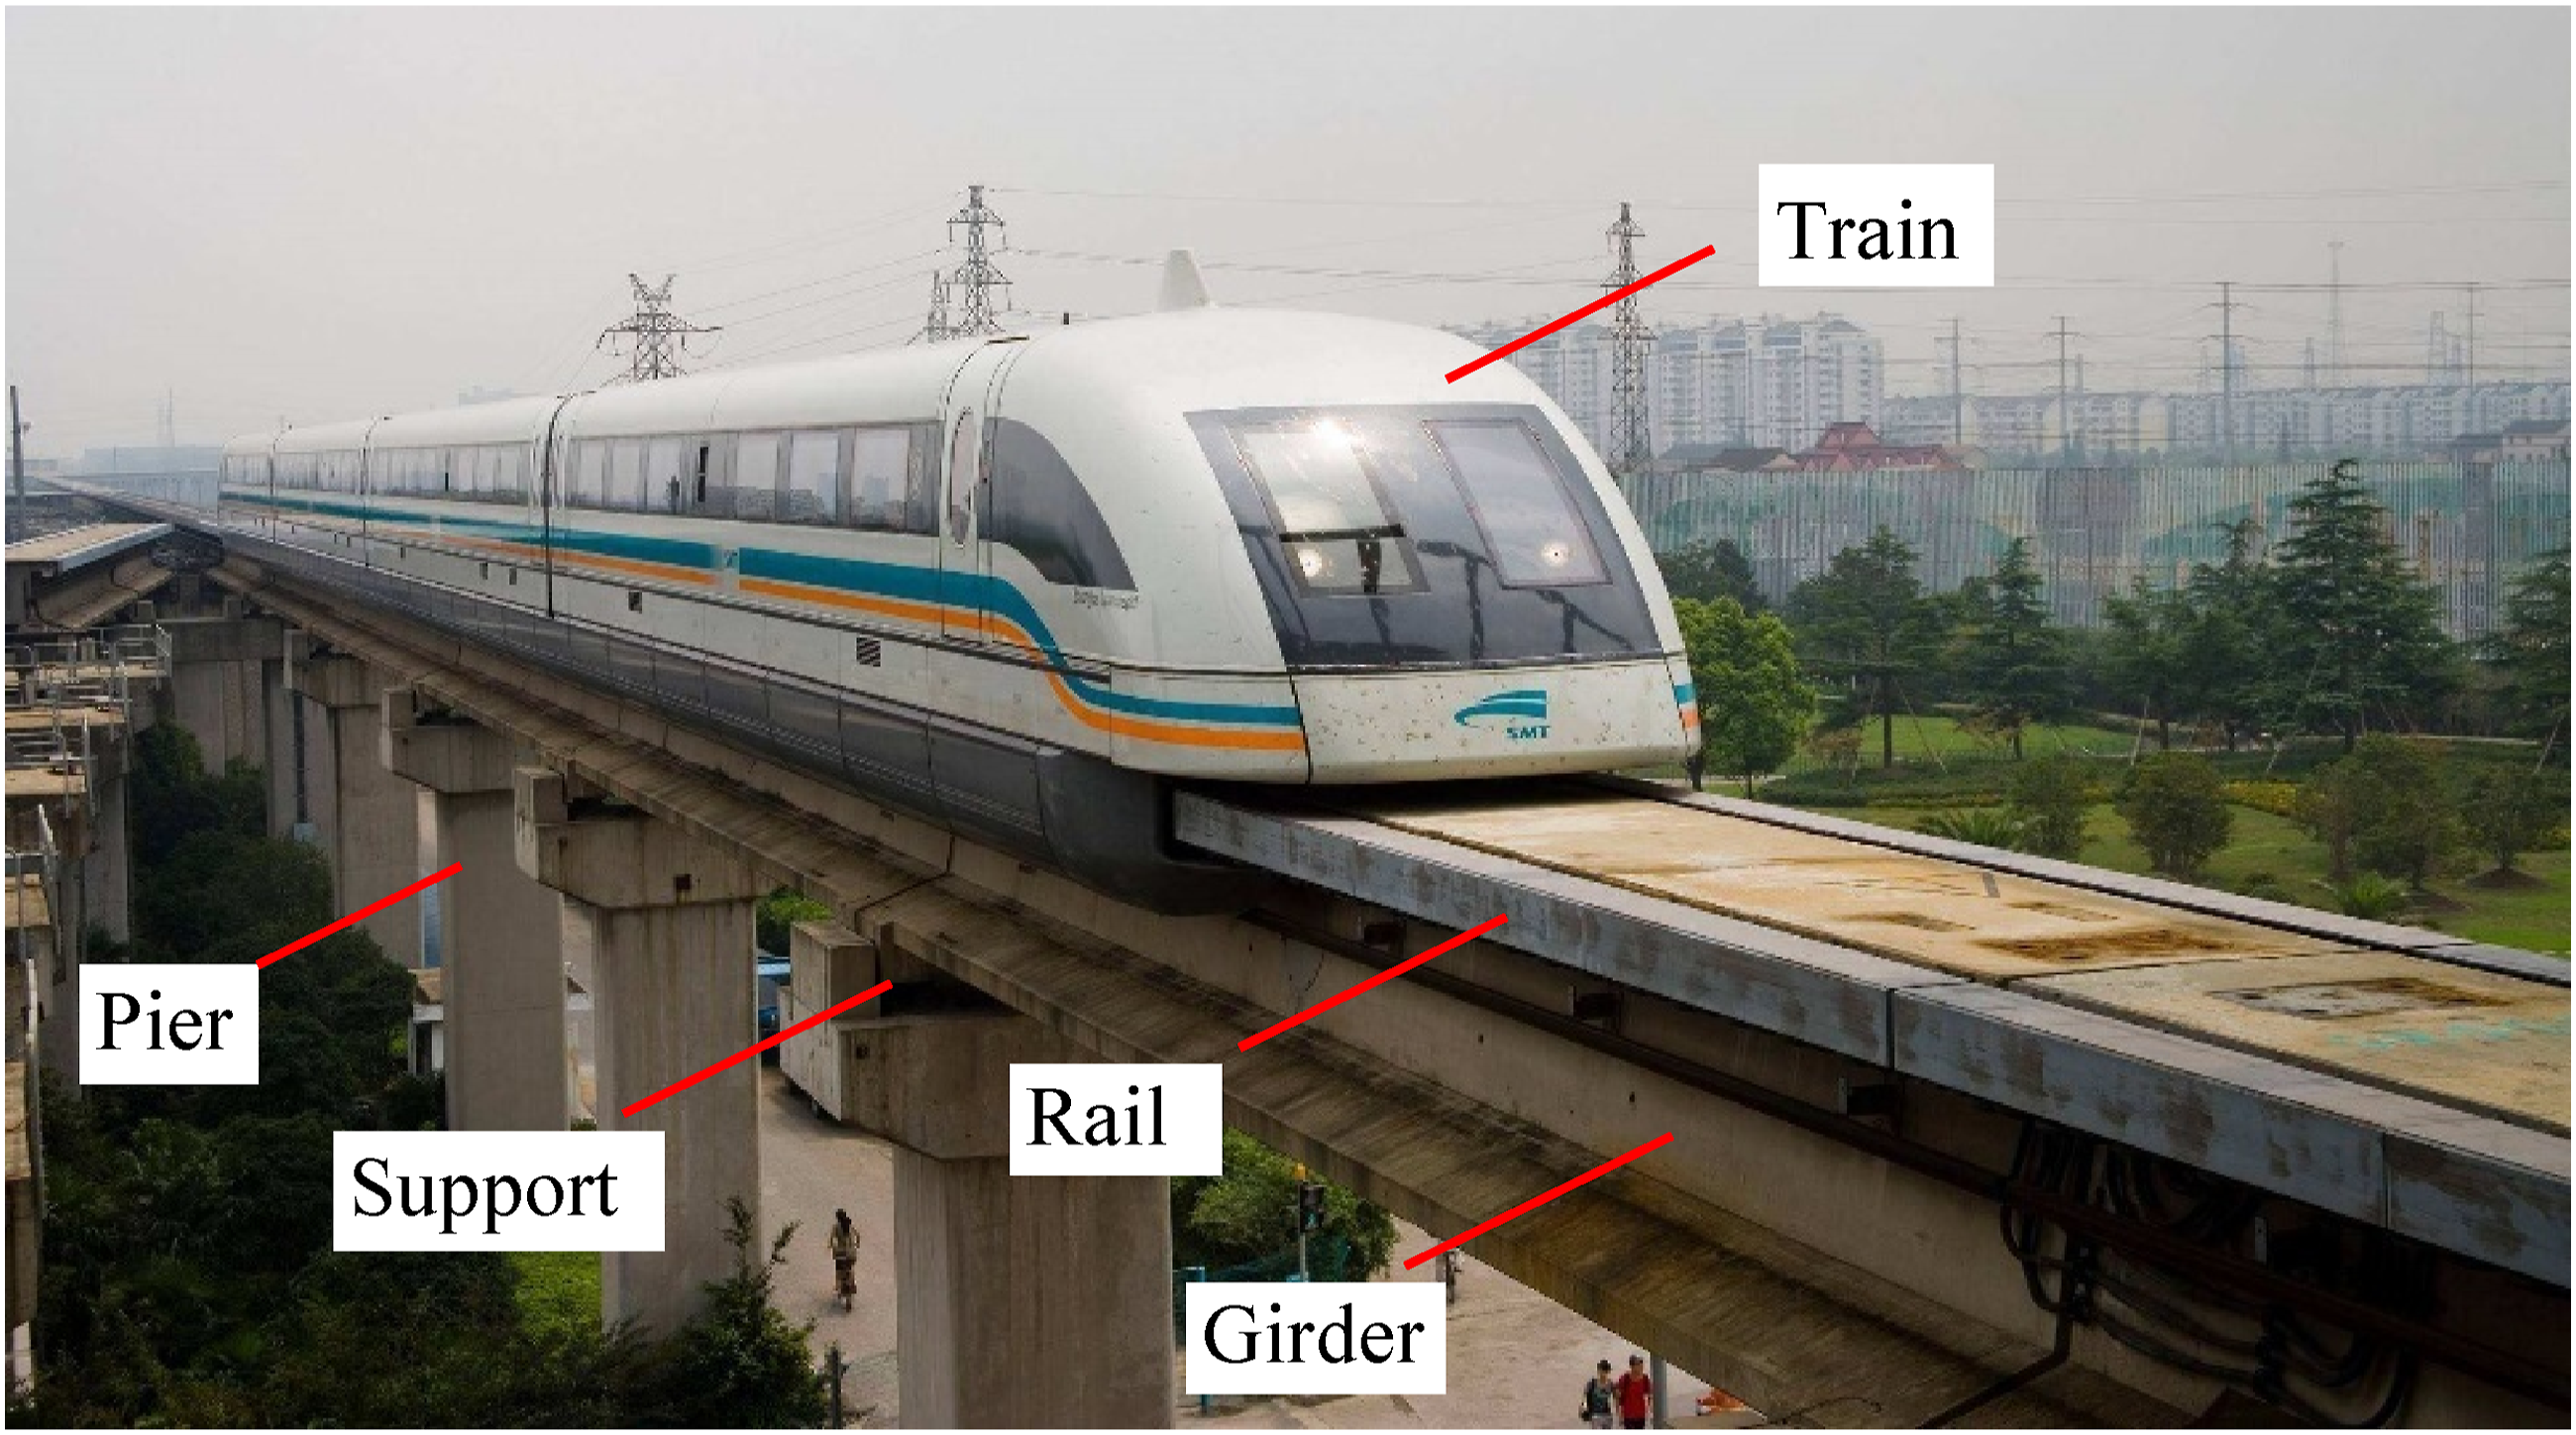
Guideway bridge model
The guideway bridge, as shown in Figure 1, consists of girders, piers, supports, and rails. The bridge has a single span of 24.768 m, and the rails on both sides are composed of eight functional units, each of which is connected to the girder via four pairs of cast iron connectors. Both the rails and girders have box-shaped cross-sections, diagrams of which are displayed in Figure 3(a). The piers are made of solid concrete, with caps and bodies featuring rectangular cross-sections of 3.0 × 1.8 m and 1.8 × 1.8 m, respectively. Two steel laminated elastic bearings are installed between the girder and pier for vibration reduction, each measuring 0.5 m in length, 0.5 m in width, and 0.04 m in height. Finite element model of a guideway bridge: (a) shape displayed and (b) shape not displayed.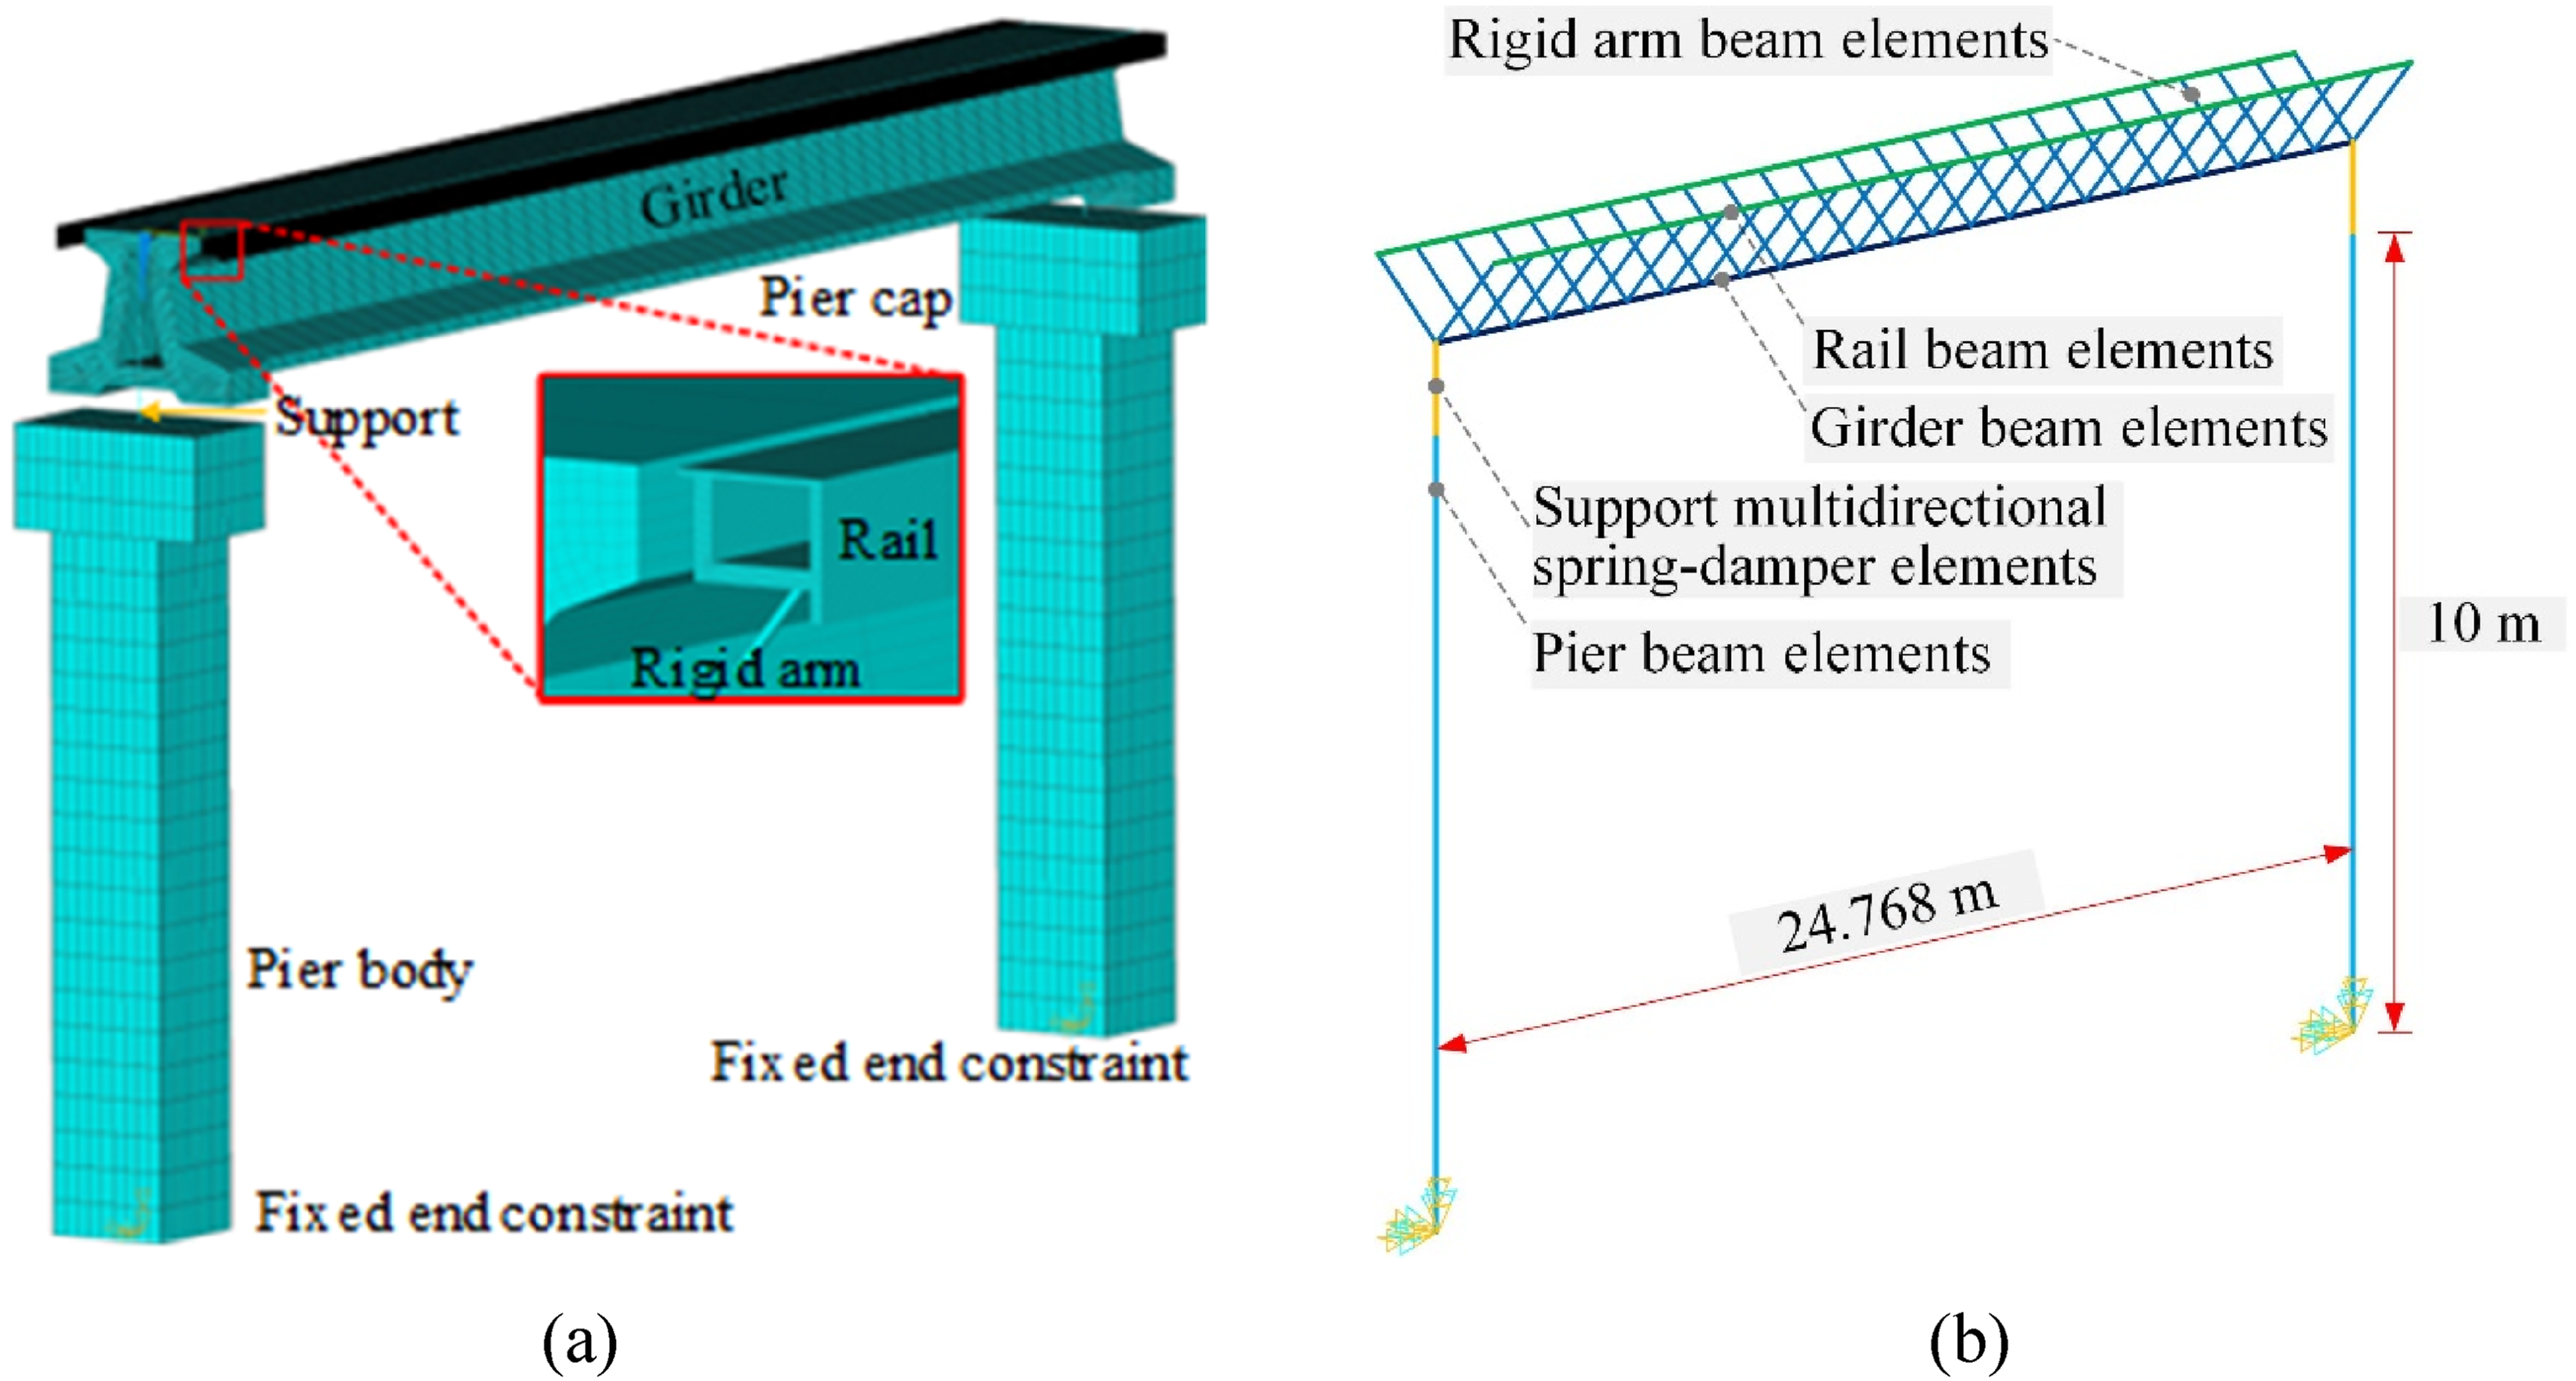
The finite element method was used to establish the guideway bridge model. More specifically, the piers, girders, and rails were simulated as Timoshenko beam elements, the supports were modelled as spring damper elements, and the girder nodes and rail nodes were connected by rigid arms to simulate the eccentric loading effect of the magnetic force. When establishing the boundary conditions for the bridge model, the influence of the soil and pile vibration on the model was ignored, and the bottom of the piers was set as fixed ends. Figure 3 shows the finite element model of the maglev viaduct established using the above method.
Controller model
A maglev train features a suspension system with multiple electromagnets. Owing to the structural decoupling function of the suspension frame, the control of individual electromagnets can be considered as the fundamental unit for the overall suspension control system of the maglev train.
34
The structural diagram of the single-electromagnet model is shown in Figure 4(a), and its parameters can be found in Ref. 6 Given that the EMS maglev train is an inherently open-loop unstable system, it is necessary to introduce a controller to ensure the stable suspension of the vehicle. In this study, a PD controller, as illustrated in Figure 4(b), is adopted to adjust the control current Model of electromagnet-rail interaction: (a) electromagnet model and (b) feedback principle for the PD controller.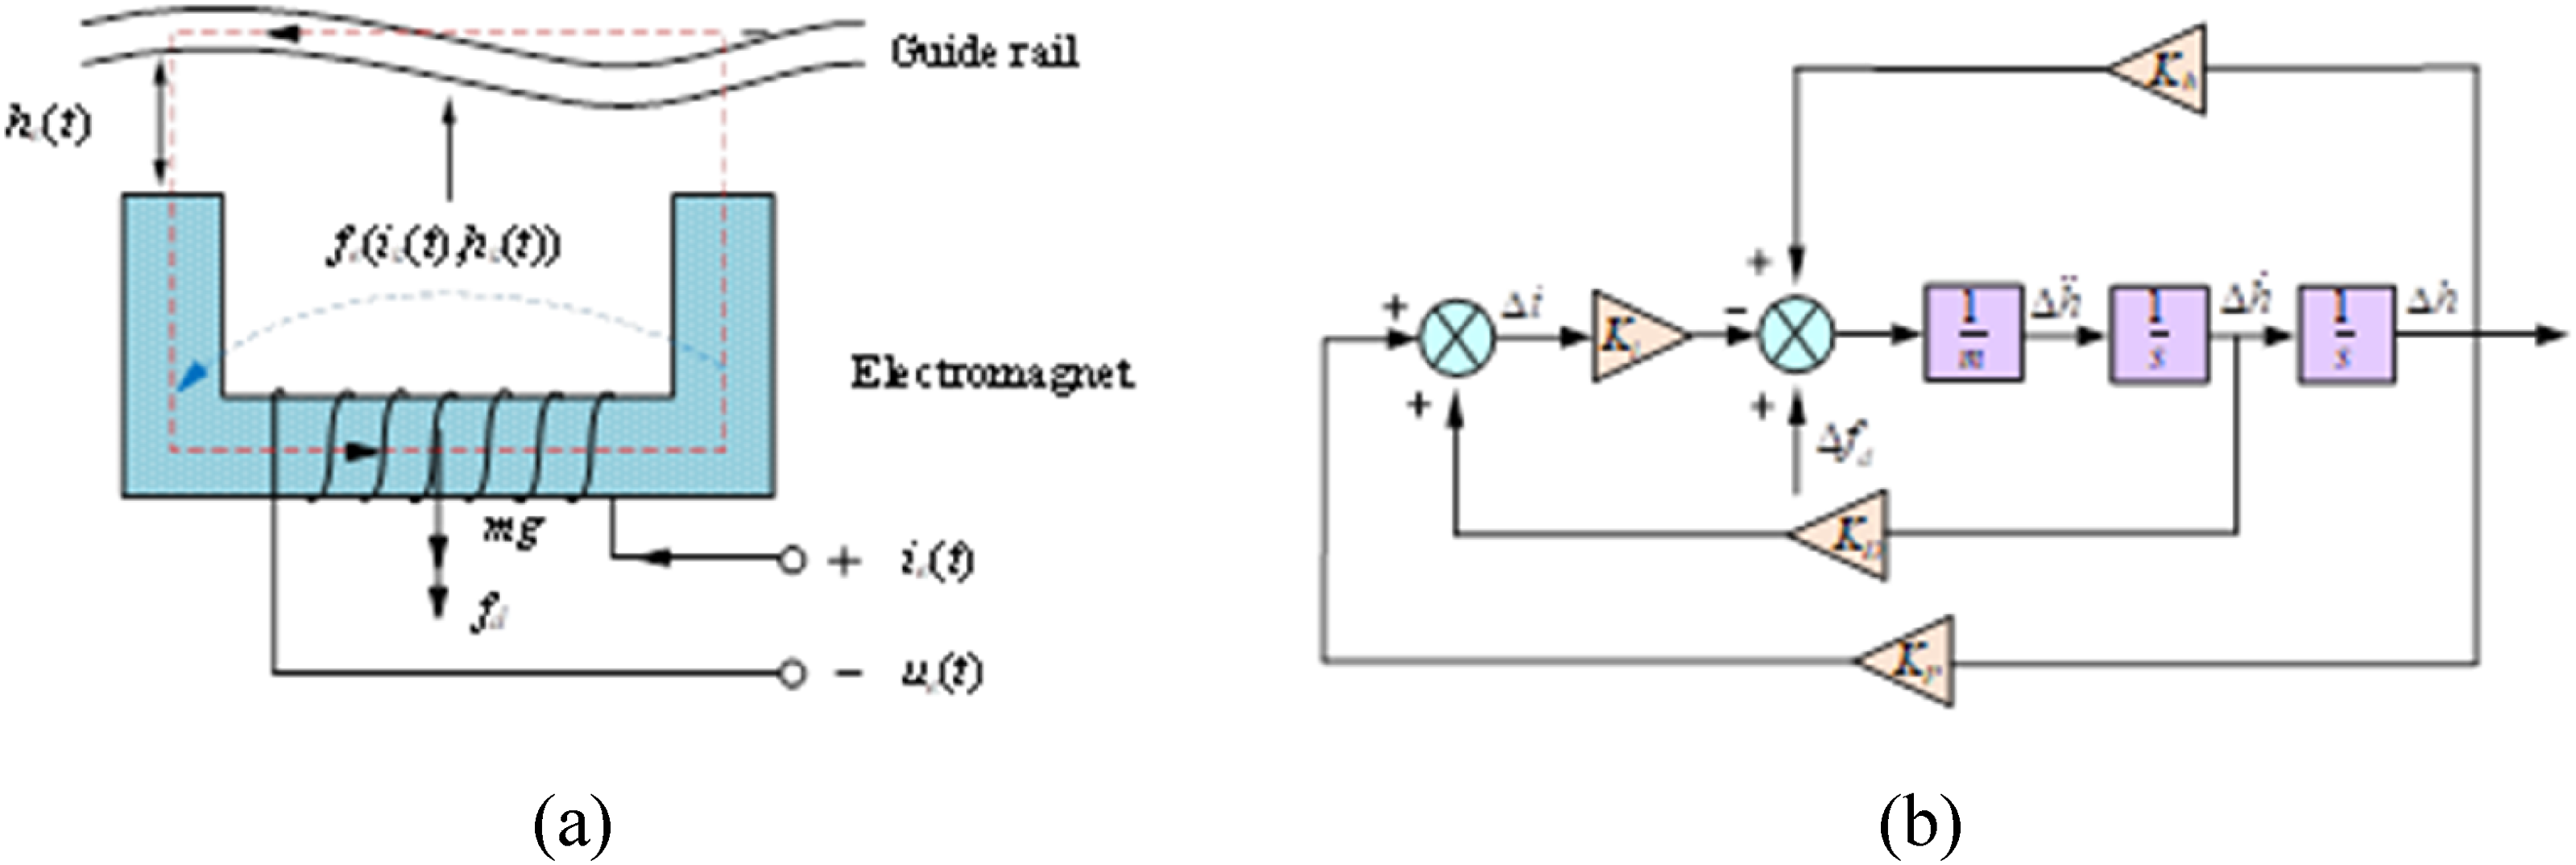

Equation of motion for the coupled system
The equation of motion for the maglev vehicle-bridge coupled system can be established as follows:

Dynamic reliability analysis of a vehicle-bridge system based on PDEM
In previous studies, PDEM has been successfully applied to address dynamic reliability problems in vehicle-bridge systems, which involve random excitations, random physical parameters, or both. The main calculation steps in this method are as follows: (1) Select representative sample point sets (2) Solve the vehicle-bridge coupled vibration equation in Equation (2) at each representative sample point set (3) Construct a virtual stochastic process


Obviously, the requirements in equation (5) can be satisfied when (4) Solve the generalized probability density evolution equation (GPDEE) of the virtual stochastic process (5) Calculate the time-dependent PDF of (6) Calculate the dynamic reliability of the maglev vehicle-bridge system by integrating


Use of ASM to accelerate the dynamic reliability calculation
Outline
Based on the discussion in Dynamic reliability analysis of a vehicle-bridge system based on PDEM, we can see that the prerequisite for calculating the dynamic reliability of the maglev vehicle-bridge system is to obtain the EEVs corresponding to the representative sample point sets
RBF-based surrogate model
The surrogate model method involves the use of limited training samples to build a mathematical model

RBF is a commonly used surrogate model that aims to fit complex functions using linear combinations of simple radial basis functions. It has the advantages of a simple structure, fast training speed, and the capability to approximate any nonlinear function. Therefore, we utilize this approach to construct an ASM for predicting the EEVs of the vehicle-bridge system. For a d-dimensional function Construction process for an RBF-based surrogate model.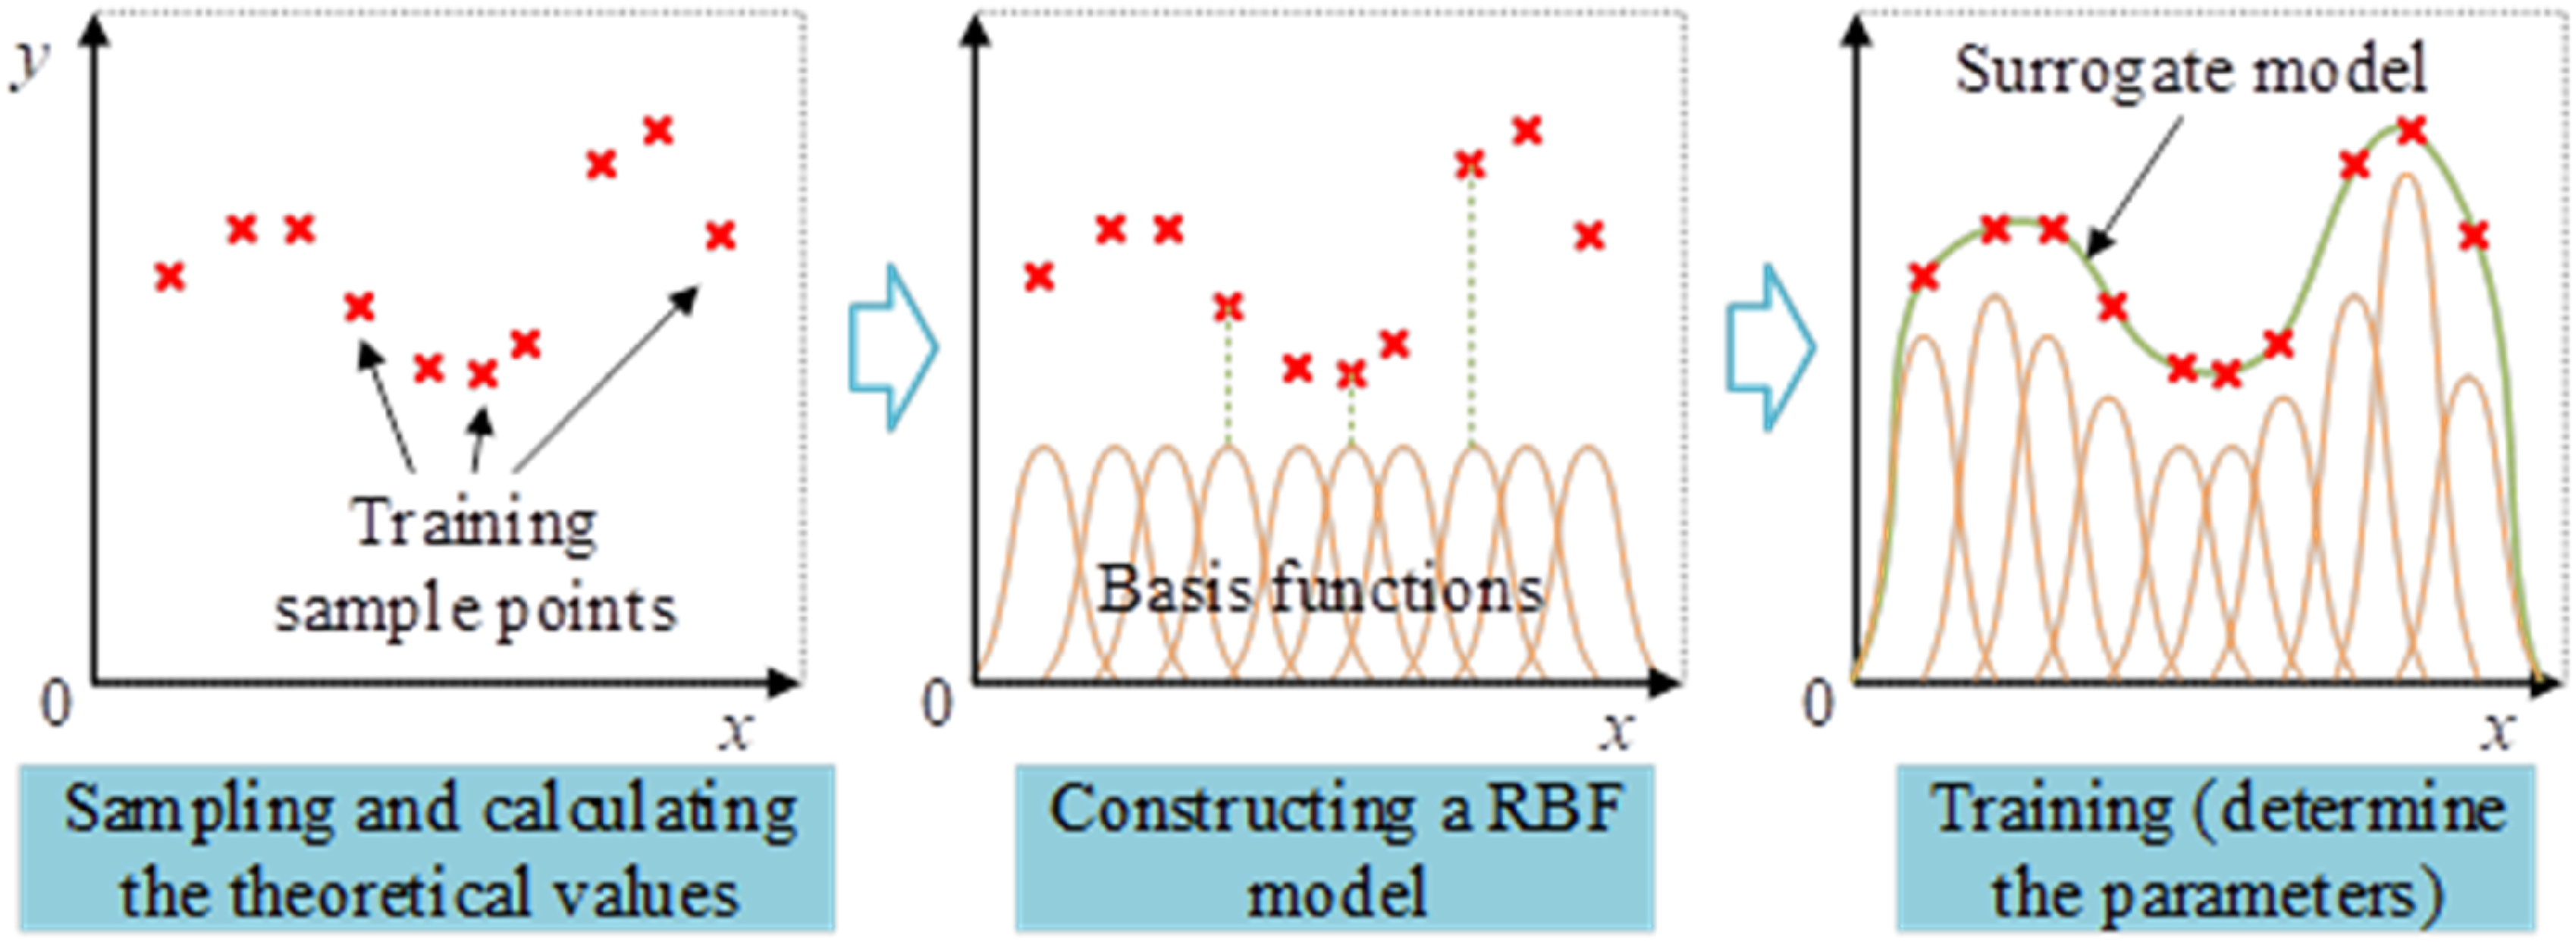


Adaptive sampling technique
As mentioned above, this study applies an adaptive sampling technique to facilitate the efficient construction of a surrogate model. This technique comprises three main steps: generating an initial sample point set, constructing learning functions, and defining a set of termination conditions. The initial sample point set
In this study, we adopt a GF-discrepancy based method
43
to generate the sample point sets

here,

When the assignment probabilities

Finally,
Of the three steps involved in the adaptive sampling technique, the construction of learning functions is the most critical. A robust learning function should possess both excellent global exploration and local exploitation capabilities. Global exploration involves discovering areas with sparse sample points in probability space, while local exploitation involves finding areas with strong nonlinearity in the response function and encrypting sample points in these regions. In this study, the learning functions proposed by Mo et al. 44 were adopted to select new sample points.
Global exploration was achieved by measuring the Euclidean distance between two points, that is,

The aim of this step is to find the point with the smallest Euclidean distance between the candidate sample point sets
To carry out local exploitation, the remainder of the first-order Taylor expansion of the function


After providing the calculation formulae for global exploration and local exploitation, the weights of both need to be considered in the search for new sample points. We therefore define the following criterion function.
44


To ensure the construction accuracy of the ASM, we set conditions for terminating the iterations based on the absolute error (AE):


Implementation process of ASM-PDEM with random controller parameters
Based on the above theoretical derivation, a corresponding program was developed using the MATLAB platform. Figure 6 shows a flowchart for the use of ASM-PDEM in a dynamic reliability analysis of a maglev vehicle-bridge system with random controller parameters. Flowchart for the use of ASM-PDEM for a dynamic reliability analysis of a maglev vehicle-bridge system with random controller parameters.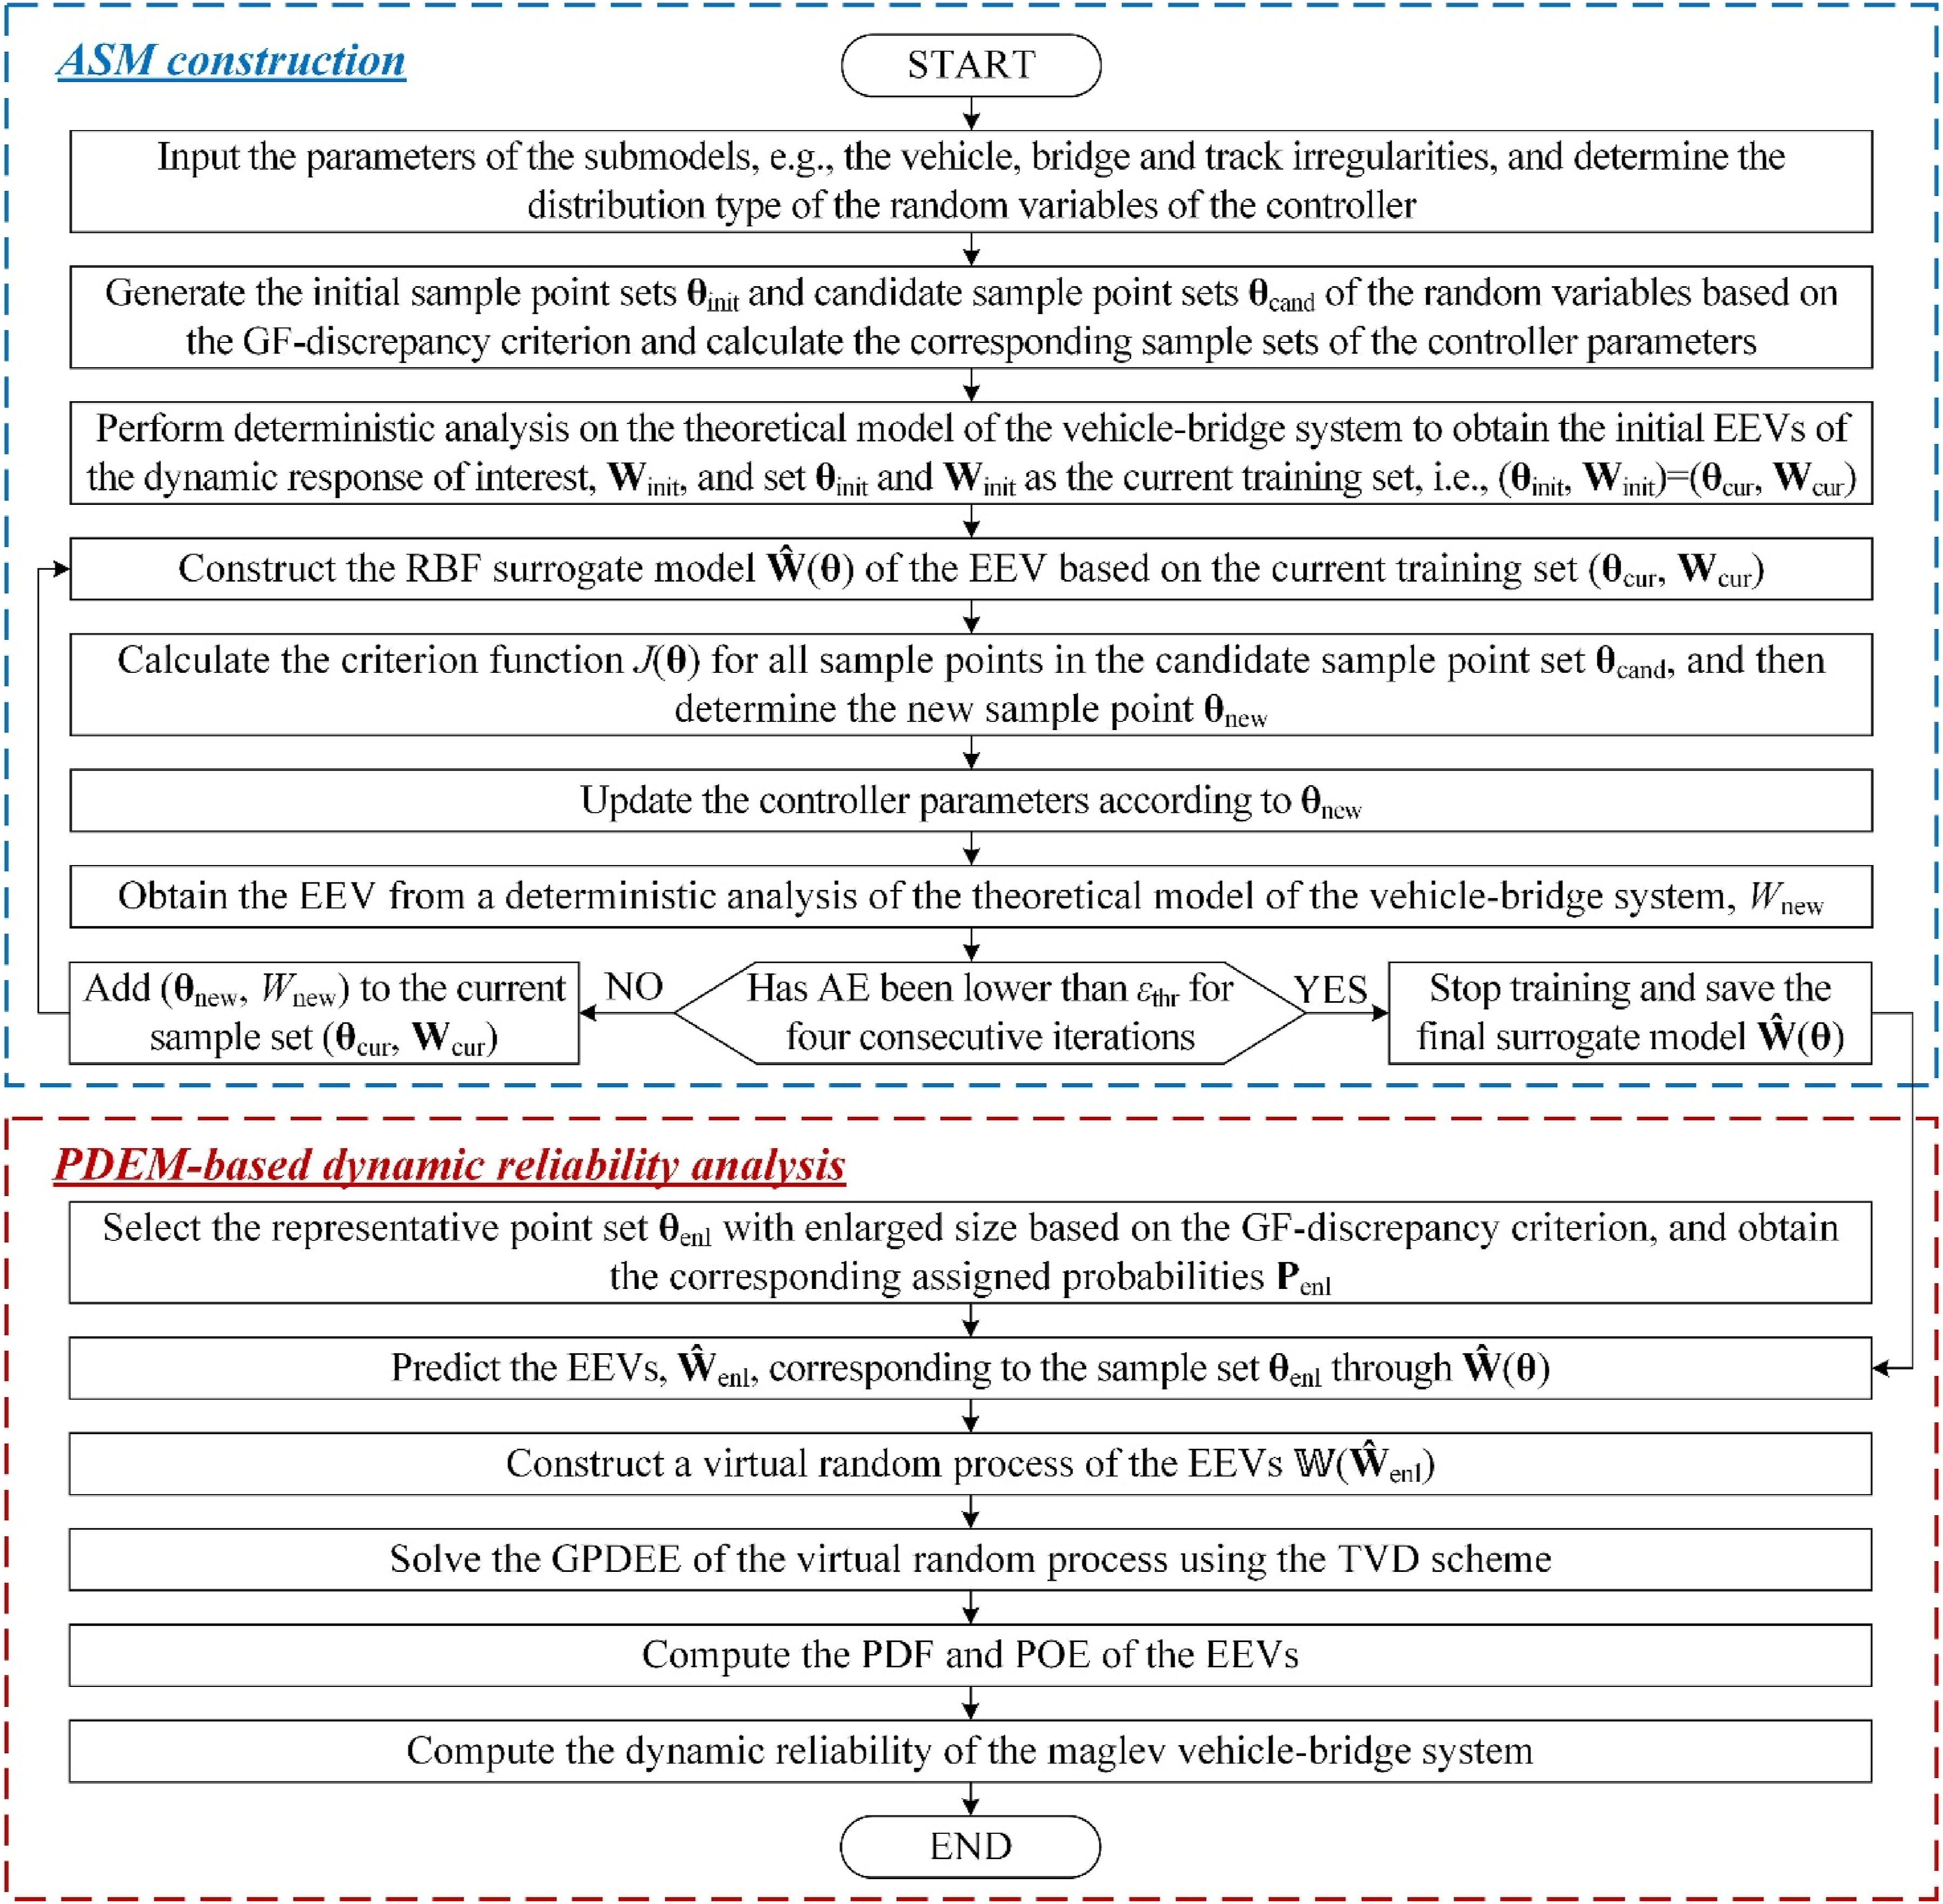
Validations
Theoretical model validation
In this section, we intend to verify the correctness of the theoretical model of the maglev vehicle-bridge coupled system by comparing it with the field measured results of Shanghai high-speed maglev line.45,46 The vehicle is a five-car formation with a speed of 430 km/h, and the model parameters are given in Ref. 6 The bridge is a five-span simply supported beam bridge with a span of 24.768 m and a pier height of 10 m. The main parameters of the bridge model are listed in Table A1. In this section, we do not consider the randomness of the controller parameters. The suspension system controller parameters are set to Randomly generated track irregularity samples: (a) vertical and (b) lateral. Comparison between calculated and measured results for the midpoint of the bridge girder: (a) vertical deflection for v = 430 km/h and (b) dynamic coefficients for v = 50–350 km/h.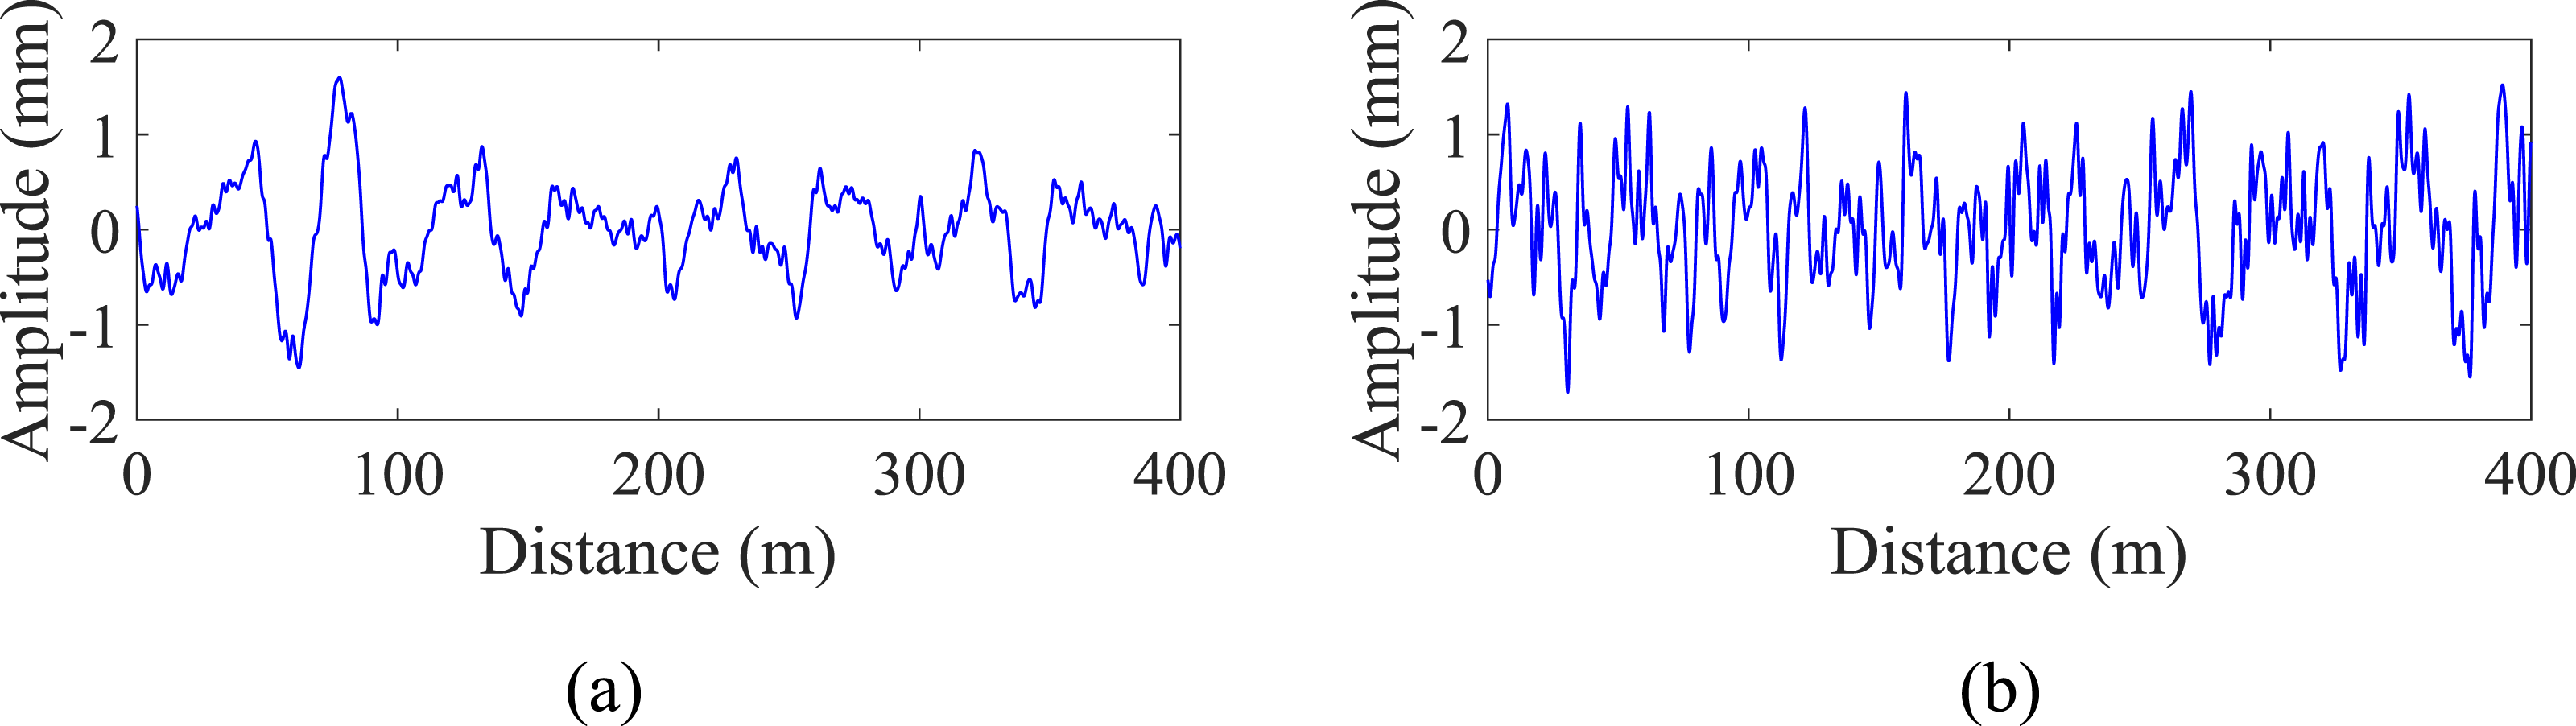
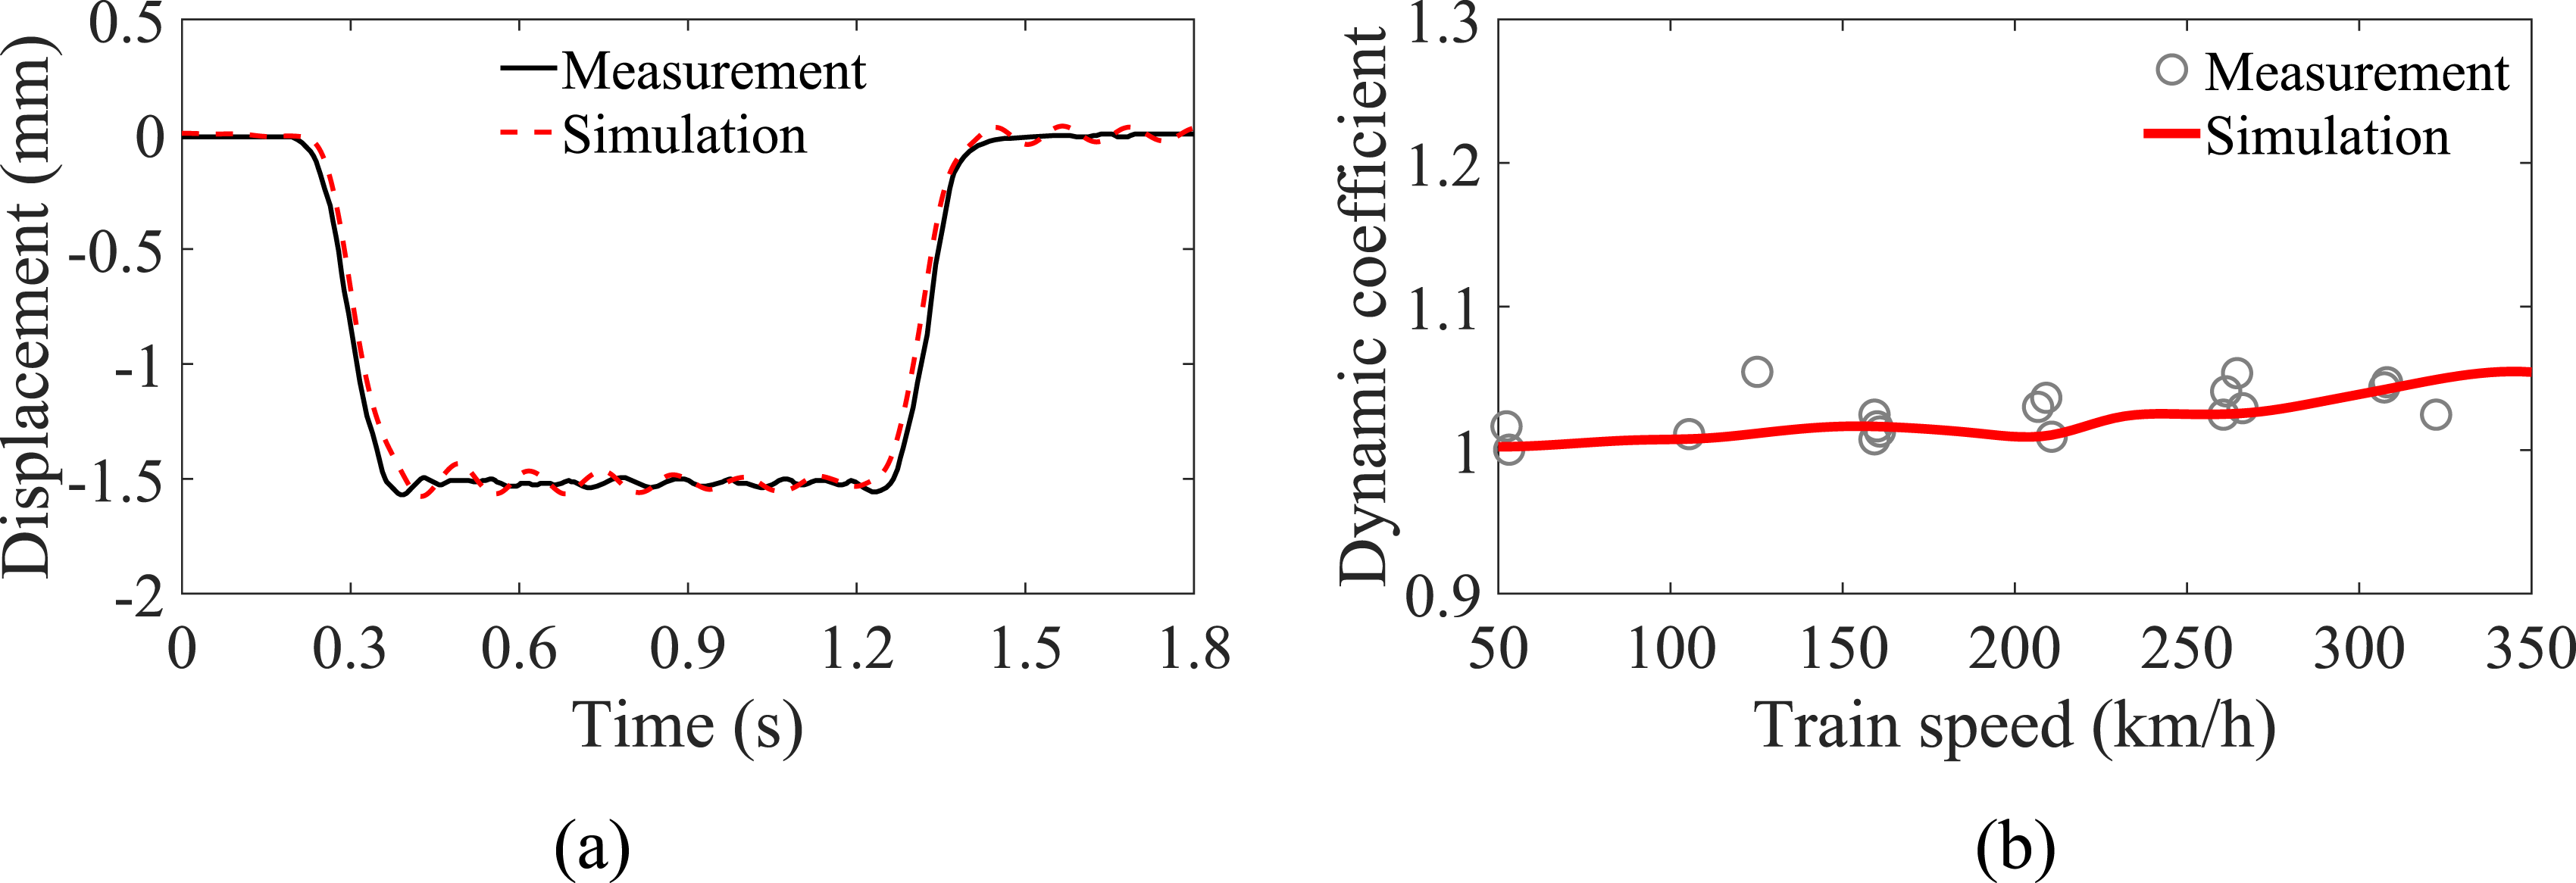
From a comparative analysis of Figure 8, we can see that the vehicle-bridge theoretical model established in Dynamic model and equation of motion for the EMS high-speed maglev vehicle-bridge coupled system simulates the dynamic characteristics of the actual model well. In the following analysis, the theoretical values of the dynamic response of the vehicle and guideway girder required for training of the surrogate model will be obtained from this model.
ASM-PDEM validation
In this section, the accuracy and efficiency of the proposed ASM-PDEM are validated by comparison with the MCM and OSM-PDEM. The distinction between OSM-PDEM and ASM-PDEM lies in their use of OSM and ASM, respectively, to predict the EEVs of the dynamic response. We assume that the controller parameters
Taking the vertical displacement and acceleration of the midpoint of the bridge girder as an example, Figure 9 shows the variation in the training accuracy evaluation indicators of OSM and ASM with the sample size. It is observed from the figure that both RMSE
OSM
and RMSE
ASM
gradually decrease with an increase in the sample size, but that ASM has a higher training efficiency than OSM, as the values decrease faster. For example, when the number of training samples reaches 273, the RMSE
ASM
for the vertical displacement of the midpoint of the bridge girder is less than 1 × 10⁻⁶, but the RMSE
OSM
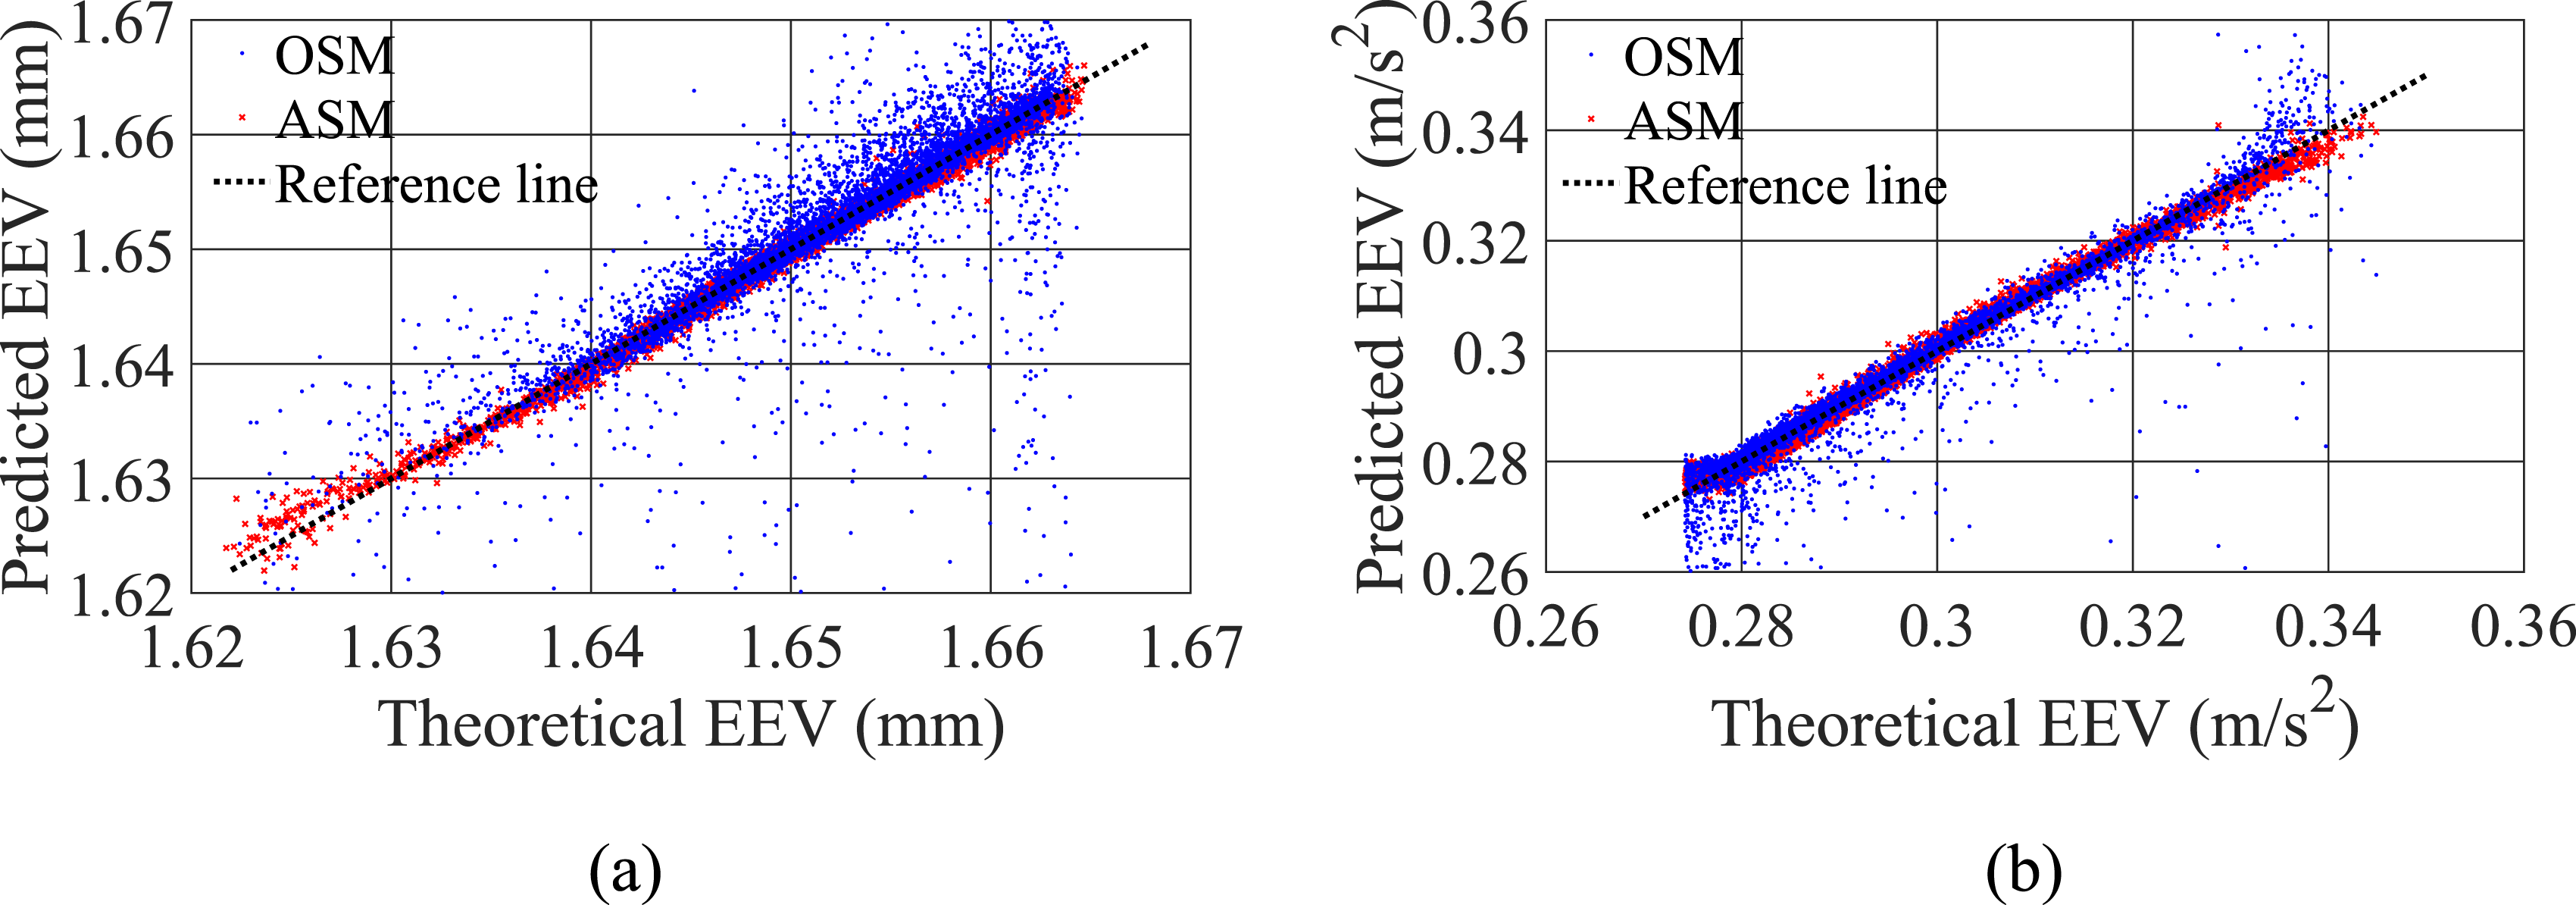
corresponding to this sample size is 1.34 × 10⁻⁵, one order of magnitude larger than the former. Although AE also tends to decrease with an increase in sample size, it differs from RMSE in that it exhibits noticeable oscillation. Consequently, we set the termination condition that iterations should cease when AE remains below a certain threshold Variation in training accuracy evaluation indicators with sample size: (a) vertical displacement and (b) vertical acceleration of the midpoint of the bridge girder. Comparison of EEVs predicted by OSM and ASM: (a) vertical displacement and (b) vertical acceleration of the midpoint of the bridge girder.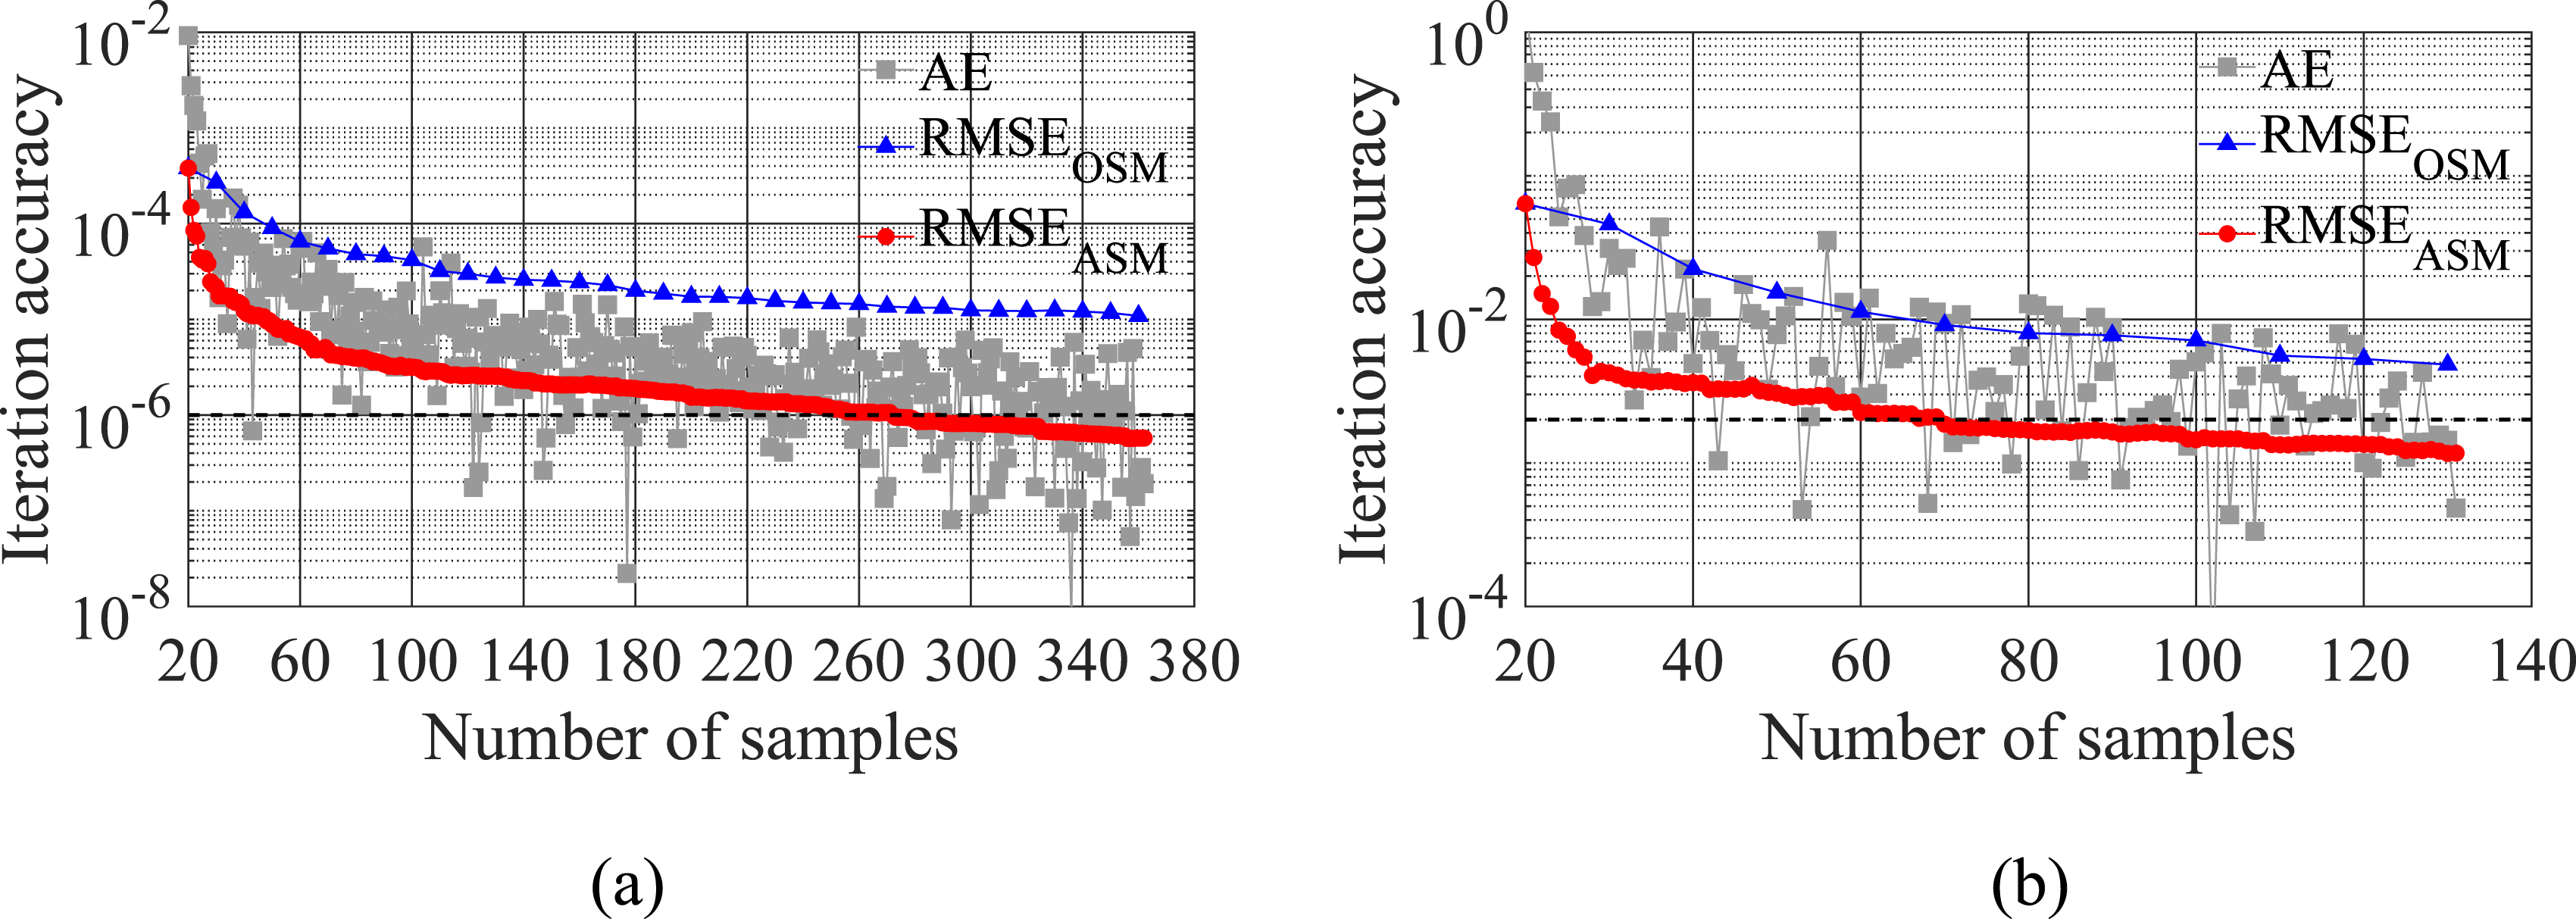
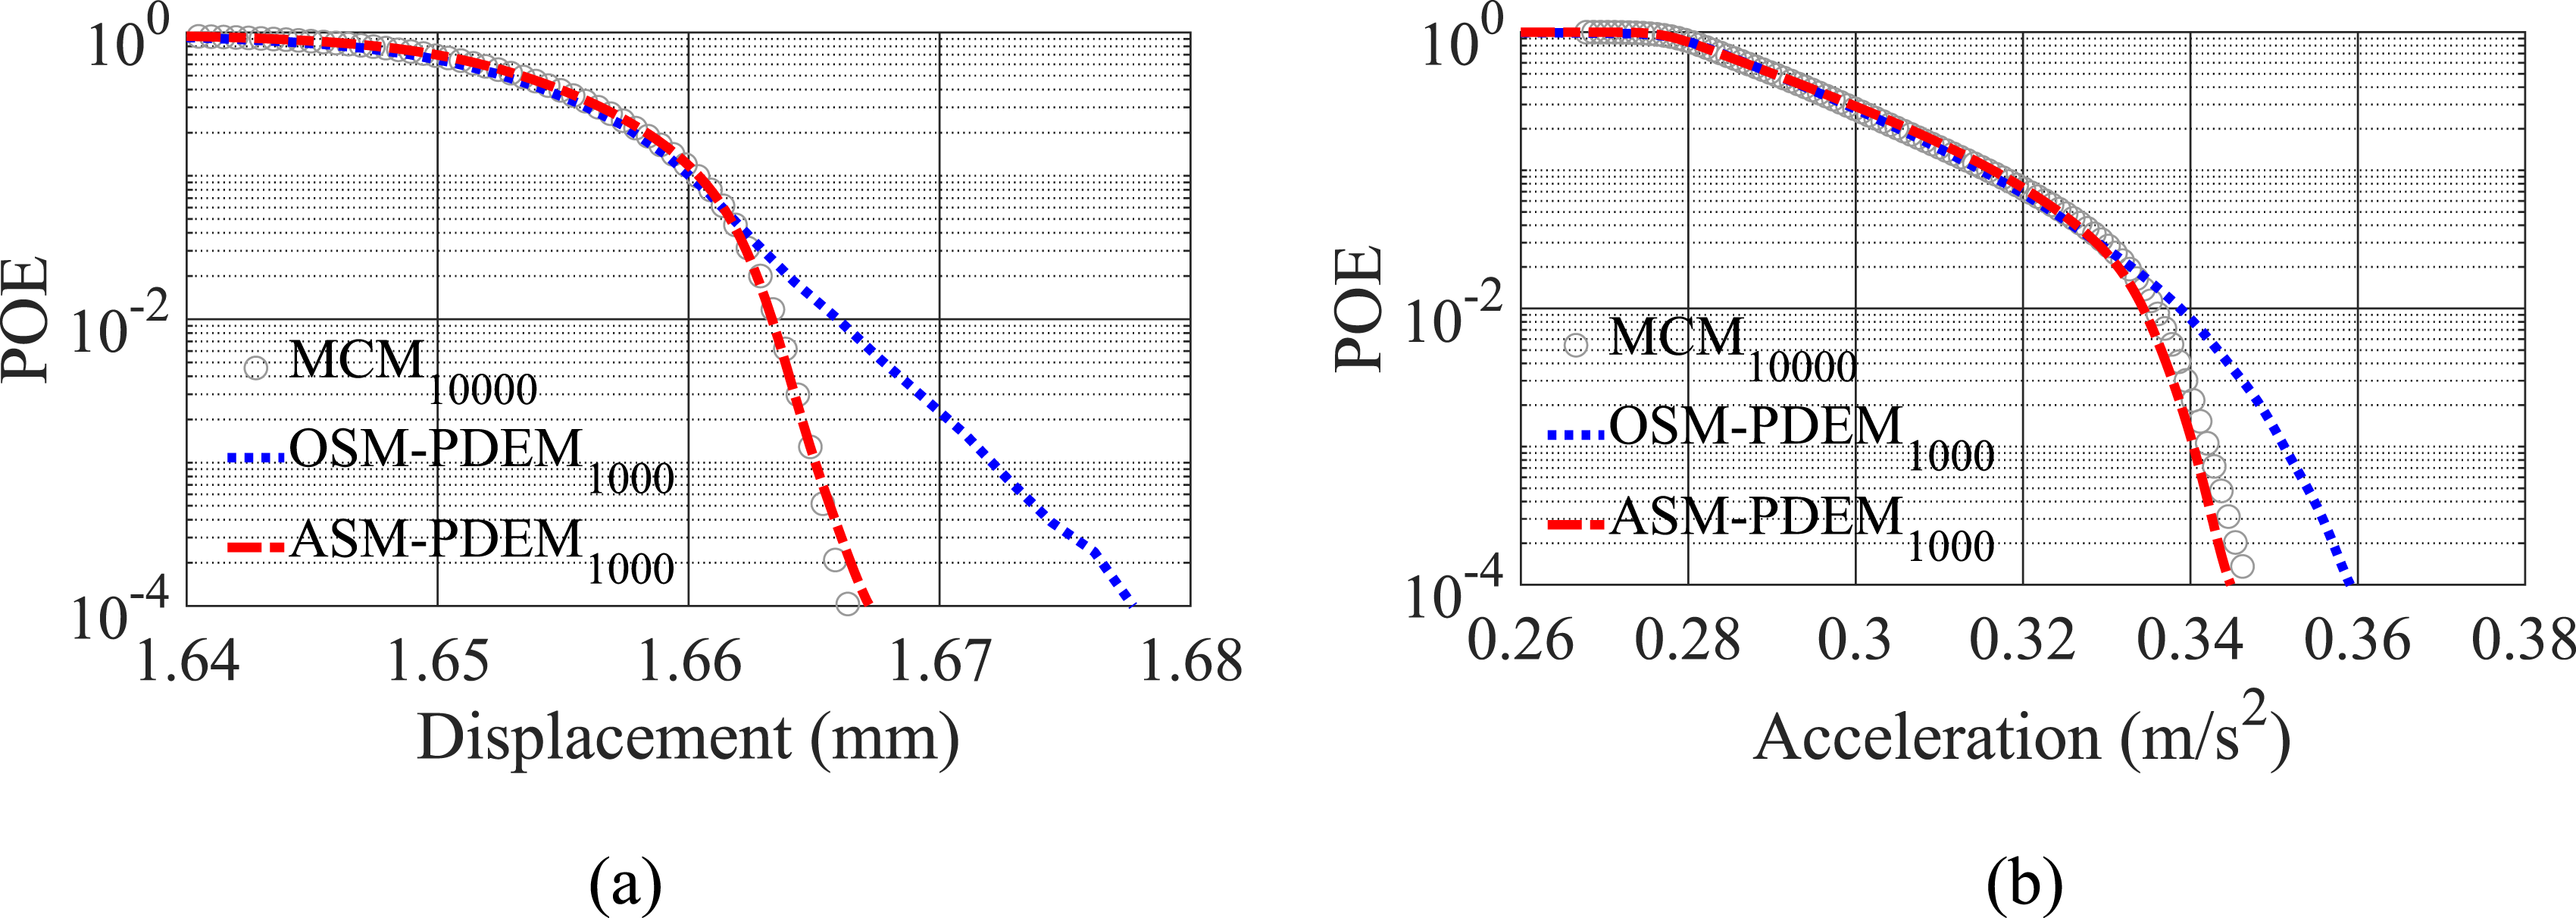
In order to illustrate the accuracy and efficiency of ASM-PDEM in the calculation of dynamic reliability, Figure 11 shows the PDFs of the EEV for the vertical displacement and acceleration at the midpoint of the bridge girder, calculated using MCM, OSM-PDEM, and ASM-PDEM. In Figure 11, “MCM10000” indicates the results obtained from the vehicle-bridge theoretical model using 10,000 randomly generated controller parameter samples, and “OSM-PDEM1000” and “ASM-PDEM1000” indicate the results obtained by OSM-PDEM and ASM-PDEM, respectively, using 1000 predicted EEVs, where the same number of training samples are used in both OSM and ASM to establish surrogate models. It can be observed from Figure 11 that the results obtained via ASM-PDEM1000 exhibit a higher degree of conformity with those from MCM10000 compared to those from OSM-PDEM1000. Taking the vertical displacement of the midpoint of the bridge girder as an example, we see that the maximum PDF values obtained from MCM10000, OSM-PDEM1000, and ASM-PDEM1000 are 6.37×10⁴, 6.01×10⁴, and 6.44×10⁴ 1/m, respectively. The relative errors for OSM-PDEM1000 and ASM-PDEM1000 are 5.65% and 1.10%, respectively. Figure 12 shows the POE curves obtained using the three methods mentioned above, and it can be seen that within the distribution range of the EEV values, the POE curves calculated by ASM-PDEM1000 are in good agreement with those from MCM10000. However, as the response increases, the difference between the POE curves calculated with OSM-PDEM1000 and MCM10000 gradually increases. Given that the failure of a vehicle-bridge system is a low-probability event, the computational precision of ASM-PDEM is significantly superior to that of OSM-PDEM for an equivalent computational effort. It is also worth noting that compared to MCM, ASM-PDEM yields an improvement in computational efficiency of an order of magnitude. For example, to obtain the vertical displacement of the midpoint of the bridge girder, ASM-PDEM only needs to solve the vehicle-bridge theoretical model 363 times, and obtaining the POE results takes a total of 5.5 h, while MCM solves the theoretical model 10,000 times, which takes a total of 124 h. The computer used in this study was an Intel(R) Core(TM) i9-9900K CPU 3.60 Hz with 32 GB RAM. Comparison of PDFs calculated with MCM, OSM-PDEM, and ASM-PDEM: (a) vertical displacement and (b) vertical acceleration of the midpoint of the bridge girder. Comparison of POEs calculated with MCM, OSM-PDEM, and ASM-PDEM: (a) vertical displacement and (b) vertical acceleration of the midpoint of the bridge girder.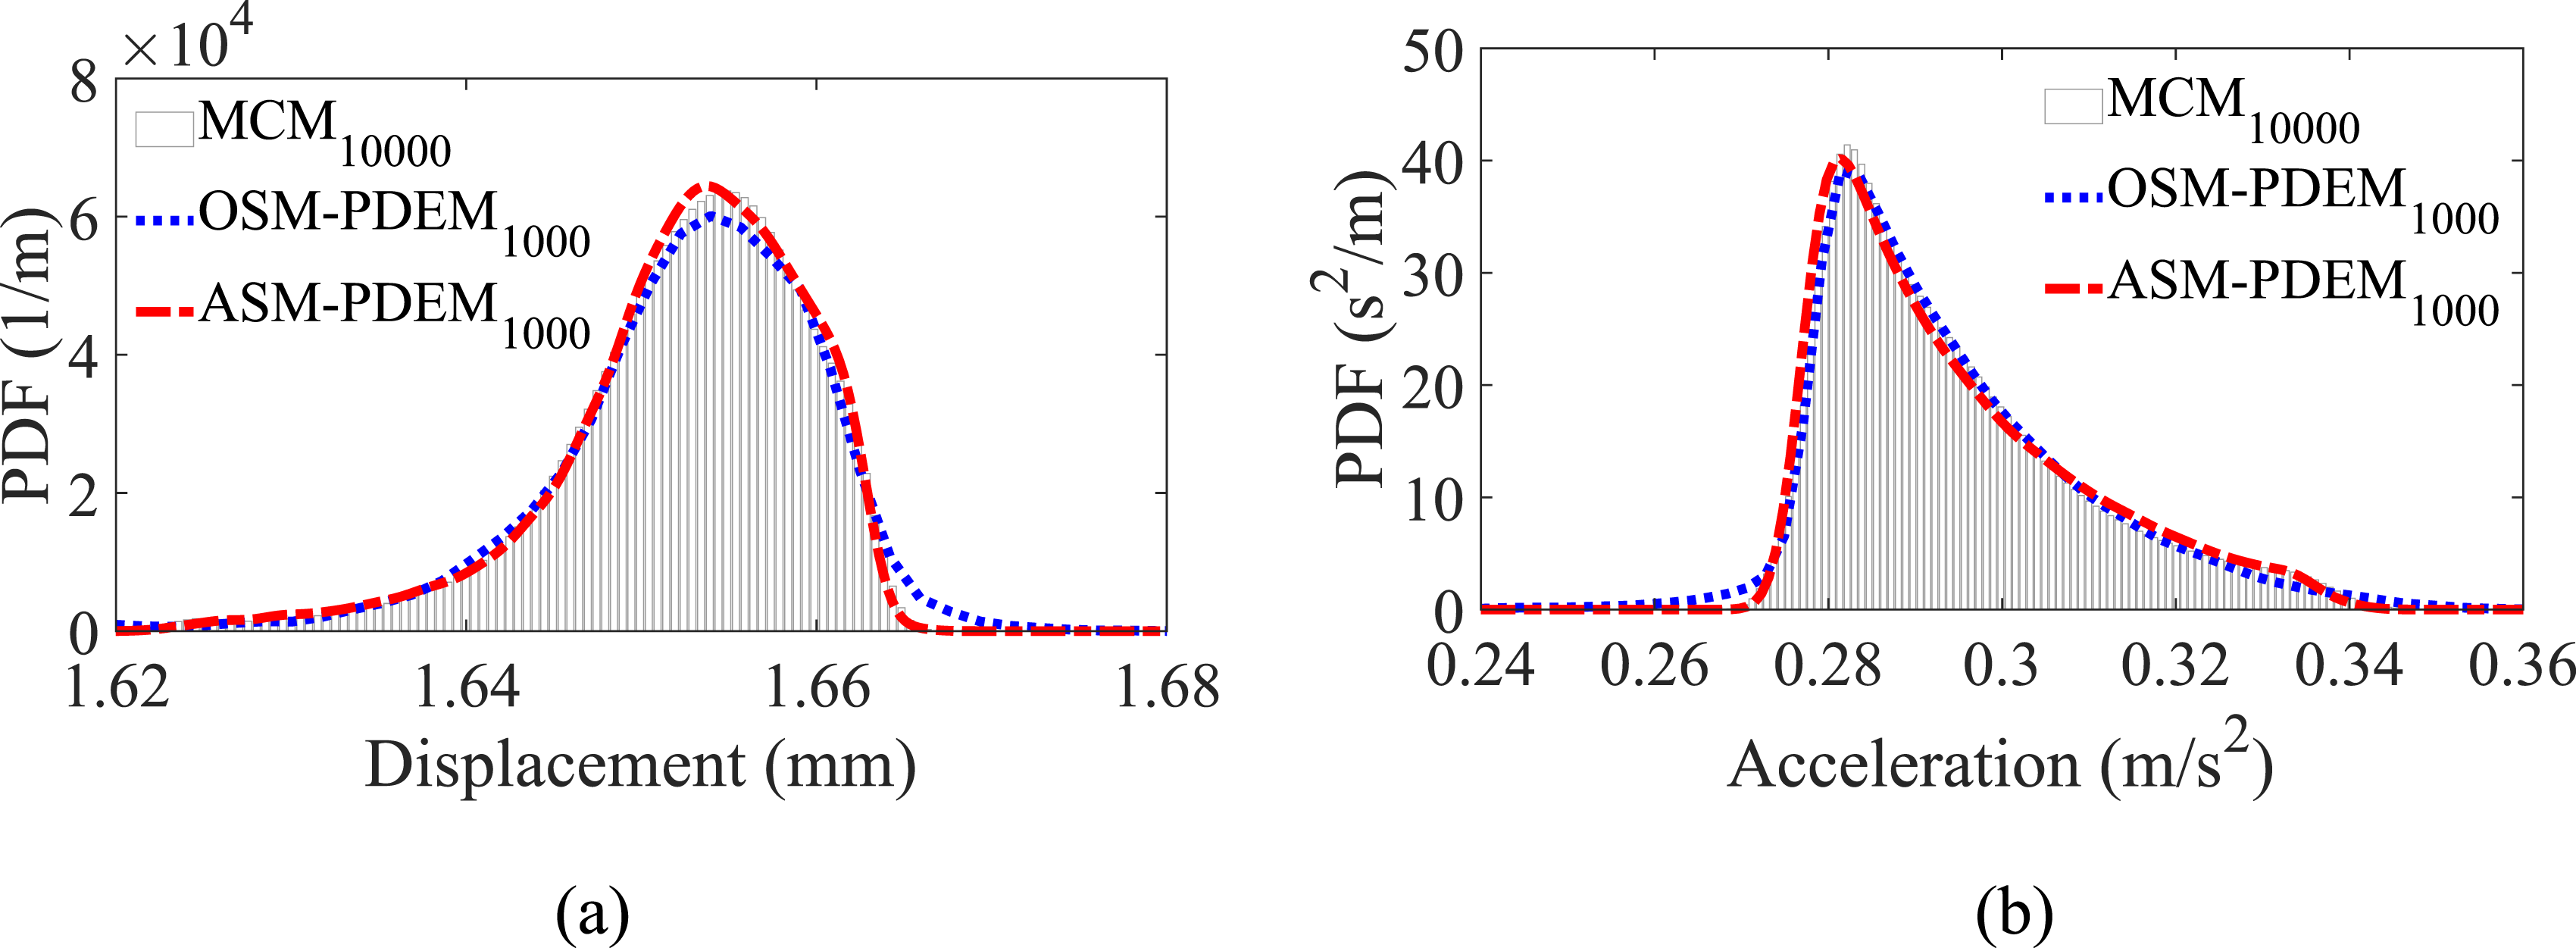
Limiting values of the dynamic responses determined by MCM, OSM-PDEM, and ASM-PDEM for different failure probabilities.
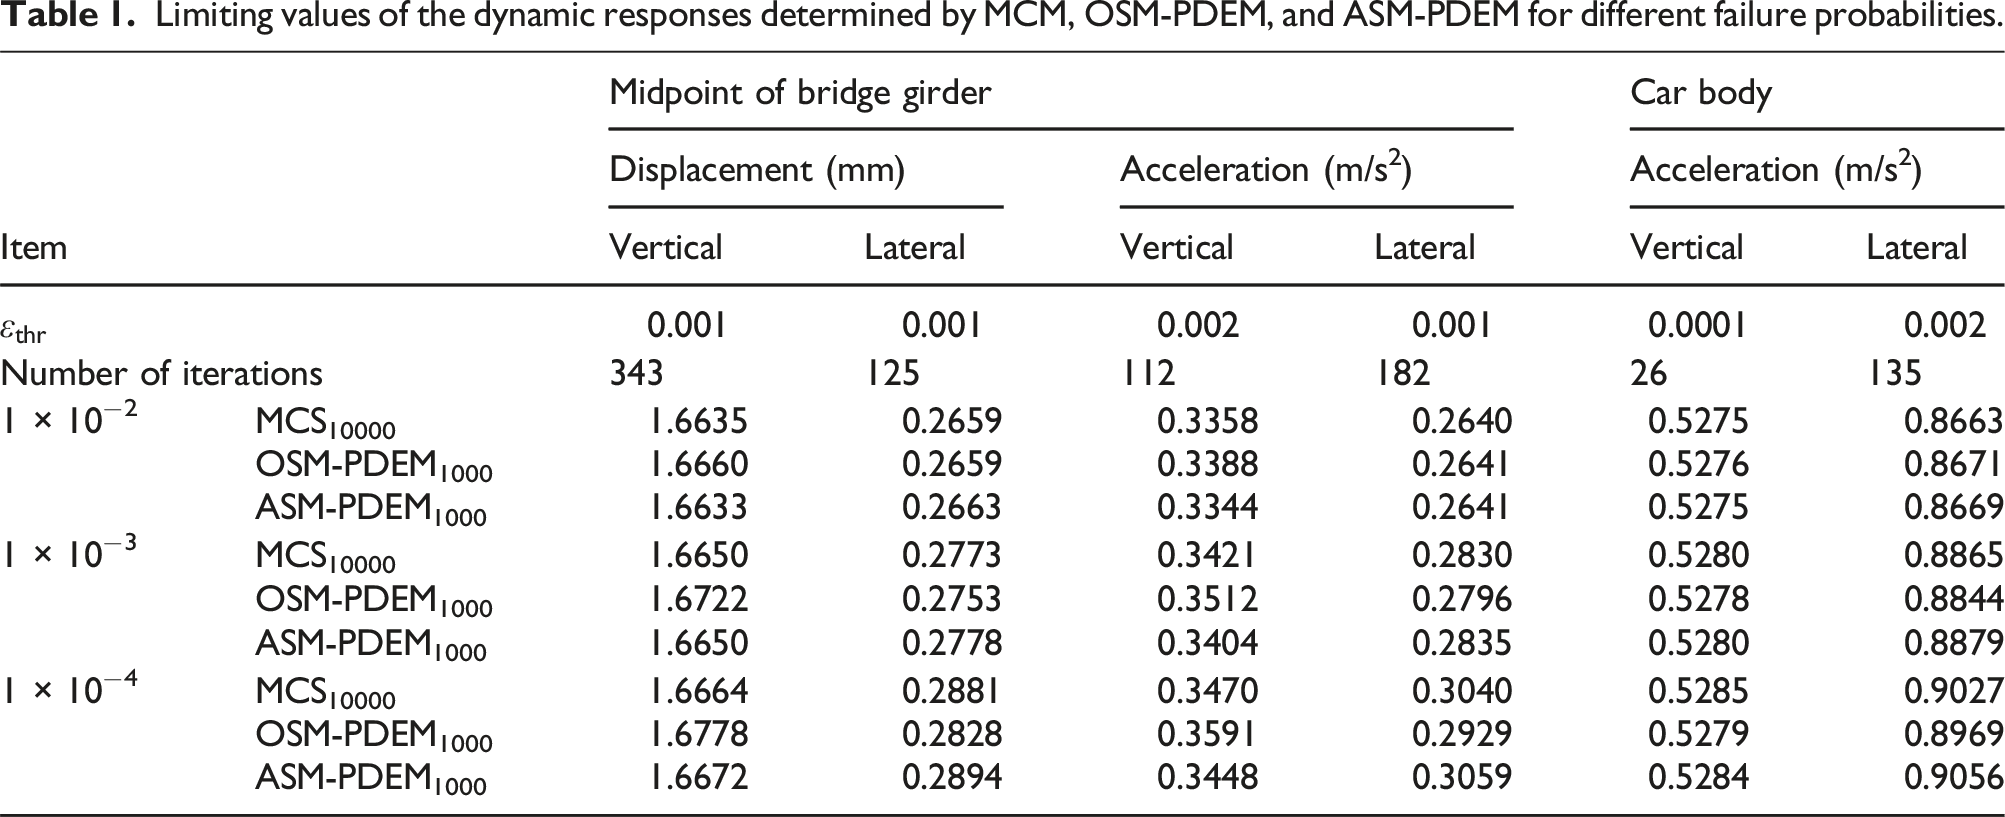
The comparison above proves that the ASM-PDEM approach proposed in this study has higher accuracy and efficiency than MCM and OSM-PDEM in terms of obtaining reliability-related results for random controller parameters. In the research described below, we therefore use ASM-PDEM for the calculations.
Numerical examples
Effects of randomness in controller parameters
The aim of this section is to investigate the effects of the randomness in each controller parameter on the dynamic reliability of the maglev vehicle-bridge system by comparing the calculation results when a single controller parameter is considered as a random variable versus when all controller parameters are considered as random variables. The vehicle-bridge system model used in this section features a five-car vehicle model and a simply supported beam bridge with 20 spans. The parameters of these models are consistent with the values provided in ASM-PDEM validation. The PDF curves for the EEV of the dynamic response under different random controller parameters are shown in Figure 13, where the legends “ PDFs of the EEV for the dynamic responses of the maglev vehicle-bridge system: (a) vertical and (b) lateral displacements of the midpoint of the bridge girder; (c) vertical and (d) lateral accelerations of the midpoint of the bridge girder; (e) vertical and (f) lateral accelerations of the car body (Legend:  ).
).
From Figure 13, it can also be seen that if we assume that the controller parameters are normally distributed random variables, the PDF curve for the EEV of the lateral vibration response approximates a normal distribution, while that for the vertical vibration response differs significantly from a normal distribution. This indicates that the relationship between the lateral vibration response and the controller parameters is approximately linear, whereas the relationship between the vertical vibration response and the controller parameters is nonlinear.
Figure 14 shows the dynamic response limits of the maglev vehicle-bridge system for different values of the failure probability. In terms of the vertical displacement and acceleration of the midpoint of the bridge girder, it can be seen that the dynamic response limits obtained by considering only Dynamic response limits of the maglev vehicle-bridge system corresponding to different failure probabilities: (a) vertical and (b) lateral displacements of the midpoint of the bridge girder; (c) vertical and (d) lateral accelerations of the midpoint of the bridge girder; (e) vertical and (f) lateral accelerations of the car body (Legend:  ).
).
Effects of the coefficient of variation for controller parameters
In this section, we consider the four controller parameters as random variables that follow a normal distribution and investigate the influence of the coefficient of variation of these variables on the dynamic reliability of the maglev vehicle-bridge system. It is assumed that the coefficient of variation of the controller parameters increases from 0.04 to 0.14, with an interval of 0.02, while the remaining calculation parameters of the vehicle-bridge system are the same as those in ASM-PDEM validation. Figure 15 shows the PDF curves for the EEV of the dynamic response for a varying coefficient of variation of the controller parameters. From Figure 15, it can be seen that as the coefficient of variation increases, the distribution range of the PDF curve becomes wider, indicating that the discreteness of the dynamic response of the maglev vehicle-bridge system increases with that of the control parameters. Additionally, Figure 15 illustrates that when the coefficient of variation is small, the PDF curve approximates a normal distribution. However, as the coefficient of variation increases, the shape of the PDF deviates increasingly from the normal distribution. These findings indicate that the nonlinear relationship between the system’s dynamic response and the controller parameters becomes more pronounced as the variability of the controller parameters grows. Furthermore, it is important to note that when the coefficient of variation is low, the PDF distribution for the EEV of the car body’s vertical acceleration is very concentrated. As the coefficient of variation increases to a certain level, sporadic distributions emerge far from the mean value, indicating a significant increase in the discreteness of the EEV. These results underscore the importance of being cautious when selecting controller parameters randomly, as doing so without theoretical or empirical backing may result in abnormal dynamic responses of the maglev vehicle-bridge system. PDFs for the EEV of the dynamic responses of the maglev vehicle-bridge system for varying values of the coefficient of variation of the controller parameters: (a) vertical and (b) lateral displacements of the midpoint of the bridge girder; (c) vertical and (d) lateral accelerations of the midpoint of the bridge girder; (e) vertical and (f) lateral accelerations of the car body (Legend:  ).
).
Figure 16 Illustrates the variation in the dynamic response limits of the maglev vehicle-bridge system with respect to the coefficient of variation, for various failure probability values. In most instances, the dynamic response limits associated with the same failure probability increase as the coefficient of variation of the controller parameters increases. This trend is attributed to the fact that an increase in the coefficient of variation leads to greater variability in the system’s dynamic response. It is also important to observe that some curves exhibit a decrease with an increase in the coefficient of variation, as seen in the limits of the vertical acceleration at the midpoint of the bridge girder under different failure probabilities. This phenomenon occurs because the tail of the PDF curve (the higher side) does not lengthen in proportion to the increase in the coefficient of variation. Additionally, Figure 16 reveals that in most cases, as the coefficient of variation increases, the disparity between the dynamic response limits for the three considered failure probabilities also gradually widens. This observation serves as an indirect indicator that the variability of the dynamic response escalates with the coefficient of variation. It underscores the importance of judicious selection of controller parameter values for the suspension system, as such selections can significantly mitigate the vibration levels within the maglev vehicle-bridge system. Variation in the dynamic response limits of the maglev vehicle-bridge system with the coefficient of variation obtained for different values of failure probability: (a) vertical and (b) lateral displacements of the midpoint of the bridge girder; (c) vertical and (d) lateral accelerations of the midpoint of the bridge girder; (e) vertical and (f) lateral accelerations of the car body (Legend:  ).
).
Conclusions
(1) A comparison with on-site measurement results shows that the coupled vibration model of the high-speed maglev vehicle and bridge, established in this study based on multi-body dynamics and the finite element method, can effectively simulate the dynamic performance of real systems. (2) The advantage of the adaptive surrogate model is that it can reasonably determine the positions of sample points based on the fluctuations in the response surface; that is, areas with strong nonlinearity have a denser distribution of sample points. The training efficiency and accuracy of the surrogate model can be significantly improved in this way. From a comparison with MCM and OSM-PDEM, we confirm that the proposed ASM-PDEM can significantly improve the accuracy of dynamic reliability calculation with the same number of training samples. (3) The discreteness of the dynamic response of the maglev vehicle-bridge system increases with that of the control parameters. The vertical response of the system is mainly affected by (4) As the coefficient of variation of the controller parameter increases, the nonlinear relationship between the system’s dynamic response and the control parameters becomes more apparent. A reasonable selection of values for the suspension system control parameters can effectively reduce the vibration of the maglev-bridge system.
Footnotes
Declaration of conflicting interests
The author(s) declared no potential conflicts of interest with respect to the research, authorship, and/or publication of this article.
Funding
The author(s) disclosed receipt of the following financial support for the research, authorship, and/or publication of this article: This work was supported by the National Natural Science Foundation of China (Grant Nos. 52208459 and 52178452), the China Postdoctoral Science Foundation (Grant No. 2022M723004), the Natural Science Foundation of Hunan Province (Grant 2024JJ2002), the Scientific Research Fund of Hunan Provincial Education Department (Grant No. 23B0312), and the Postgraduate Scientific Research Innovation Project of Changsha University of Science and Technology (Grant No. CSLGCX23142).
Appendix
Main parameters of the guideway bridge model.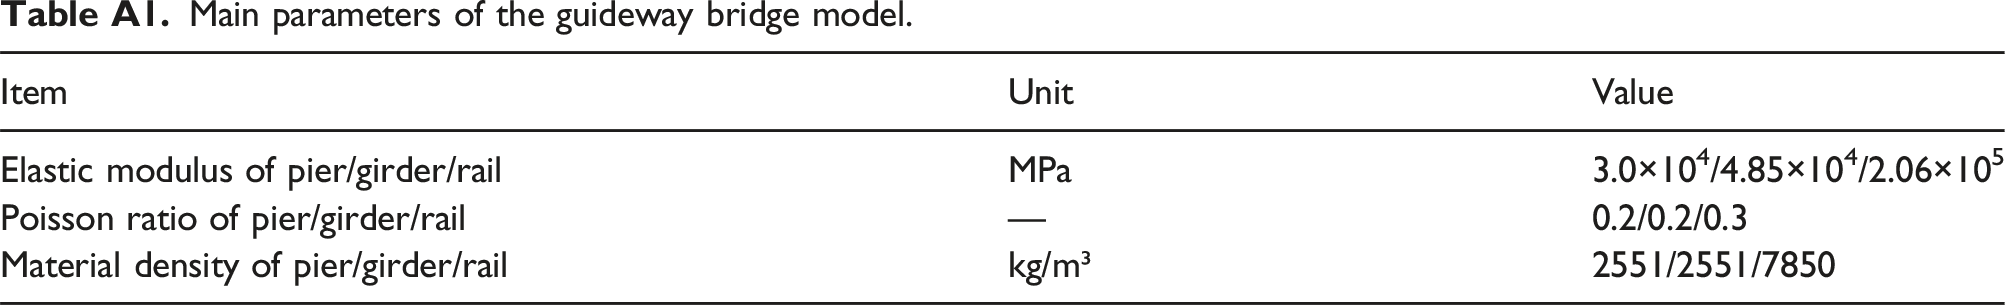
Item
Unit
Value
Elastic modulus of pier/girder/rail
MPa
3.0×10⁴/4.85×104/2.06×105
Poisson ratio of pier/girder/rail
—
0.2/0.2/0.3
Material density of pier/girder/rail
kg/m³
2551/2551/7850