
Abstract
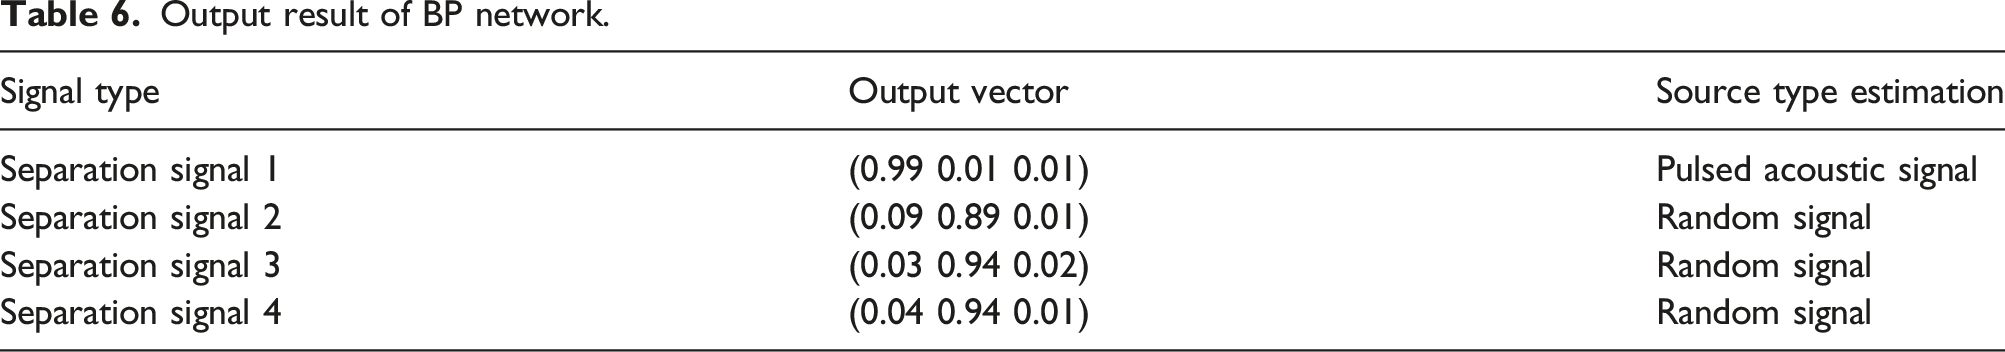
The extraction of weak acoustic signals under strong background noise is of great significance in the applications of target identification and localization. In this paper, the pulse signal with high randomness is set as the weak signal sound source, random noise and sine sound are used as the background noise. Under the condition of a signal-to-noise ratio of −20 dB, combined with blind source separation and neural network methods, the collected observation signals are subjected to weak sound signal separation and recognition research. The optimization method of centralization and scaling processing is used to eliminate the unfavorable influence of the uncertainty of the separated signal amplitude caused by the blind source separation method on the pattern recognition. The recognition result is verified by the combination of “weak impulse acoustic signal” and “random noise signal,” and the output vector (0.99 0.01 0.01) approaches (1 0 0), which is recognized as impulse acoustic signal. By combining blind source separation and neural network methods, the separation and identification of weak pulse signals under the condition of a signal-to-noise ratio of −20 dB can be achieved.
Keywords
Introduction
A weak signal is one that is obscured by background noise and difficult to display, but is extremely weak and useful. “Weak” here does not simply mean that the amplitude of the signal is small, but that the amplitude of the weak acoustic signal of interest is smaller than the background noise compared to the surrounding noise. The search and rescue of personnel in emergency rescue, fault diagnosis in engineering, precision processing and manufacturing, chemical reaction and biomedical research analysis, EEG monitoring, etc. are all related to the collection and measurement of dynamic signals such as weak sound, light, magnetism, electricity, vibration, pressure, etc. For cabin noise or some equipment noise, it belongs to weak signal in terms of energy comparison of sound wave. Therefore, the separation technology of weak acoustic signals under strong background noise has important engineering application value. The excitation of noise source on offshore platform is usually large. At present, there are many separation methods for weak acoustic signals under strong background noise, such as lock amplification method, sampling integration and digital averaging method, empirical mode decomposition method (EMD), blind source separation method, etc, but there are some limiting factors in the application. Maximiliano Osvaldo et al. 1 demonstrated that the locking amplifier method can be used to measure signals with multiple excitation frequencies, but its application to signals with the same frequency interference and high-frequency band is limited. Peng Yu 2 et al. constructed a lock-in amplifier for CSR beam diagnosis and applied it to a beam diagnosis system. The lock amplification method mainly uses the modulation amplification method to suppress noise, so the lock amplification method has limited application to the same frequency interference and high-frequency signal applications, and there are phase error and calculation stability problems. Sun Ziqiang et al. 3 used the sampling integral method to analyze the early fault signal detection of gear box, effectively improving the low signal-to-noise ratio, but this method is only applicable to periodic signals. The limit of sampling integration and digital averaging is that the higher the signal-to-noise ratio obtained, the greater the number of cycles and is suitable for the detection of periodic signals. Xing Lihua et al. 4 proposed an empirical mode decomposition method (EMD) to decompose the instantaneous diesel engine vibration signal into each intrinsic mode function component (IMF) and reconstruct the signal to eliminate noise interference. When the empirical mode decomposition method is used, mode overlap will occur when the excitation frequencies of various sound sources are similar, and different IMF decomposition forms are selected to correspond to different results. In order to achieve better separation effect, it is necessary to have some prior knowledge of signal sources. Yang Hui et al. 5 used the Duffing oscillator equation to separate weak sinusoidal signals with different frequencies under strong background noise. In weak signal detection based on a Duffing oscillator, it is usually assumed that the frequency is known, but this is not always the case.
The blind source separation method can avoid the interference of the above limiting factors, considering that the type of weak signal source is not restricted and the characteristics of “total blindness” are realized. In 1991, J. Herault and C. Jutten proposed the Independent Component Analysis Method (ICA), which realizes the separation of sound sources after mixing two independent source signals, 6 which is a blind source separation method based on the independence of the source signal. ICA technology has made the blind source separation method well developed in the practical application of engineering, and has been widely developed in some engineering fields, and the practical application is high. There are also practical engineering examples of blind source separation methods, such as Ypma’s proposal for a new method of signal separation using time correlation, which can decompose multichannel vibration data into harmonic activities related to faults. 7 Based on the manual data, the algorithm performance of parameter setting was studied, and the second-order ICA algorithm and feature extraction method were compared with other machine vibration ICA algorithms and feature extraction methods using the vibration data of a submersible pump. Gelle et al. 8 analyzed the vibration acceleration signals of two motors on the same bench by applying blind source separation method to the vibration analysis of rotary motors. Gu Jiang et al. 9 proposed a signal denoising method based on ICA, aiming at the problem that acoustic emission signals are relatively weak and the actual detection signals often contain strong background noise. Zhang Wen 10 introduced sparse orthogonal joint constraint and DOA-based initialization method to improve the acoustic signal separation performance through simulation verification of helicopter sound source data. Yang Song, 11 according to the difference in the correlation between the adjacent frequency points of the same and different underwater acoustic signals, realizes the adjustment of blind source separation order of underwater acoustic signals, and generalizes from two sources to multiple sources. But the blind source method has the problem of amplitude uncertainty and sequencing uncertainty. In addition, the signal-to-noise ratio of 20 dB is the limit for engineering applications. At present, there are few researches on how to process the separation signals obtained by blind source separation.
Artificial neural networks are composed of neurons with simple structure and simple functions, and neurons are connected to each other to form a network to achieve certain functions. The research of artificial neural networks originated at the end of the 19th century, which originated from many interdisciplinary studies such as physics, psychology, and biology. In 1943, Warren and Walter Pitts theoretically proved that artificial neural networks could calculate any arithmetic and logical functions, and they also proposed the mathematical model of M.P artificial neurons, which opened the curtain on the field of industrial neural networks for all scholars. 12 Huang Liangpei et al. applied wavelet packet analysis and BP neural network to rolling bearing failure mode recognition, and identified the fault type of rolling bearing through BP neural network]. 13 Shi Chao et al. used the motorcycle engine as the research object to establish the corresponding BP neural network to classify several abnormal noise types, and realized pattern recognition to further determine the fault type. 14 This paper uses the wide application of BP neural network in pattern recognition to perform pattern recognition on the data obtained after blind source separation.
This article from the perspective of aeroacoustics experimental test of weak signals, on the premise of without any prior knowledge, based on the data of three kinds of sound source separation test, using the method of blind source separation, the separation results are certain optimization, combined with BP neural network. A process of separation and recognition of weak sound signal is formed, which can be applied to the detection and recognition of weak sound signal.
Blind source separation algorithm
Basic theory of blind source separation method
Blind source separation method refers to a signal processing method to predict the source signal only by observing the observed signal of the sensor under the condition that the mixed channel parameters of each source signal and observation matrix cannot be obtained in advance. From a mathematical point of view, blind source separation algorithm is able to observe a series of mixed signals and separate mixed signals, the relationship between the source signal and the observed signal can be expressed as formula (1)
15
by using mathematical formula:


It can be seen from
Steps of acoustic signal separation algorithm
(1) The acoustic observation signal X is treated with centralization and whitening, and the observation signal Z after whitening is obtained; (2) Randomly select the initial vector 0w; (3) Taking kurtosis as the cost function, a fast fixed point cycle algorithm based on kurtosis is established8–10; (4) In order to ensure that the acoustic separation signals extracted each time are unextracted signals, a step of successive orthodontic step must be added before the repeated step (3) to remove the extracted components. (5) The separation matrix (6) The separation matrix
Numerical analysis
Numerical analysis of single interference noise source model
When the weak acoustic signal source is established, a time signal Time-domain waveform of weak pulse signal source signal Time-domain waveform of random signal interference source 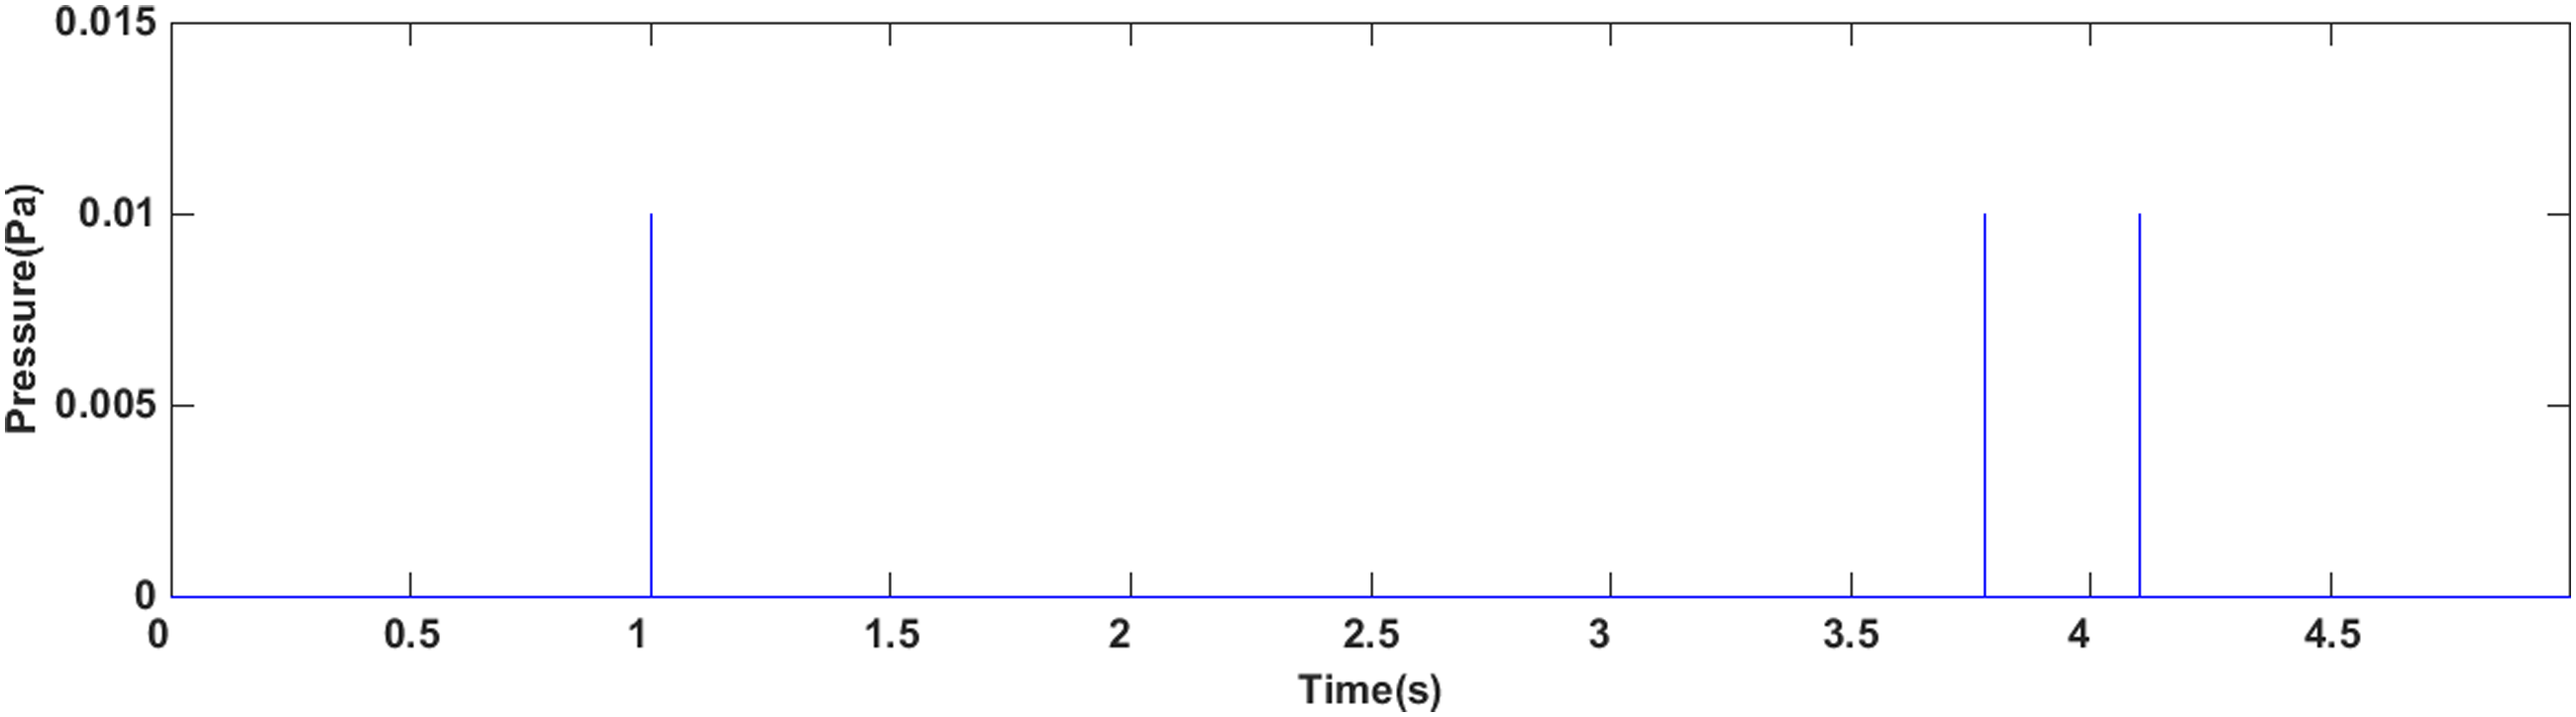
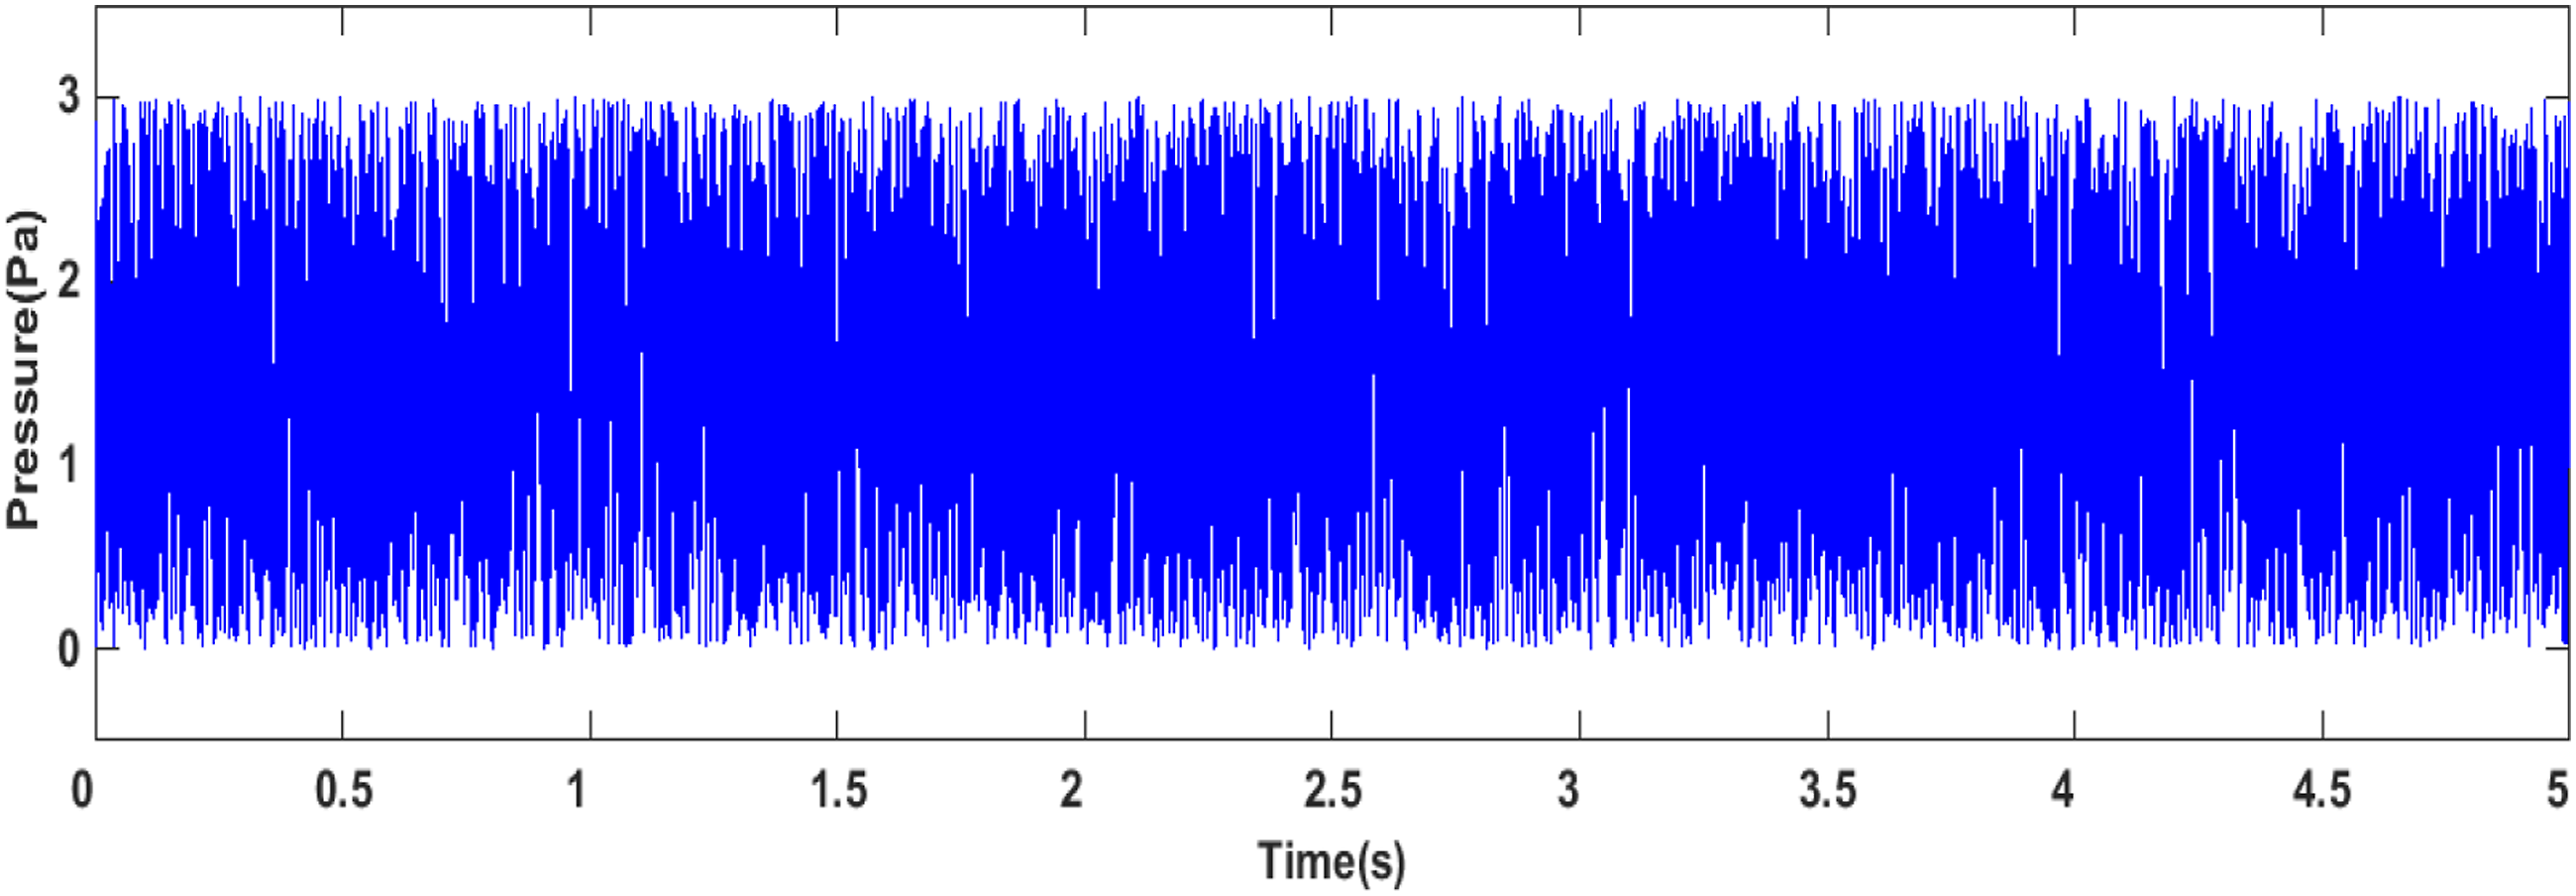
As can be seen from the above amplitude characteristics of the weak pulsed acoustic signal source and the random signal interference source, the amplitude of the weak pulsed acoustic signal differs 300 times from that of the random signal interference source, and the peak signal-to-noise ratio reaches −69 dB. Composed of signal source matrix Simulated 4-channel sensor observation signal time-domain signal.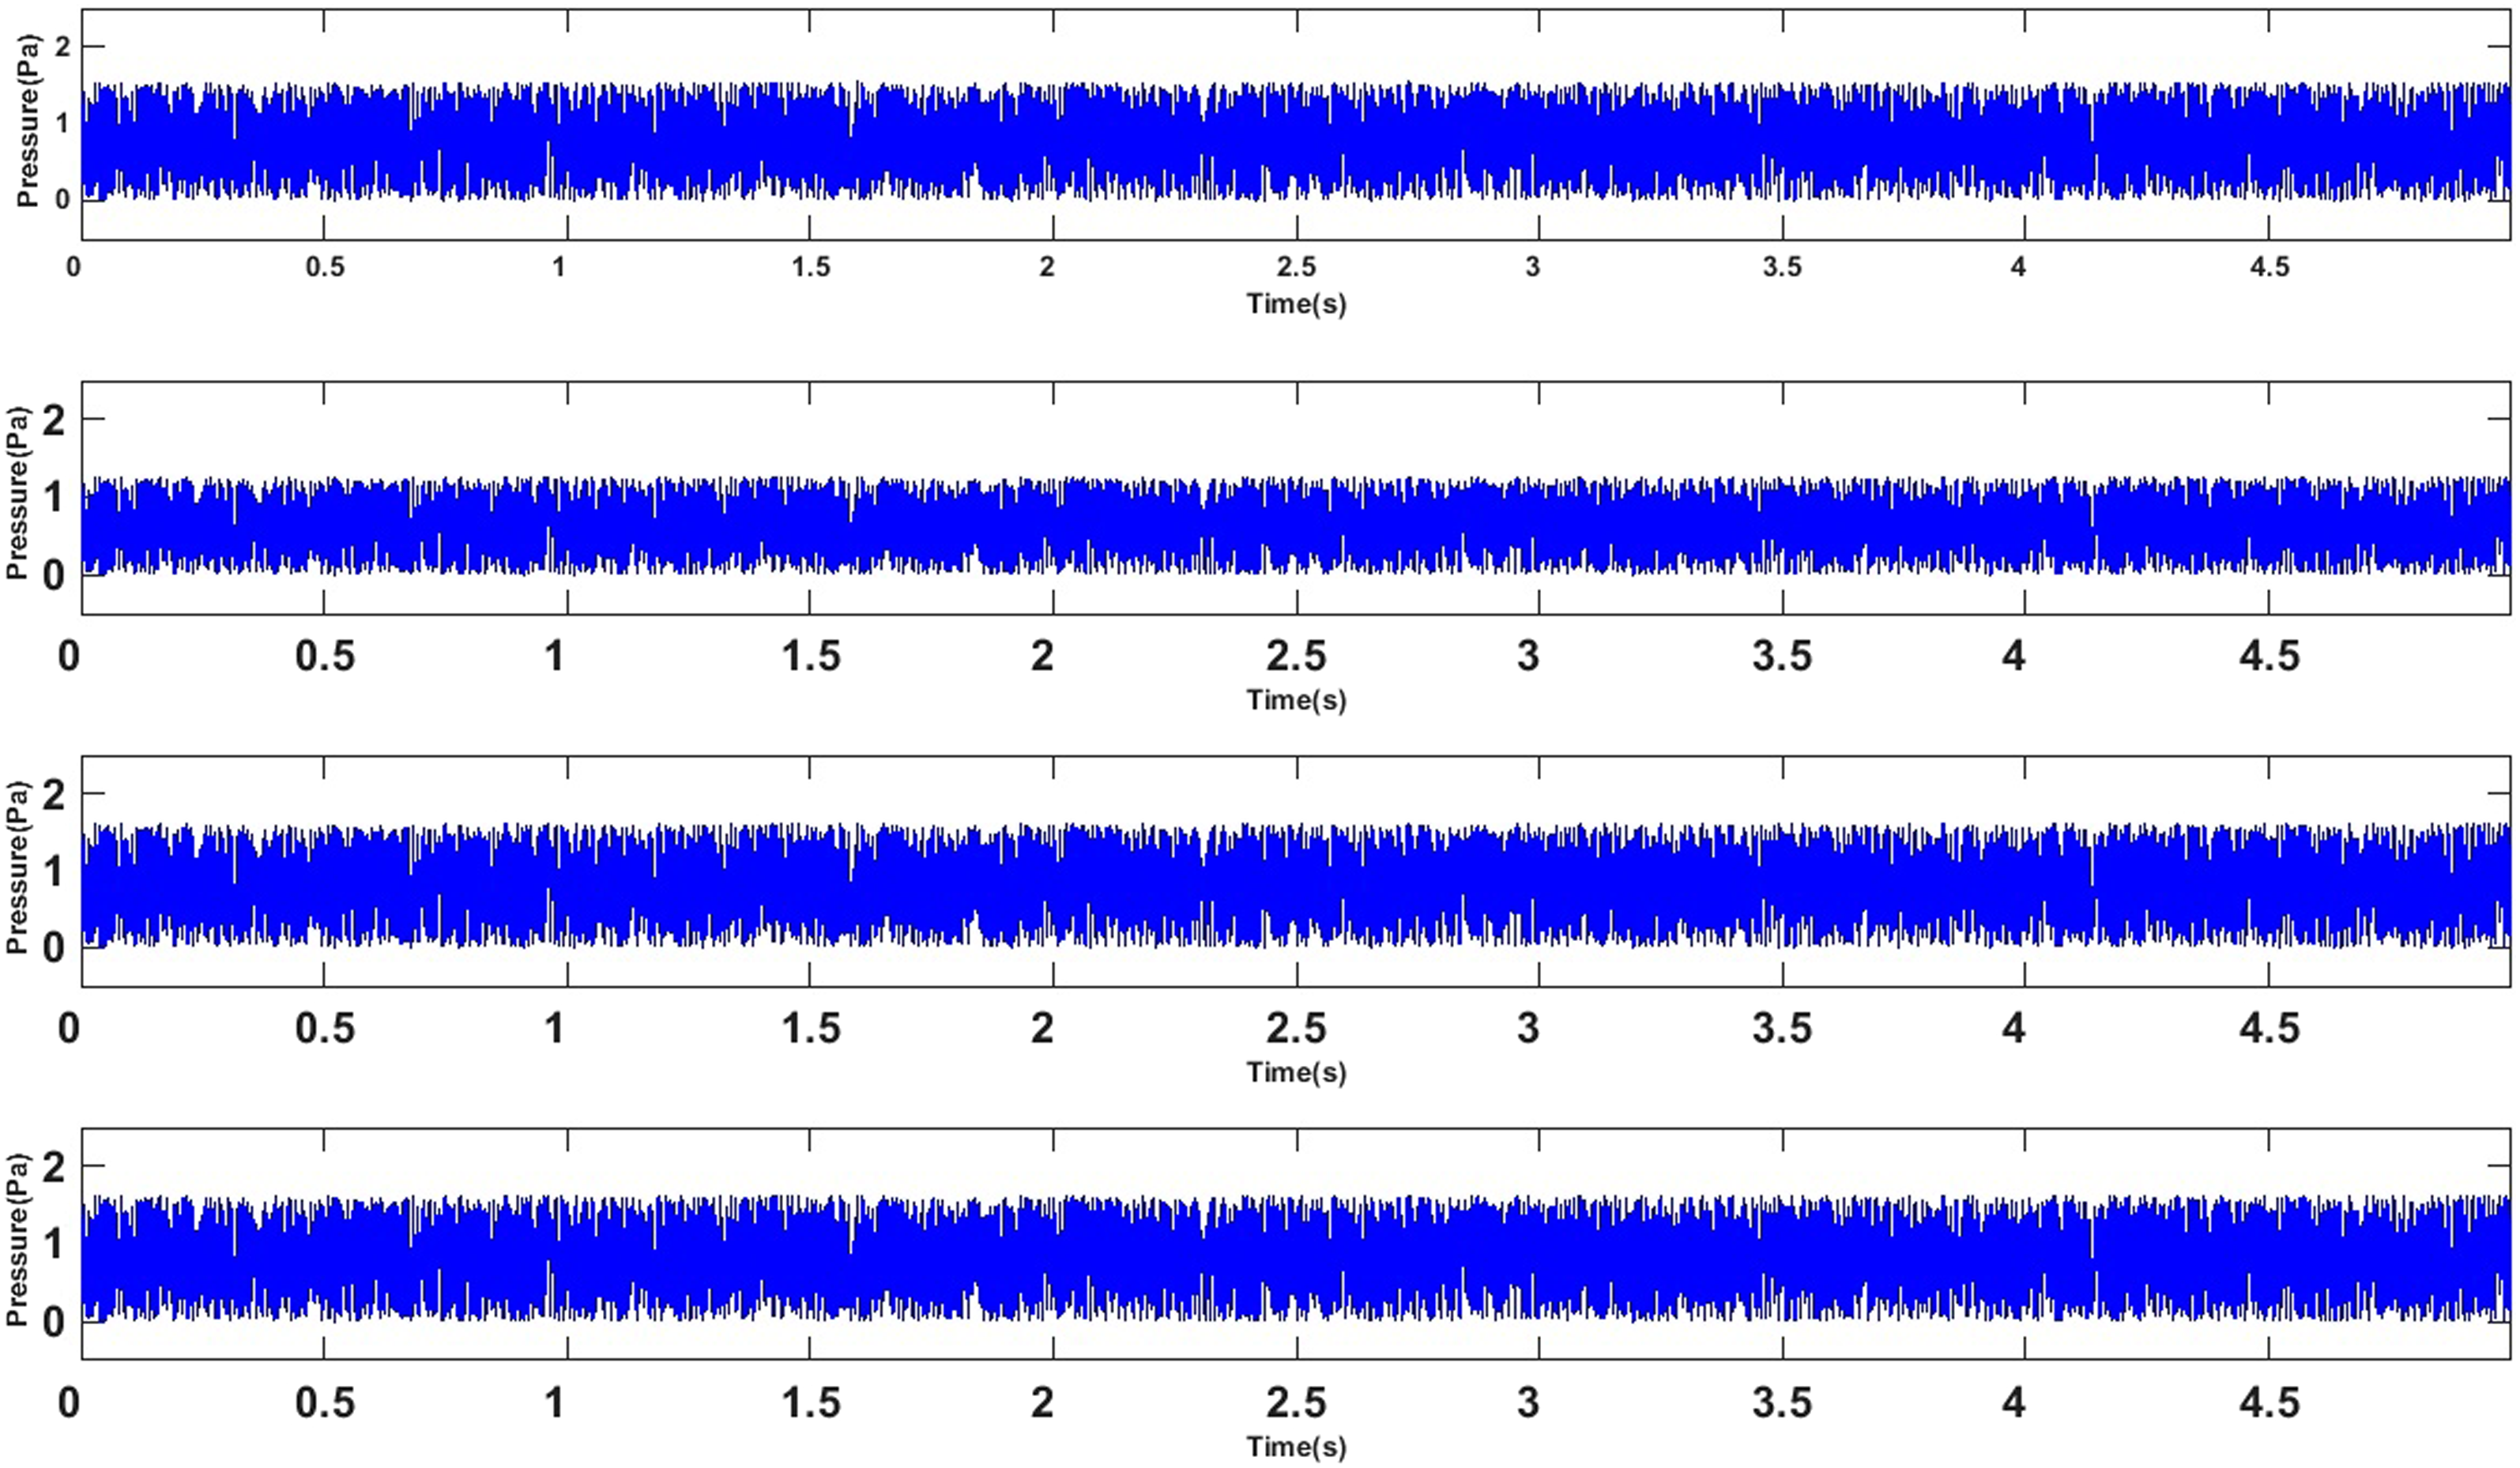

From the observed signals, it can be found that weak pulsed acoustic signals that need attention are completely buried in the background noise. Under pre-known weak acoustic source peak rigidities that should occur around 1s and 4s of time-domain signals, they are completely absent in four observed signal computation, so the time-domain characteristics of weak pulsed acoustic signals are lost. Assuming that p-1 vectors have been estimated and a matrix

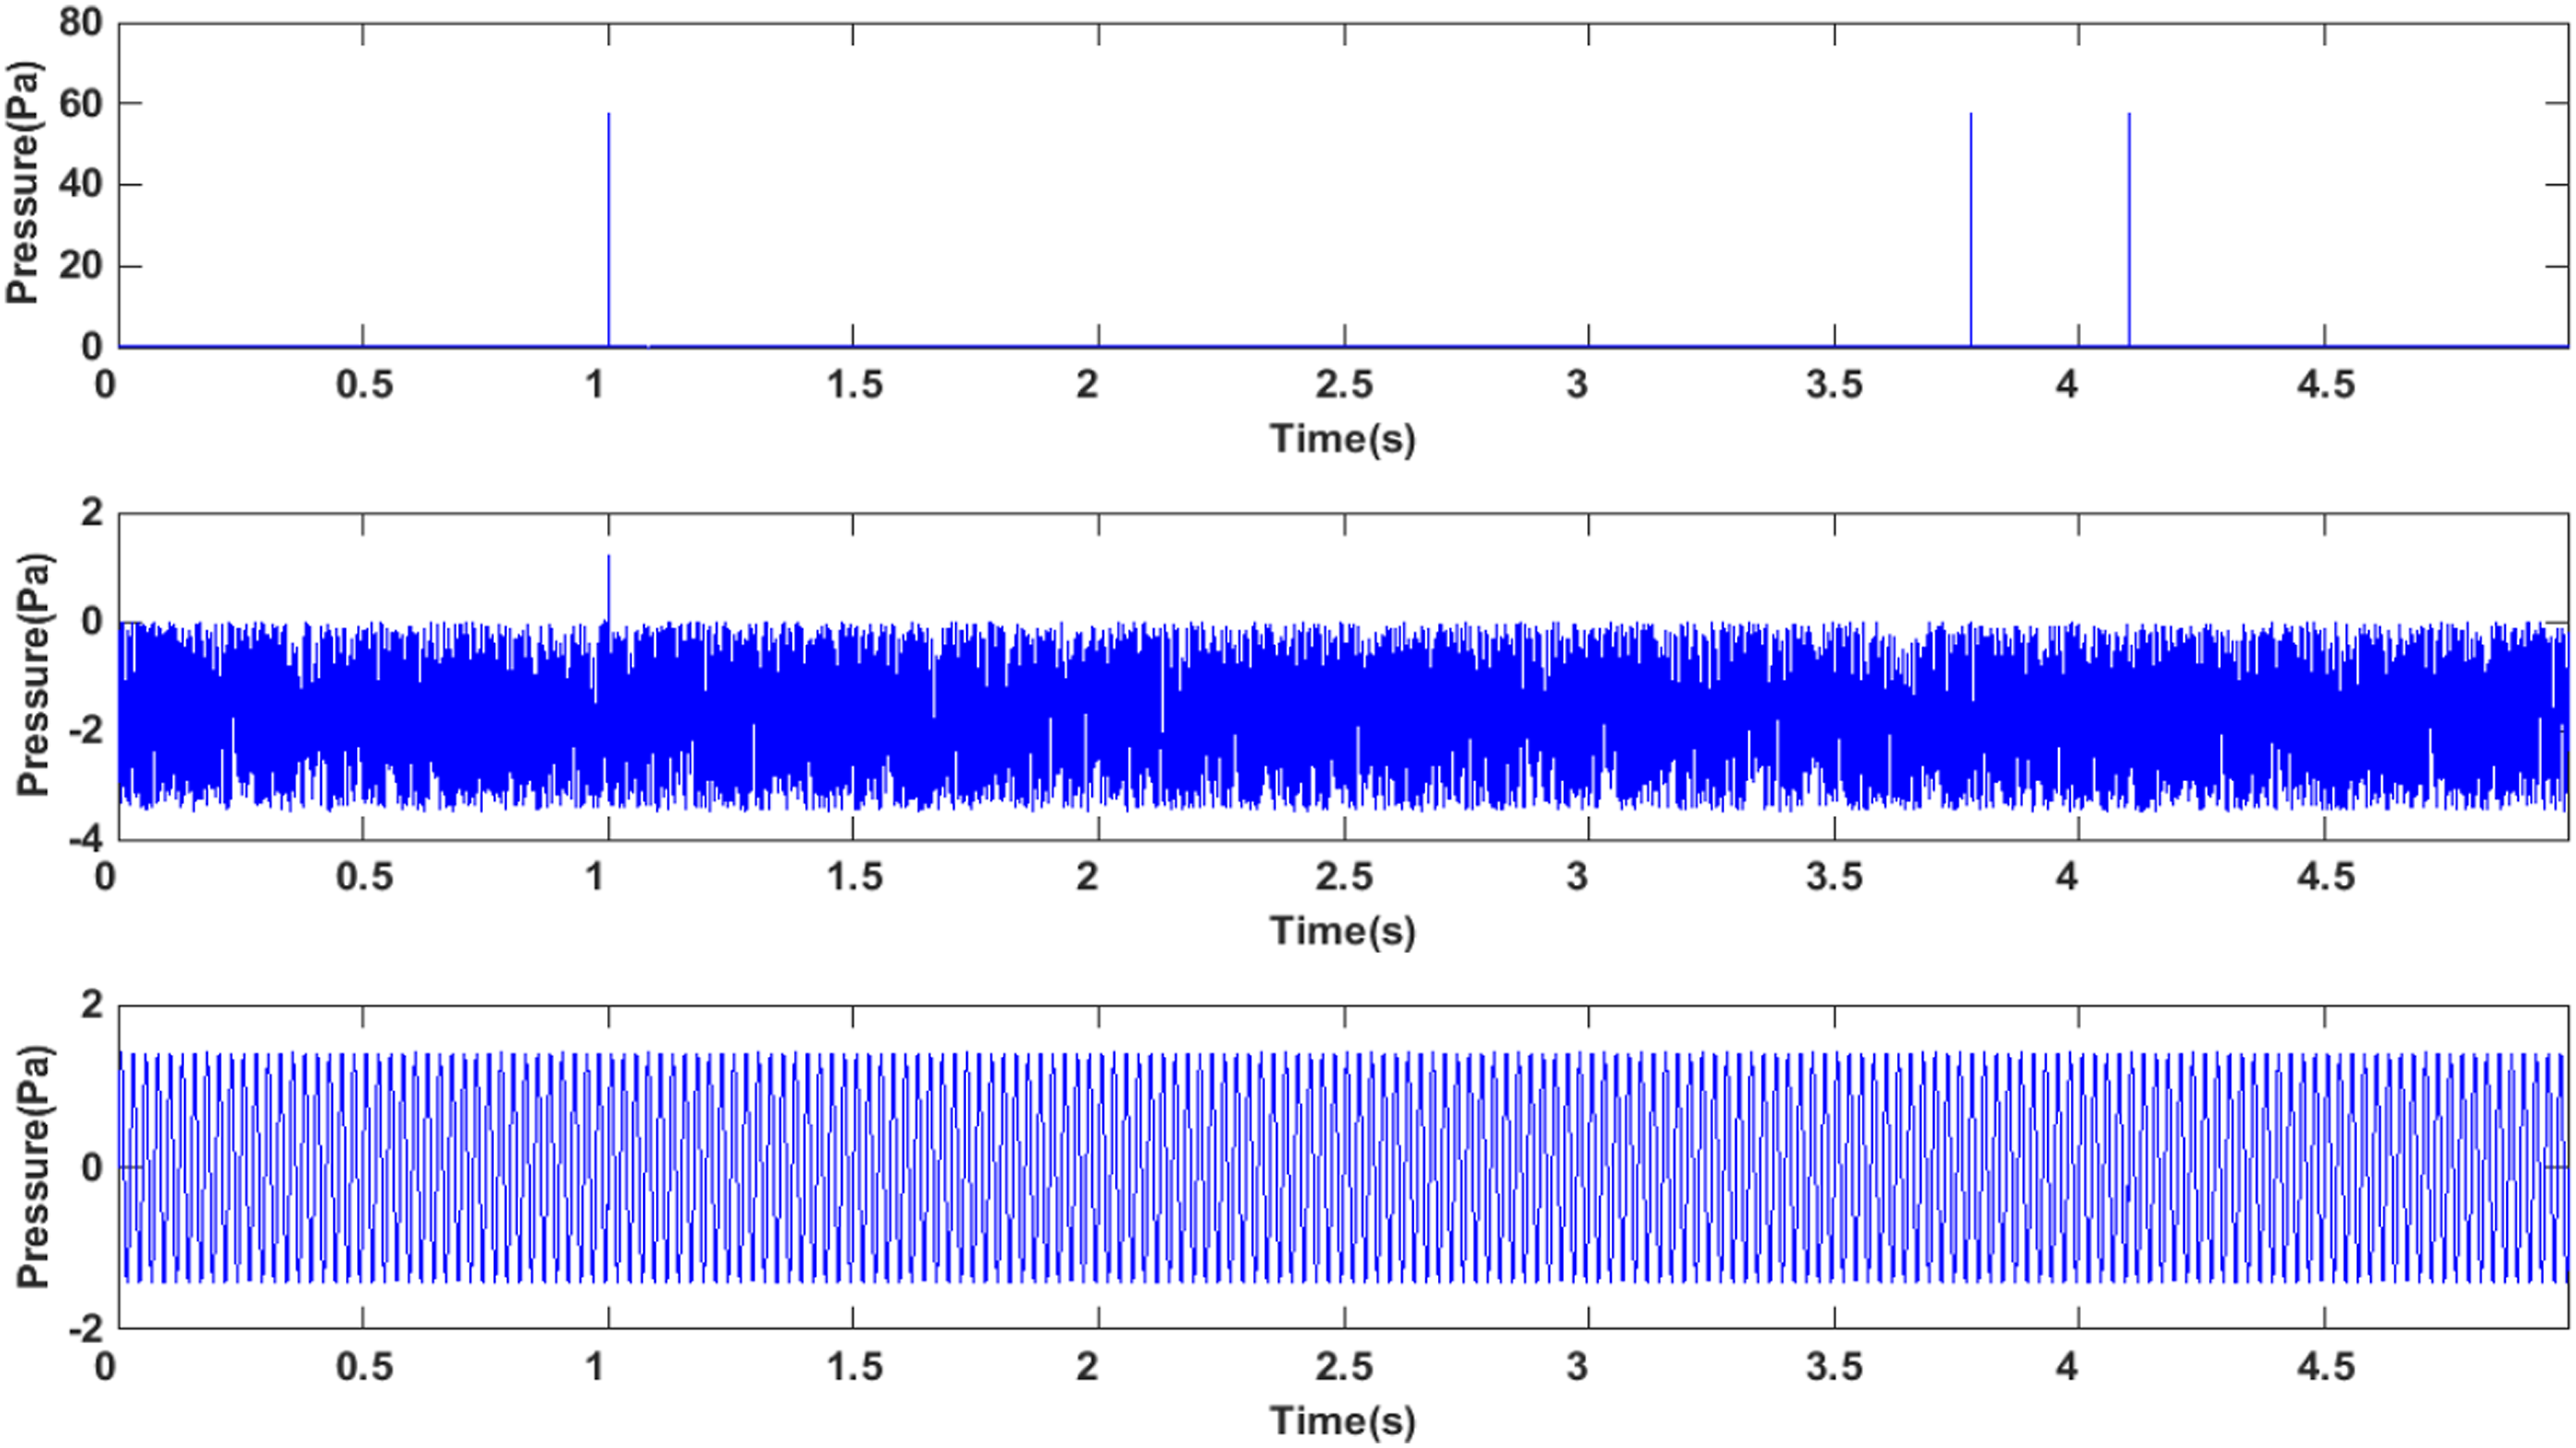
The separated signal is shown in Figure 4: Results of analog signal separation.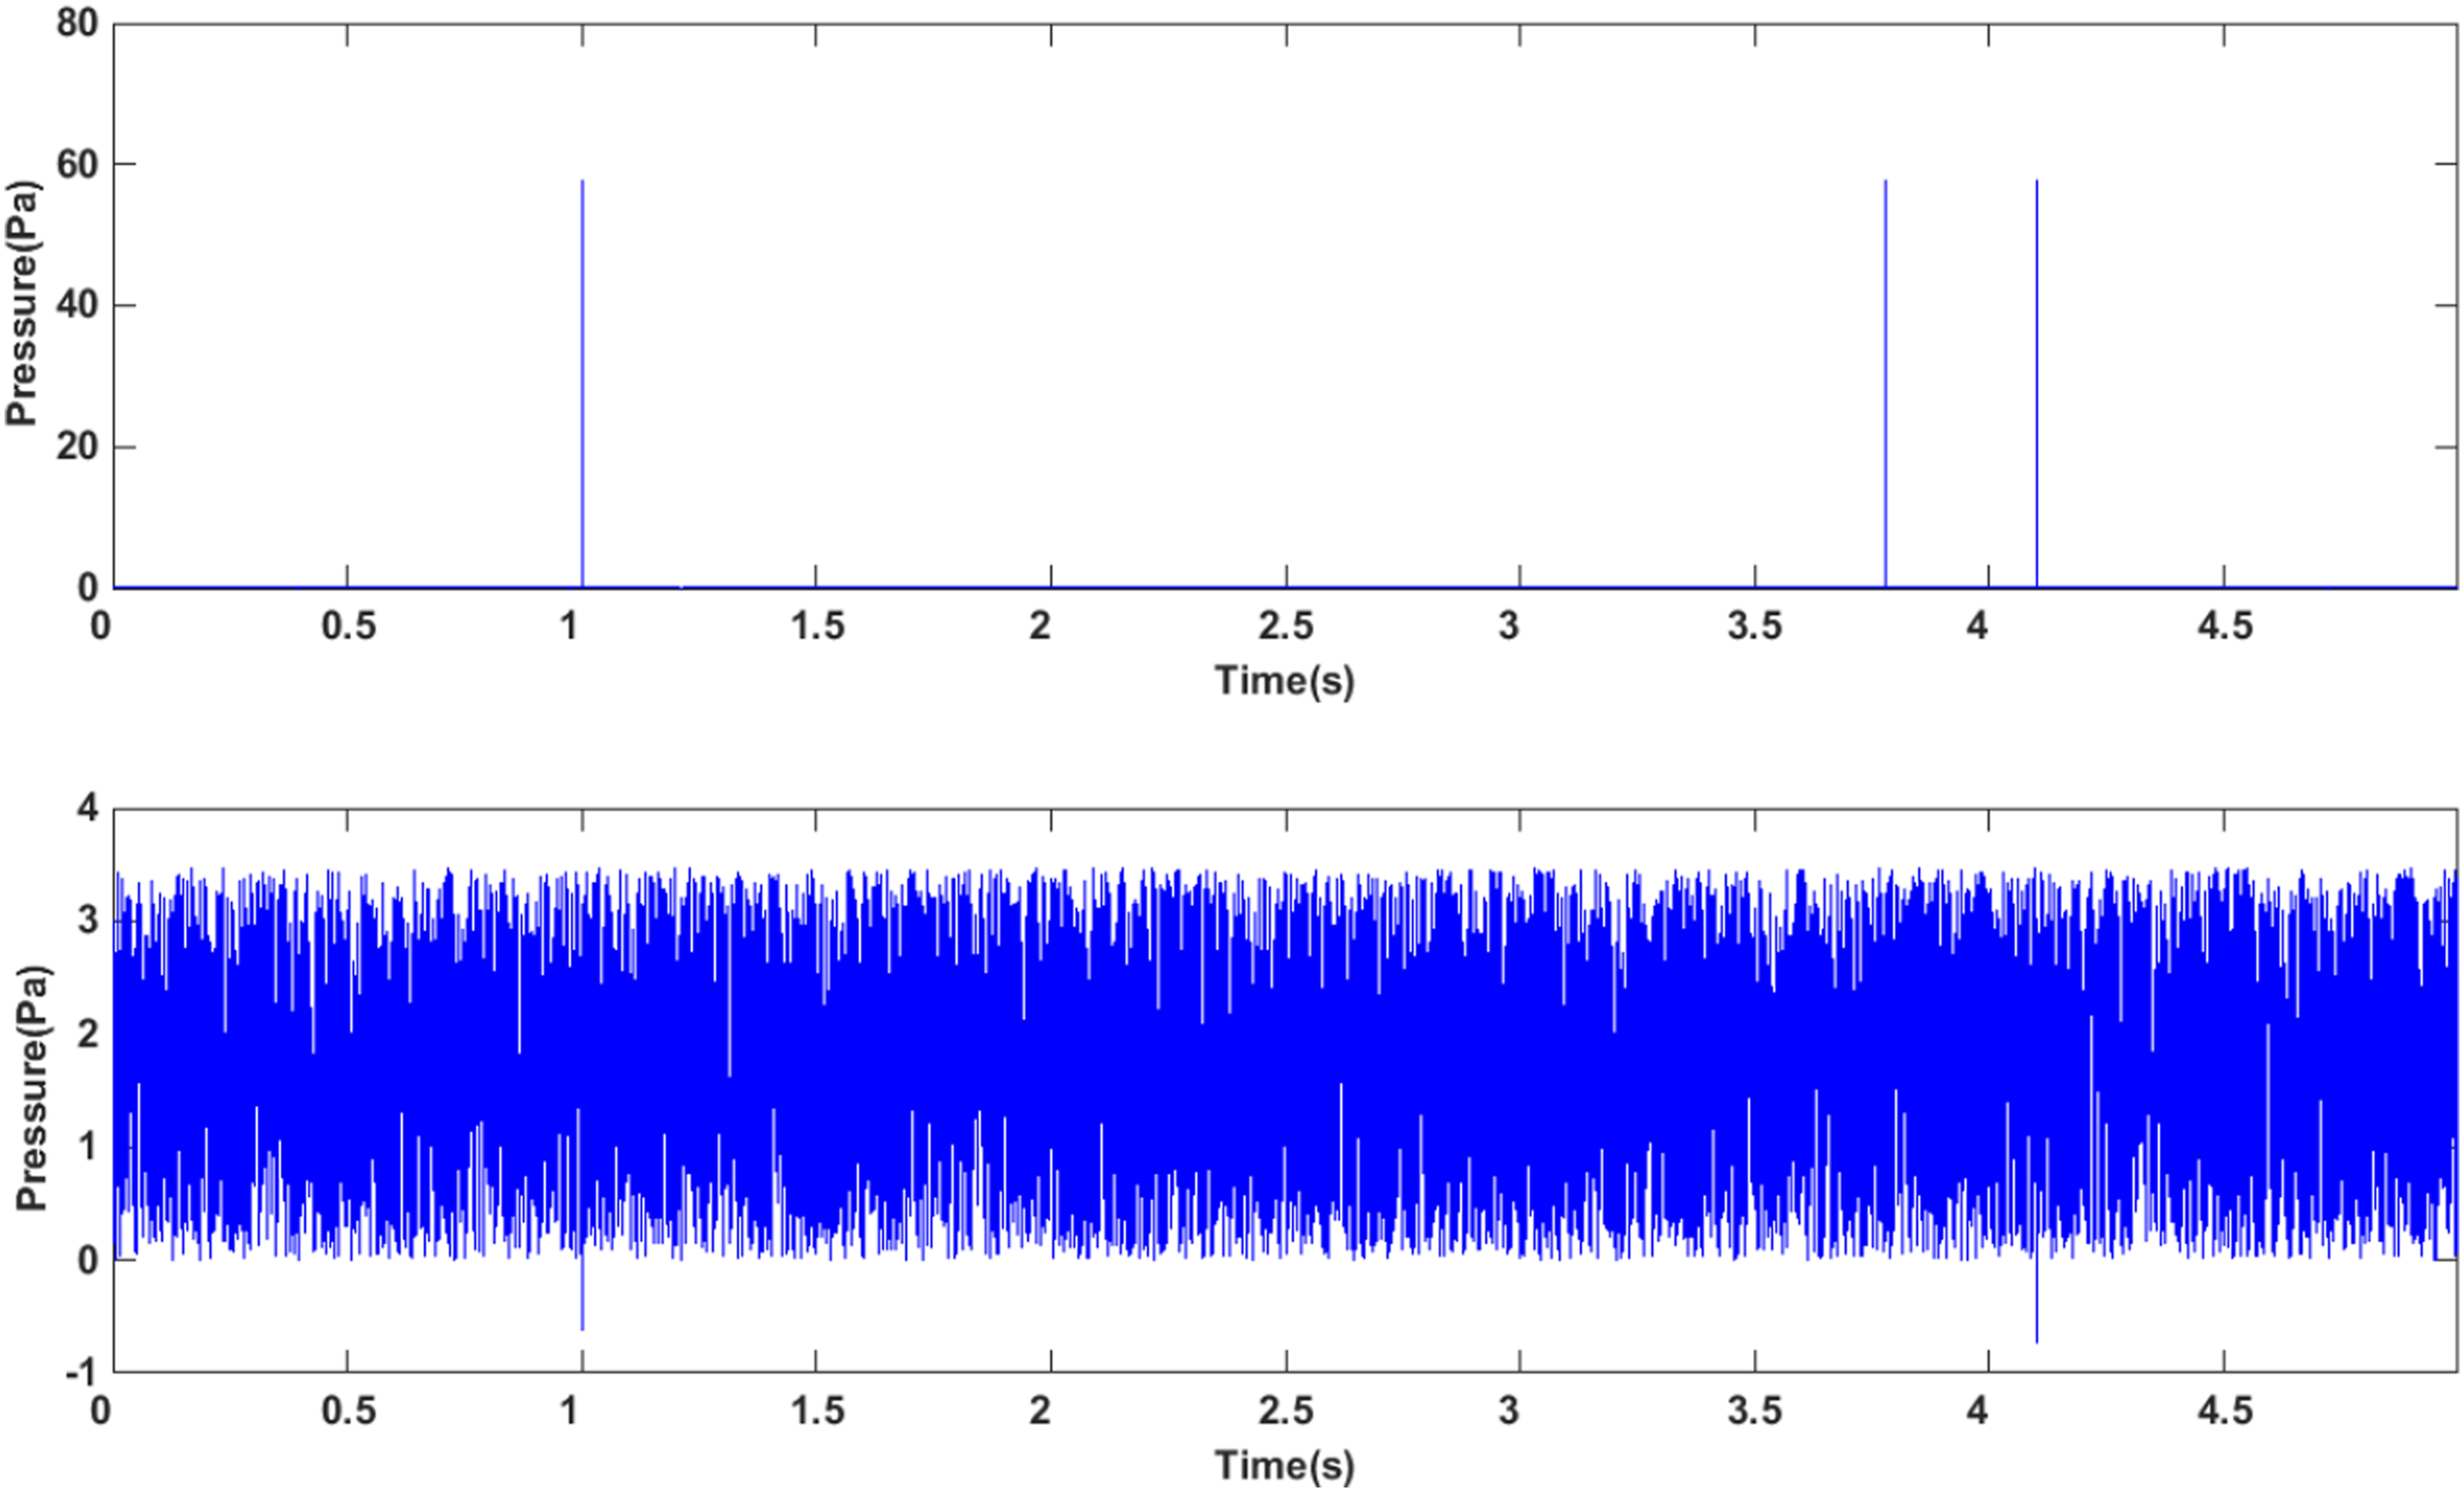
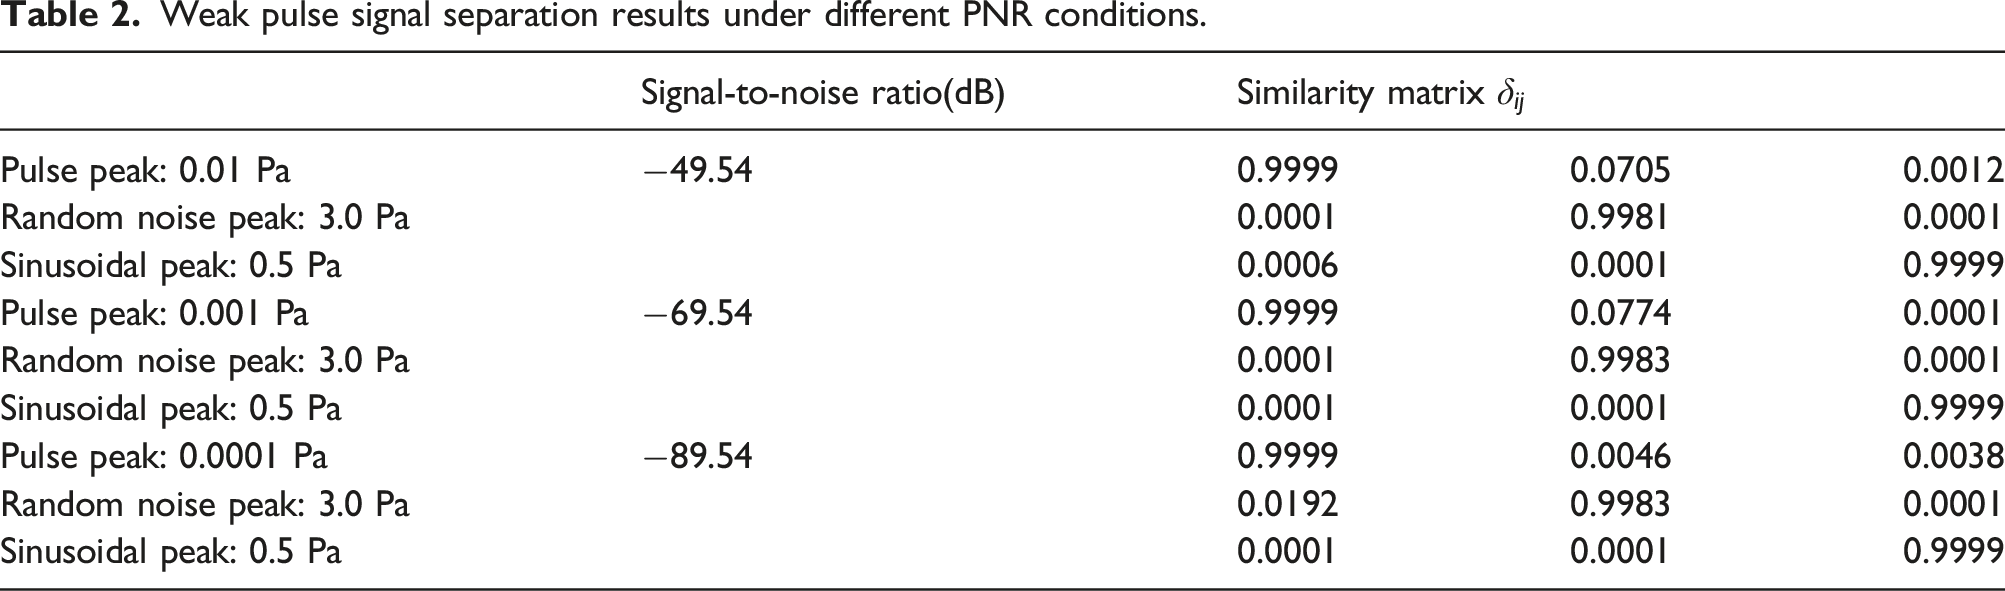
Weak pulse signal separation results under different PNR conditions.
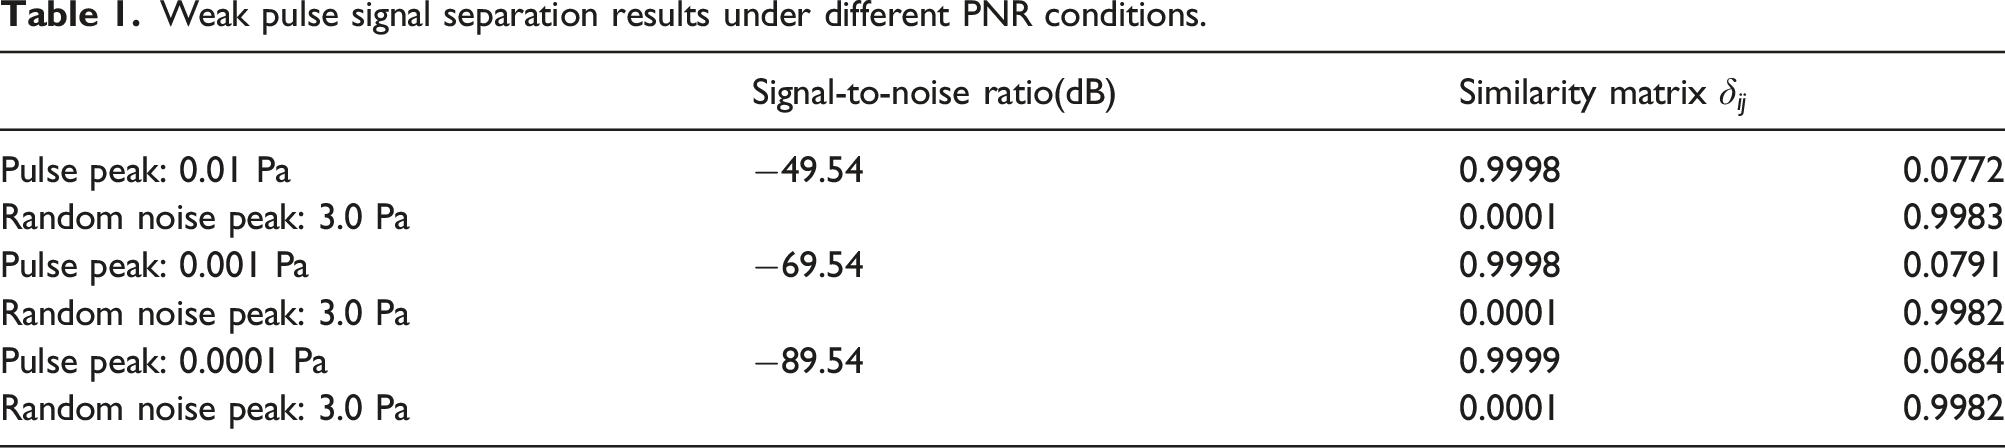
From the similarity matrix formed by the separated signal and the source signal, it can be seen that only one similarity coefficient in each row and column of the similarity matrix is close to 1, and the similarity coefficient in other positions is close to 0, indicating that the signal separation effect is better. Taking the signal separation similarity matrix obtained under the condition of signal-to-noise ratio of −49.54 dB, δ11 is close to 1 and δ12 is close to 0, indicating that the separated signal y1 is the signal estimation of the source signal s1; similarly, if δ12 is close to 1 and δ11 is close to 0, the separated signal y2 is the signal estimation of the source signal s2.
It can be seen from the above table that under the condition of random noise single interference source, when the signal-to-noise ratio reaches −89.54 dB or even lower, the weak pulse acoustic signal still has a good separation effect. The following conclusions can be drawn: Theoretically, as long as the sensor can receive the weak pulse sound signal, regardless of the background noise, the algorithm can realize the extraction of weak pulse sound signal under background noise.
Numerical analysis of dual interference noise source model
After verifying that the weak pulse acoustic signal source can be separated by algorithm under the strong single random noise interference source, a sinusoidal signal source is considered as another interference source to conduct the separation research of weak pulse acoustic signal under the condition of double interference sources. The calculation process is similar to that of a single interference source, so we will not elaborate on it and only introduce the important results. The newly added signal is a 40 Hz sinusoidal signal with 5 s duration shown in Figure 5, the amplitude of the sinusoidal signal was 0.5 Pa. 40 Hz sine signal analog signal.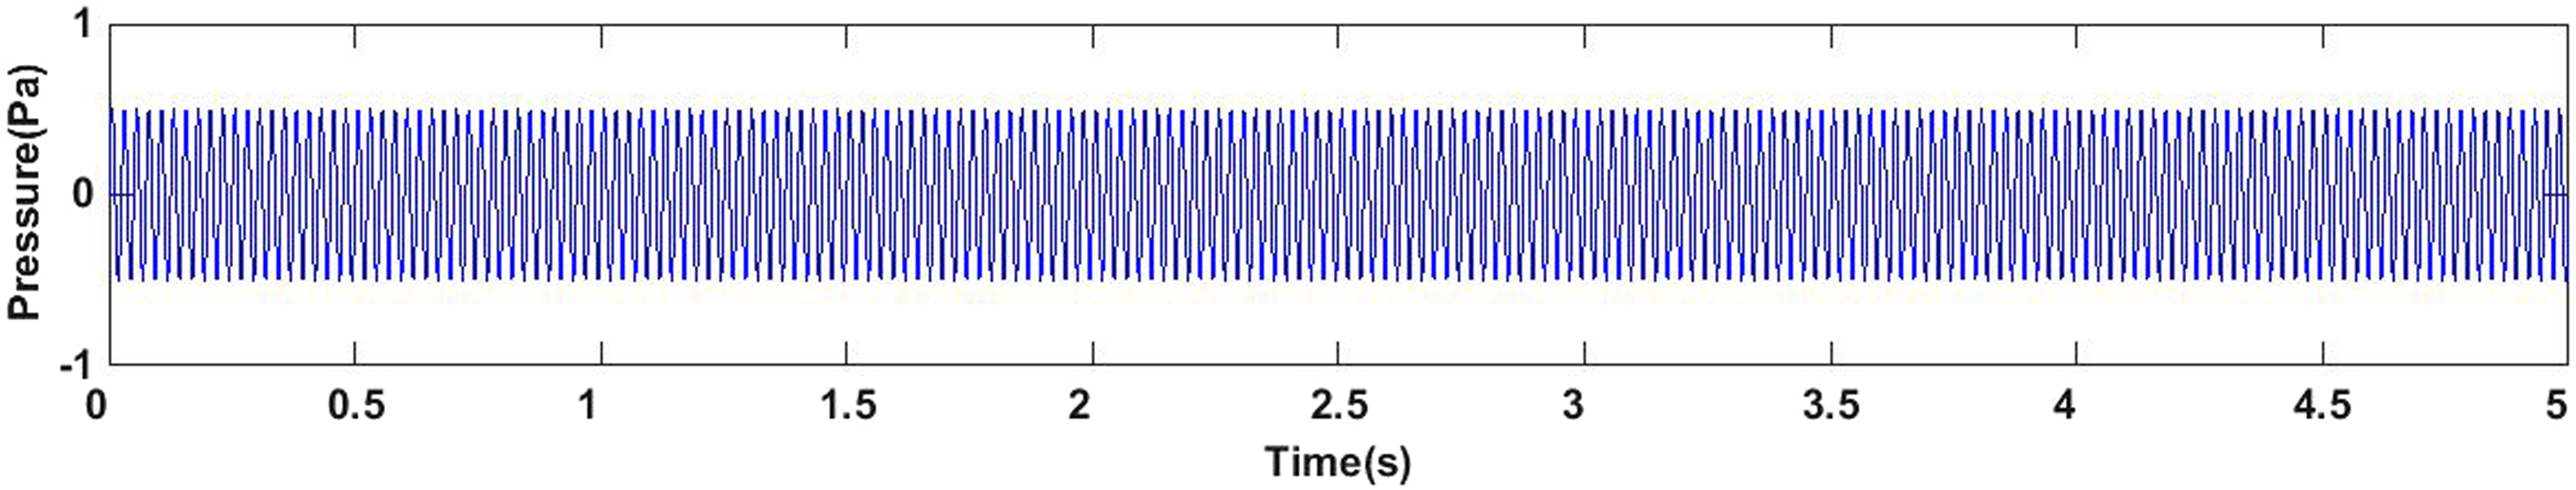
Since the dimension of the source signal is 3, a 4 × 3 random matrix is established to form the observed signal, as shown in Figure 6. The separation results are shown in Figure 7: Numerical simulation of four sensors receiving signals. Numerical simulation results of separated signal.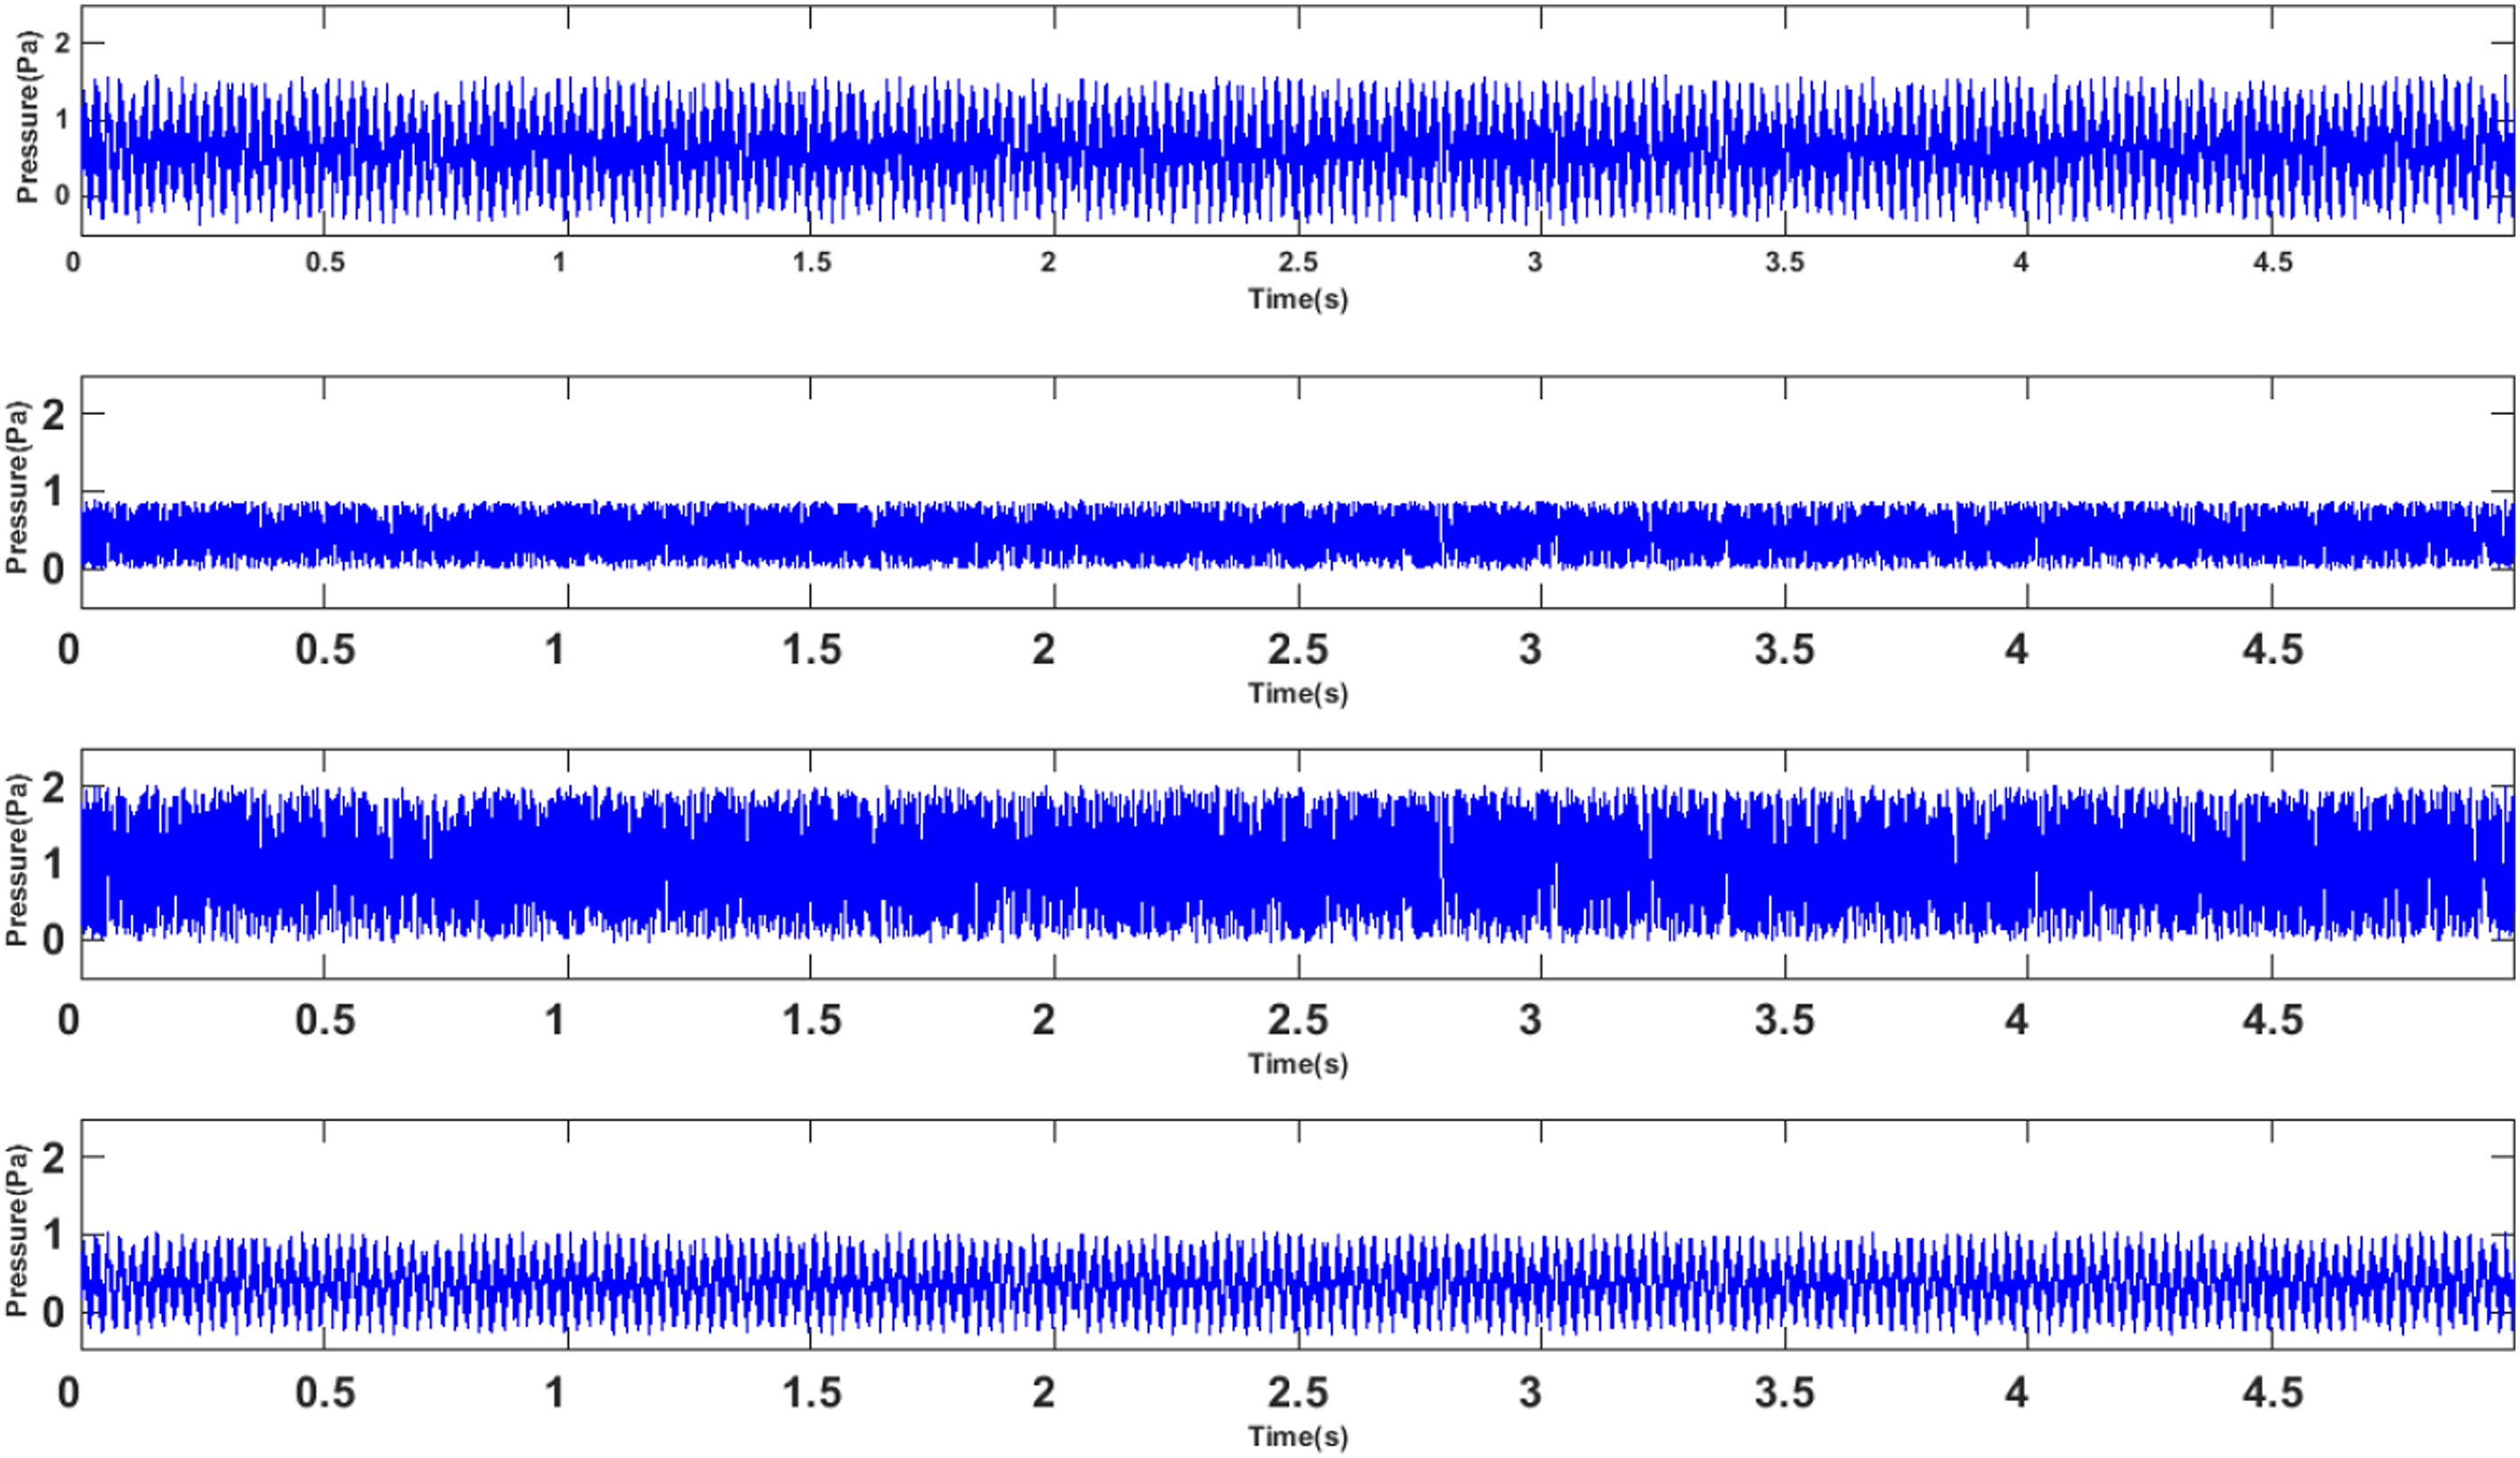
It can be seen from the numerical simulation that the separation results restore the original three source signals to a large extent. So the first separated signal is weak pulsed sound, and pulsed time is at 1s and before and after 4s, which is the same as the impulse time of the weak acoustic source that we have assumed. The second separated signal is the random noise interference source signal, and the third signal is the set 40 Hz sinusoidal signal. It can be seen that the weak pulsed acoustic signal can still be separated under the condition of two interference sources.
Weak pulse signal separation results under different PNR conditions.
It can be concluded from the above table that the signal-to-noise ratio of weak pulsed acoustic signals from a double interference source has a similar effect on the separation of weak acoustic signals as that from a single interference source, both of which mean that in theory, as long as the sensor can receive weak pulsed acoustic signals, the algorithm can realize the extraction of weak pulsed acoustic signals under background noise regardless of the background noise.
Experimental study
Experimental study on separation and recognition of weak acoustic signals
The experimental site of this paper is A semi-anechoic chamber in an acoustic laboratory, the background noise is less than 20 dB(A), and the cut-off frequency is 100 Hz. The test instruments used in this experiment are mainly: B&K vibration and noise analyzer, B&K non-directional sound source, B&K4819 microphone, two general market sound source speakers. In the experiment, the universal horn was used as the weak pulse sound signal source, the B&K non-directional spherical sound source was used as the random noise interference source, and another horn was used as the sinusoidal sound source. The sound source arrangement interval was 0.5 m, and the four sound pressure receiving sensors were arranged in an arc 1m away from the center of the sound source. The field experimental arrangement was shown in Figure 8: Experimental layout of semi-anechoic chamber.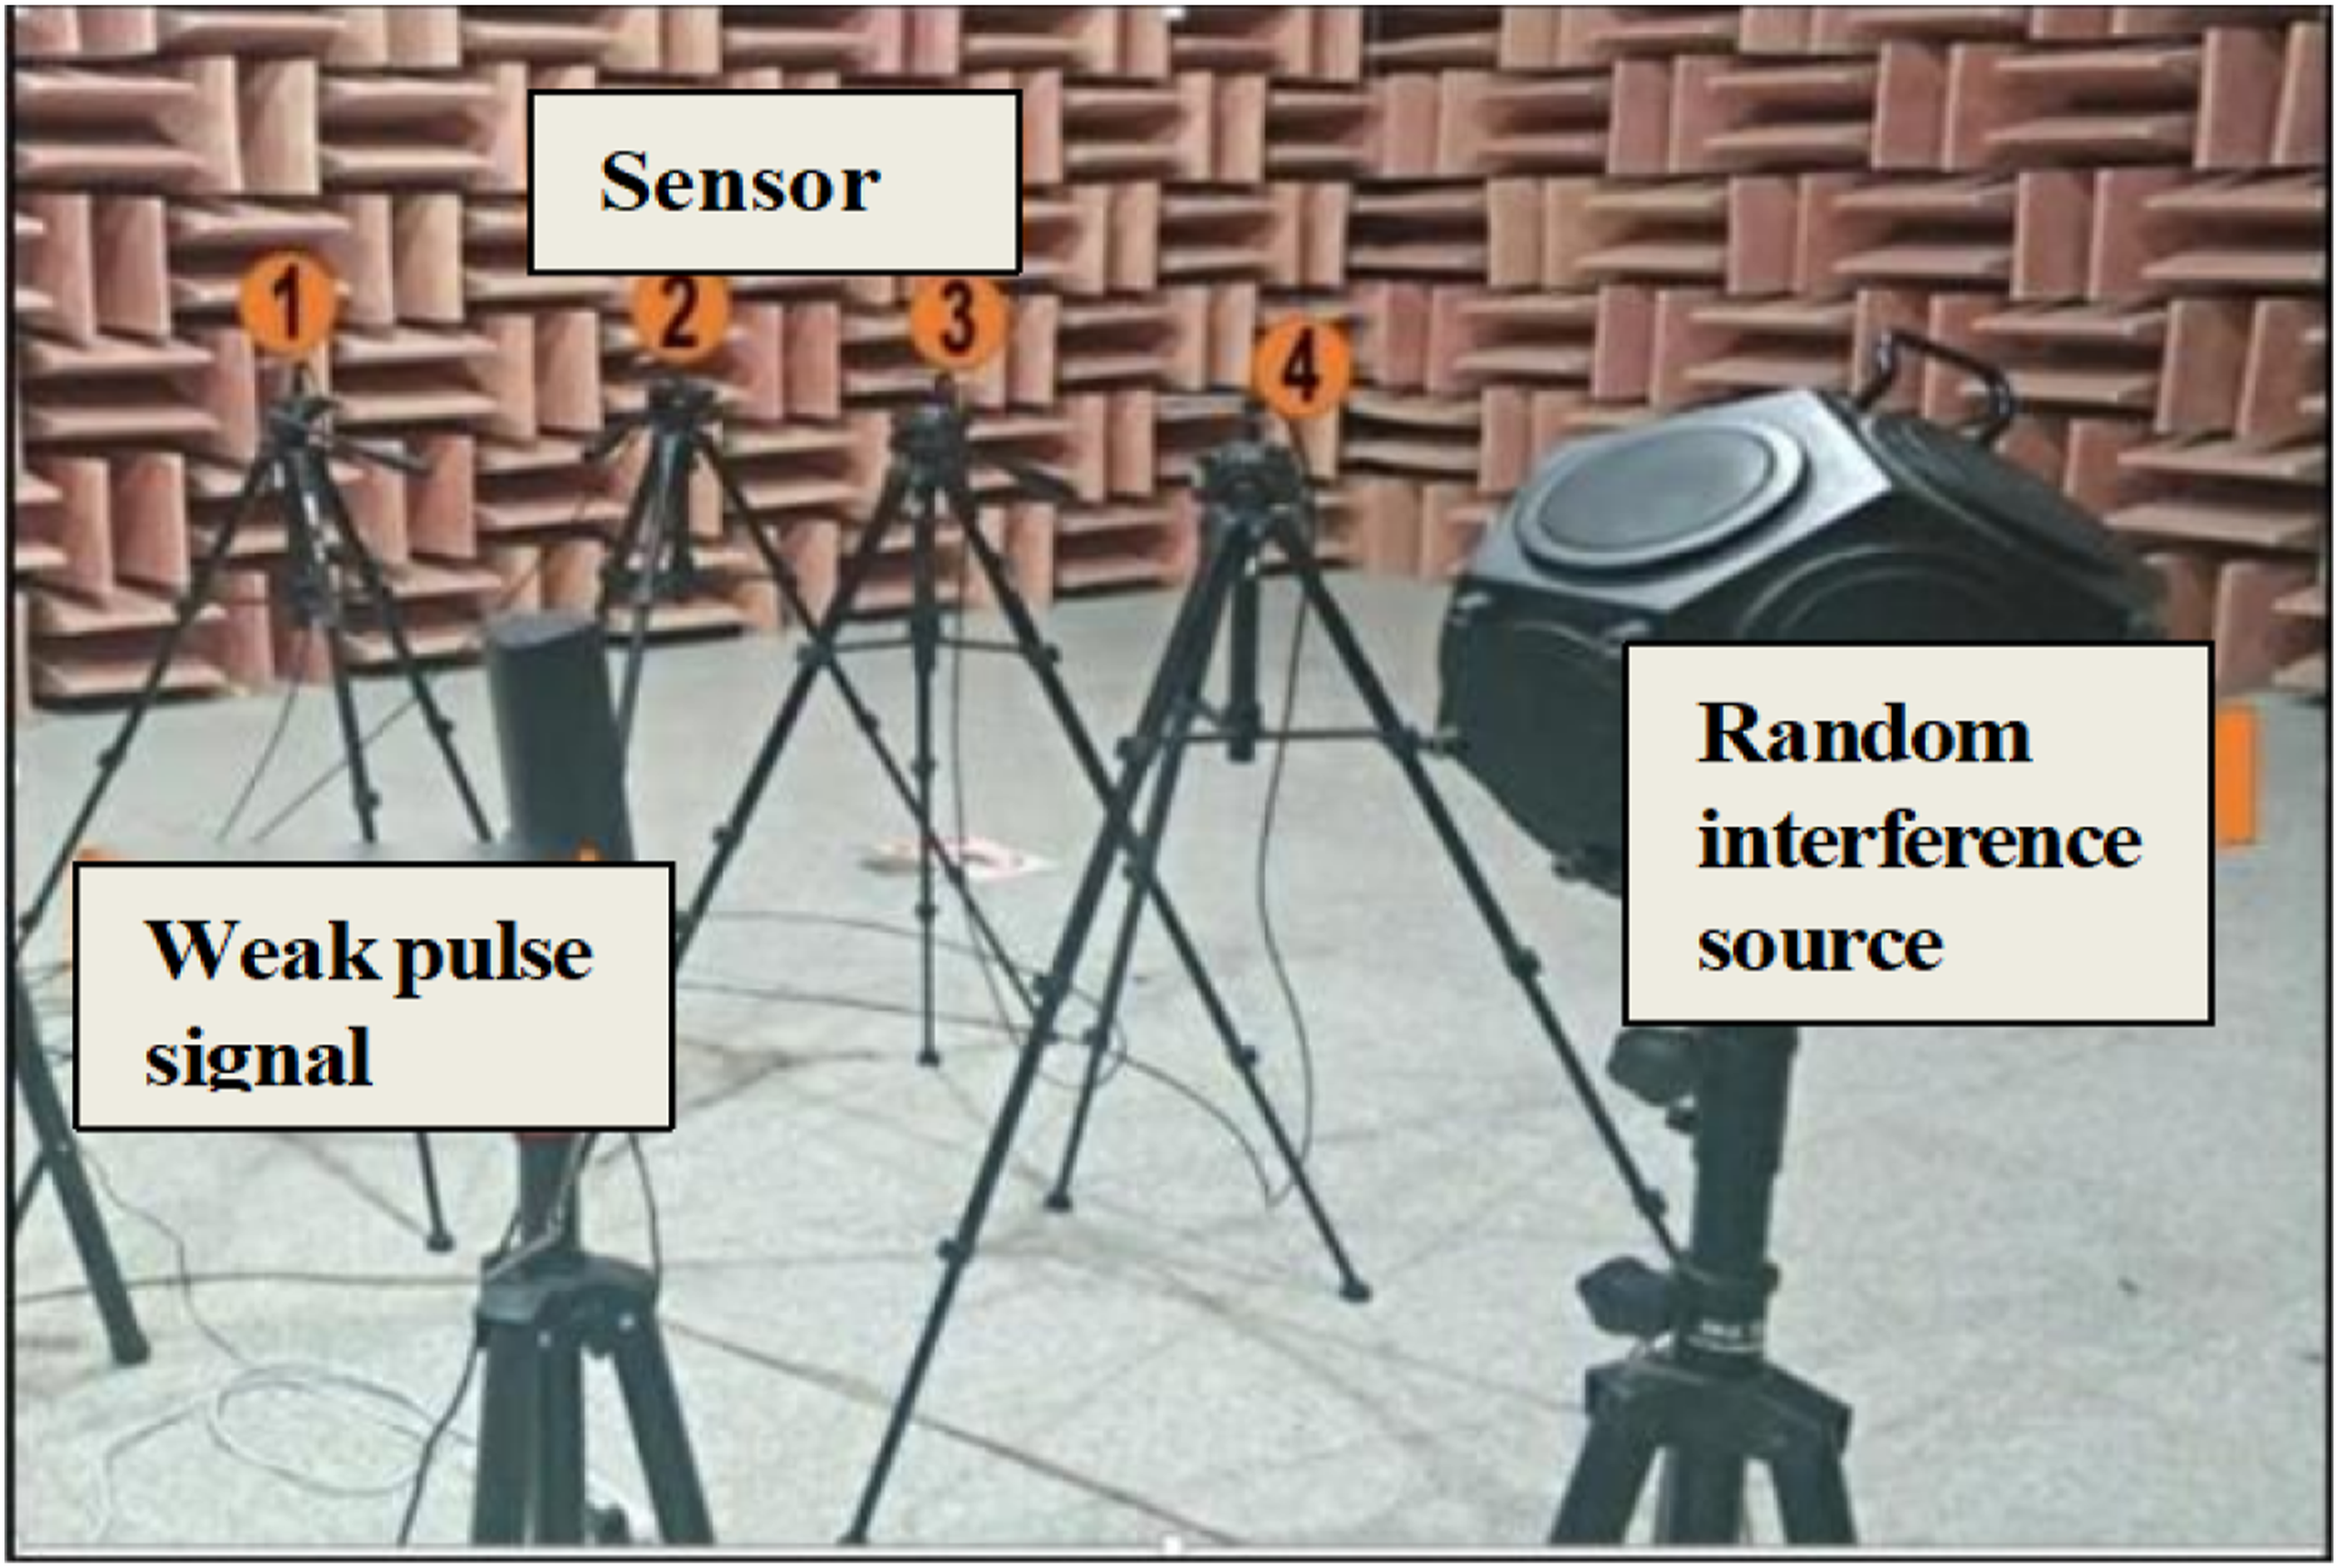
Establish the impulse signal with strong randomness as the weak sound source signal, write the Matlab program and establish the 1s single pulse and 4s two consecutive pulses, respectively. The signal received by the weak pulse acoustic signal sensor set in the experiment is shown in Figure 9. Strong random background noise and sinusoidal noise with a frequency of 200 Hz are added, the signal-to-noise ratio is −20 dB, and the measurement signals collected by four microphones are shown in Figure 10. Test results of weak pulse acoustic signal source. Signals received by 4 sensors under strong interference background noise.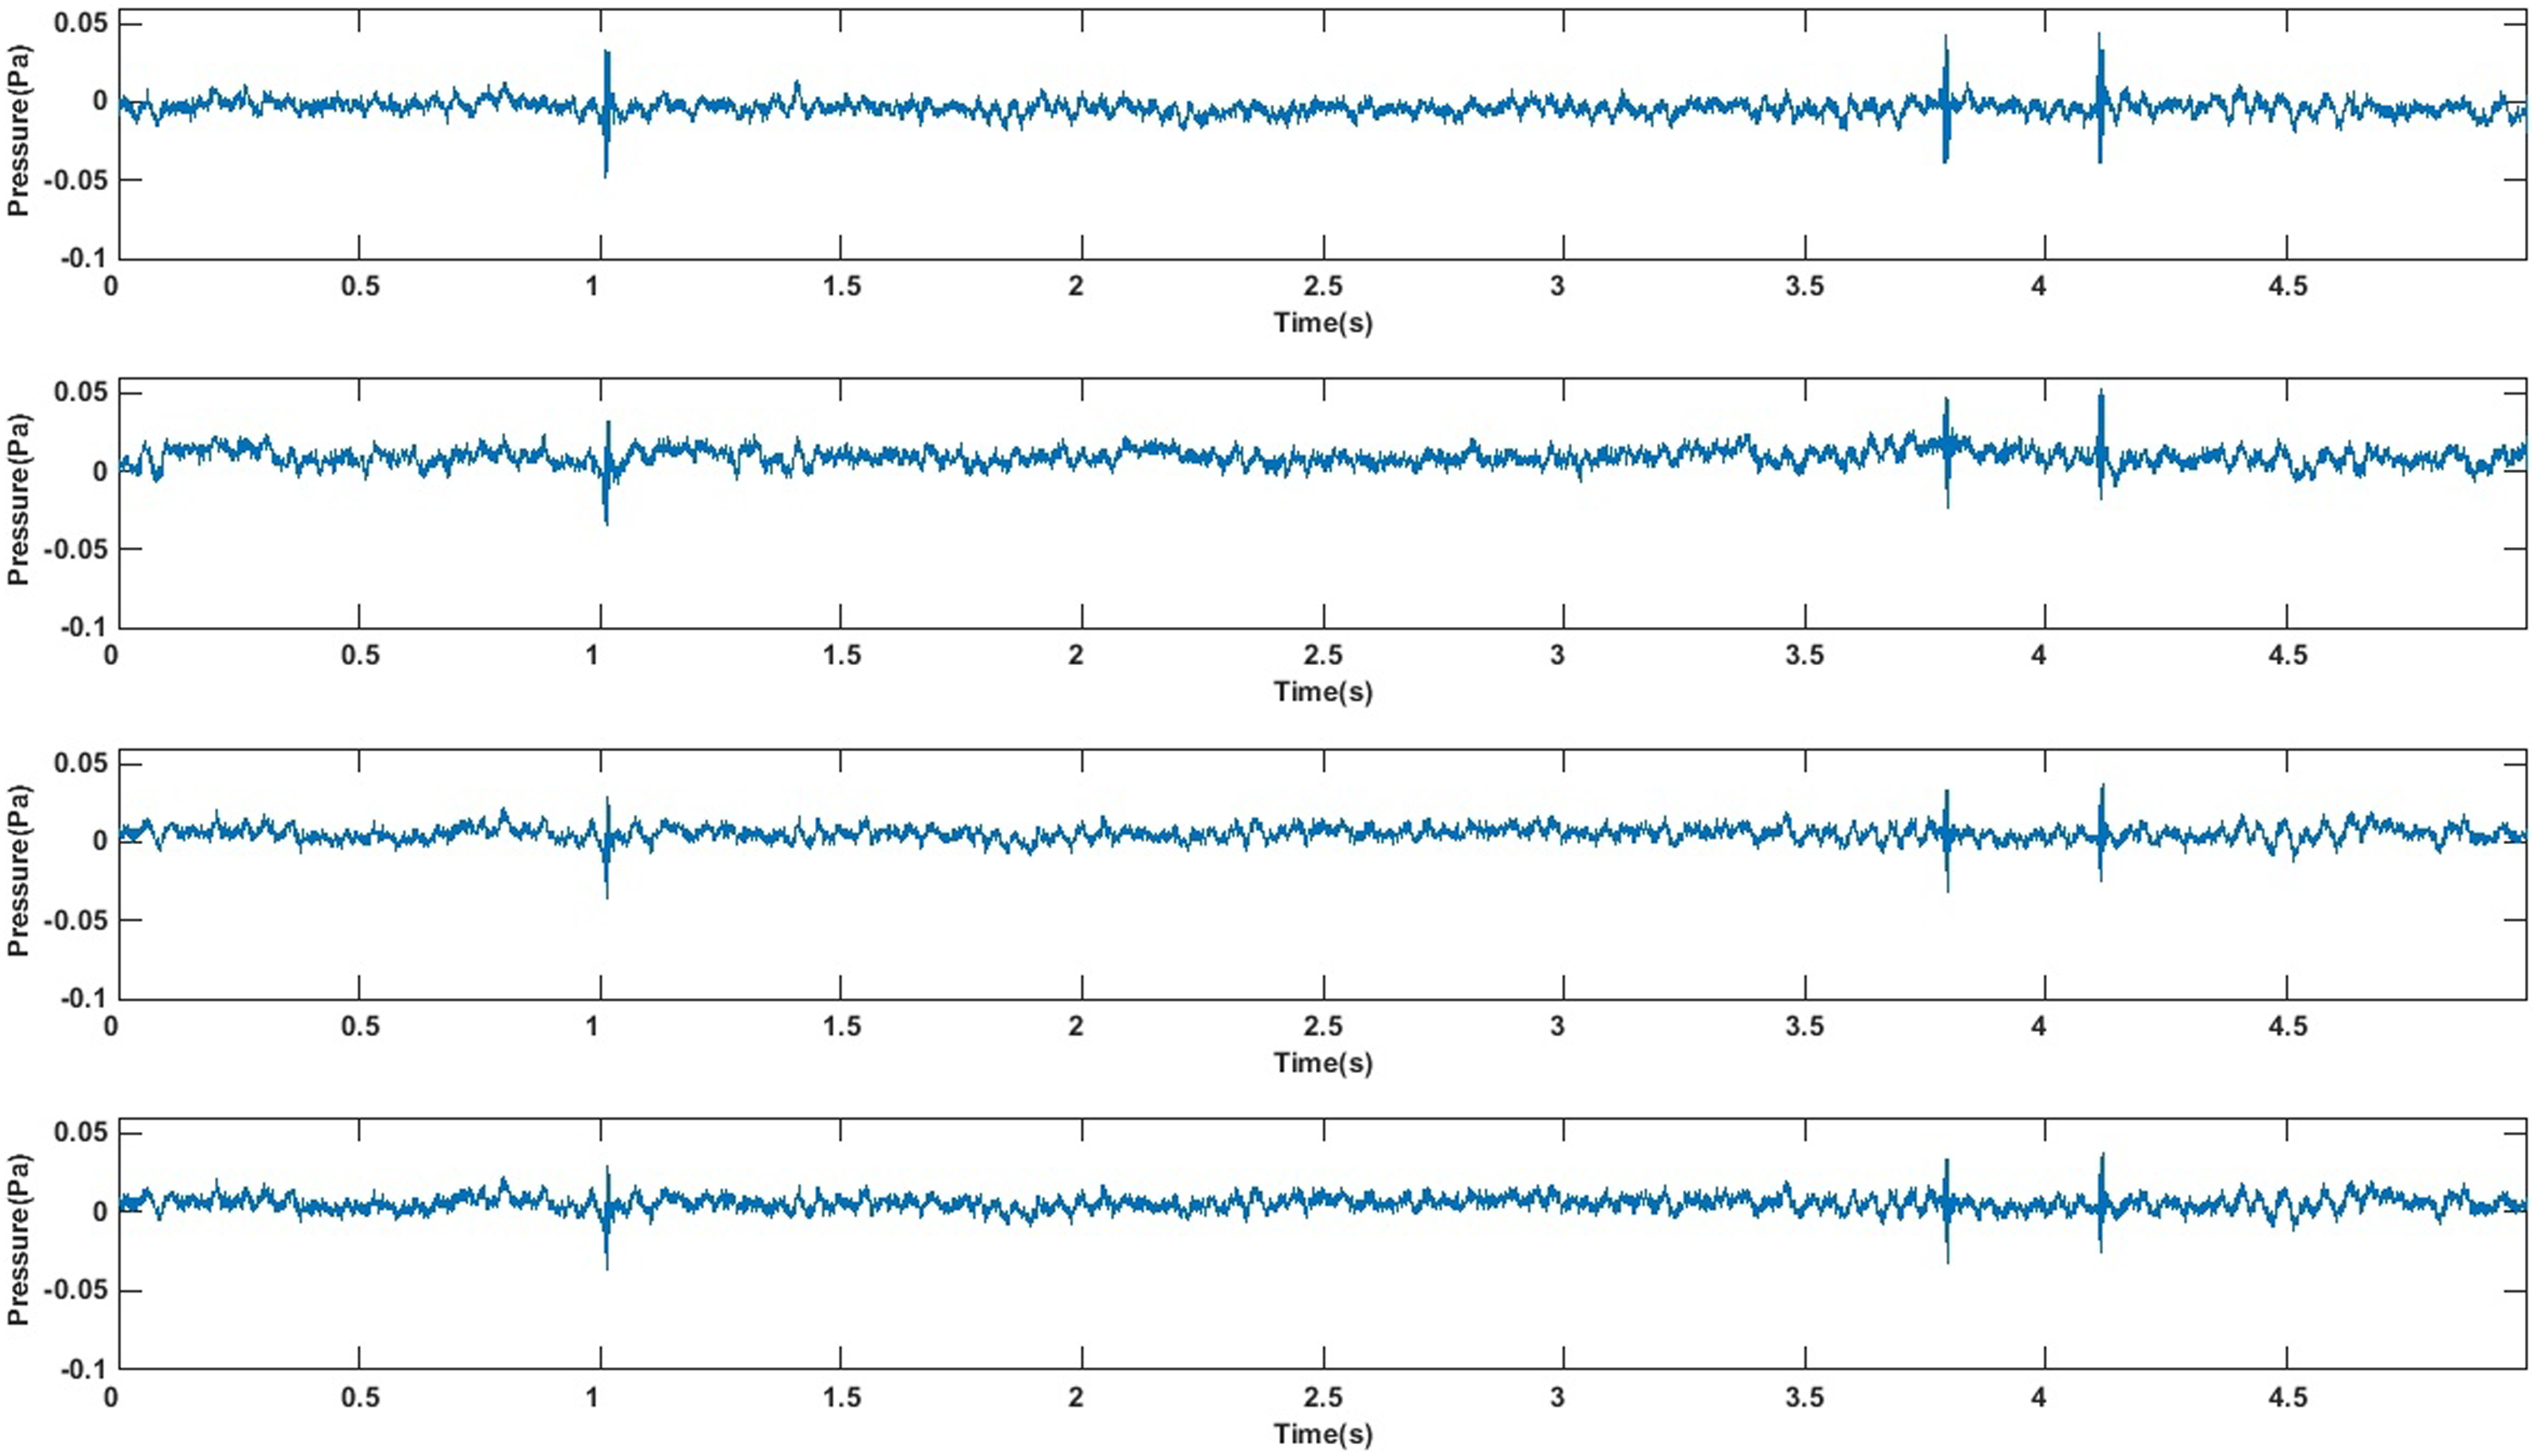
As can be seen from the above table, during the experiment, the separation effect can be judged by observing the time-domain characteristics of the separated weak pulse acoustic signals. When the signal-to-noise ratio of weak acoustic signal is higher than −21 dB, the time-domain pulse effect is obvious, and better separation effect can be obtained. When the signal-to-noise ratio of weak acoustic signal is lower than −23 dB, the time-domain pulse effect can hardly be observed, and the signal separation effect is poor.
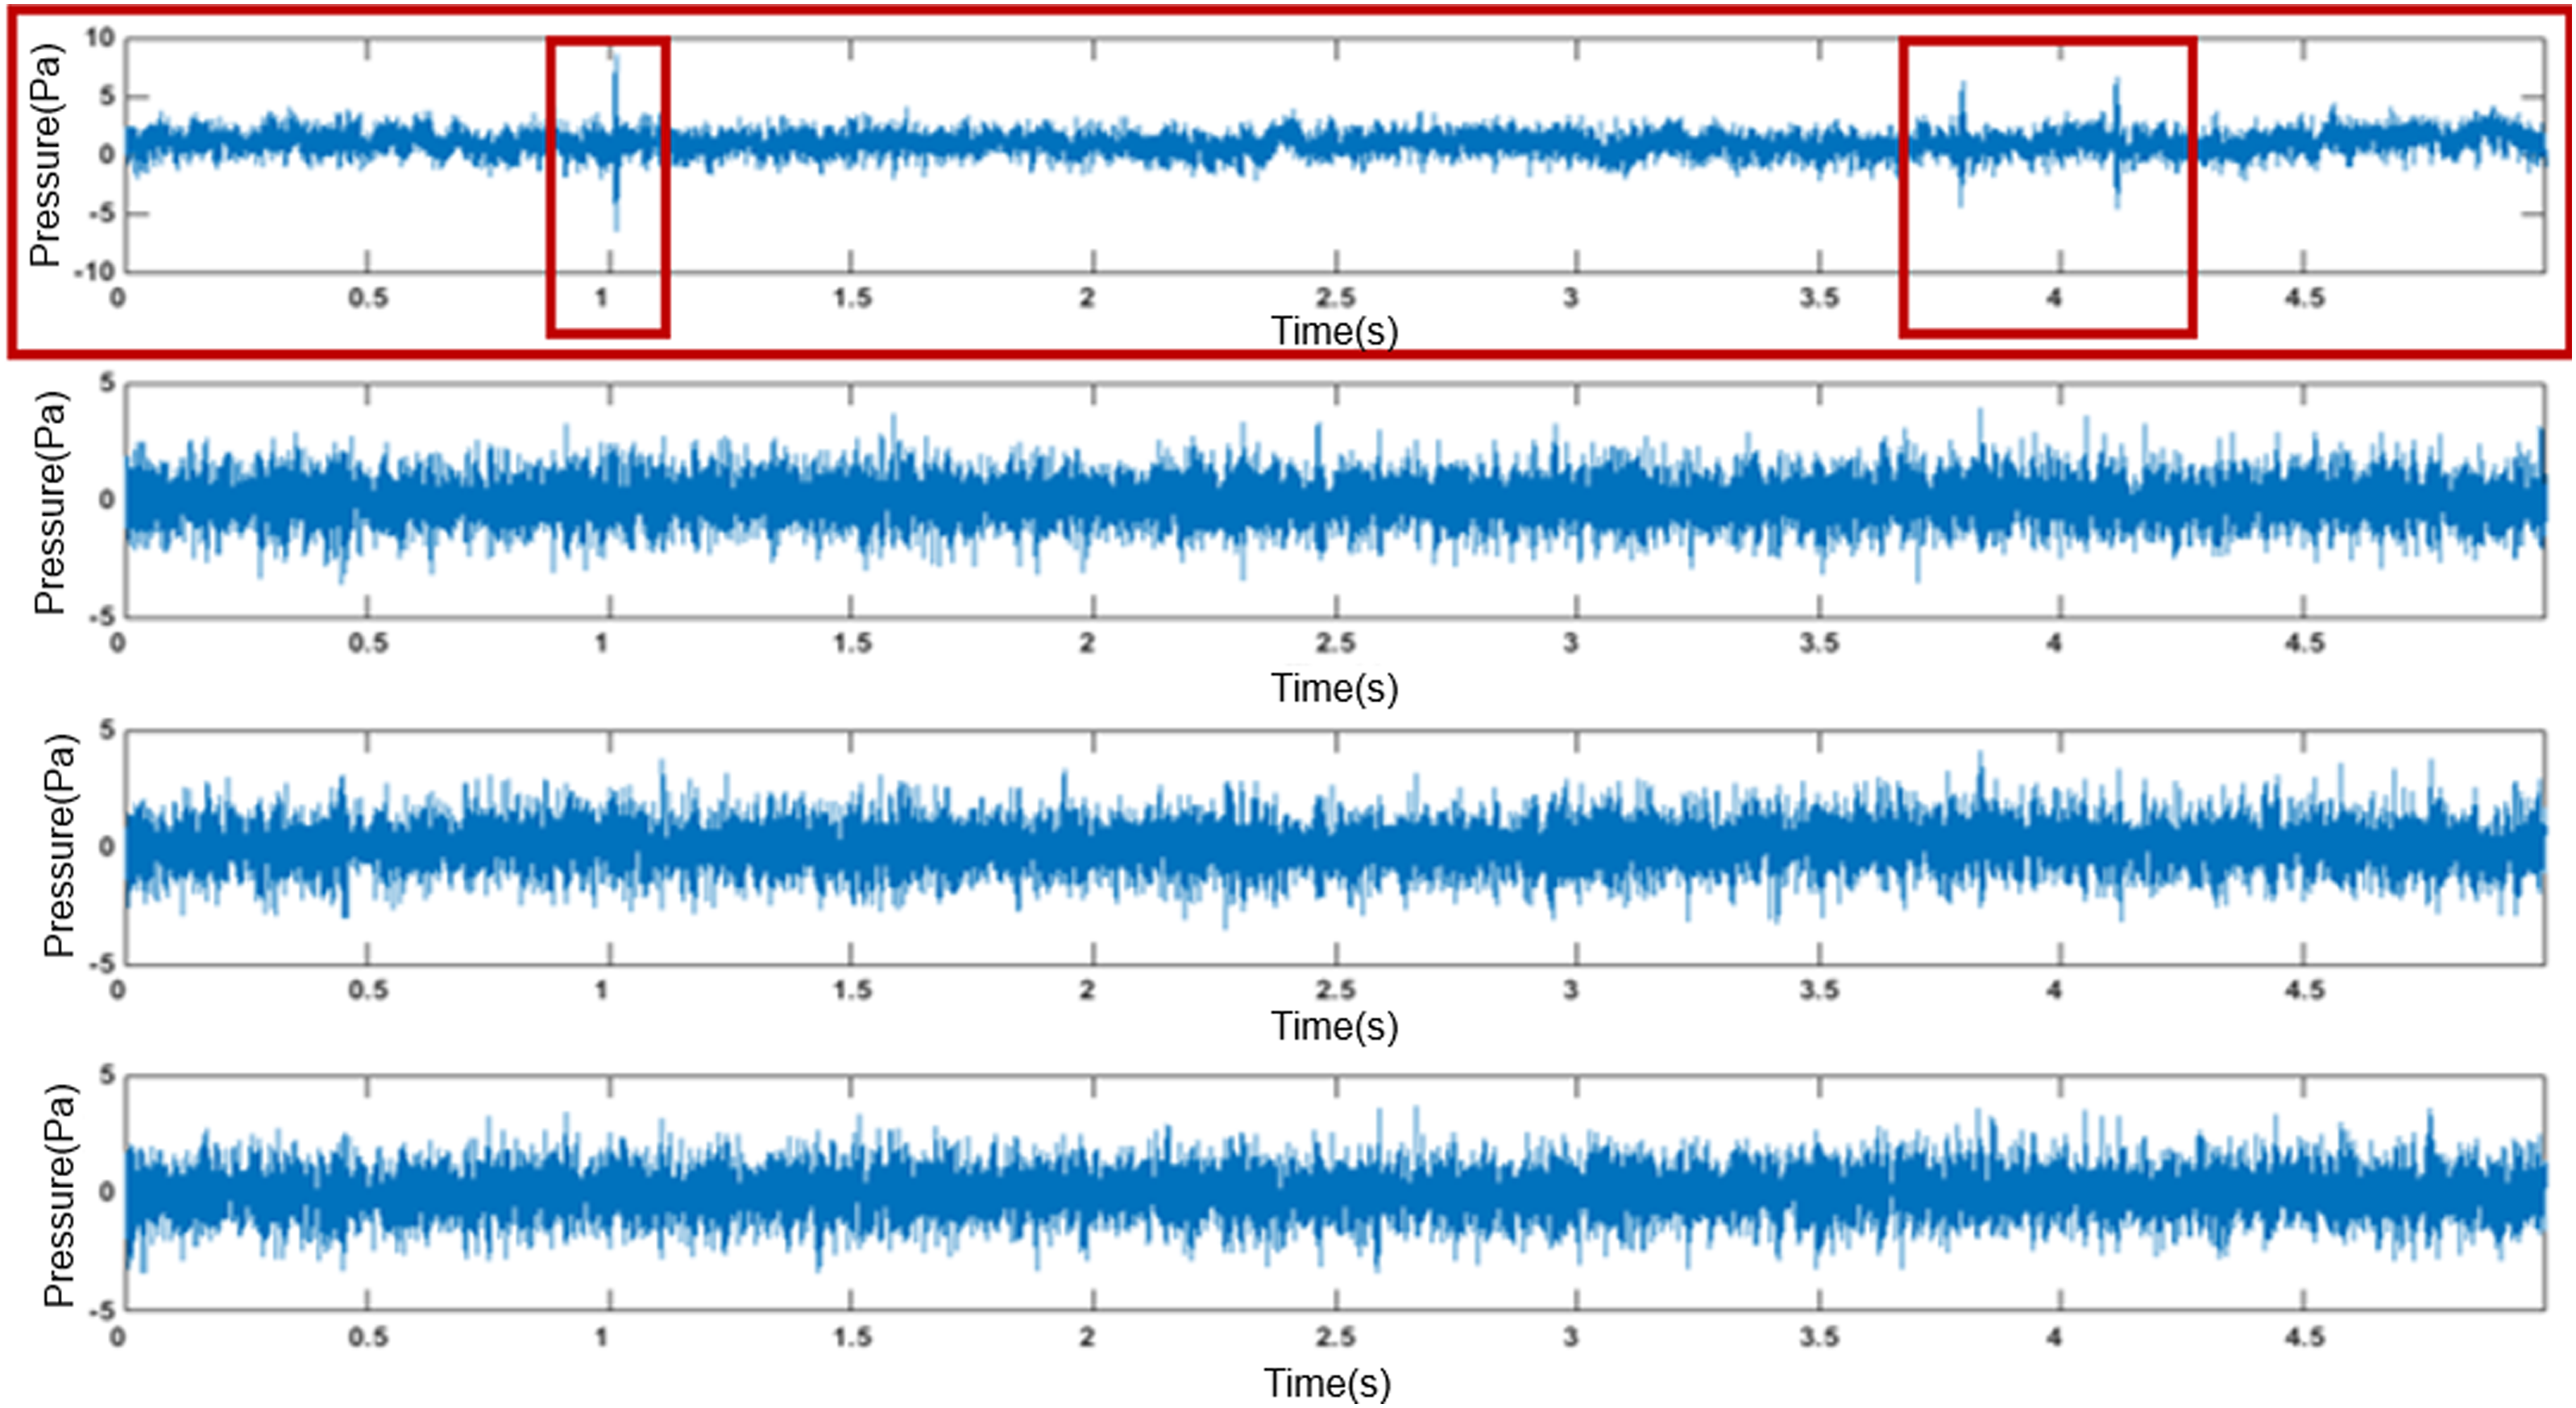
Three kinds of sound sources and four sensors are set up in the experiment, which belongs to blind source separation under overdetermined conditions. The separation algorithm is used to carry out blind source separation on the above observed signals, and the signal source estimation signal obtained is shown in Figure 11: Results of blind source separation of test signals.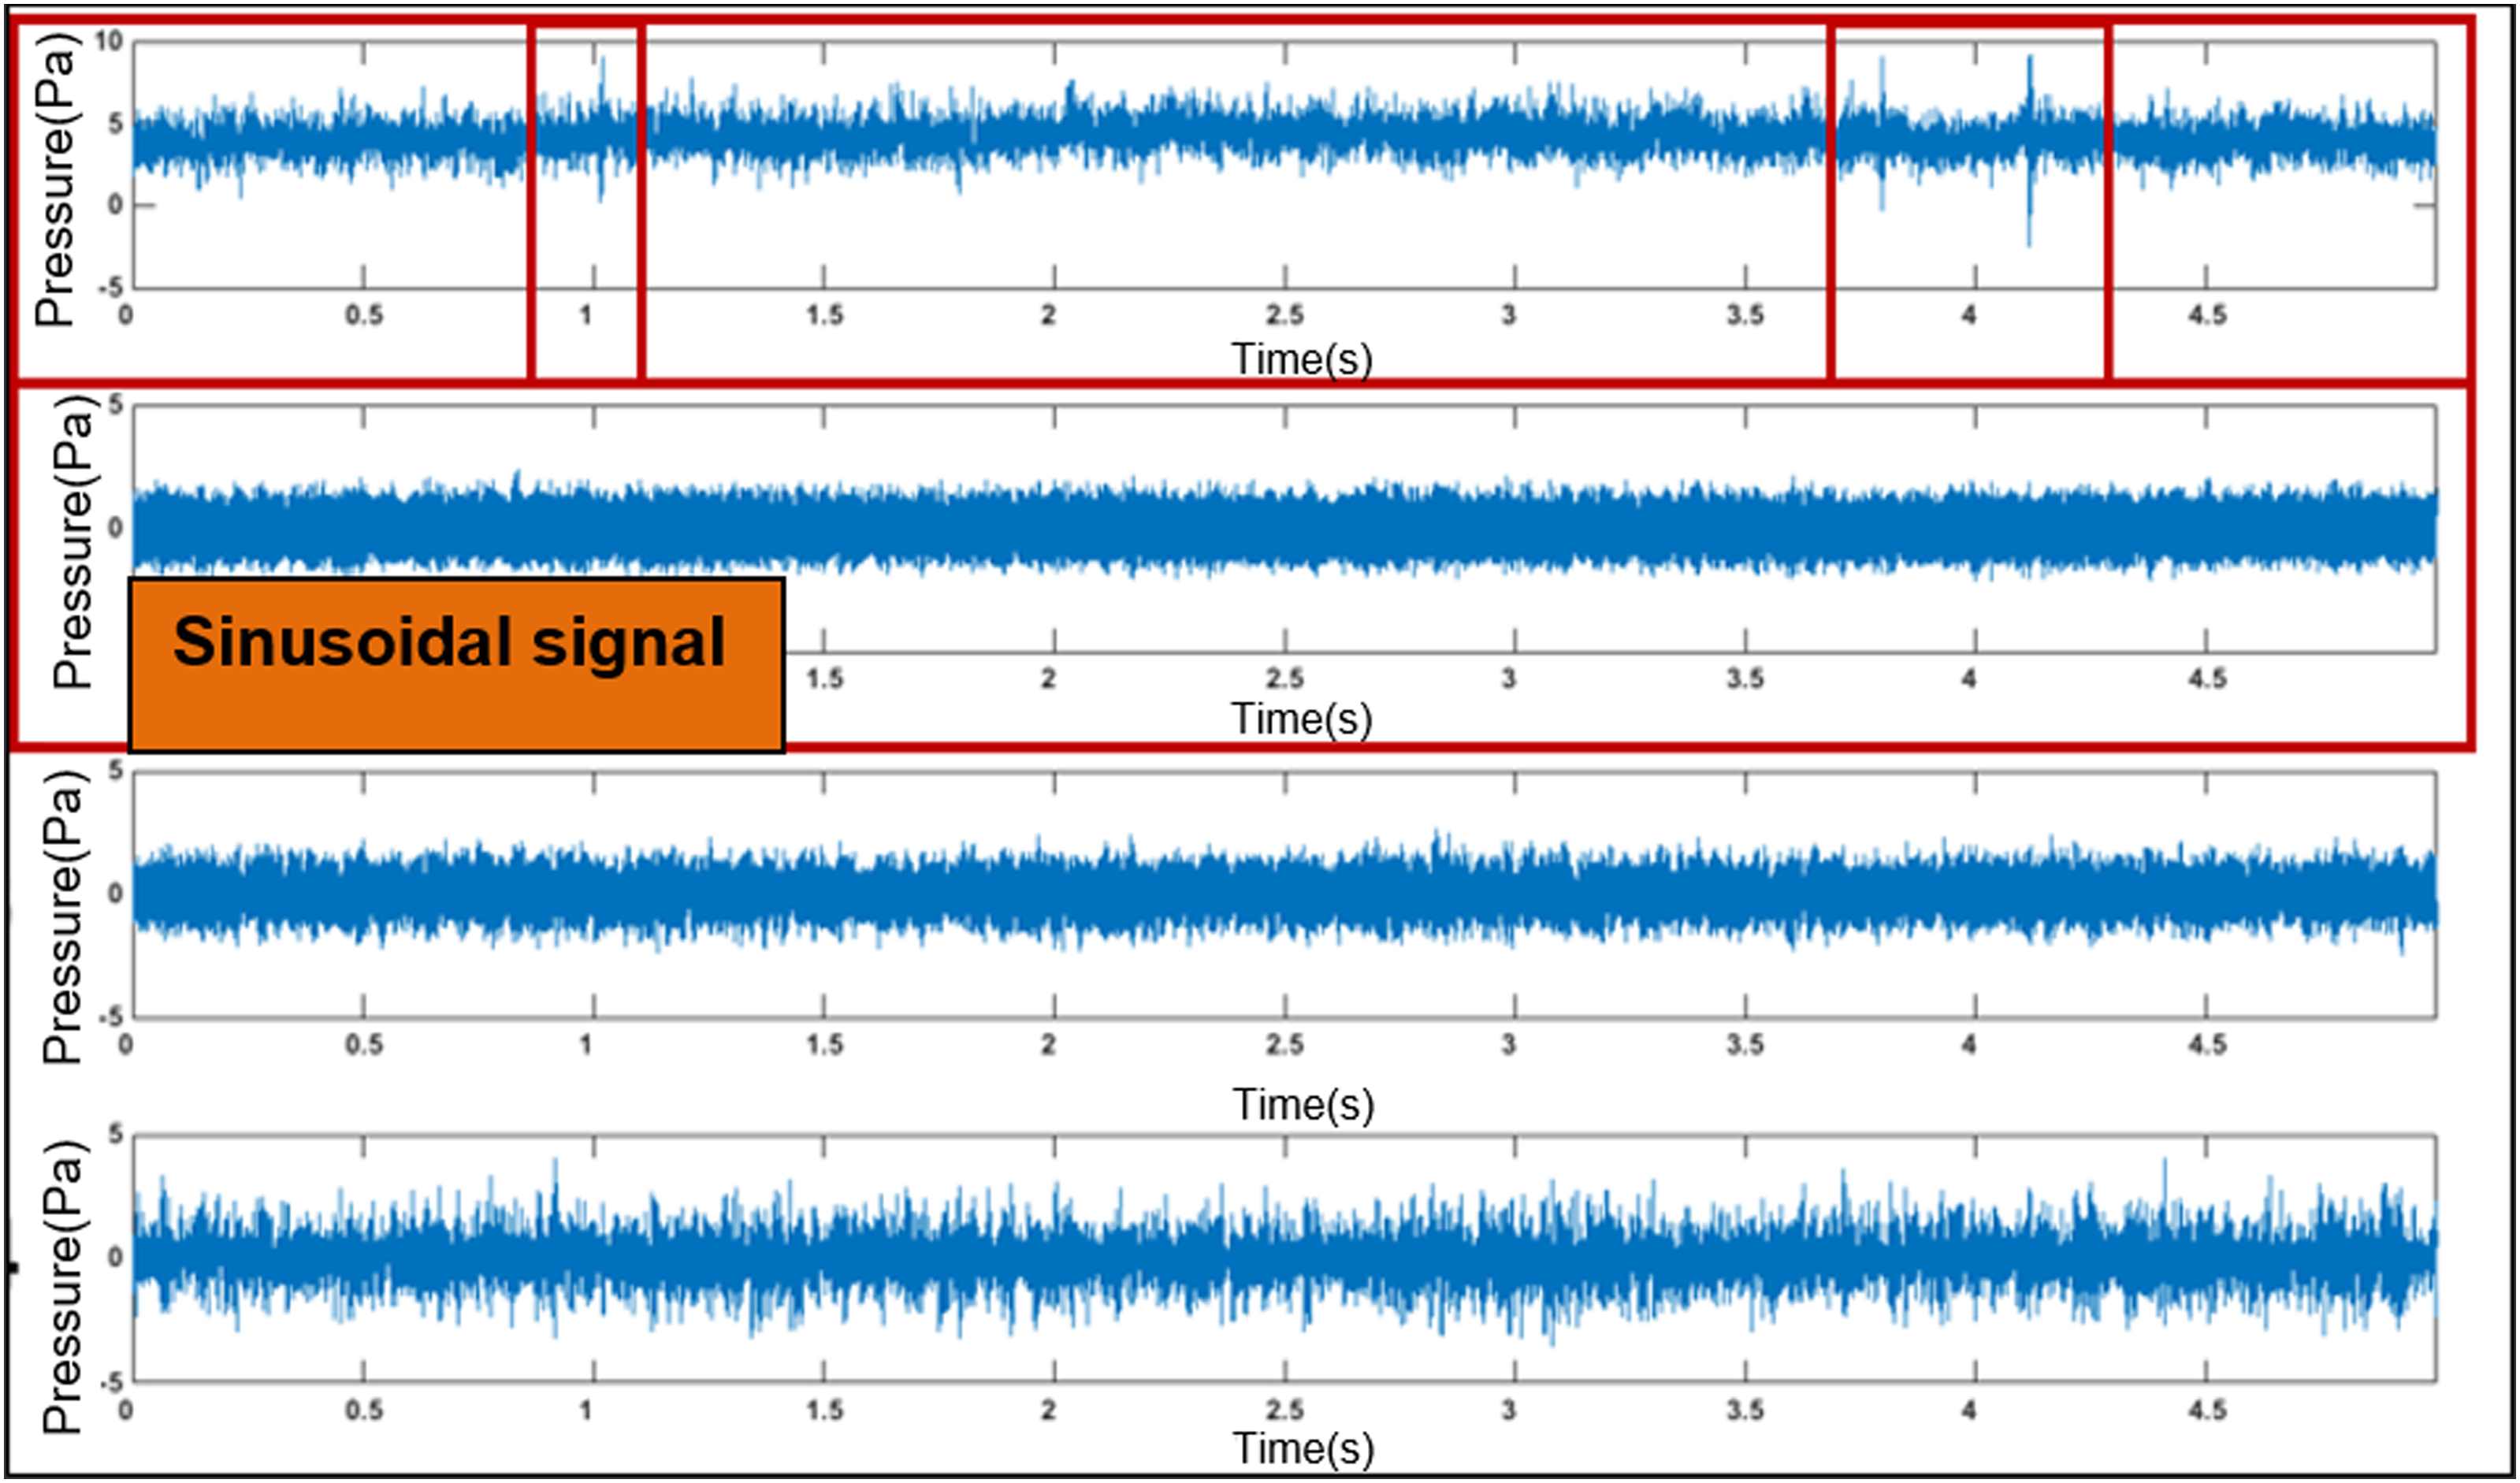
As can be seen from the results in Figure 11, the first isolated signal is a weak pulse signal, and the time-domain acoustic characteristics of the weak pulse acoustic signal with pulses before and after 1s and 4 s are basically restored, but the amplitude uncertainty exists. The second signal separated is a 200 Hz sinusoidal signal.
It is known that the blind source separation method can be applied to the separation of weak signals under strong background noise. In this paper, pattern recognition is intended for the separated signals, but the amplitude uncertainty exists in the separated signals. This phenomenon is unfavorable to pattern recognition, so this paper takes some processing methods to separate signals, so as to facilitate pattern recognition.
Experimental verification of dual interference noise source signal separation
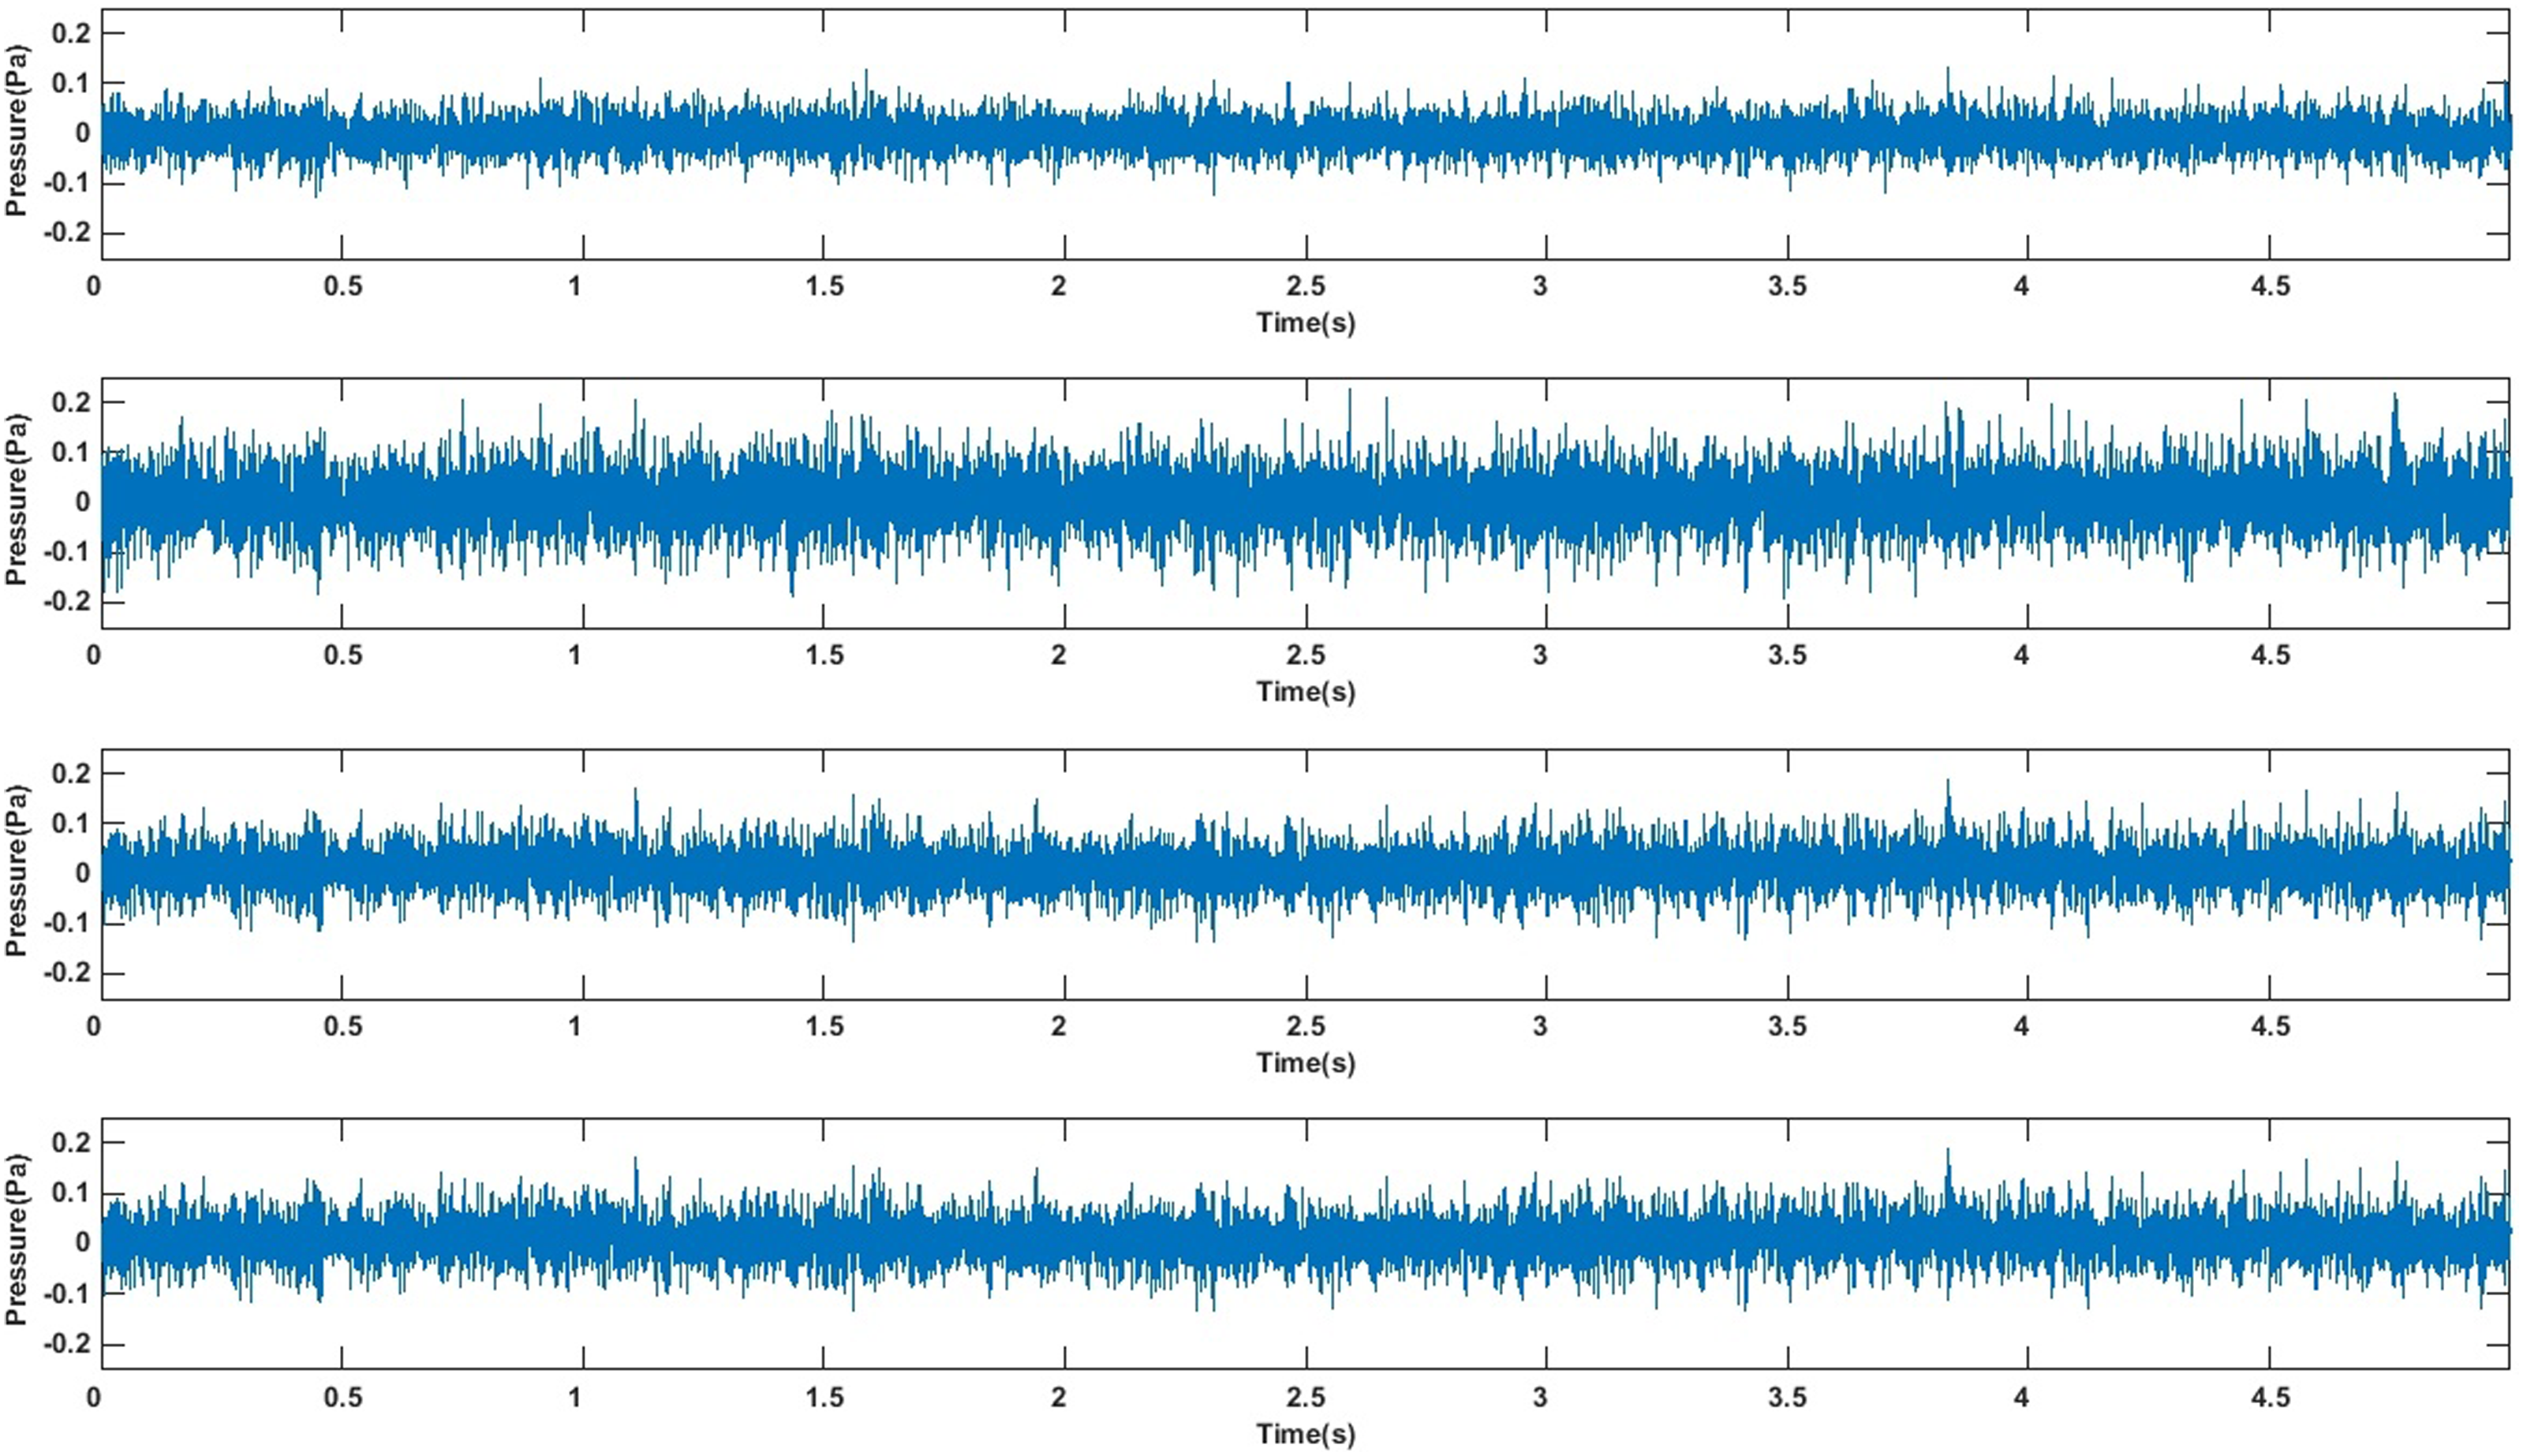
Similarly, on the basis of the above weak acoustic signal separation experiment of single interference source, sinusoidal acoustic interference source signal is added. Due to the limitation of the horn sound source, the horn cannot accurately emit the 40 Hz sinusoidal sound as in the numerical simulation during the experiment, so the 200 Hz sinusoidal sound is used as the second interference noise source in the experiment. The signals received by the four sensors tested in the experiment are shown in Figure 12. The separation results are shown in Figure 13: Experimental test 4 sensors receive signals. Experimental test data algorithm separation results.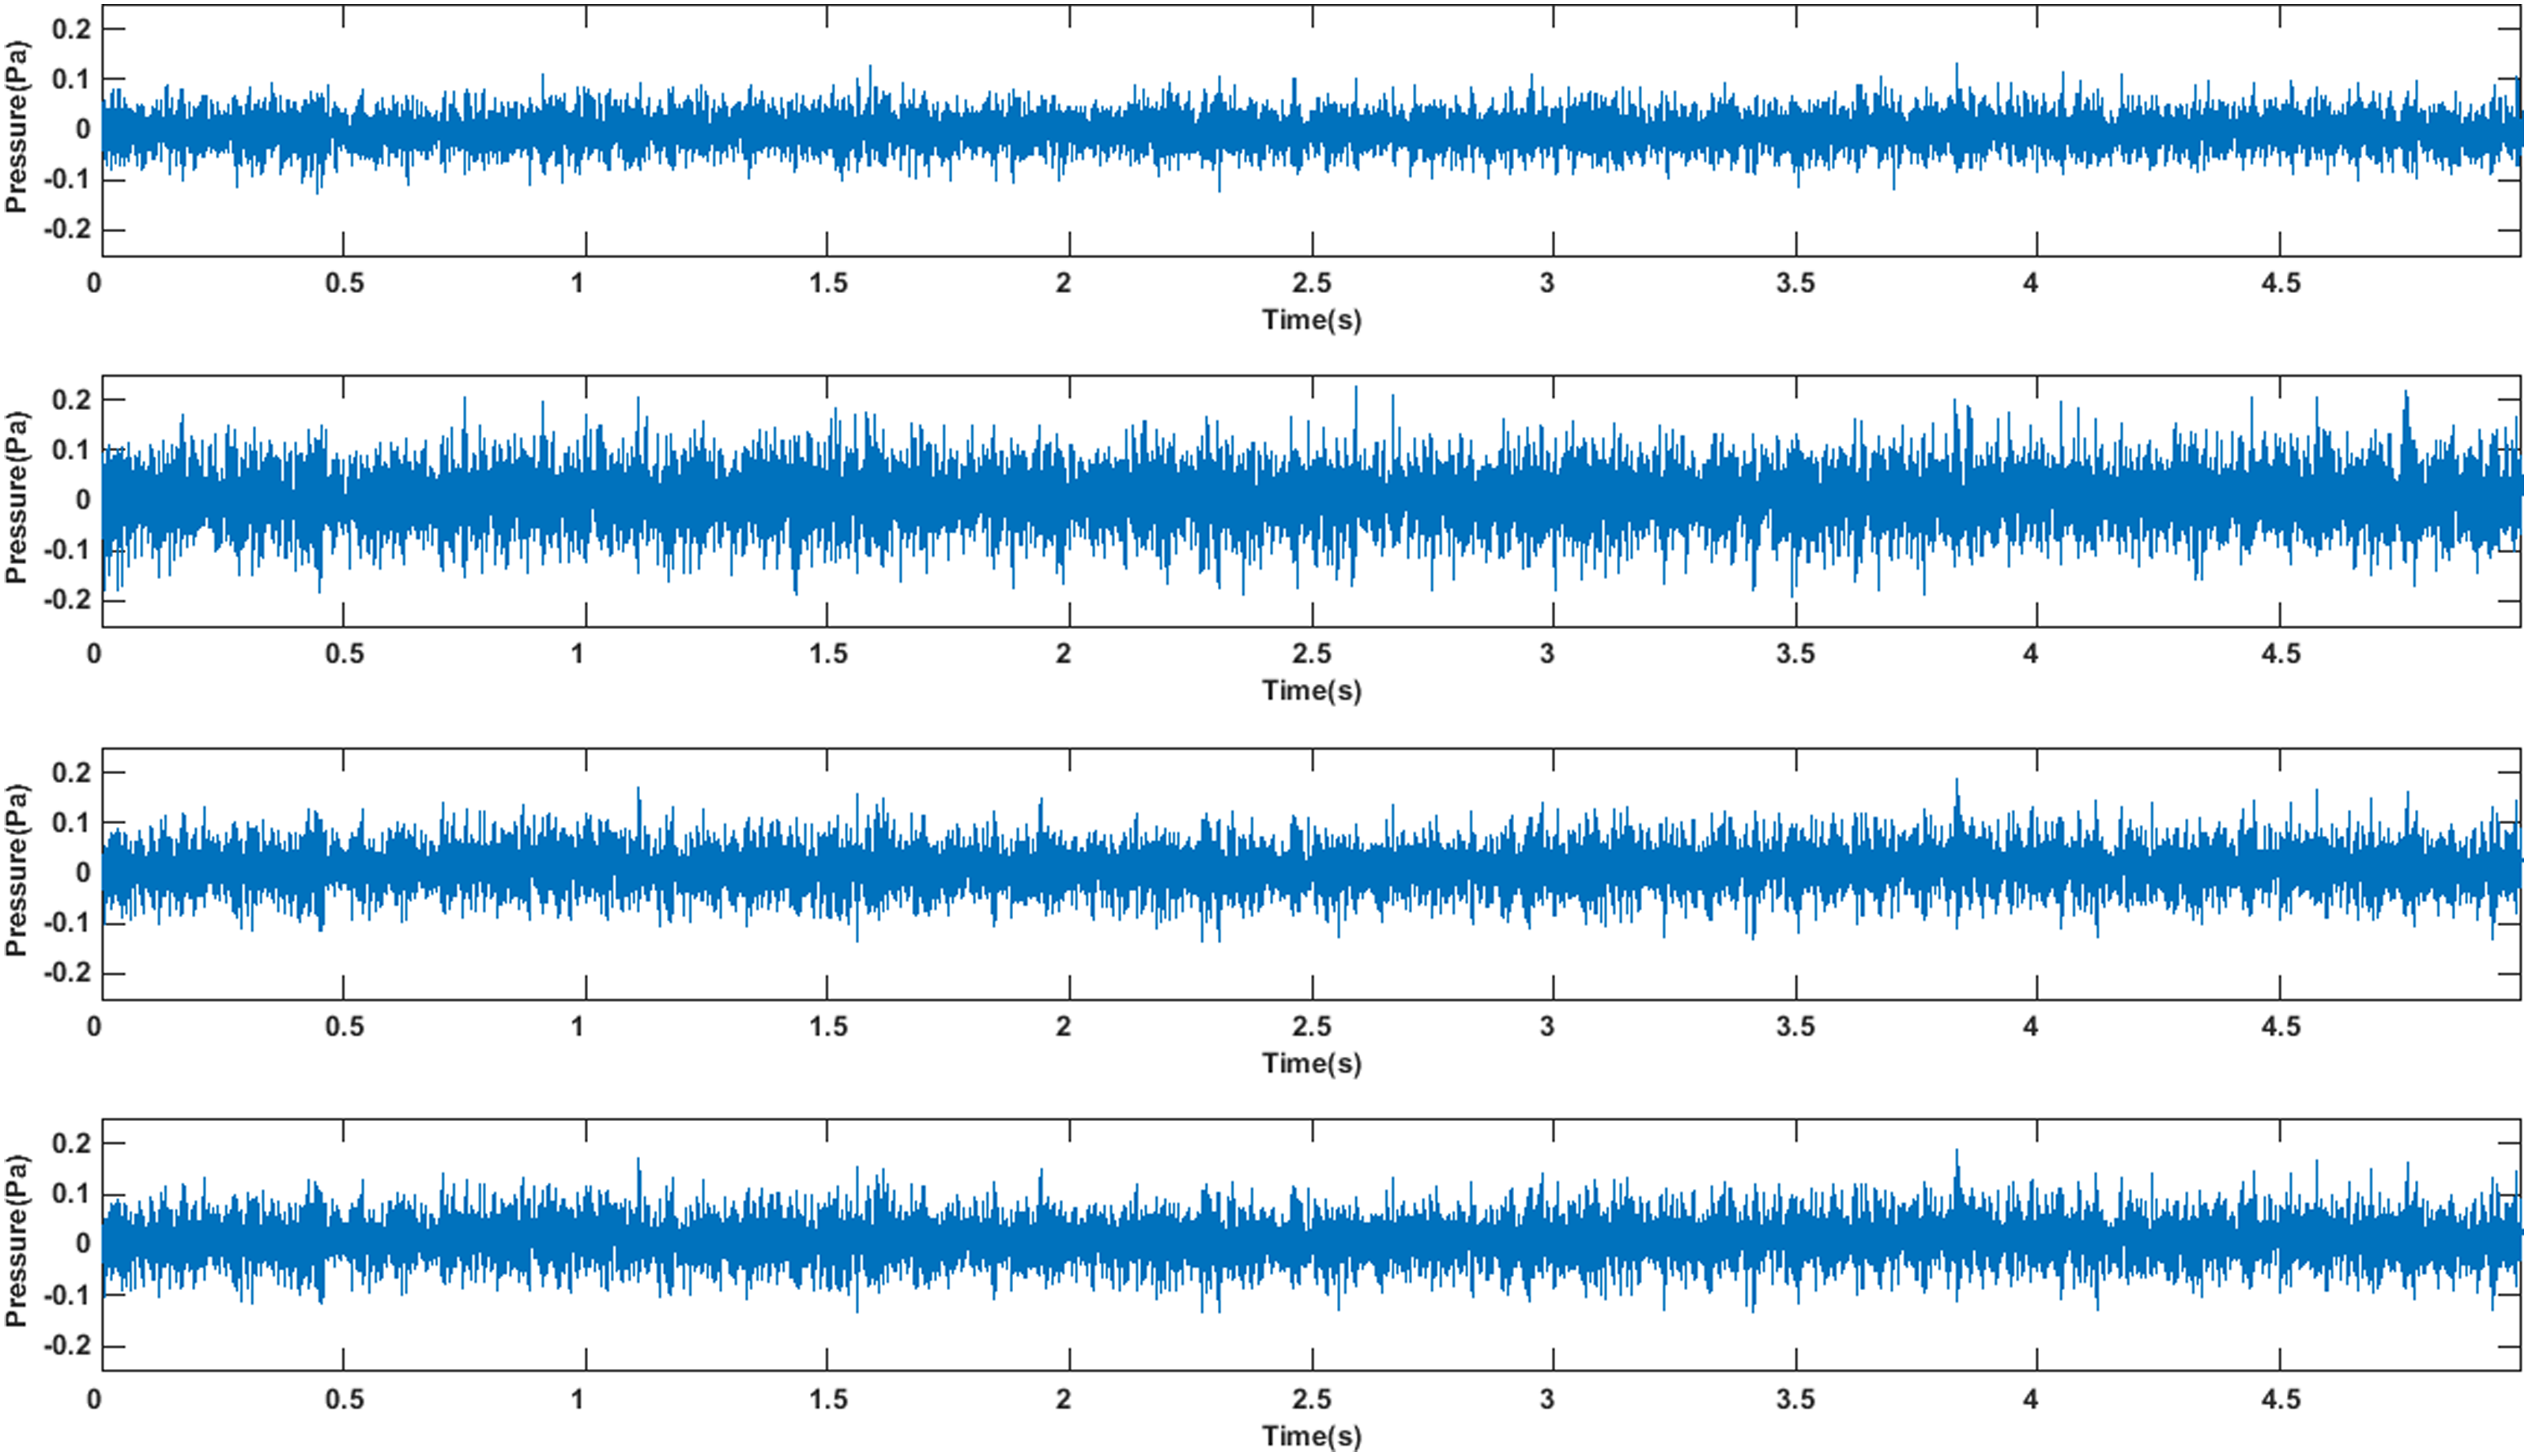
Experimental test the effect of signal-to-noise ratio on weak pulse signal separation.
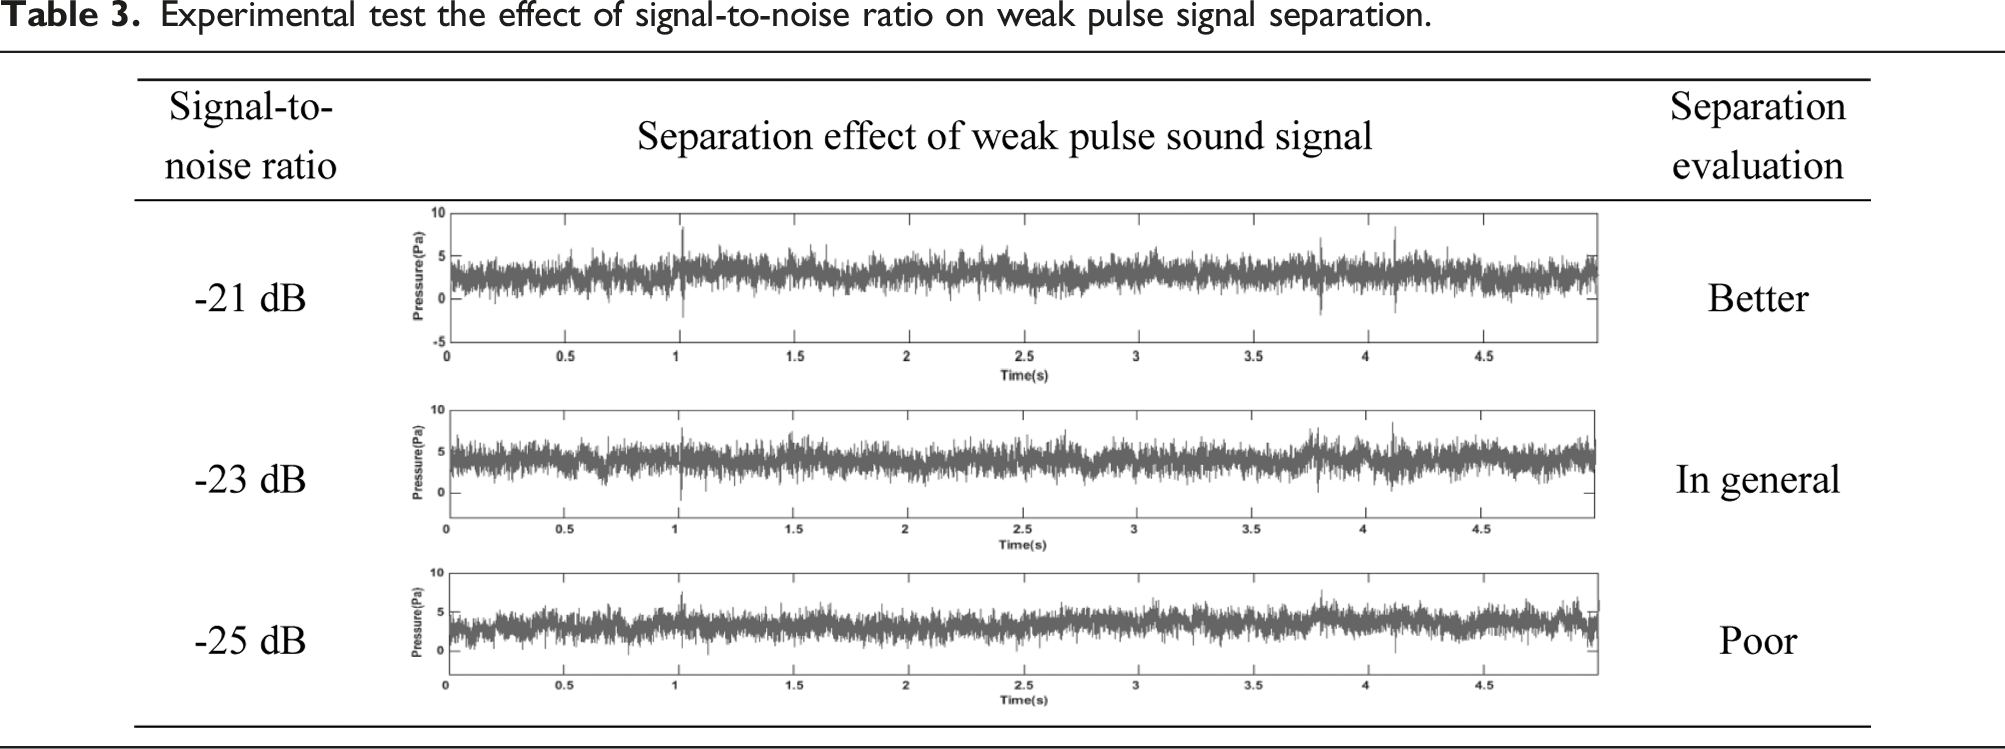
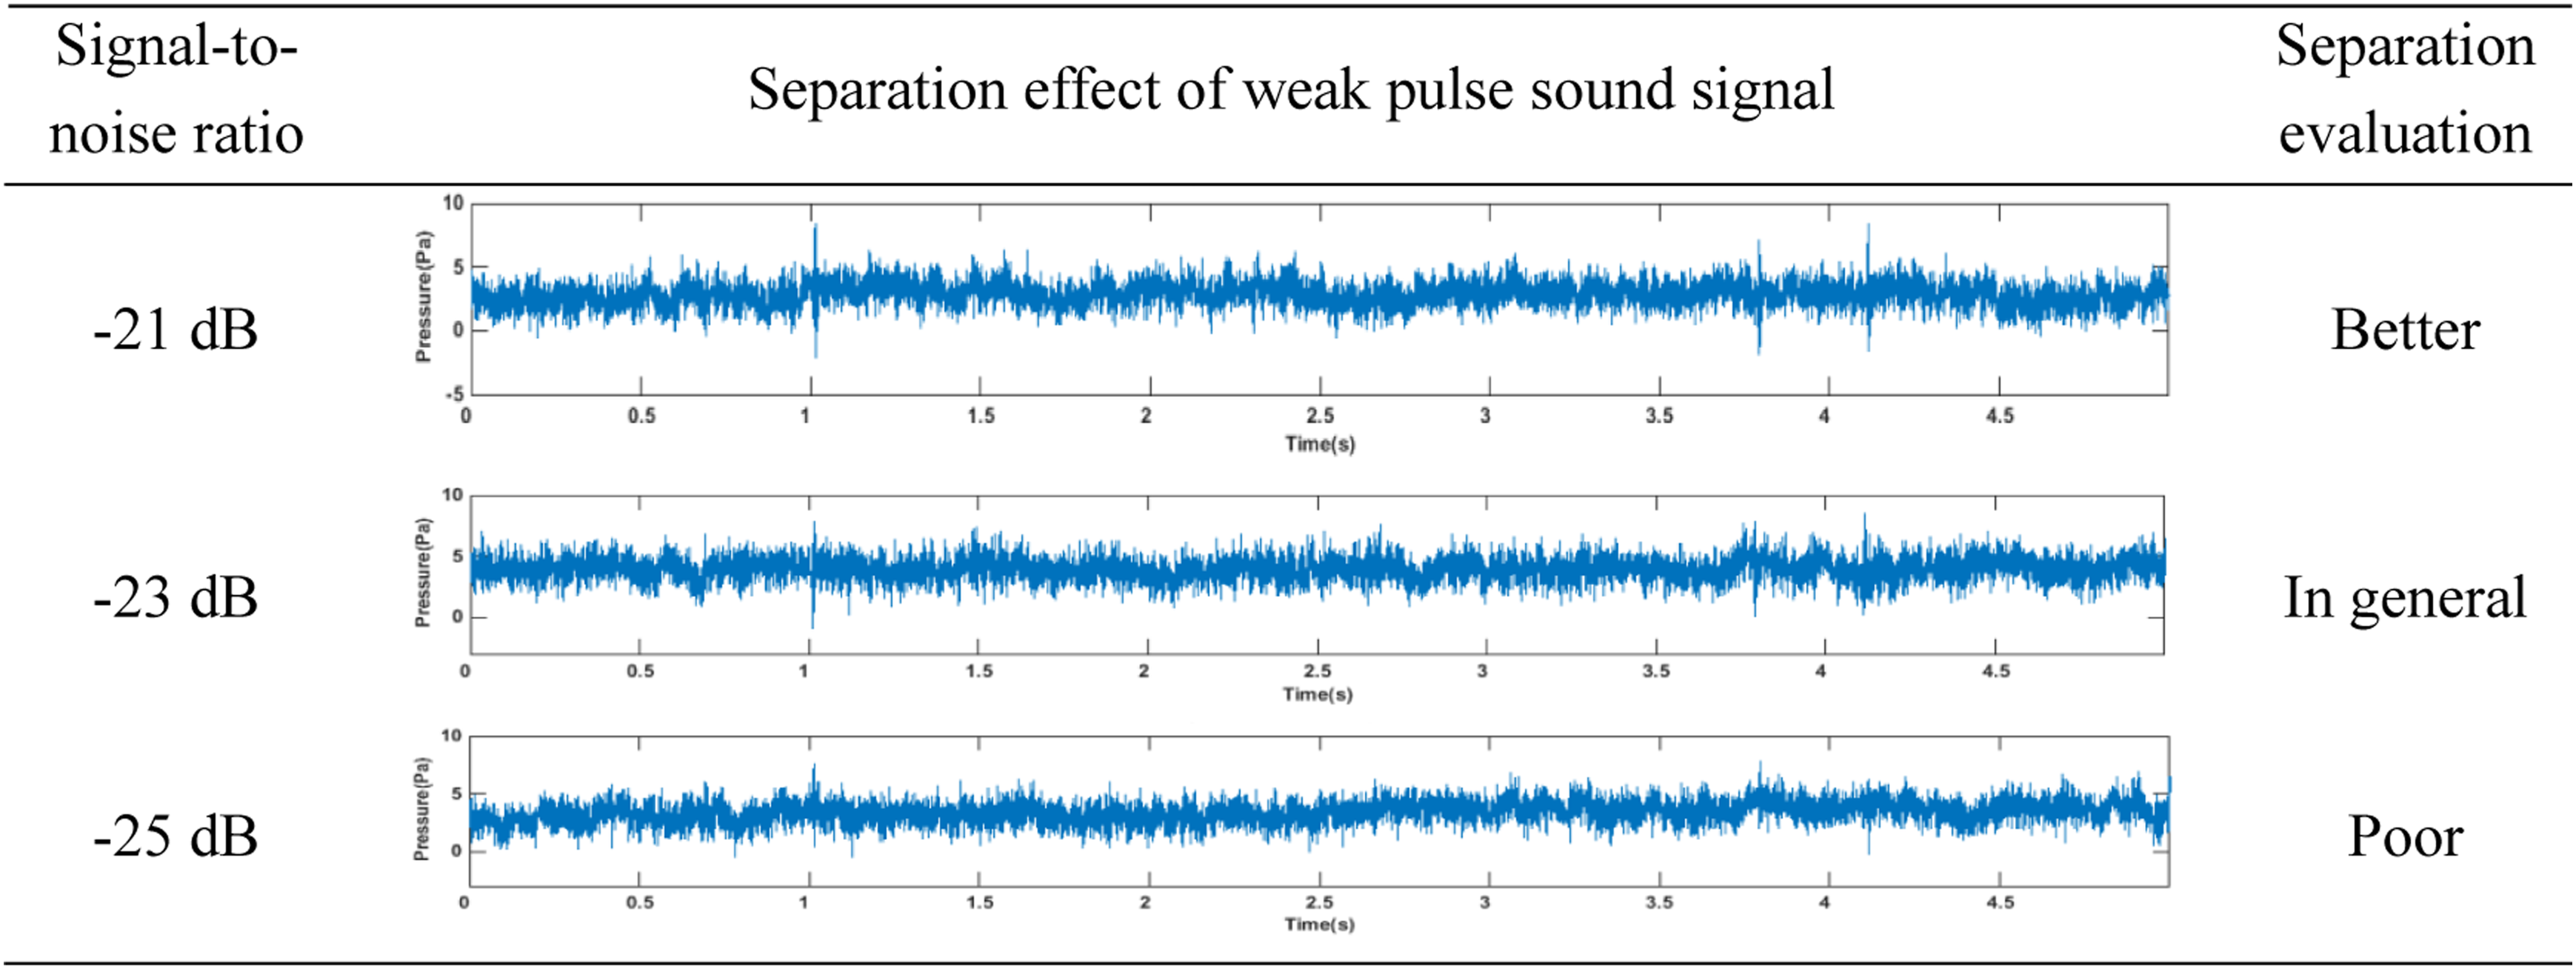
As can be seen from the above table, during the experiment, the separation effect can be judged by observing the time-domain characteristics of the separated weak pulse acoustic signals. When the signal-to-noise ratio of weak acoustic signal is higher than −21 dB, the time-domain pulse effect is obvious, and better separation effect can be obtained. When the signal-to-noise ratio of weak acoustic signal is lower than −23 dB, the time-domain pulse effect can hardly be observed, and the signal separation effect is poor.
BP neural network for acoustic signal recognition
Pretreatment of acoustic signal separation
The time-domain signal energy will affect the above indexes, and the weak pulse acoustic signals received by four groups of microphones are taken as reference for analysis. The same type of experimental test pulse signals received by the four groups of microphones are shown in Figure 14. The amplitude of the signals received by the four groups is different, resulting in large fluctuations in the indicators of the same time-domain characteristics, as shown in Table 4: Time-domain test results of the same type of weak pulse acoustic signal received by the microphone. Time-domain index of pulse signal received by four microphones tested experimentally.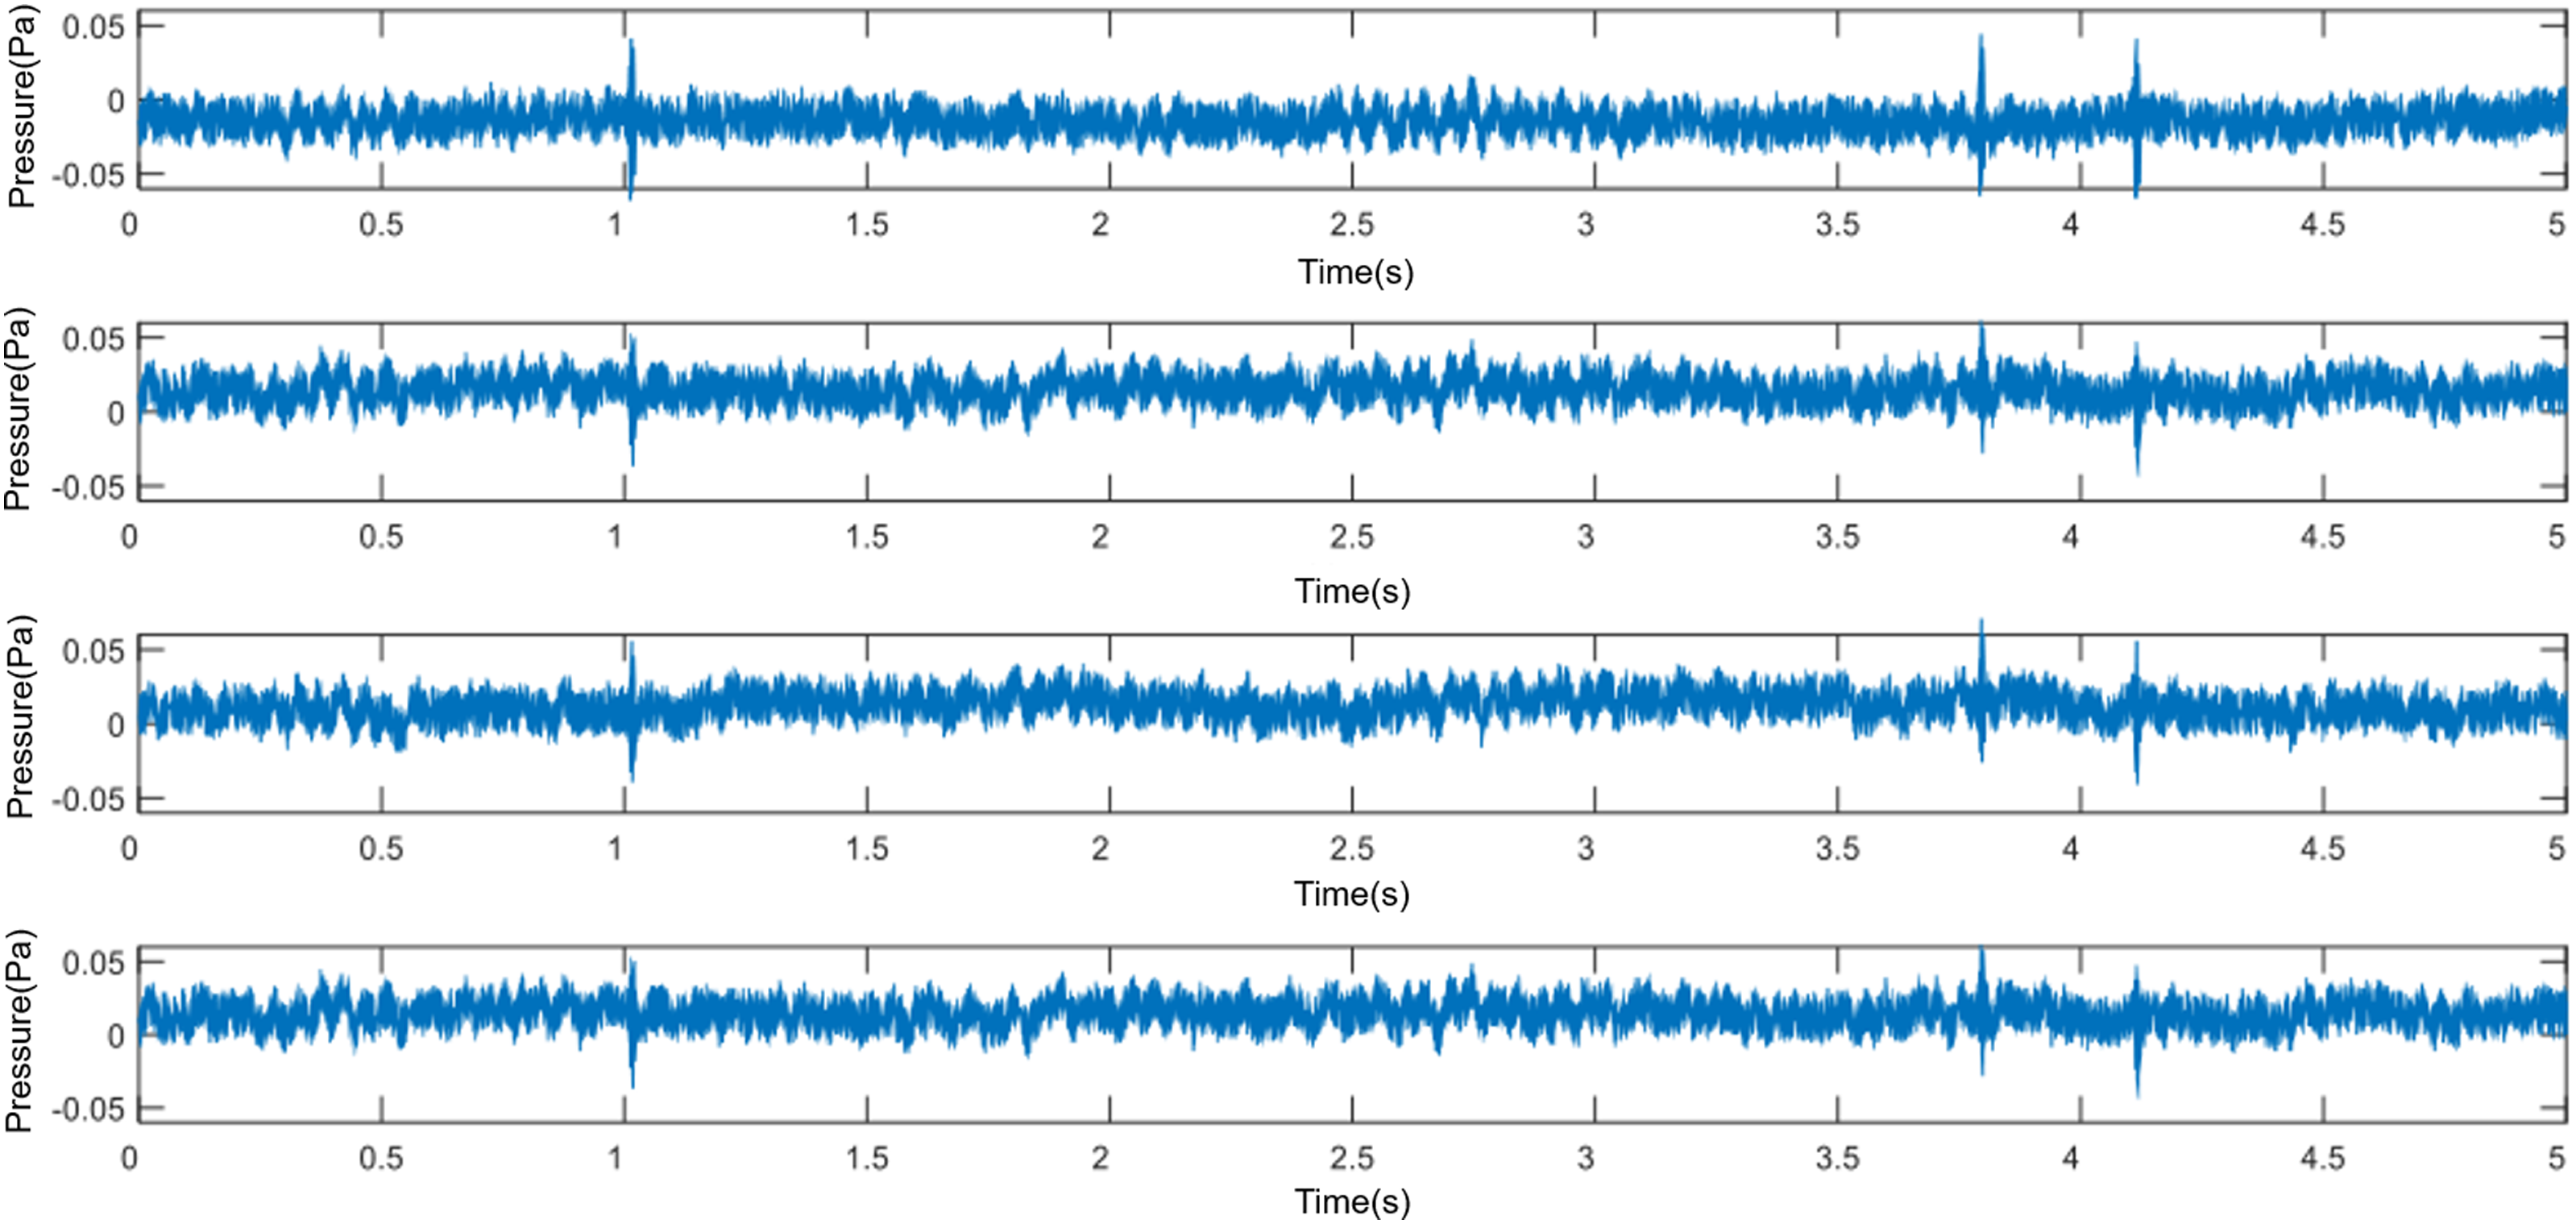
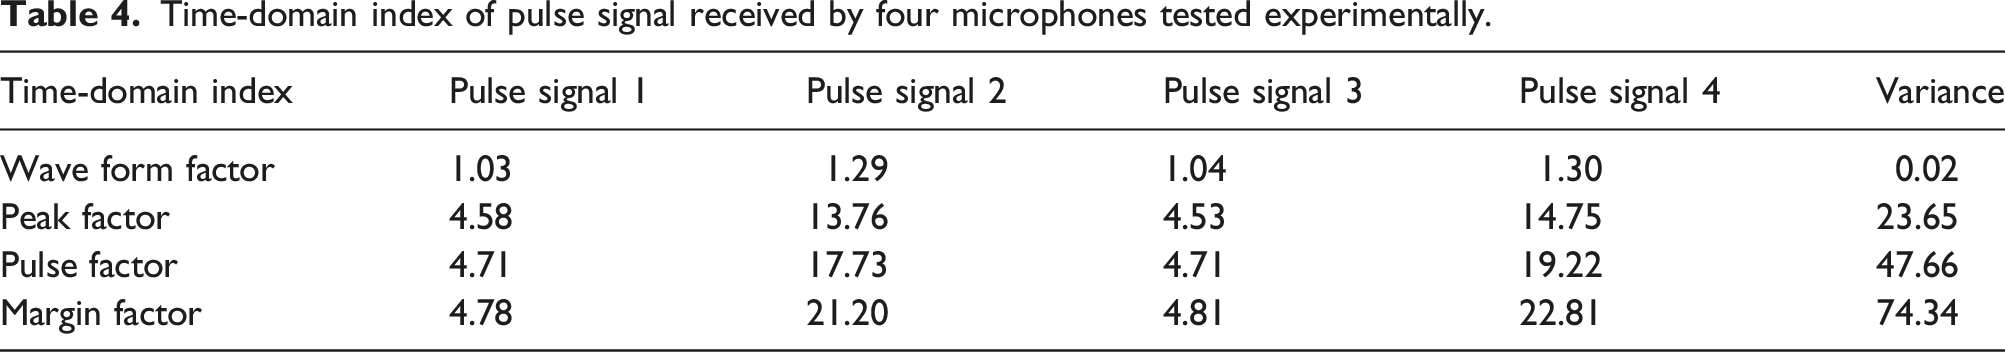
As can be seen from the results in Table 4, experimental test results of pulse signals belonging to the same type vary greatly in time-domain index according to the received signal strength, which is not conducive to pattern recognition of acoustic signals. According to the above research results, the optimization processing of the training sample of BP neural network is proposed by centralization and scaling. The centralized treatment method is shown in equation (5):
This paper scales the amplitudes of experimental test signals into uniform values, as shown in equation (6):
The optimized signals are shown in Figure 15, and the time-domain characteristic statistical indicators are shown in Table 5: Time-domain diagram of the signal after centralization and scaling. Time-domain indexes of 4 pulse signals after centralization and scaling.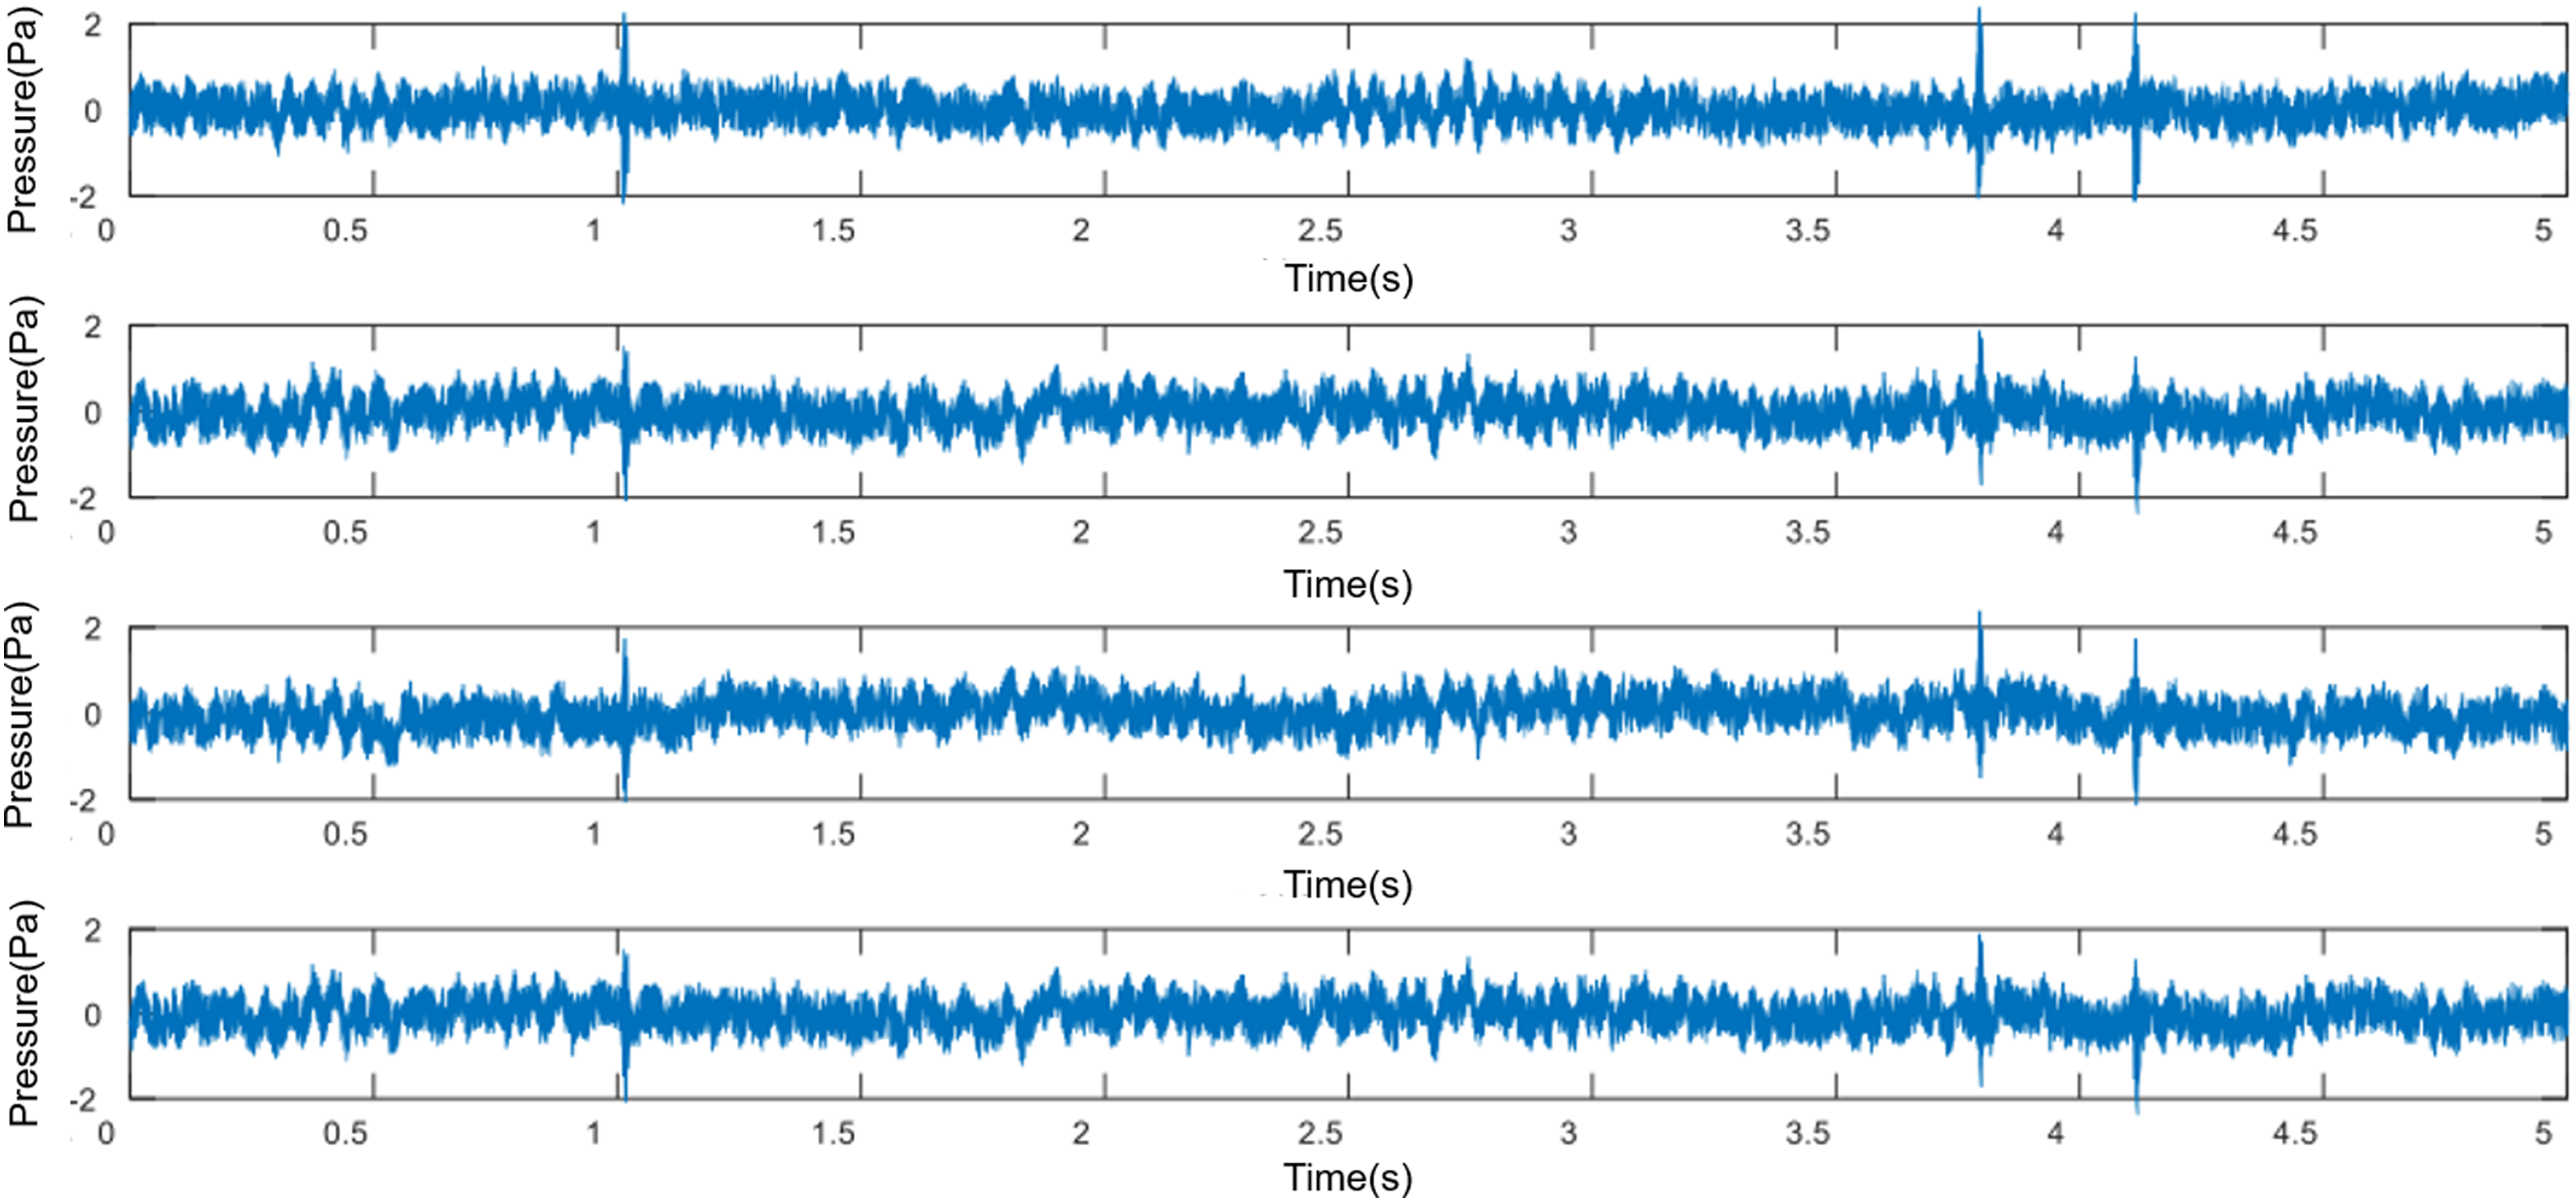
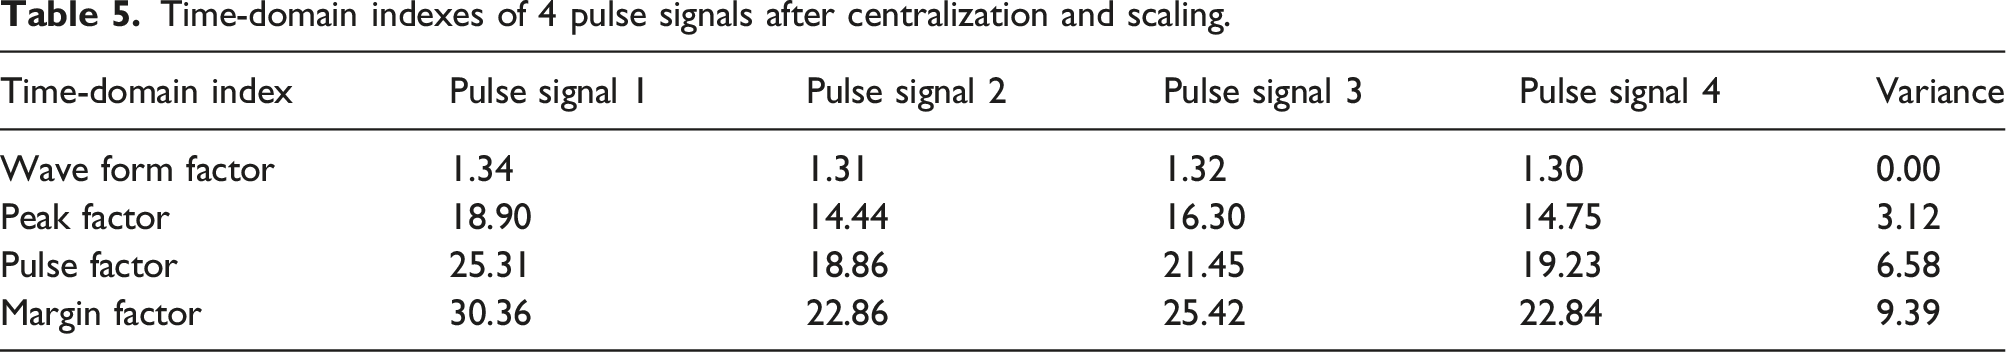
By comparing Table 4 and Table 5 and it can be found that the data oscillation after centralization and scaling has been well suppressed, and each time-domain index is basically near a preset value.
Selection of time-domain characteristic indexes of acoustic separation signals
Figure 16 shows the above four time-domain characteristic indexes of 20 groups of pulse signal, random signal and sinusoidal signal. Taking the waveform factor as an example, the waveform factor of the pulse signal fluctuates around 1.30, the random signal fluctuates around 1.25, and the sinusoidal signal fluctuates around 1.10. It can be seen that the four time-domain characteristic indicators of the three types of signals all have obvious hierarchical classification phenomenon, and the characteristic indicators of the same type of signals tend to be flat, which can be used as a reference basis for pattern recognition. Time-domain characteristic indexes of pulse signal, random signal, and sinusoidal signal.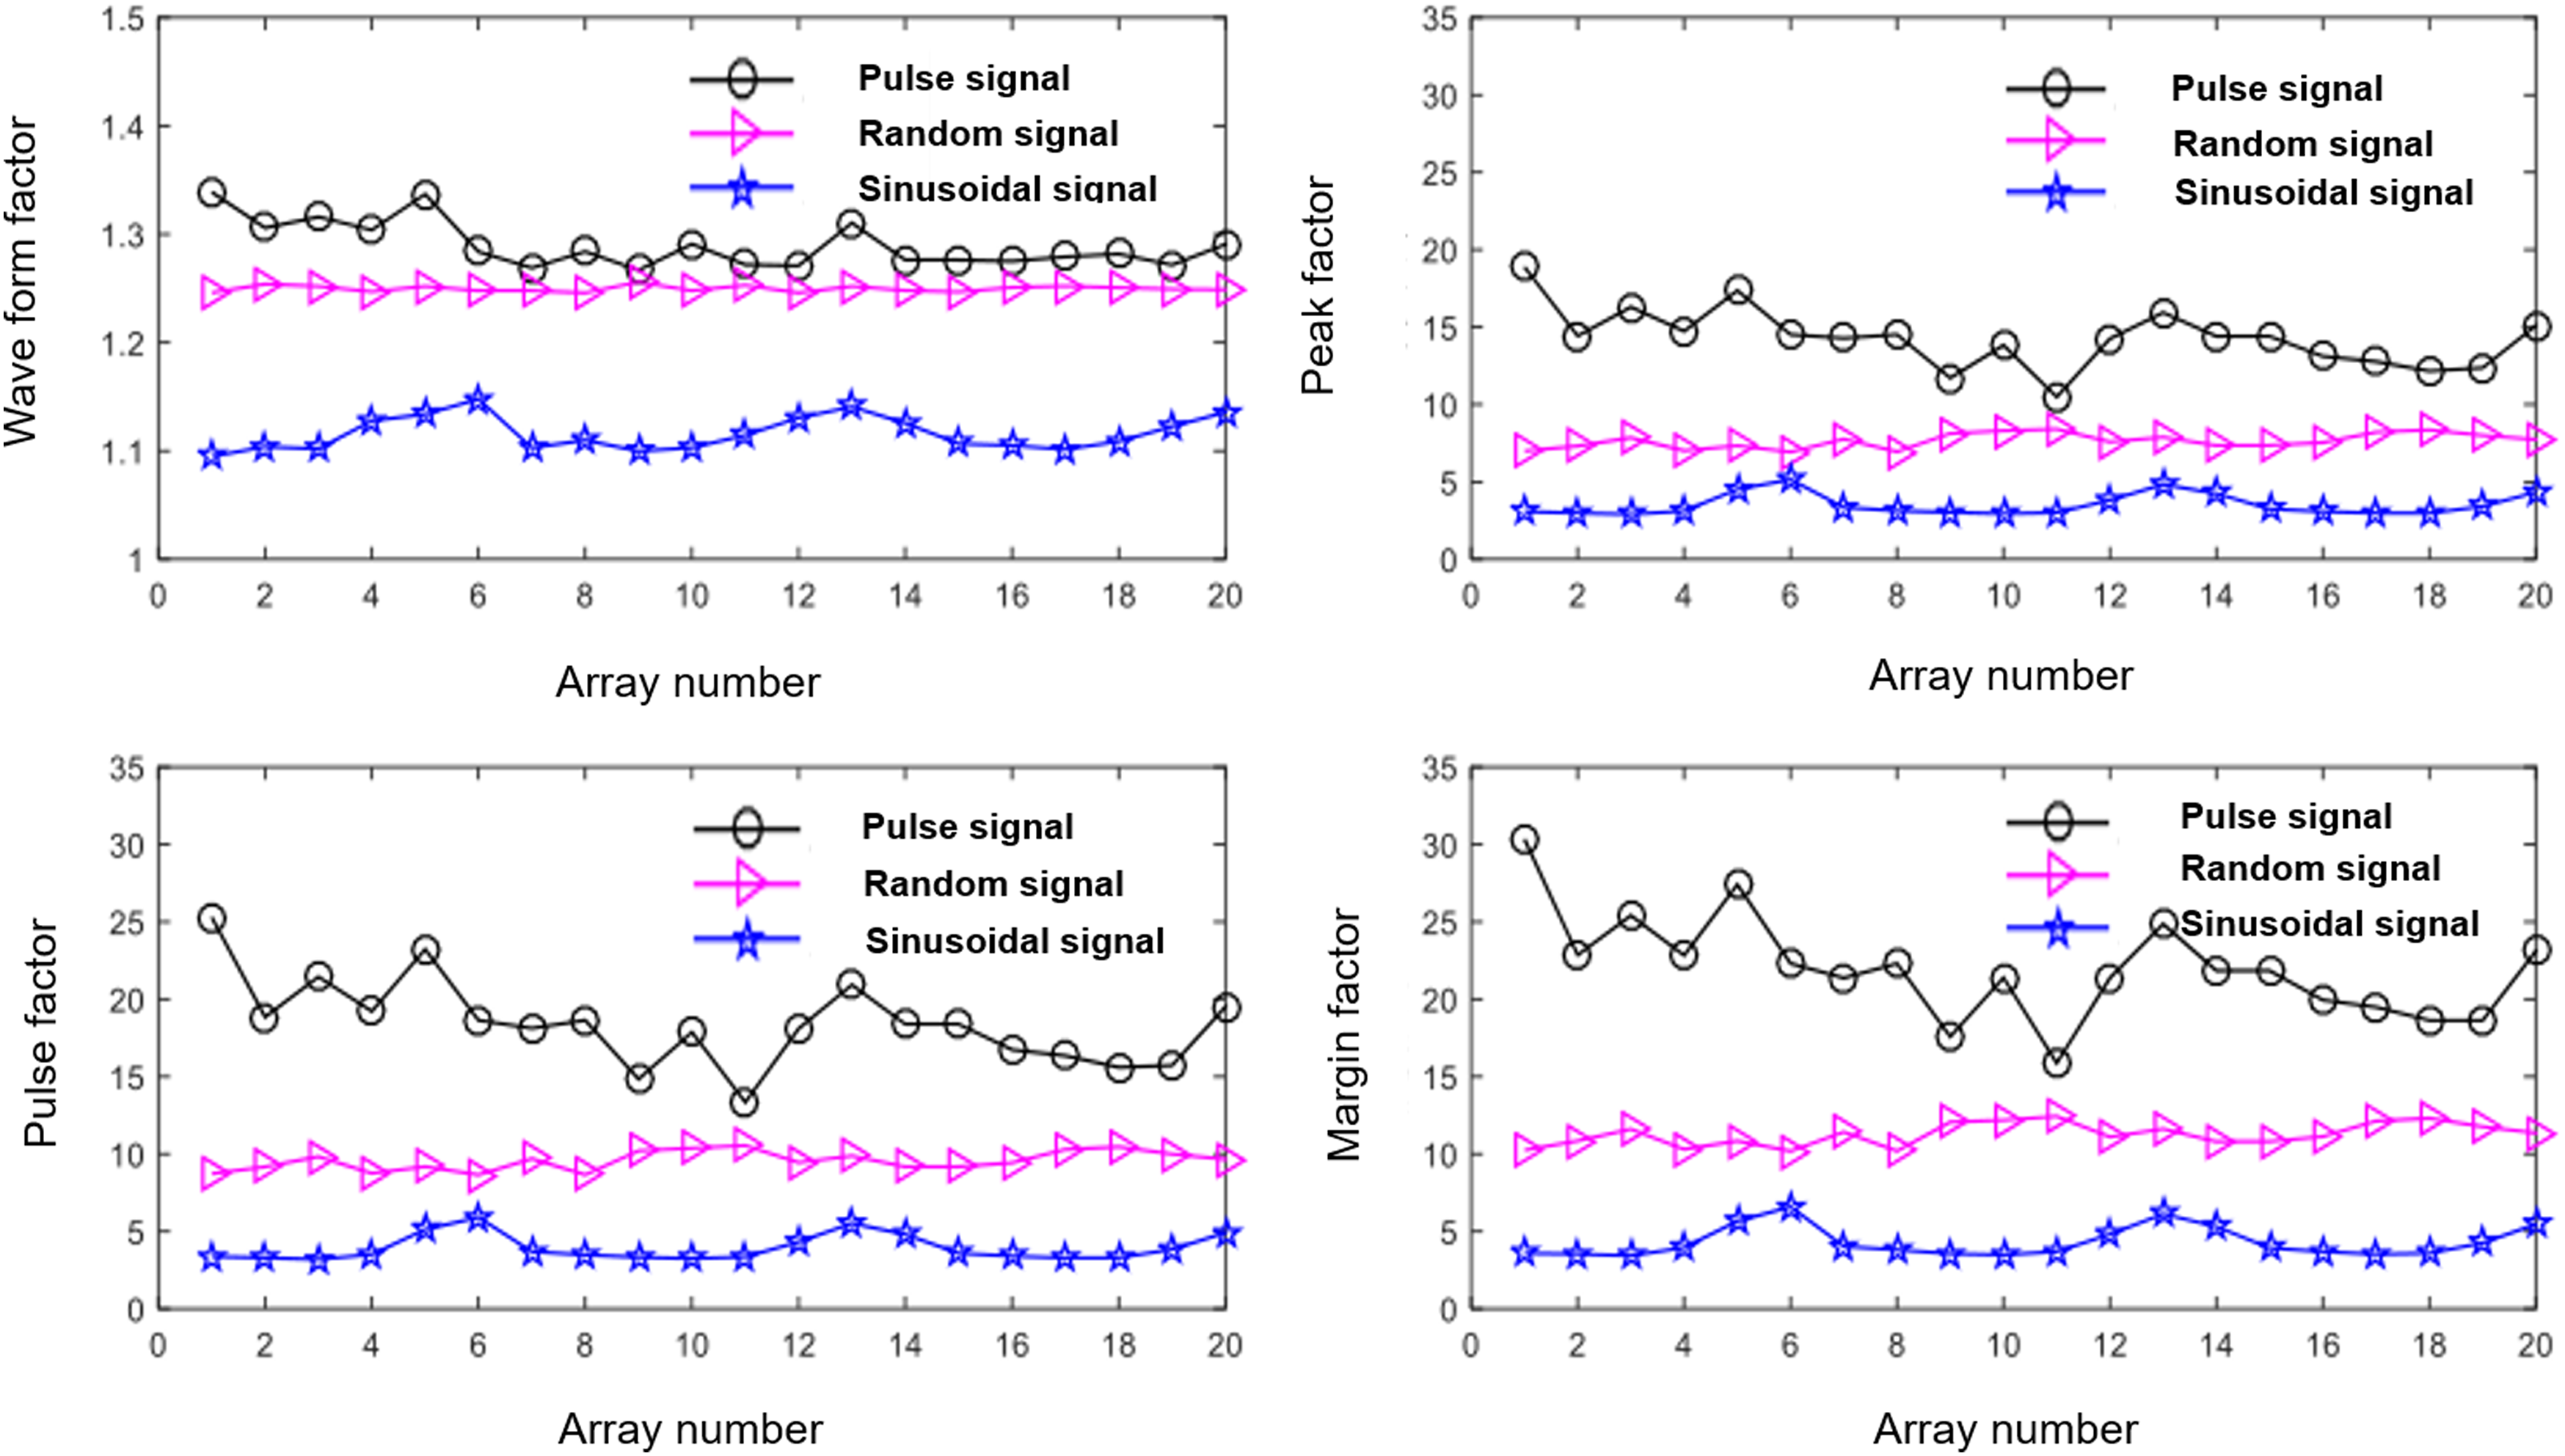
Establishment of training samples
A total of 60 groups of training samples were established according to the experimental test data. In order to verify the BP neural network training results, 6 groups of test data were reserved as test samples in addition to the above 60 groups of training samples. Considering the time-domain characteristics of pulse signal, random signal and sinusoidal signal with frequency of 200 Hz, waveform factor, peak factor, pulse factor, and margin factor were selected as input factors, and the input layer neurons were 4. The standard vectors of the output mode are (100), (010), and (001), corresponding to the pulse acoustic signal, random noise signal and 200 Hz sinusoidal acoustic signal, respectively, and the neuron of the output layer is 3. The elements of the output vector are values from 0 to 1, and the transfer function of the neurons in the output layer is S-type logarithmic function log sig. BP network with single hidden layer element was adopted, the number of hidden layer neurons was set as 11, and the transfer function of hidden layer neurons was S-type tangent function tan sig. The learning rate is 0.05.60 groups of experimental data are taken as sample data to establish a 4-11-3 BP neural network for the subsequent analysis of acoustic signals.
Verification of training results
Output result of BP network.
Conclusion
(1) Blind source separation method can be applied to the extraction of weak acoustic signals under strong background noise. Based on the observation signal, a set of time-domain data blind source separation algorithm is developed. The weak pulse sound signal with high randomness was used as the weak acoustic signal source, and the signal-to-noise ratio was set as −20 dB double interference source to realize the separation of weak pulse sound signal in time-domain. (2) Pattern recognition of separated signals can be carried out by selecting appropriate time-domain features. The centralization and scaling optimization of separated signals can eliminate the amplitude uncertainty caused by blind source separation in the process of pattern recognition. (3) Combining the blind source separation method with BP neural network, the 4-11-3BP neural network is constructed to carry out pattern recognition of three types of signal sources and realize pattern recognition of weak sound signals under strong background noise.
Footnotes
Acknowledgments
This work was supported by Project of the National Natural Science Foundation of China: Research on the Separation and Identification of Multi target Noise Sources in Complex Sound Fields Based on Phase Conjugation Method (No. 51609037); Basic Research Business Fee Project of Dalian University of Technology: Research on Location and Imaging of Ship Radiated Noise Sources in Complex Marine Environment (No: DUT22GF206). The authors would like to thank Miss. Renjie Zhao for the adjustments and revisions to the article.
Declaration of conflicting interests
The author(s) declared no potential conflicts of interest with respect to the research, authorship, and/or publication of this article.
Funding
The author(s) disclosed receipt of the following financial support for the research, authorship, and/or publication of this article: This work was supported by the Research on Location and Imaging of Ship Radiated Noise Sources in Complex Marine Environment (DUT22GF206) Research on the Separation and Identification of Multi target Noise Sources in Complex Sound Fields Based on Phase Conjugation Method (51609037).