
Abstract
Bolted joints play an important role in aerospace, machinery manufacturing, weapons and other fields, and the contact pressure distribution at the connection interface seriously affects the service performance of the bolts. Contact pressure analysis is an essential basis and reference for structural design, calibration, inspection, and safety monitoring of bolted connection structures. Considering the preload force and frictional contact between the joint components, a block mapping hexahedron mesh generation and finite element modeling method for bolted connections is presented, and the finite element models of single and double bolted structures are constructed. Then, an experimental test platform for measuring contact pressure distribution is constructed. Comparison of finite element analysis results with experimental results for the contact pressure distribution in the single and double-bolted joints; the root mean squared error of contact pressure distribution is less than 5%, which verifies the effectiveness of the finite element models. After that, the models are used to study the contact pressure distribution in single-bolted joints and contact pressure coupling effect of double-bolted joints, and the normal stress distribution features within members and contact pressure distribution contour are revealed for single and double-bolted joint. Finally, the finite element models are adopted to investigate the effects of the clamping length, preload, material properties, hole clearance, and bolt size on contact pressure distribution in single-bolted joints. The coupling effect of contact pressure distribution in double-bolted joints under different preloads and geometric parameters are also examined.
Introduction
As a classical form of mechanical connection, the bolted joints are widely used for fastening two or more parts together to constitute a component in modern engineering structures due to their properties of easy to disassembly, low cost, and high load-bearing capacity.1–3 For different working environments and load conditions, there are convenient ways to design bolted joints and select the appropriate fasteners. 4 However, the existence of the connection interface disrupts the consistency and continuity of the structure, resulting in the transfer of loads and motions through the contact interface for the bolted joints, which in turn affects the mechanical properties of the whole structure.5–7 The influence of the contact interface on the mechanical properties is mainly reflected in the connection stiffness between members in bolted joints. 8 The connection stiffness is an essential physical quantity for dynamic modeling of bolted joints under external load and can be calculated by combination of Hertzian contact theory at the microscopic level with fractal theory at the macroscopic level. 9 The contact pressure magnitude and its distribution are the basis of the Hertzian contact theory analysis, thus, the contact pressure is a prerequisite for the calculation of the connection stiffness of the contact interface. 10 In this context, the mathematical representation of contact pressure distribution is a scientific problem that needs to be solved. Before that, we need to know the characteristics and change rules of contact pressure distribution under different preloads and geometric parameters. Therefore, this work focuses on the features and regular pattern of contact pressure distribution in single and double bolted connection structures. In the modeling and simulation process, we assume that the contact interface is all ideal smooth surfaces. The study of the contact pressure on the connection interface has important engineering value for structural optimal design and safety management of bolted connection structures.11–13
Despite of so important of contact pressure distribution for bolted connection structures, there is little published literature on this topic. Mantelli et al. 14 placed the pressure-sensitive film between two members of a single-bolted joint for measuring the contact pressure distribution. Pau et al. 15 compared the two experimental methods: pressure-sensitive films and interface ultrasonic waves reflection, and the contact pressure distribution characteristics obtained from the results of both experiments were consistent. Based on some necessary assumptions, Nassar et al. 16 and Haidar et al. 17 developed two analytical models for the contact pressure distribution using the contact radius of contact interface in single-bolted joints, where the contact radius is related to conical envelope angle, plate thickness, and bolt head radius. Oskouei et al. 18 established a finite element model of a three-layer plate structure with a single bolt connection and used the model to conduct a simulation study of the clamping pressure distribution, which showed that the clamping pressure distribution in the plates showed a crock-shaped. Stephen et al. 19 investigated the contact pressure distribution of single bolt connections by ultrasonic wave experiments, the contact pressure is not monotonically decreasing along the direction perpendicular to the centerline of the screw hole, and the peak contact pressure is near the hole edge. However, these research papers were focused on the single-bolted joints and the coupling phenomenon of contact pressure distribution for double-bolted joints has not been investigated in detail.
The finite element method plays an important role in structural design and analysis, and it is also applicable to bolted connection structures. The most important feature in the numerical calculation of bolted joints is the interface contact problem, which can be processed and solved with high accuracy by the finite element method. Wileman et al. 20 and Sethuraman et al. 21 simplified the single-bolt joints to a quarter axisymmetric plane model and obtained the member stiffness by the finite element method. Kim et al. 22 proposed four modeling methods for 3D finite element models of bolted joins and validated them by static experiments. Nevertheless, literature search results showed that little works have been done to study the contact pressure distribution in bolted connection structures, much less for the contact pressure coupling effect of multi-bolted joints, and the effects of preload and geometric parameters on the contact pressure distribution are still unknown.
This paper presents a method of block mapping hexahedron mesh generation and finite element modeling for bolted connections, and constructs the finite element models for single and double bolted joints and the face-to-face contact pairs between the contact components are defined. The models are then applied to investigate normal stress distribution feature within members and contact pressure distribution contour. The finite element analysis (FEA) results for single and double-bolted joints are verified by comparing with a series of experiment results. Parametric studies are performed to determine the effects of the structural parameters and preload on the contact pressure distribution in single-bolted joint. The coupling effect of contact pressure distribution in double-bolted joints under different preloads and geometric parameters is also investigated. The flowchart of this research is shown in Figure 1. Flowchart of this research.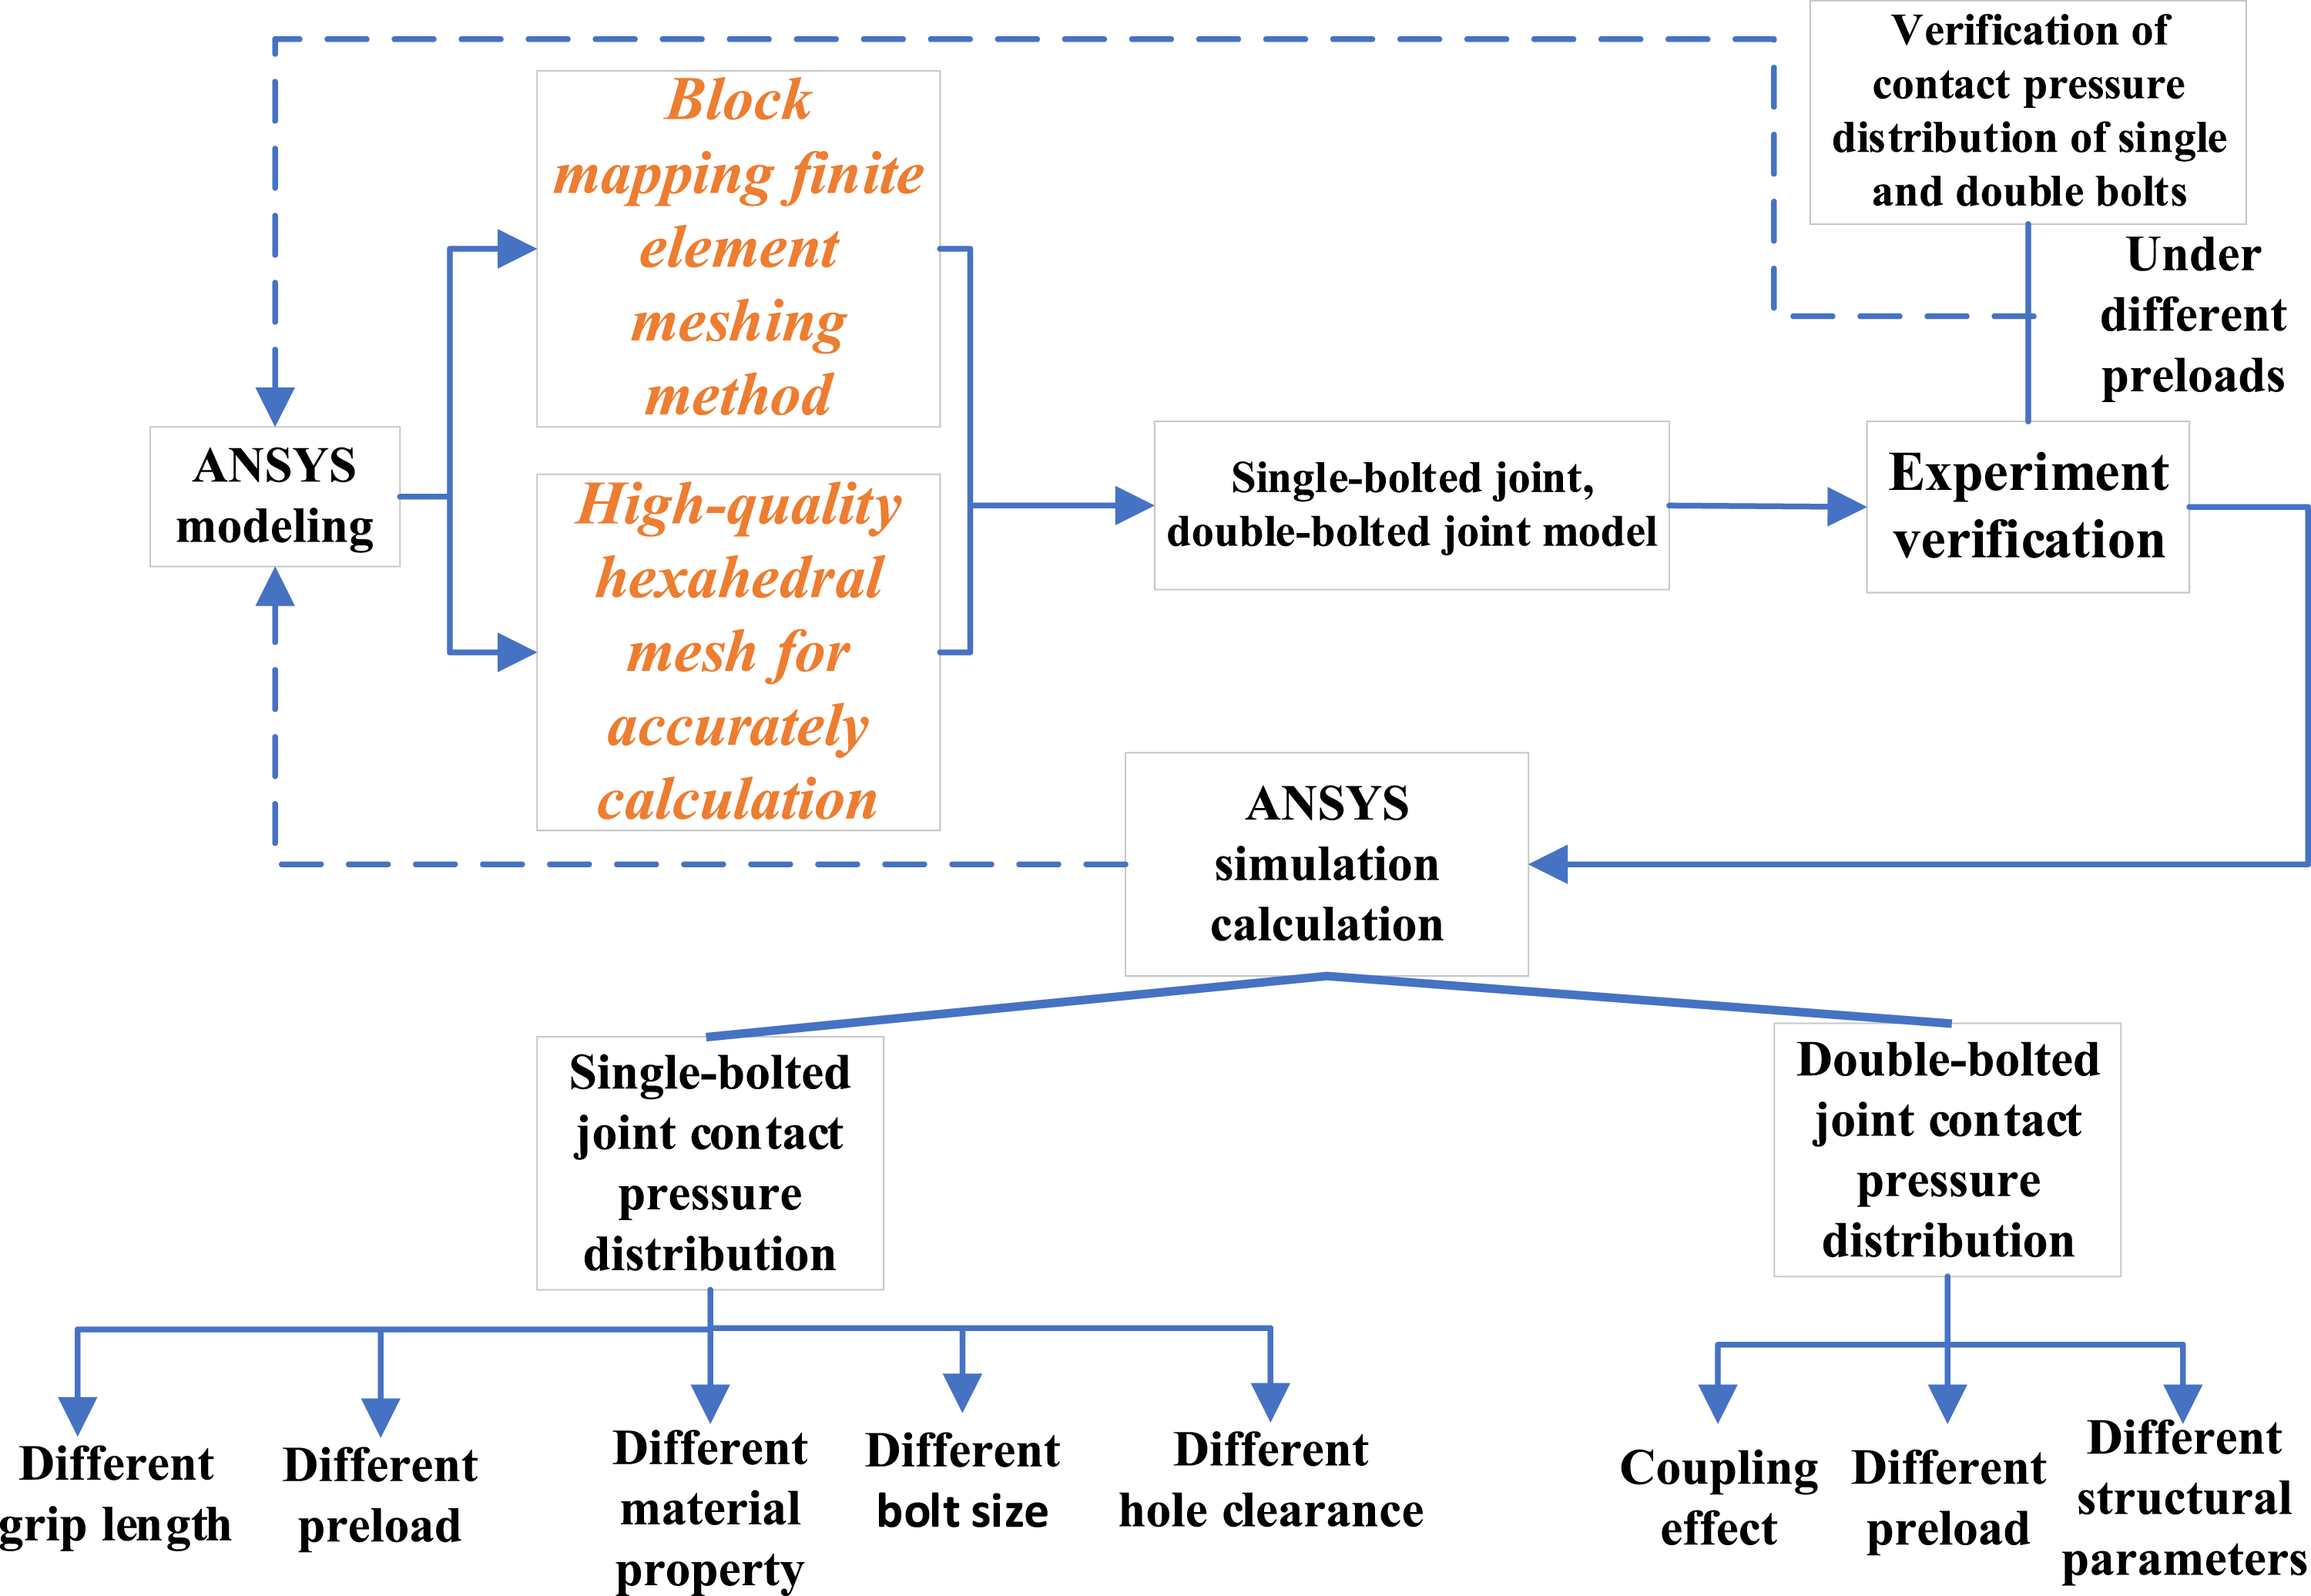
Finite element modeling of bolted joints
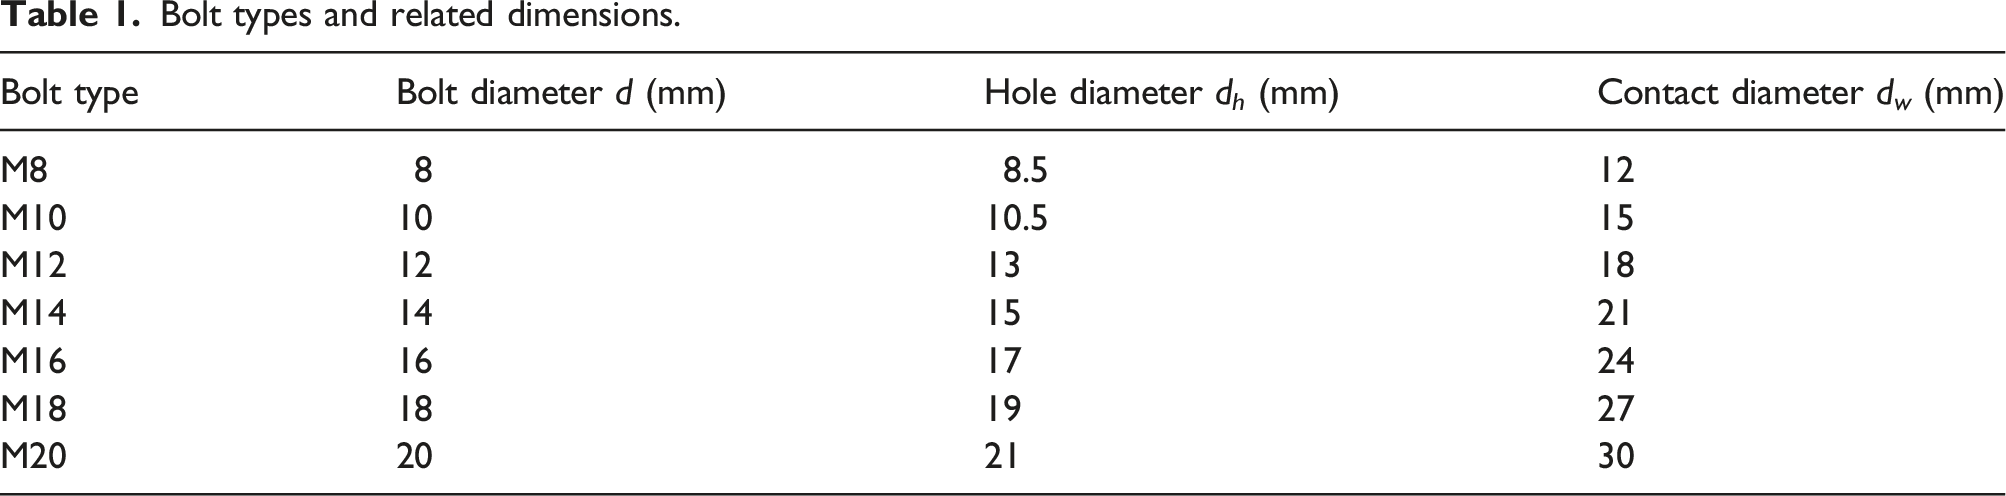
In order to build a finite element model of the bolted connection structures, a typical single-bolted joint structure consisting of bolt, nut, upper, and lower plates is used in the modeling, as shown in Figure 2. D0 represents the outer diameter of the plates, and the thickness of upper and lower plates can be expressed, respectively, by t1 and t2, while L = t1 + t2 denotes the grip length. The d is the nominal diameter of bolt, and the d
h
is the hole diameters of plates, while the contact diameter between upper plate and bolt head can be expressed as d
w
. According to Ref. 16, the contact diameter d
w
is 1.5 times the nominal diameter d of bolt. Commonly used bolt types and their related dimensions are listed in Table 1. The structure of double-bolted joint has one more bolt than that of single-bolted joint and will also be modeled for the investigation of the coupling effect of contact pressure distribution in double-bolted joint. Typical structure of a bolted joint. Bolt types and related dimensions.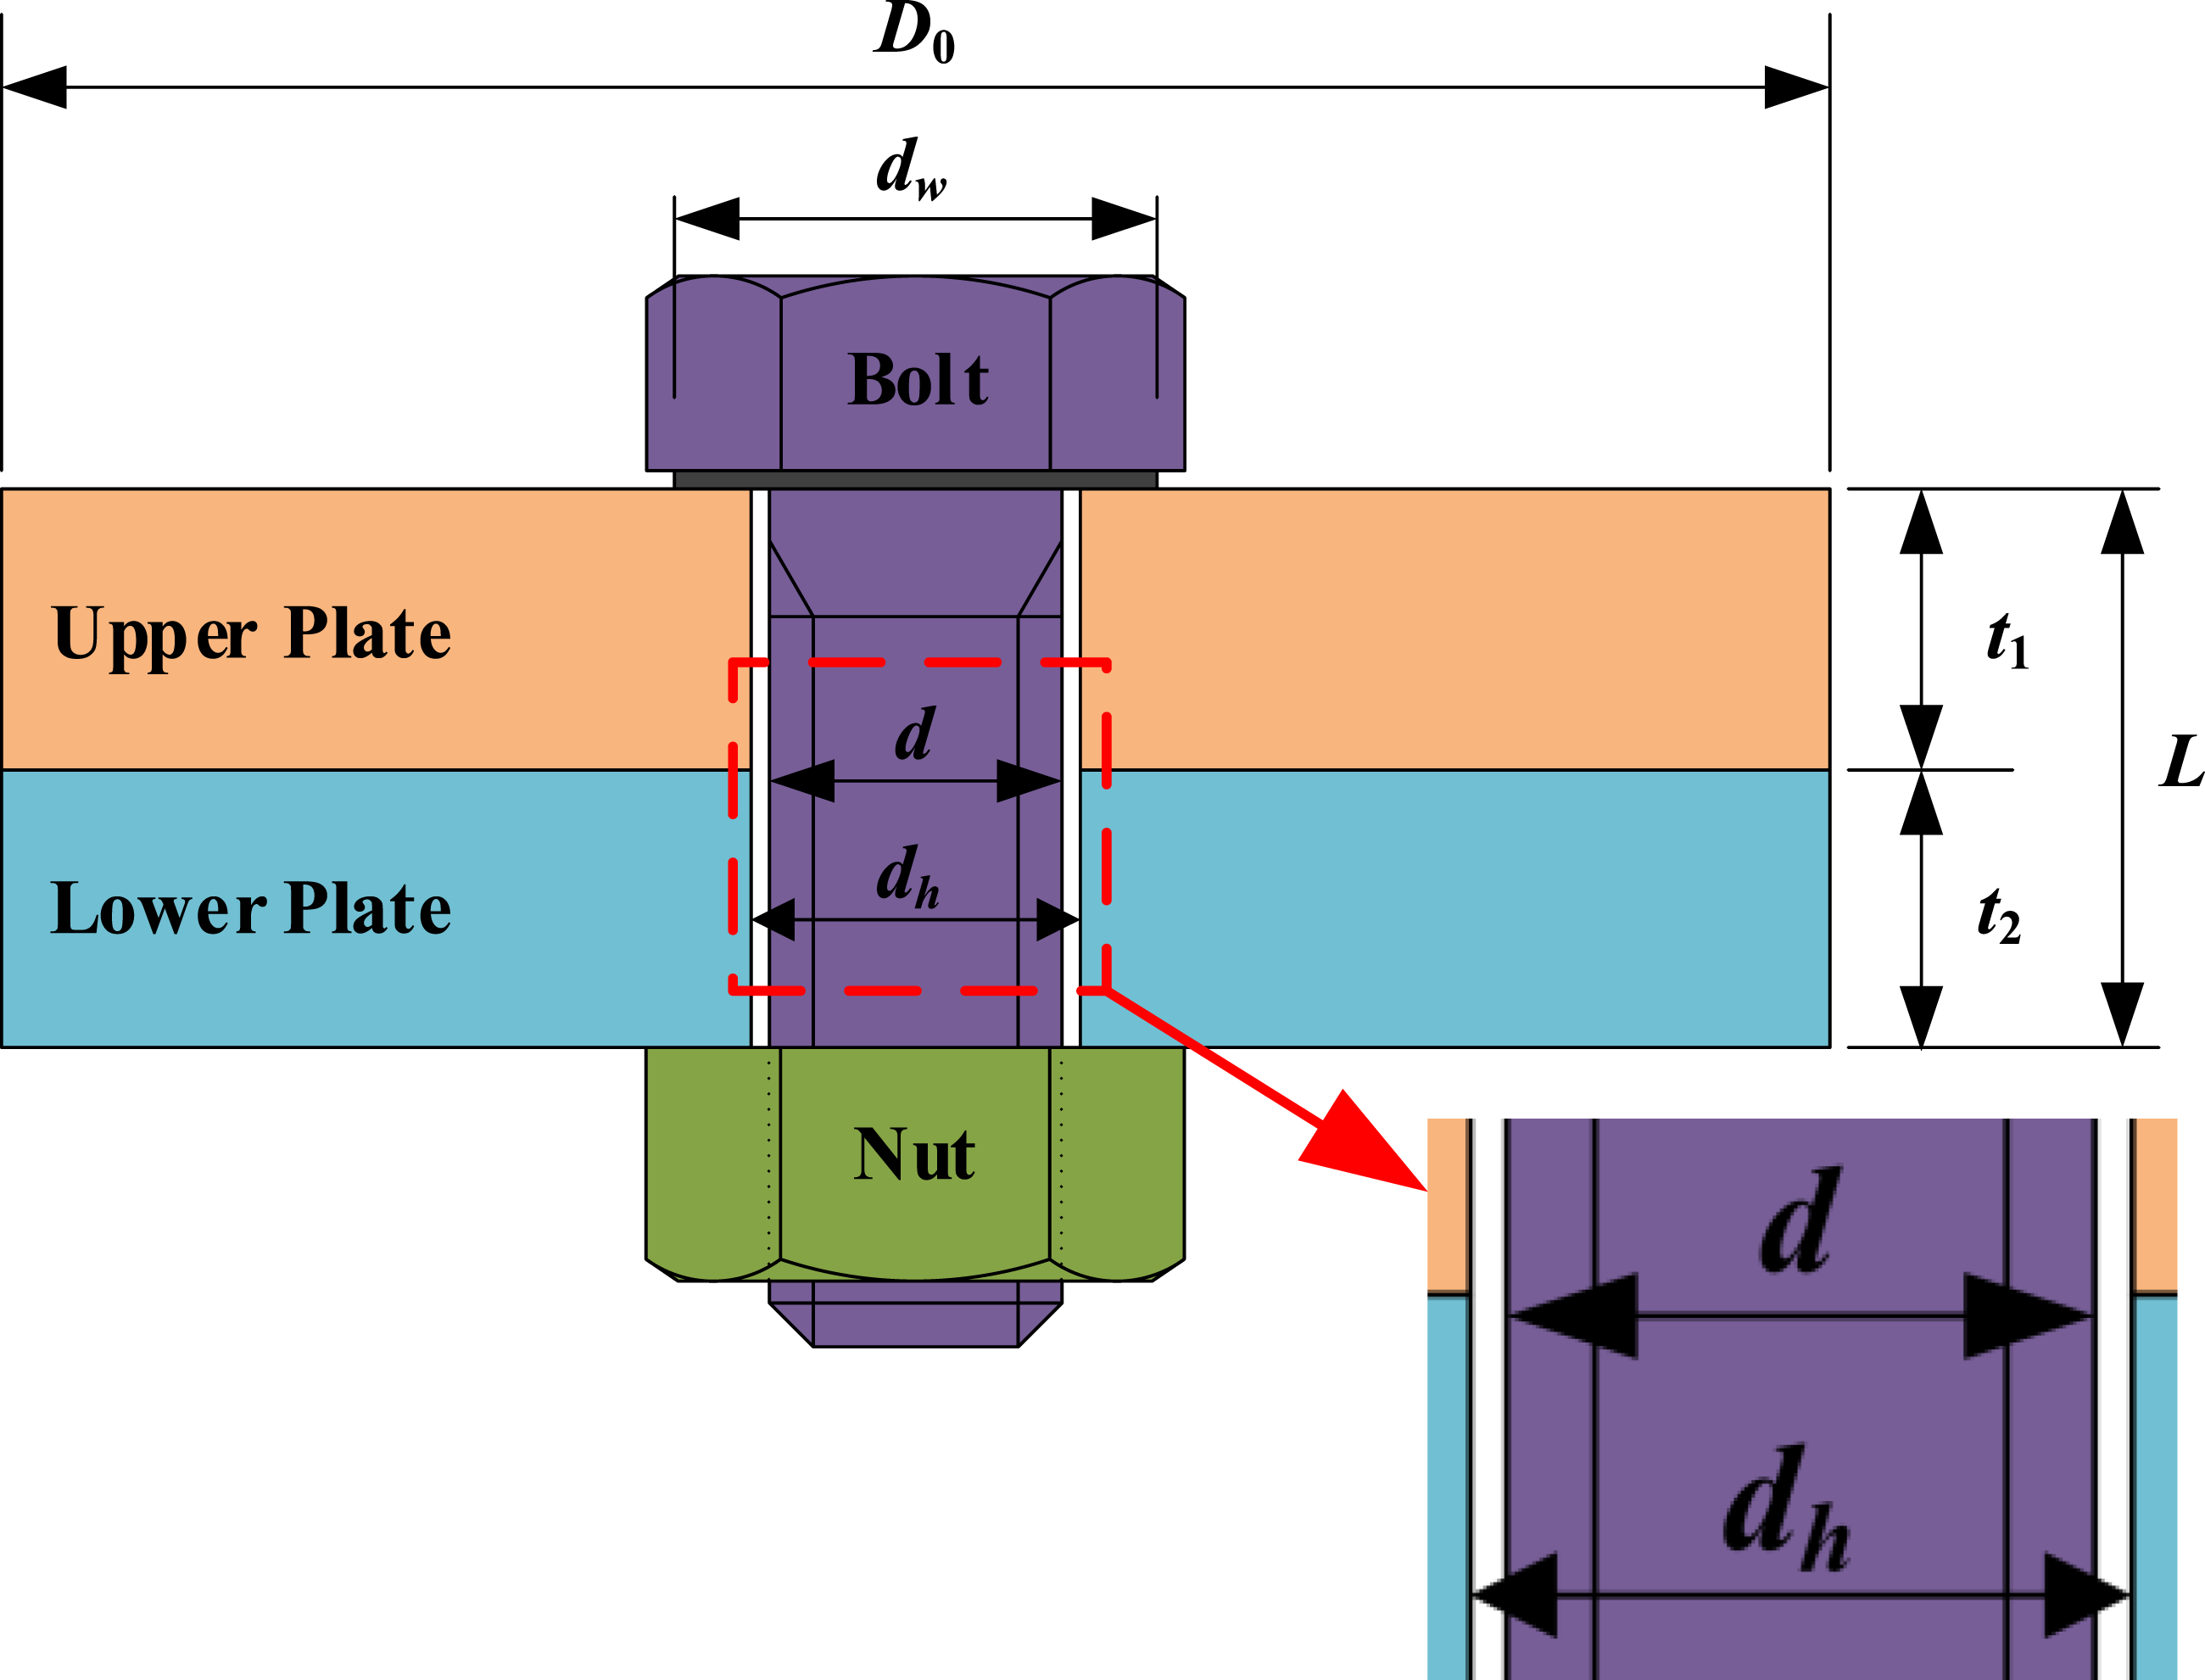
Block mapping mesh generation method
For the convenience of finite element modeling, the geometry of the bolted connection structure needs to be simplified. There are two principles of simplification, one is that the simplified geometric model is suitable for finite element meshing and can improve the efficiency of numerical calculation, and the other is that the simplified model cannot affect the analytical results of contact pressure distribution of the contact interface between two plates. In accordance with the requirements, we simplify the bolt head and nut to two cylinders with the identical diameter of d w . The strain of the thread under preload has little effect on the contact pressure at the interface, so the threads on the bolt and nut are ignored. In addition, the length and width of clamped plates are large enough, without considering the effect of the boundary of plates on the contact pressure distribution. Then, the simplified 3D solid model of bolted joints can be constructed in the ANSYS software.
In order to generate a high-quality hexahedral mesh with regular shape for more accurate contact pressure distribution calculation results, a block mapping finite element meshing method is developed in this paper. The method first slices the solid model according to the geometrical structure features, and each part of the sliced model is then mapped for meshing. Figure 3 shows the solid slice block model with single and double bolted joints. First, the bolt is split into two parts, a solid cylinder and a hollow cylinder, while the plate is split into a hollow disk containing the screw holes. Then, the overall bolted joints are divided by two virtual planes perpendicular to each other, two planes parallel to each of the two sides of the plate, and the intersection line of the two planes is the centerline of the bolts. Finally, the bolt joints are divided into a four-part structure that is symmetrical around the centerline of the bolt. For the blocks of bolt, nut, and hollow discs, the number of segments per edge is set, and the hexahedral mesh mapping is divided using the VMESH command in ANSYS software. For the corner plate block on the outside of the hollow disk, a regular face mesh needs to be drawn using the AMAP command, after which the mapped hexahedral meshing of the corner plate block is performed by the VSWEEP command. Developed solid model of single and double bolted joints (after using ANSYS software to cut the bolted joint into blocks, each solid block is represented by a color to facilitate observation of the structure, which is conducive to mapping mesh division). (a) Single-bolted joint (b) Double bolted joint.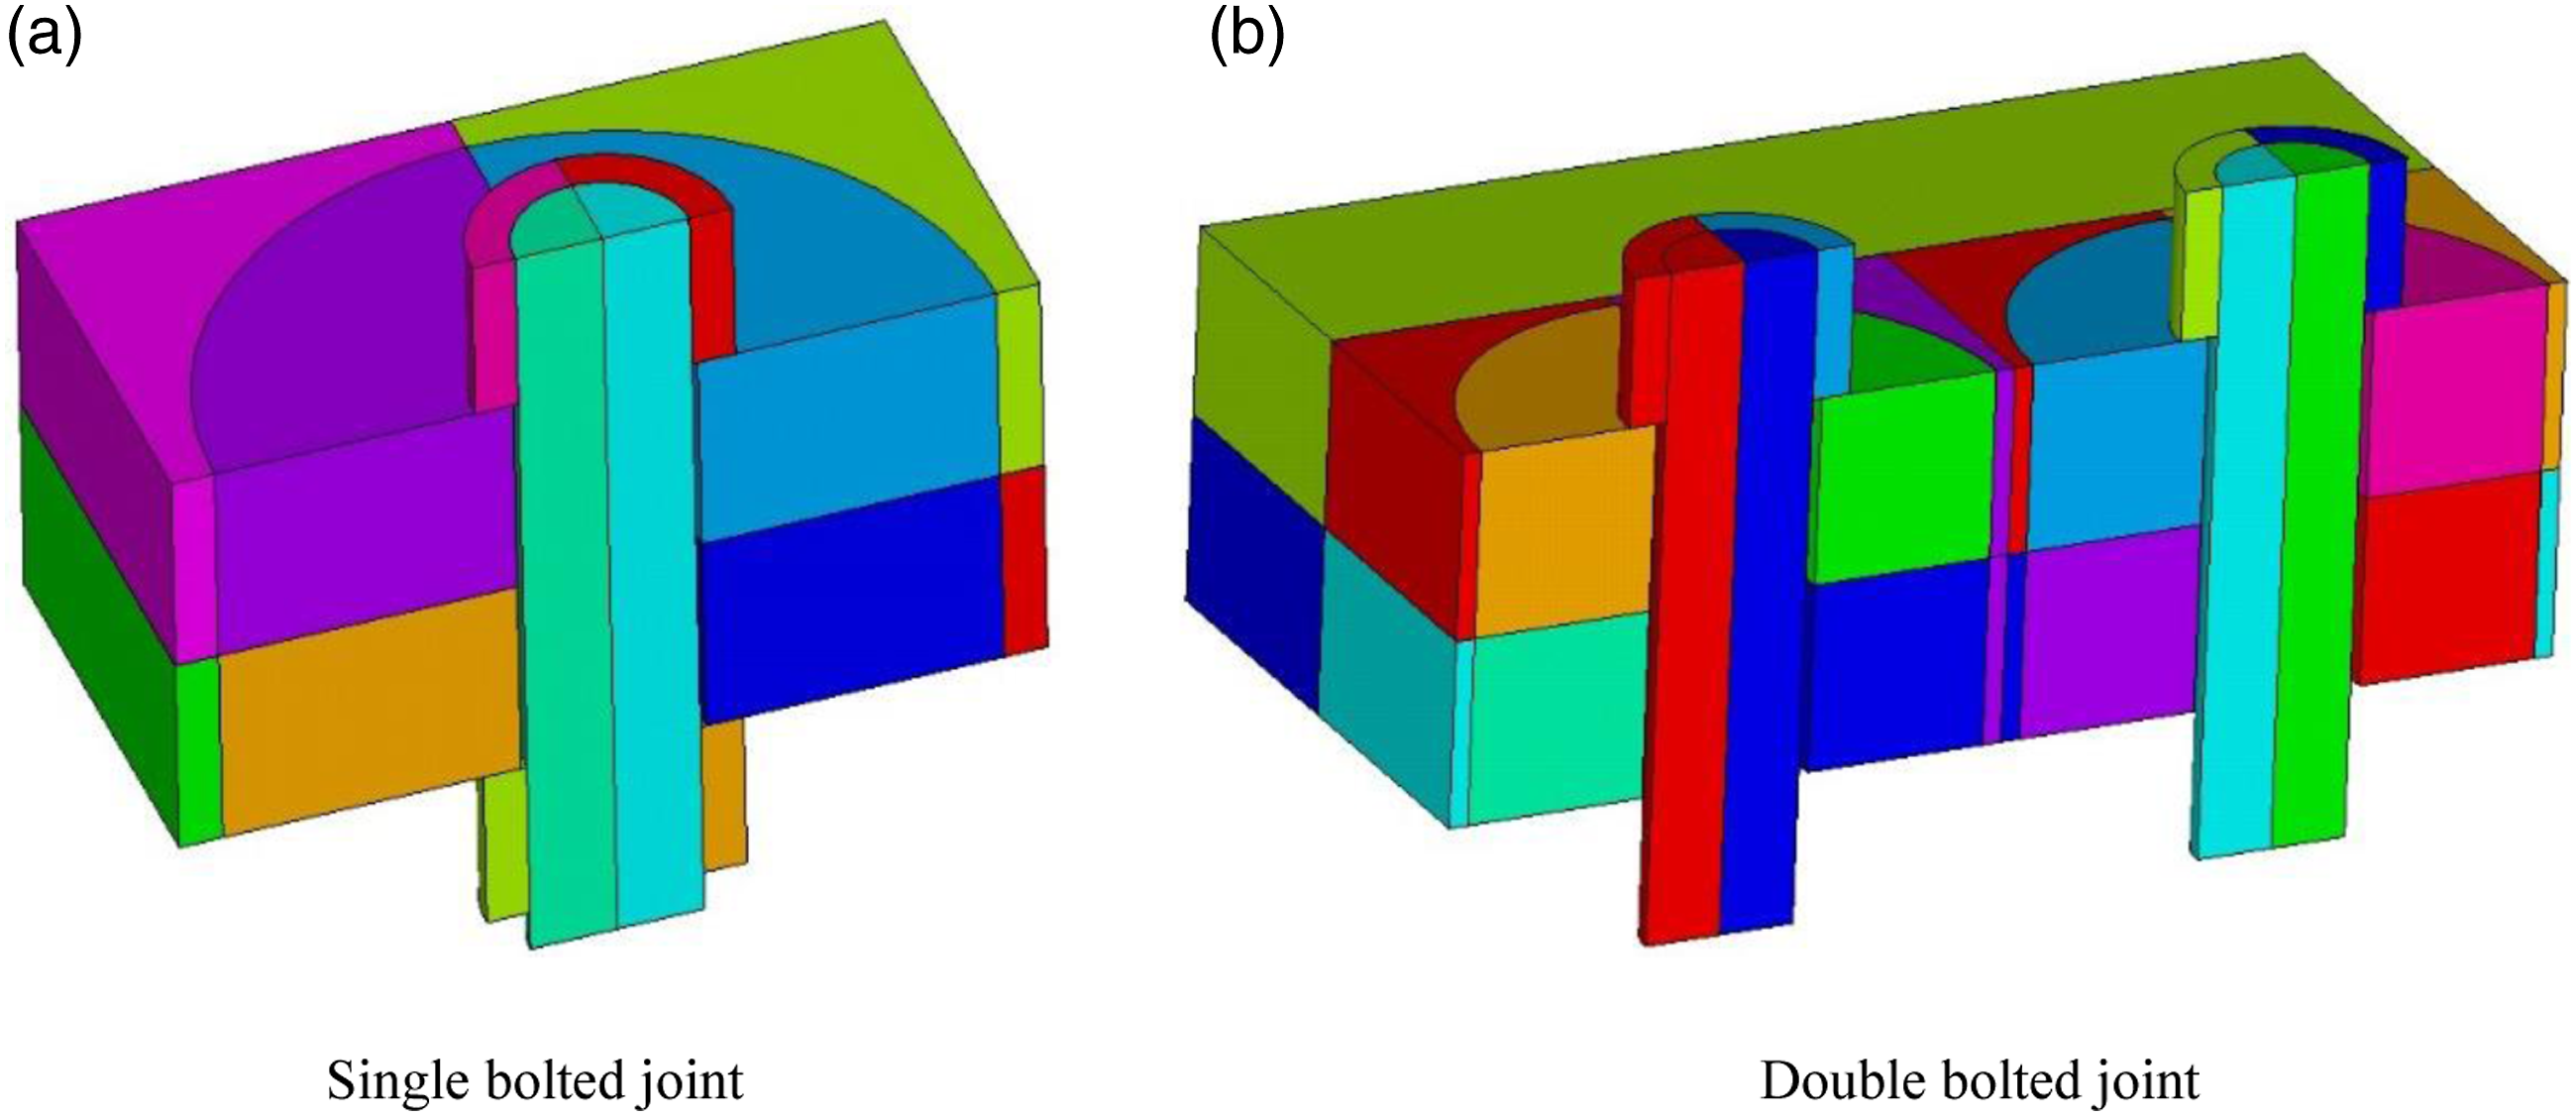
Model description of single-bolted joint
The FEA software ANSYS is employed to construct the finite element model of the single-bolted joint, as shown in Figure 4(a), where the physical model is discretized into brick element Solid 45 in ANSYS and the finite element model consists of 17,352 elements and 20,683 nodes. Three contact pairs in the finite element model are defined by surface-to-surface contact utilizing the target element TARGE170 and contact element CONTA174, which are applied to the contact surfaces between the upper plate and lower plate, bolt head and upper plate, and between the nut and lower plate. The boundary condition of the model is unilateral fixed in the form of a cantilever, that is, the degrees of freedom of all nodes on the left surface of the lower plate are completely constrained. The settings of contact and boundary are illustrated in Figure 4(b). (a) 3D finite element model and (b) intermediate cross-section diagram.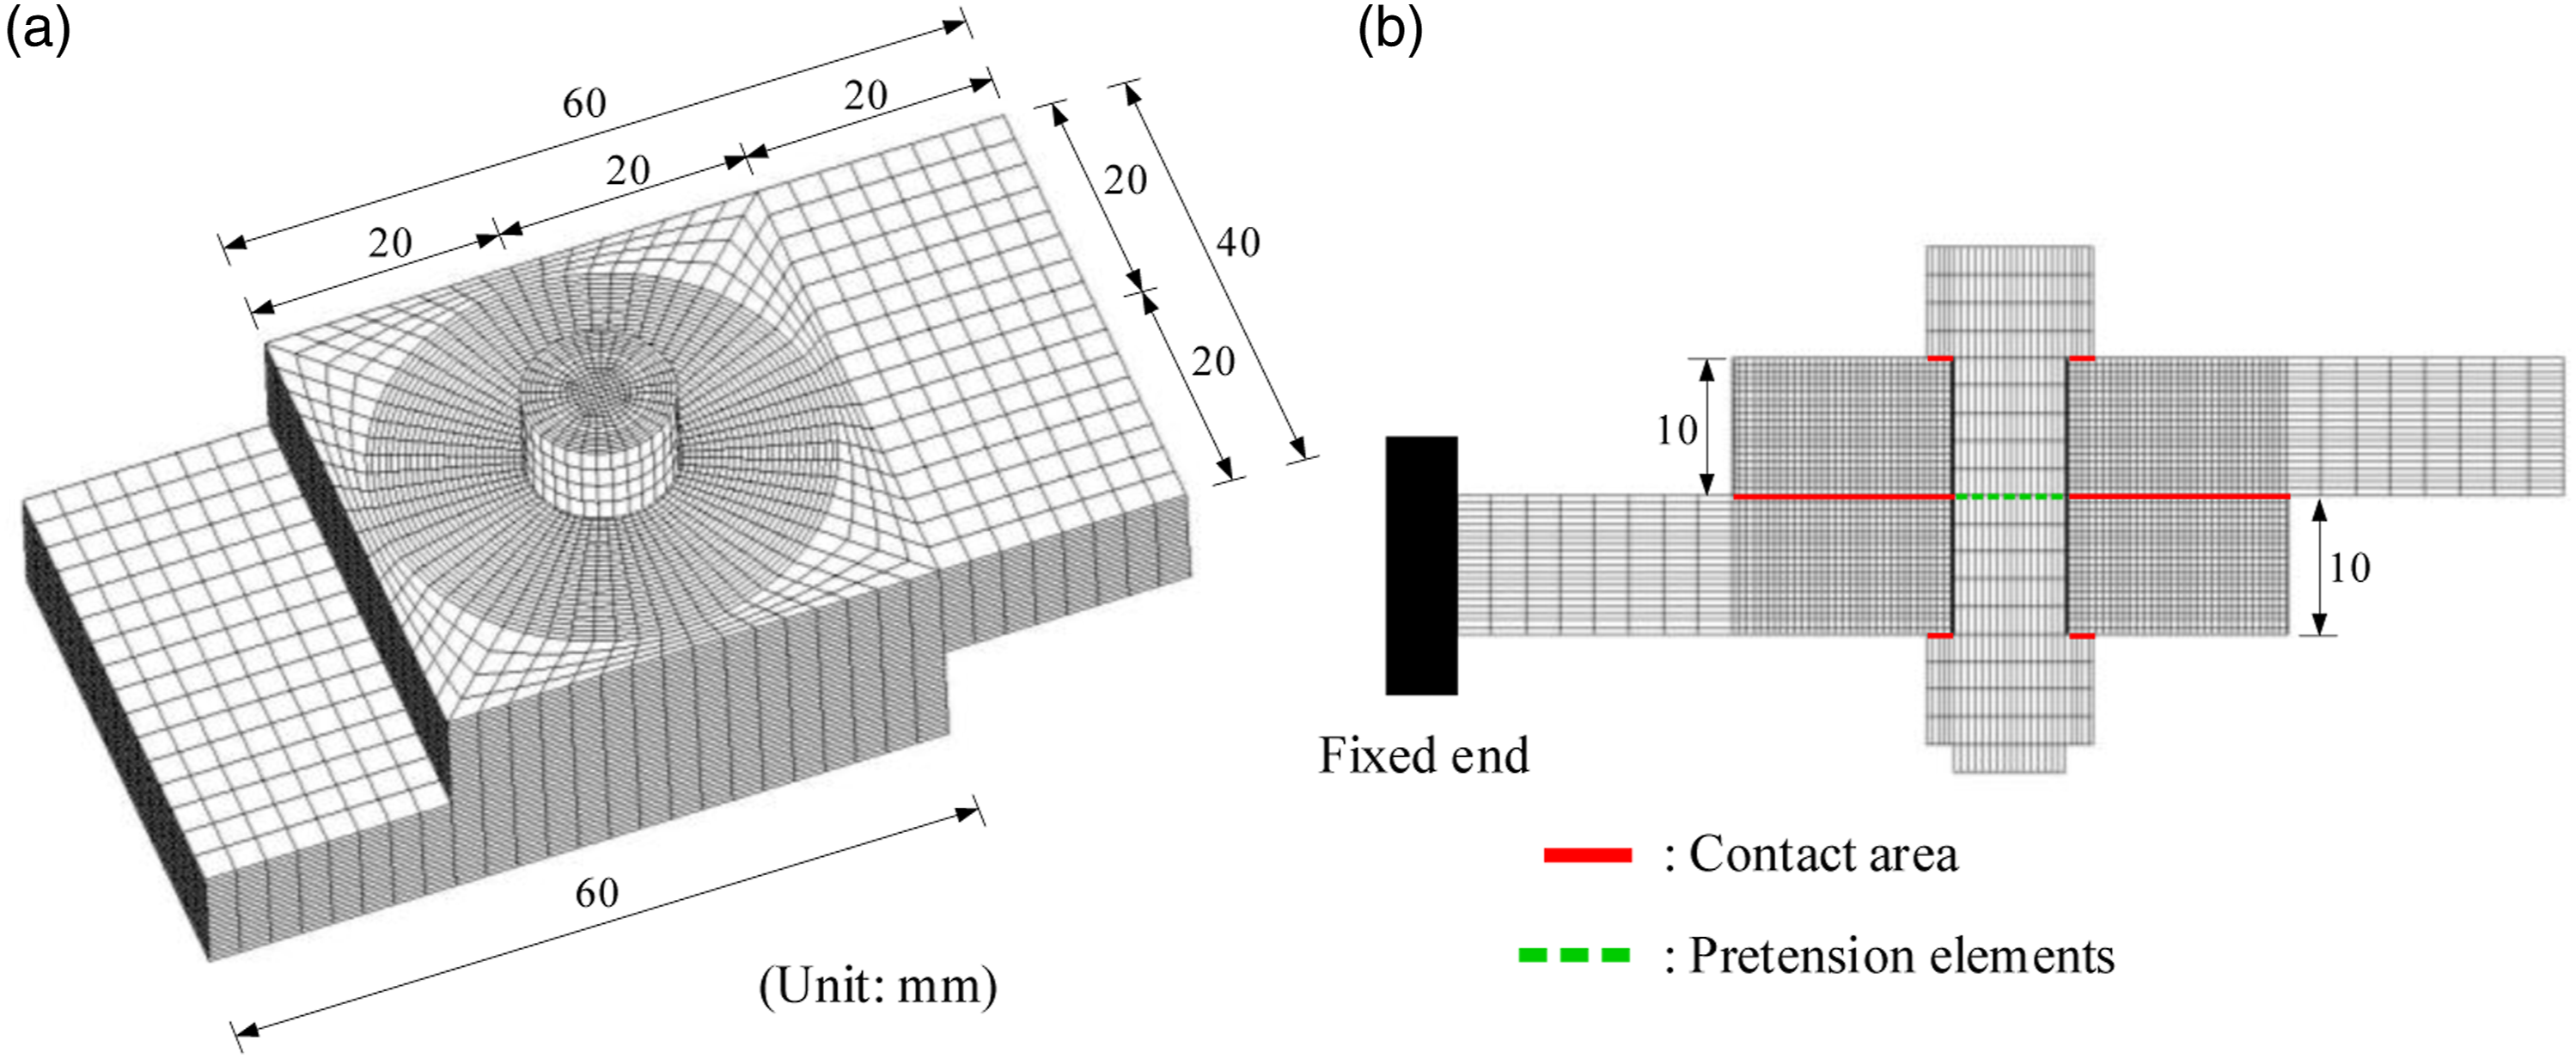
The upper plate and lower plate are clamped together by the bolt type of M8, and the two plates have the same hole diameter of 8.5 mm and the plate thickness of 10 mm. All the parts in the model are made of isotropic steel, where material properties can be set as the density is 7850 kg/m3, the elastic modulus E is 206 GPa, and the Poisson's ratio v is 0.3. The friction contact between the upper and lower plate, bolt head and upper plate, and between the nut and lower plate is characterized by the friction coefficients, which are set to 0.15.
ANSYS provides two methods for applying pretightening force to bolts in bolted connection structures. The first method is to define the pretension element PRETS179 on the stud circular cross-section and then set the value of the pretightening force directly on the pretension element. Another method is to assign a virtual temperature to the bolt and use the deformation of the bolt to generate pretightening force P according to the principle of thermal expansion and contraction. The relationship between pretightening force P and virtual temperature difference 
Finite element model of double-bolted joint
A double-bolted joint as representative is exploited to examine the coupling effect of contact pressure distribution between plates in multi-bolted joints and to survey the difference of contact pressure distribution between multi-bolted joint and linear superposition of single-bolted joint. Here, a double-bolted joint consists of two plates and two bolts, and has similar modeling method to the above single-bolted joint. The three-dimensional finite element model of double-bolted joint is established with the same bolt size, boundary condition, and material as the simple one, as shown in Figure 5, where the dimensions of joint components are illustrated and the unit of length is millimeter, while O1 and O2 represent the center line of bolt 1 and bolt 2, respectively, and D is the distance between two bolts. Finite element model of double-bolted joint.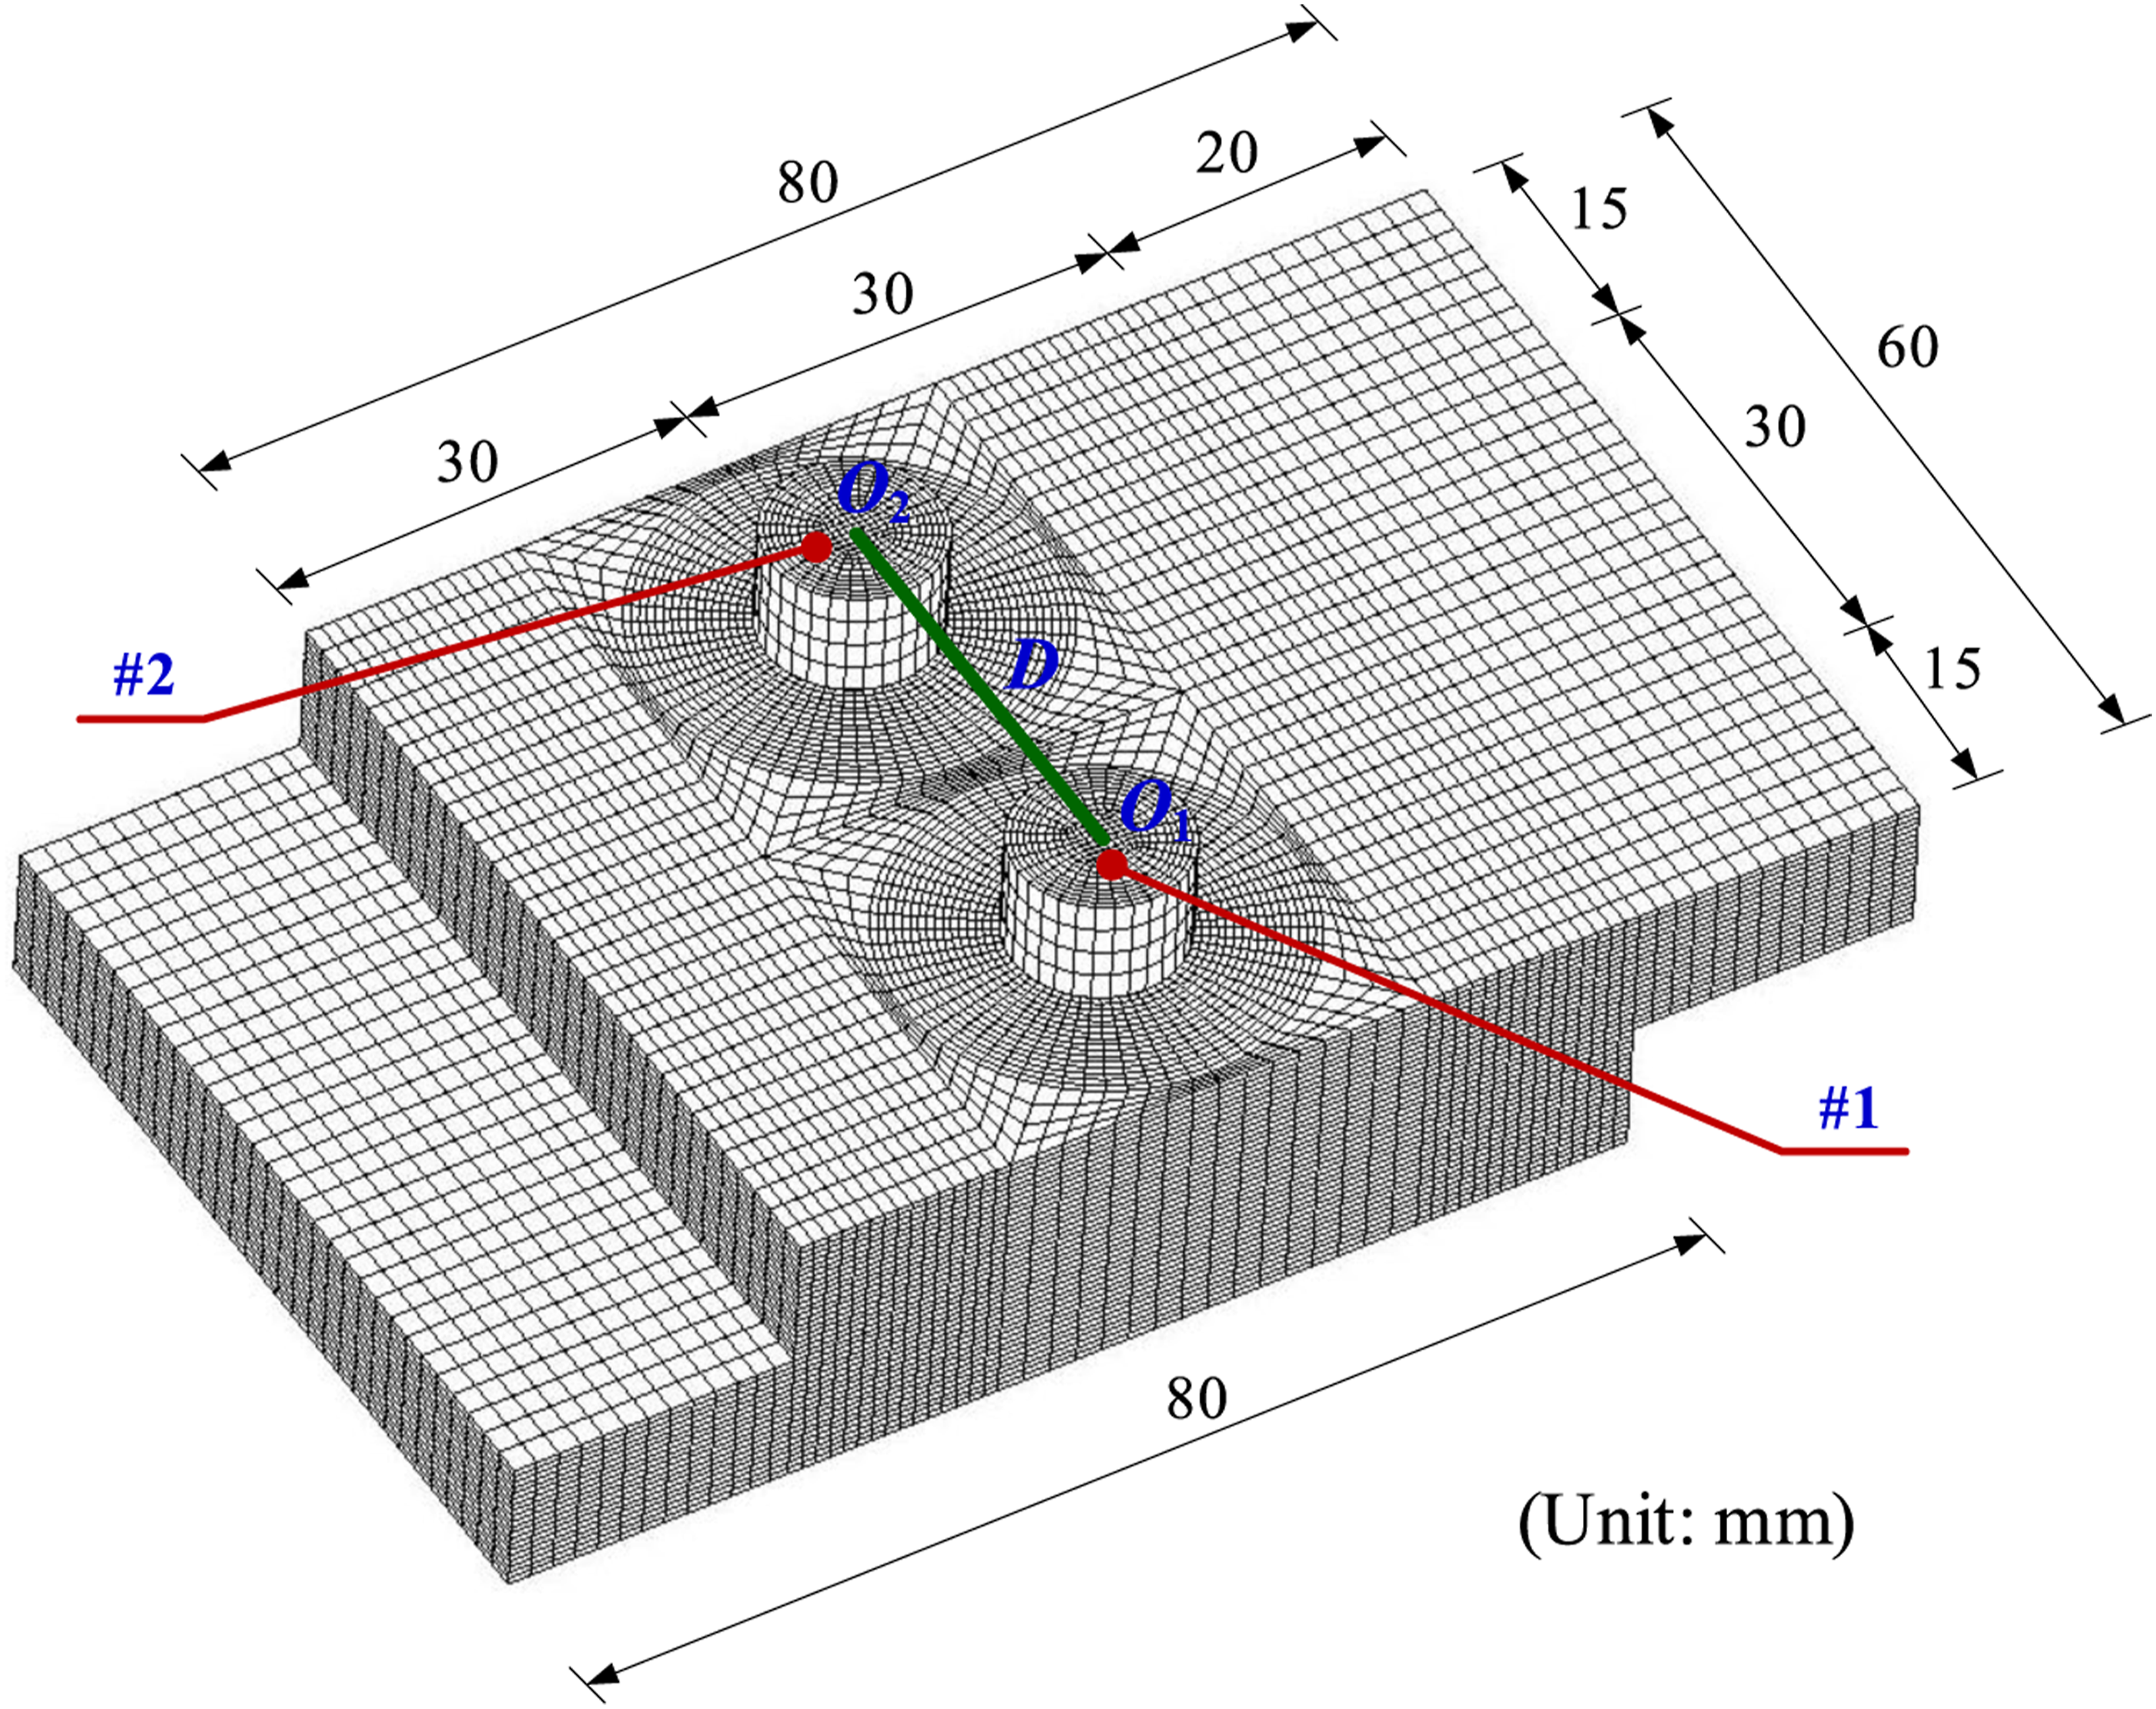
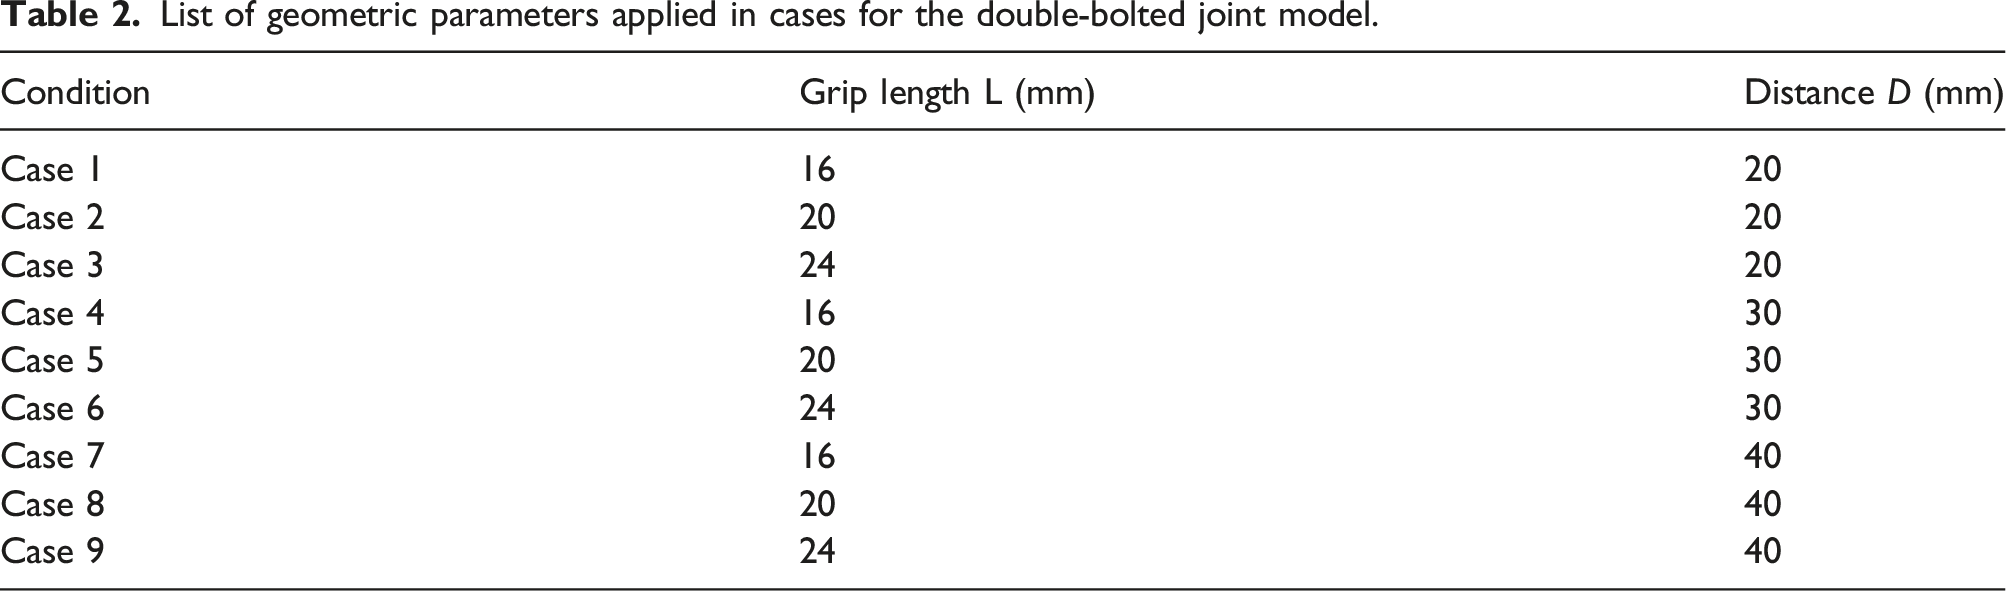
List of geometric parameters applied in cases for the double-bolted joint model.
Experiment verification
Experiment setup
For the validation of the finite element analysis of contact pressure distribution in single and double-bolted joint, a series of experiments on contact pressure distribution are carried out and comparisons between the FEA results and experiment results are conducted. The square plates with single bolt hole and double bolt holes are regarded as test specimens, whose dimensions and configurations are illustrated in Figure 6. The bolts of M8 are selected to connect the square plates. On the basis of the modeling, it is easy to construct the finite element models of test specimens. Configurations and dimensions of square plates.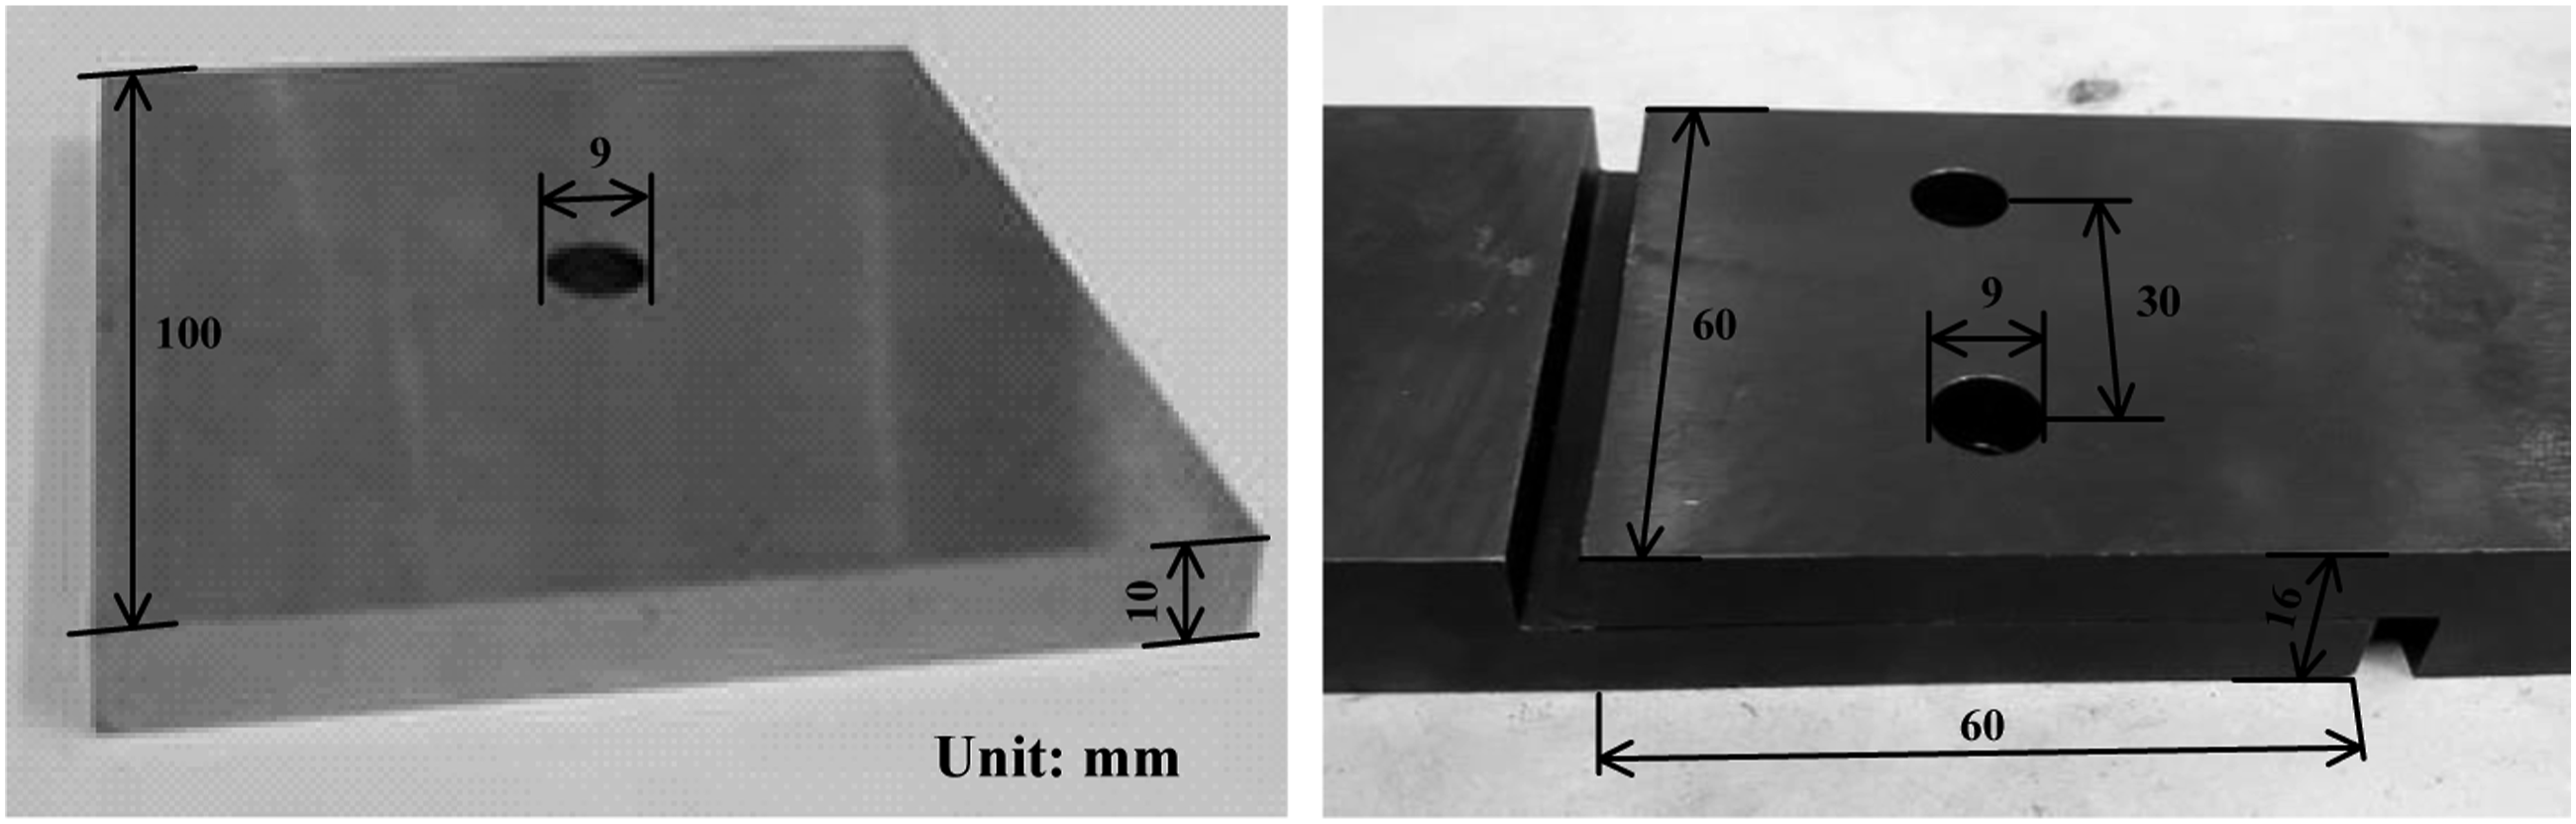
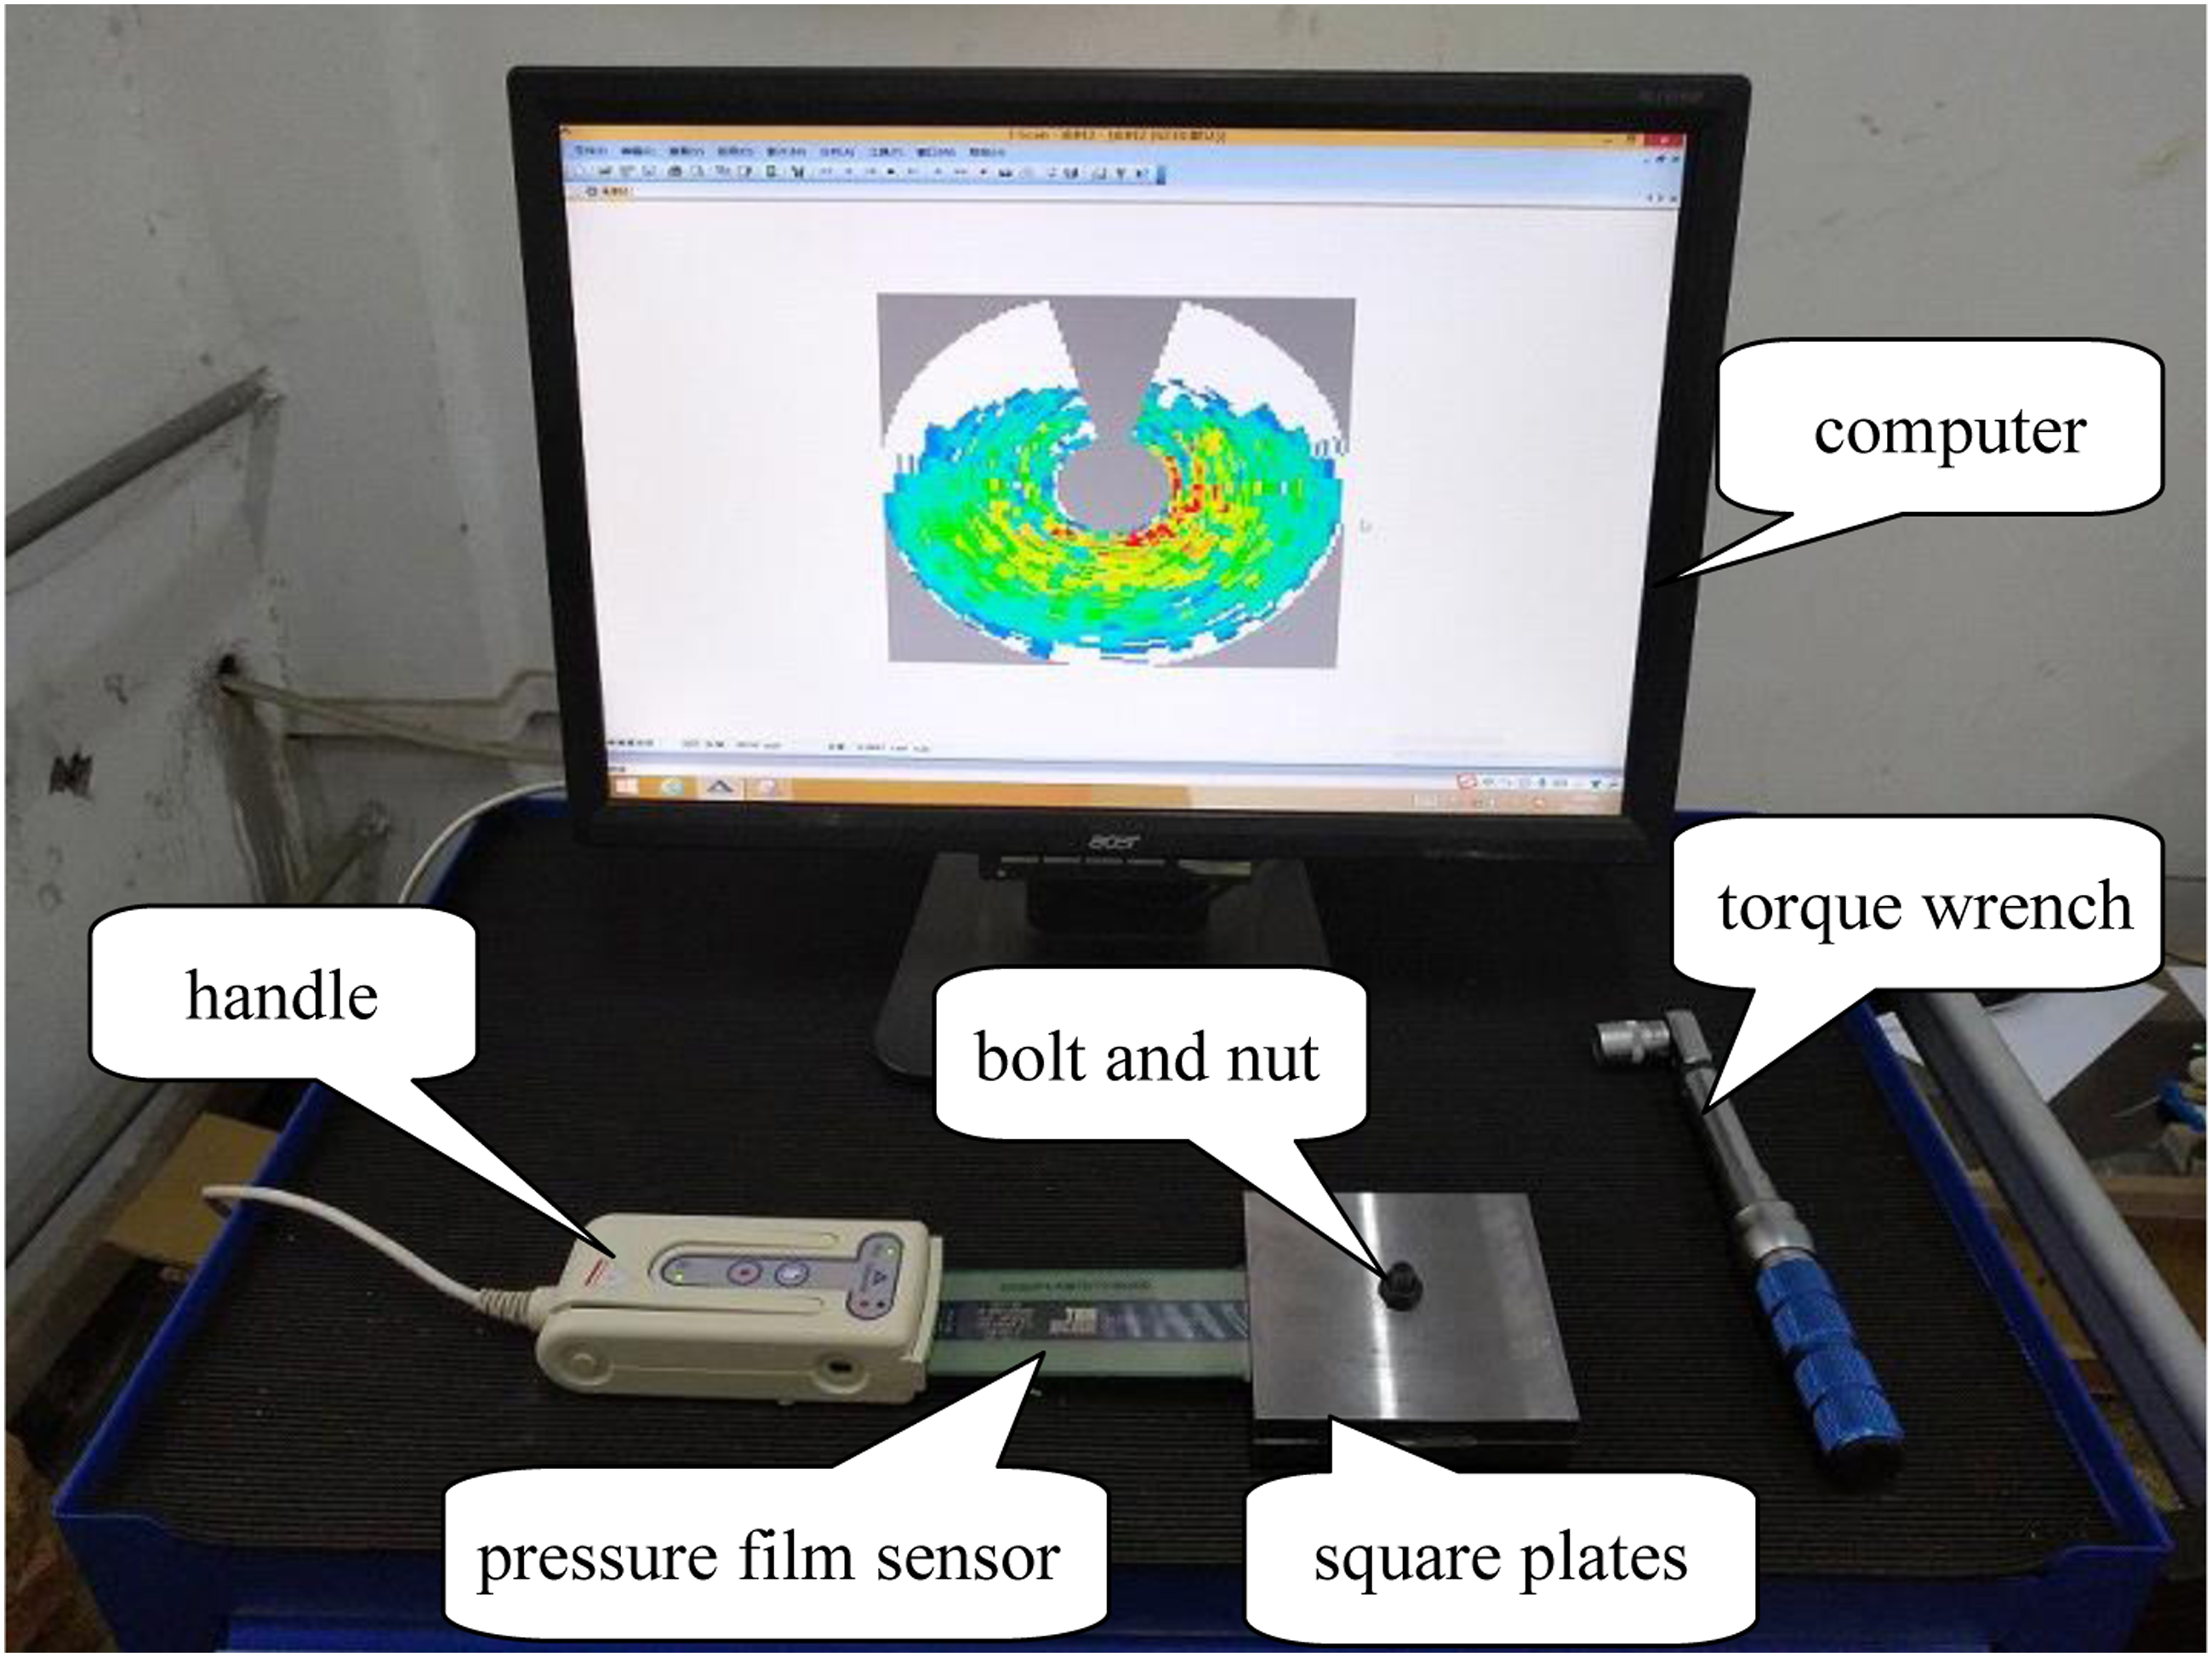
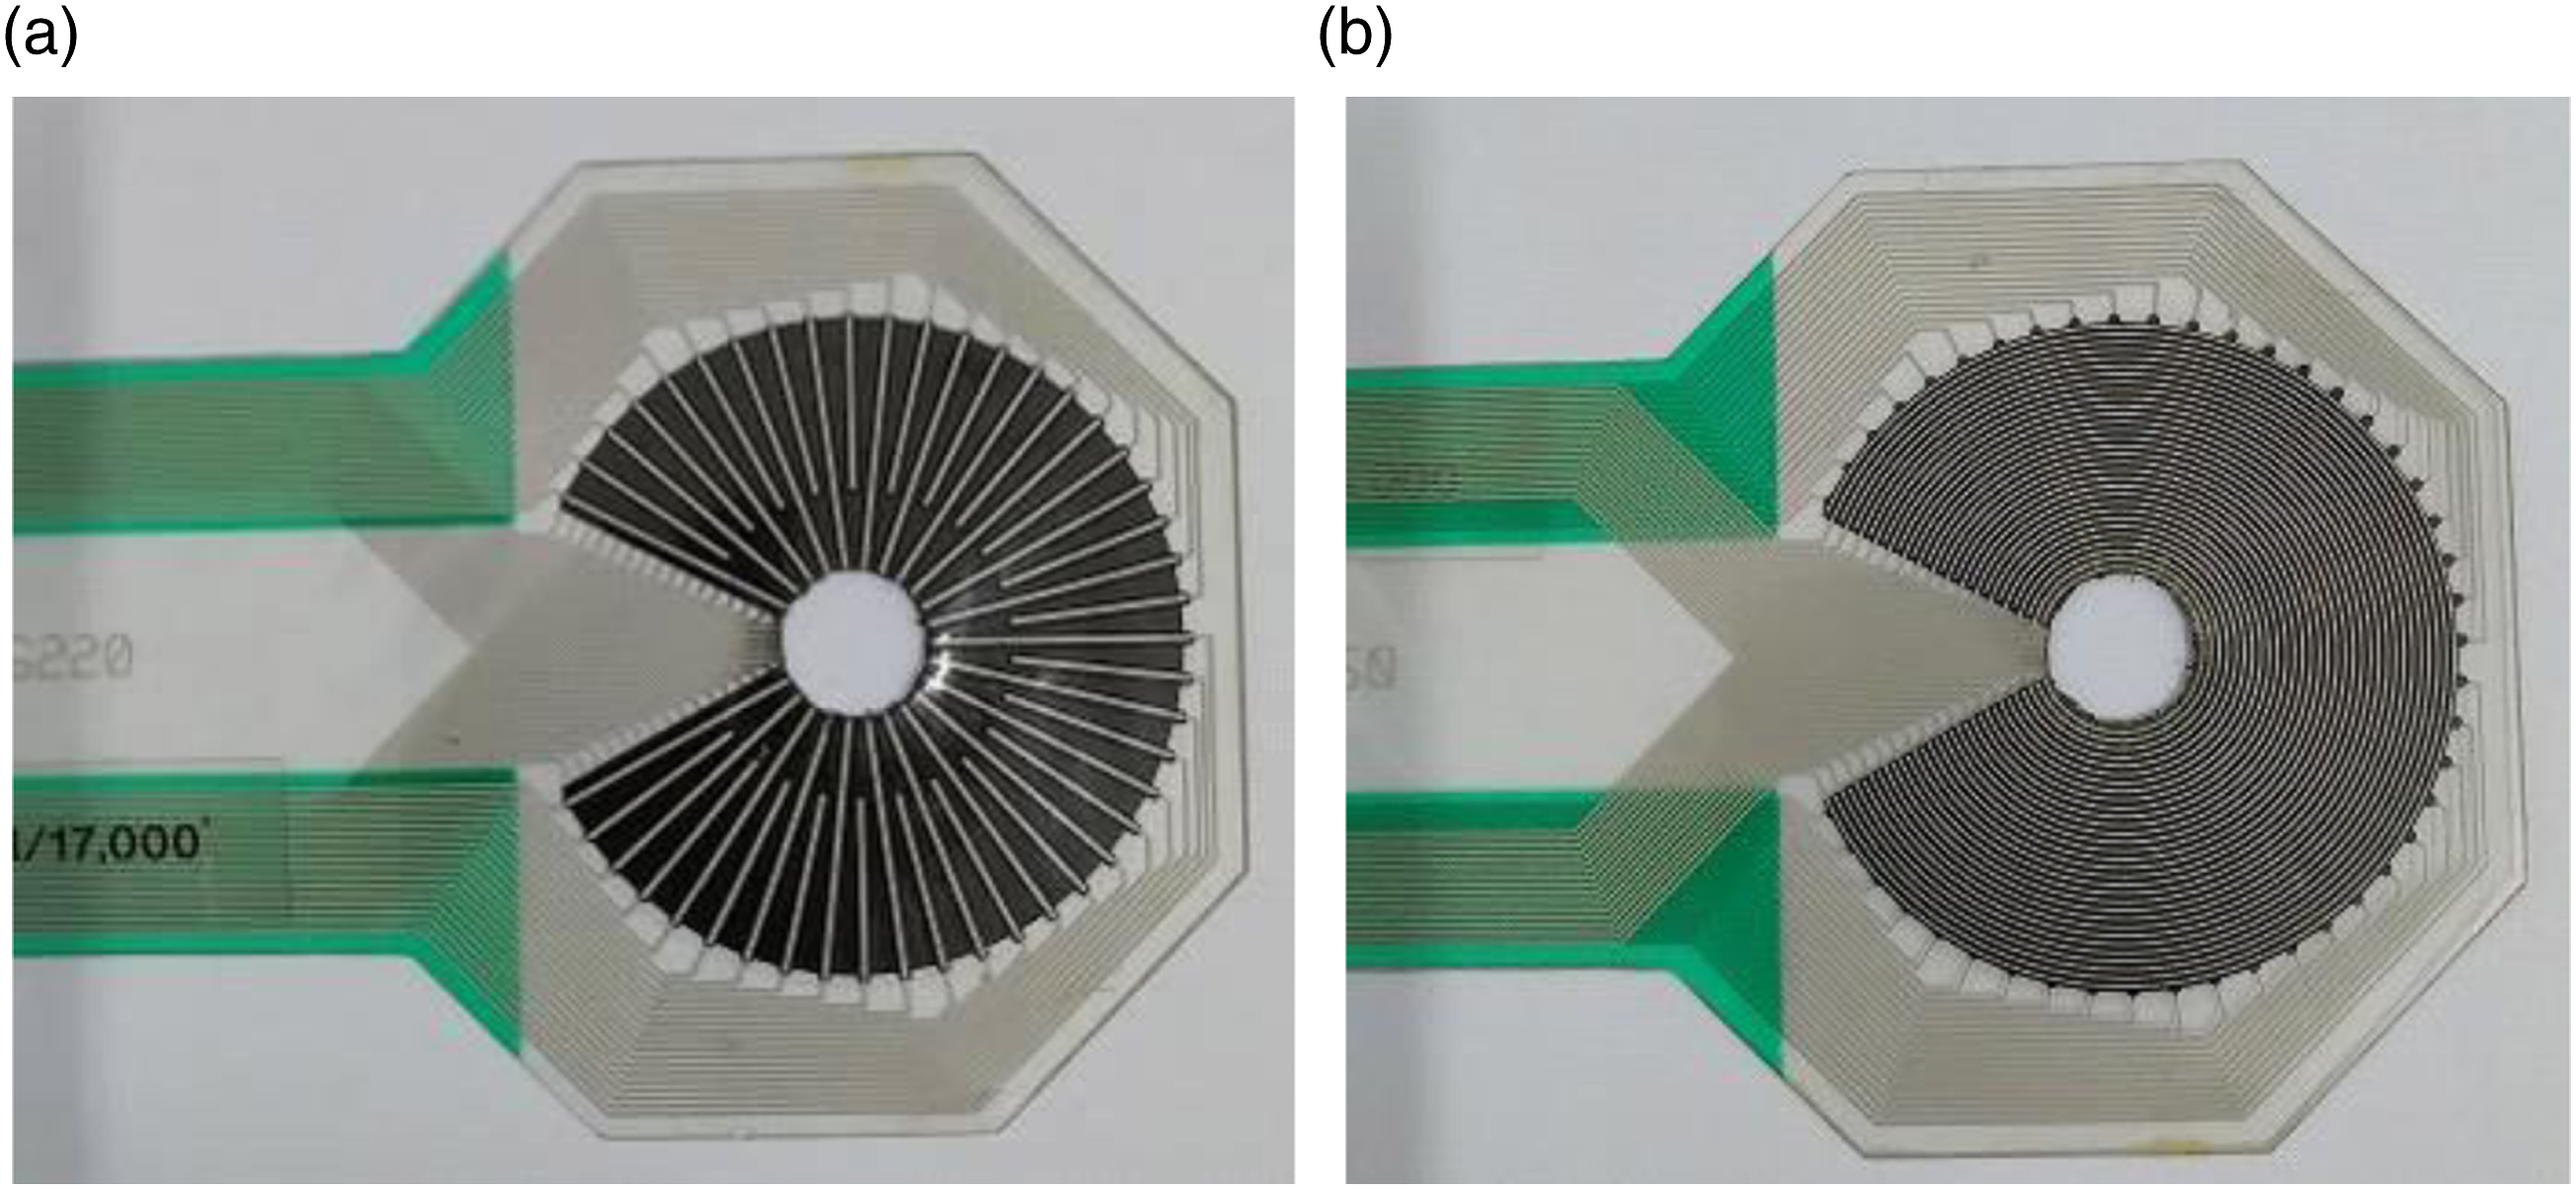
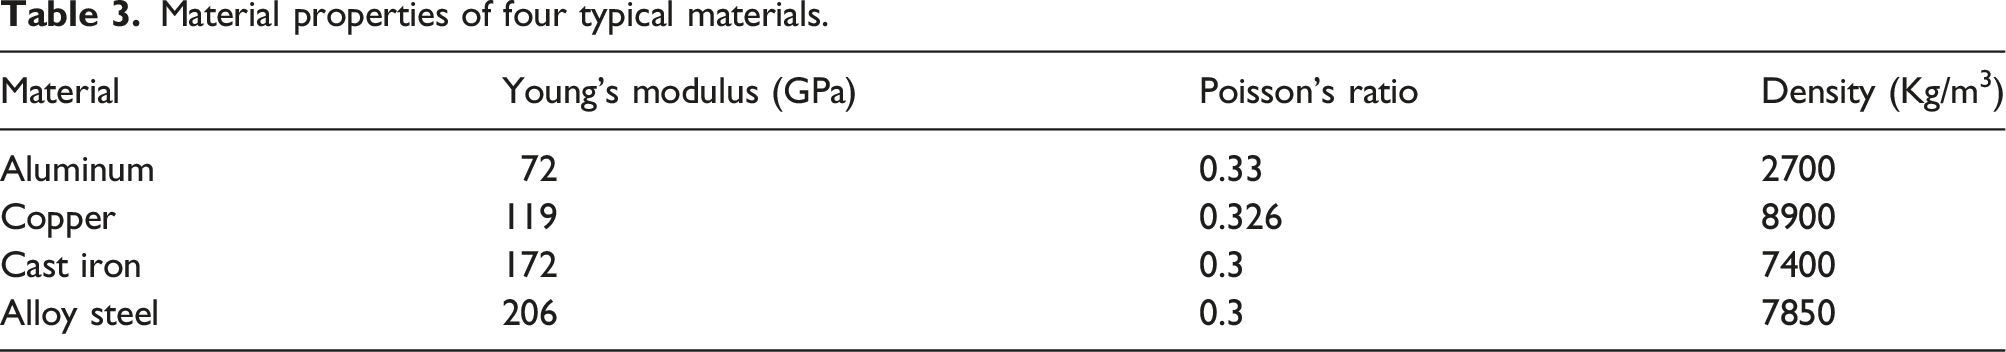
The I-Scan test system for pressure distribution developed by Tekscan is utilized to construct the contact pressure distribution experimental platform, and the overall test system is shown in Figure 7, where it is composed of computer, handle, pressure film sensor, plates, bolt and nut. The pressure film sensor has a number of pressure-sensitive points arrayed around the hole, which capture the contact pressure signal between the two plates. Figure 8 shows the front and back of pressure film sensor, whose thickness is only 0.1 mm and has good flexibility, providing favorable conditions for contact pressure distribution measurement. The pressure membrane sensor transmits the collected contact pressure signal to the handle, which is converted from analog signal to digital signal and sent to the computer for processing. The test specimens, bolts and nuts are made of alloy steel and the material properties are listed in Table 3. In the experiment, the torque wrench is used to impose the tightening torque, and then the bolt generates a corresponding preload. The relationship between the tightening torque and the preload can be expressed as Experimental set-up. (a) Front and (b) back of pressure film sensor. Material properties of four typical materials.
Experiment results
The torque wrench is used to apply the tightening torque of 8 mm and 16 mm separately to the bolt connection structure in Figure 7. Accordingly, the bolt will generate preload of 5kN and 10kN, respectively. The contact pressure distribution of the single-bolted joint under different preloads measured by experiment is shown in Figure 9. It can be seen that the contact pressure distribution results measured by the experiment are similar to the simulation results shown in Figure 13(a). Nevertheless, the contact pressure distribution obtained from the experimental results is not symmetric around the central hole. This is mainly due to two reasons, on the one hand, the centerline of the hole of the pressure film sensor and the centerline of the bolt hole are difficult to achieve complete coincidence when the experimental platform is installed, on the other hand, from the microscopic level, the processing roughness of the plate surface has an impact on the experimental results. Many sampling points are arranged on the pressure film sensor, and under the influence of micro roughness, local areas may not be able to collect contact pressure data. In order to minimize the influence of the above factors on the contact pressure distribution measurement results, we average the contact pressure values measured at pressure-sensitive points on the same circumference. Contact pressure experiment results under preloads of (a) 5kN and (b) 10kN.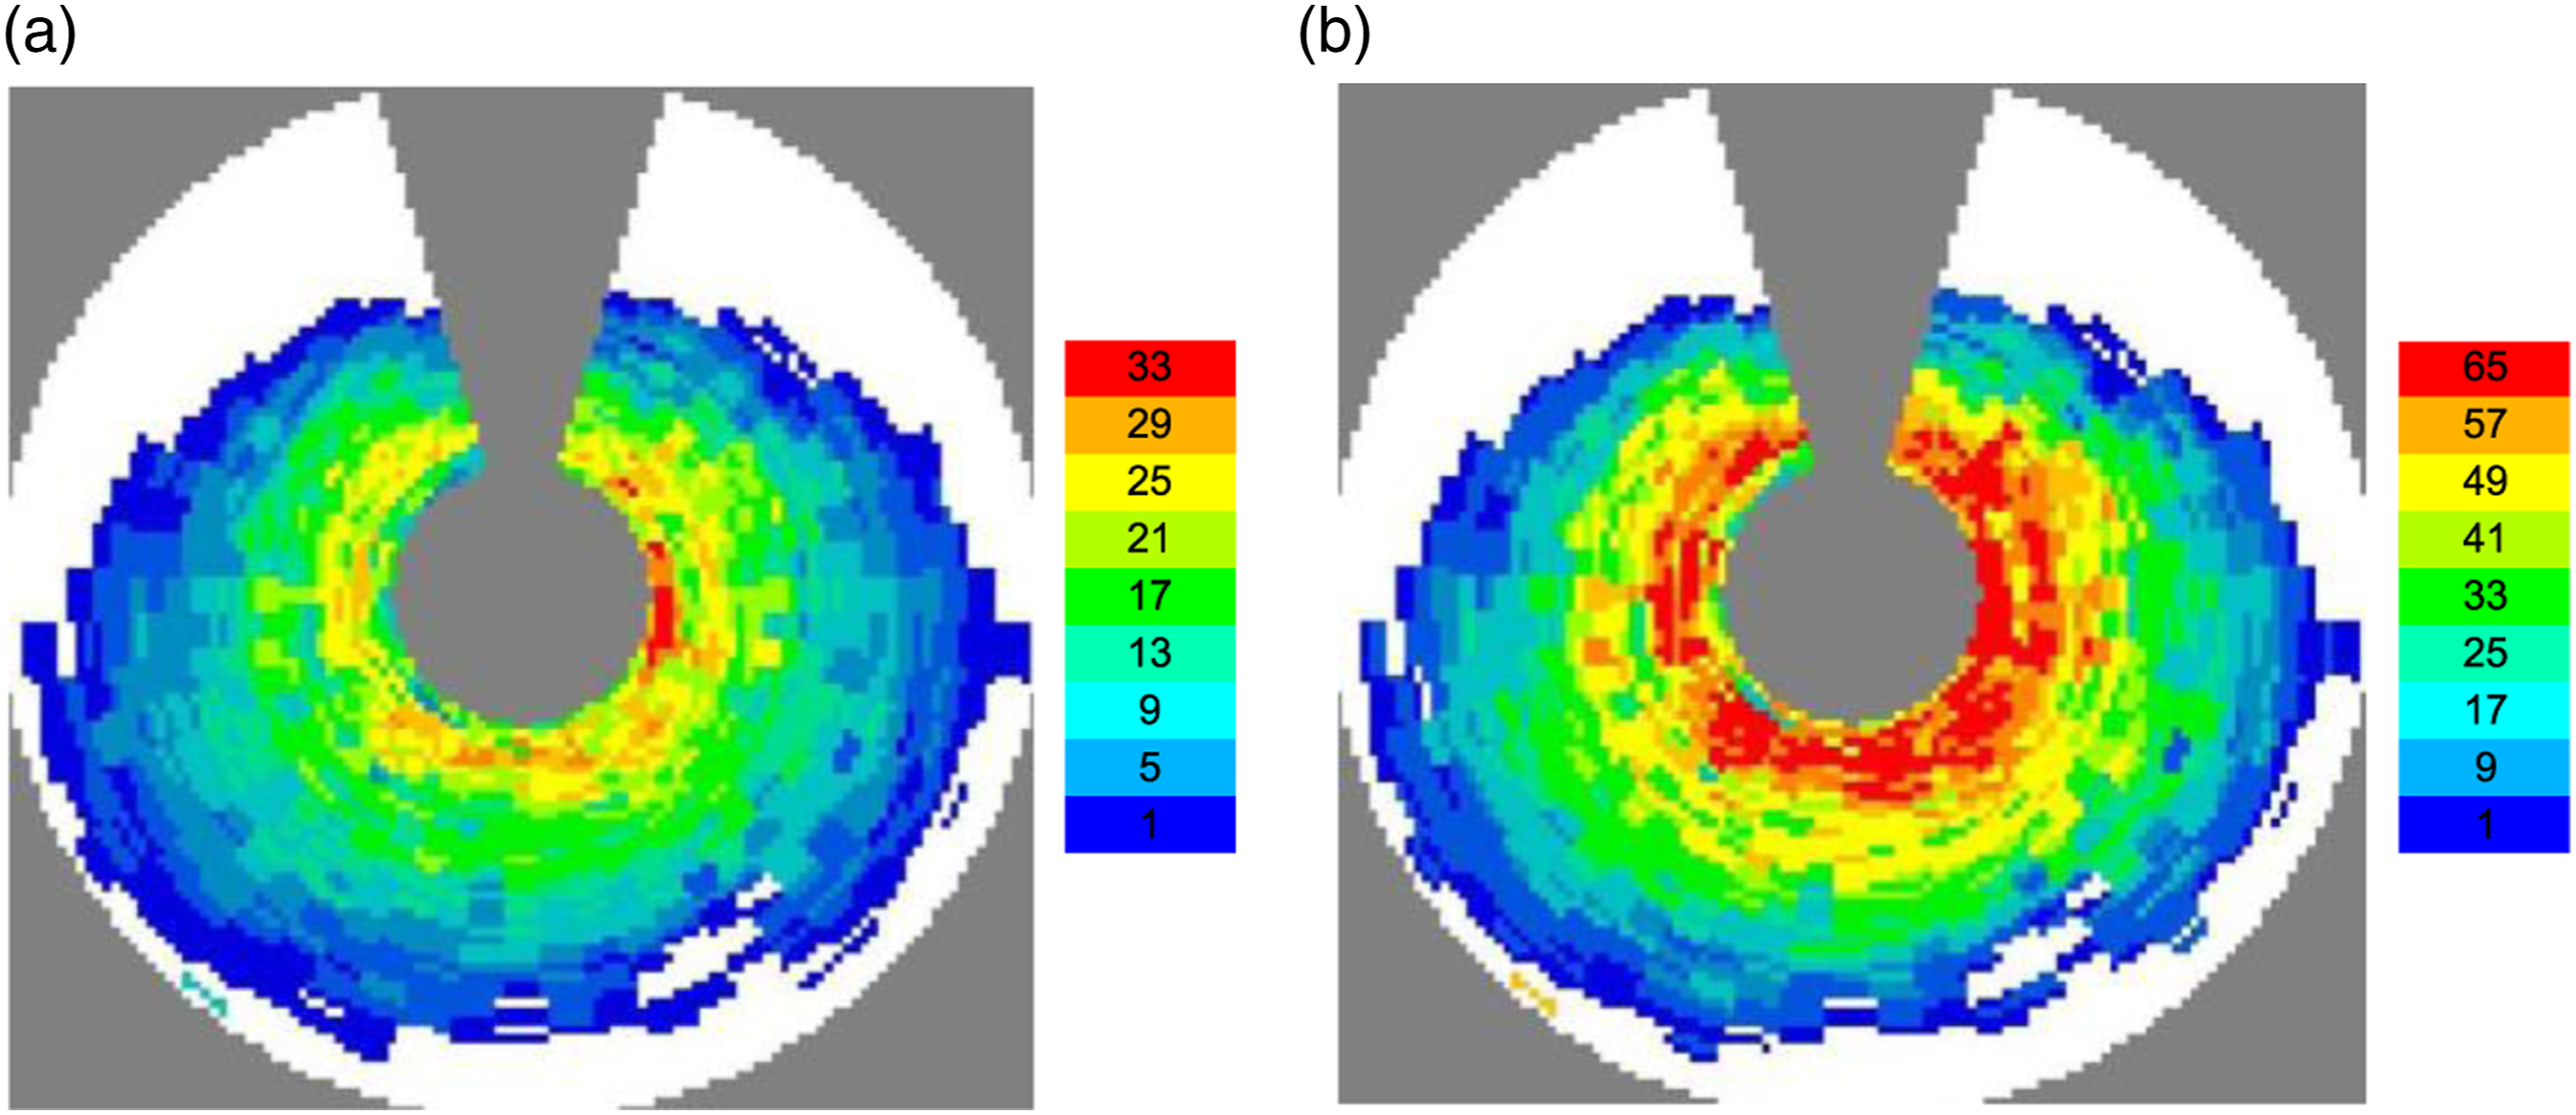
The comparison of the FEA results and the experimental for contact pressure distribution is shown in Figure 10. As can be seen that the contact pressure curve variation characteristics of the FEA results are in agreement with the experimental results under different preloads, and the root mean squared error of contact pressure distribution is less than 5%, which validates the applicability of the proposed single-bolted joint model. Furthermore, it is observed from experiment results that the contact pressure under the preload of 10 kN is larger than that of 5 kN, but the contact radius is identical. This phenomenon is consistent with the FEA results in Section 4.1, which indirectly illustrates the correctness of the influence of the other relevant factors on contact pressure distribution for the single-bolted joint. Contact pressure versus the radial distance under preloads of (a) 5kN and (b) 10kN.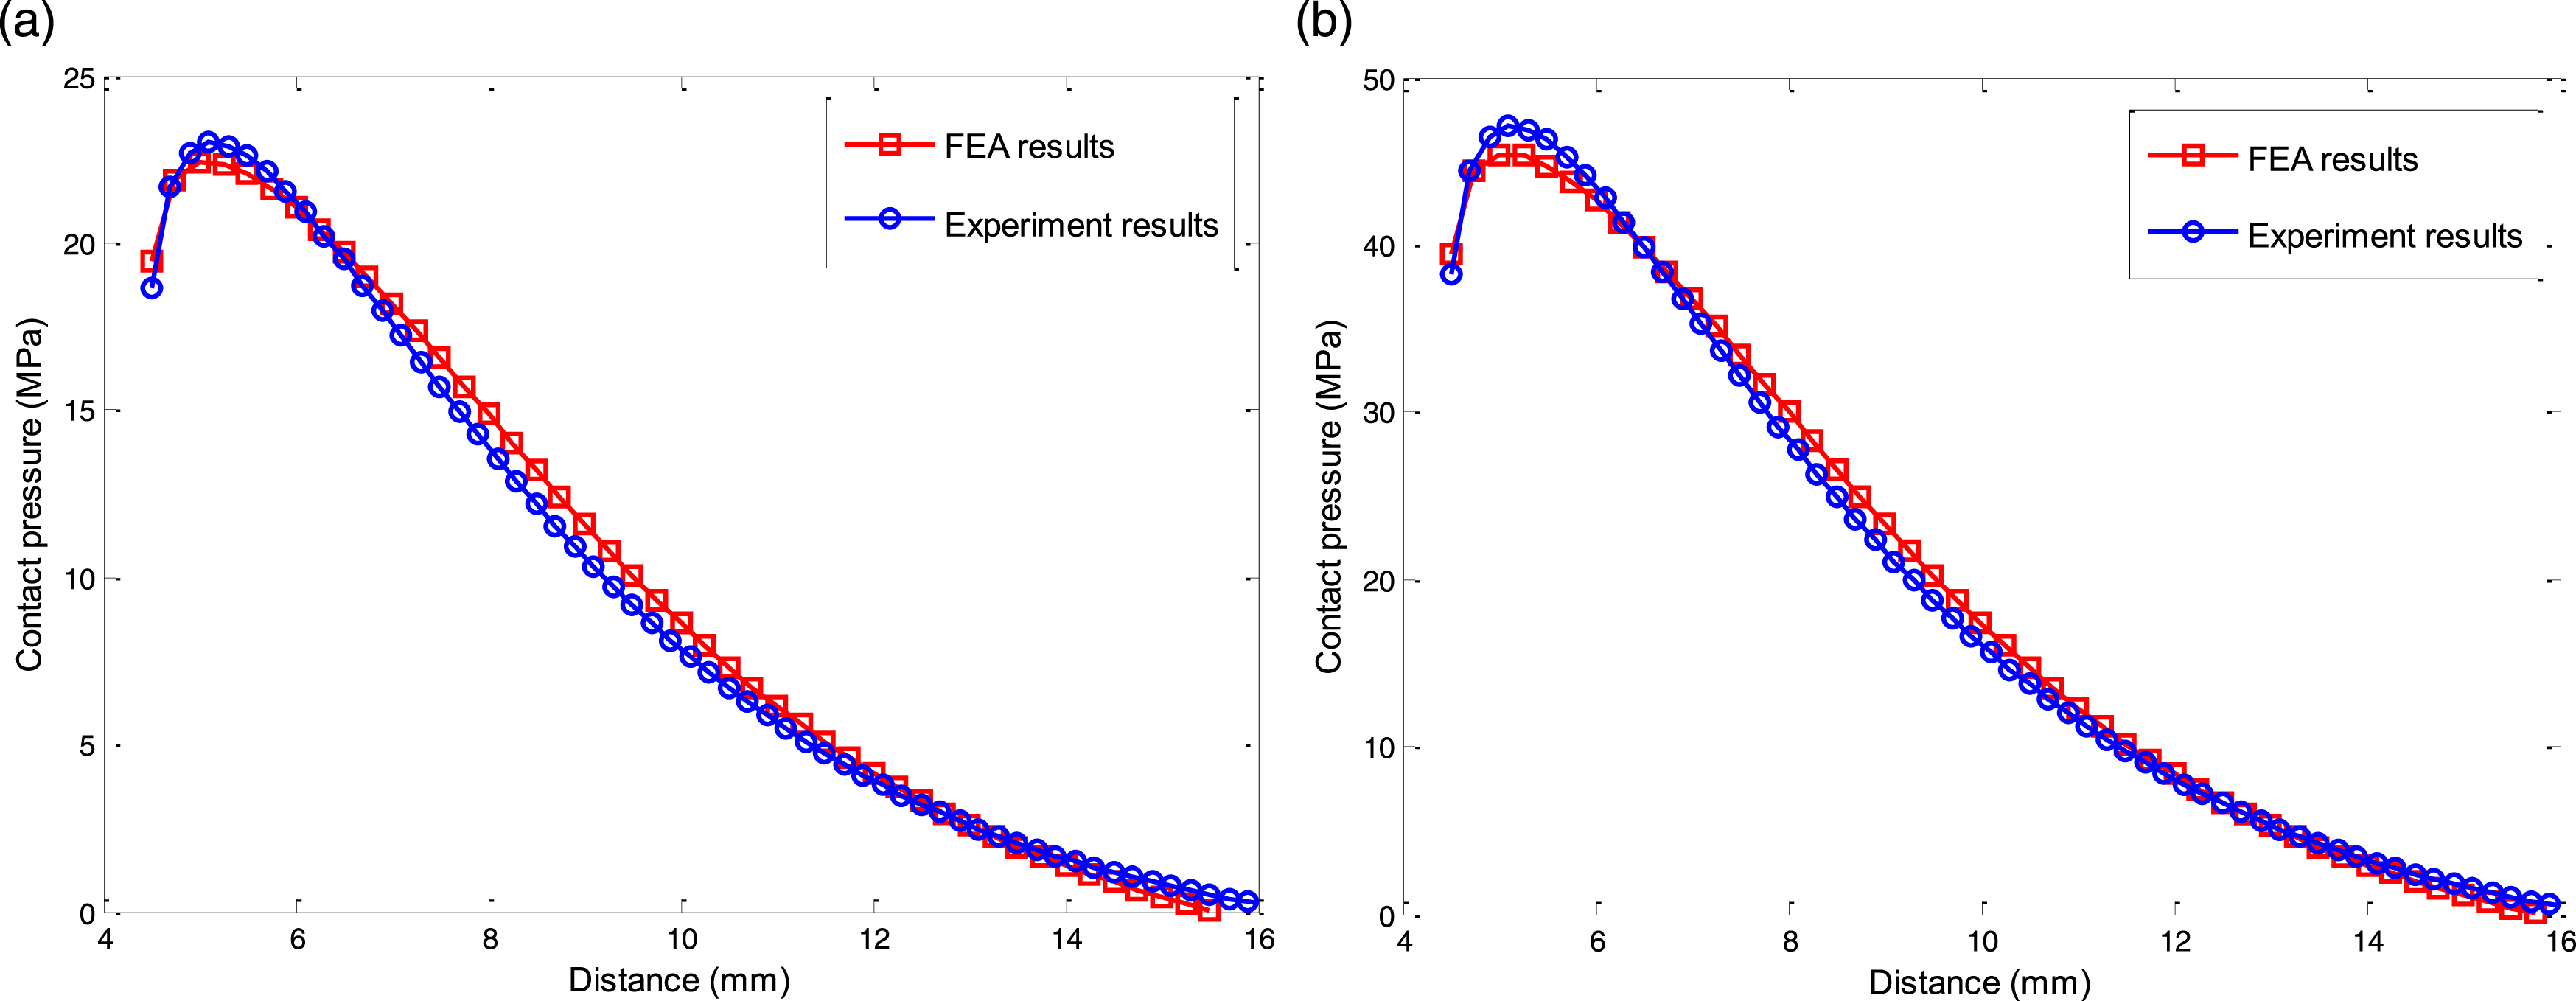
The comparison of contact pressure distribution between the FEA results and experiment results for double-bolted joint under different preloads is shown in Figure 11, where the clamped length is 16 mm. As can be seen from the comparison that the FEA results are in good agreement with the experiment results, the applicability of the finite element model and the correctness of the FEA for contact pressure distribution of double-bolted joint are validated. Furthermore, it is revealed that the calculated data of the contact pressure based on the finite element model of double-bolted joint is a little larger than that of the experiment results under the same preload condition. This difference may be caused by the error of instrument and measurement. Contact pressure distribution between two bolt holes for double-bolted joint under preloads of (a) 5kN and (b) 10kN.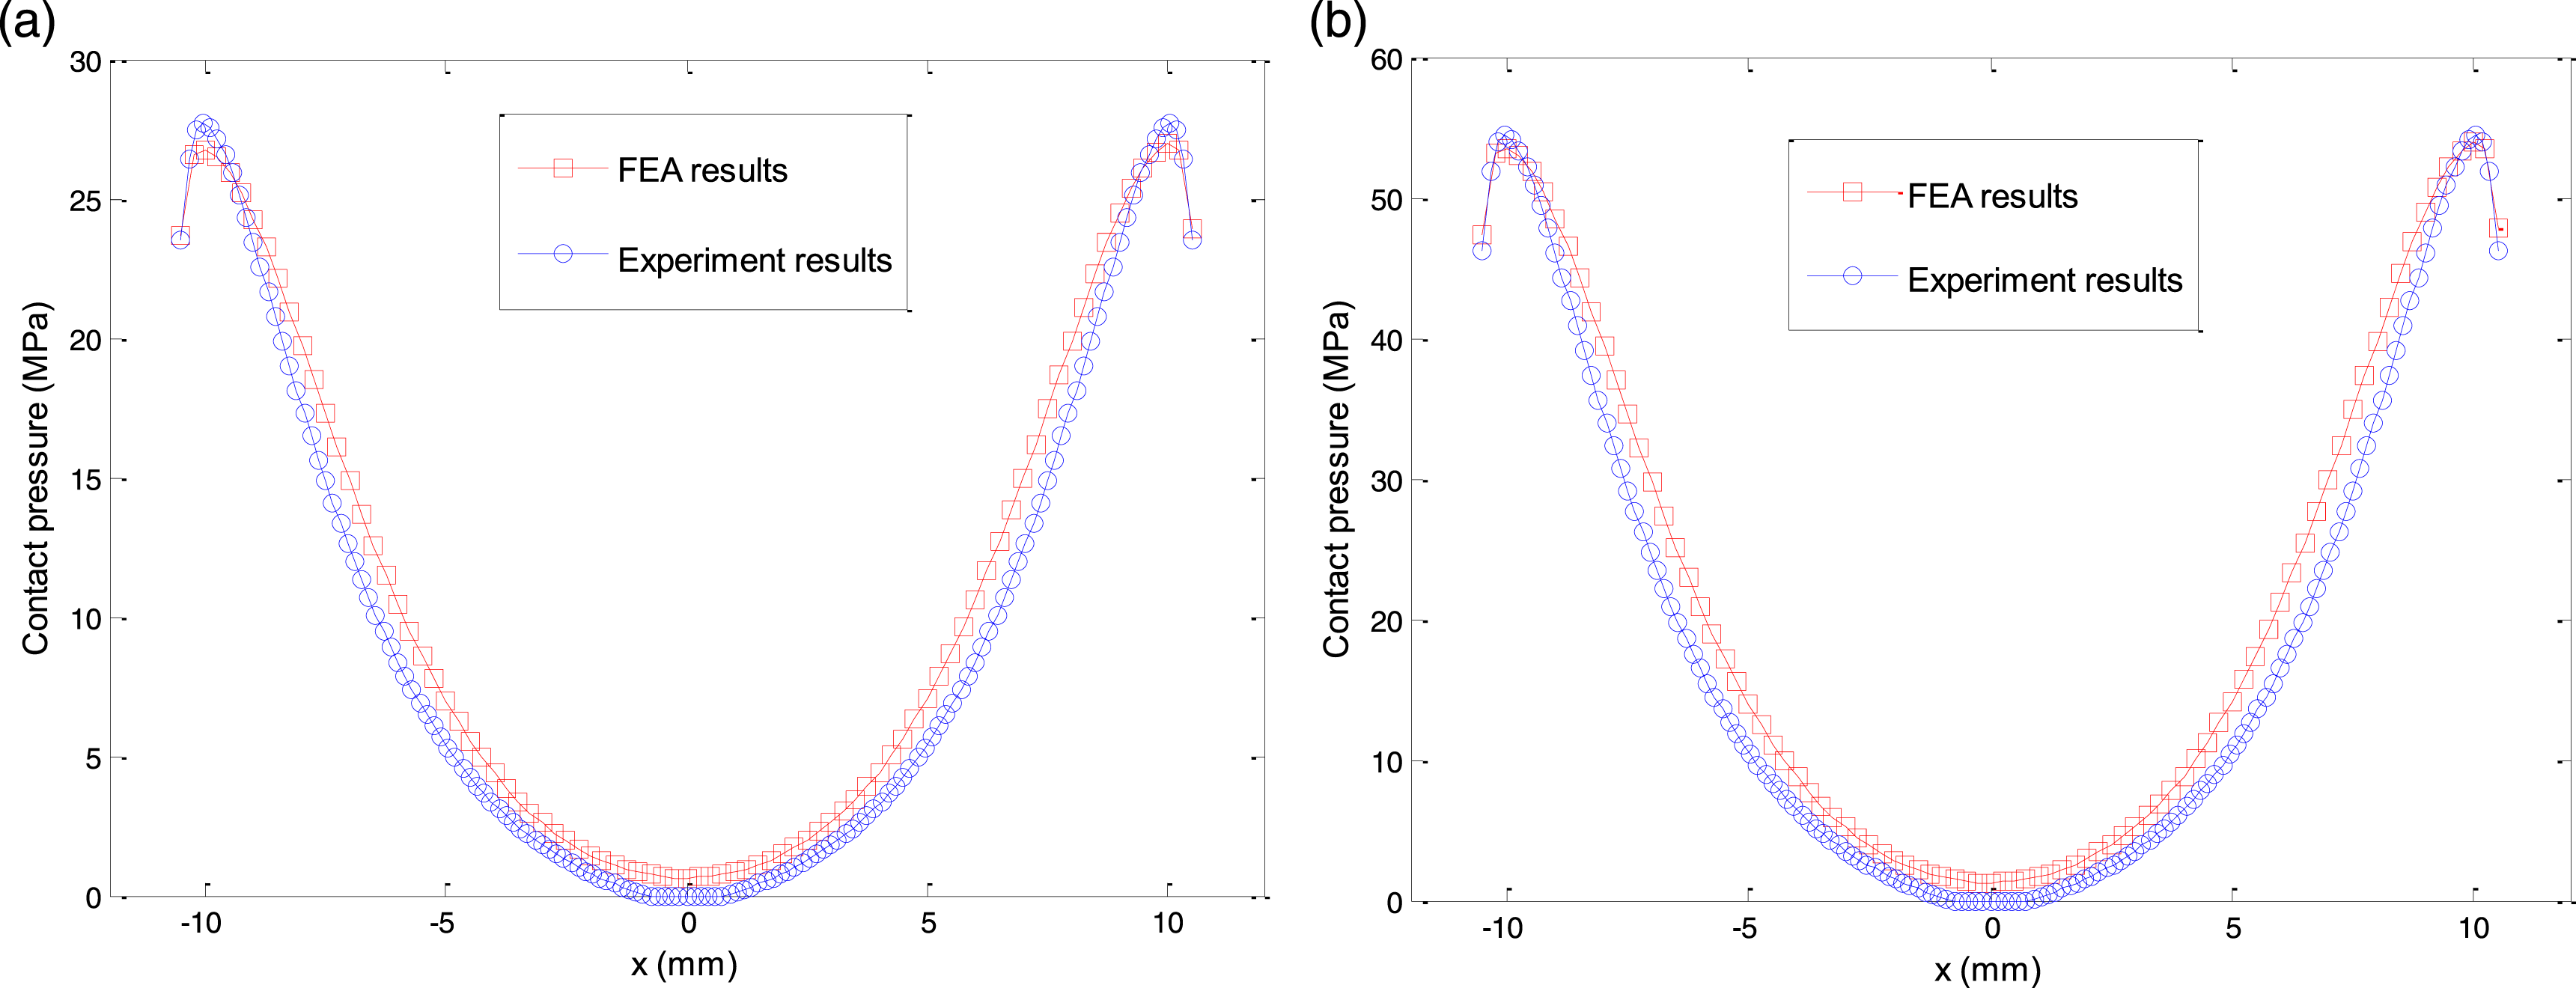
Contact pressure distribution in single-bolted joint
The contact pressure distribution in single-bolted joint has an important guiding role for the load analysis and structural dimension design of large structural bolted connections. A preload of 5 kN is exerted on the established finite element model in Section 2.2, where geometrical parameters and material properties are described in detail. Then, the 3D stress distribution characteristics inside the clamped plates of single-bolted joint can be acquired by finite element nonlinear statics analysis. The normal stress distribution within the clamped plates of single-bolted joint is displayed in Figure 12, where the stress unit is Pa. It can be seen that the stress distribution shape of the upper plate and the lower plate presents two symmetrical hollow cones, and the symmetrical plane is located on the contact interface. Since the contact area between the bolt head and the upper plate, and between the lower plate and the nut is small, the maximum stress value is situated at the edge of the upper and lower holes. Normal stress distribution inside clamped plates of single-bolted joint.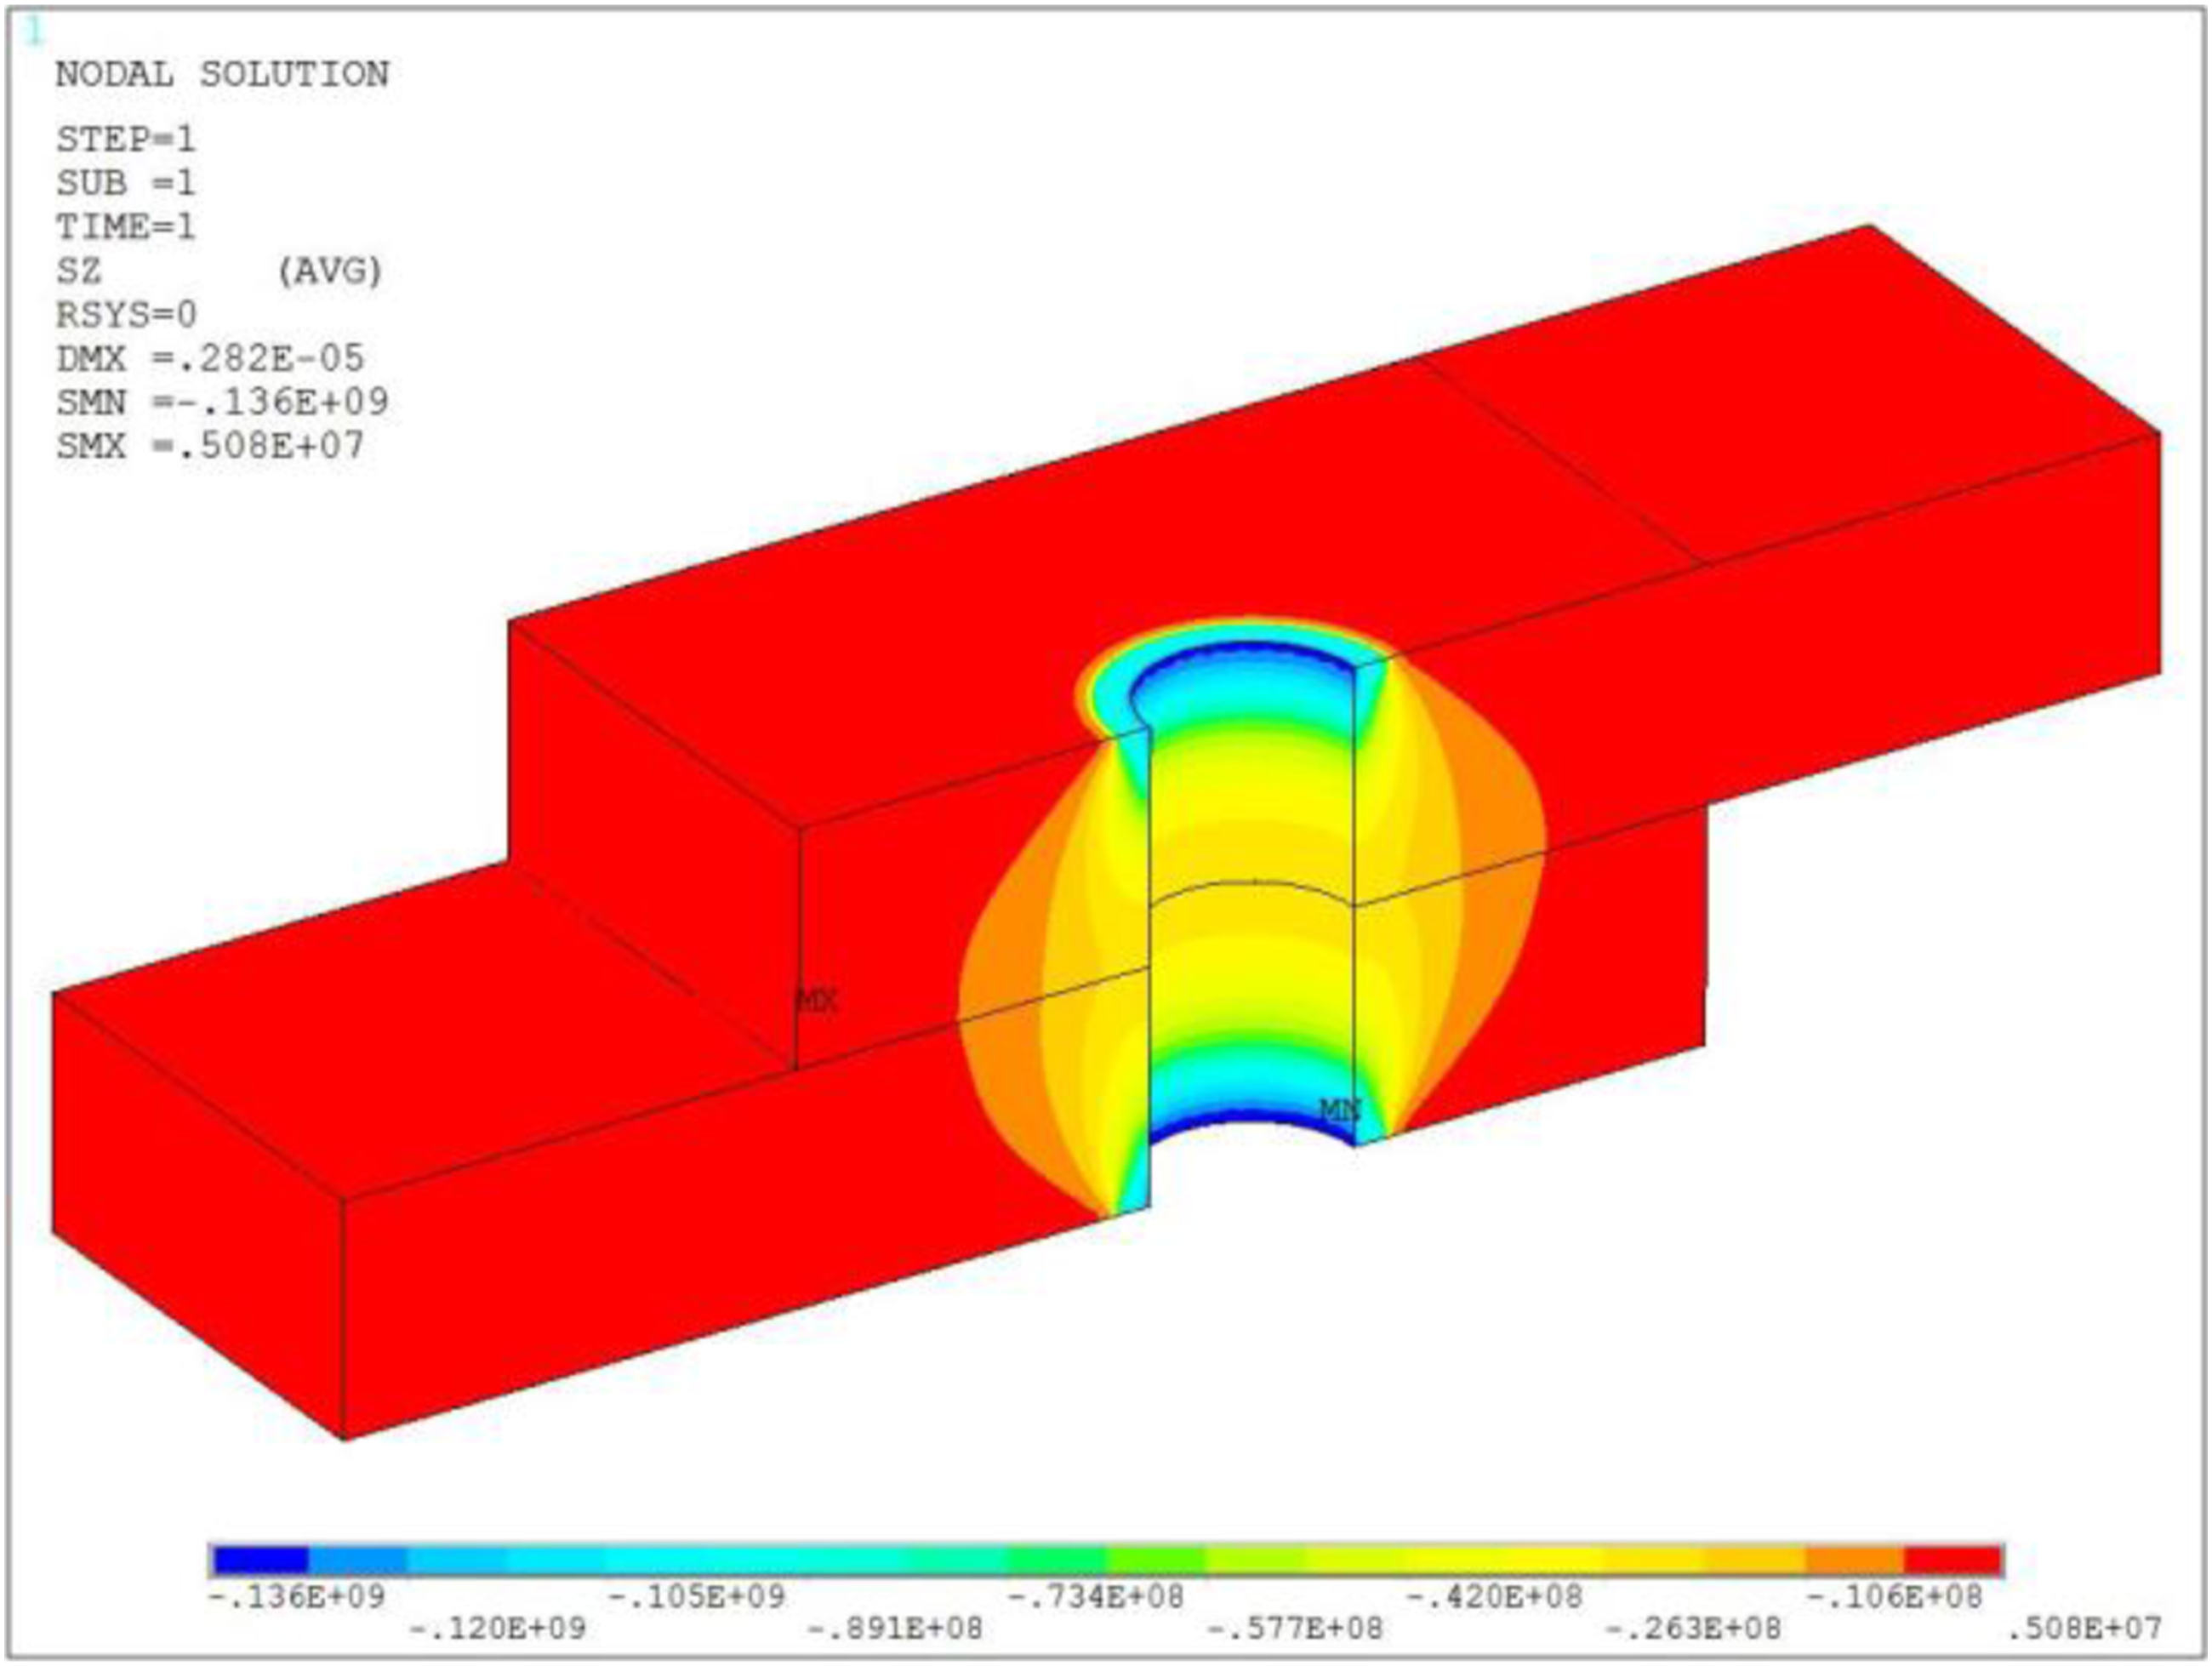
The contact pressure distribution between upper and lower plate of the single-bolted joint is one of the research purposes of this paper, which is able to be extracted from Figure 12. The extracted distribution contour and variation of contact pressure for the single-bolted joint are shown in Figure 13. From Figure 13(a), the contact pressure distribution is uniform around the circumferential direction of the hole-like circular band. To clearly observe the change of contact pressure in the radial direction, the pressure of all nodes on the contact interface are picked up and drawn into three-dimensional surface as shown in Figure 13(b). It is clearly seen that the peak of contact pressure is located near the hole edge, and the contact pressure first increases to the peak and then gradually decreases to zero in the radial direction. The contact pressure variation characteristics between upper and lower plates of the single-bolted joint are different with the previous studies16,17 that the contact pressure was assumed to be monotonically decreasing. Distribution contour and variation of contact pressure for single-bolted joint.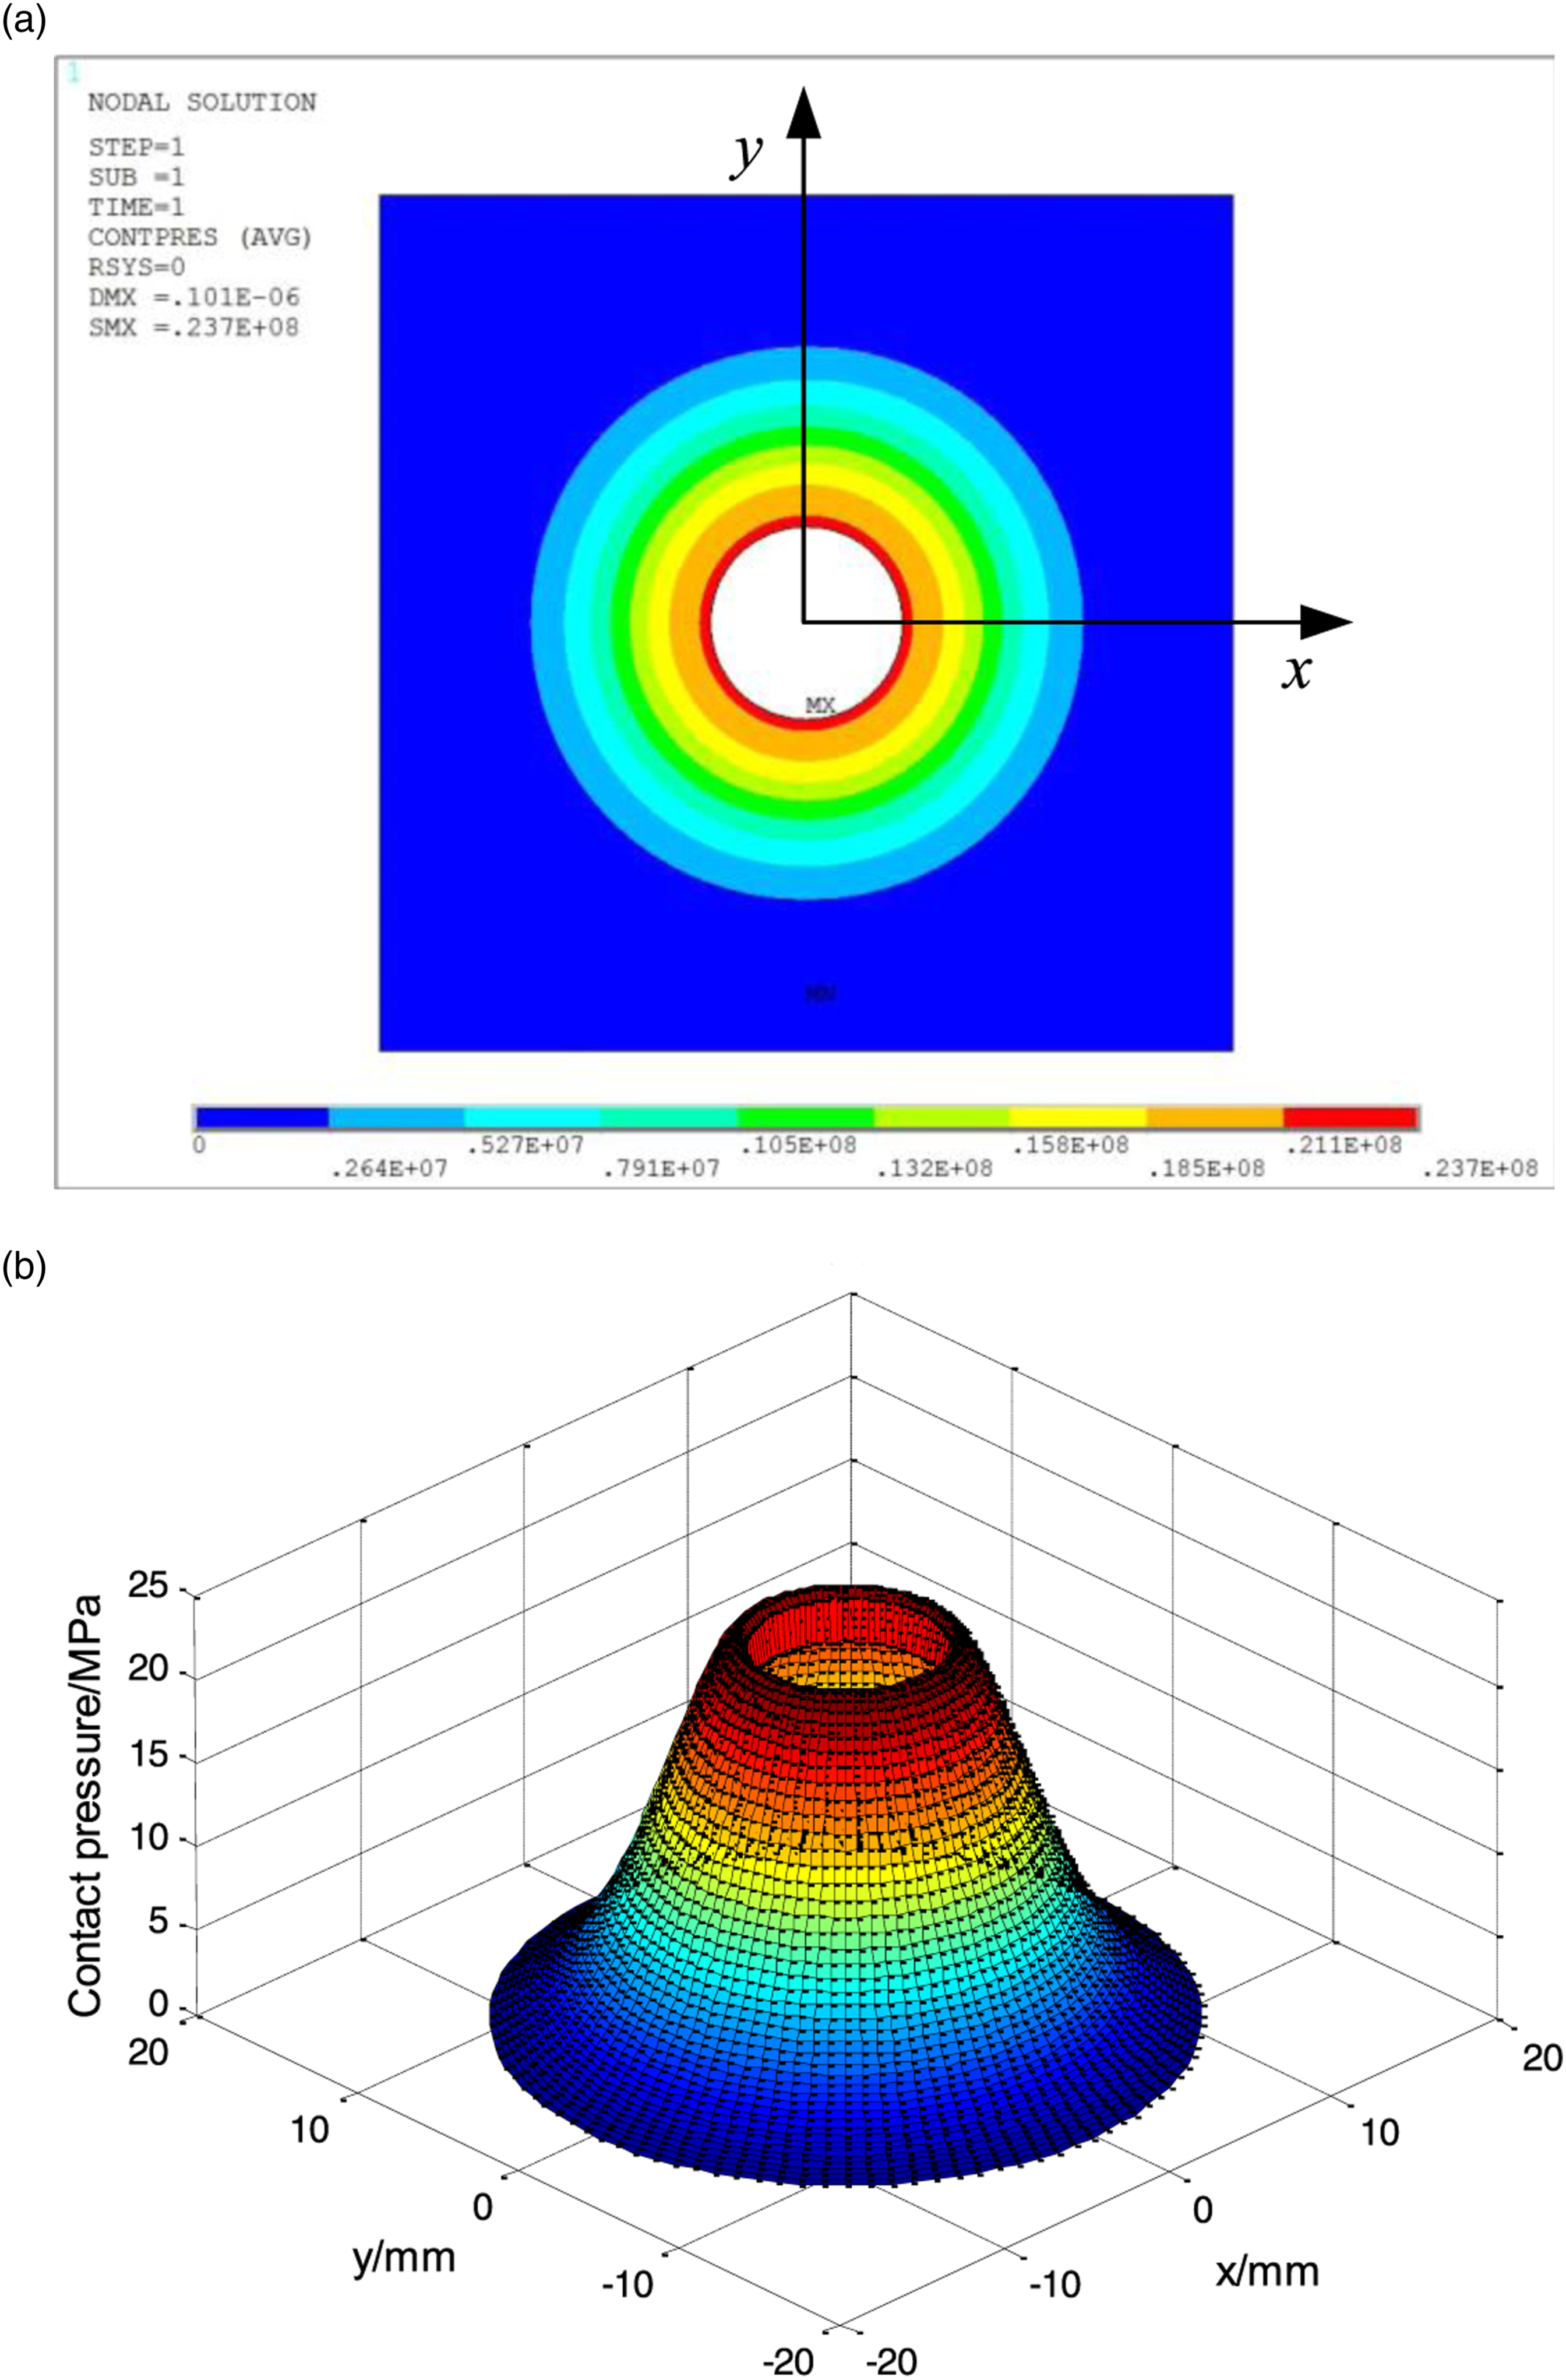
In the following analysis of this section, the proposed finite element model of single-bolted joint is used to determine the influence of relevant factors on the contact pressure distribution between upper and lower plates. The considered relevant factors included preload, material properties, bolt sizes, grip length L, and hole clearance (d h -d)/2. It should be emphasized here that only the contact pressure distribution in the radial direction for the single-bolted joint is the focus due to uniform pressure in the circumferential direction around the hole.
Effect of preload
Preloads of 1kN, 5kN, 10kN, 15kN, and 20kN are imposed on finite element model of the single-bolted joint shown in Figure 4, respectively. The contact pressure versus the radial distance under different preloads is shown in Figure 14. From it, one can see that the increased preload leads to the increase of the contact pressure, which corresponds to the actual situation. The minimum contact radius of pressure distribution for different preload is 4.25 mm from the centerline of the bolt hole, which is located exactly on the edge of the bolt hole. Moreover, the maximum contact radius under these preloads is also identical, and contact pressure reduces to zero at the same maximum contact radius. The variation characteristics of the contact pressure curves indicate that the preload has no effect on the contact area of the interface, but the preload can affect the magnitude of the contact pressure. Contact pressure versus the radial distance under different preloads.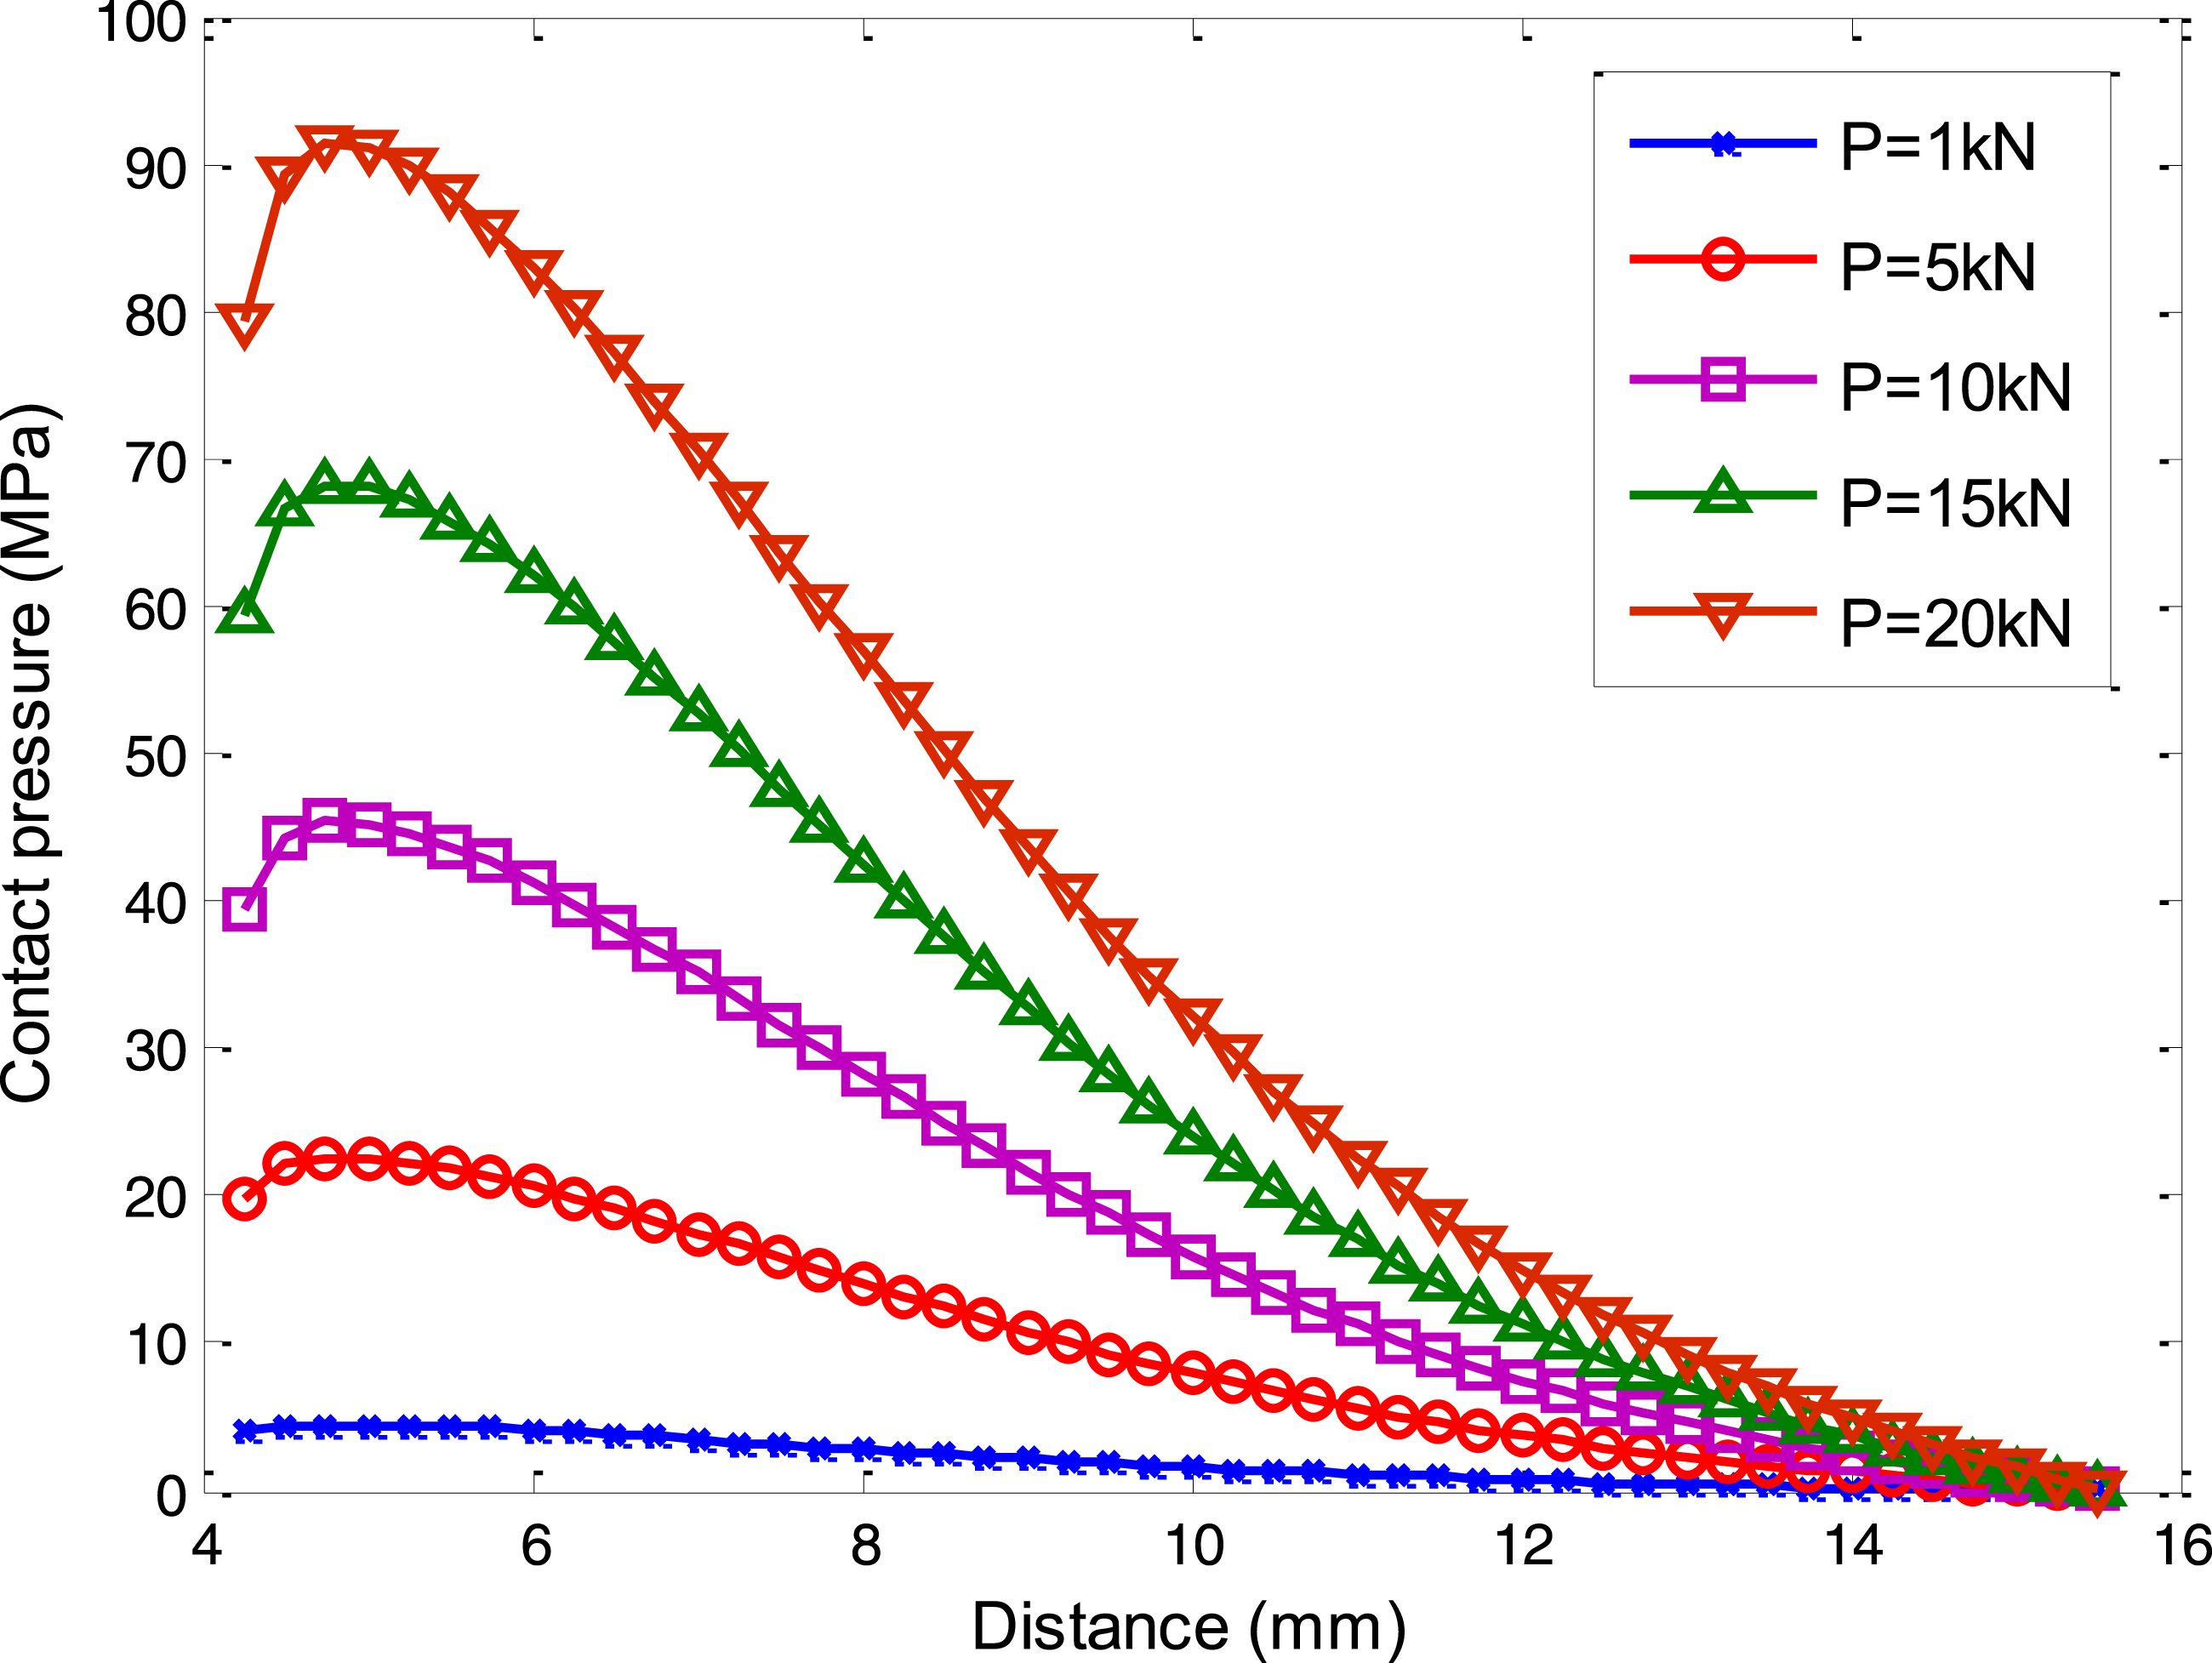
Effect of grip length
The influence of grip length on the contact pressure distribution is taken into account in this section. A preload of 5kN is applied to the finite element model shown in Figure 4 and maintained unchanged; the contact pressure versus the radial distance under different grip lengths are shown in Figure 15. It can be seen that the maximum contact radius of pressure distribution increases with the increase of the grip length L, and the peak of the contact pressure curve can be obviously decreased when the grip length L is increased. These phenomena demonstrate that the grip length is sensitive to the contact pressure distribution of bolted joints and is capable influencing both the contact area and the peak of contact pressure. Contact pressure versus the radial distance under different grip lengths.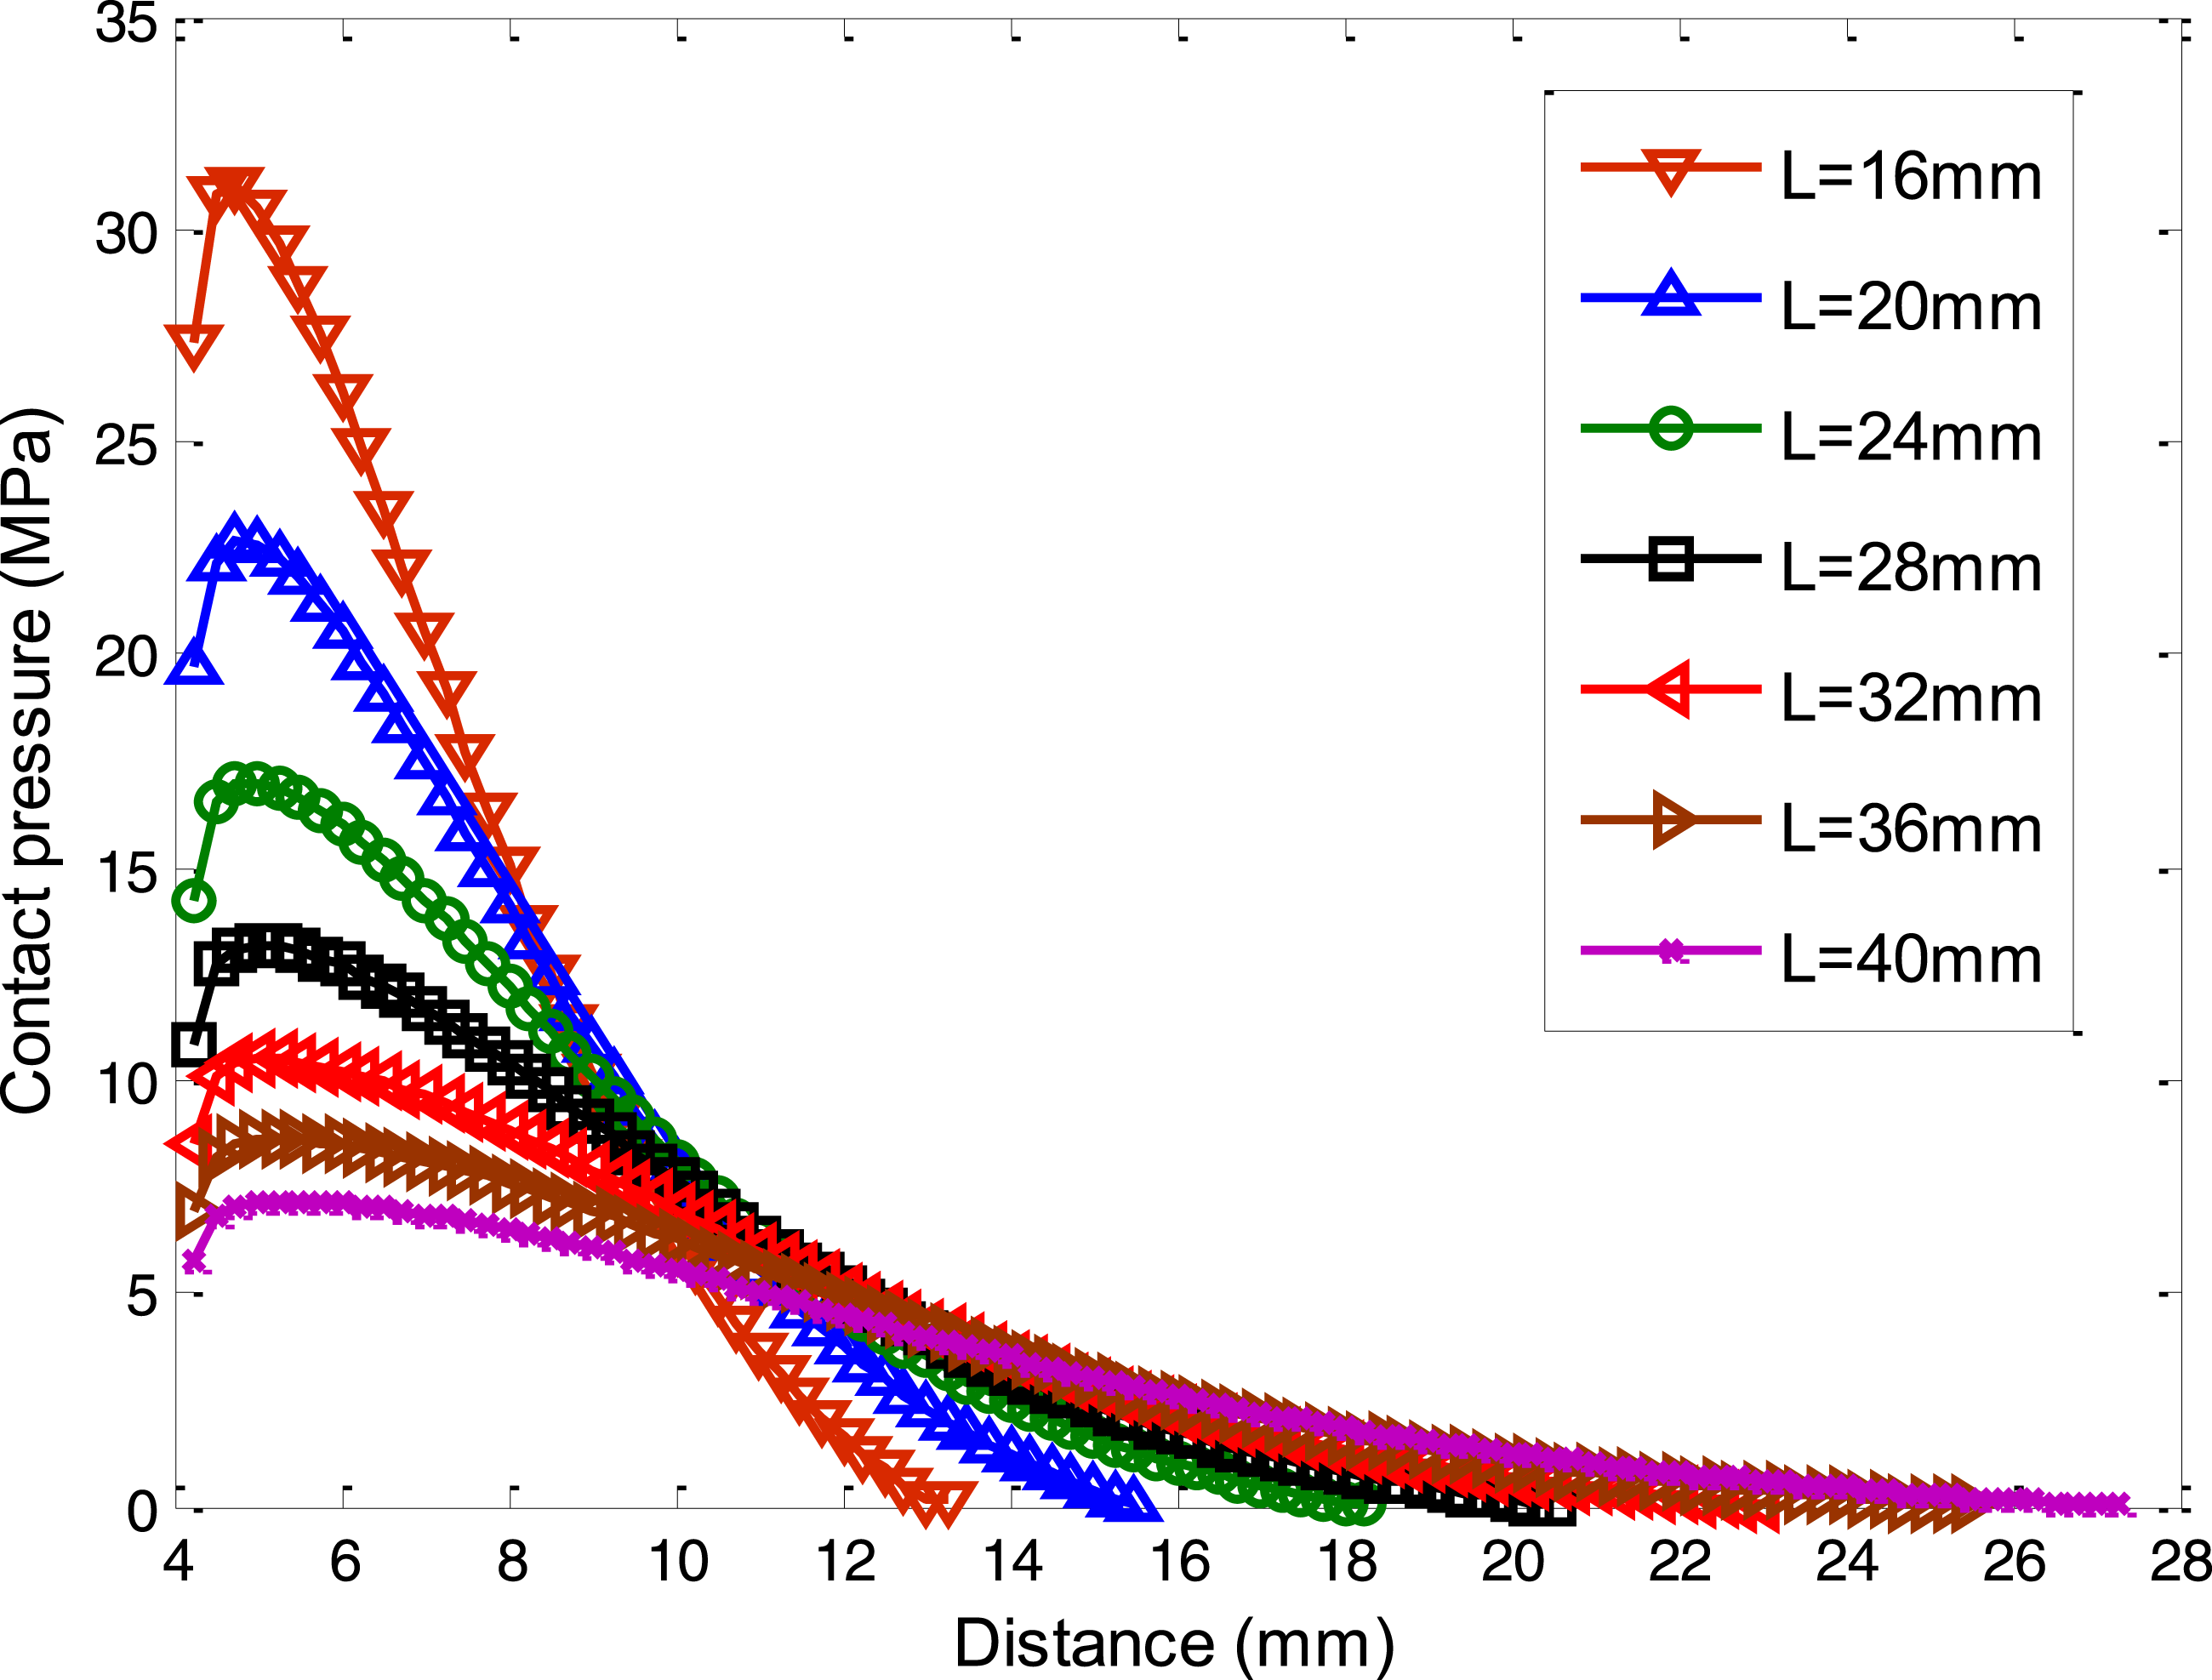
Effect of material property
Four typical materials are employed to study the effect of material properties on contact pressure distribution for the single-bolted joint. The materials are alloy steel, cast iron, copper, and aluminum, and the basic material properties are listed in Table 3, where densities and Young's modulus are differing from each other. In the finite element model shown in Figure 4, alloy steel is assigned to the bolt and nut, and the three remaining materials are used for the clamped plates, respectively. The preload is still set to 5kN, and the contact pressure versus the radial distance under different materials are shown in Figure 16. From it, one can see that the contact pressure distribution has the maximum contact area and the minimum contact pressure peak when the clamped plates are made of aluminum, on the contrary, the plates made from cast iron demonstrate the minimum contact area and the maximum contact pressure peak. The results show that with the increase of Young’s modulus, the contact area is reduced and the contact pressure peak is improved. In addition, it is worth noting that the area enveloped by the contact pressure curve is the same for different materials, which is due to the fact that different material plates are under the same preload. Contact pressure versus the radial distance under different materials.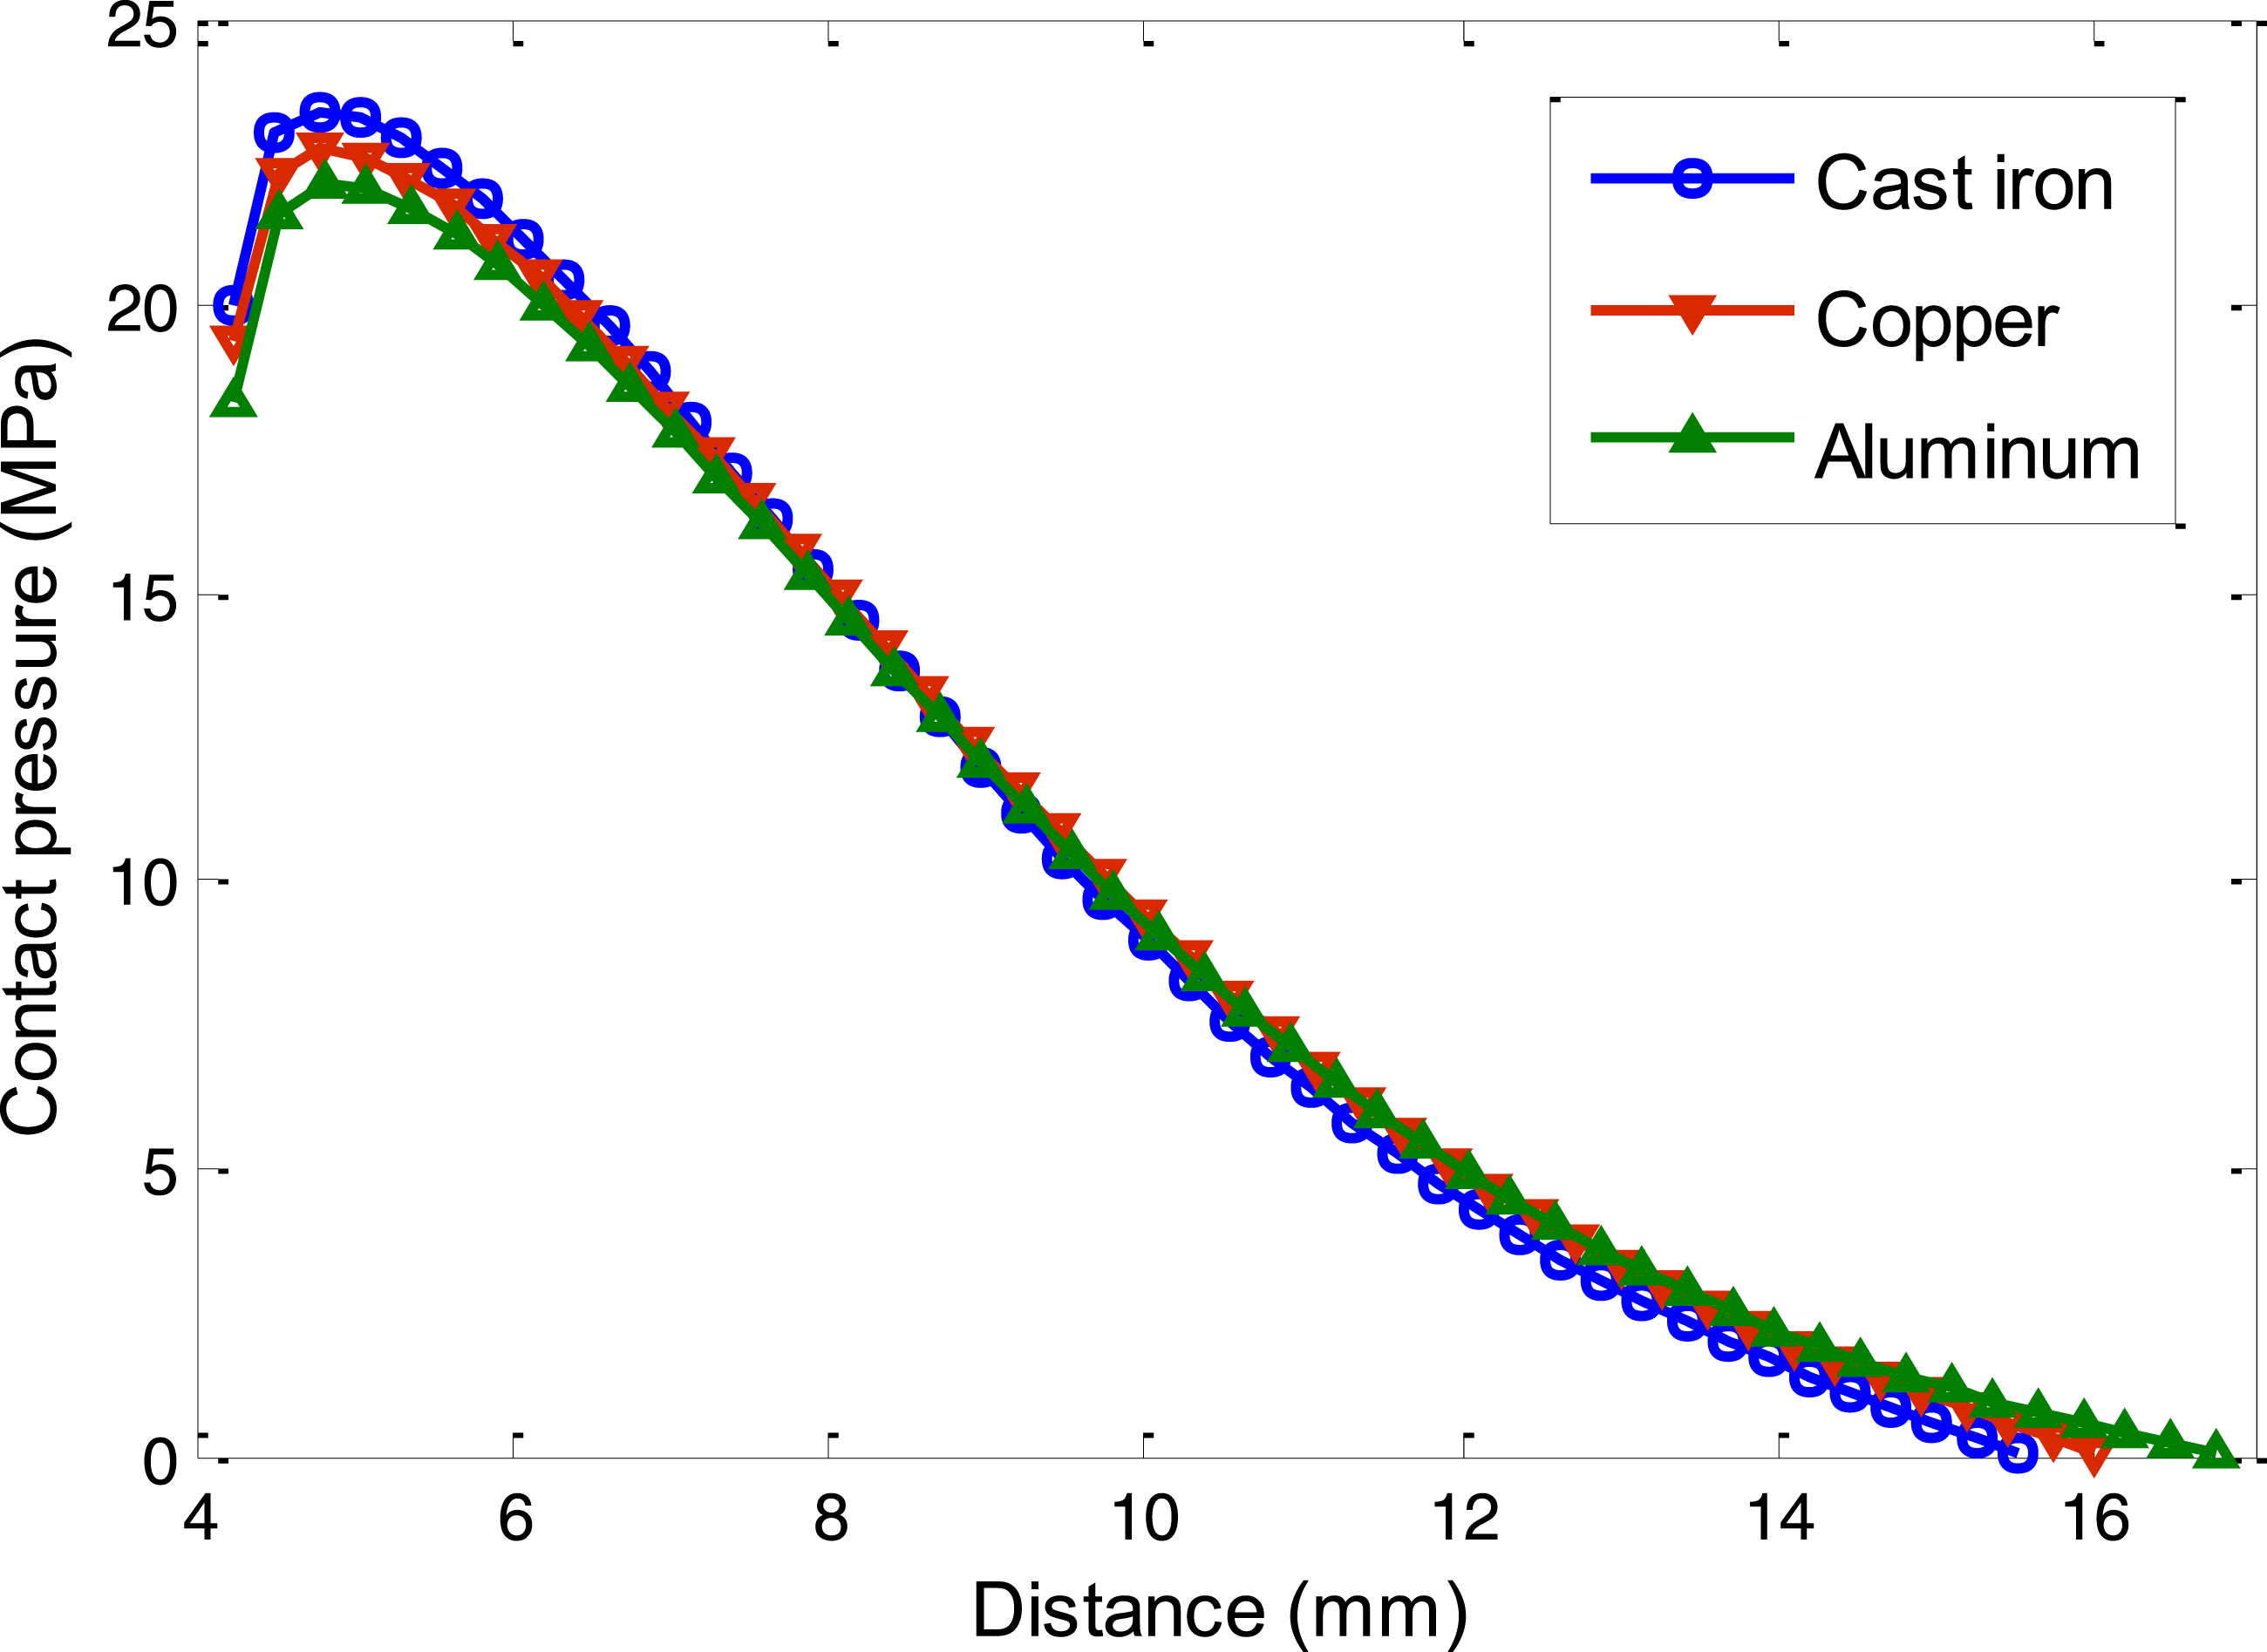
Effect of hole clearance
The effect of hole clearance on contact pressure distribution is also considered. For bolt with a nominal diameter of 8 mm shown in Figure 4, its hole clearance varies from 0 to 0.5 mm in general. Therefore, the three values of 0.05 mm, 0.25 ,mm and 0.5 mm for the hole clearances are chosen to be applied, respectively, in the finite element model to calculate the contact pressure distribution under different hole clearances. The simulation results are shown in Figure 17, where the grip length of 20 mm and preload of 5 kN are employed. It is observed from the figure that the contact pressure distribution curves at different hole clearances have the same maximum contact radius, which is 15.6 mm from the hole centerline. The contact pressure peak is shifted to the right due to the increase of the hole clearance, but the amplitude of the peak is almost independent of the hole clearance. The results indicate that the hole clearance only has a smart effect on the contact area of the contact interface. Contact pressure versus the radial distance under different hole clearances.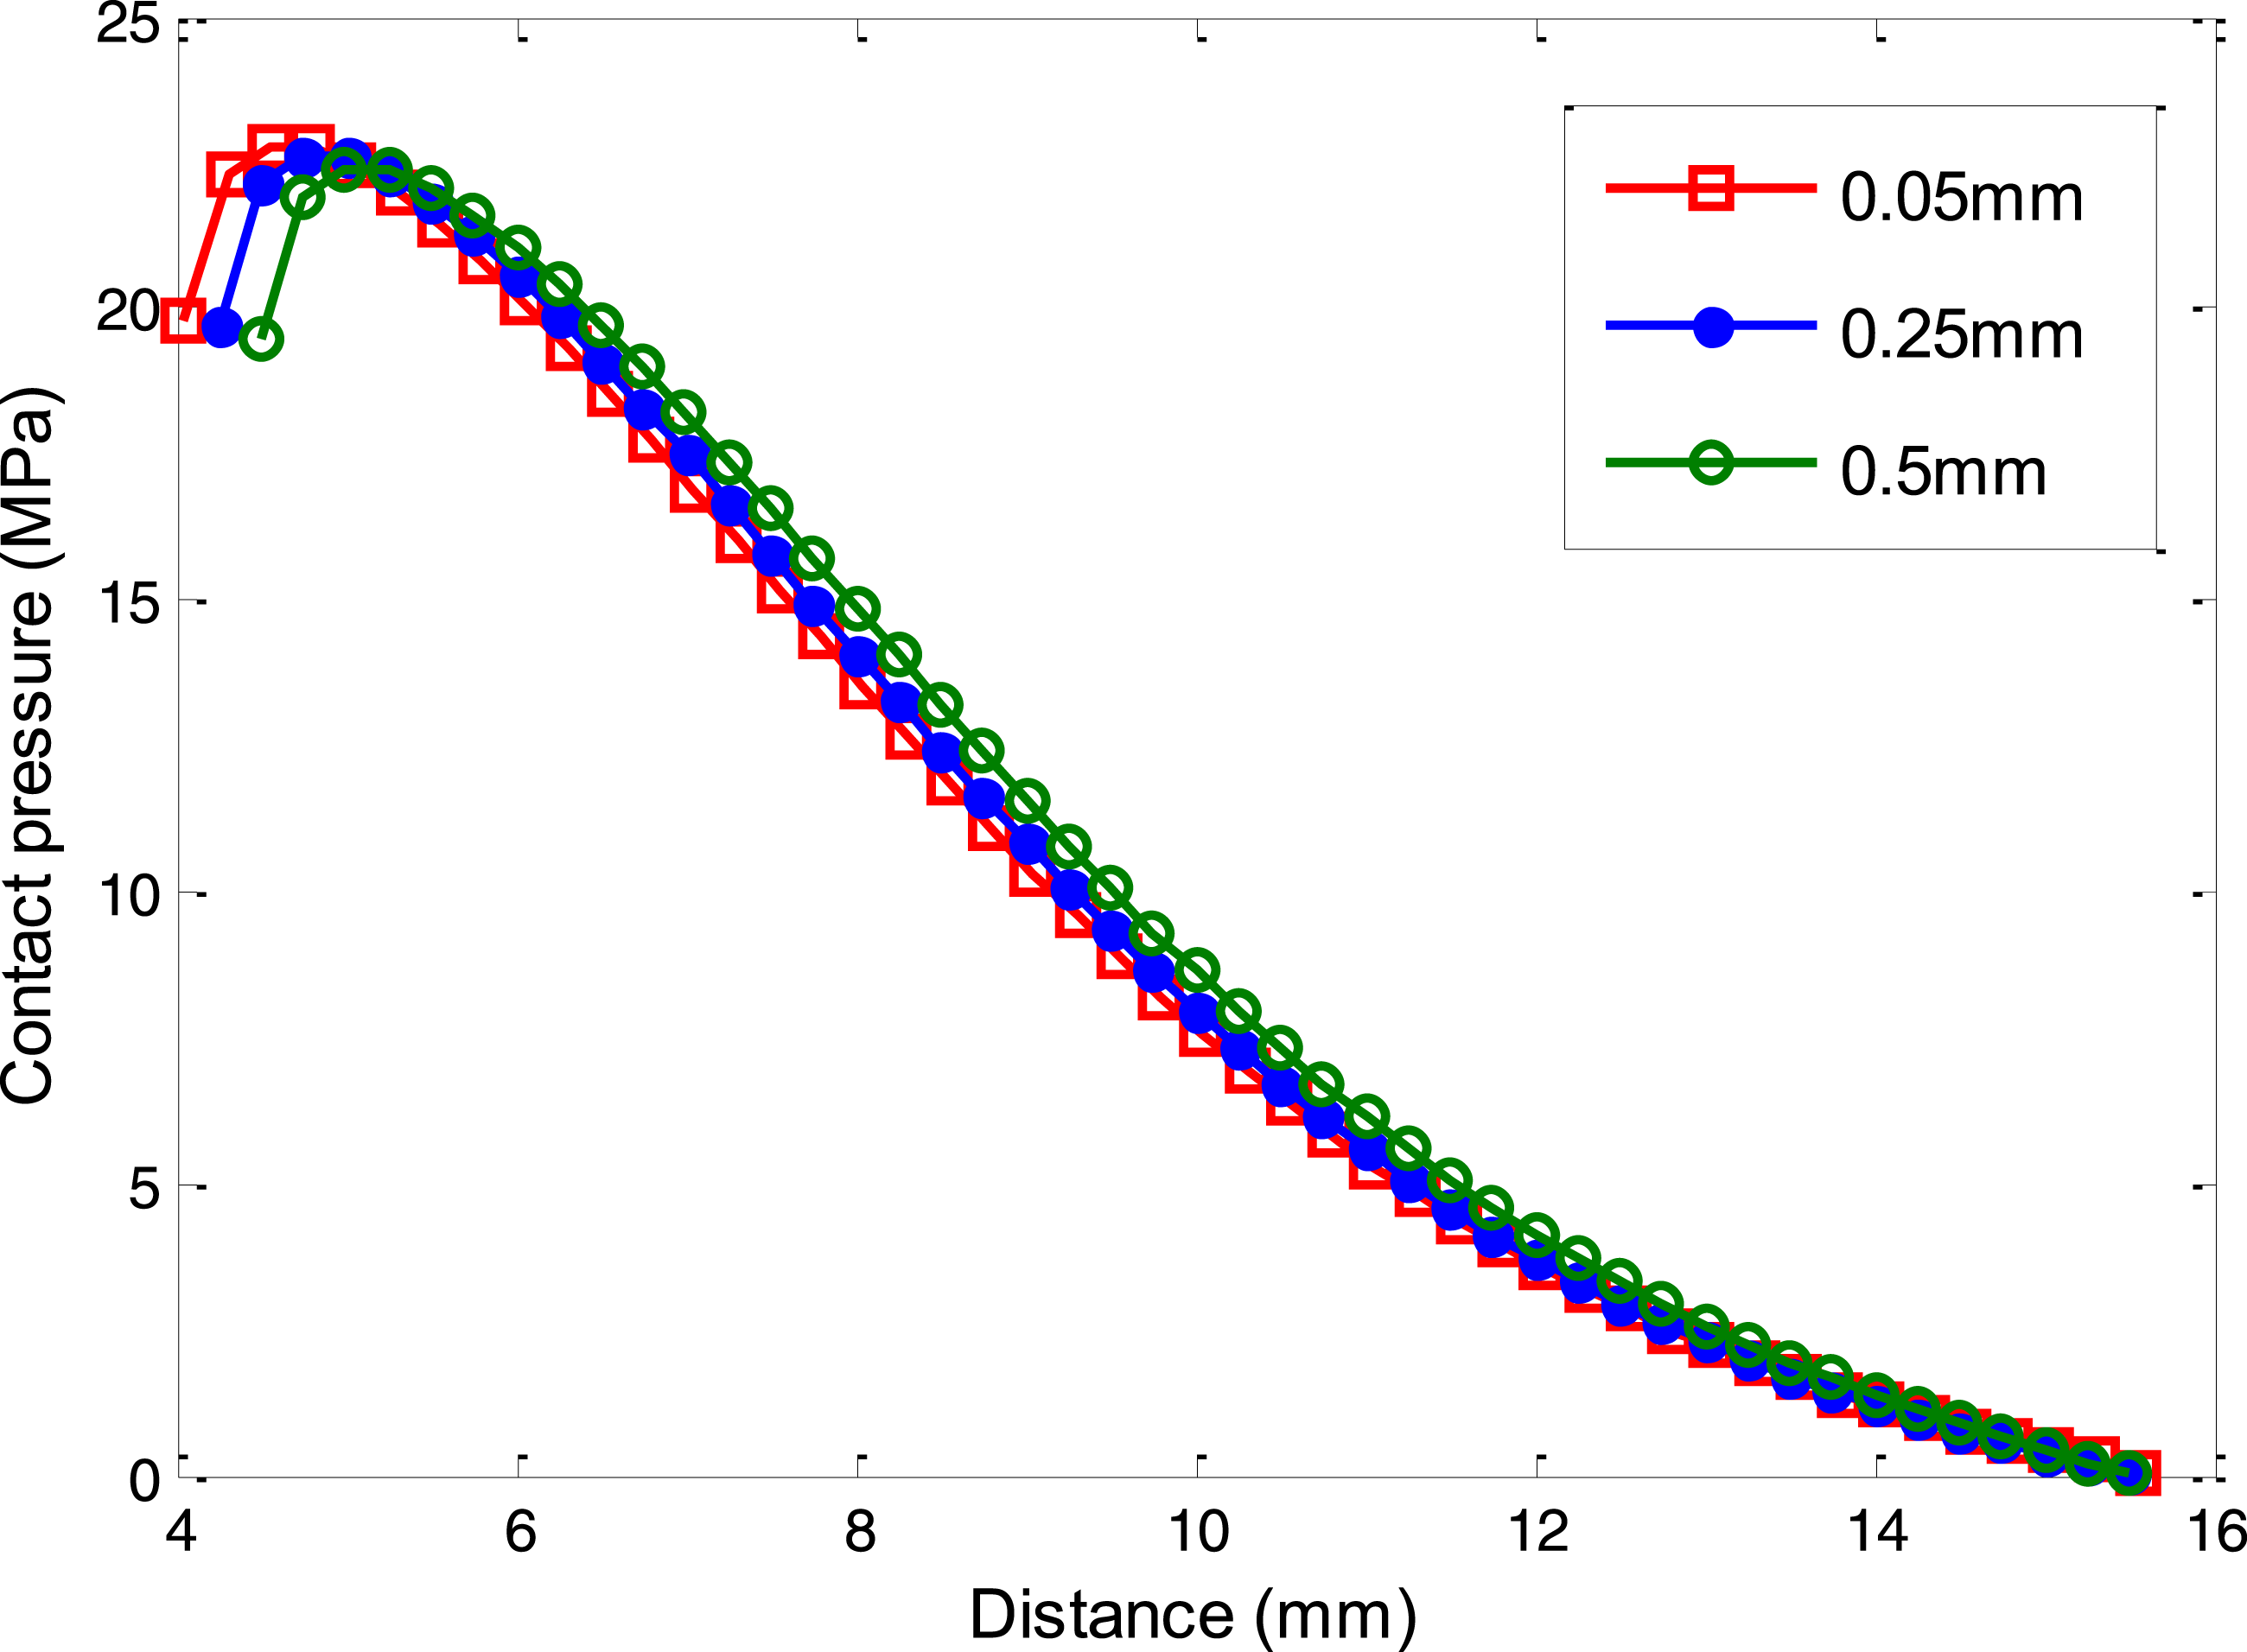
Effect of bolt size
According to the bolt types and related dimensions listed in Table 1, the model shown in Figure 3 is modified to construct the finite element models with different bolt sizes. In all models, the grip length is 20mm and the preload is set to 5kN. Figure 18 shows the variation of contact pressure distribution for different bolt sizes. As can be seen from the figure that the contact pressure peak is reduced with the increase of the bolt size, the peak position moves right due to the increase in diameter of the bolt hole. In addition, enlarging the bolt size will lead to an increase in the interface contact area. The variation characteristics of the contact pressure curves illustrate that the bolt size has an effect on the contact area and contact pressure peak. Contact pressure versus the radial distance under different bolt sizes.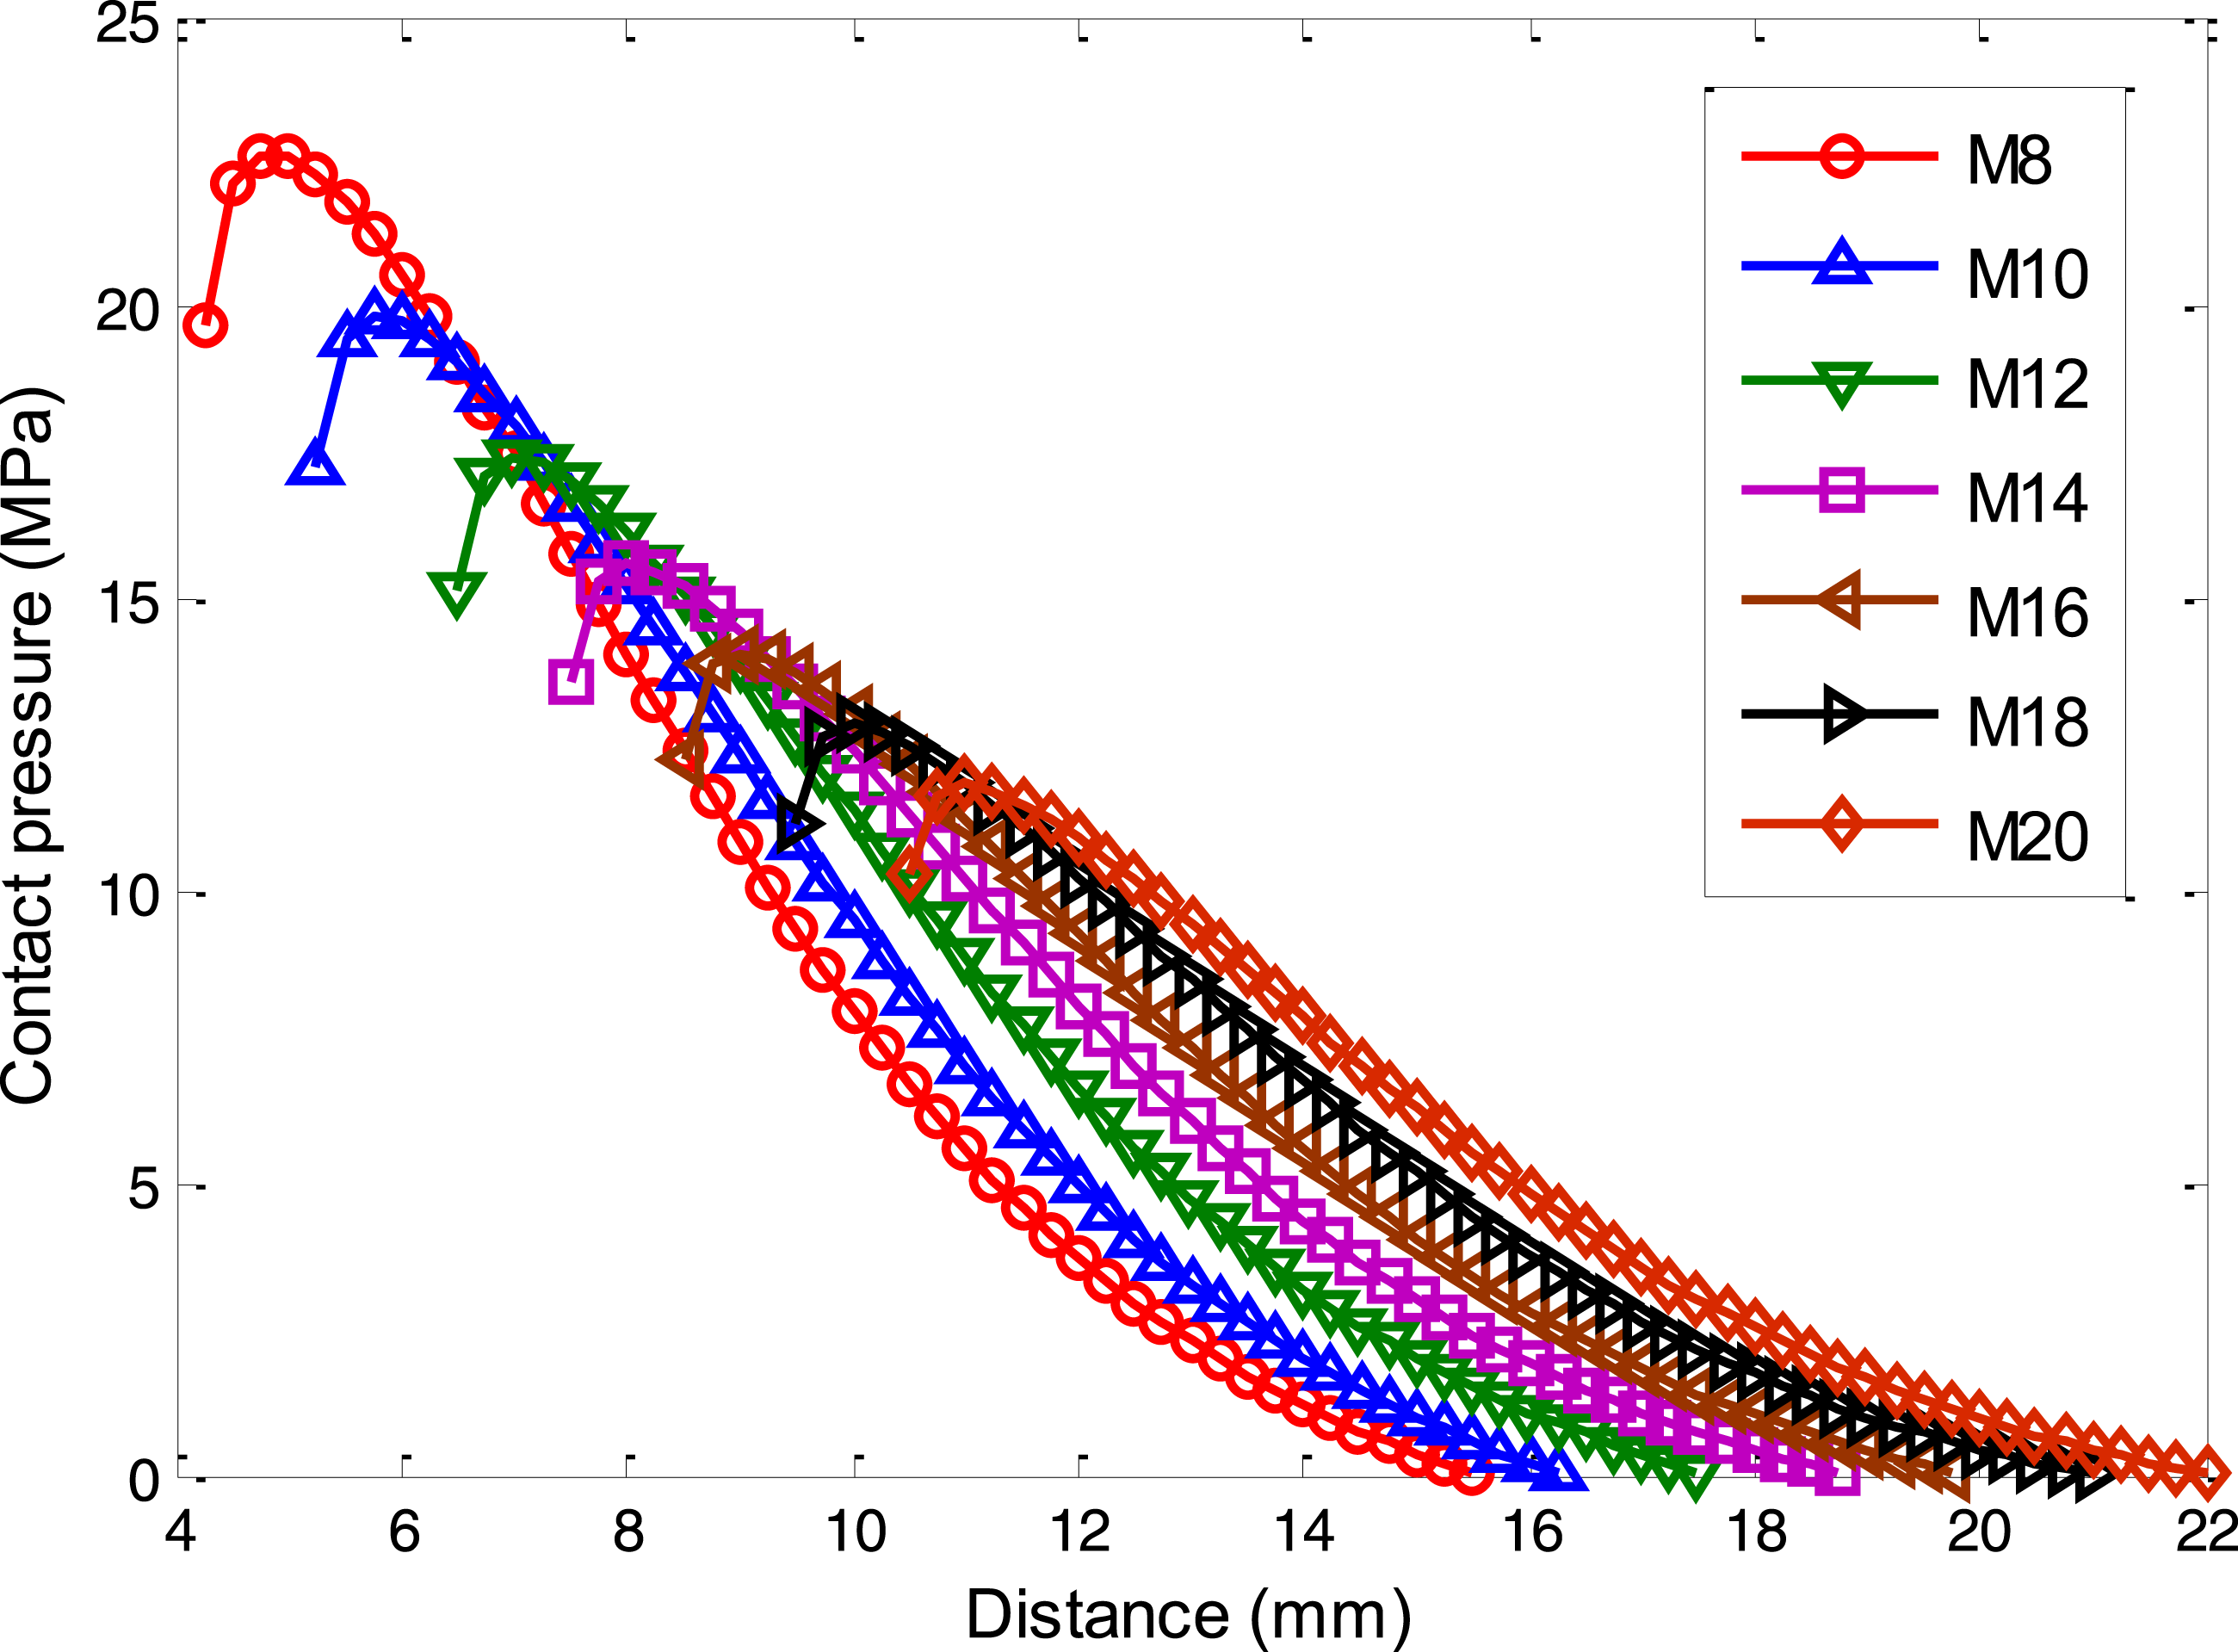
Contact pressure distribution in double-bolted joint
The investigation of the contact pressure distribution in double-bolted joint can provide important guidance for the optimal design of the structural form and position distribution of bolt groups. The pretension force of 5 kN is applied to the two bolts, respectively, in the finite element model shown in Figure 5, where the grip length L is 20 mm. The three-dimensional transverse normal stress distribution within clamped plates for the double-bolted joint is shown in Figure 19, where the stress unit is Pa. It can be observed that the stress distribution profile is like four symmetrical frustums of hollow cone, which are coupled in the middle region between two bolt holes. Because the width of the two plates is a little narrow, there is stress in the small area on the boundary of two plates, which means the dimensions of plates have certain effect on the stress distribution of double-bolted joint. Transverse normal stress distribution contour within clamped plates for double-bolted joint.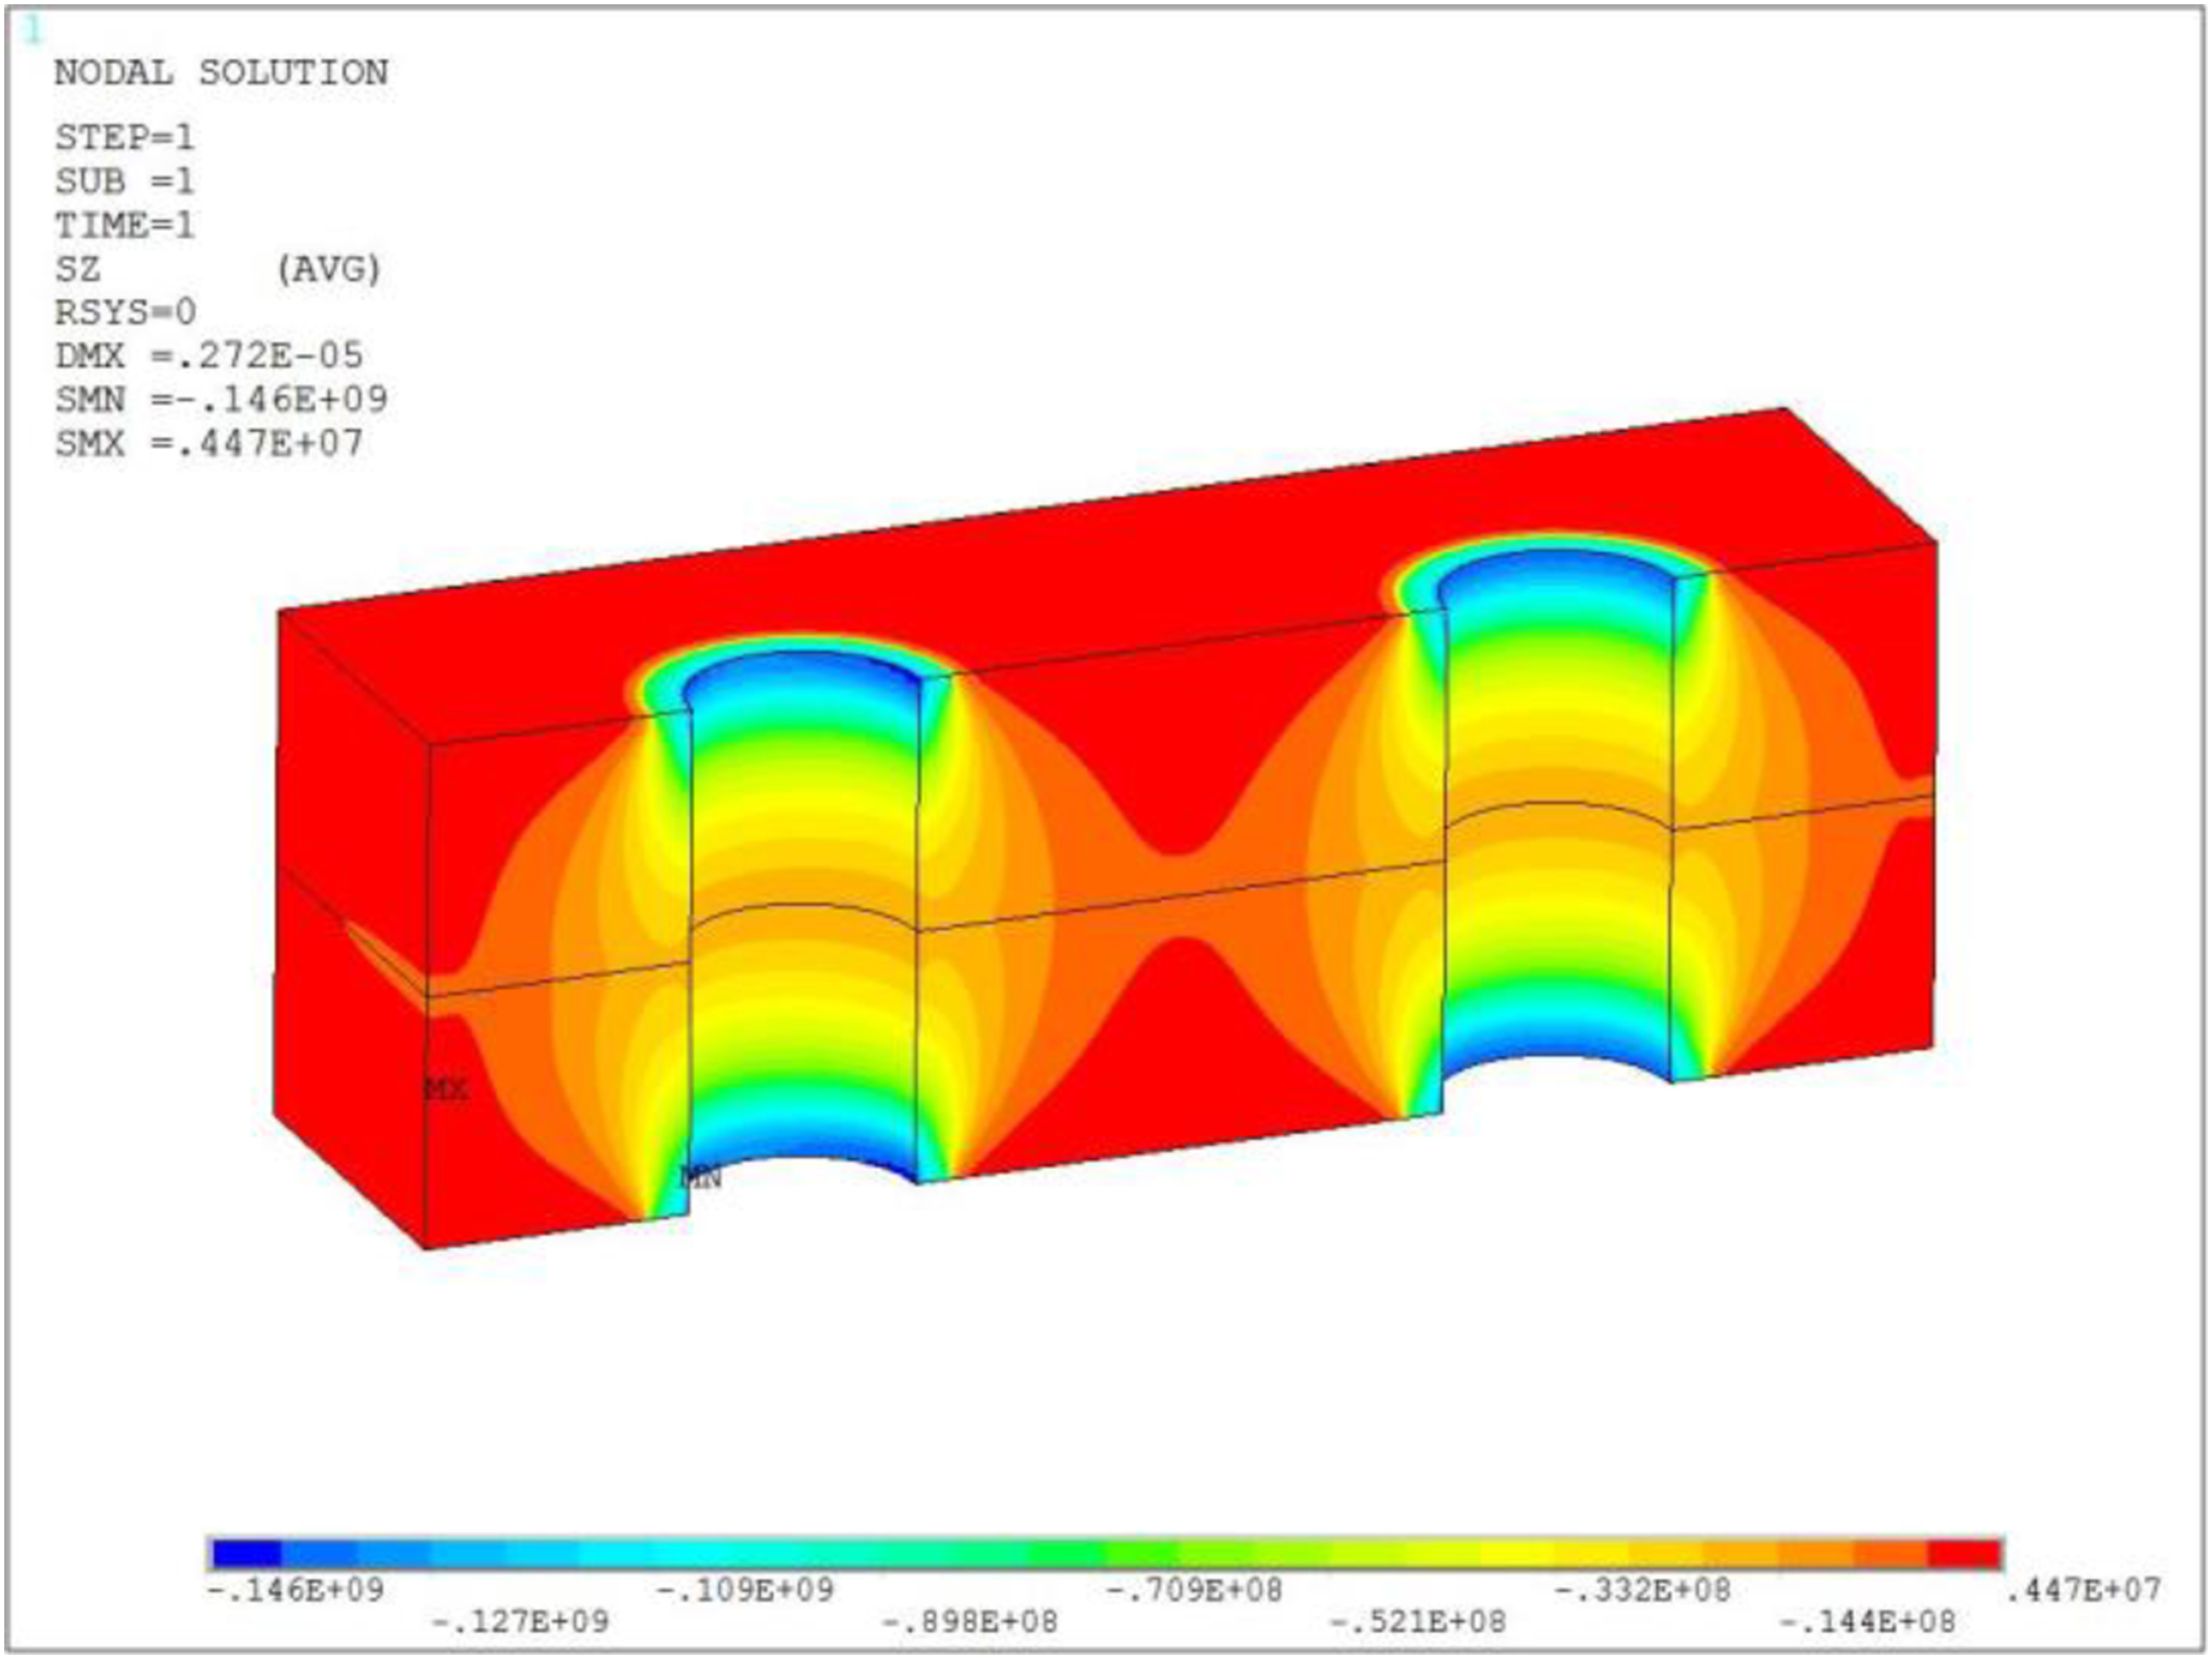
Extraction of nodes pressure on the contact interface, the contact pressure distribution between upper plate and lower plate for the double-bolted joint can be acquired as shown in Figure 20, where the contact pressure distribution contour and change curve of contact pressure along the x-axis are displayed. As can be seen in the contact pressure distribution contour, two circular bands of contact pressure generated by two pretightening bolts are around the two bolt holes, respectively, and are coupled at the outer edge, which indicates the coupling phenomenon of contact pressure existence in the double-bolted joint. It can be observed in the contact pressure curve that contact pressure distribution is symmetric along the y-axis, and the curve characteristic of contact pressure distribution on one side of the y-axis is similar to that of the single-bolted joint. Contact pressure distribution of double-bolted joint.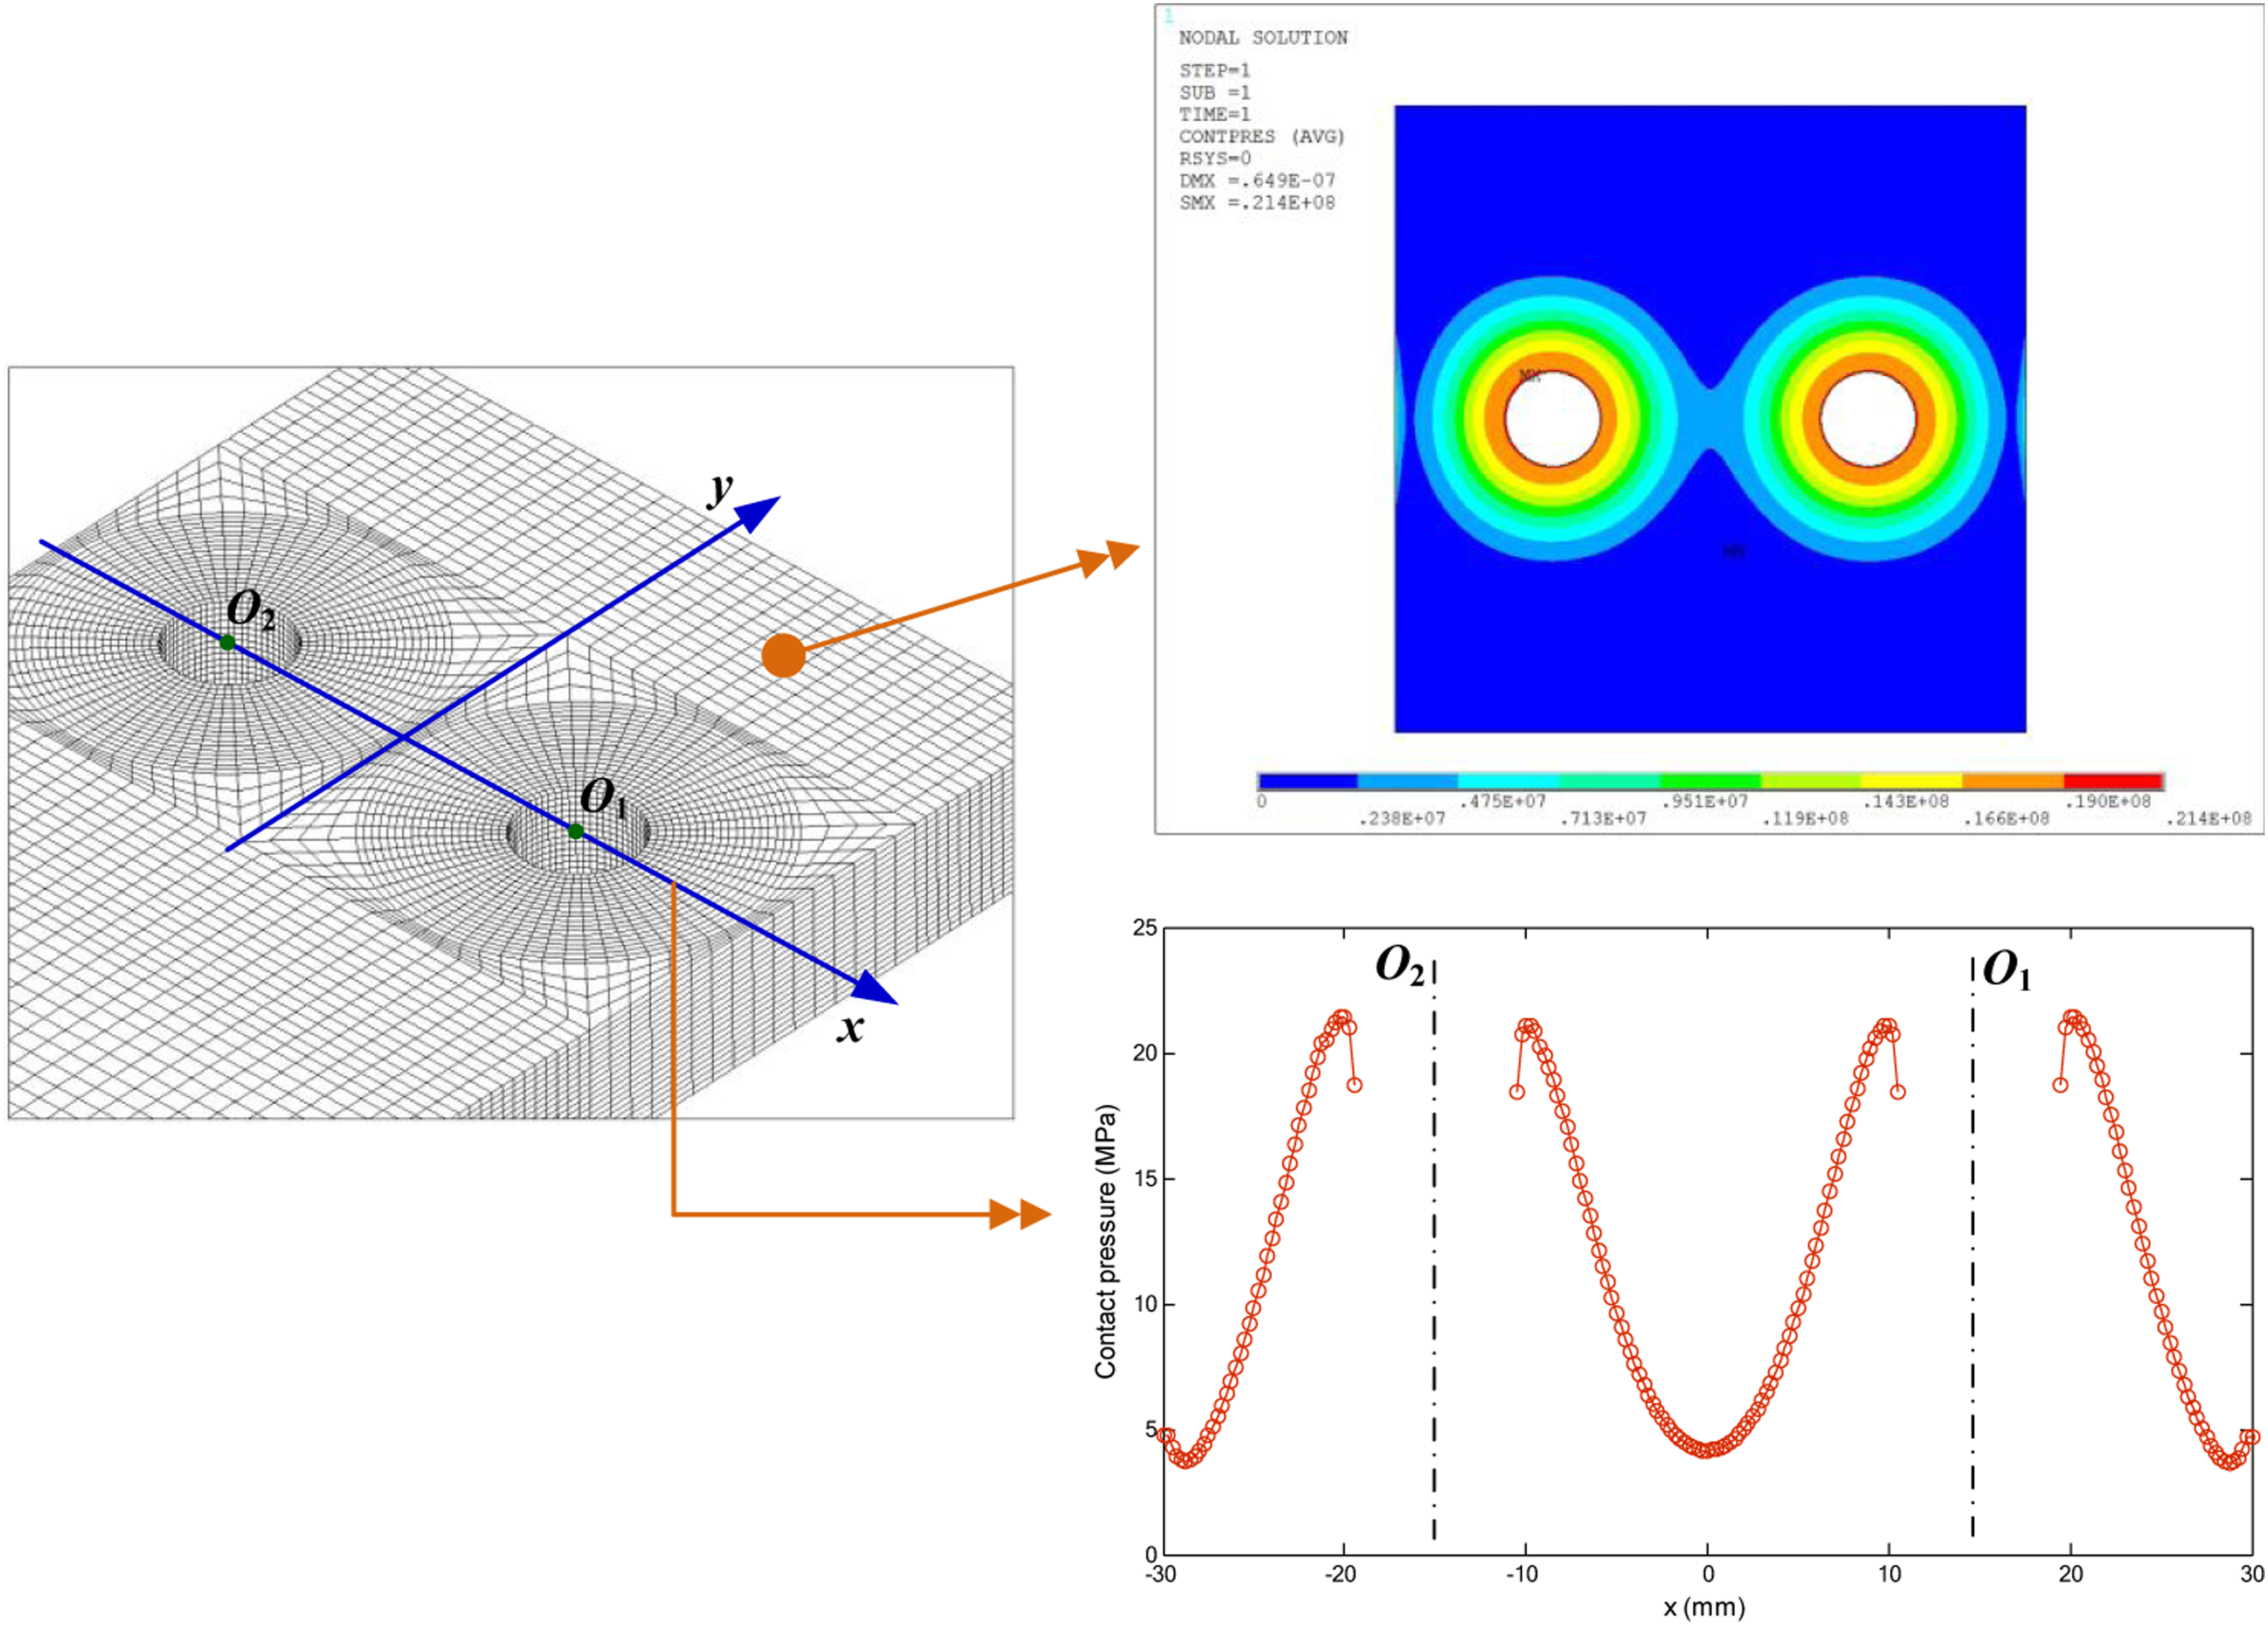
Coupling effect of contact pressure distribution
Contact pressure on the path between bolt 1 center O1 and bolt 2 center O2 on the contact interface of double-bolted joint can directly reflect the coupling effect of the two bolts interaction areas. Therefore, this path will be used to study the coupling effect for the double-bolted joint in the following section. Contact pressure distribution under coupling effect of double-bolted joint is compared with the linear superposition of contact pressure distribution under the single bolt, as shown in Figure 21, where the preload of 10 kN for two bolts is adopted. As can be seen in the figure, these two kinds of contact pressure distributions are not equal; the coupling effect reduces the peak value of contact pressure but increases the trough value of contact pressure, which makes the variation of contact pressure more smoothly and has the potential to increase the contact area. Comparison of contact pressure distribution between coupling effect and linear superposition.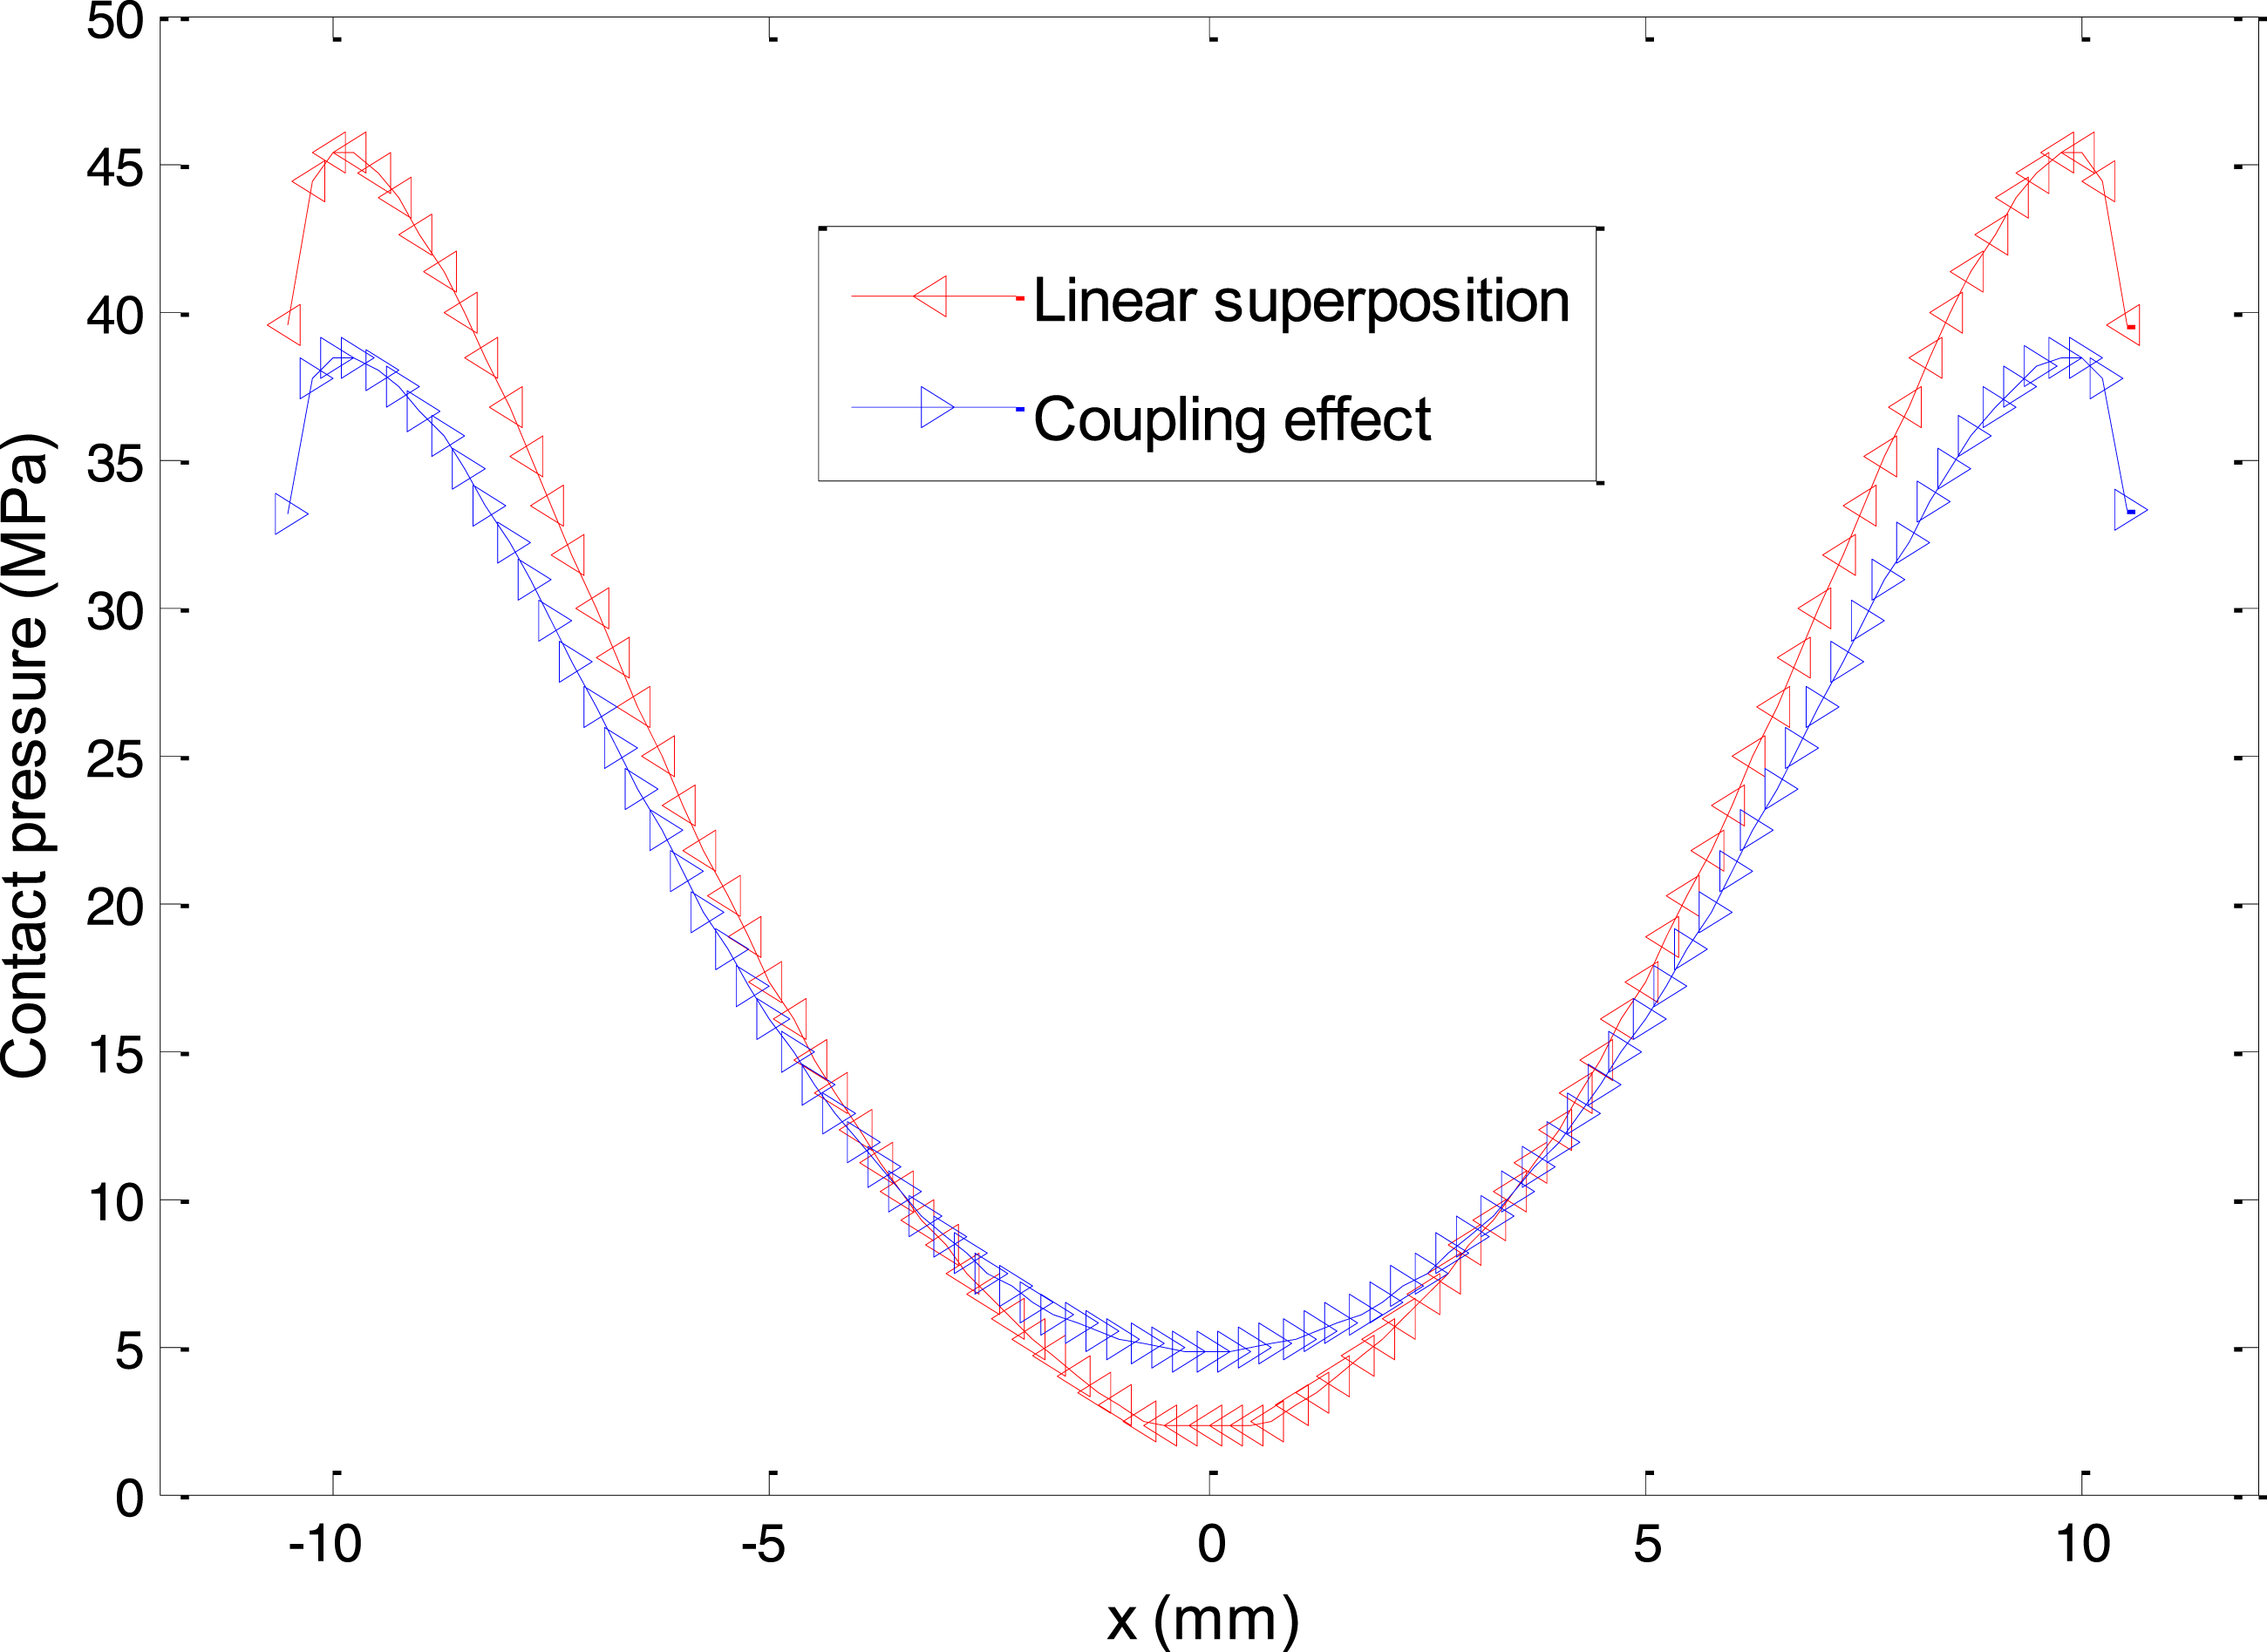
Effect of preload
The effect of preload on the coupling effect of contact pressure distribution in double-bolted joint is considered. Using the joint model shown in Figure 5, preloads of 5kN, 10kN, and 15kN are imposed on the bolt 1 and bolt 2, respectively. Contact pressure distribution under coupling effect for double-bolted joint with different levers of preload are illustrated in Figure 22. It can be seen in Figure 22(a) that the same preloads are applied to the bolt 1 and bolt 2, the contact pressure increases with the increase of preload, and the increasing amplitude of peak value relative to the trough value is great. When the preload of two bolts is very small, the contact pressure in the middle zone may reduce to zero, and then the contact area will be cut down. The contact pressure distribution of two bolts under different preloads is shown in Figure 22(b). Comparing to the Figure 22(a), it is clear that the peak values of contact pressure distribution versus preloads for two bolts remain unchanged, however, the trough value of contact pressure is decreased and its position moves to the side of lower preload. Contact pressure distribution under coupling effect for double-bolted joint with different preloads.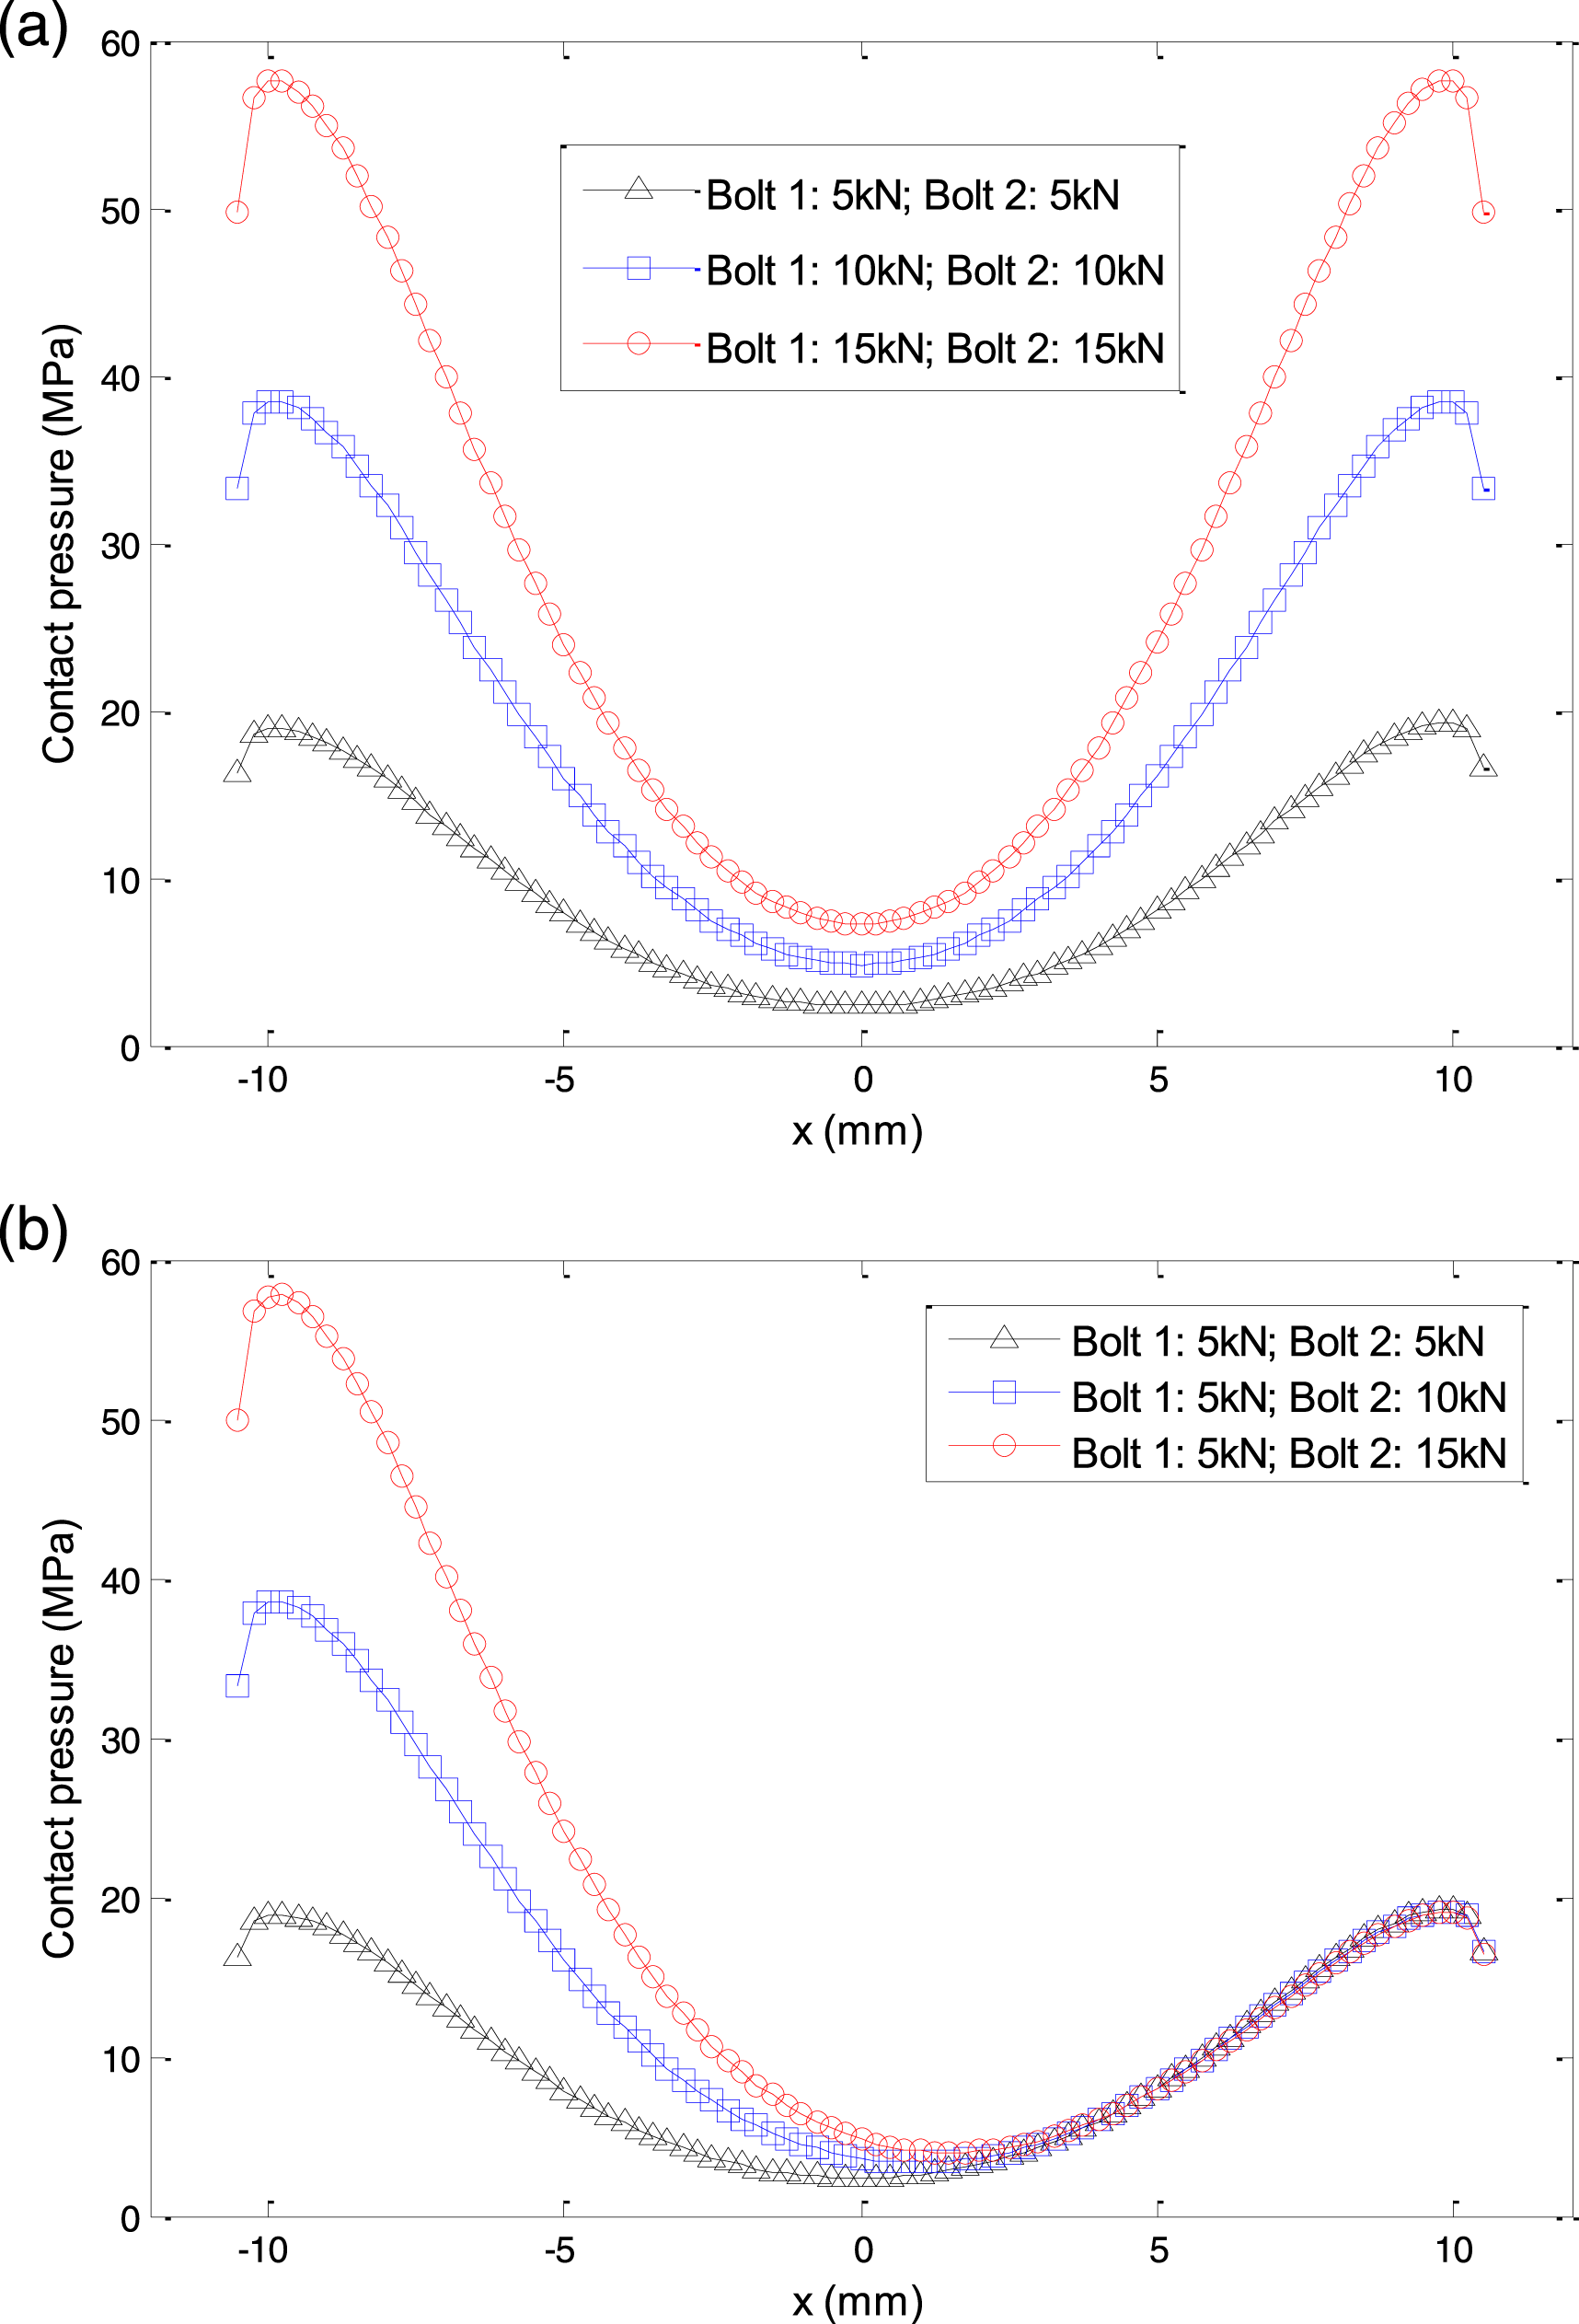
Effect of structural parameters
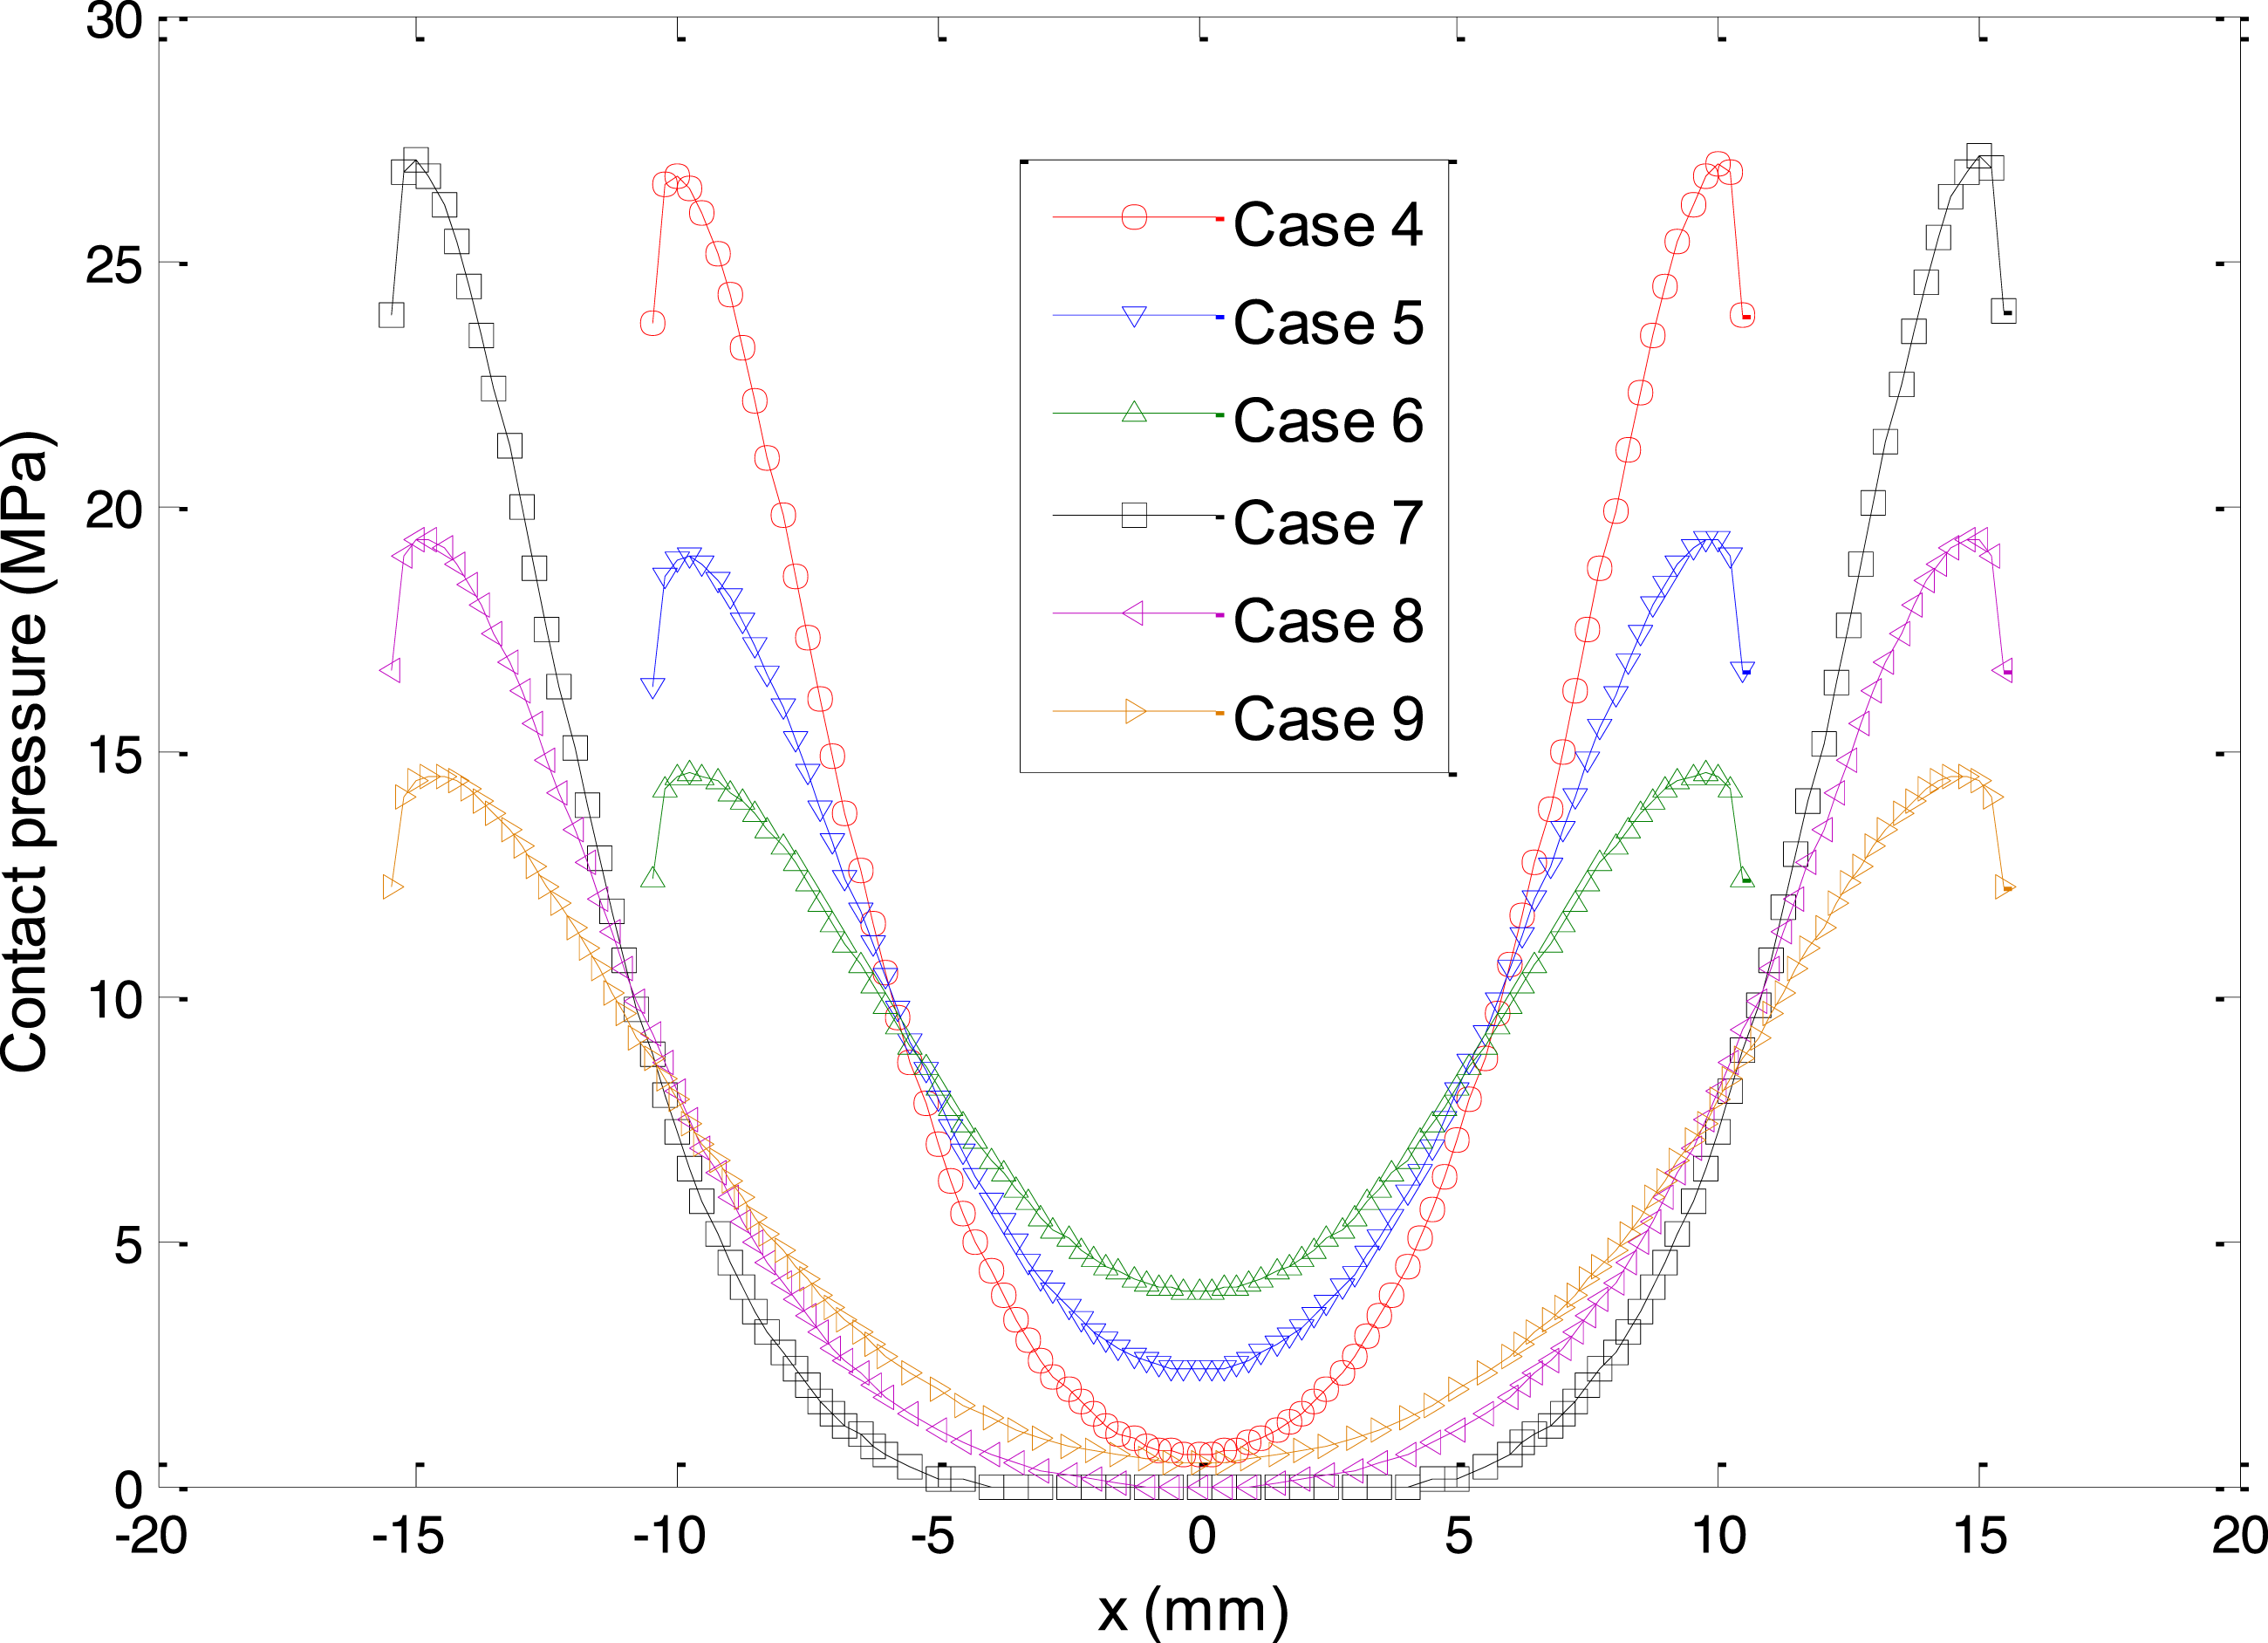
The grip length L and distance D between center lines of two bolts are the key geometric parameters of the double-bolted joint. In this section, the effects of the two geometric parameters on coupling effect of contact pressure distribution are discussed. Table 2 lists nine cases for different combinations of L and D. Contact pressure distribution contour under these cases for double-bolted joint are shown in Figure 23, where the preload of all bolts is set to 5 kN. It is observed that by increasing the grip length L, the coupling region of contact pressure under two pretightening bolts is expanded, and the coupling region shrinks when the value of D increases. Correspondingly, the variation of contact pressure along the path of O1O2 for case 4 to case 9 are shown in Figure 24. It is implied that increasing the grip length L reduces the peak value and improves the trough value of contact pressure under coupling effect for the double-bolted joint. As the distance D is enlarged, the trough value of contact pressure in the coupling region will decrease substantially while the increment of the peak value becomes small. Contact pressure distribution contour for double-bolted joint with different cases. Variation of contact pressure for double-bolted joint with different cases.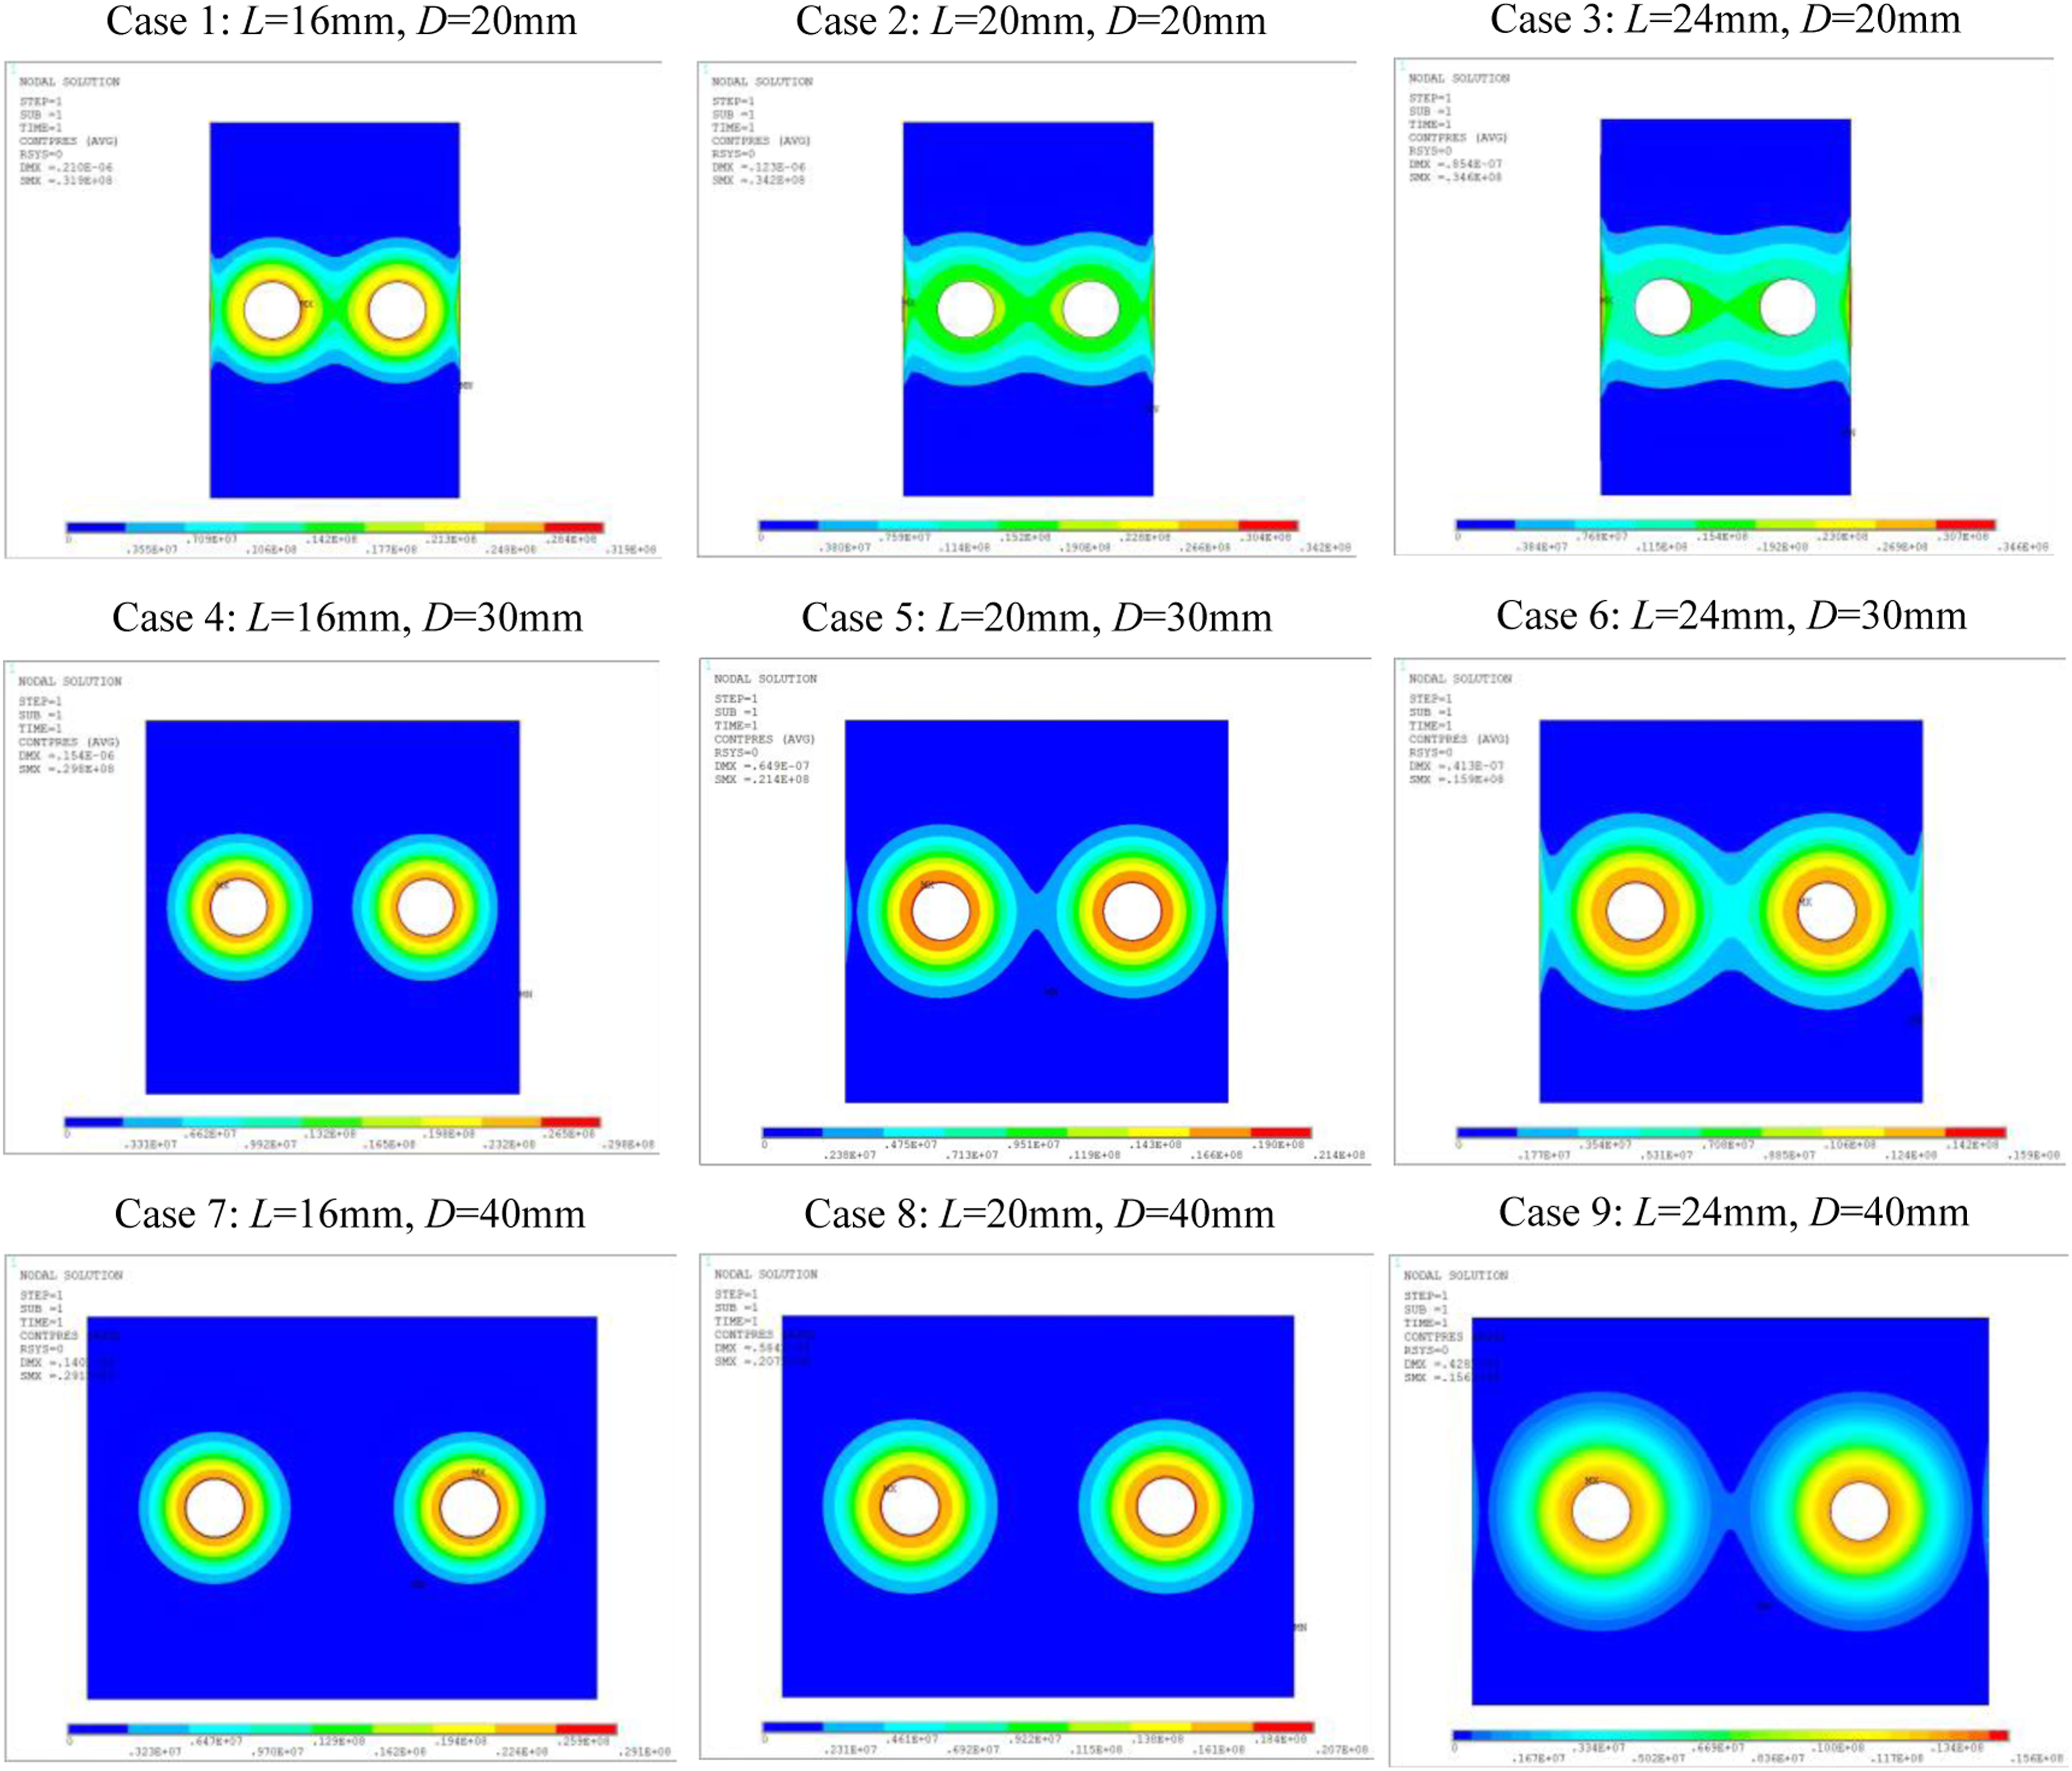
Discussion
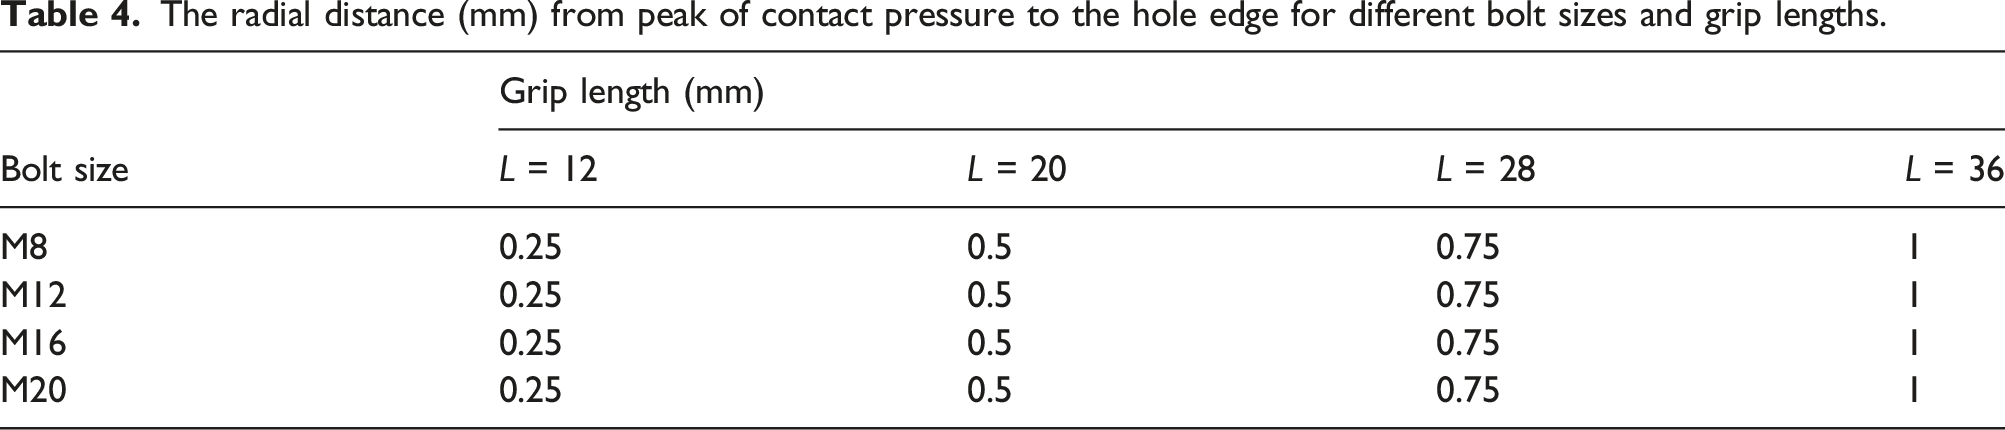
Using the established three-dimensional finite element model of bolted joints, parametric studies were performed to determine the influence of relevant factors on the contact pressure distribution in bolted joints. The factors considered included preload, grip length, material property, hole clearance, and size of the bolt. It can be found that the contact pressure between upper plate and lower plate reaches a peak near the edge of the bolt hole and drops to zero in a distance of a certain radius away from the bolt centerline. The variation characteristics of contact pressure are in agreement with experiment results by this study. Interestingly, the peak value of contact pressure is located inside the contact surface rather than at the edge of bolt hole. Since the bolt head moves perpendicularly away from the contact surface between upper plate and lower plate as the plate thickness increases, and this is a stress concentration factor, the distribution is stretched. Figure 25 shows the displacement contour of the upper plate. As can be seen, the bolt head is not in completely parallel contact with the upper surface when the bolt head acts on the plate, but mainly acts on the upper edge of the bolt hole. This leads to the stress concentration and maximum stress at the upper edge of the bolt hole. The maximum stress on the upper edge of the bolt hole propagates to the contact surface between upper plate and lower plate at an angle with the vertical direction of the plate. Thus, the peak value of contact pressure occurs inside the contact surface, and the position of the peak is related to the thickness of the clamped plates. The radial distance from the peak of contact pressure to the hole edge for different bolt sizes and grip lengths are listed in Table 4. From it, one can see that the peak position of contact pressure depends on the thickness of plate and has nothing to do with the size of the bolt head. In previous investigations,16,17 the contact pressure was assumed to reduce monotonously with the increase of radial distance away from the bolt centerline, and then analytical models of contact pressure distribution obtained were inaccurate. Displacement contour of the upper plate. The radial distance (mm) from peak of contact pressure to the hole edge for different bolt sizes and grip lengths.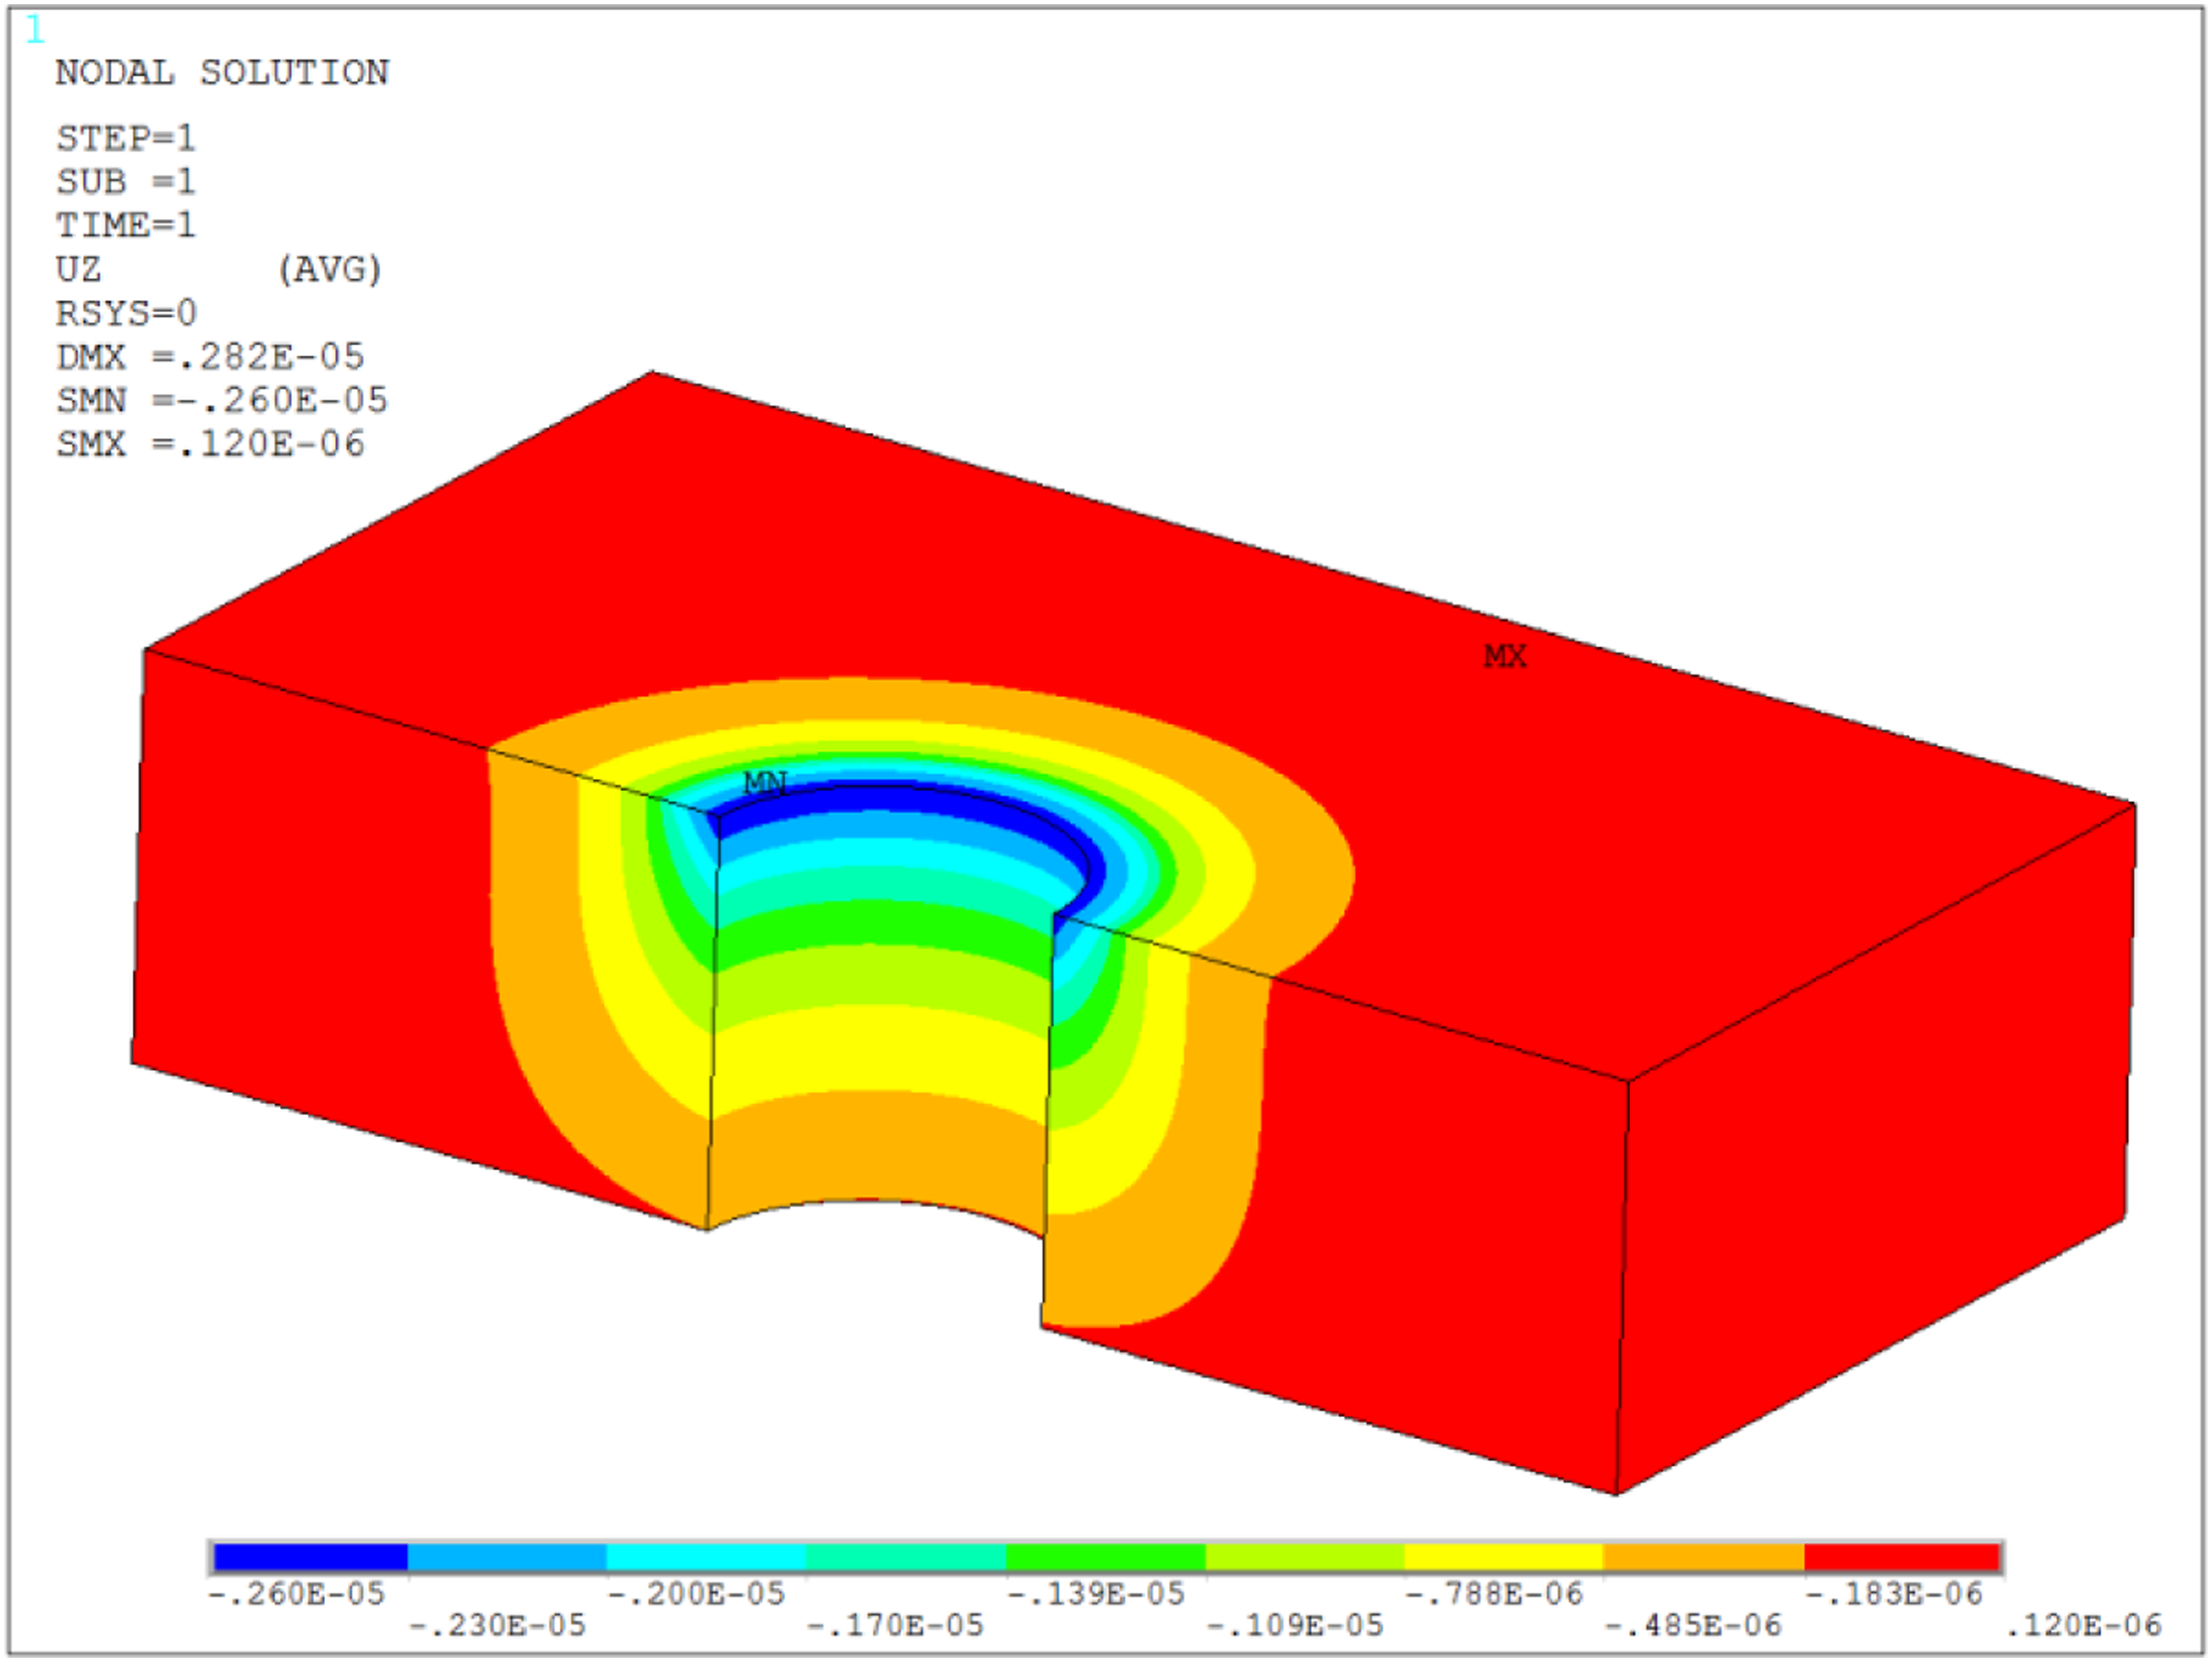
It should be emphasized that the FEA results of contact pressure distribution obtained in this paper were accomplished under two preconditions. On the one hand, the size of clamped plates was large enough, without considering the effect of the boundary of plates on the contact pressure distribution. On the other hand, the material of clamped plates was isotropic, and the stress and strain of plates were in the elastic range. The peak positions of contact pressure as shown in Table 4 were also acquired under these two constraints. When the material of clamped plates has nonlinear property such as elastic-plastic material, viscoelastic material, and composite material, the contact pressure distribution of bolted joints will become more complex, which leads to the uncertainty of the peak position of contact pressure and the difficulty of mathematical characterization. This paper obtained the characteristics and the variation rules of contact pressure distribution under different preloads and structural parameters for the bolted joints. On this basis, the next step of research will focus on the mathematical characterization of the contact pressure distribution at the interface of bolted joints, thereby providing a foundation for high-precision connection stiffness modeling. In addition, if the clamped plates are made of anisotropic materials, the contact pressure distribution features will become complex, which will be studied in future work.
Conclusions
In this paper, the block mapped hexahedral mesh 3D finite element models for single and double-bolted joints were established on the software ANSYS. The models were then utilized to parametric study the effects of the preload and several structural parameters on the contact pressure distribution in single-bolted joint and contact pressure coupling effect of double-bolted joint. The finite element models and the FEA results for the single and double-bolted joint were validated by a series of contact pressure distribution experiments. From the analysis results for the single-bolted joint, the bolt size and grip length had an important influence on the peak value and contact area of contact pressure. The contact pressure increased with the increase of the preload for any given grip length, but the variation of preload does not change the size of contact area. With respect to the double-bolted joint, increasing the grip length and decreasing the distance between two bolt holes can improve the coupling region of contact pressure and have obvious effect on the contact pressure distribution. It is also indicated that the contact pressure under coupling effect increases with the increase of preload, and the increasing amplitude of peak value relative to the trough value is great. The study of contact pressure distribution provides the basis and priori knowledge for structural design and safety monitoring of bolted connection structures.
Recommendation
The next research will focus on the mathematical characterization of the contact pressure distribution at the interface of bolted connection, so as to provide a basis for high-precision stiffness modeling. In addition, the influence of the clamping plate made of anisotropic materials on the contact pressure distribution will be studied in the future work.
Footnotes
Declaration of conflicting interests
The author(s) declared no potential conflicts of interest with respect to the research, authorship, and/or publication of this article.
Funding
The author(s) disclosed receipt of the following financial support for the research, authorship, and/or publication of this article: This work was supported by natural science research project of colleges and universities in Jiangsu Province (21KJB460004) and the Joint Funds of the National Natural Science Foundation of China (U2268205).