
Abstract
Using a demolition hammer among the power tools is one of the most challenging job tasks for the operators of these tools, which exposes users to high levels of hand-transmitted vibrations. The focus of this study was for finding the vibration levels transmitted to the handles, the frequency content transmitted by the tool, and the effect of using insert bits with different tip shapes and lengths using conventional demolition hammers under controlled operating conditions on typical concrete slabs in the field. Three demolition hammers (weighing between 14 and 27 kg) with two handles installed were subjected to simultaneous measurements based on ISO 5349 as the field measurement technique. The findings demonstrated that even while the vertical axis dominated, several samples also produced equivalent x-axis results. The impact energy of the tools employed and the transmitted vibration to the tool handles are not significantly correlated with each other. All mean values were higher in the slabs with a thickness of 15 than those with 10 cm. The mean values of the total results for the two forms of flat and point tip inserted bits were 16.85 and 15.86 m/s2, respectively, and in the samples with the same operating factors, this difference was more than 3 m/s2 (p < .03). The a wrms (frequency-weighted root mean square acceleration) produced at tools using 60 cm bits were more than those with a length of 40 cm, both for the average of the total results and the average of the results of each hammer. The difference between the average bit length groups over samples with the same factors reached 4.65 m/s2 (p = .02). Frequency analysis for the flat and point insert bits with 60 cm length in the concrete slabs with a thickness of 15 cm showed that the dominant frequencies detected at lower frequencies for point bits. This difference is almost two frequency parts of 1/3 octave band.
Introduction
Hand and arm vibration (HAV) exposure occurs when hand-held vibrating tools are used with any power source. Exposure levels vary among different power tools used by workers in different job tasks. This type of tools, due to their natural function, that is, demolition of concrete surfaces and stone cutting, they usually need to make strong blows at the work point.1,2 As a result, this tremendous energy is transmitted from the tool handle to the operator’s hand through the tool handle and other attachments. In the construction and maintenance sector, concrete breakers, demolition or jack hammers, impact and rotary hammer drills, and power drills are the most often utilized heavy duty vibrating power instruments.3,4
If the term rotary is not used to describe this tool, it usually functions as an impact or hammer mechanism. In the case of tools with percussive action, there is a kind of a mechanical system that can convert the rotational force of the motor into a hammer force with a very high and robust frequency. The power or speed of the operating mechanism of these tools, whether percussion or rotational, along with other effective factors such as grip force,4–7 feed force,2,7–9 bit wear,10,11 bit diameter,8,12–14 device weight,4,15 power source,15,16 and user arm posture7,17 have considered in the magnitude of the vibration of the tools of the handle. The results of a study in a group of construction workers showed that jackhammering was pointed out to be a task that had the most significant damage to their health. 18
While working these tools, especially demolition hammers, in addition to ergonomic risks, including exposure to high force, repetitive movements, contact stress, and load handling, exposure to high levels of hand vibration during work is an added risk.4,13,15 If this high level of vibration lasts for several months, adverse health effects will occur this level of exposure include vascular, neurological, and other cardiovascular system disorders that are related to damage to the blood vessels. The occurrence of these complications and disorders is known as Vibrating white finger disease (VWF).19–21 Specific symptoms of the disease include discoloration or whitening of the fingers with numbness, pins, and needles, which often occur in cold and wet conditions. Neurological disorders caused by damage to the nervous system are associated with numbness, a tingling sensation, and a decrease in handgrip strength. Other symptoms include pain and stiffness of the hands and forearms with a general decrease in accuracy and strength.19,22,23
Vibration magnitude reports for vibratory power demolishing tools are very diverse and range from 5.18 m/s2 for rotary hammer in field measurement at maintenance works, 24 6.77–12.78 m/s2 related to two pneumatic 6.6 and 6.9 kg chipping hammer with 50–200 N feed force in laboratory, 2 9.7 m/s2 and 19 m/s2 on many of 27, 40 kg pneumatic a hydraulic jackhammer, 15 8.6–26.61 m/s2 on combination hammer and electric breaker,13,25 and 45–55 m/s2 related to unknown pneumatic and hydraulic rock hammer at quarry in Vietnam. 26
In previous study by Rempel et al., 16 two types of drills with different power supplies and similar weight showed that the a wrms (frequency-weighted root mean square acceleration) for pneumatic drill (with a weight of 8.6 kg, the APT-115 model with a frequency of 48 Hz—which is one of the lightest wind instruments) compared to electric rotary drills (with a weight of 8.3 kg HILTI TE70-AVR with a pulse frequency of 64 Hz) is more than five times (39.1 VS 7.15 m/s2).
Johnson et al. 4 conducted a study on the effect of muscle activity, pressing and pressing when using vibrating power tools on two asphalts and concrete work surfaces with thicknesses of 4 and 6 inches using pneumatic and hydraulic demolition hammers. Working on an asphalt surface produces approximately 30% more vibration on the operator’s hand, and at 6 inches thick, the tool vibrates about 33% more than on work surface with 4 inches thick.
Edward et al. 25 and Sam and Kathirvel 27 show that the work method used by the user is the most important factor for the level of transmitted vibration, while Hartung et al. 28 and Aldin, 17 respectively, introduced the use of gripping/feeding force, and in some frequencies, the relative position of the wrist-forearm and the position of the straight or bent forearm as more effective parameters. Common bits used for demolition hammers are often of varying lengths and flat tips and square or round shapes, depending on operational requirements. These chisels, with their very hard material, can penetrate the heart of all kinds of non-metallic structures.13,25,29,30
Even though a certain drill diameter is optimal for use in any tool, many studies have found a positive relationship between the diameter of the inserted bits and the magnitude of the handle vibration.12–14 But today, for safety reasons, in most demolition hammers, only one bit’s diameter can be used in each hammer. The design of the hammer drill and the method or technique of the user can also affect the vibration of the handle.24,25 Metals were used in these studies, but in a study by Antonucci et al., 11 automated test bench according to ISO 10-28927 31 was used. In a study by Antonucci et al., 11 they presented vibration peak values for bits with a certain time of previous use and the reported weighted and weightless acceleration values were 4.7 and 15 m/s2 at 50 Hz, respectively11. A specific trend for determining the effect of tool weight, whether rotary or percussive, is not known even for tools with the same brand and structure, meaning that lighter tools have not always been reported as safer and better tools.4,13,15,25 Manufacturers of demolition and drilling tools also tended to underestimate the measured values of their tools and usually report a single vibration value of the tool handle under standard conditions. In the study comparing ISO 8662 and ISO 5349 methods in evaluating the output results of a group of demolition and drilling tools, which has created differences from 2.85 to 12.61 m/s2 for different groups of these tools and the average values based on The ISO 8662 method is consistently very lower than ISO 5349. Published studies based on ISO 8662 are commonly known as CE Data, and tool makers use this method. 25 The vibration level reported by the hammer drill manufacturers may more or less estimate the actual workplace risk depending on the specific conditions of data collection.2,3 In addition, compared to laboratory research, field research has many advantages. Measurements and results of field conditions can be used not only to assess vibration exposure, but also to evaluate control strategies with greater confidence.
The primary dominant frequency in hand tools is proportional to the rotation frequency tool (impact or rotation), and along with this frequency, other harmonic frequencies are usually observed in the frequency signal of the tools. These dominant frequencies are usually seen in electric hammers at less than 400 Hz and in pneumatic hammers in the range of 1000–1500 Hz. 16 The use of personal protective equipment such as vibration reducing gloves (VRG) also usually causes a limited rate of vibration reduction on the Users hand or even use of some of them may have adverse effects. 32 Welcome et al. found that the vibration decline rate for frequencies less than 400 Hz in such gloves is about 10%. 33 Frequency content of many vibrating hand tools is in this frequency range, especially for impact hammers.11,16 In addition, when using this type of gloves, due to their higher diameter than ordinary gloves, many executive interventions generate in the work process of the operator.16,32–34 There are still many doubts about the effectiveness of these gloves, transfer to the fingers in particular due to the limited studies. As a vital concern, these gloves reduce the dexterity and grip of the hands. Therefore, if their significant effectiveness is not confirmed, using them will also have disadvantages.33–35
Since the relationship between vibration level and maximum exposure time is exponential, accurate exposure data is essential in this class of instruments. Due to the different effective variables and the great variety in heavy electric demolition hammers, knowledge about them is limited. Therefore, the aims of this study were investigating the actual exposure of users during concrete demolition with standard electric demolition hammers available in real fields but under control to answer the following questions: 1. What is the actual level of exposure during the demolition of concrete by this tool? 2. Does the demolition of concrete with different thicknesses have different results? 3. Does the tip shape of the used bits affect the handle vibration rates or the user’s exposure? 4. Does the length of the used bits affect the handle vibration rates or the user’s exposure? 5. Is the speed of transmission of vibration the same in two types of tools? 6. Will the frequency spectrum transmitted in the tools change significantly as their bit’s specification change?
Material and methods
Concrete specification
A total of 150 concrete blocks were made and after 45 days of processing, curing and preparation to achieve the structural quality of concrete (C 20) based on EN 206-1: ISO 2000, 679; 36 ISO 28927-10 31 demolition of concrete slabs was carried out. To prepare the concrete used, we first consulted with an expert consultant in concrete processing and preparation. Since C 20 quality concrete is widely used in real environments in the construction and flooring, it was chosen based on the consultant’s recommendation and previous studies.
All concrete slabs were prepared on a uniform surface with the same mixing and grading with the cooperation of a concrete engineer at the same time and place. Each slab measures 40 × 70 cm and has two thicknesses of 10 and 15 cm. A wooden grid with specified dimensions was created to separate the slabs before concreting. After preparing the concrete slabs, the wooden frame of each concrete piece was removed and the piece was completely demolished separately. In this situation, we were assured that the quality of other concrete slabs will not be affected by the impacts caused by the demolition of the side slab, and therefore, the optimal quality of the blocks will be maintained. Figure 1 shows the prepared concrete slabs Figure 1(a), destroyed concrete slabs Figure 1(b) and the conditions of the demolition process Figure 1(c). Produced concrete slabs (a), quality of demolished slabs (b), and demolition process by user 2 (c).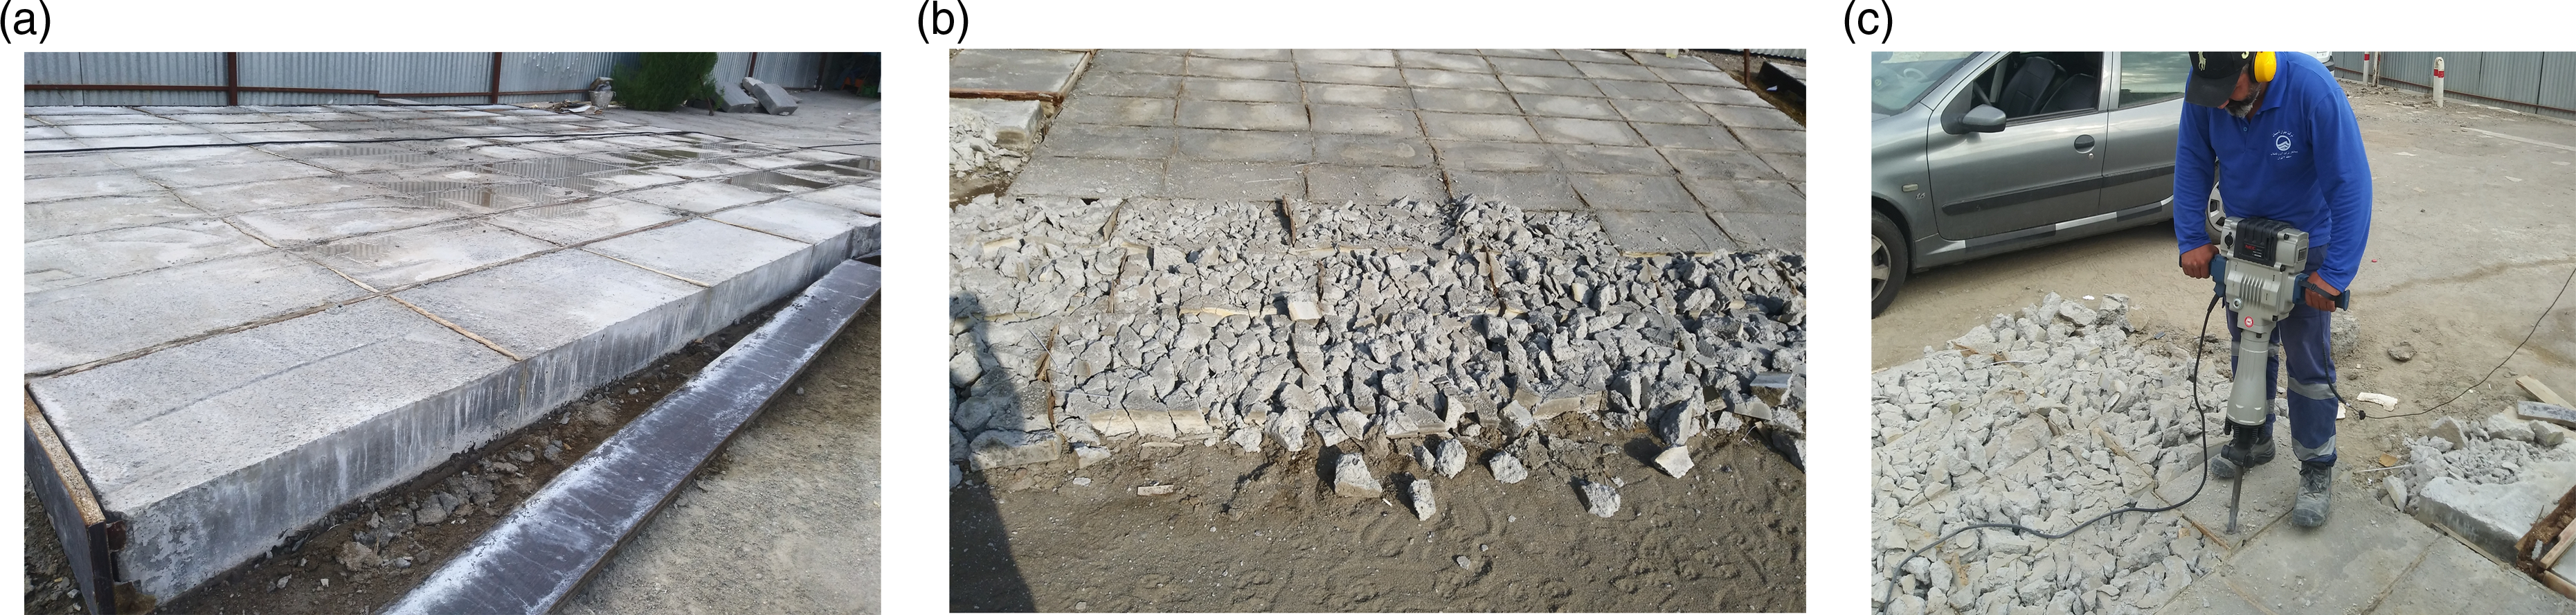
Device specification and test procedure
In the present study, we used three new NEC professional electrical demolition hammer as depicted in Figure 2(a) that widely used in Iran and other Middle East countries. Demolition hammers used (a) and bits used (b) in the study process.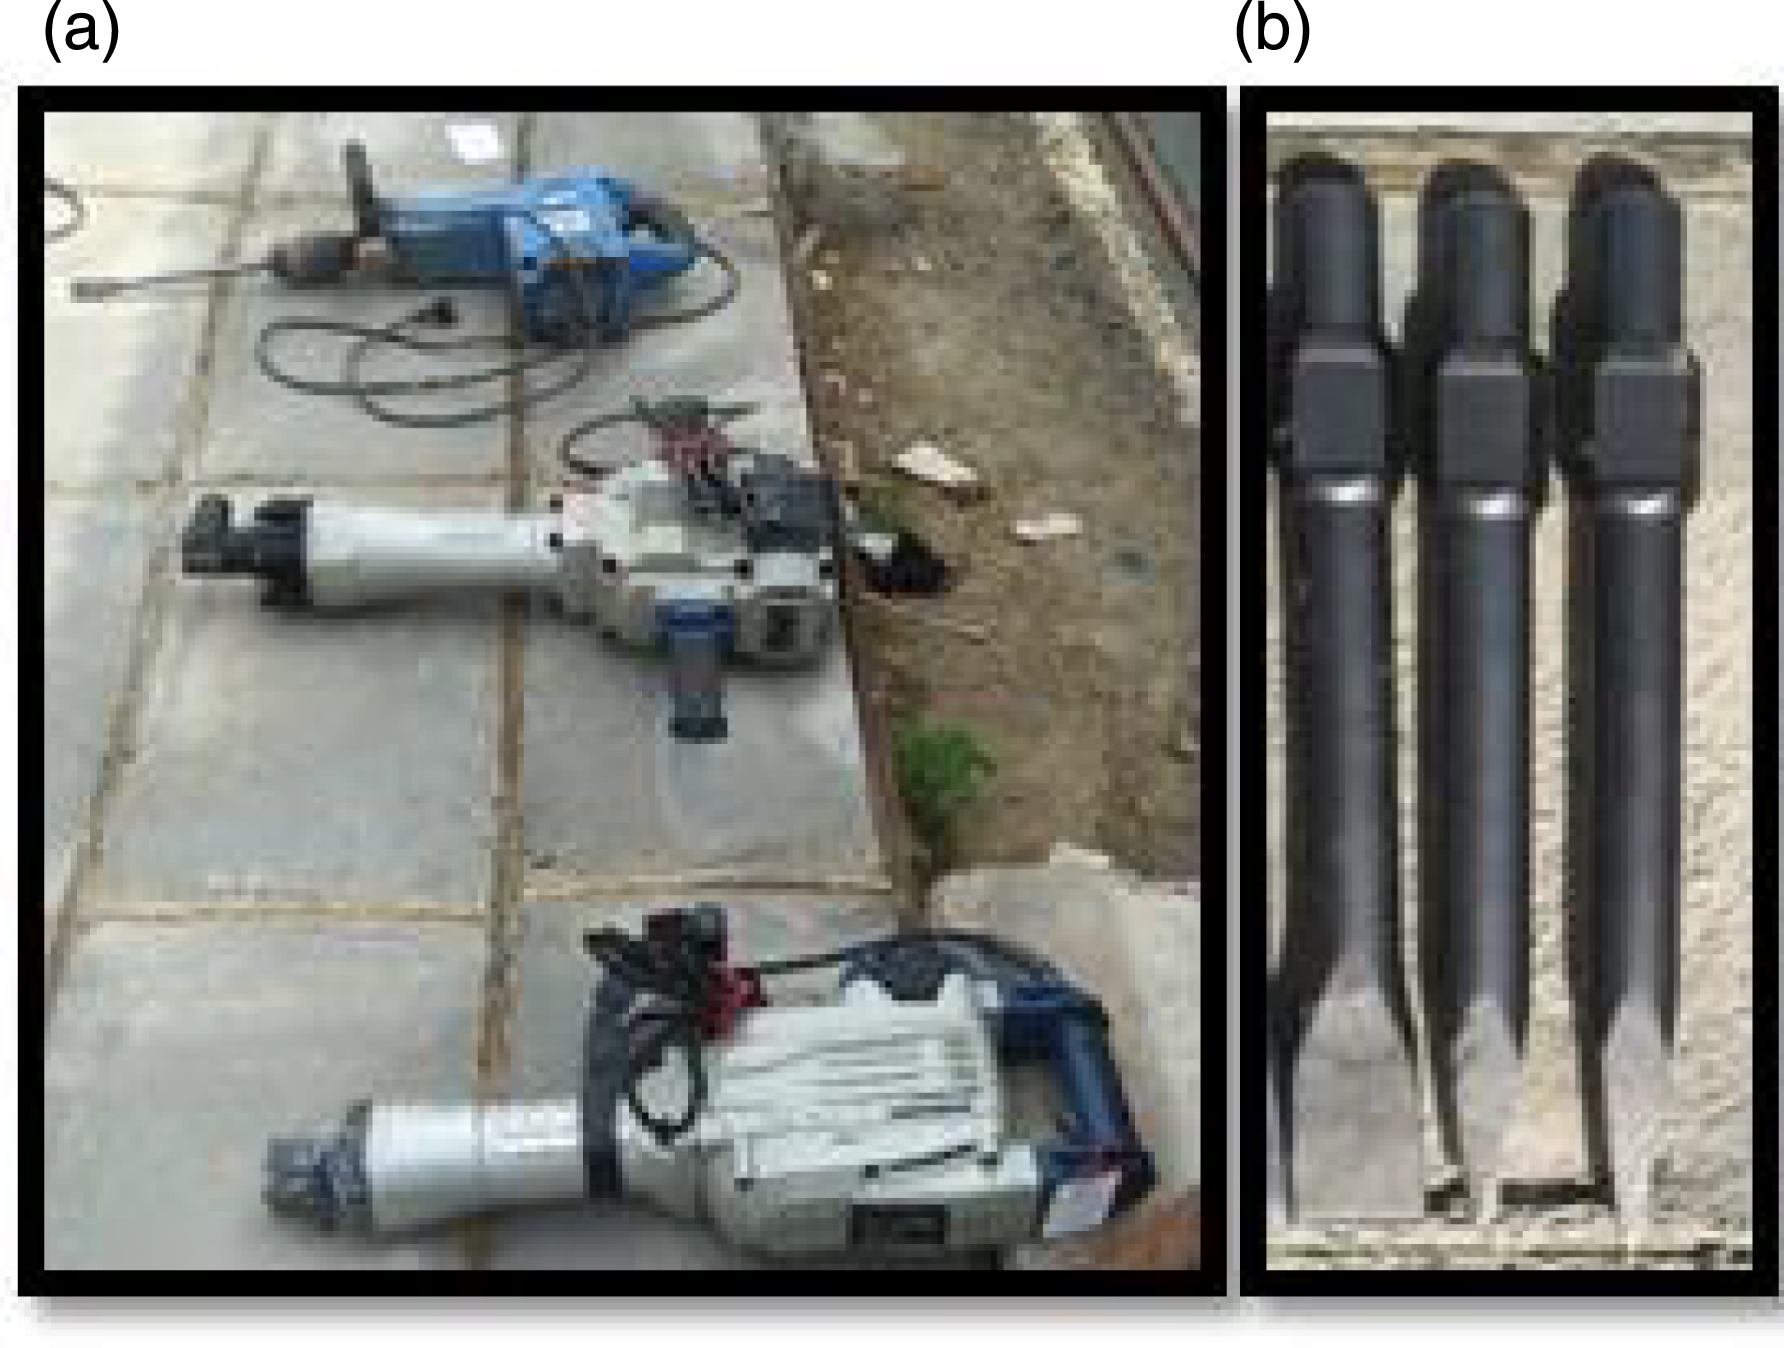
Specifications of used demolition hammer.
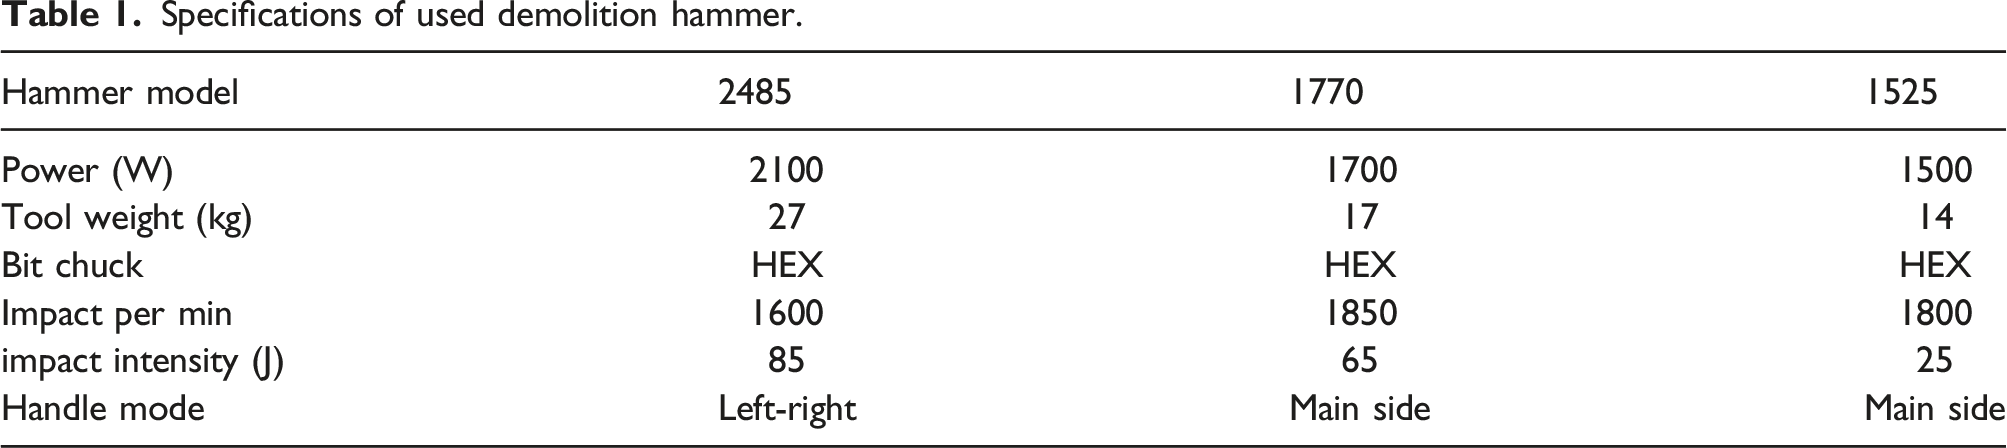
To reduce the capacity to transmit vibration to the hammer handle as intended by the manufacturer, all grips were elastically attached. The tool handle’s insulating layer’s elastic and vibrational characteristics are not specified by the manufacturer. But, the thickness of elastic layer used in the 2485 hammer handle is about 70% of the thickness of the other two hammers, and in the lighter hammers, the thickness of the elastic layer engineering caliper used was 2.7 mm.
The inserted parts were used by the toolmaker to demolish the concrete parts. The bits used in this research were chosen in terms of their common use, and these four new bits (2 bits with a length of 60 cm and 2 bits with a length of 40 cm) were used for all three tools. A flat tip bit and a point bit shape were used for each normal bit length. Therefore, 4 different bits were used. The diameter of inserted bits was the same and equal to 26 mm, and all of them were suitable for the tool box and of the HEX or 6 edge type (Figure 2(b)). This type of chuck is widely used by such manufacturers for manual demolition tools slightly larger than about 20 mm in diameter.
Test subjects
The present study was conducted with three experienced healthy male users. All subjects voluntarily agreed to participate in the study and were trained by the research team on the objectives of the study and the quality of demolition of concrete blocks. Before starting the work, it was explained to the users that during the demolition of each concrete piece, there should be no interruption as much as possible and to rest as much as necessary between the demolitions of the pieces. However, the rest period between two consecutive pieces was at least 5 min for each user. They were not given any additional instructions to carry out the demolition, the operation method and how to start and end the demolition. All three participating users had at least 5 years of experience with demolition hammers, including the tools used in this study. These users were pipeline repair and reconstruction workers in Tehran water and wastewater company. All the samples were taken for three consecutive weeks and during regular working hours of the day in two shifts, morning and evening, in August 2021.
In this research, the effect of the physical characteristics of the user and the force of the grip on the level of vibration transmission of tool handles during demolition with electric tools has not been investigated and reported. The objectives of this study are mainly to investigate the effect of the characteristics of the hammer, including the characteristics of its bit or chisel, and the work material to be destroyed on the vibrations transmitted from the handle. Figure 3 shows the users’ anthropometric information and a schematic view of hand dimensions according to DIN 33402-2: 2005-12, 2005.
37
Anthropometric data of participating users and schematic view of hand dimensions.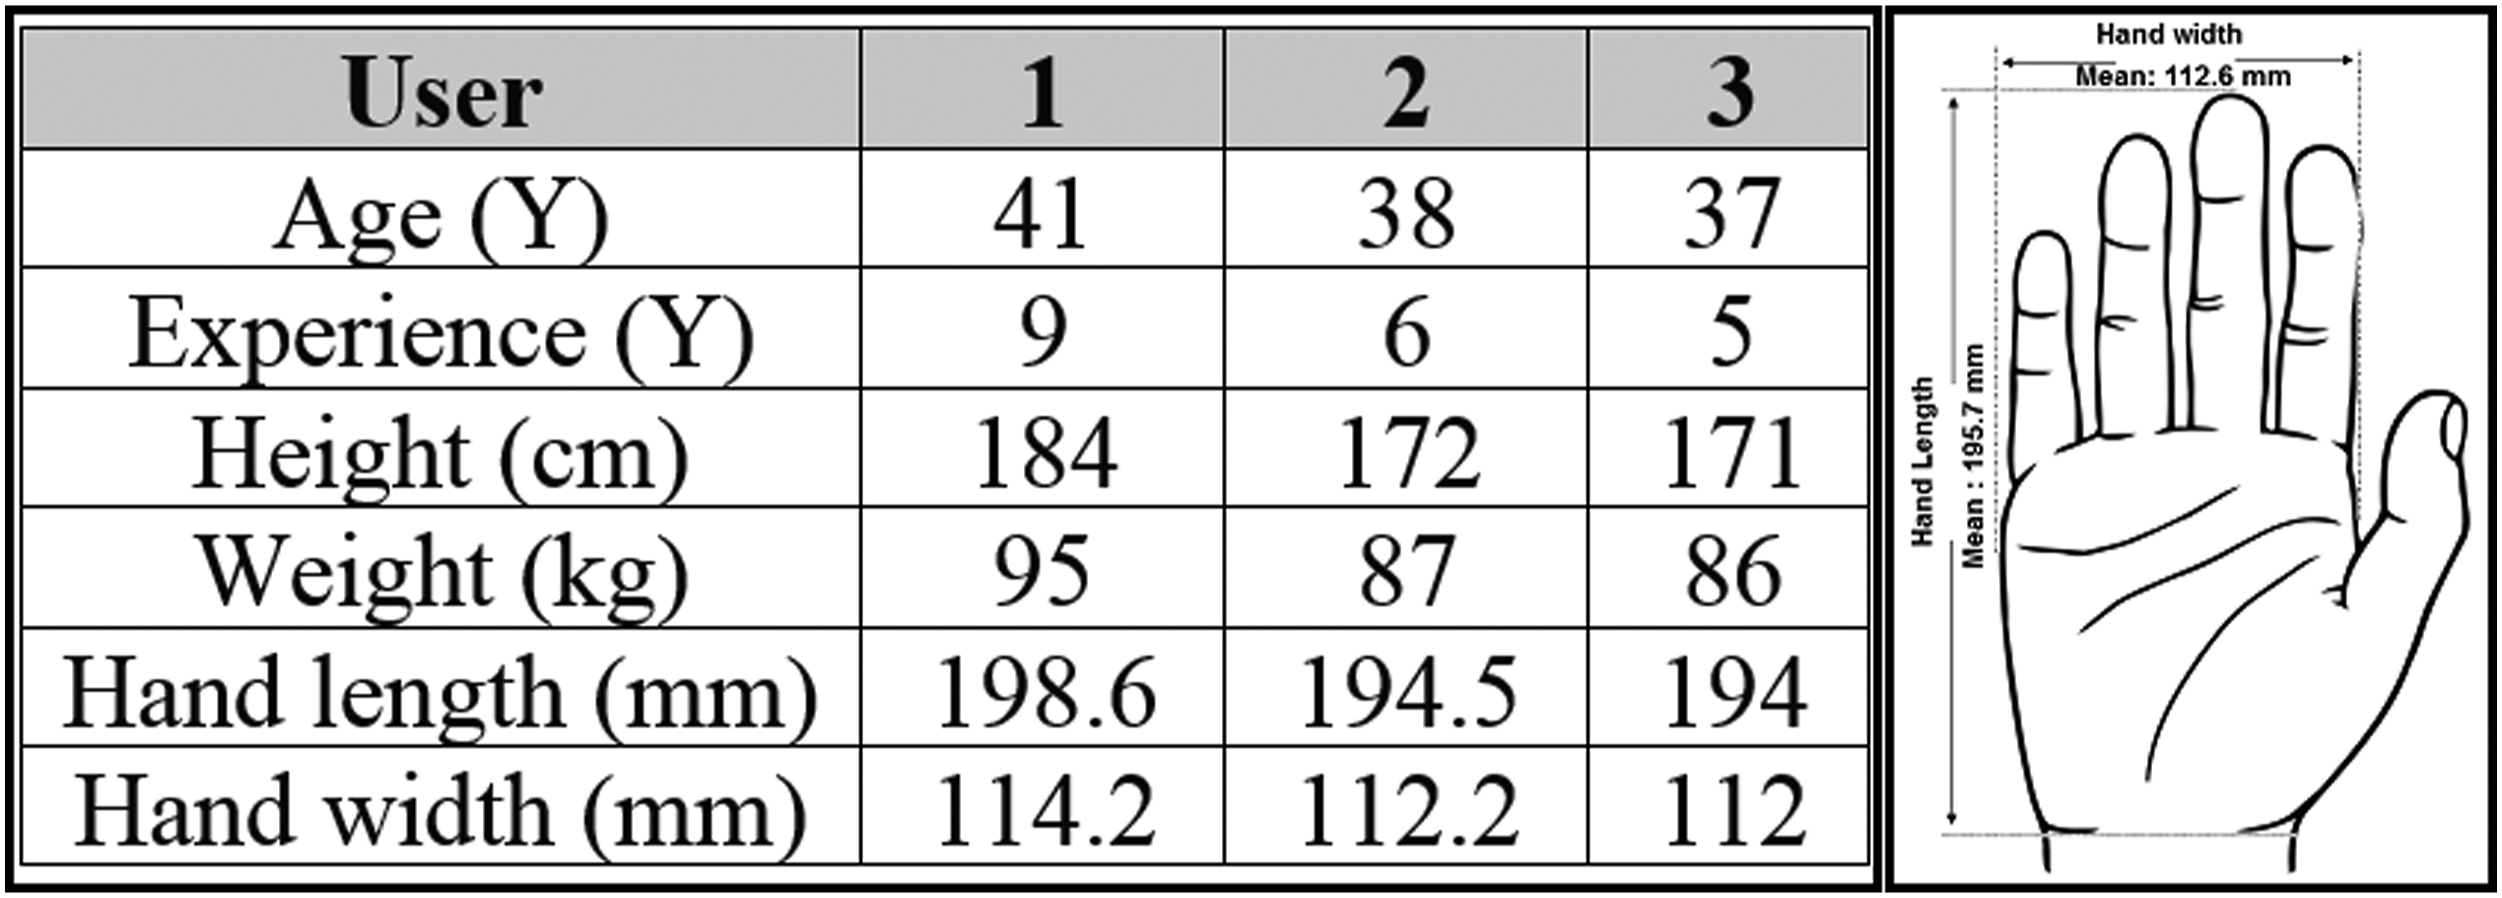
Vibration measurement and analysis method
In all samples, vibration in both tool sets was measured simultaneously using two vibration meters and analyzer (SVAN 958-A) calibrated by the manufacturer. The accelerometers were placed in the hand of the operator according to the methods defined in ISO 5349 1, 2:2001 using the SV 50 adapter and the accelerometer assembly with a sensitivity of 10 mv/g, which met the requirements of the ISO standard (Figure 4).38,39 In this situation, the accelerometer was placed by the user at the closest point to the tool handles. Axial system defined on accelerometer in main handle (a) and auxiliary handle (b) based on ISO 5349.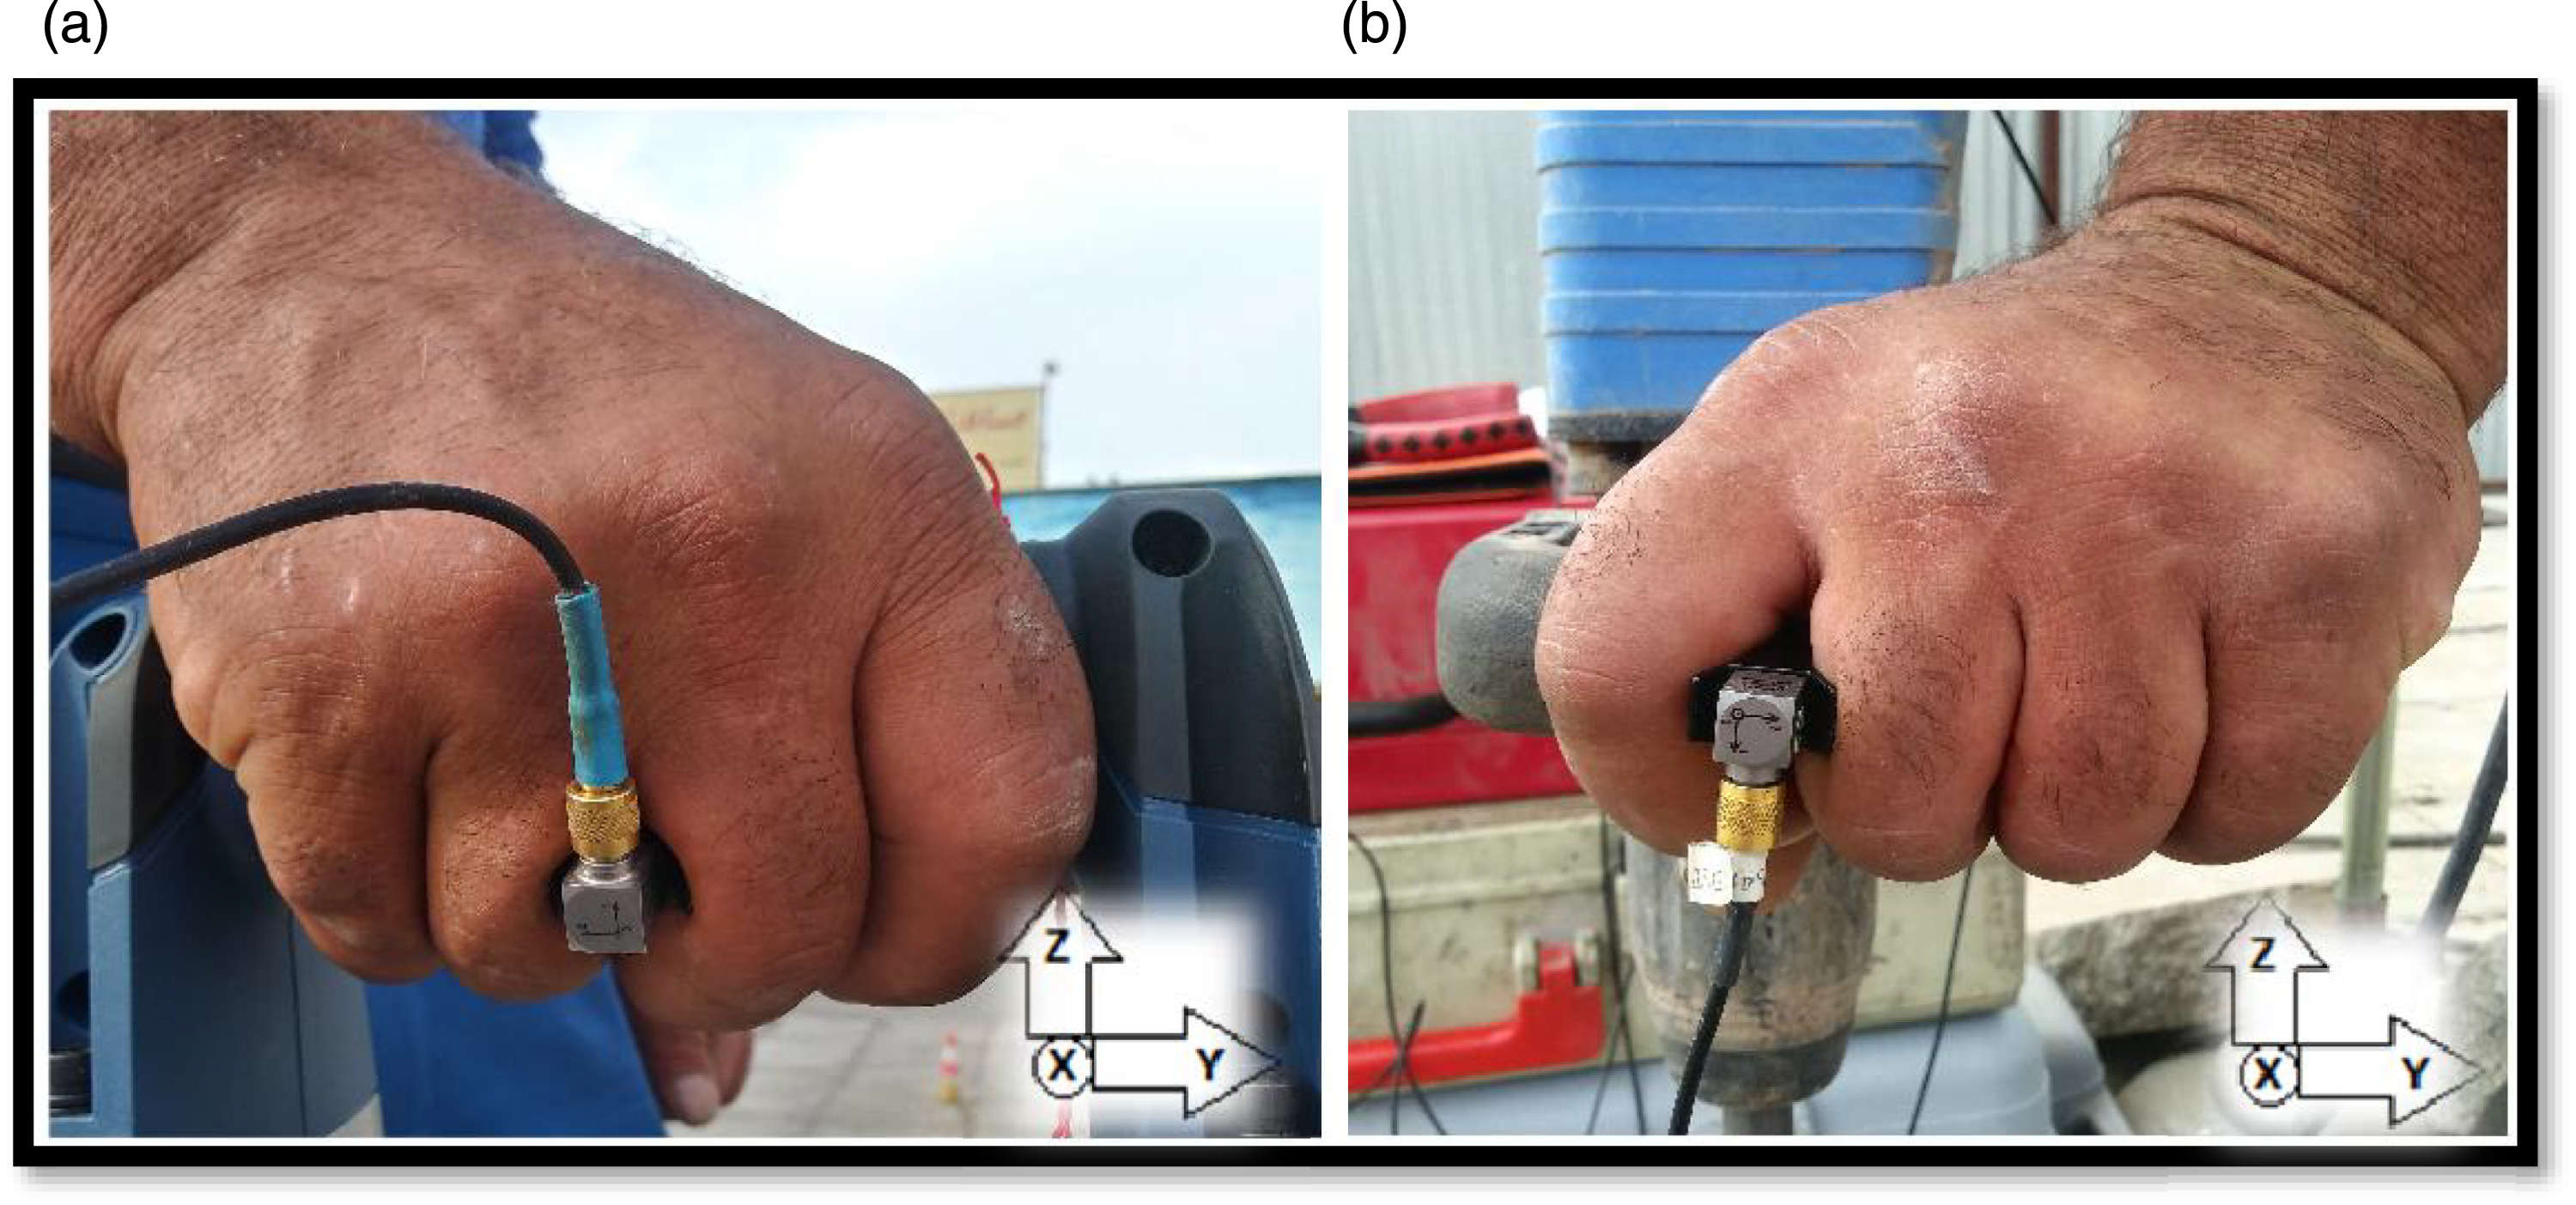
Based on ISO 5349-2, 39 the preferred method of adapter attachment is to attach an accelerometer to the instrument cluster; however, using a hand-mounted adapter is a popular approach. 40 To choose the right adapter, the results of two direct and manual connection adapters provided by the manufacturer were compared. Abnormal output signals were observed in the method of direct installation of adapter on the tool handle because of factors such as the vibration characteristic of the demolition tool, high acceleration sent to the tool handle, loosening and opening of the accelerometer from the adapter, etc. After this preliminary study, using the hand-connected adapter method was chosen to perform the measurements.
On the other hand, in the method of directly installing the accelerometer using a plastic clip on the tool handle, so that the accelerometer did not contact the edges of tool handle and its vibrational nature is not affected, the researcher must place the accelerometer within a distance about 1 cm from the edge of the handle. This configuration reduced the useful width of the tool handle and interferes with the normal operation of the hammer. Therefore, using hand-held adapters seems to reduce the interference with instrument guidance and provide results closer to true values.
Throughout the measurements, another person guided the measuring cables and equipment to eliminate disturbances in the routine process performed by users.
To increase the reliability of the results, for each concrete slab, vibration values were measured in 2–3 continuous steps. After every 90 s, the next measurement process was started automatically with a delay of less than 0.2 s, according to the initial tests. After the demolition of the concrete slabs, the vibration measurement process was stopped manually. During the demolition of the slabs, for several samples, an unscheduled stoppage in the work was necessary and the vibration measurement process was stopped manually until the problem was resolved. The final results for each slab are the root mean square acceleration of each axis for the time intervals of degradation measurement in each slab. Due to the presence of tools with different demolition power, the number of results was different for each slab, and the weighted frequency acceleration results of each slab after completion were calculated according to ISO 5349-1 for the entire duration of the measurements with the following equation: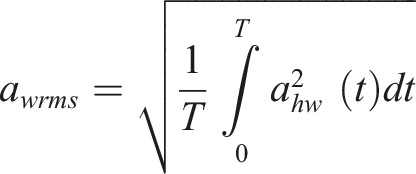
To evaluate the vibration of the handle due to comparability for lateral (Y) and horizontal (X) versus vertical values according to ISO 5349-1:2005
38
for all tests, we calculated vector sum values (VSV) of three axes to evaluate the final exposure by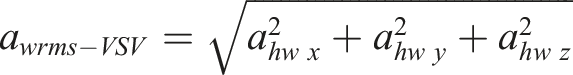
The weighted frequency spectrum of each sample for each hammer and each condition (include each of the study factors), in order to investigate the percussion frequencies and their related harmonic frequencies was considered, and their dominant frequency was extracted from the measurement signals.
ISO 10819 41 has introduced two frequency ranges for evaluating the effectiveness of vibration damping gloves, which includes a range of 25–200 Hz, which is called the low frequency range (L), and 200–1250 Hz, which is called the medium frequency range. In this research, the same approach was used to evaluate the frequency changes in the measured samples and the changes in each hammer handle and different variables in these two frequency ranges were checked. According to the wh frequency weight filter in ISO 5349-1, the importance of frequency values above 1250 Hz is much less than the low frequency range; hence, the acceleration values below 1250 Hz are investigated to present the results of this study was analyzed. 38
The effect of each factor including bit length, bit tip shape, and concrete thickness on handle vibrations was investigated through t test (two groups) or one-way ANOVA (>2 groups). Statistical analysis was performed with Graph Pad Prism software (version 9.0.0).
Results
Handle vibration of tools
For adding and gaining the empirical knowledge about the vibration transmissibility on the electric demolition hammer handle in the real work area, 144 field measurements (72 measurements for each handle) were performed by three experienced users on concrete slabs. An overview of three vibration instrument results from these field measurements is presented first.
The results showed that the vertical axis of transmitted vibration (Z axis) in all samples for both groups of tool handles had higher values than other two axes and was the dominant axis in all results. The highest value of measured a
wrms
in the axes is 22.59 m/s2 and for the Z axis and the lowest axial value is 1.33 m/s2 for the Y axis (the Y axis is parallel to the handle axis for left-right handles). After the vertical axis, the X-axis had the greatest mean value among the axes, while the Y-axis often had the lowest values. With instance, Figure 5 displays an example of the raw dominant axis time history signal of a 1770 hammer for a 60 cm flat bit on 15 cm thick slabs. Sample time history signal for the dominant axis of the 1770 hammer for a 60 cm flat bit on a 15 cm thick concrete slab.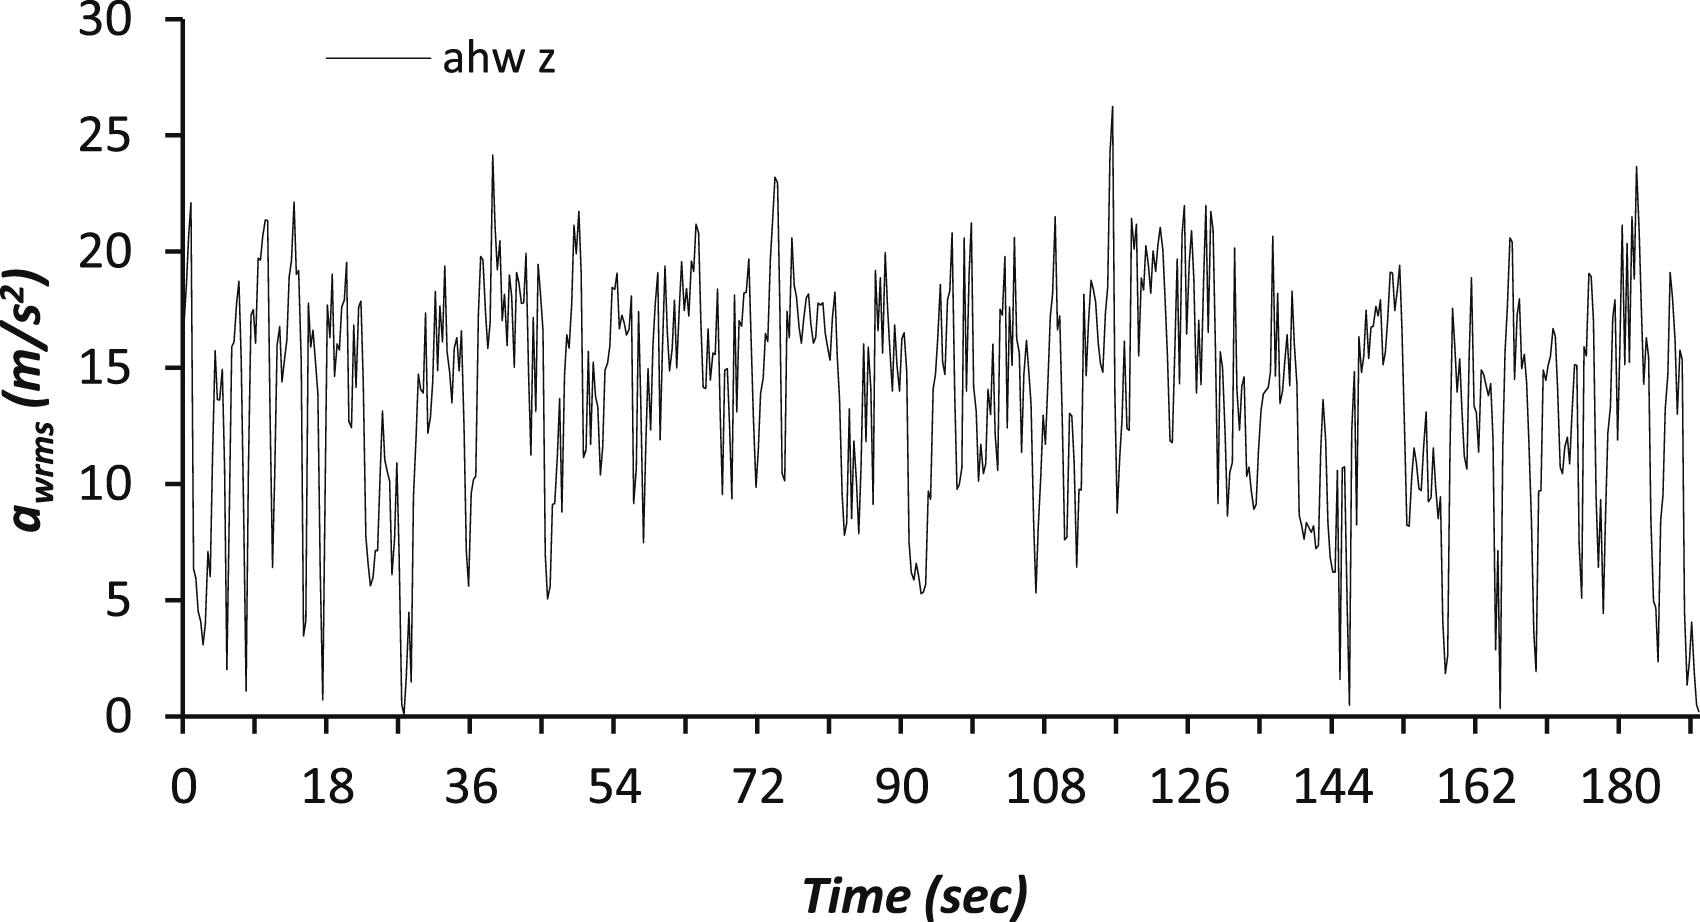
Average frequency-weighted rms acceleration (a wrms ) values for users and tools on the hammer handle (m/s2).
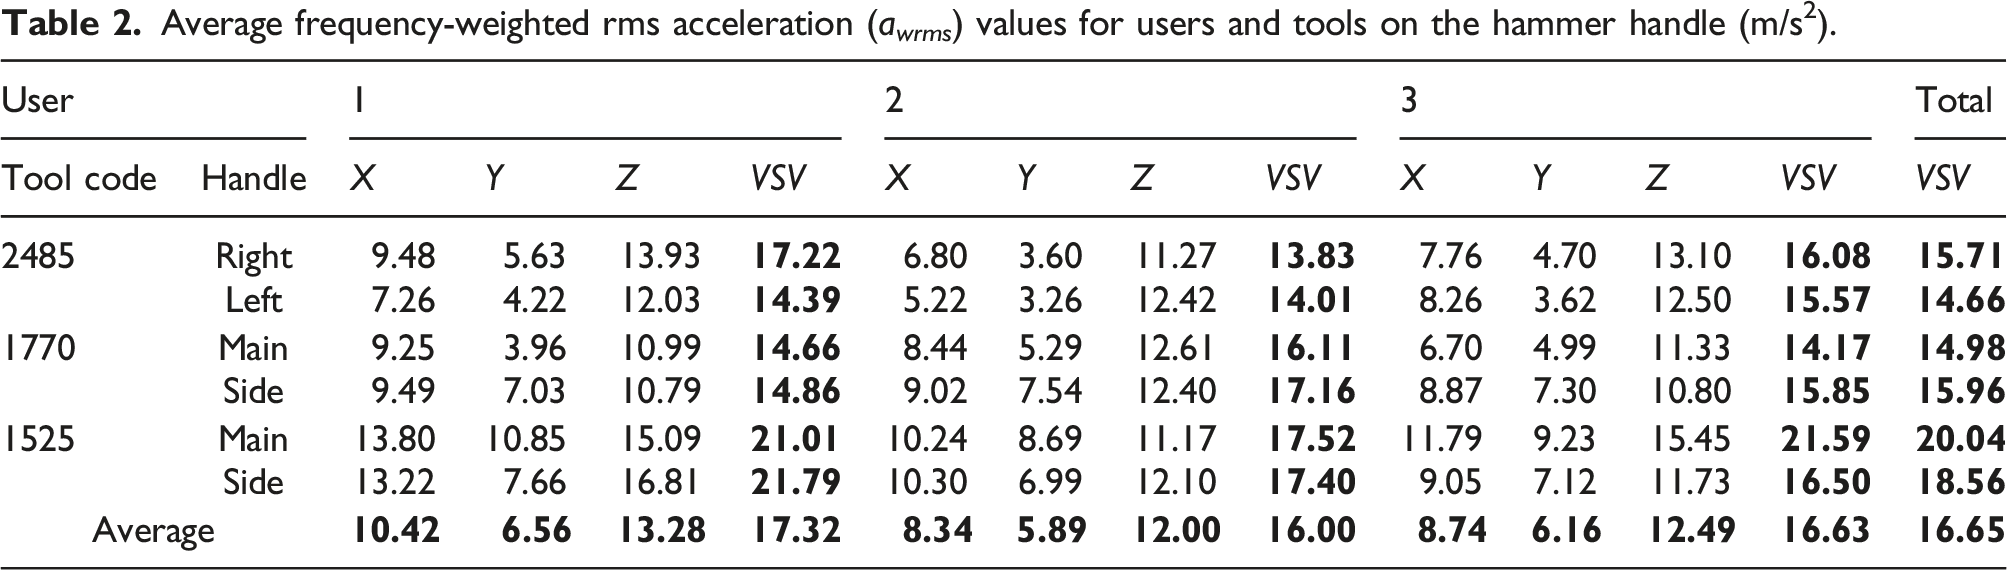
The mean values of the samples measured by the participating users due to the difference in experience and anthropometric dimensions of the body between the three users had a statistically significant difference (p = .0062). In addition, the comparison of the results obtained for the 1525 hammer by all users showed that the average results from users 1 and 3 were close together, and there was no statistically significant difference (p = .13), but the average values of user 2 with other users for this hammer were significantly different. (p = .0002).
As presented in Table 2, the results showed that the main handle of the 1525 hammer (20.04 m/s2) is the highest average and the lowest average of the tool handle is the left handle of the 2485 hammer and is equal to 14.66 m/s2.
Between two groups of different handles, both for the average results of hammers 1525 and 1770 with main and side handles on the body of tool (p = .64) and for hammer 2485 with left and right aligned handles (p = .15) was not significantly different. As shown in Figure 6, comparing the results hammers separately for each user, except for a borderline significant difference in the mean of the left and right handle results of 2485 hammers by user 1 (p = .05), and a significant difference for the mean results of two main and side handles of the 1525 hammer by user 3 (p = .0034) in other conditions, the difference among the handles of each tool by each user (7 cases out of 9 cases) was not statistically significant. The a
wrms
values of the tools with main-side handles by users.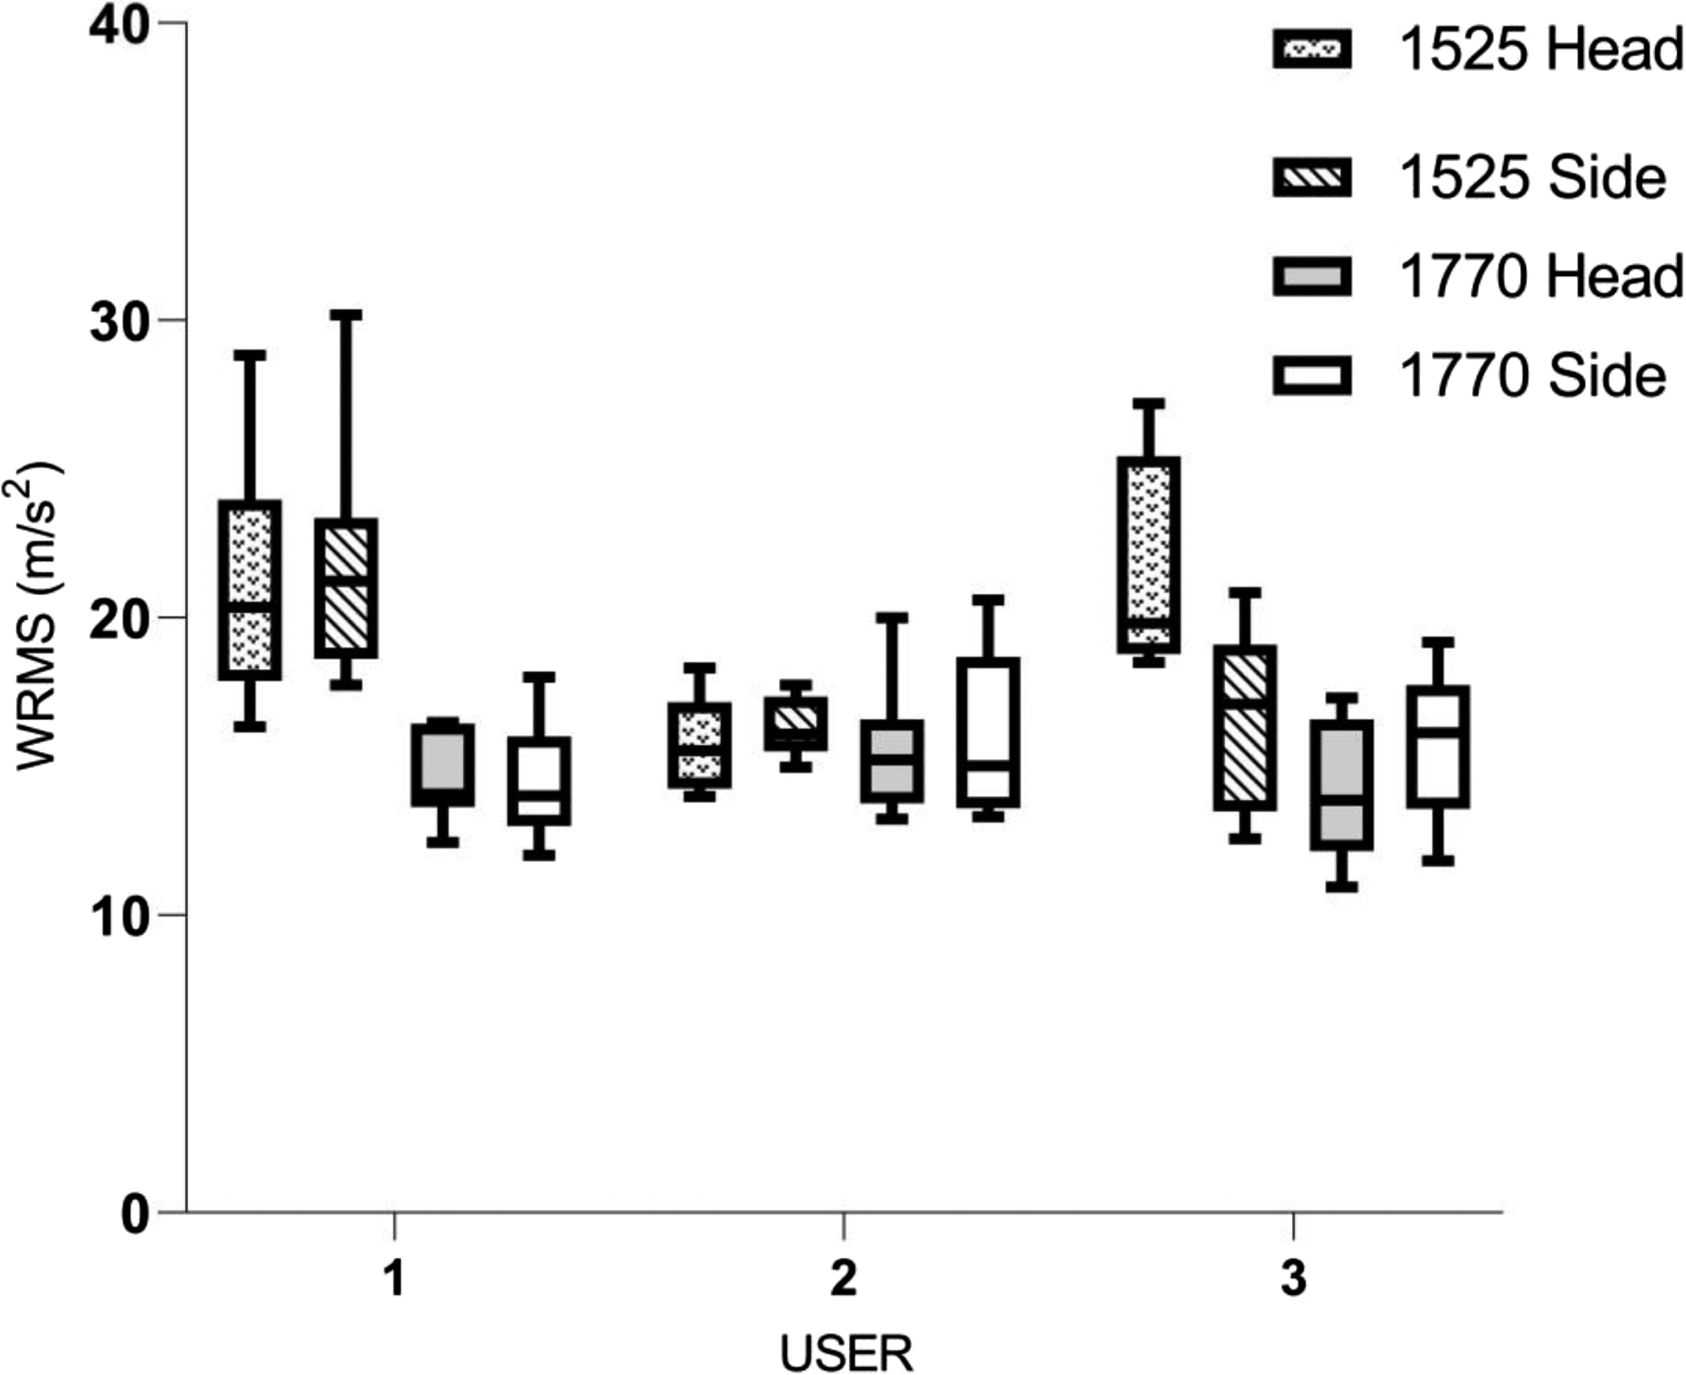
The results of vibration of the handle for different thicknesses of concrete
The average results of each tool and each user for two concrete slab thicknesses are presented in Figure 7(a) and (b). As expected, the results showed that in all three tools, the increasing trend of the a
wrms
values on the handles has an increasing tendency towards higher thickness. The highest average in hammer 1525 was equal to 20.81 m/s2 in the demolition of concrete with a thickness of 15 cm and the lowest average related to the demolitiont of concrete with a thickness of 10 cm for hammer 2485 and was equal to 14.10 m/s2. The total average of the results for the two concrete thickness groups was significantly different (p < .0001). In hammers 1525 and 2485, the average results of 15 cm thick blocks were three and 2.2 m/s2, respectively, and higher than the average of 10 cm samples (p = .008 for 1525 and p = .015 for 2485). Frequency-weighted rms acceleration (a
wrms
) results for 10 and 15 cm thick concrete slabs by each tool (a) and user (b).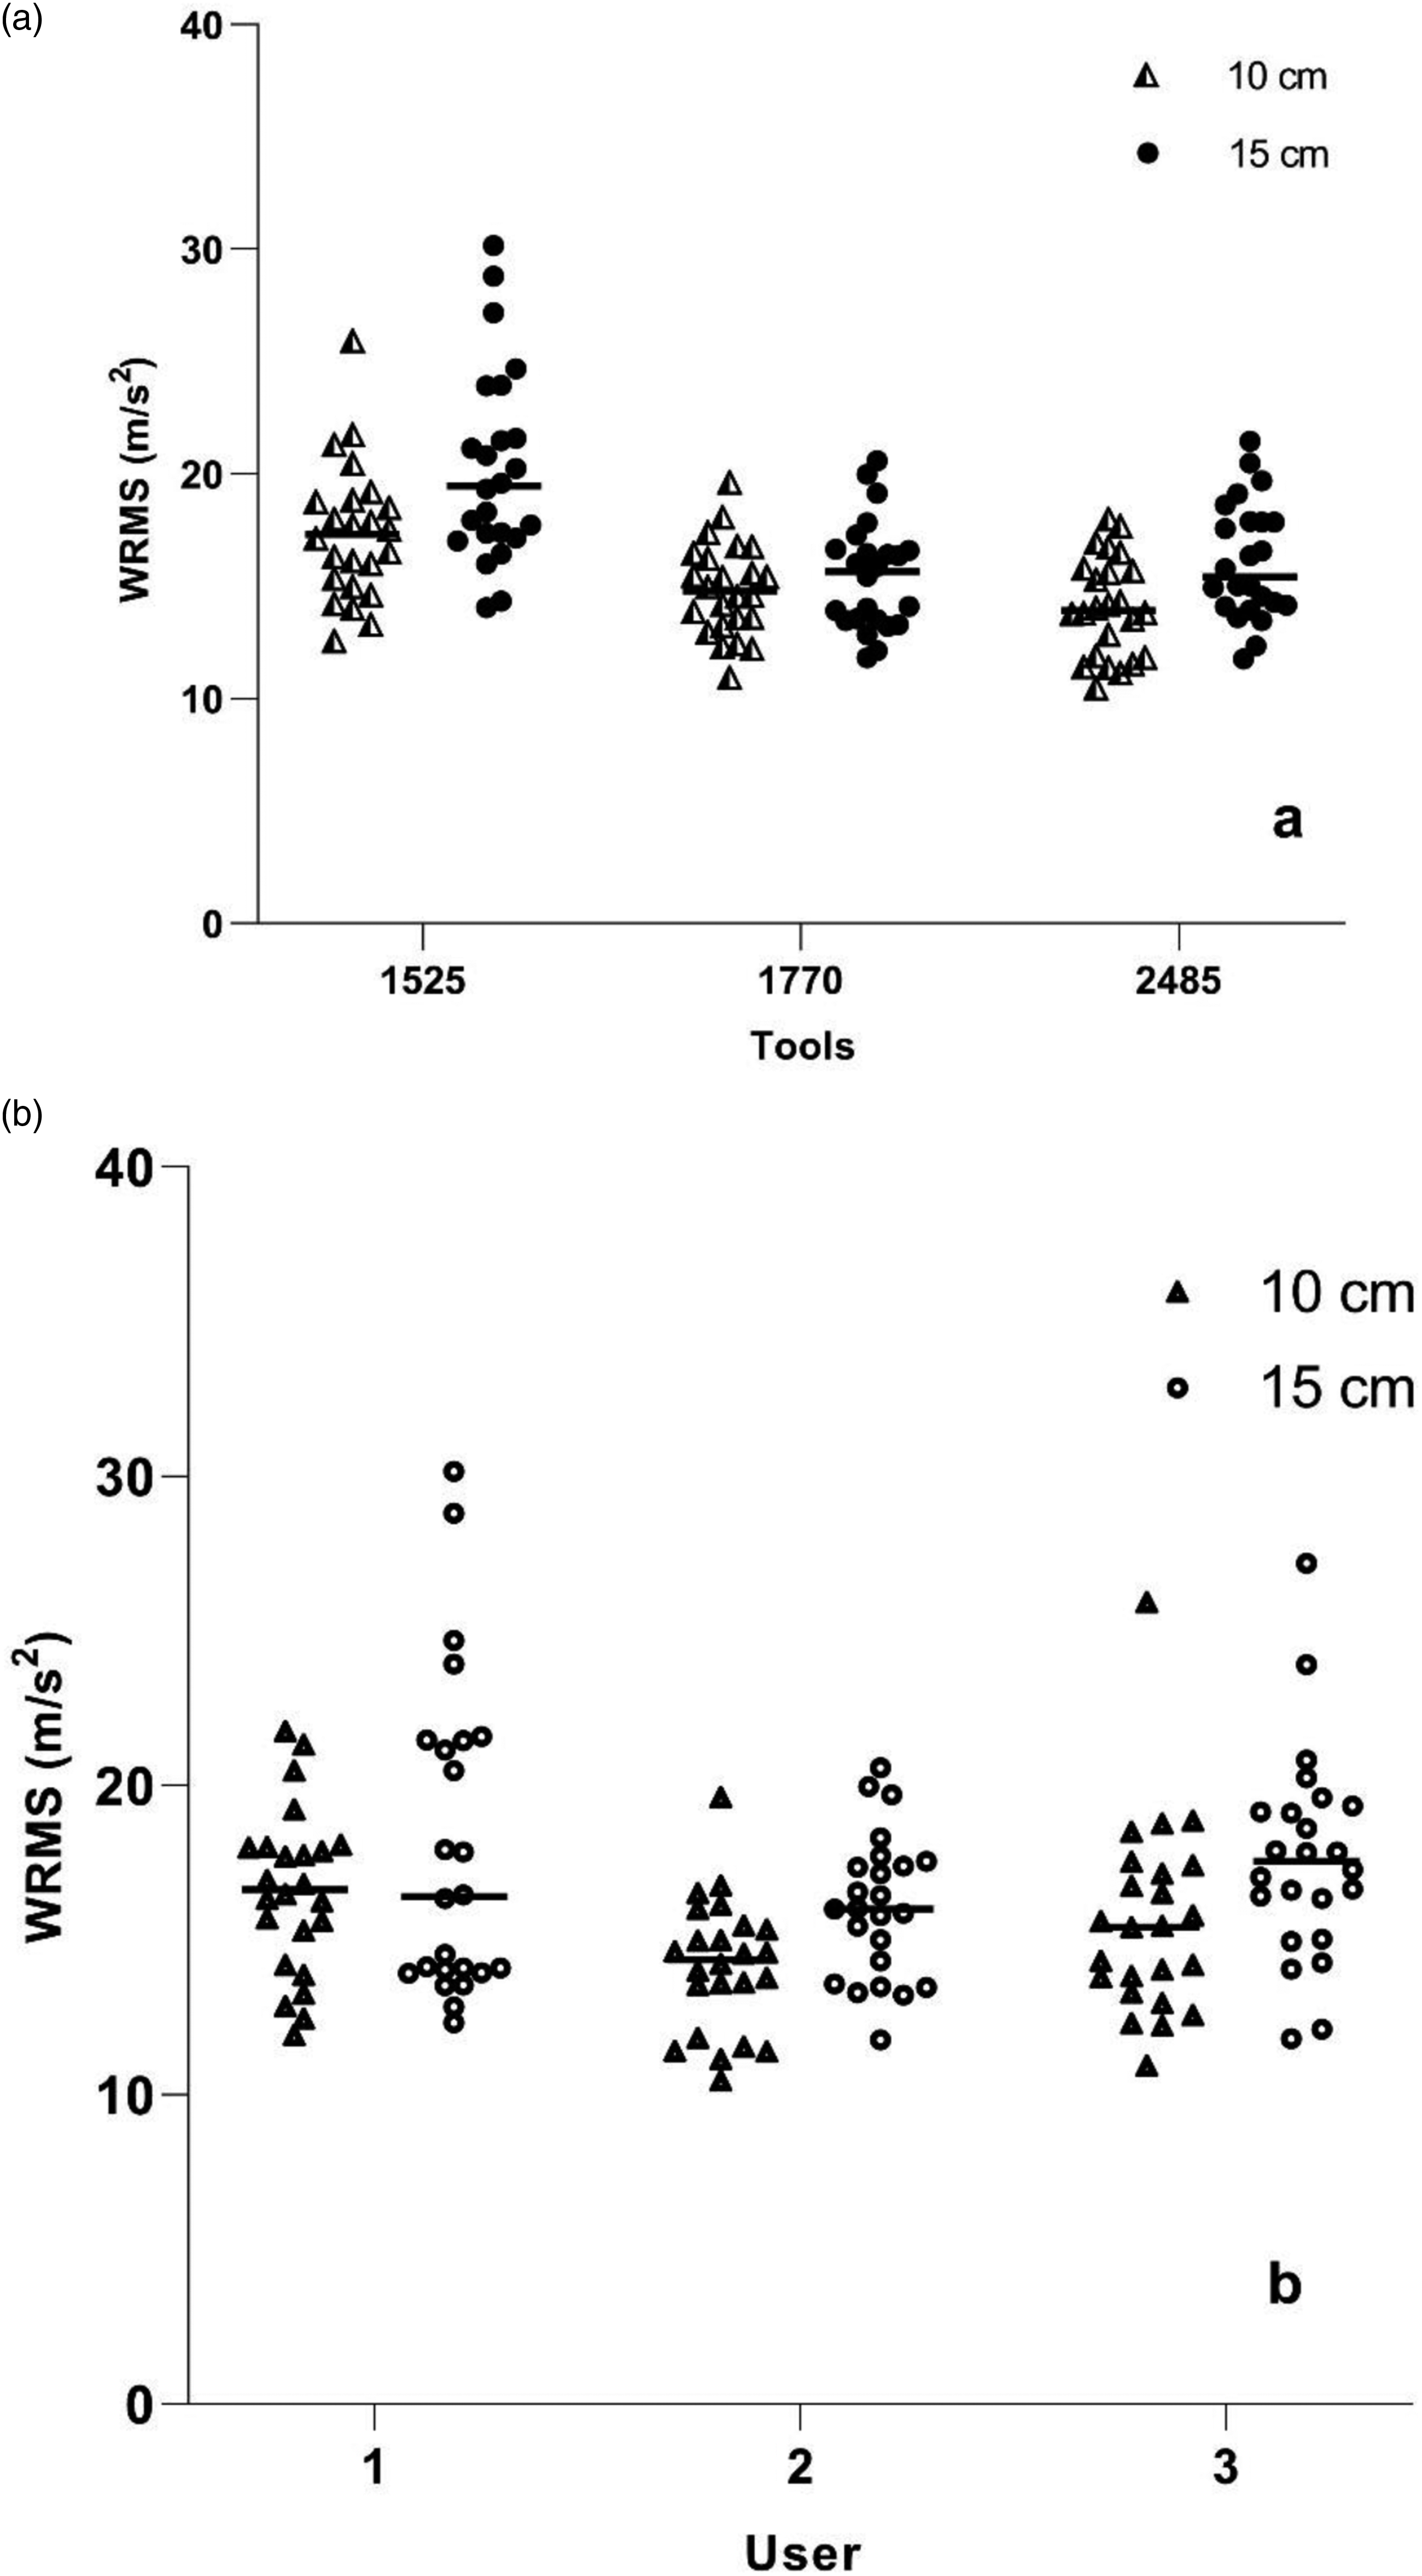
For the 1770 hammer, the difference between the two means thickness was 0.65 m/s2, but the mean values of the 15 and 10 cm groups were not significantly different (p = .98). Also, the analysis of values for the average results of each user showed that the difference between the average results in different groups is significant (p = .0007).
Monitor vibration results for bit tip shapes
The average values of two inserted flat and point bits were 16.85 and 15.86 m/s2, respectively. Figure 8(a) and (b) showed the median value and the dispersion of total values for all tools and users when using flat and point bits. In general, the mean values of flat bits were higher than those of point-shaped bits. The total mean of WRMS-VSV had a significant difference when all results were regarded (p = .023). However, when the mean values of the two-bit tip shapes in the results of each tool were examined separately, the difference among the groups became more apparent. The values for the lighter demolition hammer (1525) are 19.66 m/s2 for flat bits and 17.98 m/s2 for point bits. In hammer 2485, the average values were 15.69 and 14.51 m/s2, respectively (p = .046). In all comparable situations, a flat bit transmitted vibration more effectively than a point bit. When the 2485 hammer data were investigated for the same concrete thickness and comparable bit length, the VSV acceleration (a
wrms
) for samples with flat bit under the same circumstances was 18.13 m/s2 and 15.38 m/s2 in pointed bits. The average values of 1525 hammers for 15 cm concrete thickness in flat and point bits were 23.59 and 20.36 m/s2, respectively (p = .12). Frequency-weighted rms acceleration (a
wrms
) results for flat and point shape tip bit in tools (a) and users (b).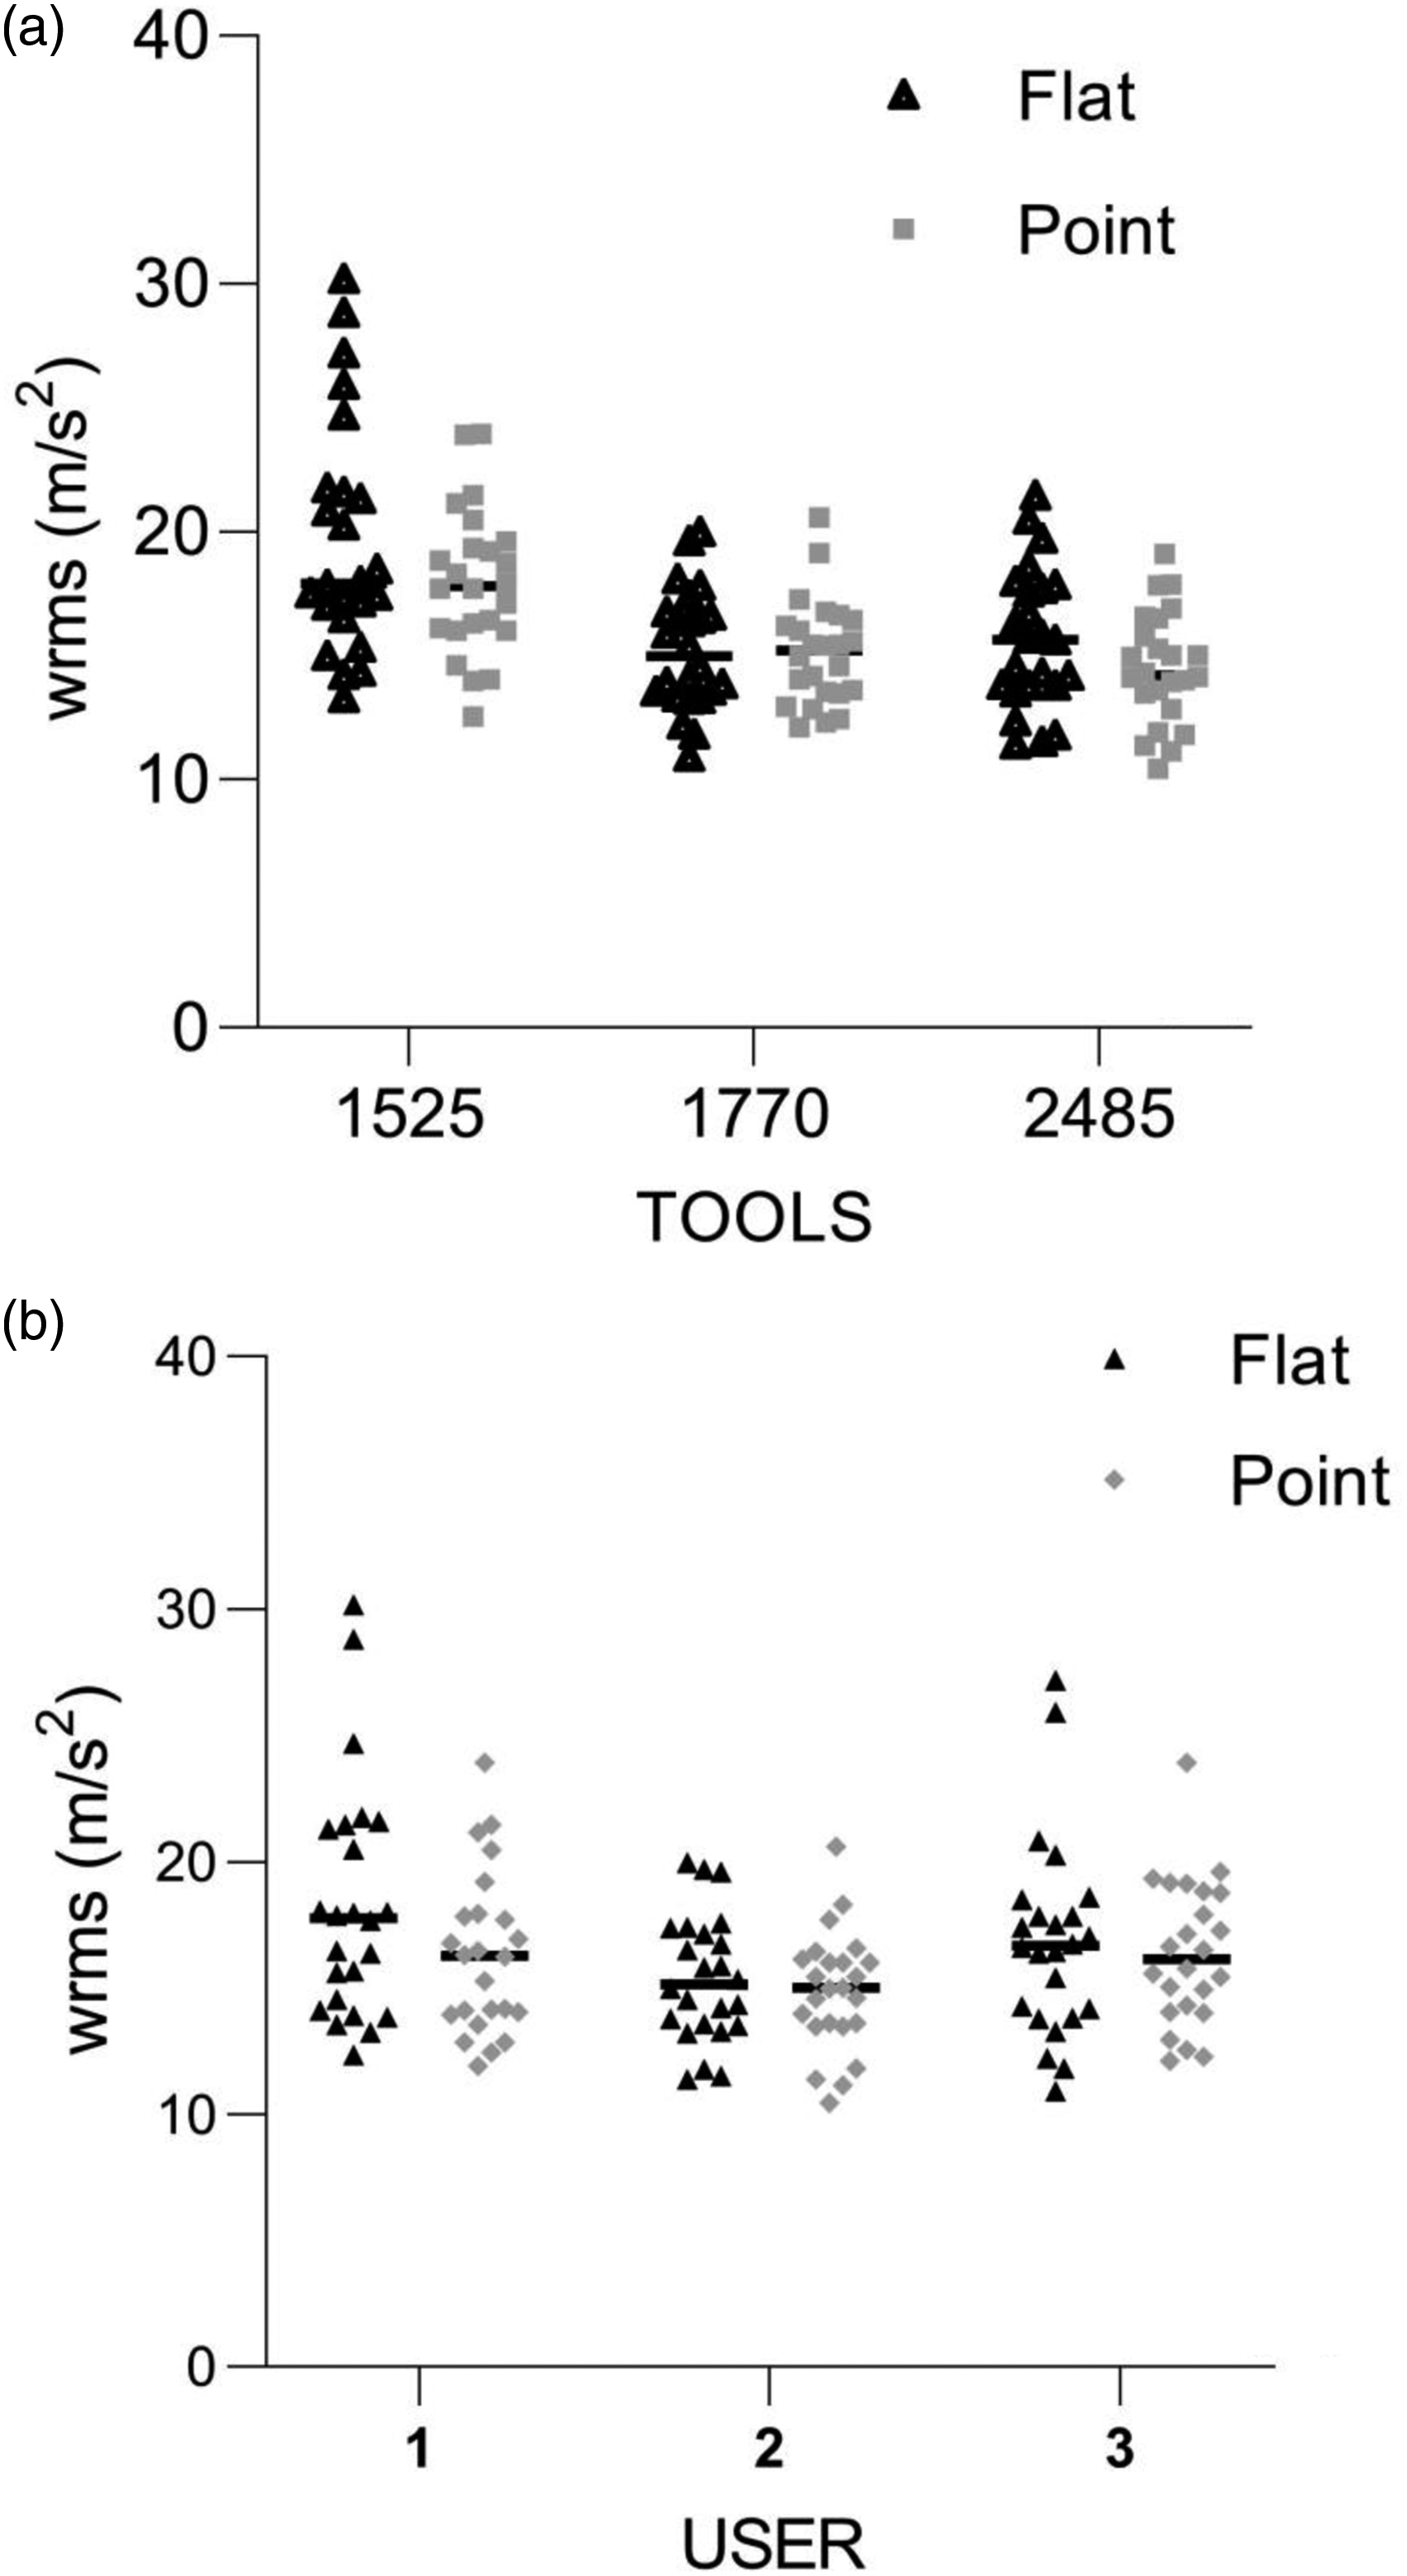
In other cases, such as the average results for 10 cm thick concrete by hammer 2485, the difference between flat and point bits (14.63 for flat and 13.53 m/s2 for point inserts) was 1.1 m/s2 (p. = .14). When the average results were compared for samples made with concrete with a thickness of 15 cm and a bit length of 60 cm, the difference determined was about 2 m/s2 (19.50 m/s2 for flat and 17.50 m/s2 for point bits). This amount of difference led to a significant difference between the average of the two groups of bit lengths used. (p = .03).
Handle vibration results for bit length
Both in the average of total results and in the average of the results for each tool, more values were produced for the samples made with the bit length of 60 cm compared to the bits with a length of 40 cm. The difference among these results was equal to 2 m/s2, which led to a significant difference in VSV values for these two lengths (p = .0007). Mean values for the instruments were 17.67 m/s2 for 60 cm bits and 15.63 m/s2 for 40 cm bits.
The lowest difference in the average of the three used tools was equal to 0.73 m/s2 for the 2485 hammer and the highest difference for the 1525 hammer is equal to 3.11 m/s2 (17.75 m/s2 for the 40 cm and 20.85 m/s2 for 60 cm bits). The average difference between these two groups in the results of the 1770 hammer was equal to 2.29 m/s2 (14.32 m/s2 for the 40 cm bit and 16.61 m/s2 for the 60 cm bit). The difference between the mean of the groups had a significant difference (p < .0001). Figure 9(a) and (b) shows the status of the average values in the examined tools and users in terms of used bit length. Results of frequency-weighted rms acceleration (a
wrms
) for 40 and 60 cm bit lengths in instrument (a) and users (b).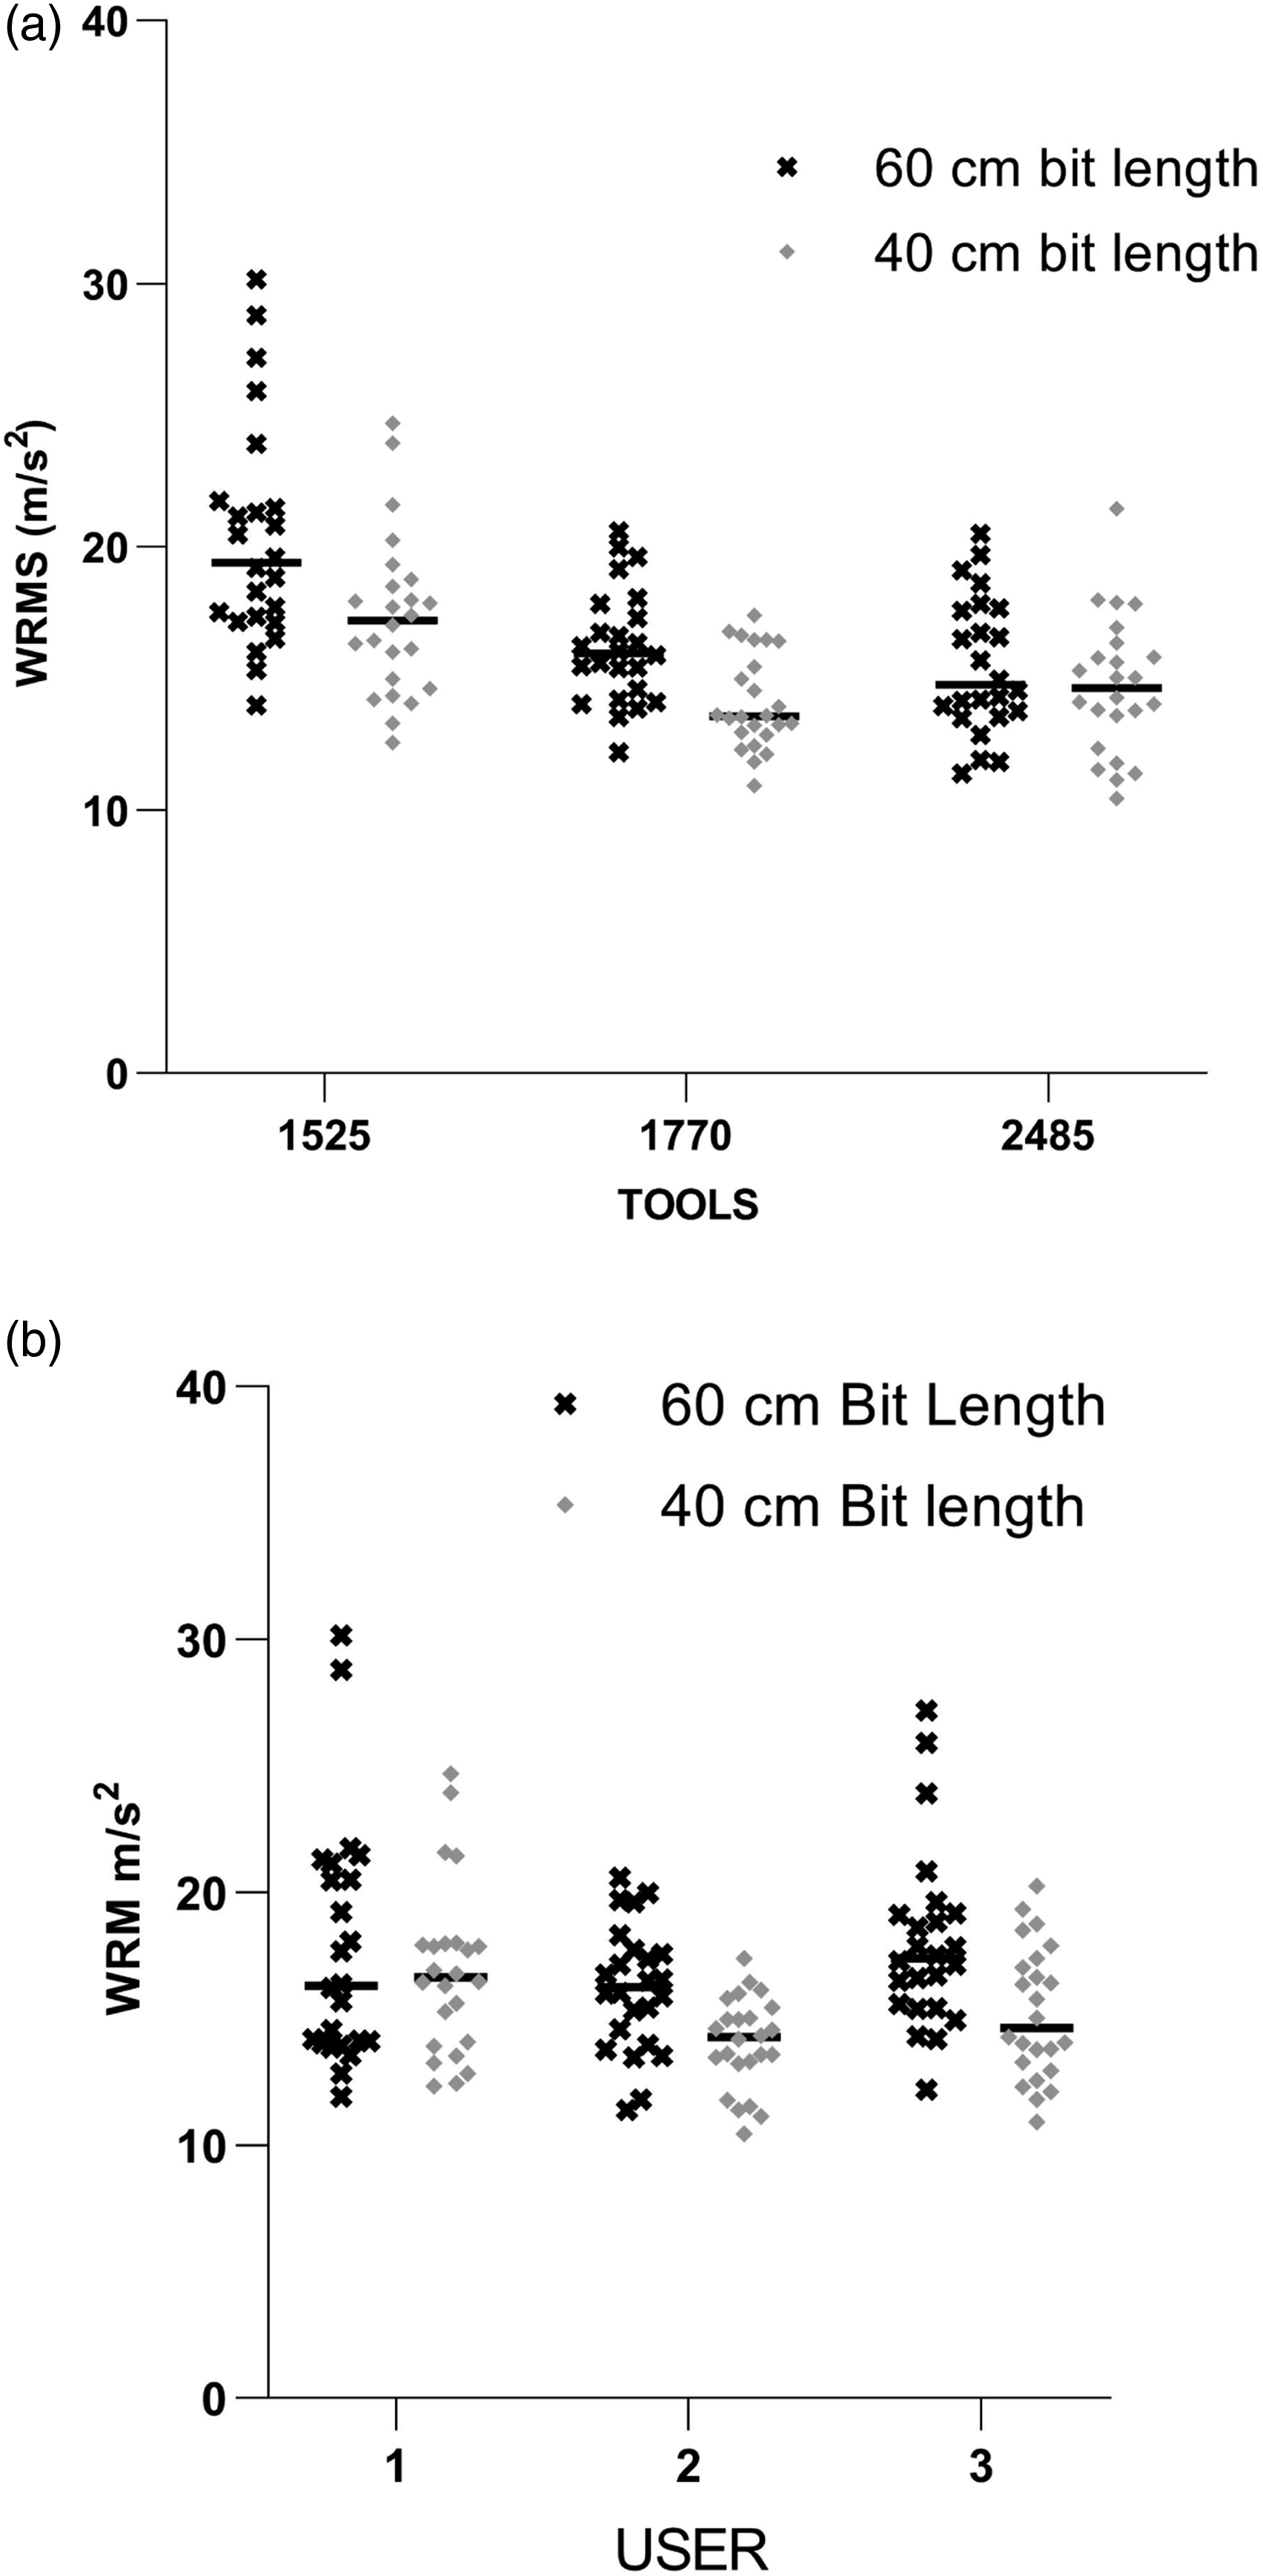
The largest mean difference for these commonly used bit lengths was observed for the 1525 and 1770 hammers by users 3 and 2, which were similar at 4.65 and 3.92 m/s2, respectively. The difference between the means in these two groups of bit length between users was statistically significant (p = .0002).
Higher values from the average results when using a longer bit compared to a shorter bit, have the same conditions when results of similar samples were compared (samples with same concrete thickness, bit tip shape, and the same tool).
For example, used in flat bits in the demolition of concrete with a thickness of 15 cm using tools 1770, the average difference between the two groups was about 2.35 m/s2 (p = .0125). There was a similar difference for point bits (about 1.83 m/s2) in this hammer. The difference between bit length for the VSV values of both concrete thicknesses in the results of the flat bits for 1525 hammer was about 4 m/s2 (p = .036). This difference was even greater, when they were compared only 15 cm thick concrete slabs. In sharp bits in both concrete thicknesses, the average values of 60 cm bits were about 2.4 m/s2 higher than the average of 40 cm bits.
The total average of 15 cm concrete slabs demolished by all users from the flat bit with length of 60 cm was 19.50 m/s2. The latter value was about 3.4 m/s2 higher than the corresponding value for the same situation for the 40 cm bit group (p = .02). The difference between the two groups of bit length for 10 cm concrete samples was about 2.15 m/s2 (p = .037).
Frequency analysis results
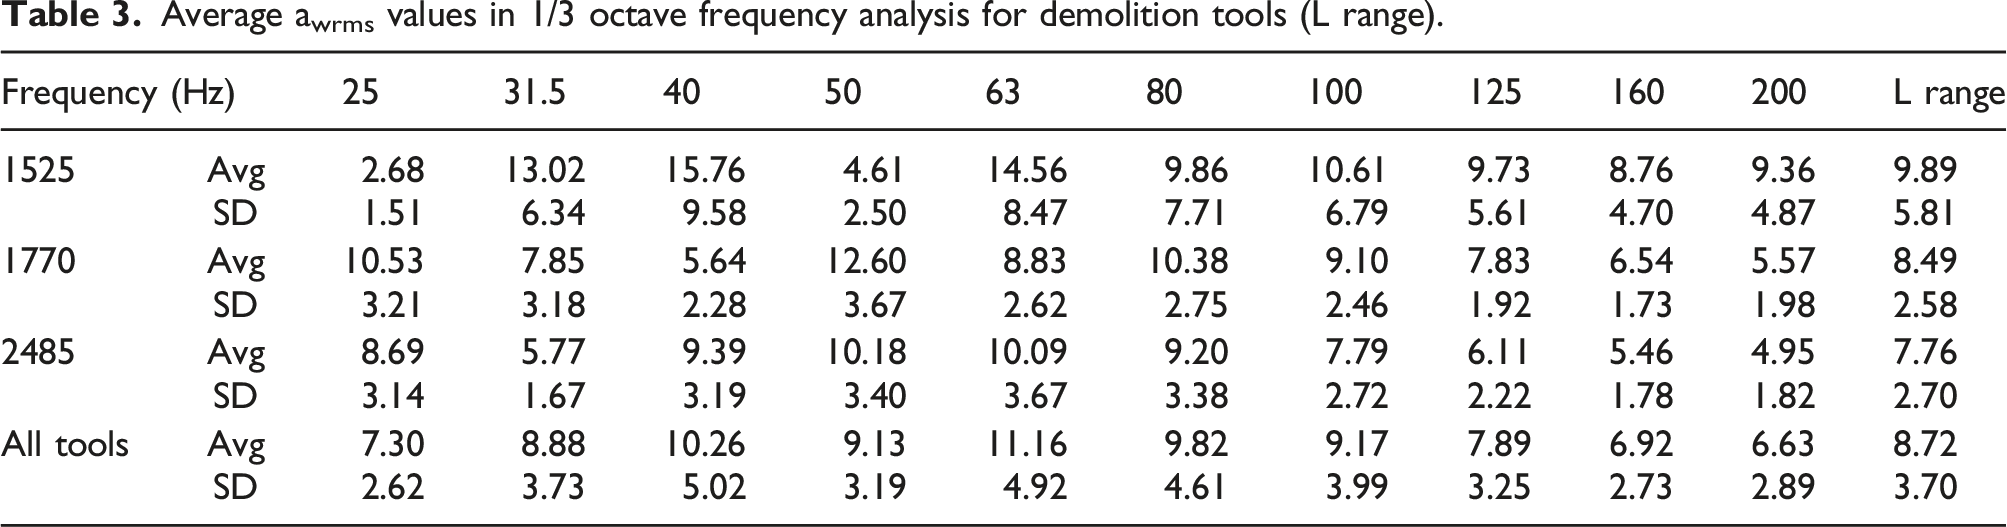
Average awrms values in 1/3 octave frequency analysis for demolition tools (L range).
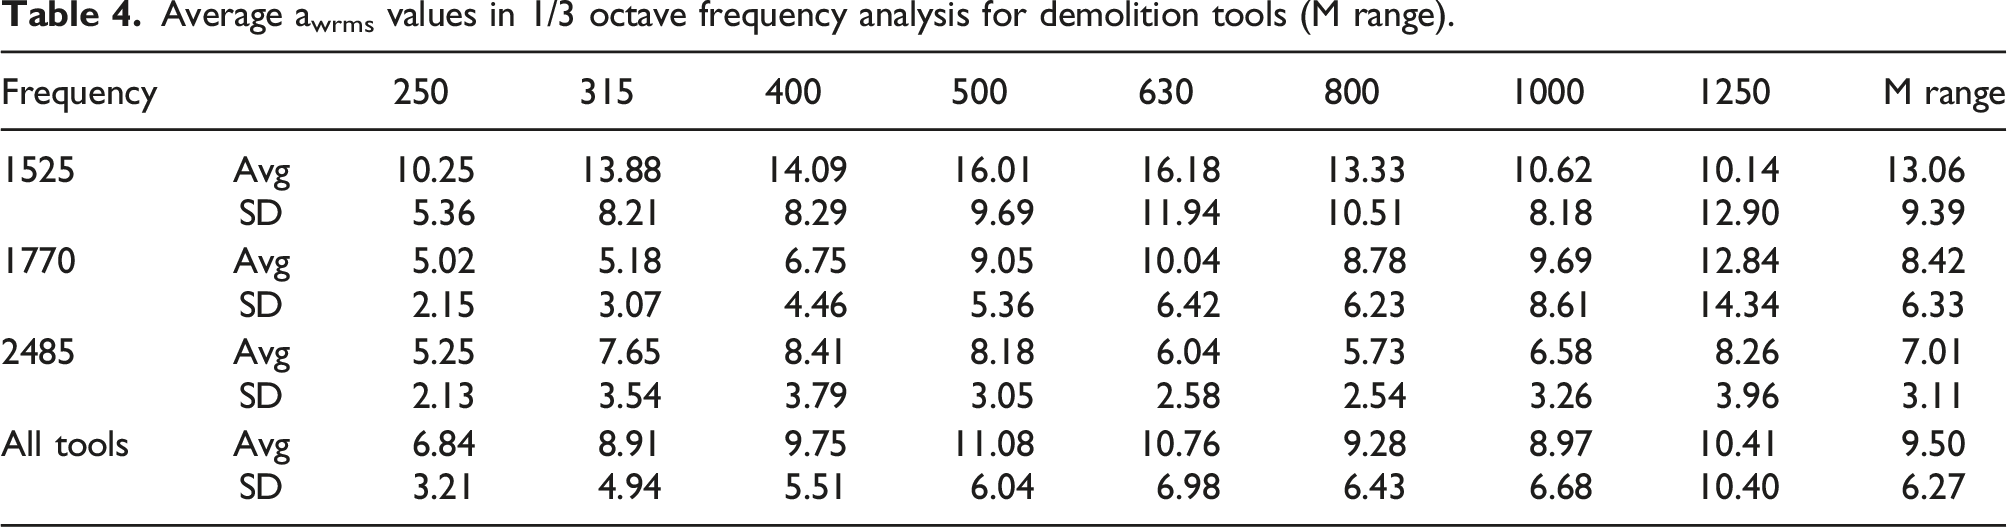
Average awrms values in 1/3 octave frequency analysis for demolition tools (M range).
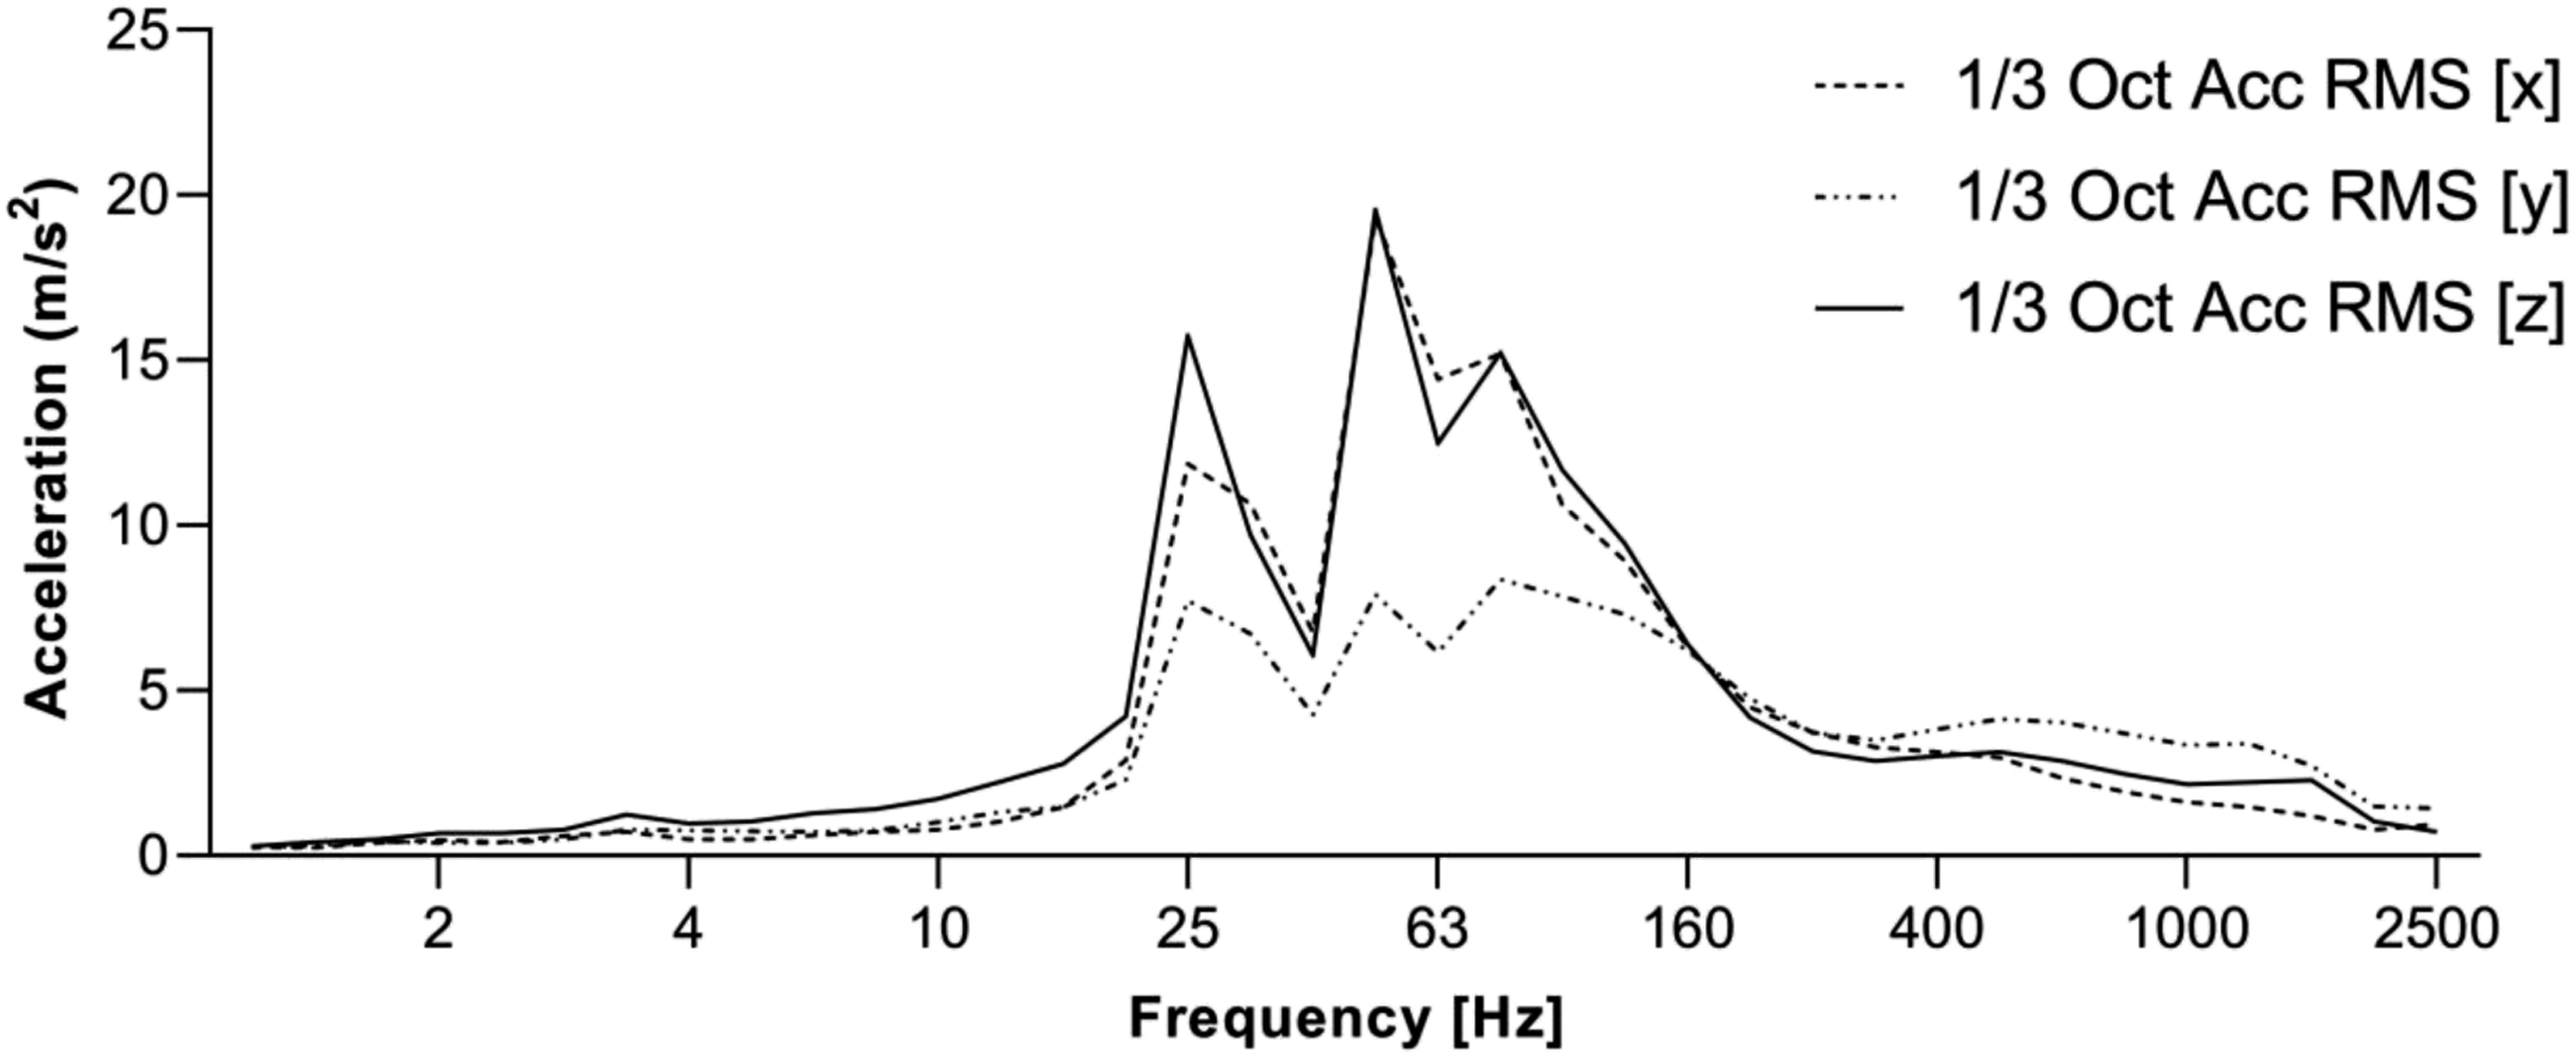
One third octave acceleration for axis with dominant frequencies of signals for hammer 1770 to a 60 cm flat on the 15 cm thick concrete slab.
The results of analyzing the overall frequency data revealed that the frequencies between 31–100 Hz and 400–800 Hz were the ones that produced the largest average acceleration. In the L and M frequency ranges of the samples, the average of the five prominent frequencies was 9.92 m/s2 (50–125 Hz) and 9.98 m/s2 (400–1000 Hz), respectively. These prevailing frequencies were often close to one another.
The average values for hammer 1525 were higher than other two hammers, and for L frequency range was 9.89 m/s2 compared to 13.06 m/s2 for the M frequency range. The average values in the other two hammers in L and M frequency ranges were lower, and about were 0.1 and 0.7 m/s2 for 1770 and 2485 hammers, respectively. When the difference among the means of five dominant central frequencies in the L and M ranges was studied, it was found that the differences for these two hammers at L and M frequencies were greater and close to 2 m/s2.
As shown in Tables 3 and 4, in the hammer 1525, the highest averages transmitted in frequencies of 40, 63, and 31 Hz in the L frequency range and at 315–630 Hz in the M frequency range. The mean values in three dominant frequencies less than 80 Hz was 14.45 m/s2 and in the three dominant frequencies in the M range were 15.42 m/s2. There was a noticeable decrease in frequency between 40 and 63 Hz (i.e., 50 Hz) for the average results of each of the three operators in this 1525 hammer.
In the L frequency range, the highest value for 1770 hammer was equal to 12.60 m/s2 at 50 Hz and had a statistically significant difference (p < .0001) with other frequencies in this range. The dominant observed in the M range above 500 Hz and was approximately 10 m/s2. In hammer 2485, which is as left-right handle at the top of the tool, the average values of the L and M frequency range were 7.18 and 7.01 m/s2, respectively. This difference was greater than the five dominant frequencies in each set frequency range and was 1.8 m/s2 (7.82 m/s2 for M and 9.51 m/s2 for L domain). The results showed that in the L domain, the frequencies 50–63 Hz, and in the next degree, 80 and 40 Hz, show the larger values about 10 m/s2. On the other hand, for the M range, the frequencies of 400, 500, and 1250 Hz had a dominant value slightly higher than 8 m/s2.
Figure 11 shows the mean results for the frequency range of 25–1250 Hz for any type of instrument cluster connection. As can be seen from the Figure 11, the difference in a
wrms
values is generally significant, and especially at frequencies above 100 Hz, the mean values for the main handles are significantly higher than the average values of the group with the side handles (p = .0189). There are two peak frequency ranges at 30–63 Hz (except for 50 Hz) and at 315–630 Hz. Average values of 1/3 octave band frequencies from 25 to 1250 Hz for types of tool handle attachment.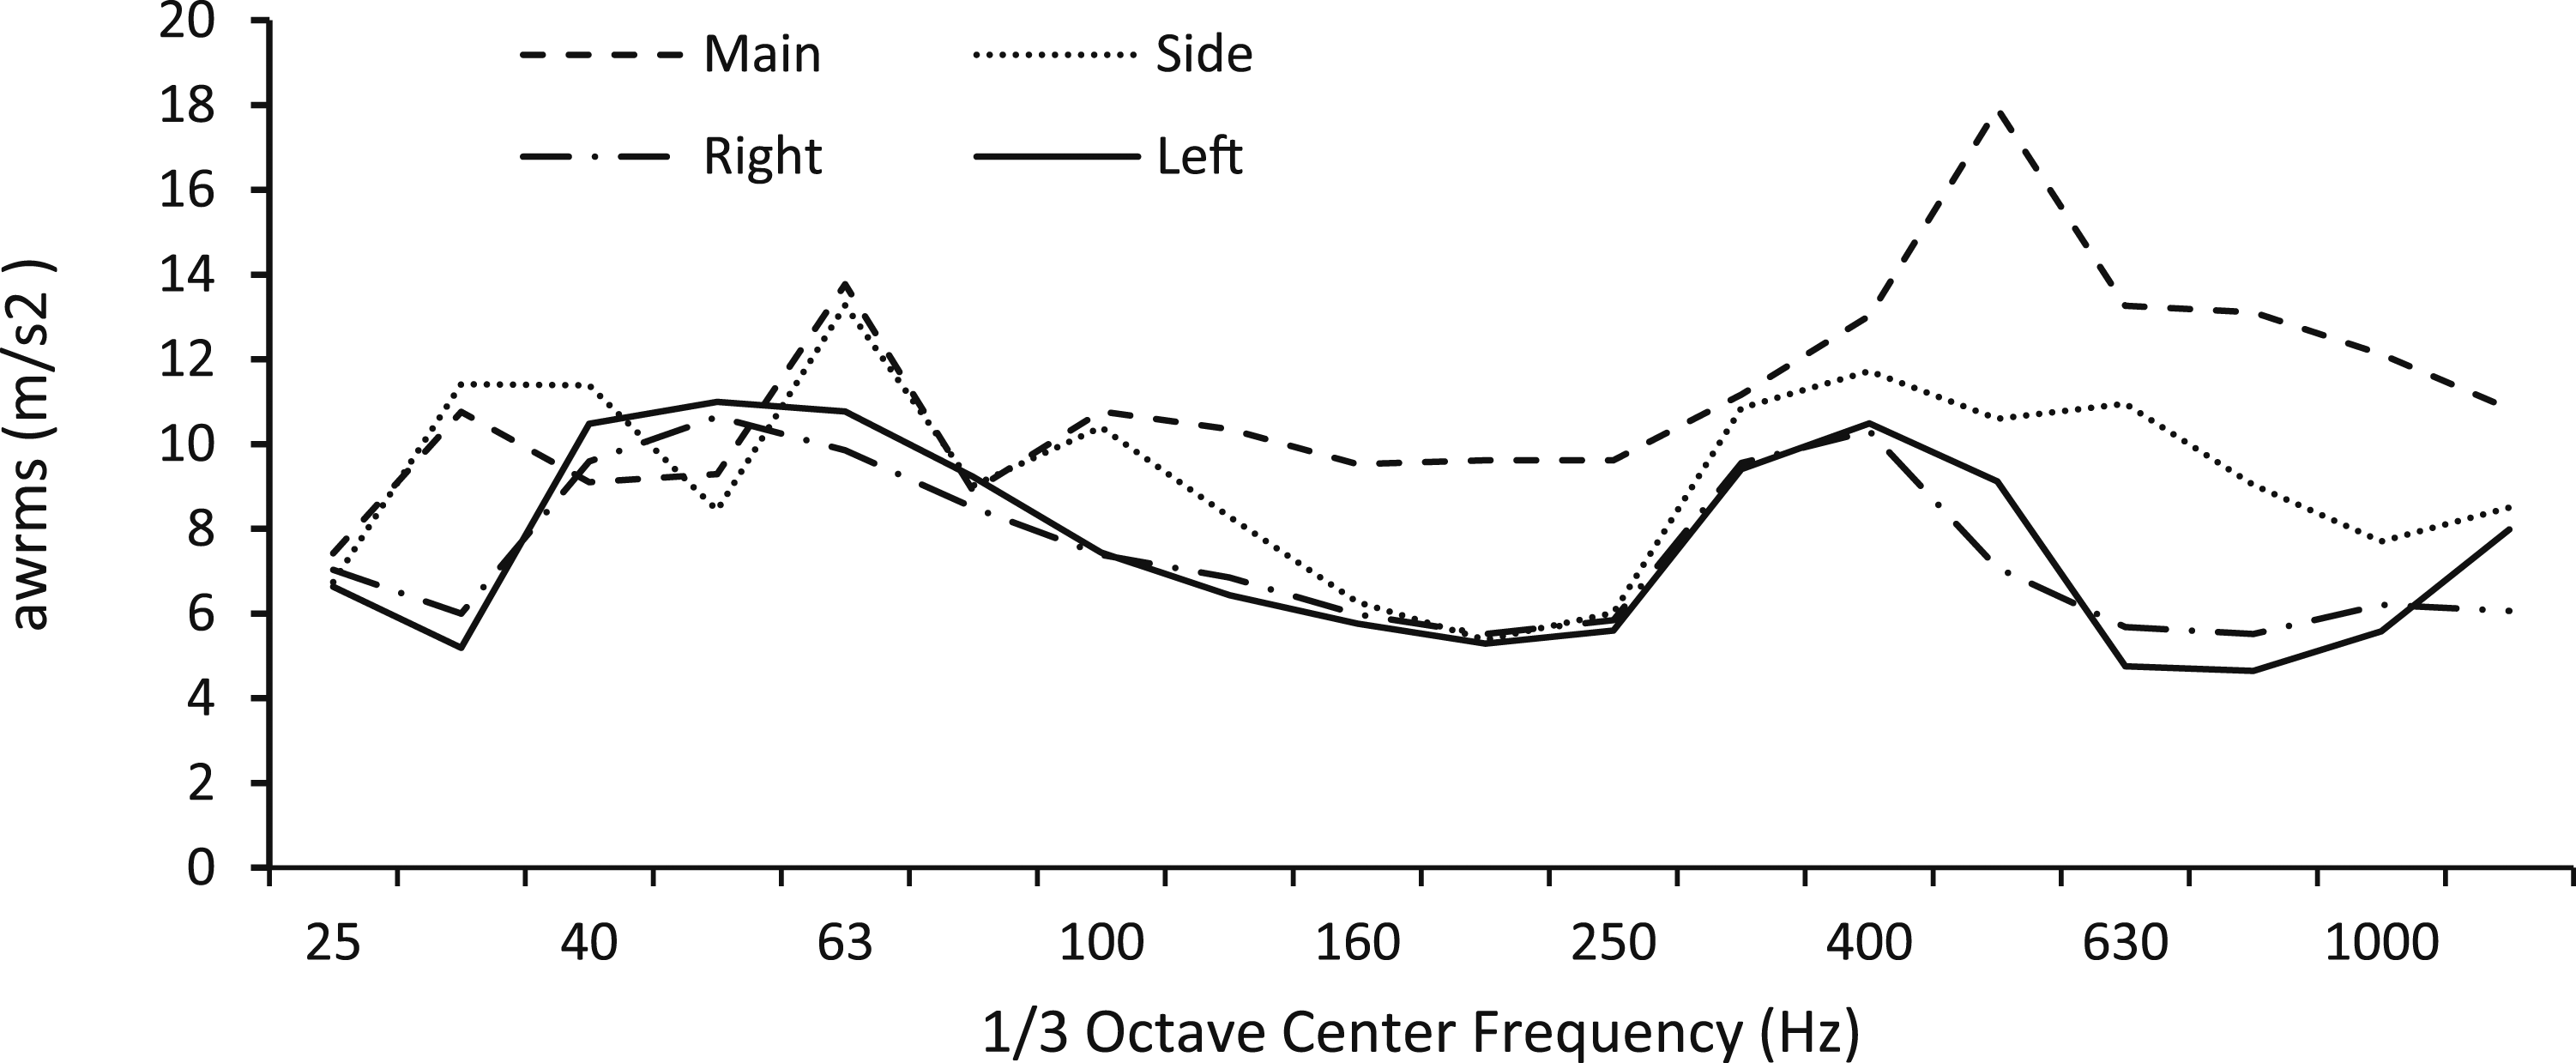
In the left-right handle hammer, the frequency range of the handles is very close to each other and has two dominant ranges in the frequencies of 40–63 Hz and 315–500. A similar trend has been observed when comparing the results of individual users. For hammers with main auxiliary handles, the average difference between handles for the low and medium frequency ranges was 3.28 and 0.9 m/s2 for the 1525 and 1770 hammers, respectively. Regardless of other factors, the comparison of the results showed that the a wrms values for the 15 and 10 cm slabs are low except for minor differences in the range of 40–80 Hz and above 500 Hz. The average difference for two groups of 10 and 15 cm slabs in L and M frequencies was 0.77 and 0.2 m/s2, respectively.
The highest mean values in the all samples of flat and point bits were 12.08 and 10.66 m/s2, in L frequency range in the 63 and 40 Hz, respectively. For M frequency range, the highest values for both groups were at 500 Hz.
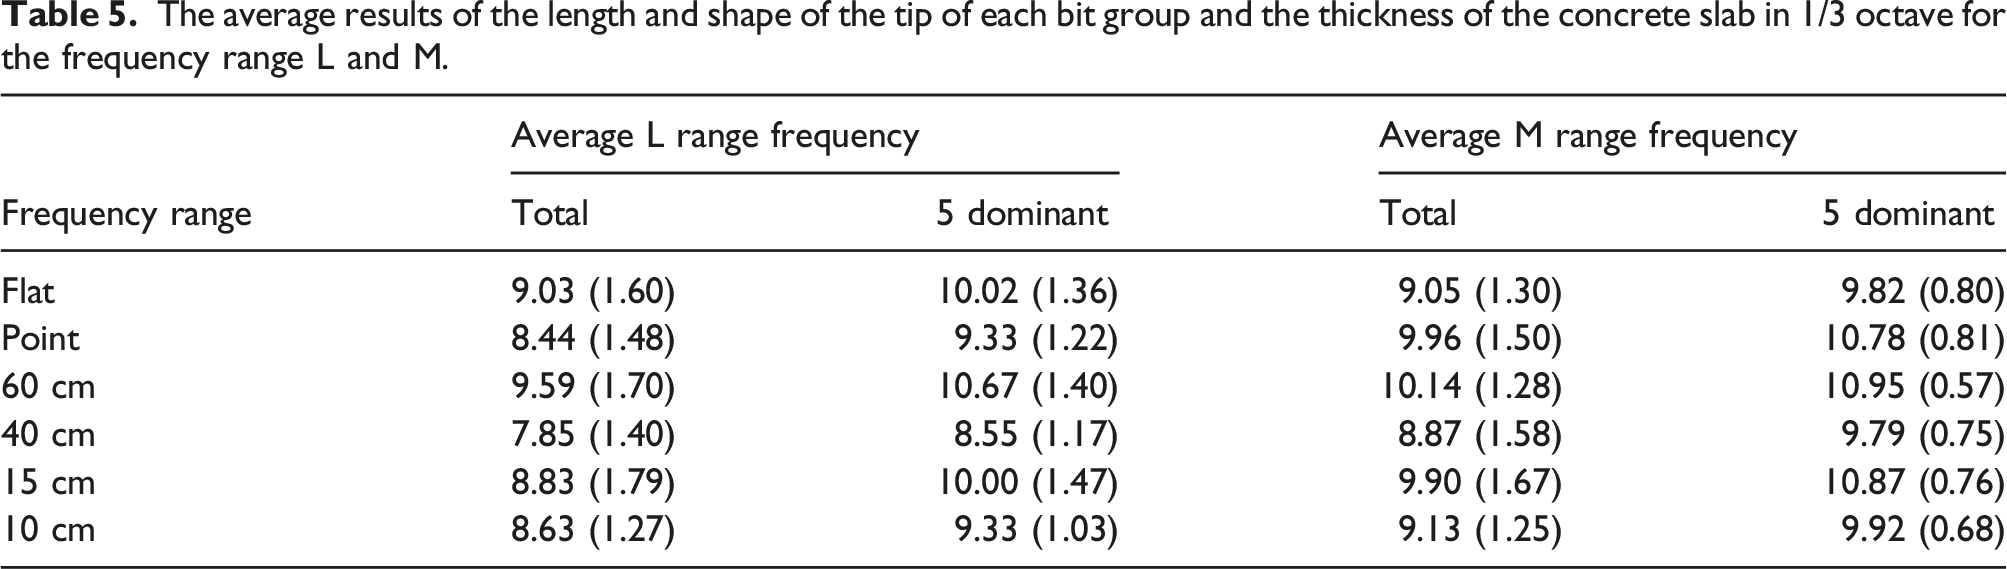
The average results of the length and shape of the tip of each bit group and the thickness of the concrete slab in 1/3 octave for the frequency range L and M.
At frequencies of 20, 25, and 63 Hz, the mean values of all samples in the flat bits were higher, and the highest value was related to 63 Hz. But at other frequencies, the values were either equal or at frequencies such as 315–500 and 40 Hz, the mean values of the point bits were higher than the flat bits. However, the difference between the means was not significant.
Discussion
This study examined the effect of difference in impact energy, the length and shape of bits, and the thickness of concrete during the demolition of concrete surfaces by electric demolition hammers on the vibrations transmitted to the handles of these tools in the field measurements.
Tools used to demolish or break non-metallic structures, either by a hammer or rotary action mechanism, are known by such titles as demolition or chipping hammers, jackhammers, combination or rotary hammers, and concrete breakers. During using these tools, high vibration is transmitted through their handle to the hand of the operator.3,13,24
Therefore, control management and the strategy of selecting and using them and their requirements is a challenge in the field of ergonomics, health, and safety that many efforts were made in this regard.42–44 Hence, for assessing vibrational exposures, many factors such as tool history, life, shape, bit wear rate, the body position, and the user’s performance should be considered. The vibration transmitted to the category of electric demolition tools by new tools and new bits is investigated in this study.
The dominant value of vibration in one direction appears that largely depends on the type of operation and tool used. 45 Consistent with the findings of previous studies, the vertical demolition axis results were remarkably high at both handling of tools; however, the value from the horizontal axis (x) was comparable to the vertical direction.14,15,40 This is a fair circumstance for the operator to hold the accelerometer while destroying, and in reality, the reason for the high values in the horizontal axis is because the operator’s hand angle changed while directing the tool, altering the accelerometer’s vibration input axis. This condition was observed in the study of De Silva and Wijewardana 45 during demolition process in real conditions. For these reasons, in studies such as Lindenmann et al. 7 and Aldien et al., 17 only the results of this axis were reported. According to the summation of axes or VSV method based on ISO 5349 for assessment of human exposure, shifting part of the acceleration to another axis did not pose a significant problem. Therefore, it should be noted that the values of other axes in the evaluation of exposure to these tools should never be ignored. However, in many studies, such as the study by Lindenmann et al., 7 only the evaluation was done in the vertical axis and the results of other axes were not even presented, which seems that it cannot be a correct approach in non-robotic and steady-state conditions, unless the accelerometer was attached on the instrument handle.
The weight and energy consumption of tools are not always suitable factors for estimating the level of vibration transmitted to the tool handle. According to ISO 5349-1, 38 Mansfield 12 showed for 19 different electric rotary hammer drills, the vibration level increased with increasing bit diameter, and for 19 mm diameter bits, the reported handle vibration ranged from 8 to 17 m/s2 in the tested drills. Although generally increasing the weight of hand tools usually increases the acceleration of the tool handles, nevertheless among a certain group of tools, this equation is not observed based on the weight of the tool. 24 Consistent with the results presented in this paper, Johanson et al., 4 Campbell et al., 15 and Edward et al.13,25 also showed that there was no statistically significant relationship between a wrms results and tool weight. It can be concluded that appropriate and optimal tools should be provided for each type of demolition process according to the required hardness and power. 13 So, based on the results of the hammers in this study, it seemed that a hammer with an energy of 25 J per impact is not a good choice for destructing surfaces with similar hardness and thickness in this study and exposes the operator to more risks.
Although the mean values of hammers for different types of handle location on tools was not statistically significant but when the average values of all three hammers were checked, the difference of about 1 m/s2 between the handles with higher averages was significant compared to the handles with lower averages.
In many tools similar to this study, the tool handles are usually made as head-side due to the ergonomic factors. In this study, the average values of hammers for different types of handle locations on the tools were not statistically significant, but by examining the average values of all three hammers, the difference was about 1 m/s2 between the handles with a higher average. Compared to handles with a lower mean (p < .03). Also, in the frequency spectrum of 25–1250 Hz, the difference in the values of a wrms is generally significant, and especially at frequencies higher than 100 Hz, the average values for the main category were significantly higher than the average values from the group with side handles (p = .0189). For the instruments with the main category, the average difference between the two groups in the low and medium frequency ranges was 3.28 m/s2, and for the 1525 and 1770 instruments, it was 0.9. Difference in the results of the two hammer handles was also reported in the studies of De Silva and Wijewardana 45 and Jakubek and Rukat. 14 Importance of these differences is understood by manufacturers and designers due to the difficulty of controlling the dominant vibrations with low frequency content. Therefore, an important approach is that the design strategy of vibration control and reduction in each category should be different based on several influencing factors. 7
The overall mean of 16.65 m/s2 (14.66–20.04) in this study can be compared to 15.09 m/s2 reported for five electric and pneumatic demolition hammers in real conditions, a mean of 12.78 m/s2 for pneumatic hammers in the laboratory environment, and an average of 19 m/s2 in 27 and 40 kg heavy demolition hammers under actual operating conditions.4,15,16
In the study of De Silva and Wijewardana, 45 the hand-arm vibration exposure values for the x, y, and z axes was reported to be 23.3, 15.2, and 18.1 m/s2, respectively.
These results are related to the values of the trigger time without using protective methods during the demolition of C25 concrete with an electric hammer made by Hilti (TE-1000). Most important reasons for the difference between the results of this research and this study can be found for reasons such as providing results for trigger time, differences in hardness and density of concrete surfaces, new or used tools or bits during demolition, etc.2,4,45,46
The results of the vibration measured in this field study seem more intense than the results of similar studies done robotically or in laboratory environments in this group of electric tools.
The effect of this has been shown in the comparison of hammers in both robotic and human situations leading to more significant results for human versus robotic values: about 1 m/s2 by Remple et al., 8 and more than about 4–11 m/s2 by Uhl et al. 46 In laboratory methods such as ISO 28927-ISO 6882, the recommended work method is downward, but in real conditions, the angle of hammer is usually inclined, not vertical and straight.8,25,31,46,47 Accordingly, it seems that the findings in real operational environment studies like this study are more similar to the actual values of users' exposure, which was also confirmed in the study conducted by De Silva and Wijewardana. 45 In the downward working method with manual vibrating tools, the total mass of the hand contributes to vibration transmitted to the hand, while in the laboratory environment and when the downward work is not performed, most of the vibration transmissibility is limited to the apparent mass of the palm,45,48 which is probably the main reason for the difference in results between studies in real and controlled conditions.
Similar to the results presented by Campbell et al. 15 showed that with increasing the thickness of the work surface, a wrms values in each tool increased. Comparison of the difference between the results between the Hammer as in Figure 7(a) showed that the largest difference between the It leads to the demolition of 15 and 10 cm concrete slabs related to the 1525 hammer. This subject becomes more evident when the level of significant difference in the total results for the two groups of 10 and 15 cm concrete thickness (p < .0001) and especially the significance level of each tool was studied separately (p-value for tools 1525, 1770, and 2485 are 0.008, 0.98, and 0.15, respectively). Significant differences in the 1525 tool for demolishing concrete blocks of 15 and 10 cm indicate that this tool is not a good choice for higher thicknesses. Figure 7(b) has been show that the difference in the results obtained for two concrete thicknesses in the mean users results, except from the user 1, the difference in results was statistically significant (p = .0048).
Our results showed that, in general, the average values of flat bits are higher than point bits (P) and the difference between the two groups is statistically significant (p = .023). When the average results of hammers were examined for the same concrete thickness (15 cm) and bit length (60 cm), the difference between the two groups was statistically significant (p = .03). In addition, it was found that the difference in mean a wrms -VSV for samples made with flat bits compared to point bits in 2485 and 1525 hammers was 2.75 and 3.23 m/s2, respectively.
Similar to the average results for flat and point bits, between the two groups of bits with a length of 40 and 60 cm, the difference between the means was statistically significant (p = .0007). The average of 60 cm bits was about 2 m/s2 larger than the 40 cm bits. Also, the total average of 15 cm concrete samples destroyed by all three users with 60 cm flat bit was 19.50 m/s2. The latter value in similar conditions was about 3.4 m/s2 higher than the average value of 40 cm bits (p = .02). The highest average difference value for the two lengths of bits investigated in this study was observed in 1525 and 1770 hammers by users 3 and 2, which were 4.65 and 3.92 m/s2, respectively.
In previous studies that were conducted with the aim of investigating the effect of changing requirements in tools and related work areas similar to this study, Hussain 49 showed that drill vibration increases while productivity (i.e., drilling time) and decreases with tool wear and Rimmel et al. 50 (2006) and Jakubek and Rukat 14 showed that the vibration transmission varies significantly with drill diameter for hammer drills. Except from the study by Antonucci et al., 11 who have investigated the wear of tool heads in metalworking drills and reported the increase in handle vibration with increasing usage and the wear of the drill bit, related to the length and shape of the tool head, another study was not found in our internet searches.
We can see the importance and higher health risk at frequencies up to 63 Hz compared to frequencies higher, with a brief look at the frequency weighting presented in human vibration standards. The results obtained in this frequency range support the results of studies by Antonucci et al. 11 and Remple et al. 16 that the extremely high vibration energy of about 50 Hz is related to the collision frequency of hammers, and in addition, this trend is shown in the peaks of upper harmonic frequencies in this study.2,16,38 In general, with the change of various factors and requirements, the frequency spectrum of the instruments also changed. So it is clear that external parameters such as how users work and their experience and other parameters affect the main frequency of each tool. A similar trend is observed in the study of Marcotte et al. 51 The average acceleration of 1/3 octave band frequencies showed that the 1525 hammer had higher average values than the other two hammers, except for frequencies less than 25 Hz and 50 Hz. To better understanding of these changes, the results of the samples with similar conditions have been compared in the following so that the effects of investigated factors in this situation can be estimated with more confidence.
The differences between the results of three users at frequencies of 31.5–80 Hz at L frequencies ranges and 315–1250 Hz at M frequencies ranges (p < .0001) show the effect of user characteristics on the results. It turns out that these differences in results between users at different frequencies are not coincidental and are probably related to one or more of the factors related to users, including height, weight, work experience, arm or forearm length, and how the user works.
Comparison of the average values of central frequencies of 1/3 octave bands in samples with 60 cm bits and concrete slabs with a thickness of 15 cm showed that only in frequencies 40 and 315 and with a less difference at 400 Hz, average values of samples with point bits was higher than the average of samples done with a flat bit. In other frequencies, the highest differences in frequencies 63 and 50, respectively, and in the second degree, in other frequencies, average values of the flat bits were higher than the point bits.
As shown in Figure 12, the analysis of the values performed with flat bits in 15 cm blocks showed that in all central frequencies, the values of the samples performed with 60 cm bits were higher than the 40 cm bits. The difference between the two groups in the central frequencies of 63, 40, 500, 400, and 50 Hz was the highest. The same trend was observed in most of the frequency ranges for point bits (other than 63 and 800 Hz). Average frequency spectrum of 1/3 octaves in samples with similar conditions.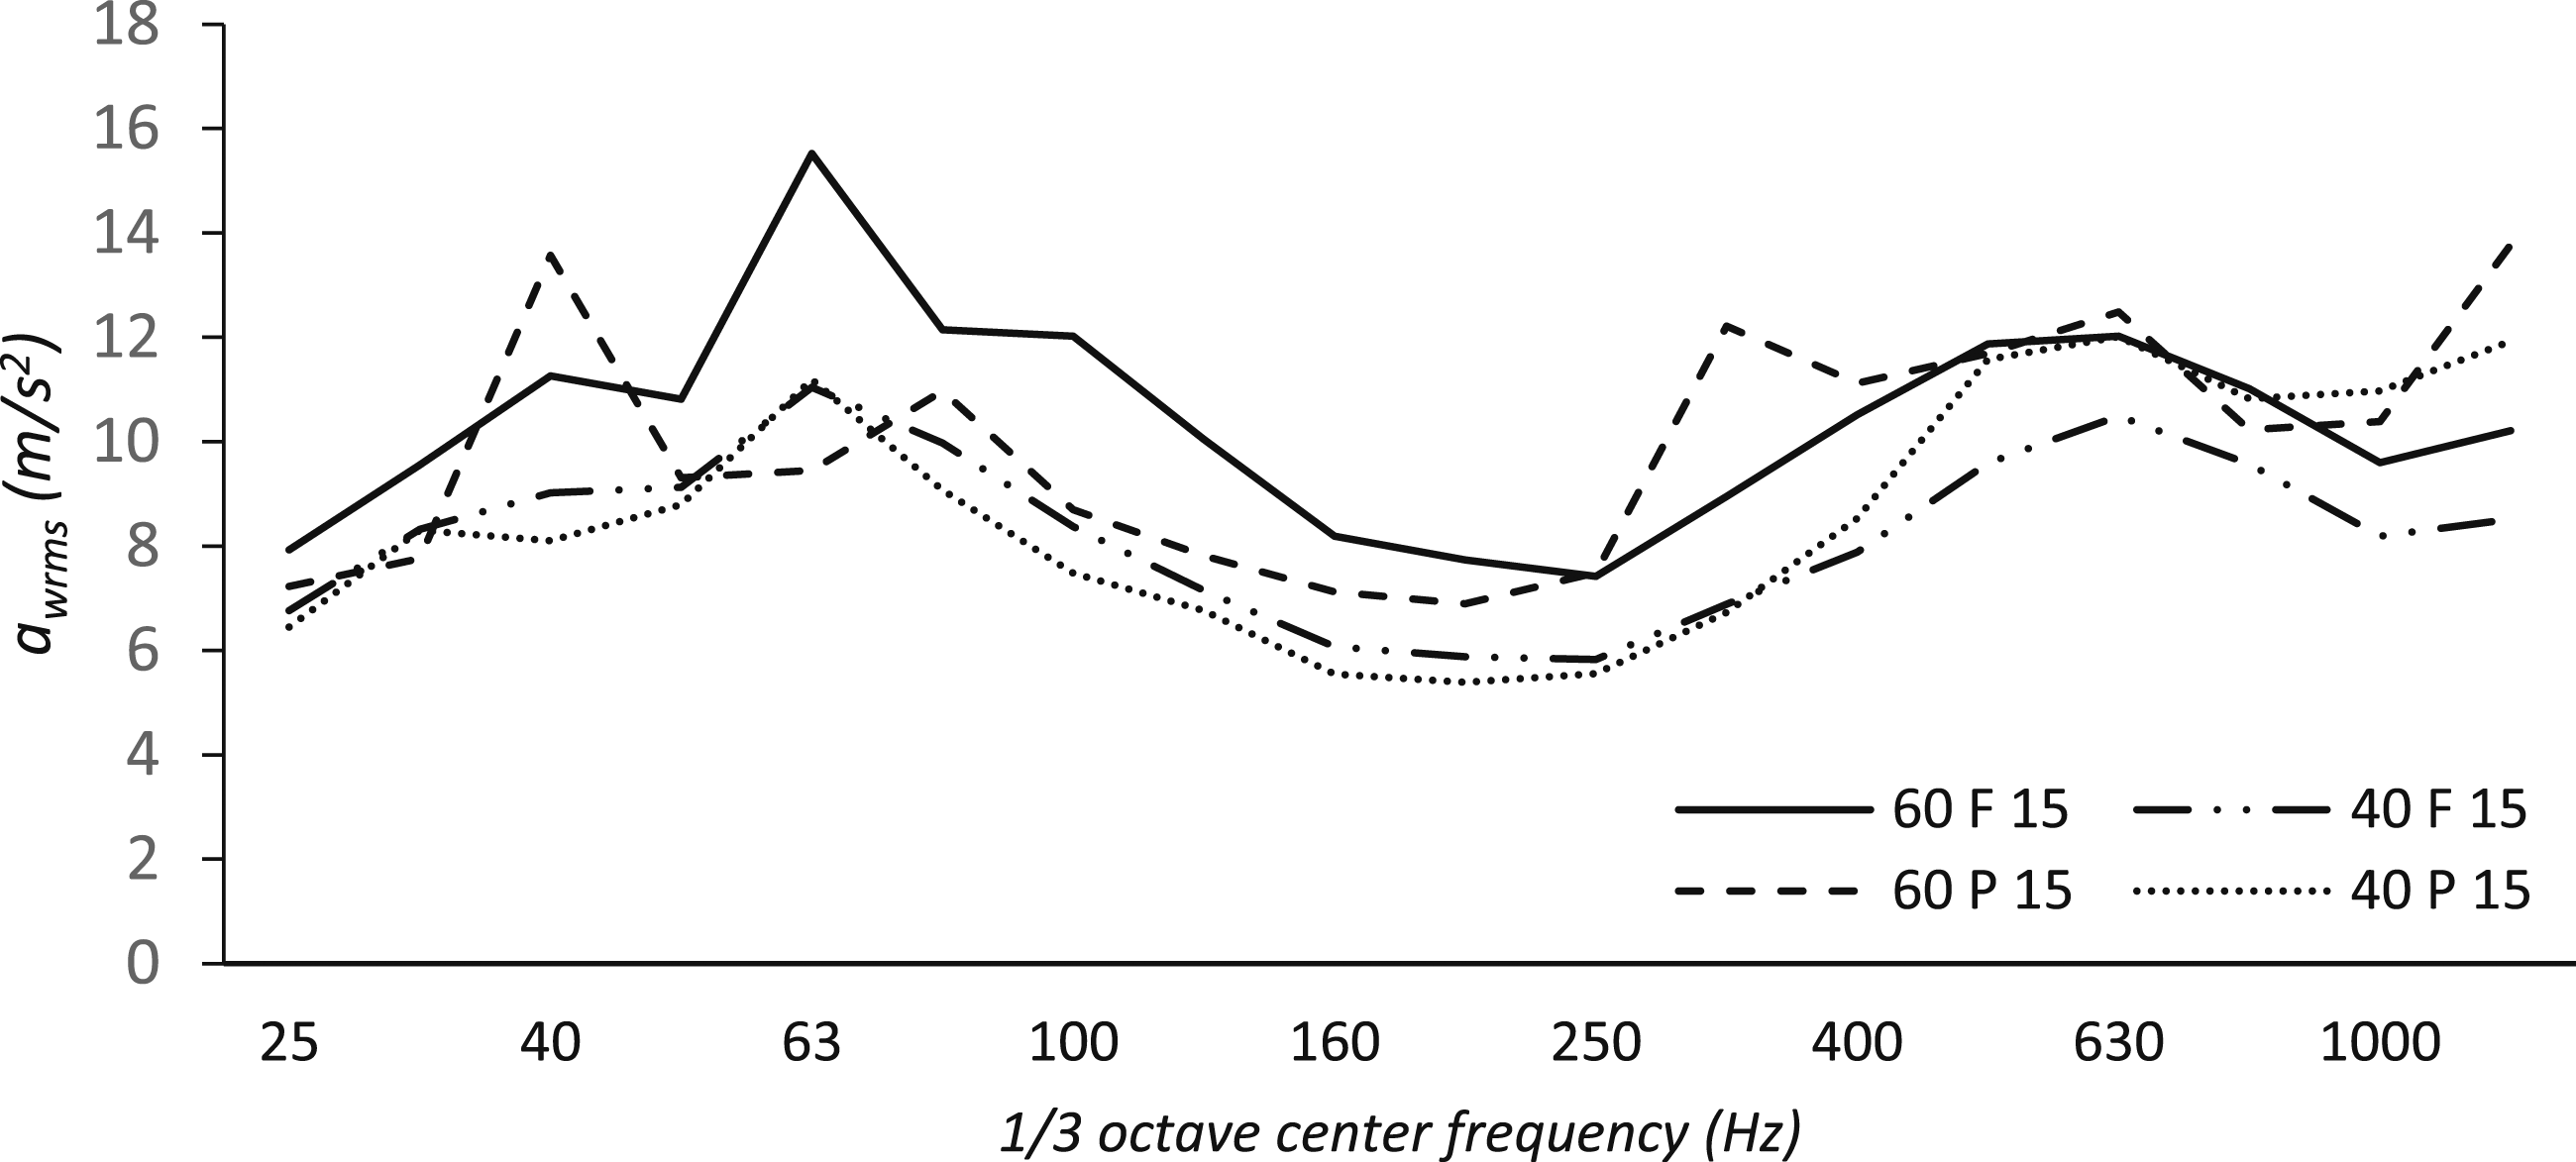
In addition, based on Figure 12, it can be concluded that the dominant frequencies in point bits with a length of 60 cm are observed in the same concrete samples with a thickness of 15 cm compared to flat bits at lower frequencies. This difference is approximately two frequency parts of 1/3 octave band. Antonucci et al. reported similar results on frequency content change due to bits’ wear. 11 Manufacturers and designers understand the importance of this difference due to the difficulty of controlling vibrations with a lower frequency spectrum. This condition was not observed for 40 cm bits.
The higher location of the curve for 60 cm bits than for 40 cm is clearly visible in the frequency spectrum presented for the same thickness of concrete, especially in flat bits and indeed in a large part of the frequency spectrum for point bits. Furthermore, a significant difference is observed in the range of 50–200 Hz from the flat bits and the 60 cm point in Figure 12. From these differences obtained, similar to the approach reported by Edwards and Holt 13 that the bit diameter is optimal for each rotary hammer drill, it is possible to propose optimal bit lengths or bit head shapes for any given task to control its exposure vibration.
Manufacturers tend to underestimate the vibration levels of their tool’s acceleration values for various reasons. Of course, the main reason for this is probably the method of measurement and the ideal conditions during their results presentation. In fields, there is not always an ideal situation to operate the tools and usually, the actual situation is even worse than the conditions defined in this study. Another reason is the presence of other harmful factors in the work environment. In short, about the information published by the manufacturers, it is clear that this information is not enough in at least half of the cases, and the manufacturers must provide the published values of their tools more and based on the specifications and requirements of the tools. 3
According to the guidance 52 and ACGIH 53 guidelines, the permissible daily exposure value for a working day is 5 m/s2. Similar to the results presented by López-Alonso et al., 3 from the results of this study for each hammer, it was found that based on these guidelines, the allowable exposure time even for the hammer with a lower a wrms in this study does not even reach 1 h.
Therefore, the findings of our study are important because different levels of about 2–4 m/s2 in such tools are remarkable for exposure assessment. This difference level produced due to changing of effective variables such as bit length, tip bit shape, handle attachment type, etc. The choice of the optimal tool according to the type of usage required and even the appropriate user selection strategy can be considered the key results of this study. A decrease of about 4 m/s2 in acceleration will increase up to 1 h the daily working time allowed for the tools. The estimated average allowed time for the tools used and the users are shown in Figure 13(a) and (b). Taking an overall view of Figure 13, it seems reasonable to state that the allowable exposure time remarkably increased when the value of a
wrms
due to using of different accessories for tools decreases by 4 m/s2. The results of studies on the effectiveness of vibration reducing gloves usually shows a limited reduction in the vibration rate by users and is usually for frequencies less than 400 Hz and about 10%. The importance of the factors used in this study can be further found, when comparing the reduction rate using the shape of the tip bit, the length of the inserted bits and other investigated parameters.32–34 Average allowable daily exposure time in the tools (a) and users (b).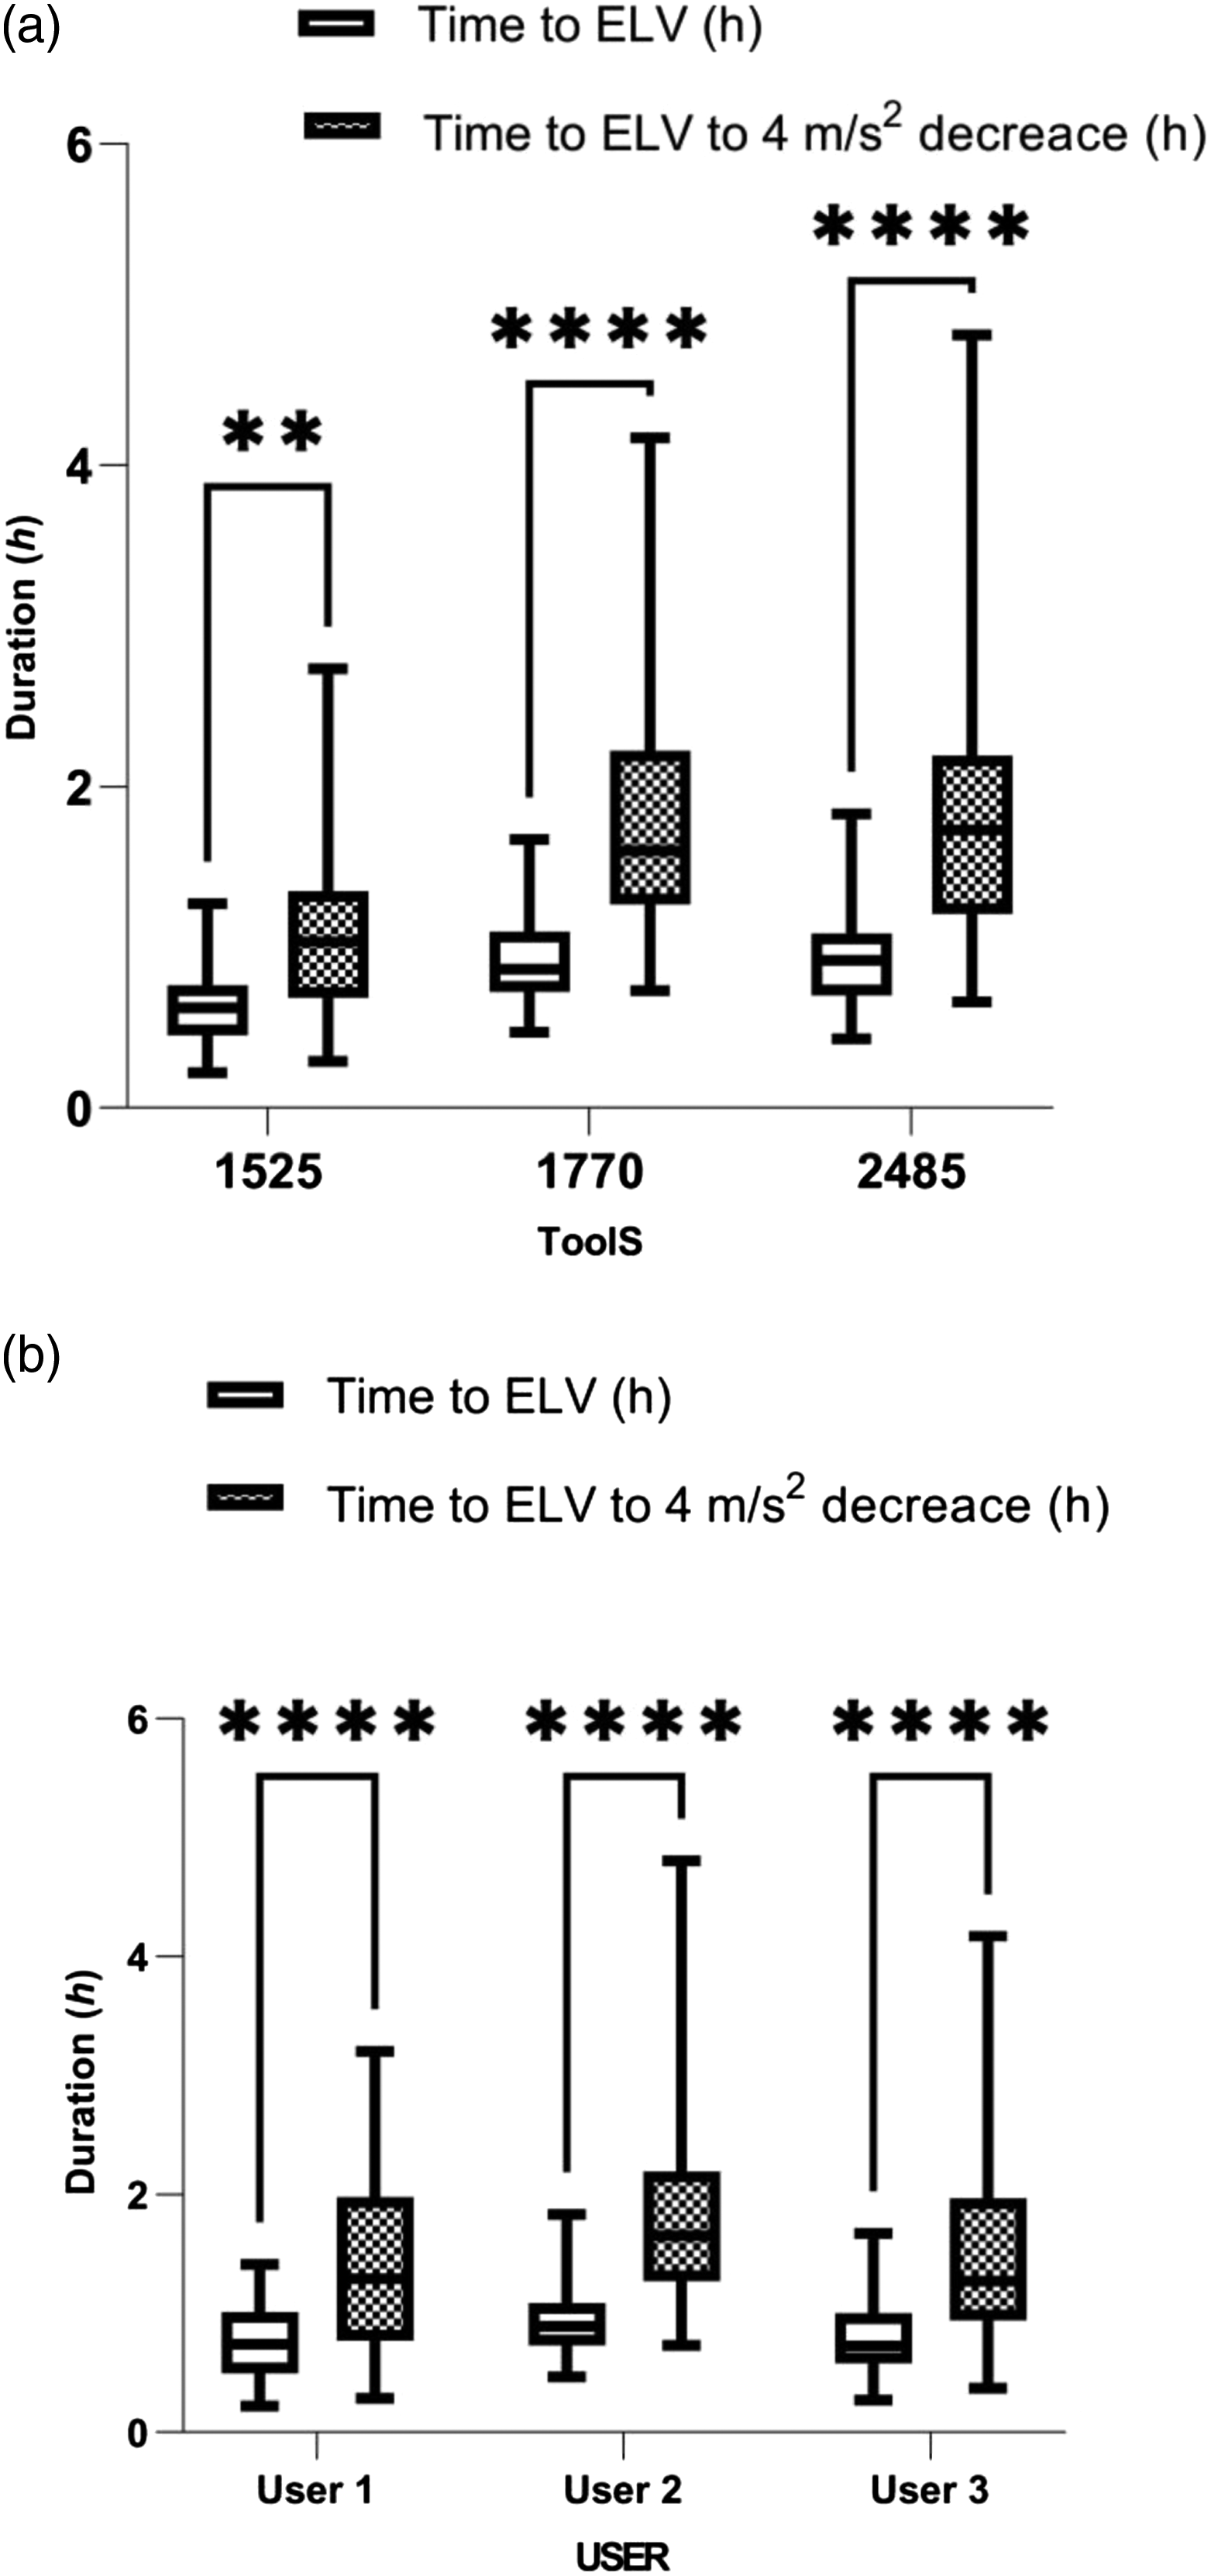
Conclusion
The focus of the present study was to investigate the effect of variables related to the demolition hammers on the handles vibration rate of these tools. This study was conducted to determine exposure to transmitted vibrations to common demolition hammers in field conditions, to study the characteristics of the transmitted frequency spectrum of tools, and to determine the effect of using insert bits by different tip shapes and lengths. Therefore, the information presented in this study will help to achieve the optimal selection of hammer attachment equipment to reduce user exposure levels. The findings in the X and Z axes were comparable despite the vertical axis’ dominance. Except for the significant marginal differences in the average results of the left and right handles of the hammer 2485 by user 1 and the significant differences in the average results of the two main and side handles of the hammer 1525 by user 3, there was no significant difference in the other conditions in the handles of the tools, based on the comparison results of hammers with handles for each user.
In brief, the mean values of flat bits were higher than point bits. However, when the mean values of the two bits in the results of each tool were separately considered, the difference between the groups became more apparent. For 15 cm concrete slabs demolished with 60 cm flat bits by all three users, the average results were 19.50 m/s2. The latter value was about 3.4 m/s2 higher than the corresponding value for the same situation for 40 cm bit group.
The highest average acceleration occurred at the frequencies from 31 to 100 Hz and then at 400–800 Hz. The average results of the five dominant frequencies in the frequency ranges of less than 200 Hz, and 200–1250 Hz in all samples were 9.92 m/s2 (50–125 Hz) and 9.98 m/s2 (400–1000 Hz), respectively. These dominant frequencies were usually adjacent to each other. The difference in a wrms values based on the ISO 5349-1 frequency spectrum is significant. Especially, at frequencies above 100 Hz, the mean values for the main handles are significantly higher than the average values of the side handles. There are two peak frequency ranges at 30 and 63 Hz (other than 50 Hz) and 315–630 Hz. In the hammers with left-right handles, the frequency content of two handles were very close to each other and had two dominant ranges at 40–63 Hz and 500–315 Hz. Moreover, the measured results of the transmitted frequency spectrum showed that the dominant frequency of point bits is at lower frequencies than the flat bit. This difference was about 2/3 of the octave band. The mean values of the flat bits were greater at the frequencies of 20, 25, and 63 Hz, with 63 Hz having the greatest value. The values were either equal or greater at other frequencies, such as 315–500 Hz and 40 Hz, where the point bits’ mean values were higher than those of the flat bits.
Footnotes
Acknowledgments
The results presented in this study are a part of the PhD dissertation approved at Tehran University of Medical Sciences No. 51014. The authors thank the cooperation of Tehran water and wastewater company for providing the tools and the participation of their employees in conducting the study.
Declaration of conflicting interests
The author(s) declared no potential conflicts of interest with respect to the research, authorship, and/or publication of this article.
Funding
The author(s) received no financial support for the research, authorship, and/or publication of this article.