
Abstract
To broaden the database of fire equipment selection and provide the basis for its selection and optimization, a low specific speed centrifugal fire pump with a specific speed of 24.7 was selected as the research object, and the inlet and outlet pressure pulsation and cavitation characteristics under different flow rates were analyzed through experiments. Results show that the head of the fire pump under the design flow rate was 75.68 m, and the efficiency was 36.84%. The dominant frequency of the pressure pulsation in the inlet and outlet of the pump under different flow rates is 1 APF (axial passing frequency). The zero flow rate has no obvious peak distribution at 1 BPF (blade passing frequency). The secondary frequency of 1 BPF and the n times the harmonic frequency of 1 BPF are distributed in the outlet of the pump. The critical net positive suction head of the fire pump under 1.0 Qd and 1.5 Qd was 0.95 m and 2.38 m, respectively.
Keywords
Introduction
Fire is one of the most frequent disasters in the world, and its occurrence not only causes huge property and material damage in a short period of time but also poses a great threat to personal safety. Firefighting equipment can minimize the damage caused by fire. At present, there are various forms of firefighting equipment. The tangent pump1,2 can simplify the structure of firefighting equipment, but its easy overload and special hydraulic performance limit the application range of the tangent pump. The centrifugal fire pump S type3,4 vane can meet the fire pump head while reducing hydraulic losses. The integrated spiral flow constant pressure pump5,6 set can meet the performance requirements of small flow and high head of firefighting equipment. The performance of the fire pump is different. In order to study the performance of fire pumps, scholars have done a lot of effort. The current research methods are mainly numerical simulation and experiment. Based on numerical simulation, the transient characteristics of flow, head, and efficiency of the snorkeling fire pump 7 during start-up were studied. Wang et al. 8 studied the external characteristics, internal flow characteristics, and cavitation characteristics of centrifugal fire pump by using CFD technology. João et al. 9 found through experiments that hydraulically driven fire pumps are less expensive to maintain than diesel-driven fire pumps and can meet the requirements of extreme conditions. The firefighting and hydrophobic performance of a series-parallel integrated spiral flow constant pressure pumping set 6 were studied by using experimental methods. In order to improve the performance of fire pumps, scholars have done a lot of performance optimization studies. Wang et al. 10 used a three-stage pressure lifting technique to meet the flow and head requirements of forest fire pumps, and the design results were found to meet the actual demand through dynamic simulation and experimental verification. Yang et al. 11 applied a low specific speed centrifugal pump to a fire truck and fixed the blade outlet angle to guarantee no overload performance while adding an induced wheel to improve the cavitation performance. Zhang et al. 12 established an automatic optimization method for the overload problem of the vertical long-shaft fire pump based on particle swarm optimization. Cai et al.13,14 developed a three-stage centrifugal forest fire pump with a wide high-efficiency zone, and Paluch et al. 15 proposed a single-stage centrifugal pump impeller design method for fire trucks. Hu et al. 16 optimized the humping and cavitation characteristics of centrifugal fire pumps by reducing the outlet diameter and outlet angle and using the splitter blade technology.
The centrifugal pump has unparalleled advantages in various applications in the fire protection field. As long as the key hydraulic components are carefully designed, they can be well adapted to various extreme load conditions. The external characteristics, pressure pulsation, and cavitation characteristics of an ultra-low specific speed fire centrifugal pump were studied by experimental method. By analyzing the error caused by the uncertainty of the experiment in detail, the reliability of the experimental results is ensured, and the reference is provided for other scholars to analyze the error in the experimental results. The external characteristics, inlet and outlet line pressure pulsations, and cavitation characteristics obtained from the final experiment can provide data to support the safe use and design optimization of fire pumps.
Experiment introduction
Research model
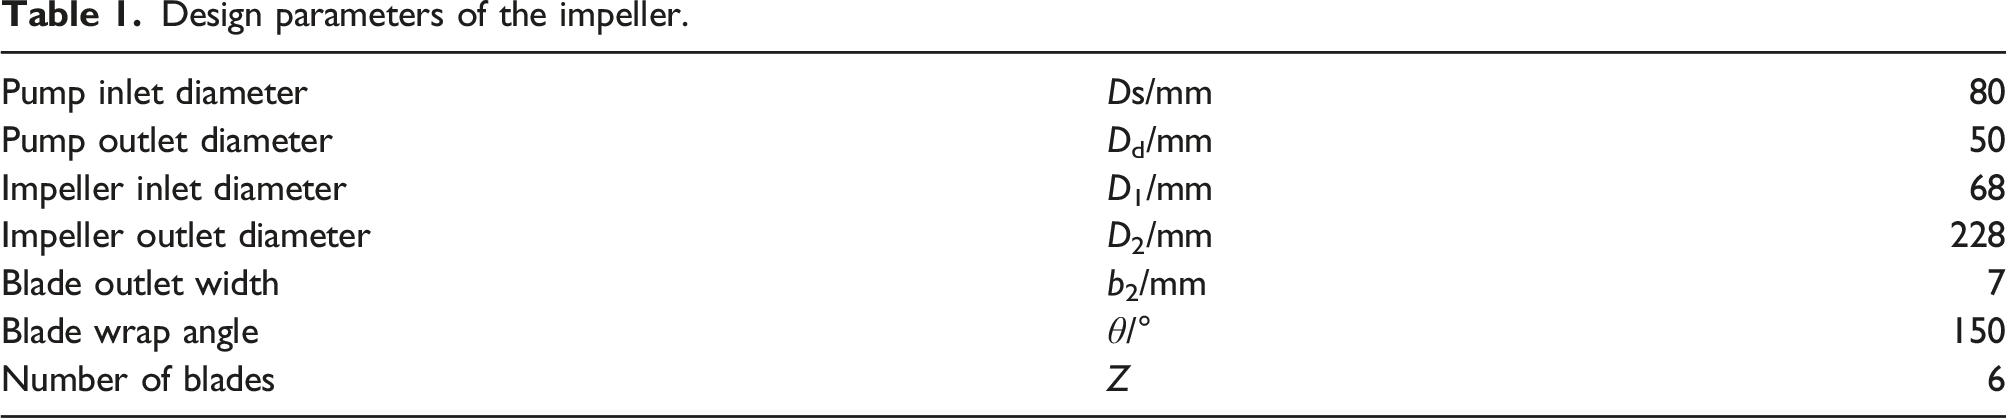
The research model in this paper is a centrifugal fire pump (building fire-fighting pump) with a specific speed ns of 24.7 ( Two-dimensional diagram and actual picture of a fire pump. Design parameters of the impeller.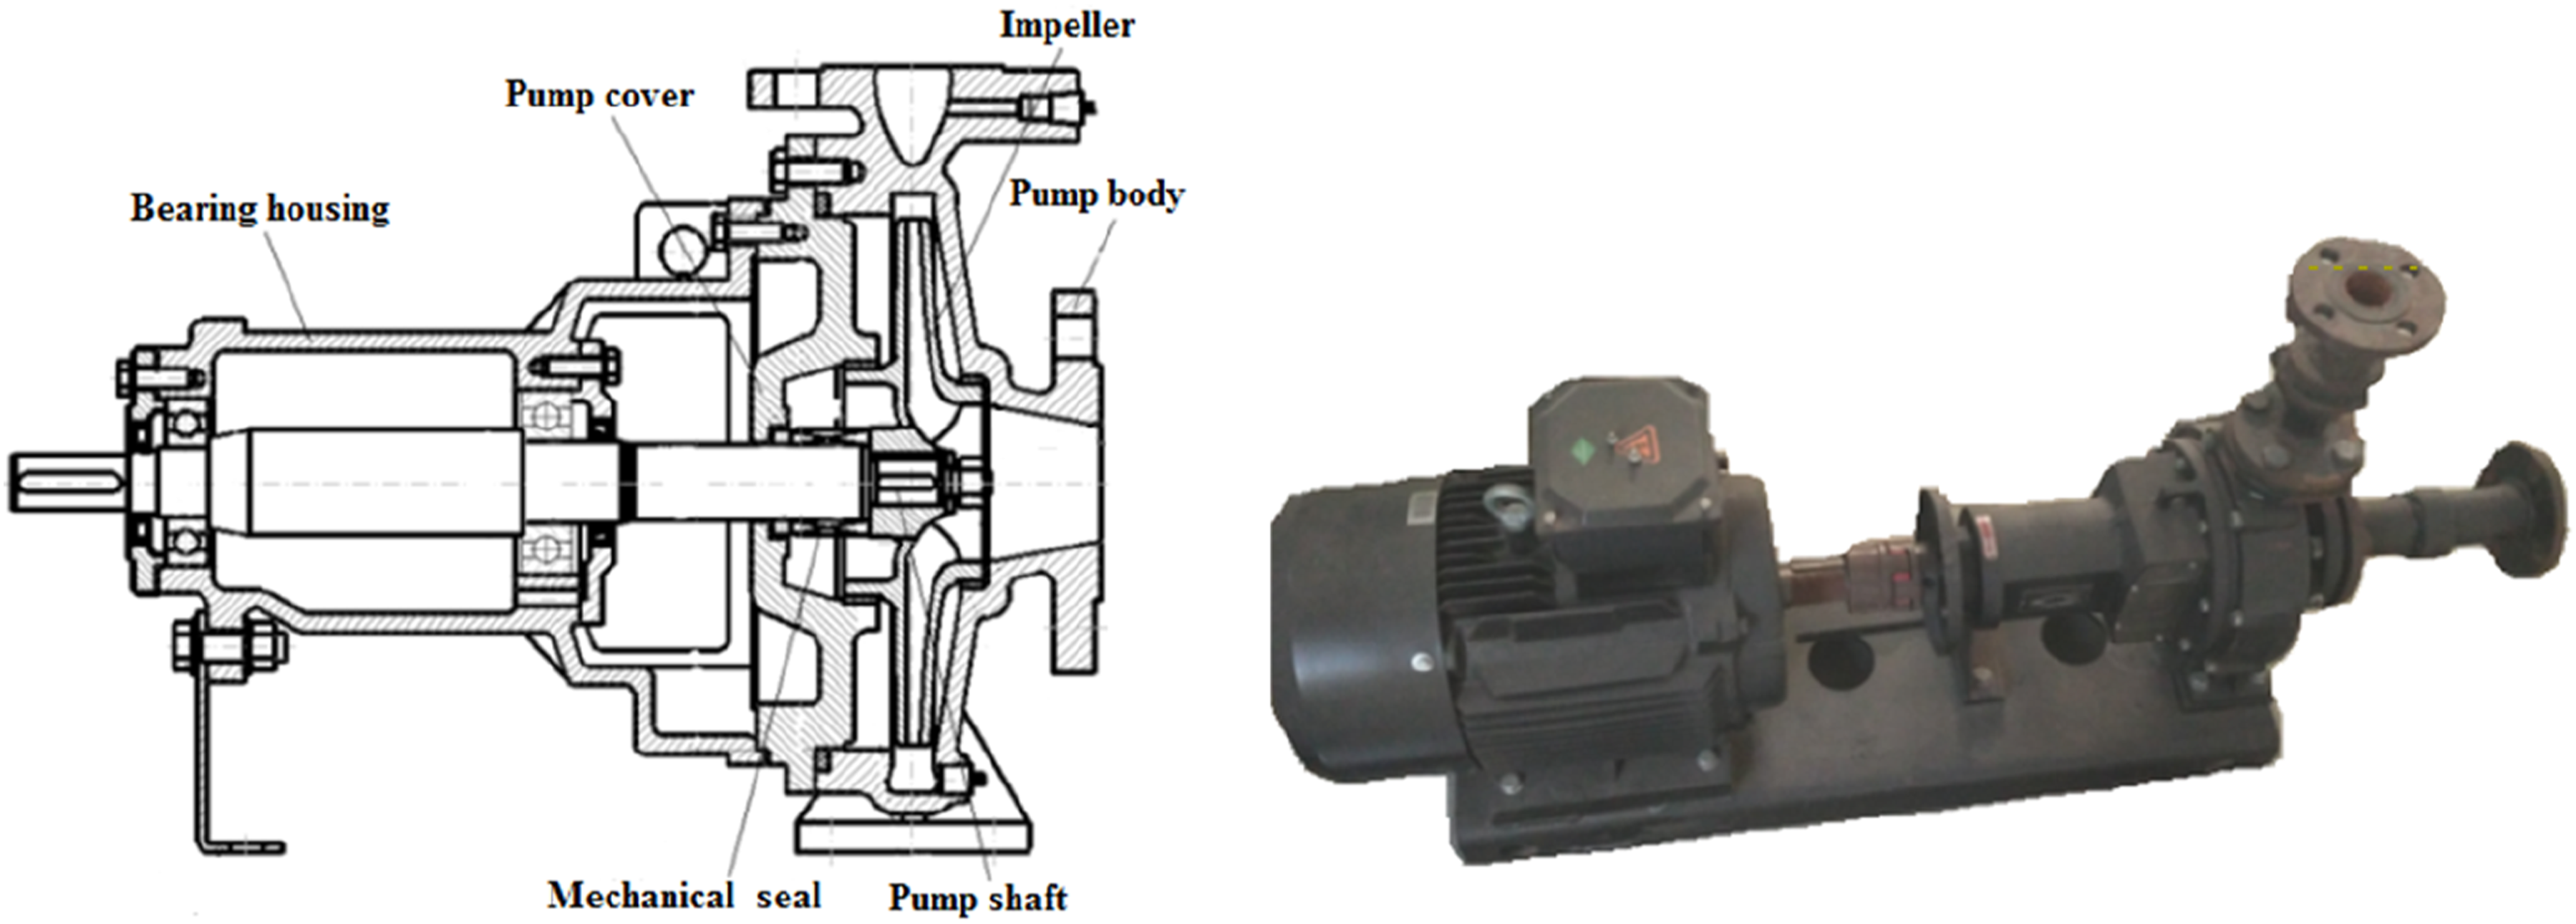
Experiment bench device
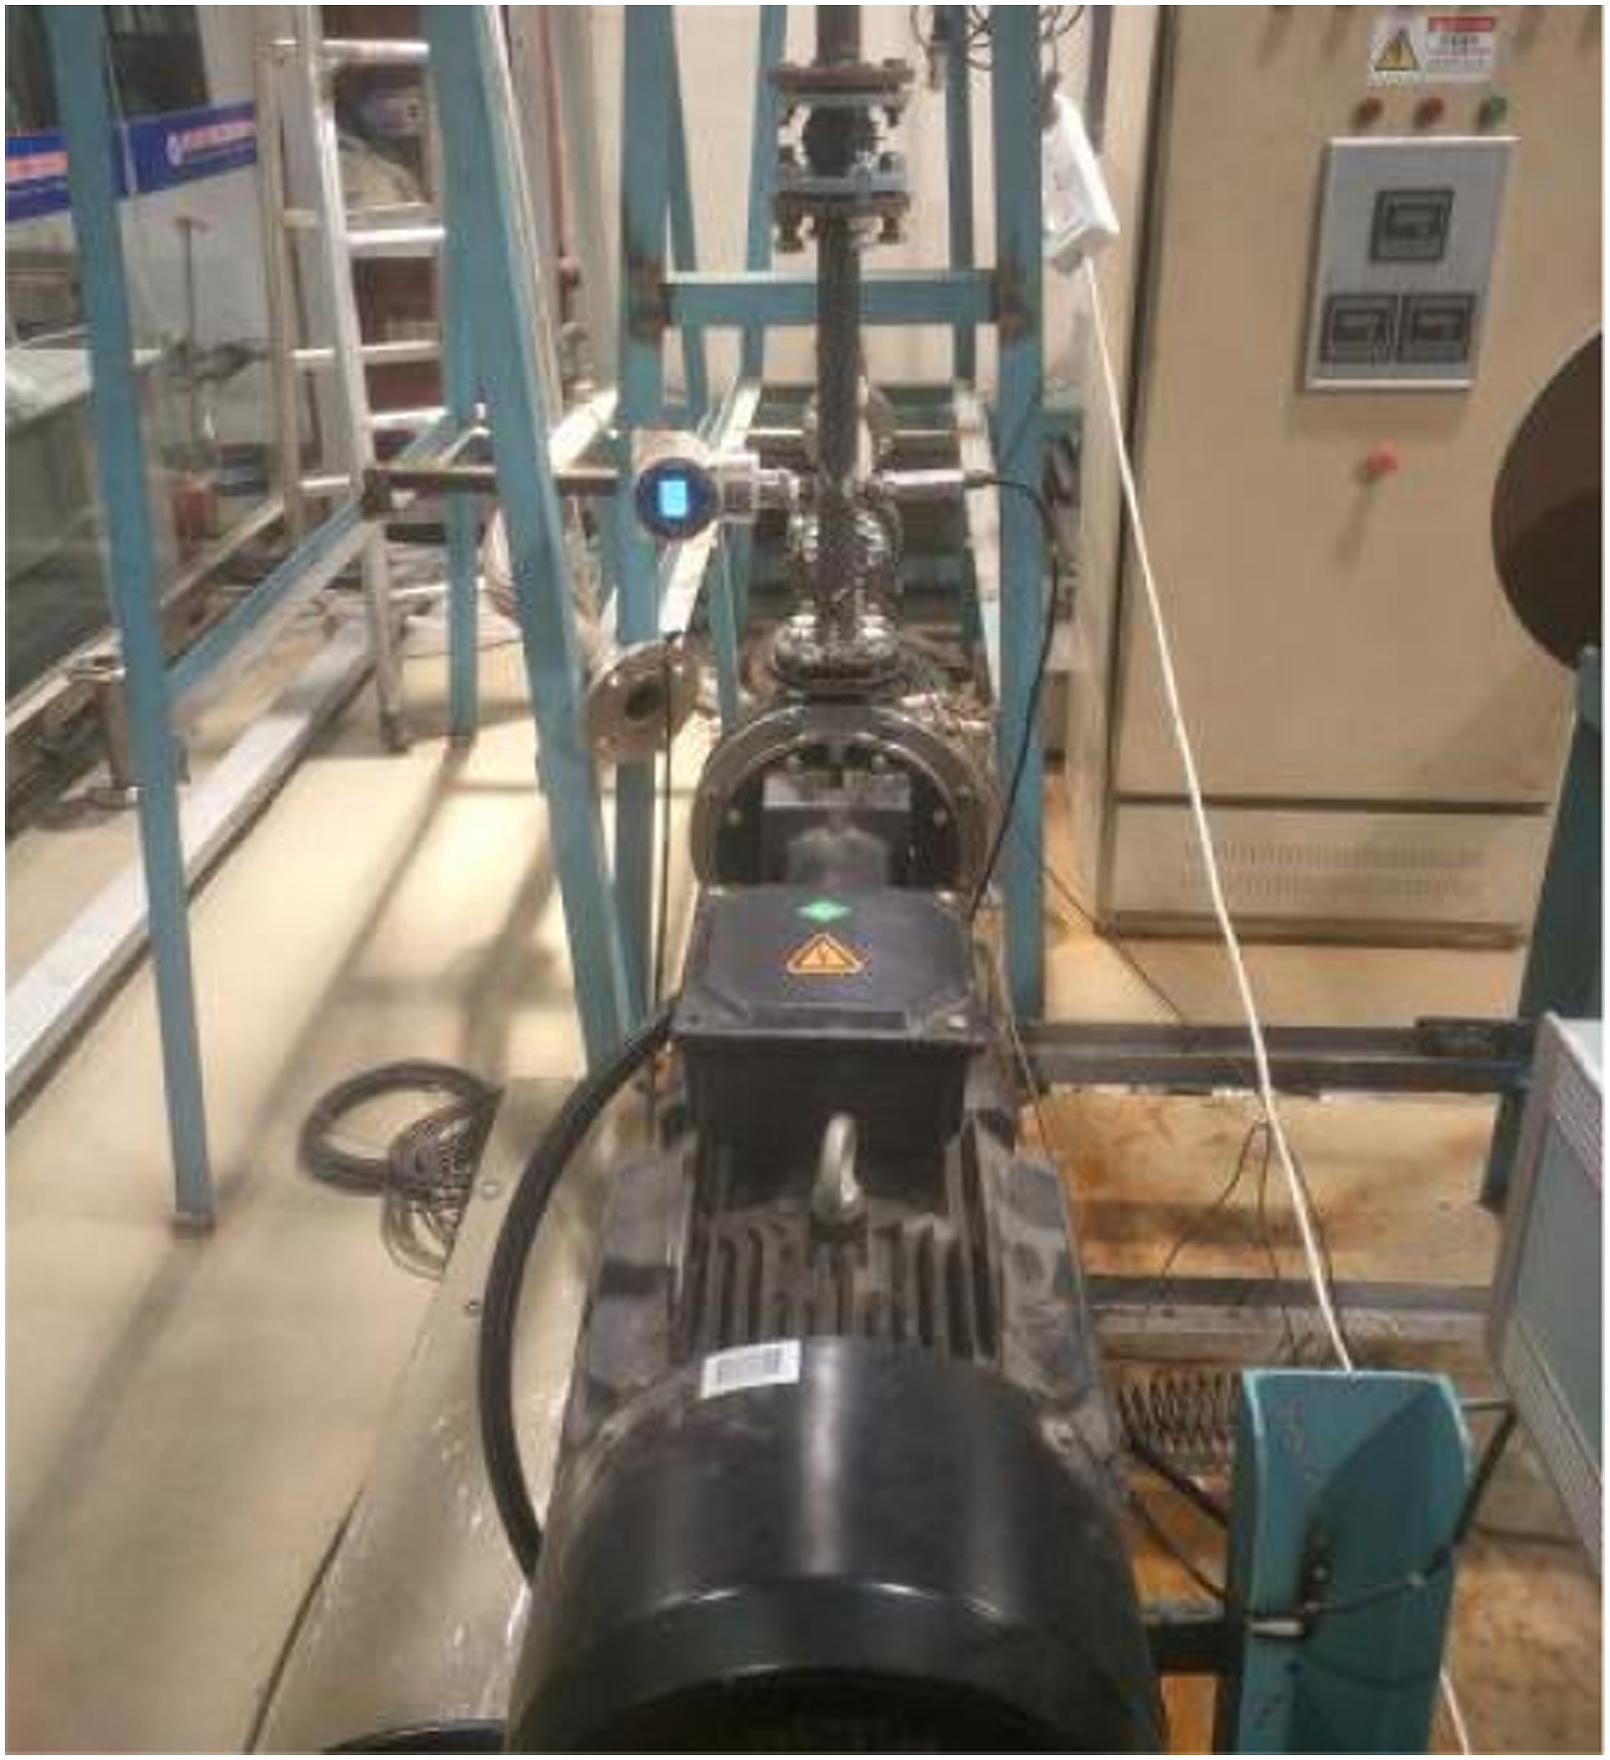
The experiment device is composed of the fire pump, motor, brake valve, inlet pressure sensor, inlet high-frequency pressure sensor, outlet high-frequency pressure sensor, outlet pressure sensor, electromagnetic flowmeter, vent valve, and data acquisition system. The schematic diagram of the fire pump experiment bench is shown in Figure 2, and the physical diagram is shown in Figure 3. The schematic diagram of the fire pump experiment bench. (1. Vacuum pump 2. Water tank 3. Vent valve 4. Gate valve 5. Data acquisition system 6. Electromagnetic flowmeter 7. Inlet pressure sensor 8. Inlet high-frequency pressure sensor 9. Outlet high-frequency pressure sensor 10. The Fire pump 11. Outlet pressure sensor). Experiment bench of the fire pump.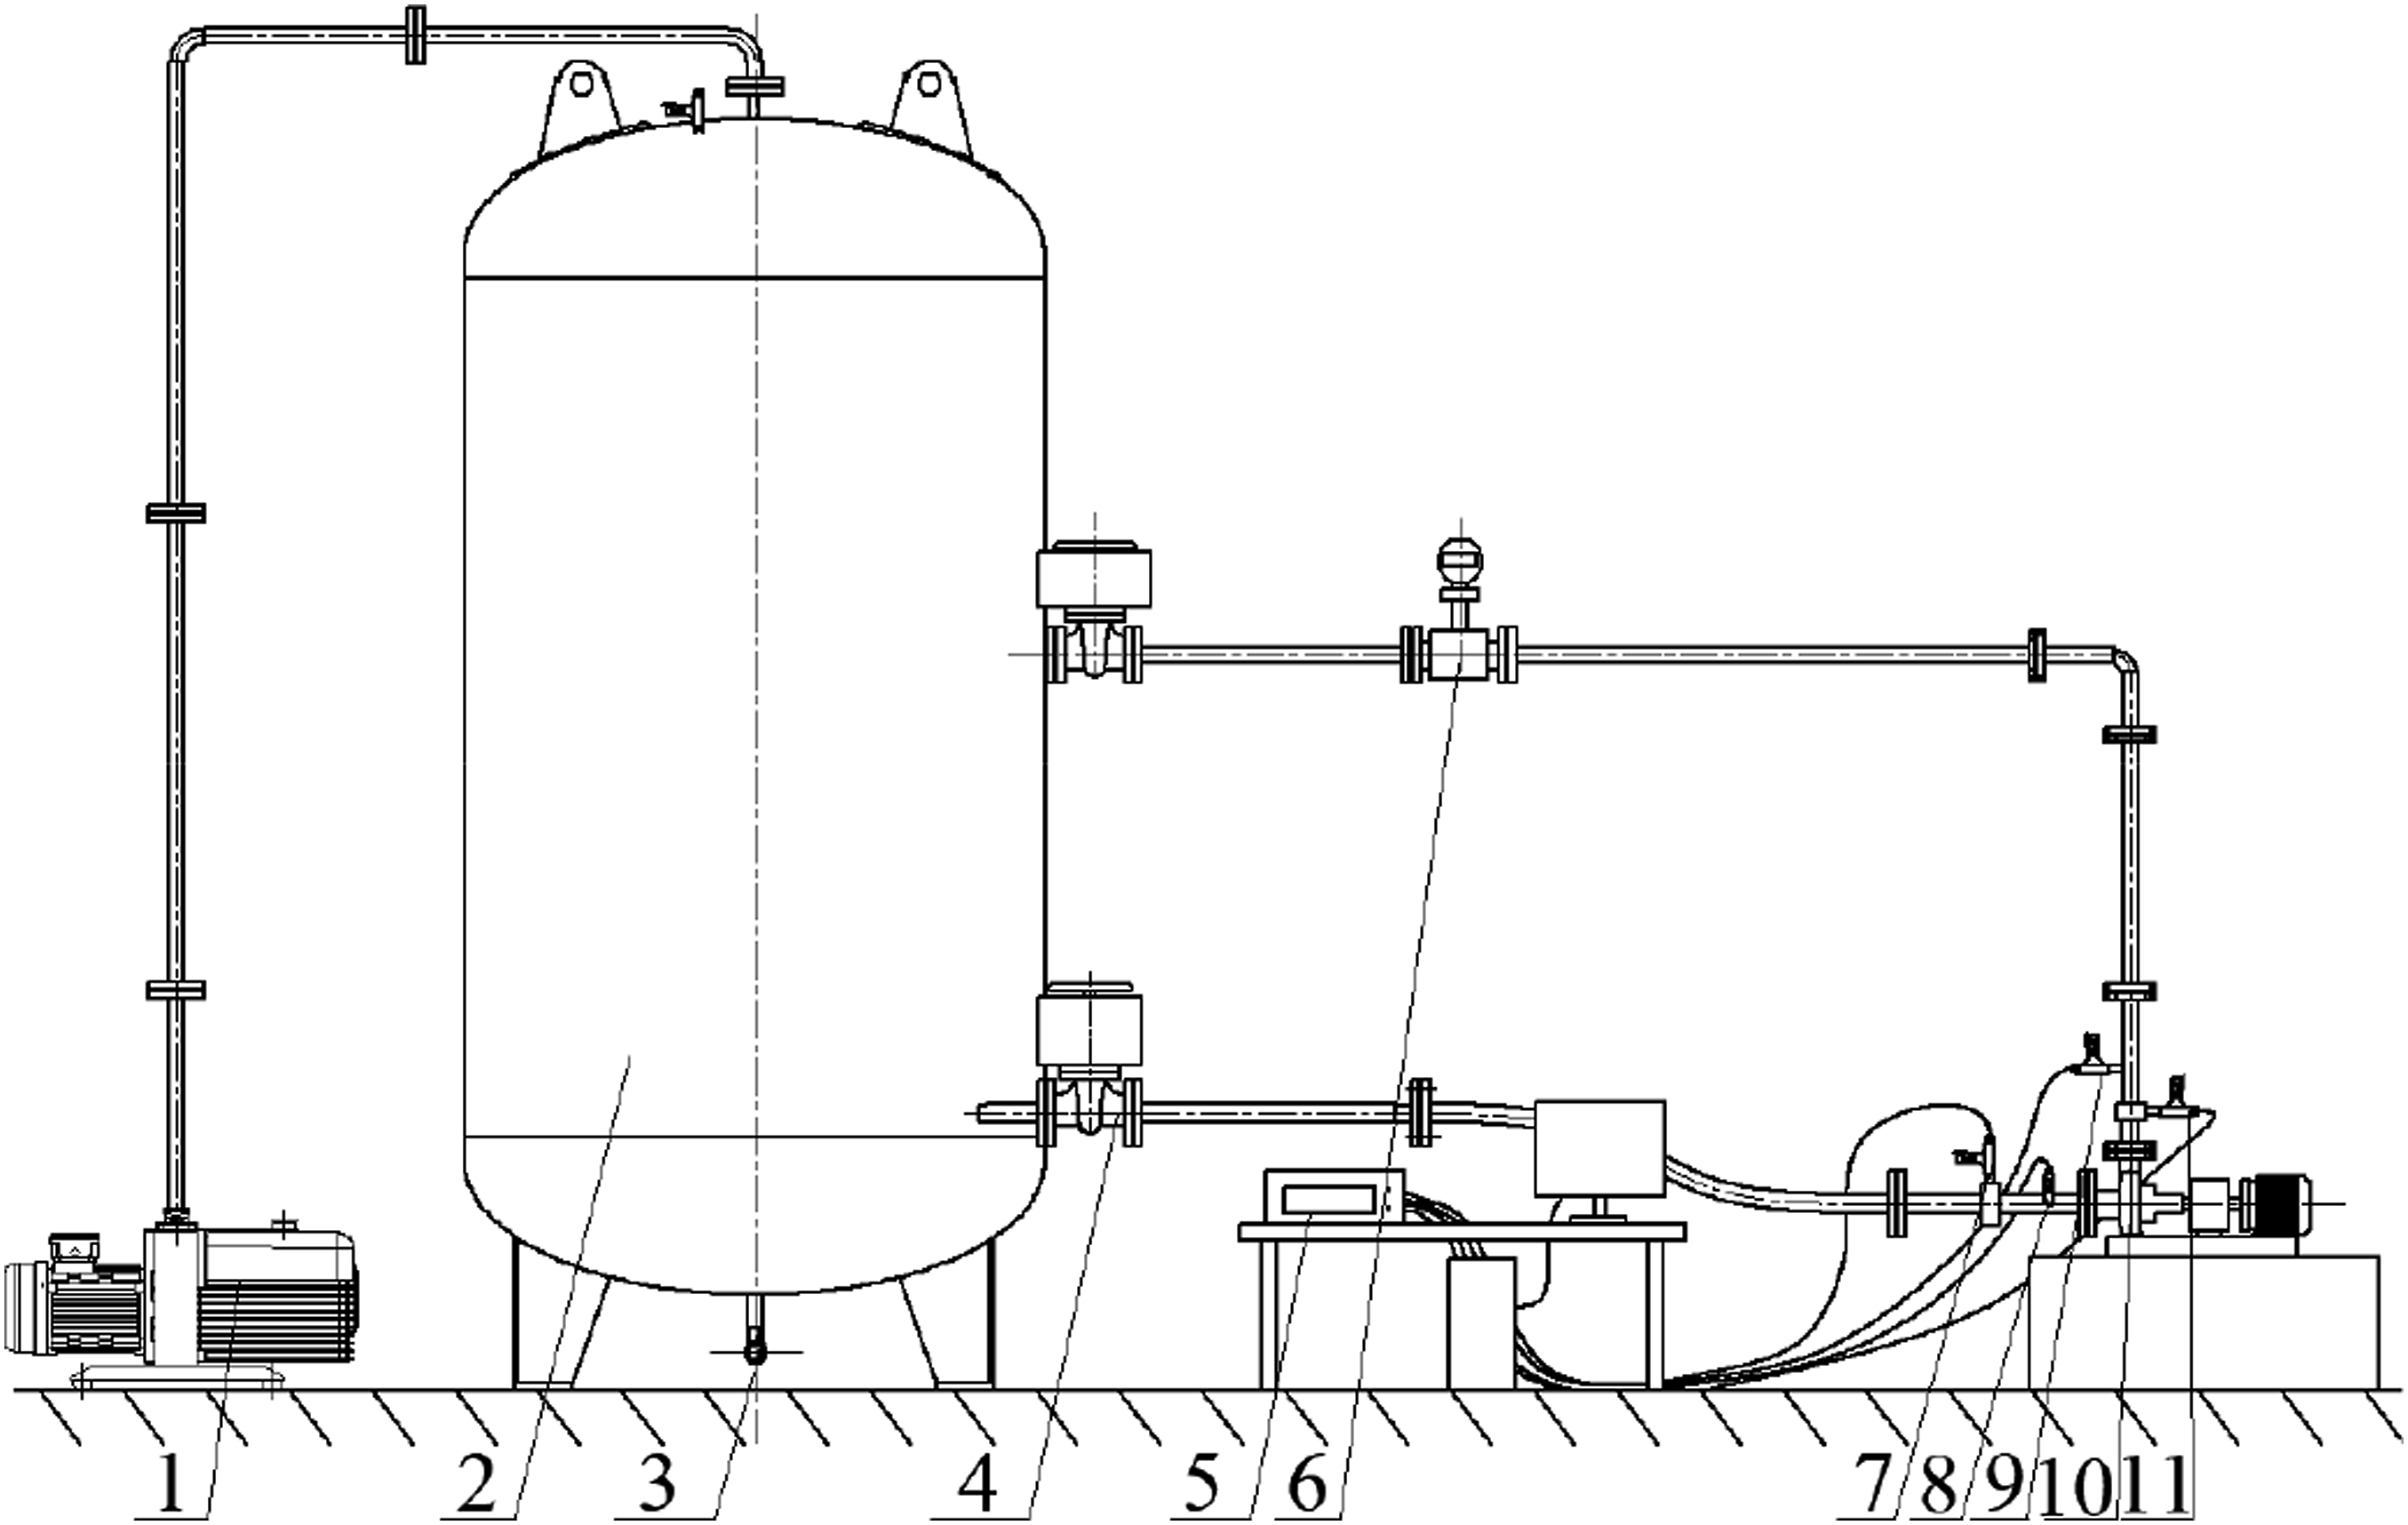
Layout of pressure sensor measuring points
Four pressure sensors were arranged in the inlet and outlet of the fire pump, including two pressure sensors and two high-frequency liquid level sensors. The sensor for measuring fire pump inlet pressure was arranged at 2 times the diameter of the inlet upstream distance flange. Because the outlet pipe diameter is small, the sensor used to measure the outlet pressure of the fire pump was arranged at the outlet downstream 5 times the pipe diameter from the flange. Two high-frequency pressure sensors were respectively arranged at 2.2 and 5 times the pipe diameter of the inlet and outlet flange of the fire pump. The layout of measuring points of the pressure sensor is shown in Figure 4, in which 1 is the outlet high-frequency pressure sensor, 2 is the outlet pressure sensor, 3 is the inlet pressure sensor, and 4 is the inlet high-frequency pressure sensor. The MIK-P300 type pressure sensor was used to measure the inlet pressure of the pump, the MK-3051-CP type intelligent pressure sensor was used to measure the outlet pressure of the pump, and the HY6100 type high-frequency pressure sensors were used to measure the pressure pulsation data of the inlet and outlet of the fire pump, the response frequency of the high-frequency signal is 100 kHz. Measuring point location of the pressure sensors.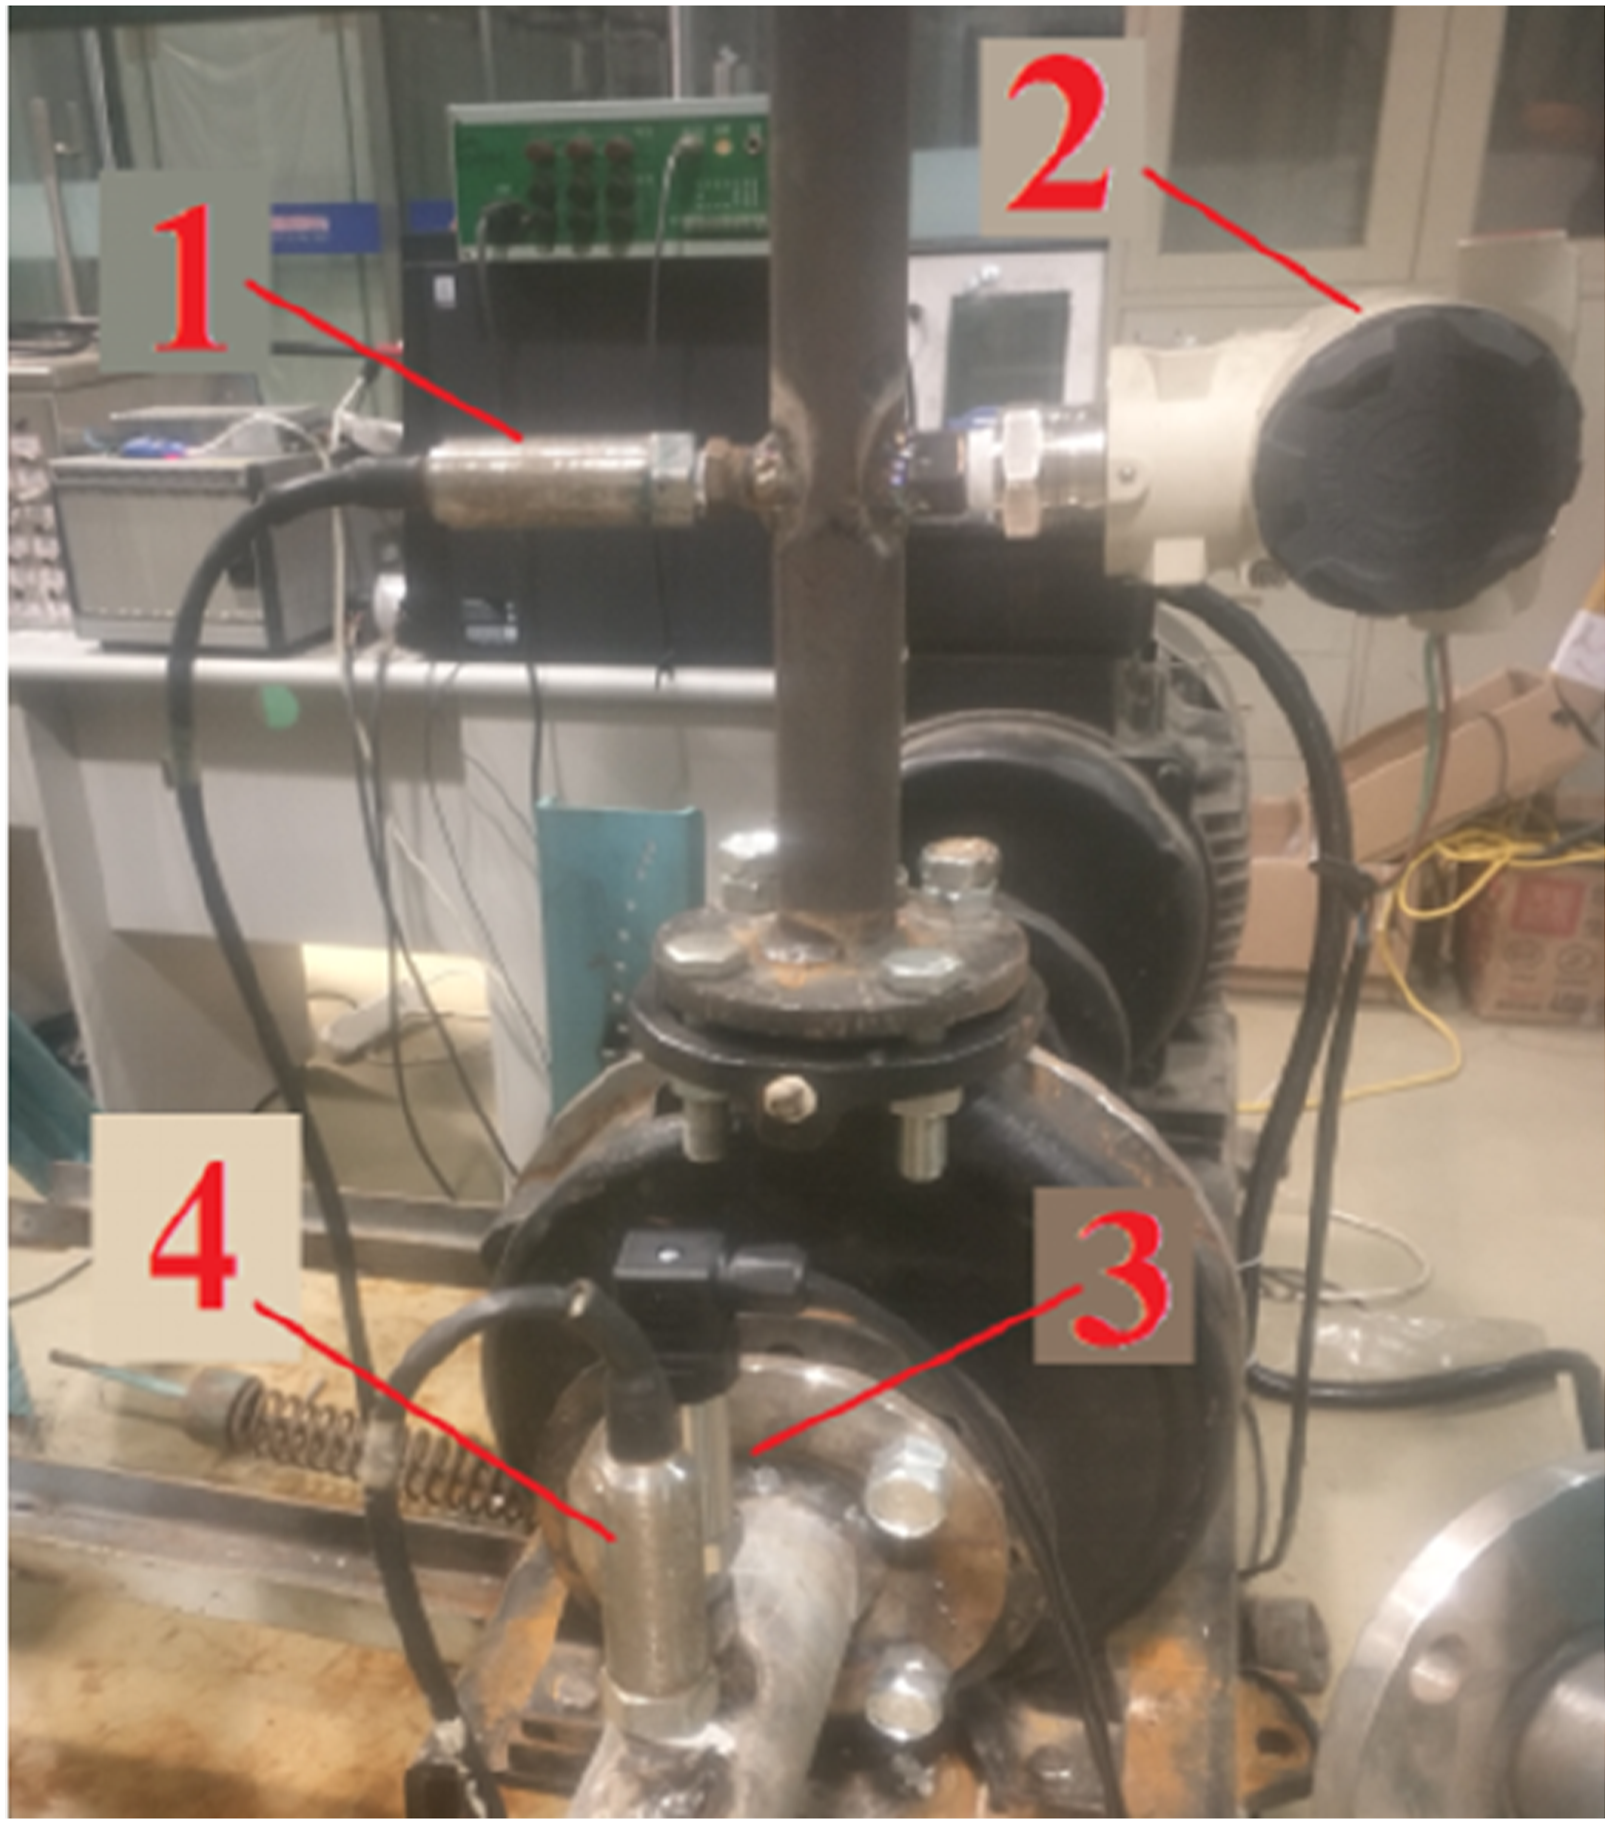
Uncertainty analysis of experiment measurement
Experiment uncertainty analysis
The INV3020 series high-performance 24-bit sampling instrument was used to collect the pressure data of the fire pump. The test starts from the large flow condition. The opening of the outlet valve was gradually reduced. After the valve was adjusted for 2 min, the data was collected when the fire pump runs stably. Each set of data results contains 30 s of pressure information, and each flow point was repeatedly collected 5 times.
Error is an existing item that is difficult to eliminate in the experiment. Due to factors such as instruments and measurement methods, the results of each data acquisition system deviate from the actual results of the experiment, which constitutes the uncertainty of the experiment measurement. To obtain accurate experimental data and ensure the experimental data’s effectiveness, the experiment results’ uncertainty was analyzed.
Random uncertainty

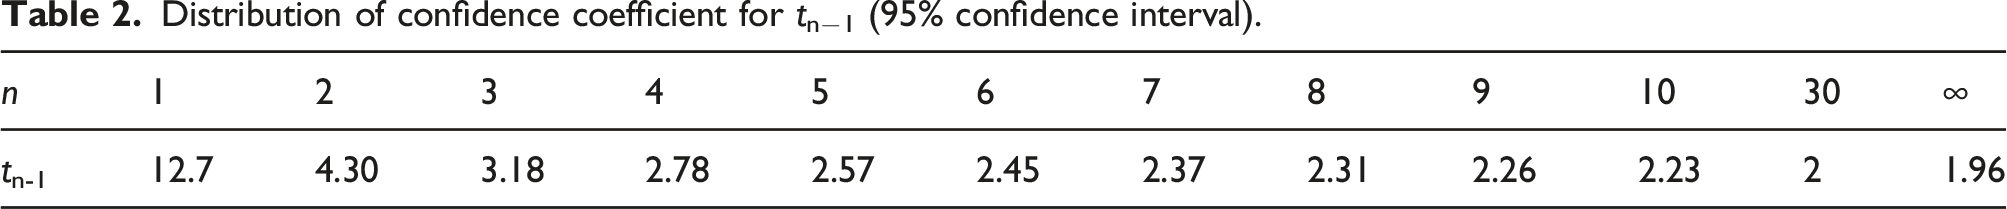
Distribution of confidence coefficient for tn−1 (95% confidence interval).
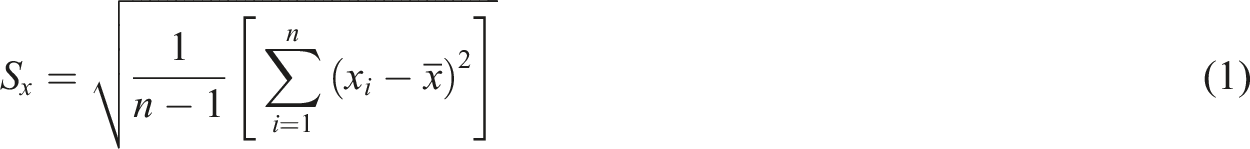
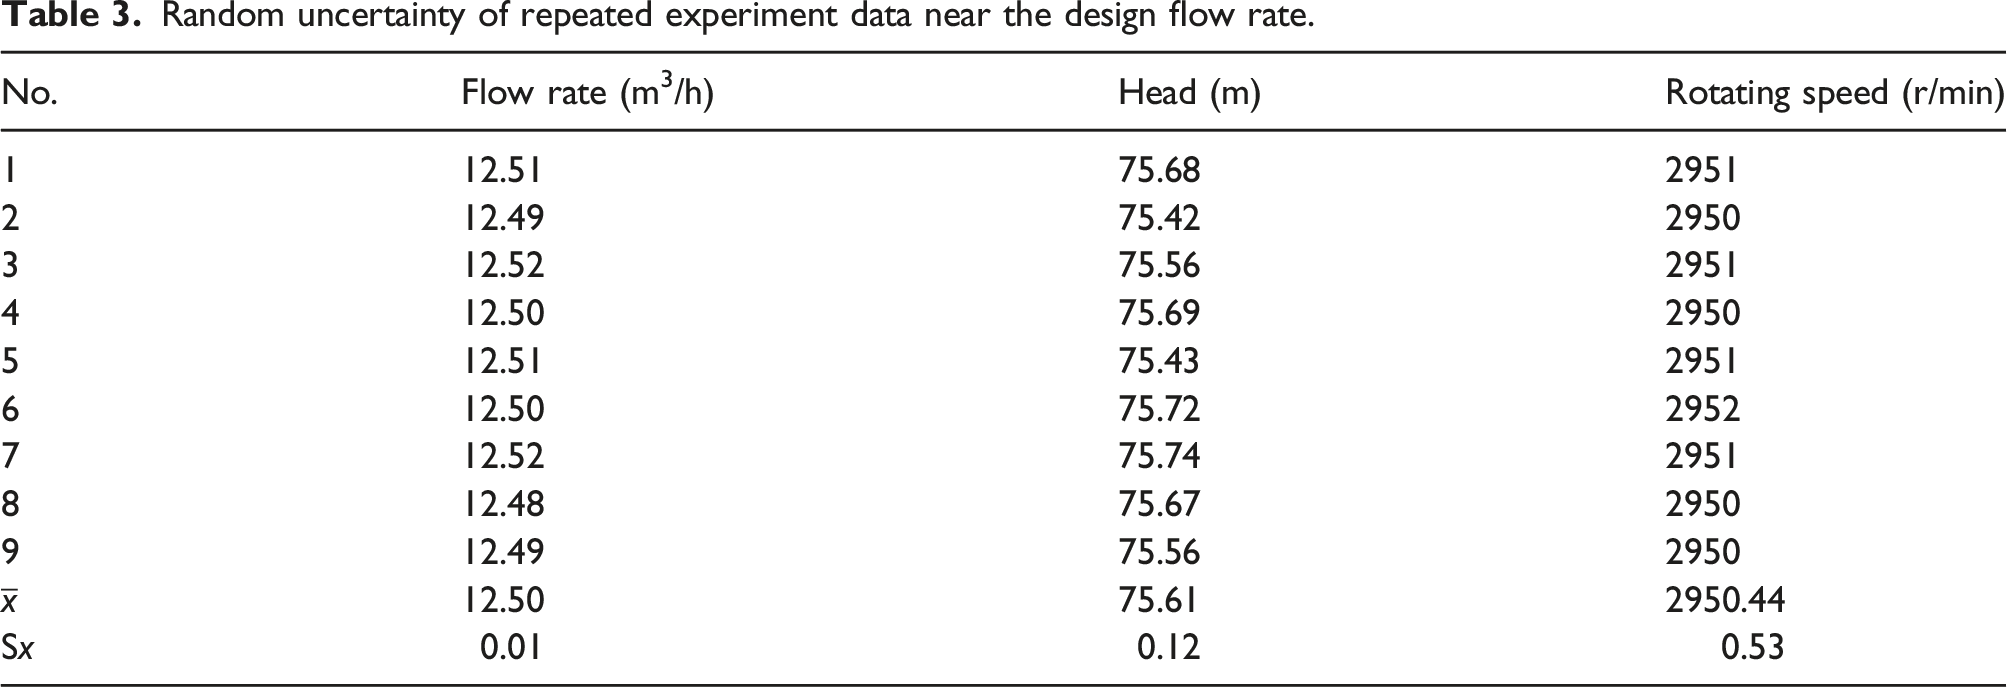
To calculate the random uncertainty in the experiment, 9 groups of repeated experiments in the fire pump were carried out, and the standard deviations of flow rate, head, and rotating speed of the fire pump were calculated by equation (1).
Random uncertainty of repeated experiment data near the design flow rate.
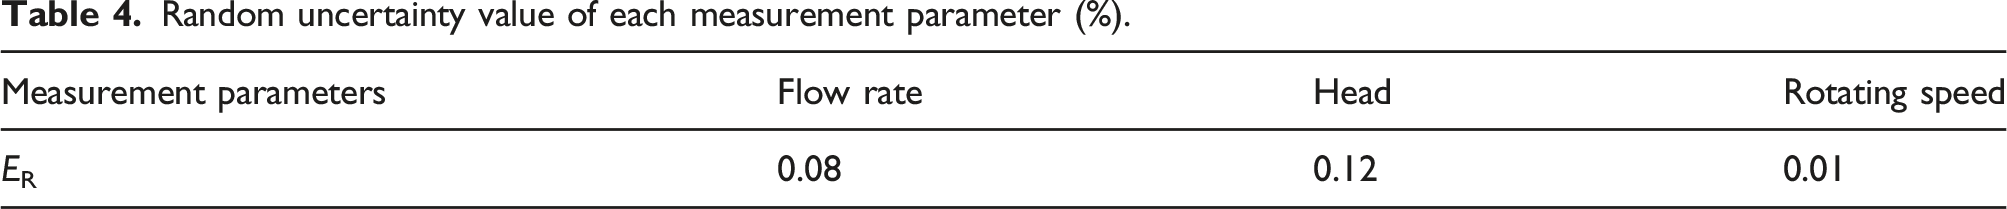
Random uncertainty value of each measurement parameter (%).
System uncertainty

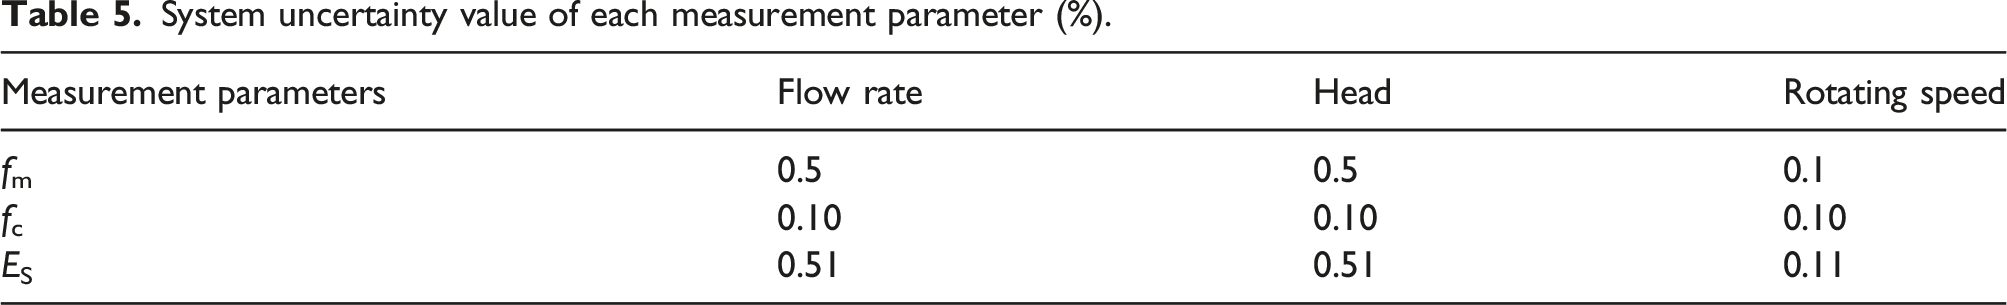
System uncertainty value of each measurement parameter (%).
Comprehensive uncertainty
The calculation formula of comprehensive uncertainty 
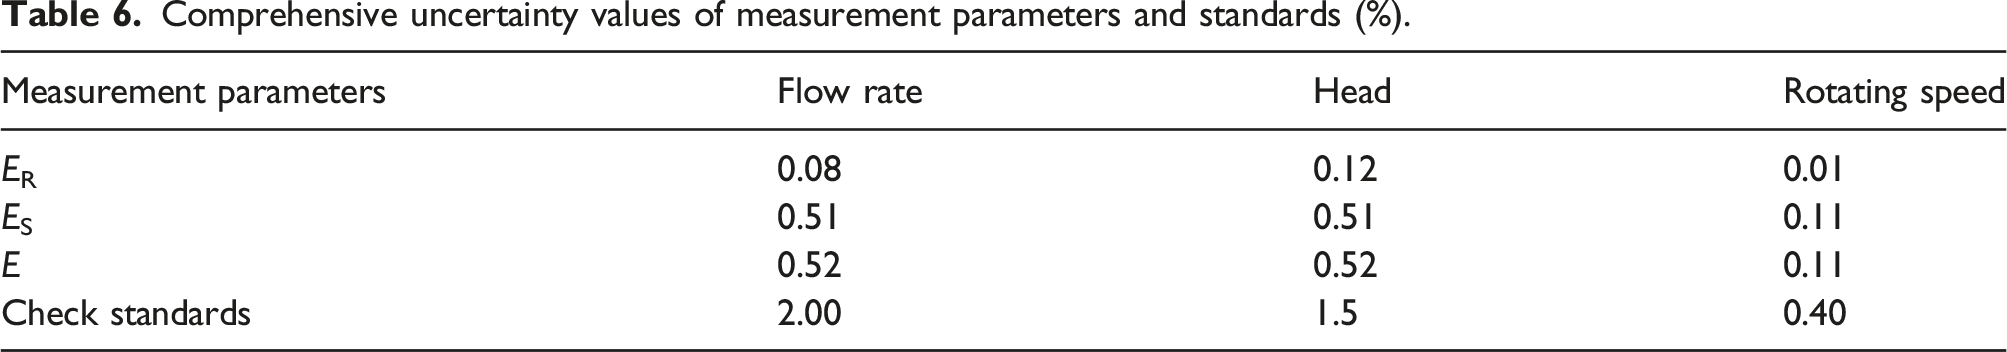
The comprehensive uncertainty values of various measurement parameters and standards are shown in Table 5.
Comprehensive uncertainty values of measurement parameters and standards (%).
Experimental results and analysis
External characteristic analysis
Figure 5 shows the external characteristic curve of the fire pump. It can be seen from Figure 5 that the experiment value of the head in the fire pump under the design flow rate was 75.68 m, the head of the fire pump under zero flow rate was 74.02 m and the head of the fire pump under 1.5 Qd was 74.82 m. The efficiency curve of the fire pump shows a continuous upward trend. The efficiency of the fire pump under 1.0 Qd was 36.84%. The external characteristic curve of the fire pump.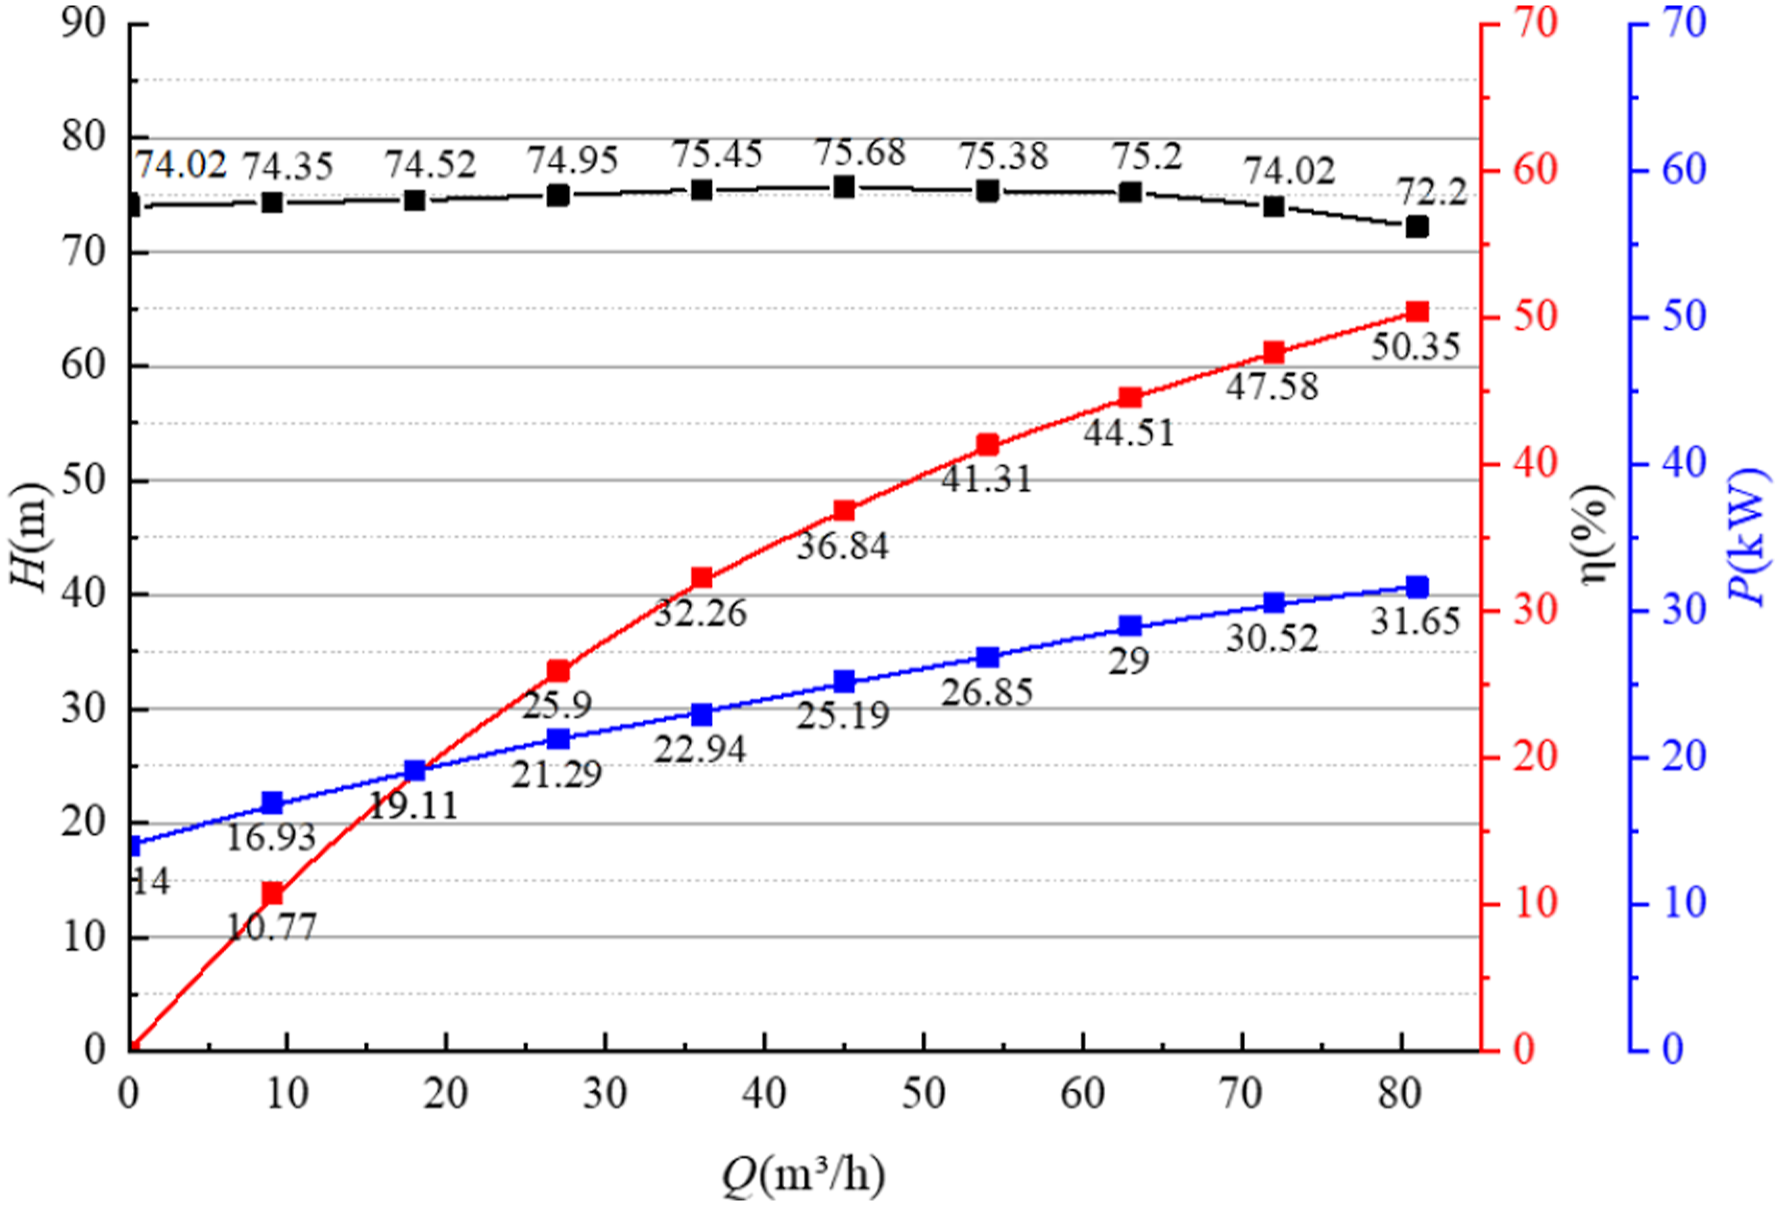
Pressure pulsation analysis
The instability of the fire pump can be analyzed by extracting the pressure pulsation data of the fire pump inlet and outlet pipes. The pressure fluctuation information in a cycle under each flow rate was selected for analysis.
To compare the pressure pulsations of the fire pump at different flow rates more intuitively, the pressure pulsation coefficient Cp17,18 was introduced to measure the magnitude of the pressure pulsations as follows
Figure 6 shows the time-domain distribution of the pressure pulsation coefficient in the outlet of the fire pump under different flow rates. It can be seen from Figure 6 that there are 6 main peaks and troughs in the pressure pulsation coefficient at the outlet of the fire pump. Time-domain distribution of pressure pulsation in the outlet of the fire pump.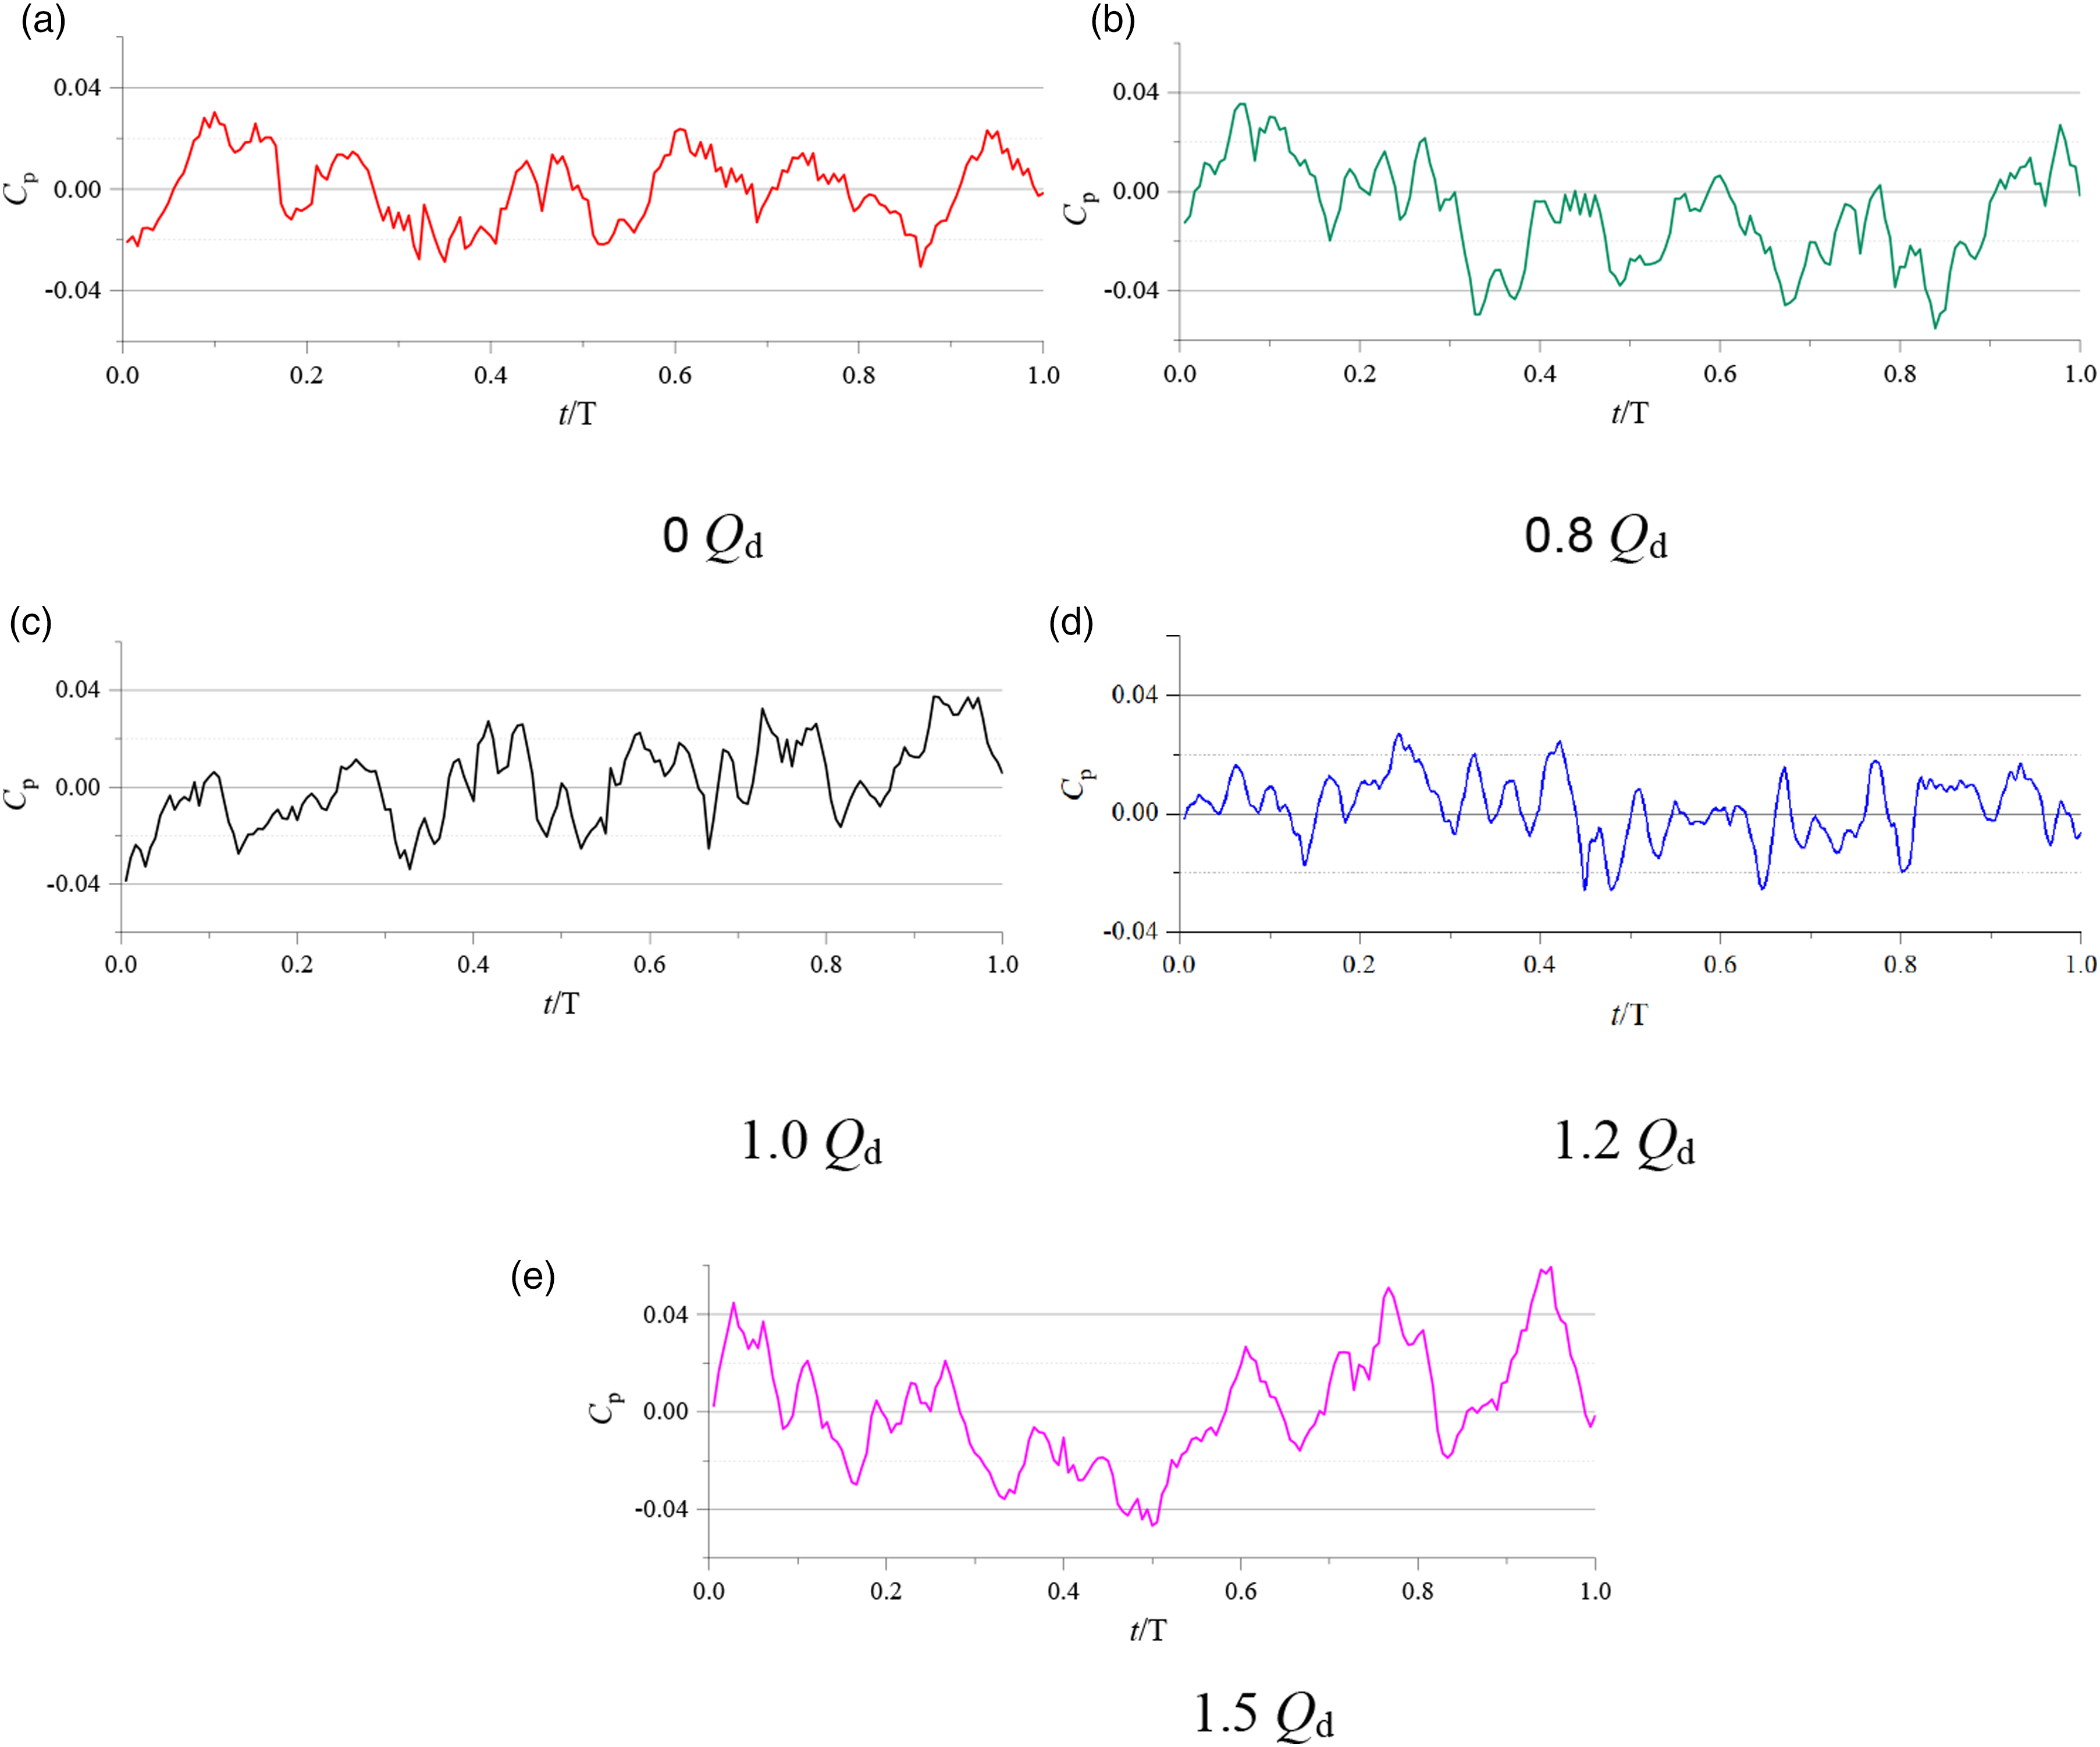
Under zero flow rate, the peak distribution at the outlet of the fire pump is more regular and obvious than other flow rates. With an increase in the flow rate, the time-domain distribution of the pressure pulsation coefficient becomes more and more disordered, and the smaller peak is more obvious. It can be considered that the pressure pulsation at the outlet of the fire pump is mainly affected by rotor-stator interaction, 19 as well as other factors including fluid impact, and this influence will be more obvious with an increase in the flow rate. By comparing the pressure fluctuation coefficient under different flow rates, it can be seen that the maximum drop of pressure fluctuation coefficient at the outlet of the fire pump is 0.071, 0.091, 0.076, 0.066, and 0.106 respectively. Under the design flow rate, it accounts for 5.94% of the head in the fire pump.
Figure 7 shows the time-domain distribution of the pressure pulsation coefficient at the inlet of the fire pump under different flow rates. Compared with the time-domain distribution of the pressure pulsation coefficient at the outlet, it can be seen that the pressure pulsation coefficient at the inlet of the fire pump presents two or three obvious fluctuations in a cycle, but there is no obvious distribution law related to the number of the blades of the impeller. At the same time, under the flow rate of 0 Qd to 1.2 Qd, the drop of the pressure pulsation coefficient in the inlet of the fire pump was about 0.029, which is more stable, regular, and periodic than that at the outlet. When the flow rate increases to 1.5 Qd, the inlet pressure pulsation remains below the negative pressure, and the maximum drop of the pressure pulsation coefficient was reduced to about 0.016. It can be considered that an increase in flow rate will improve the flow pattern of the impeller inlet to a certain extent. Time-domain distribution of pressure pulsation in the inlet of the fire pump.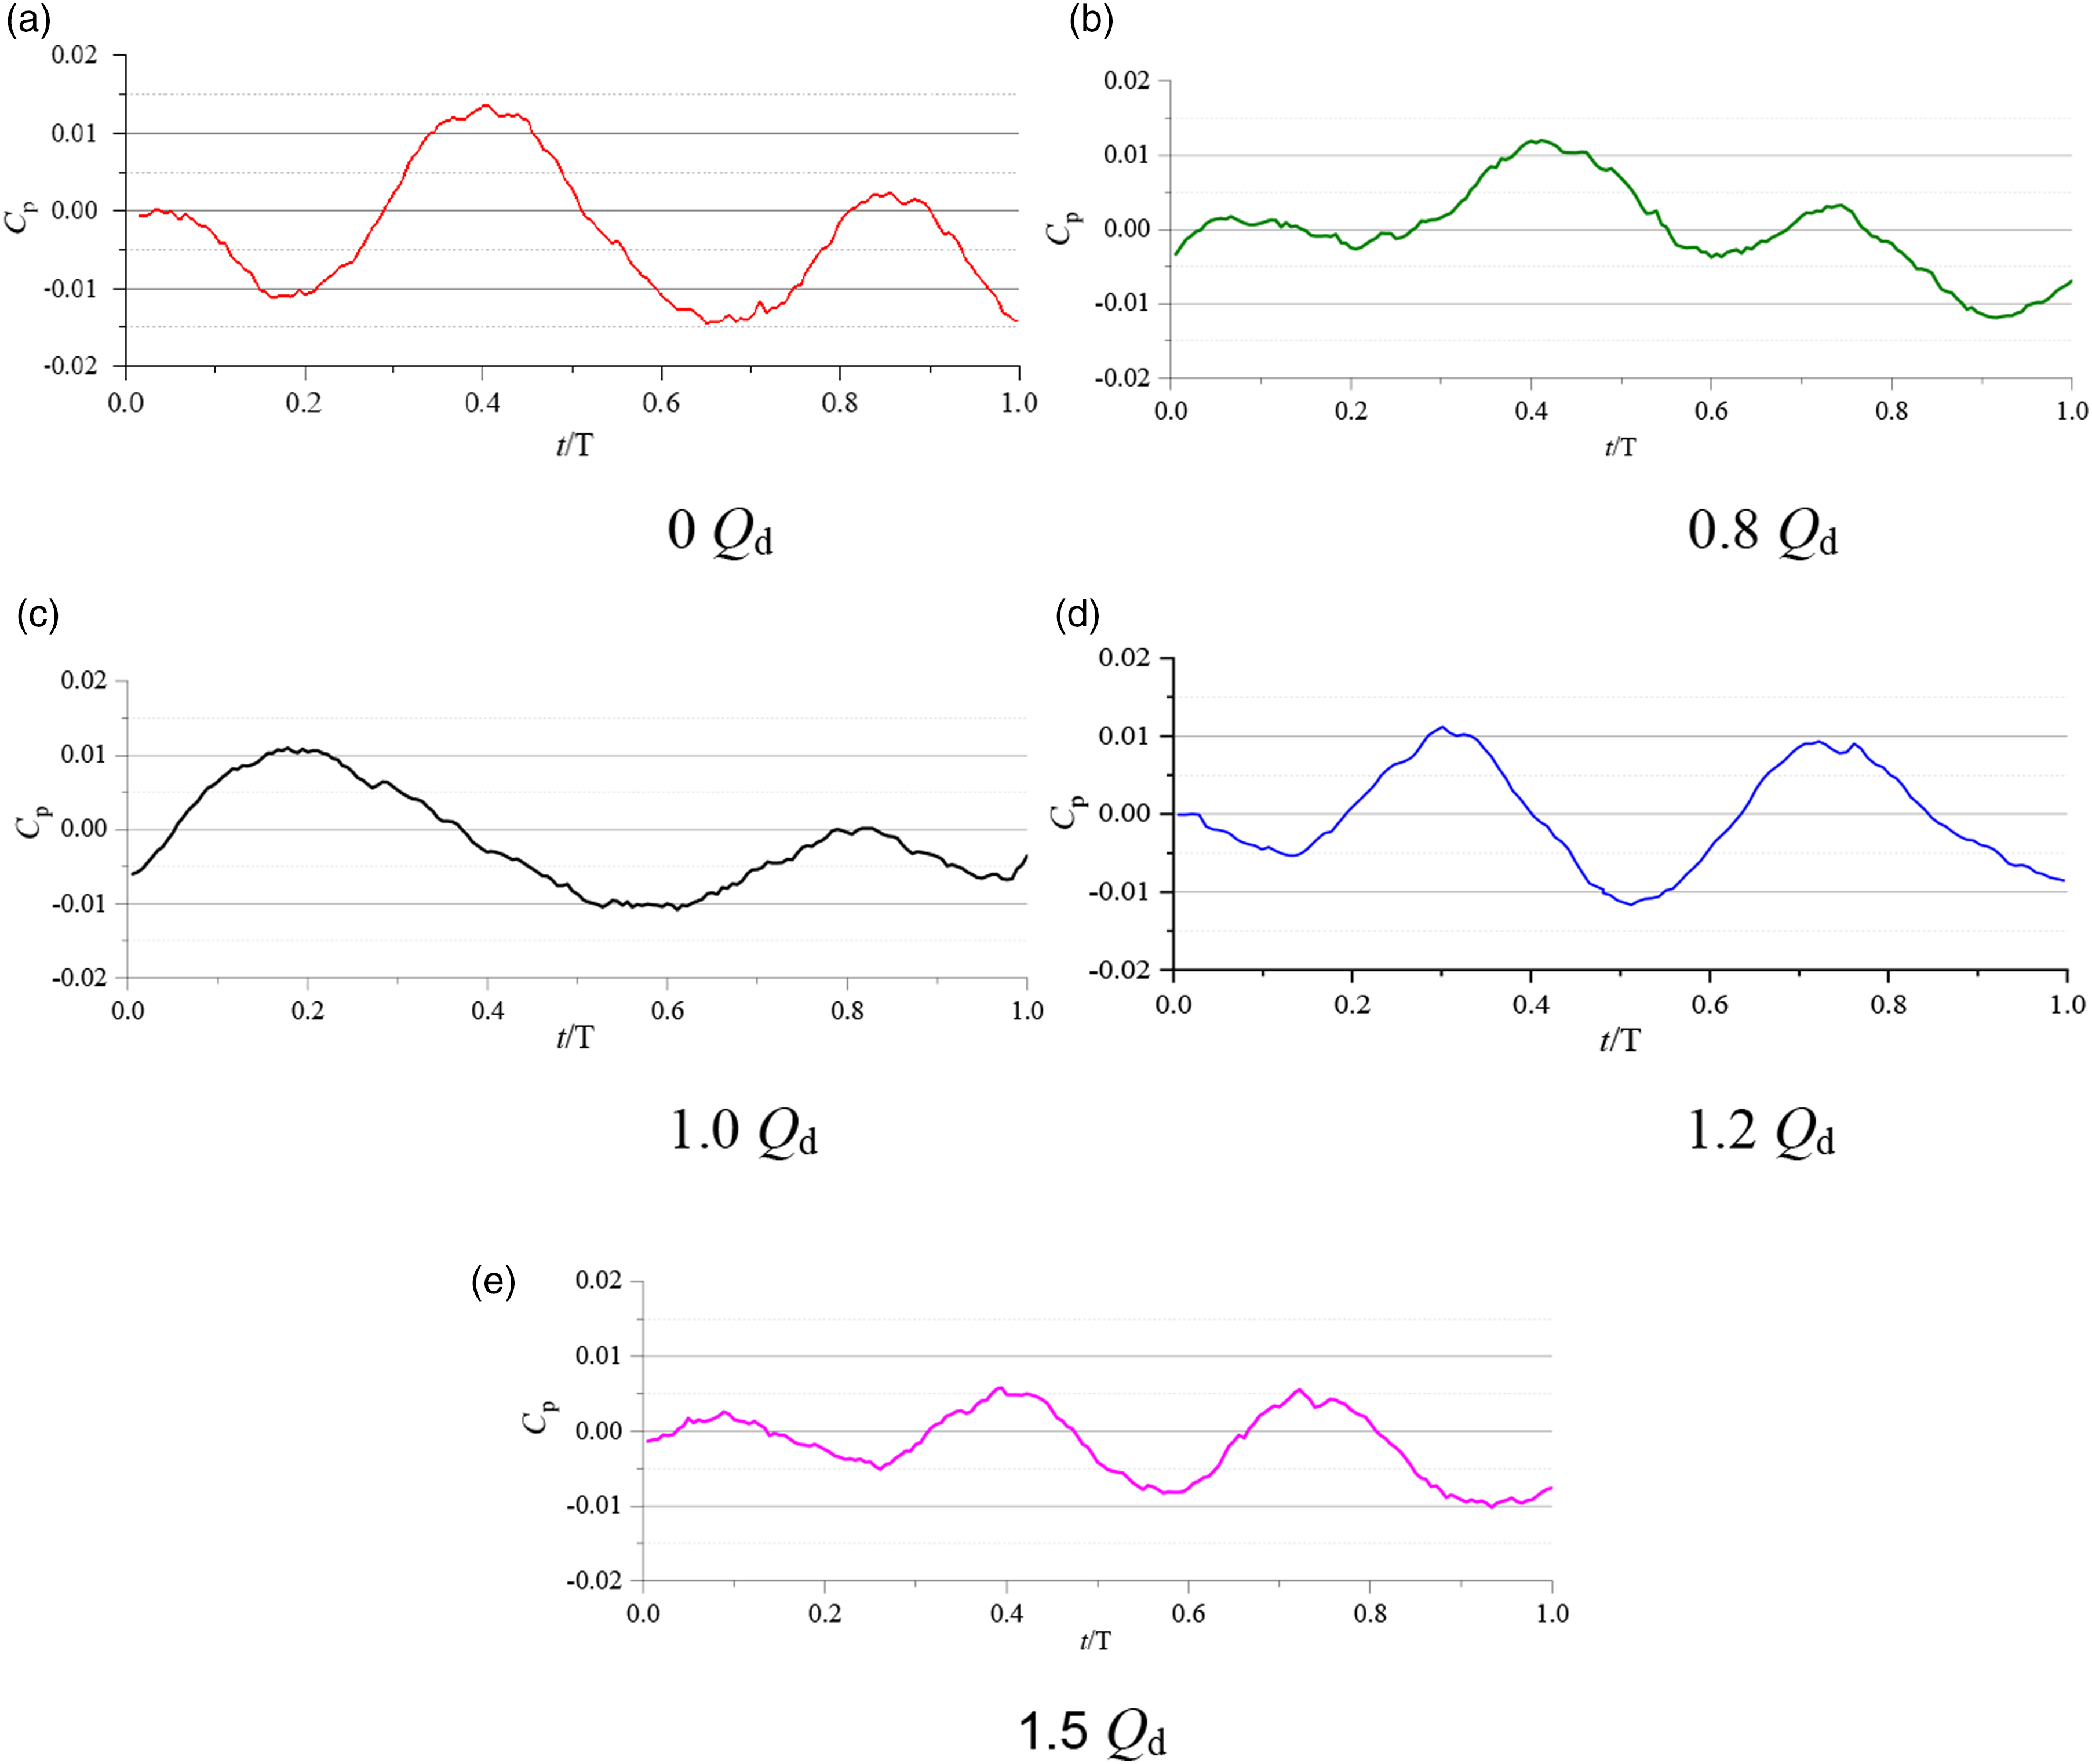
Figure 8 shows the frequency domain distribution of the pressure pulsation coefficient at the inlet and outlet of the fire pump under different flow rates. It can be seen from Figure 8(a) that the frequency domain of pressure pulsation at the inlet of the fire pump is mainly distributed in the range of 0–200 Hz, the dominant frequency and secondary frequency of the spectrum appear at 1 APF and 2 APF, respectively, and the peaks at 1 APF and 2 APF are much higher than other frequencies. In addition to the dominant and secondary frequencies, n times harmonic frequencies with 1 APF as the fundamental frequency is also distributed in the spectrum, but the harmonic frequencies were less and almost disappears after 4 APF. The comparison of the peak at 1 BPF shows that only the 0 Qd has insignificant peak distribution at 1 BPF, while other flow rates have almost no peak at 1 BPF. The calculation formulas of axial passing frequency and blade passing frequency were given as follows Frequency domain distribution of pressure pulsation in the inlet and outlet of the fire pump.

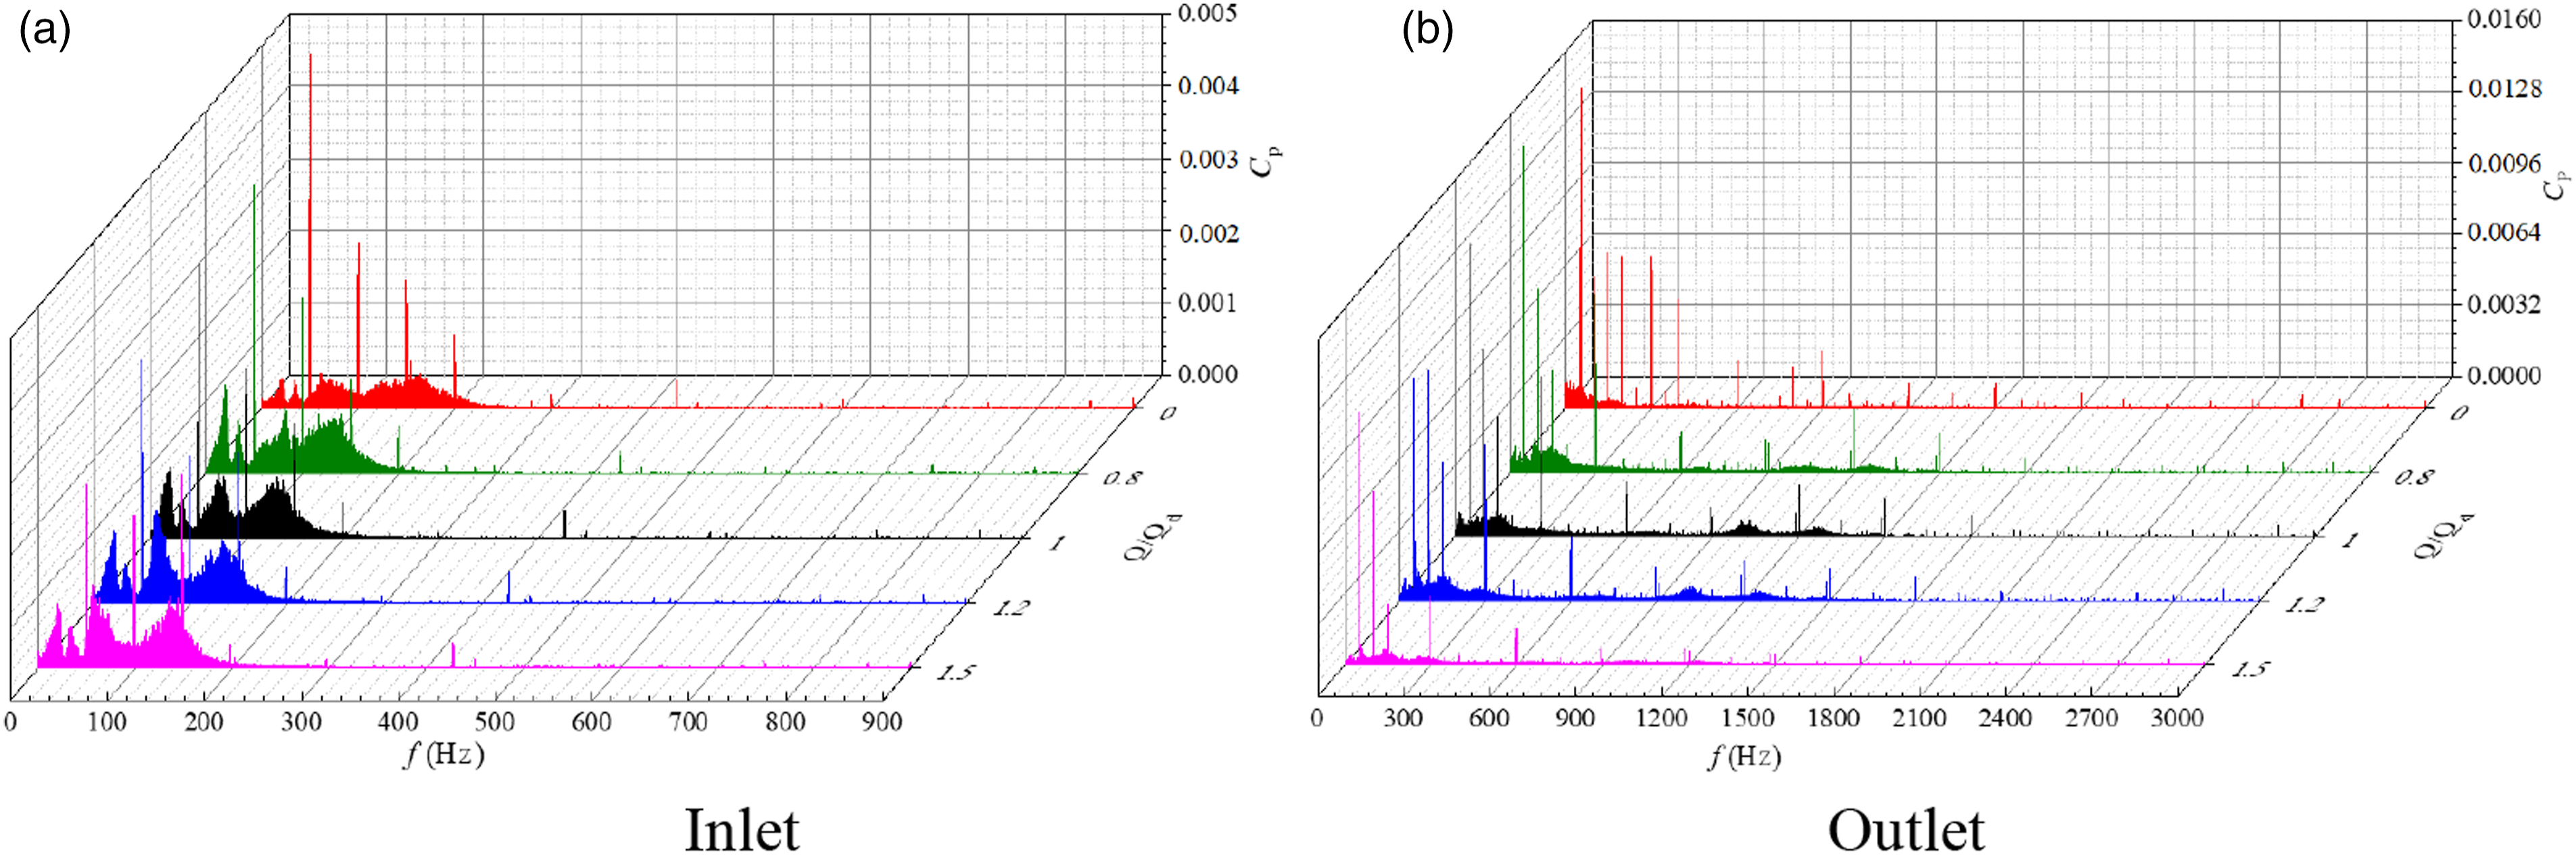
As can be seen from Figure 8(b), the dominant frequency of pressure pulsation at the outlet of the fire pump also appears at 1APF, but the secondary frequency appears at 1BPF, and n times harmonic frequency with 1BPF as the fundamental frequency is distributed in the spectrum, with relatively more harmonic frequencies. The reason for the APF of the experiment value is more likely to be that the outlet of the fire pump is affected by the vibration of the motor and pipeline.
Comparing the frequency domain peaks of the pressure pulsation coefficient in the inlet and outlet of the fire pump, it can be seen that the peak pressure pulsation at the inlet and outlet monitoring points changes with the flow rate in the same pattern, both showing a decreased with the increase of the flow rate. Especially at the inlet of the fire pump, the peak value of the dominant frequency decreases significantly with the increase in flow rate, while the decrease of the peak value of the dominant frequency at the outlet of the fire pump is relatively small.
Cavitation characteristic analysis

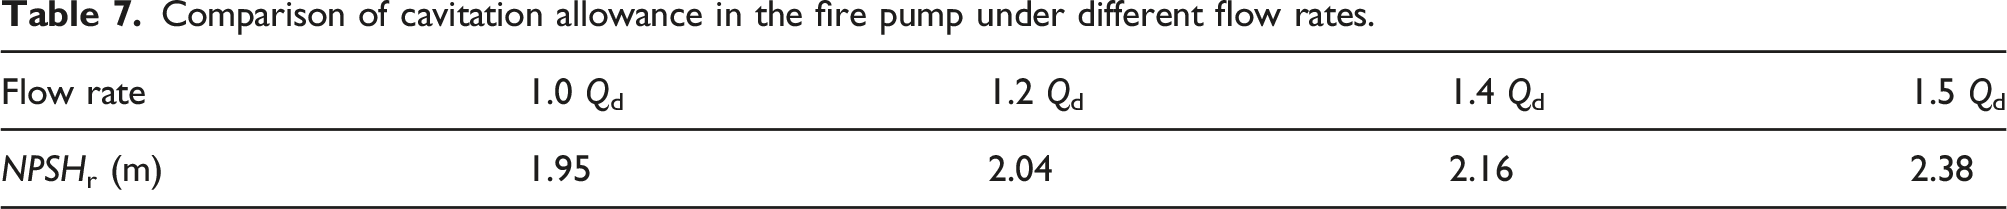
Comparison of cavitation allowance in the fire pump under different flow rates.
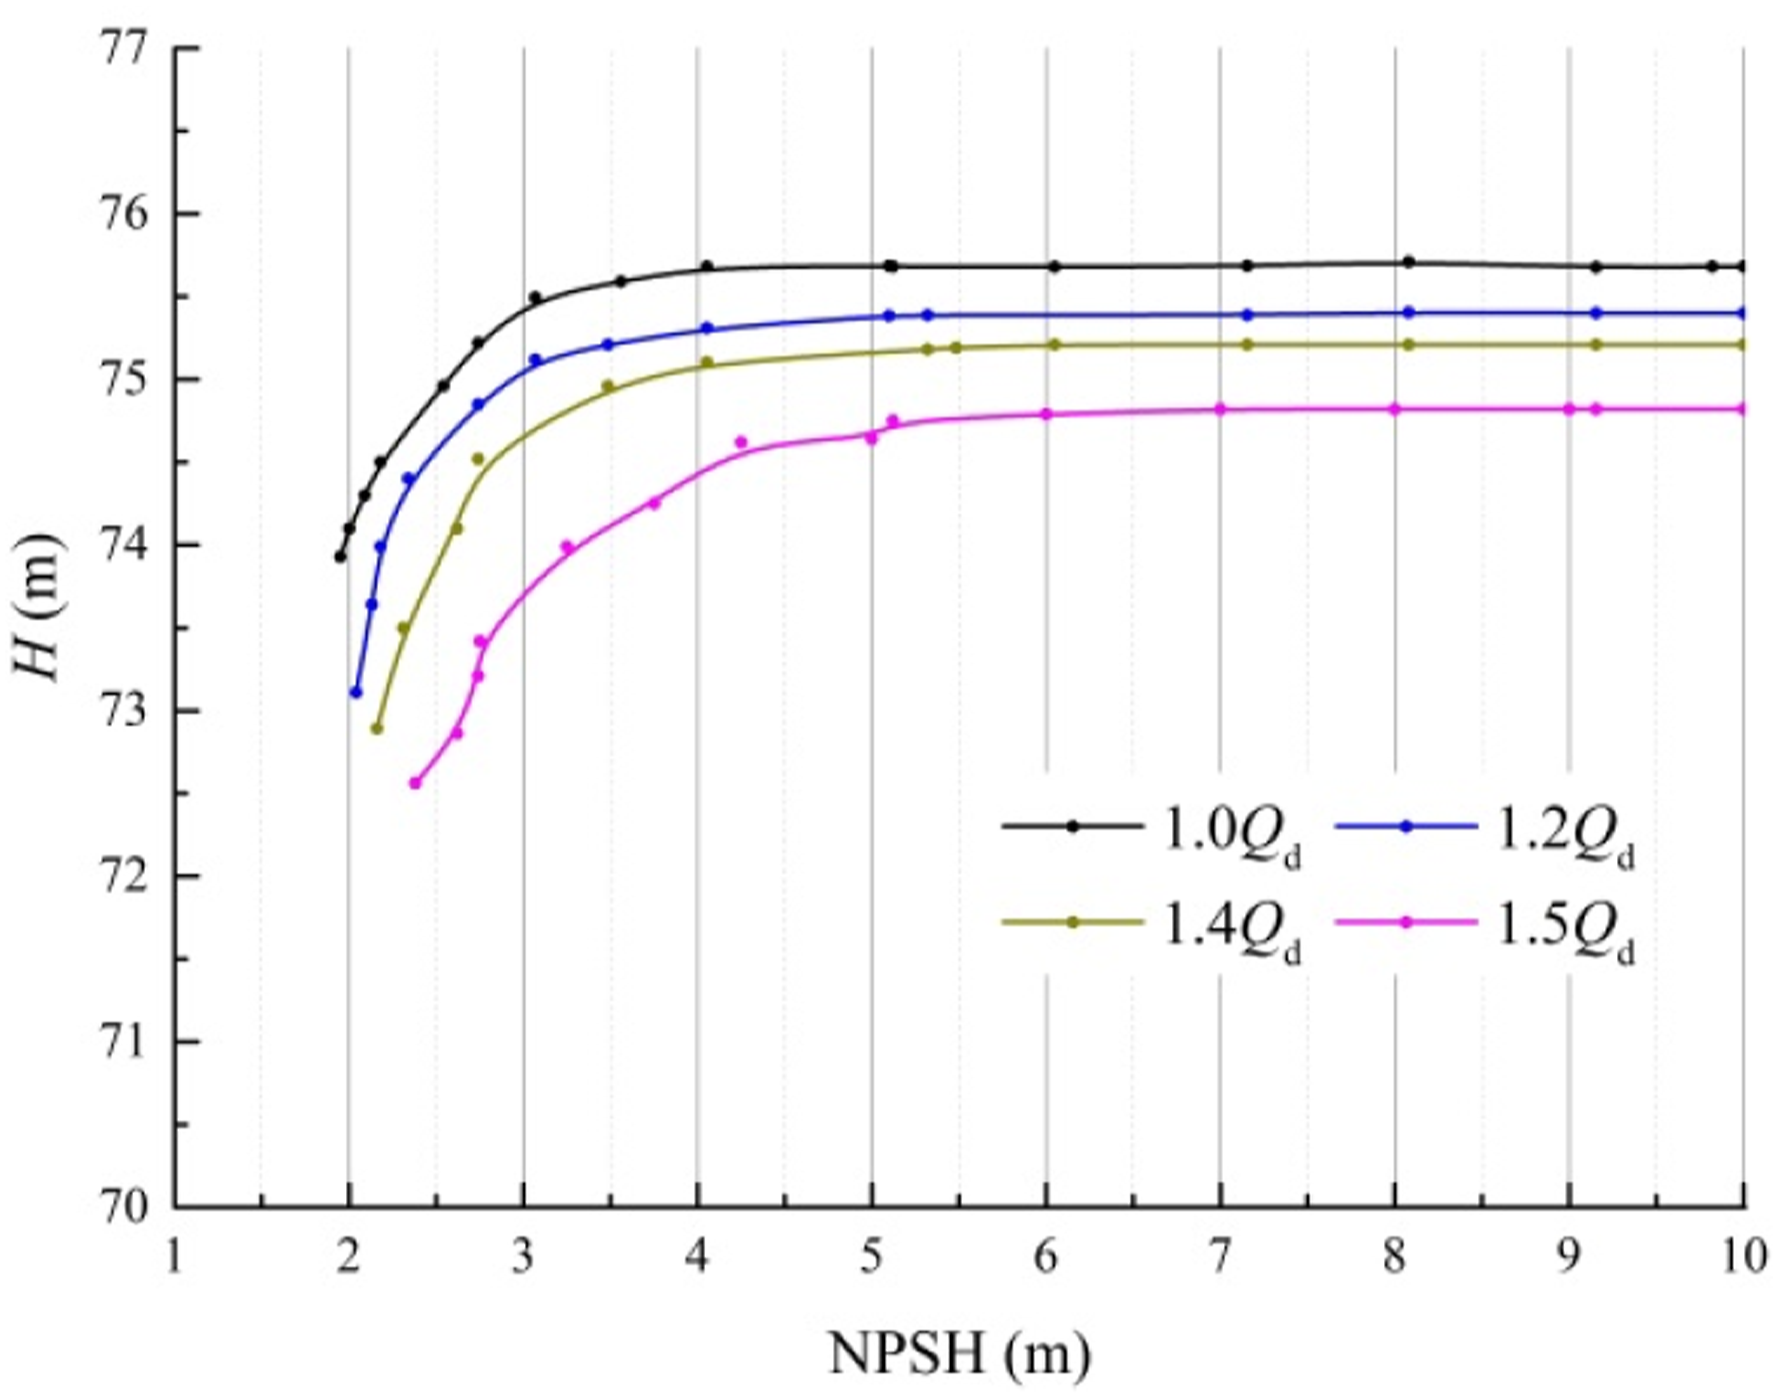
The cavitation performance curves of the fire pump.
As seen from Figure 9, the head curves of the fire pump under different flow rates remain unchanged when the inlet pressure begins to decrease, when the head under the 1.5 Qd shows a decreasing trend when NPSHa is further reduced to 6 m. The heads of 1.4 Qd and 1.2 Qd started to decrease at NPSHa = 5.48 m and NPSHa = 5.12 m respectively, and the heads of 1.0 Qd conditions started to decrease at NPSHa = 4 m. When the NPSH continues to decrease to 2.38 m, the head under 1.5 Qd is the first to decrease by 3%. The NPSHr of the fire pump under 1.5 Qd is 2.38 m. Under 1.4 Qd, when the NPSH of the pump is 2.16 m, the head curve is reduced to 3%. So NPSHr of the pump under 1.4 Qd is 2.16 m. The NPSHr of the pump under 1.2 Qd and 1.0 Qd are 2.04 m and 1.95 m, respectively.
Conclusions
The inlet and outlet pressure pulsation and the cavitation performance of a low specific speed centrifugal fire pump under different flow rates were measured experimentally, and the variation of inlet and outlet pressure pulsation and cavitation performance under different flow rates were analyzed. 1. The performance experiment results show that the head of the fire pump is 74.02 m, 75.68 m, and 74.82 m respectively under 0 Qd, 1.0 Qd, and 1.5 Qd. Under 1.0 Qd, the efficiency of the fire pump is 36.84%. 2. The dominant frequency of pressure pulsation in the inlet and outlet of the fire pump under different flow rates was 1 APF, and there is no insignificant peak distribution at 1 BPF (blade passing frequency) except for the zero flow rate. The secondary frequency of 1 BPF as well as n times harmonic frequency with 1 BPF as the fundamental frequency were distributed in the outlet of the pump, and the distribution of harmonic frequency is relatively more. 3. Under 1.0 Qd, 1.2 Qd, 1.4 Qd, and 1.5 Qd, the NPSHr of the fire pump is 0.95 m, 2.04 m, 2.16 m, and 2.38 m, respectively.
Based on the limitations of numerical simulation methods, it is particularly critical to master the excellent performance of fire pumps through experimental methods, which is also the cornerstone of future hydraulic model development and multi-condition hydraulic design.
Footnotes
Declaration of conflicting interests
The author(s) declared no potential conflicts of interest with respect to the research, authorship, and/or publication of this article.
Funding
The author(s) disclosed receipt of the following financial support for the research, authorship, and/or publication of this article: The work was supported by the National Natural Science Foundation of China (Grant No 51979124), China Postdoctoral Science Foundation (Grant No. 2021M692709).