
Abstract
In this paper, the validation of the comfort simulation strategy on an electric Stewart Platform under road driving scenarios is explained. First, an introduction to the vibroacoustic comfort theory in passenger cars is presented. Second, the Stewart Platform used for the validation process is explained. Third, the methodology conducted for the validation of a hexapod for ride comfort applications is detailed. Finally, the Stewart Platform has been validated under real world road driving scenarios for the 6 degrees-of-freedom by means of the Vibration Dose Value. The final goal of the validation strategy of the electric Stewart Platform is to perform ride and comfort studies in a driving simulator for the 1–10 Hz frequency range.
Introduction
Driving simulators play an important role in research concerning vehicle dynamics, human comfort factors, and the development of new advanced driver assistance systems. 1 These platforms enable testing to take place much earlier in the development process at lower cost, meaning the vehicle is closer to production when the physical prototypes are produced. The simulator then becomes an integral part of the vehicle development cycle as it provides a natural link between the phases of car design, from computer modeling to laboratory testing and finally to the test track. 2
One of the most widely used driving simulators in industry are Stewart Platforms, first proposed in 1965, but then evolved into a popular research topic of robotics in the 1980s. 3 This manipulating structure is a 6 degrees-of freedom (DOF) parallel mechanism originally proposed to simulate flight conditions by generating motion in space for helicopter pilot training.
Stewart’s mechanism consists of an upper dynamic platform supported by ball joints over six legs (actuators) of adjustable lengths and angular altitudes connected to the ground through universal joints. This way, the platform control allows to simulate the dynamics of a real vehicle in the three linear (longitudinal, lateral, vertical) and three rotational (roll, pitch, yaw) DOF by means of the retraction and extension of each actuator. To that end, driver inputs are firstly used to calculate the dynamics imposed by the vehicle model, which will be used by the feedback systems to give the driver the necessary cues. Second, the controller uses the kinematic model of the upper platform to position the simulator according to the maneuver imposed by the driver.
Recent applications of simulators go beyond aeronautics, being widely used as automotive simulators, ultra-precision positioning devices, ultra-fast pick, and place robots and micro-robots or medical applications. In the automotive sector, recent studies use driving simulation technology to assess energy management strategies (EMS), human machine interfaces (HMIs), active control systems (ACSs), advanced driver assistance systems (ADAS), road planning, and as a ride comfort assessment tool. 4 Ride comfort is a critical factor to evaluate the automobile performance and has been an interesting topic for researchers for many years, being whole-body vibration (WBV) transmission to passengers one of the most influent aspects on comfort, performance, and health. 5 WBV in vehicles depend on the intensity, frequency, direction, and exposure time of the input motion, and the characteristics of the seat from which the vibration exposure is received. 6 In this sense, most problematic frequencies in terms of sensitivity to WBV are between 1 and 10 Hz. Vibrations up to 10 Hz affect all of the human organs, being the human body most sensitive to vertical vibrations in the 4–8 Hz frequency range, 7 and 1–2 Hz in the x and y directions. 8 Vibrations beyond 10 Hz have local effects. Then, this study will focus on the most problematic frequency range of WBV (1–10 Hz).
In consequence, automobile designers give great attention to the isolation of vibrations in the car in order to provide a comfortable ride for the passengers. In this sense, vehicle’s suspension is an important component to ensure ride comfort, since its performance directly affects the vehicle’s ride comfort and handling stability. 9 Thus, the design of the vehicle’s suspension system must compromise the demand of ride comfort and handling stability. Then, the shock absorber spring assembly becomes a fundamental element of the suspension system. 10
In order to regulate the vibration environment in seated positions, there are three human response to vibration standards of main interest: (ISO 2631-1, 1974), (ISO 2631-1, 1997), 11 and (BS 6841, 2020). These standards provide several steps to follow for a proper analysis and the methods to be applied to analyze acceleration signals measured in road vehicles. In this regard and in order to make a correct validation of the ride comfort simulation strategy on a Stewart Platform, it is necessary to determine the appropriate maneuvers. The main evaluation methods of vehicle comfort include absorption power method, ISO2631 method, comprehensive evaluation method, and IRI method. In Refs. 12 and 13, it is shown that ISO2631is suitable for the evaluation of the comfort of low speed; this paper studies the speed in 5 m/s–50 m/s, and the speed is relatively low. Therefore, this paper uses the ISO2631 method to evaluate vehicle comfort. Consequently, this paper is based on the standards and directives in how to do a proper analysis (test cases and metrics) and give standardized results for the validation of an electric Stewart Platform for comfort studies by means of the vibration response of the seat of a Toyota Prius in the 1–10 Hz frequency range. This is, the purpose of this study is to validate if a vehicle simulator can reproduce the same vibroacoustic behavior at the contact point between the seat and the driver when it is excited with the same acceleration profile in the 6 DOF imposed on the sprung mass of a real car as a consequence of a specific set of maneuvers.
The article is structured as follows: 1. First, an introduction to the vibroacoustic comfort theory in passenger cars is presented in order to determine the correct metrics to be applied. 2. Secondly, the Stewart Platform used for the validation process is explained. 3. Thirdly, the applied methodology for the validation of a hexapod for ride and comfort applications is detailed. 4. Finally, the comfort simulation strategy on the Stewart Platform is tested under road driving scenarios for the 6 degrees-of-freedom (DOF).
As a result, the Stewart Platform has been successfully validated for ride and comfort applications in the 1–10 Hz frequency range.
Vibroacoustic comfort in passenger cars
Noise, vibration, and harshness (NVH) is the field of measuring and modifying the vibroacoustic characteristics of vehicles. 14 Noise is unwanted sound from 100 Hz to 2.000 Hz, vibration is the oscillation that is typically felt rather than heard (0–100 Hz) and harshness describes the severity and discomfort associated with unwanted sound or vibration. 15 Noise and vibration can be measured, but harshness is a more subjective assessment. Since subjective evaluation is subject to variability, an evaluation based on objective parameters is performed in order to provide more consistent results. 16
Extensive studies have been carried out by automobile engineers to identify and evaluate noise and vibration generation in vehicle cabin. 17 According to Ref. 8, the transmission of power from engine to wheels, the tire road interaction and the aerodynamic forces are the main sources of WBV in passenger cars. Then, the seat dynamics may become significant in the ride quality since this element directly transmits the vibration to the passenger. 18 Moreover, the frequency responses of some body segments such as the head, the neck, the upper torso, the upper arms, the lower arms, and the central torso are dominant at 4.44 Hz, 19 which is in the fundamental human body frequency range of 4–6 Hz reported by Kitazaki and Griffin. 20
Consequently, in order to validate an electric Stewart Platform for ride comfort applications, the accelerations measured at the contact point between the seat and the driver in a hexapod and in a Toyota Prius will be correlated. This correlation will be performed considering the same driving scenarios, the same seat structure and the same driver to avoid deviations due to differences in the dynamic performance of the seat or the coupling effect between human body and the seat.
Now, an evaluation of the different metrics available for a quantitative prediction of overall seat discomfort is made according to the standards (ISO 2631-1, 1974), (ISO 2631-1, 1997), 11 and (BS 6841, 2020). These metrics are the root mean square (RMS) value, the crest factor (CF), and the vibration dose value (VDV).
Root mean square acceleration
The RMS method is a statistical measure of the magnitude of a changing quantity.
21
The ride comfort considering the regulation prescription is assessed exploiting the frequency weighted RMS acceleration as defined by

For periodic vibration and stationary random WBV, the RMS frequency-weighted acceleration often provides a sufficient useful indication of the relative severities of different motions. 22 On the contrary, involving transient vibration, shocks, and non-stationary vibrations the period of time over which an RMS value is determined affects its magnitude. 23
Crest factor
In order to obtain information from acceleration data single phenomenon or global characteristics can be analyzed. Concerning the former, peak-to-peak or peak values can properly characterize the severity of the vibration if isolated phenomena are to be used. On the contrary, a single peak could not be representative, having no impact on global behavior.
In this case, the RMS is of great interest for giving an idea of the energy contained in the vibration.
15
Obviously, the combination of, for example, peak velocity with RMS acceleration provides much more information that each of the constituents on its own. In fact, the CF can be used to indicate the relative relevance between them as
15

It is assumed that when equation (2) returns high values, the analyzed motions are better described by means of peak acceleration while low ones indicate that the RMS acceleration should be employed. However, neither peak nor RMS values provide information of the impact of the duration of the vibrational phenomena. Hence, other parameters are needed. 15
Vibration dose value
Neither peak nor RMS values provide information of the impact of the duration of the vibrational phenomena. Hence, other parameters are needed. Assuming both peak and RMS accelerations are well balanced, it is possible to evaluate whole-body vibration response by means of a cumulative measure called “dose”. Experimental studies show that vibration dose value provides a convenient measure of the total severity. The vibration dose value is defined as
24

The VDV (see equation (3)) uses the RMS acceleration raised to the fourth power, what ensures the VDV is more sensitive to the peaks in the acceleration levels. Thus, the VDV provides a simple and robust measure that is applicable to all deterministic motions including shocks and transients and all random motions including non-stationary motions, while the use of the RMS measures is far more restricted. 15 One practical consequence of the difference between the methods is reflected in the need to specify the period over which the vibration is to be measured. This can greatly influence RMS measures but has no effect on the VDV so long as the measurement period includes the event of interest.
Then, the VDV has been used for the correlation of the accelerations measured at the contact point between the seat and the driver in a hexapod and in a Toyota Prius for the validation of an electric Stewart Platform for ride comfort applications under the same road driving scenarios.
The Stewart platform
Hydraulic motion-control systems have been used in the flight and automotive industry for more than 40 years for meeting the required performance specifications. They are significantly faster and have more torque producing capability. However, special control systems are required for their linear performance and the response time of the hydraulic systems are limited compared to electromechanical systems. Moreover, hydraulic robots require much more peripheral equipment, derived in higher maintenance costs, and they are noisy. 25
In consequence, most of the robotics applications use DC- or AC-servo motors or stepper motors, since they are cheaper, cleaner, quieter, and relatively easy to control. 26 That is why electric servo drive systems are chosen as the driving mechanism for small-scale Stewart Platform application, such as research in vehicle dynamics. 27
Mechanics of a Stewart platform
A Stewart Platform consists of a base, a mobile platform and six linear actuators that join both parts. With its extension and retraction, the actuators give the platform six degrees-of-freedom positioning capabilities, consisting of three translational (sway, surge, and heave) and three rotational (roll, pitch, and yaw) (see Figure 1). Electric Stewart Platform. (a) General overview (b) Upper view.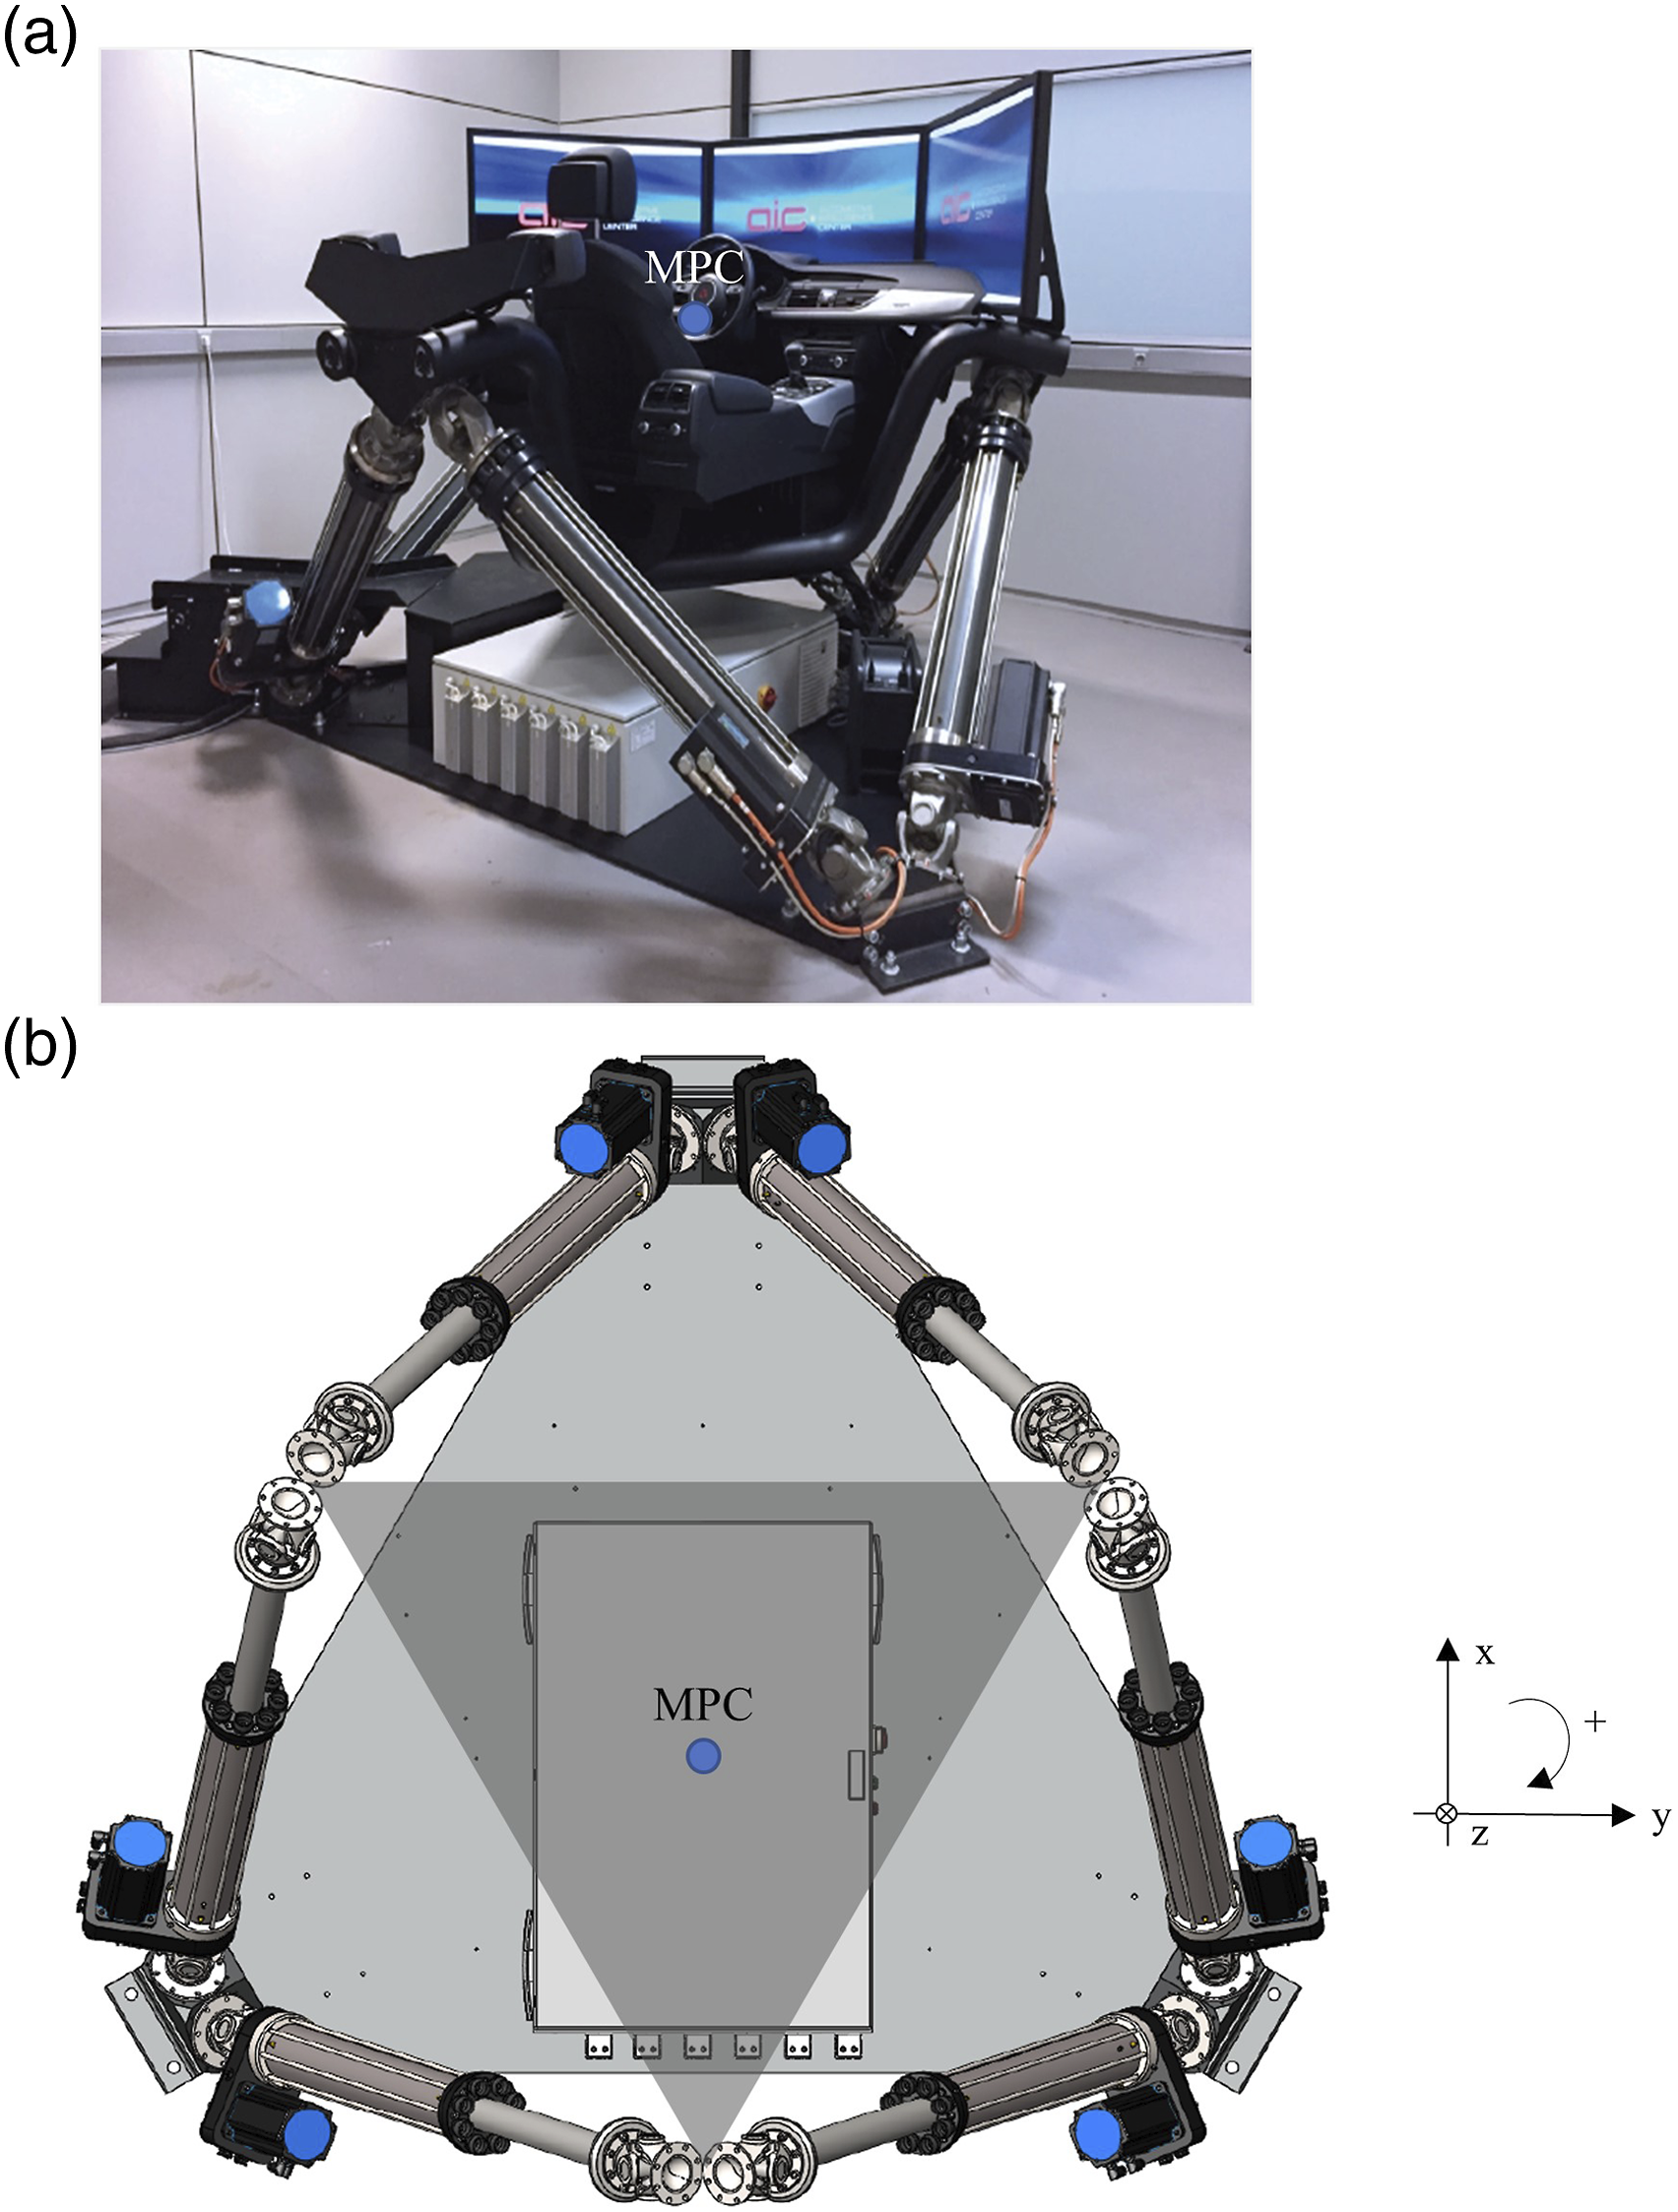
Technical specifications of the 640-motion base at a gross moving load of 1000 kg.
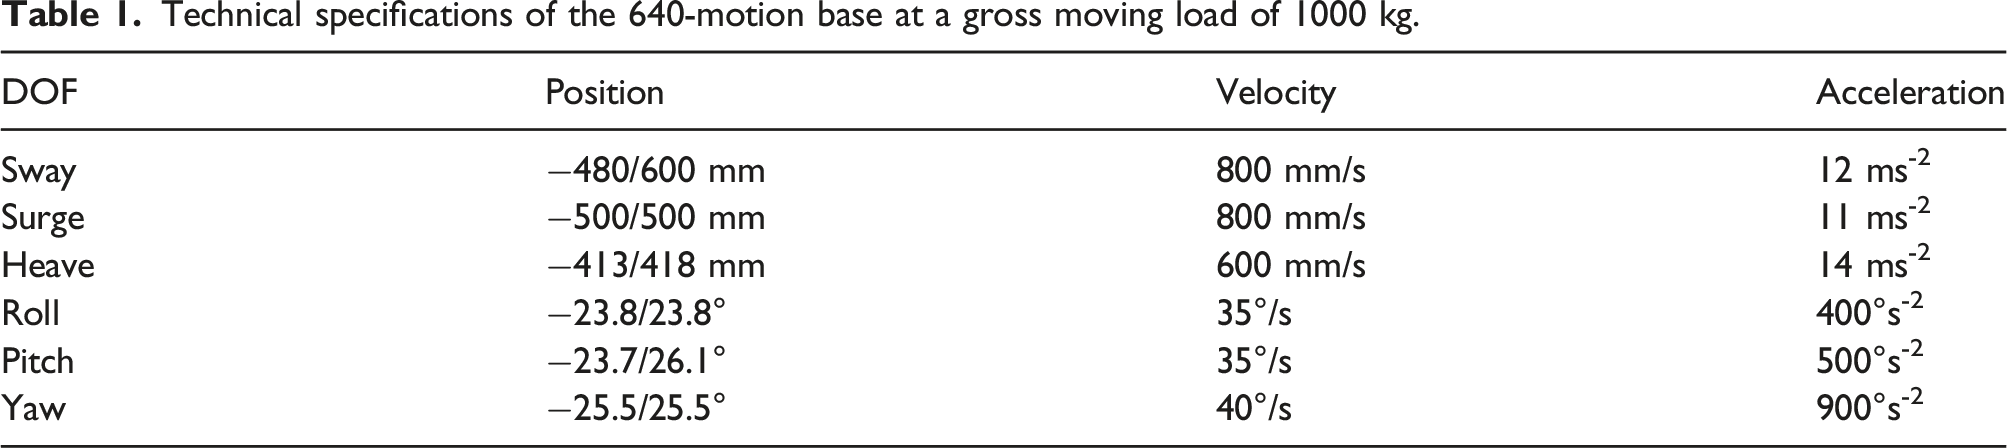
Table 1 verifies, on the one hand, that this platform is suitable for working in vehicle dynamics applications, where the maximum accelerations of the suspension system are framed within the range of ±2 ms-2. 28 On the other hand, the platform working frequency range (1–10 Hz) allows to address the most problematic frequencies in terms of sensitivity to WBV. Human sensitivity to WBV is highest around 4–8 Hz in the z direction, and 1–2 Hz in the x and y directions. 8
The actuators are linked to the base with a universal joint and to the moving platform with a spherical joint, while the torque-force of the actuator is transmitted from a synchronous belt and snail system. Each actuator is moved by a permanent magnet synchronous motor (PMSM).
Motion control strategy
There are two methods for the definition and control of the dynamics of a Stewart Platform: task-space control (or forward dynamics) and joint-space control (or inverse dynamics). 29 The forward dynamic strategy maps the joint space displacements to the task space though a multi-input multi-output framework. The inverse dynamic strategy controls each actuator of the platform as a single-input single-output system.
For a parallel manipulator, inverse dynamics is straight forward and there is no complexity deriving the equations. However, forward dynamics of Stewart Platforms is very complicated and difficult to use since it requires the solution of many non-linear equations.
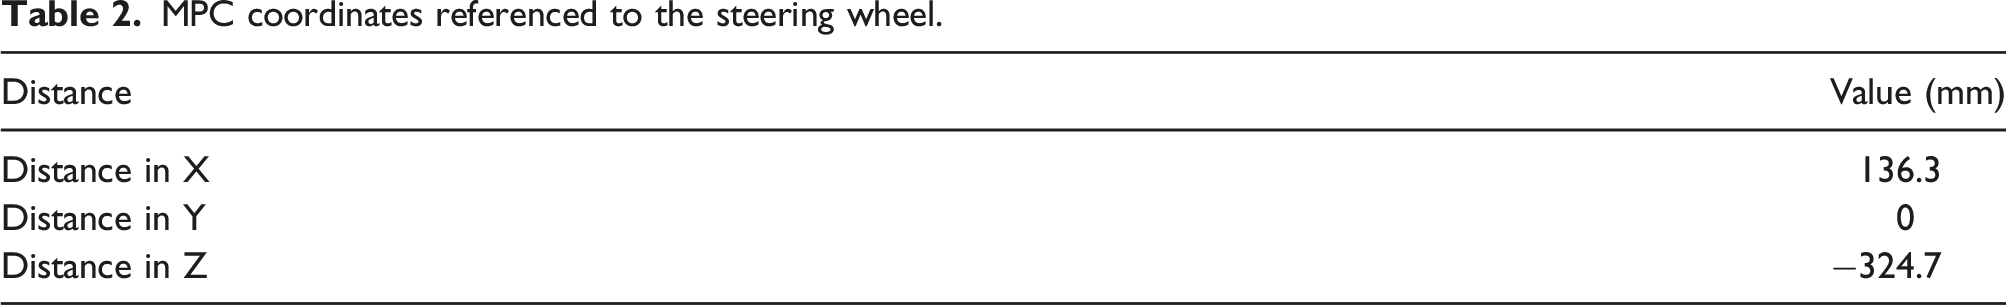
MPC coordinates referenced to the steering wheel.
Then, the commanded inputs to the MPC are acceleration in x-axis (
In order to match the objective inputs, each actuator has a PI controller over the velocity signal. However, the response of the hexapod is influenced by its inertial, stiffness, and frictional characteristics over its operating range (see Table 1). In consequence, the platform overestimates the command signals in high-energy scenarios because the control does not consider the inertia and stiffness of the simulator and it underestimates the command signals in low-energy scenarios by effect of the friction of the actuators and electric motors. As a result, the analyzed Stewart Platform presents an inaccurate behavior making it unsuitable for vehicle dynamics and ride and comfort applications.
To overcome these limitations, Santos and García-Barruetabeña, (paper Under Review) propose a motion control strategy based on the experimental dynamic model of an electric Stewart Platform and on commanded signal modulation through its frequency components identification by means of the autoregressive method that allows to optimize its performance throughout its operating range under real road signals in the 6 DOF. Then, any set of command signals sent to the MPC must be corrected according to the control strategy developed in this reference so that the simulator is able to reproduce the dynamics imposed accurately. This control is mandatory for ride comfort evaluations with this driving simulator.
Methodology
This section explains the applied methodology for the validation of an electric Stewart Platform for ride and comfort applications. For this analysis, the simulator is used as a tool to replicate real road signals measured at the MPC of the car, bypassing the vehicle model. Then, the commanded inputs sent to the MPC are the 6 accelerations measured in the real driving maneuvers explained in section Comfort tests.
This methodology is based on the correlation of the accelerations measured at the contact point between the seat and the driver in a hexapod and in a Toyota Prius by means of the VDV for the experimental campaign defined in section Comfort tests. Each experiment performed with the Toyota Prius has been replicated in the simulator with the original accelerations measured from the tests, considering the same seat structure and the same driver to avoid deviations coming from the test conditions.
Comfort tests
ISO2631-1-1997 method takes the sitting human body under vibration as the analysis model. This method considers the driver and passenger lean on the seat, and the vehicle vibration is transmitted to the human body through the seat, the floor, and the seatback. In the analysis, 12° of freedom are considered: the three axial directions at the seat center point; the three rotational directions at the seat center point; the three axial directions at hip and the three axial directions at the seatback.
However, taking into account that Foot-Transmitted-Vibration (FTV) is deemed negligible as it has minimal effects on the ride comfort, 30 only an evaluation of the vibrations measured at the seat will be made. In this respect, the measurement of the seat transmissibility is usually measured by using accelerometer pad located at the center of seat surface (ISO 2631-1 (1997)).31–33 Then, the center of the seat pad is considered as the reference point for the comfort analysis.
Taking this into account, for the validation of the comfort simulation strategy on the electric Stewart Platform from Figure 1, an experimental campaign has been designed to excite the natural frequencies of the chassis in the 6 DOF (see Figure 2), in order to evaluate the accelerations perceived in 6 DOF of the center of the seat as a consequence of these excitations.34,35 propose to select characteristic driving maneuvers according to their frequency of occurrence in real traffic: acceleration, deceleration, and lane change36,37 also propose to include bumpy roads into the comfort evaluation experiment. Comfort tests maneuvers.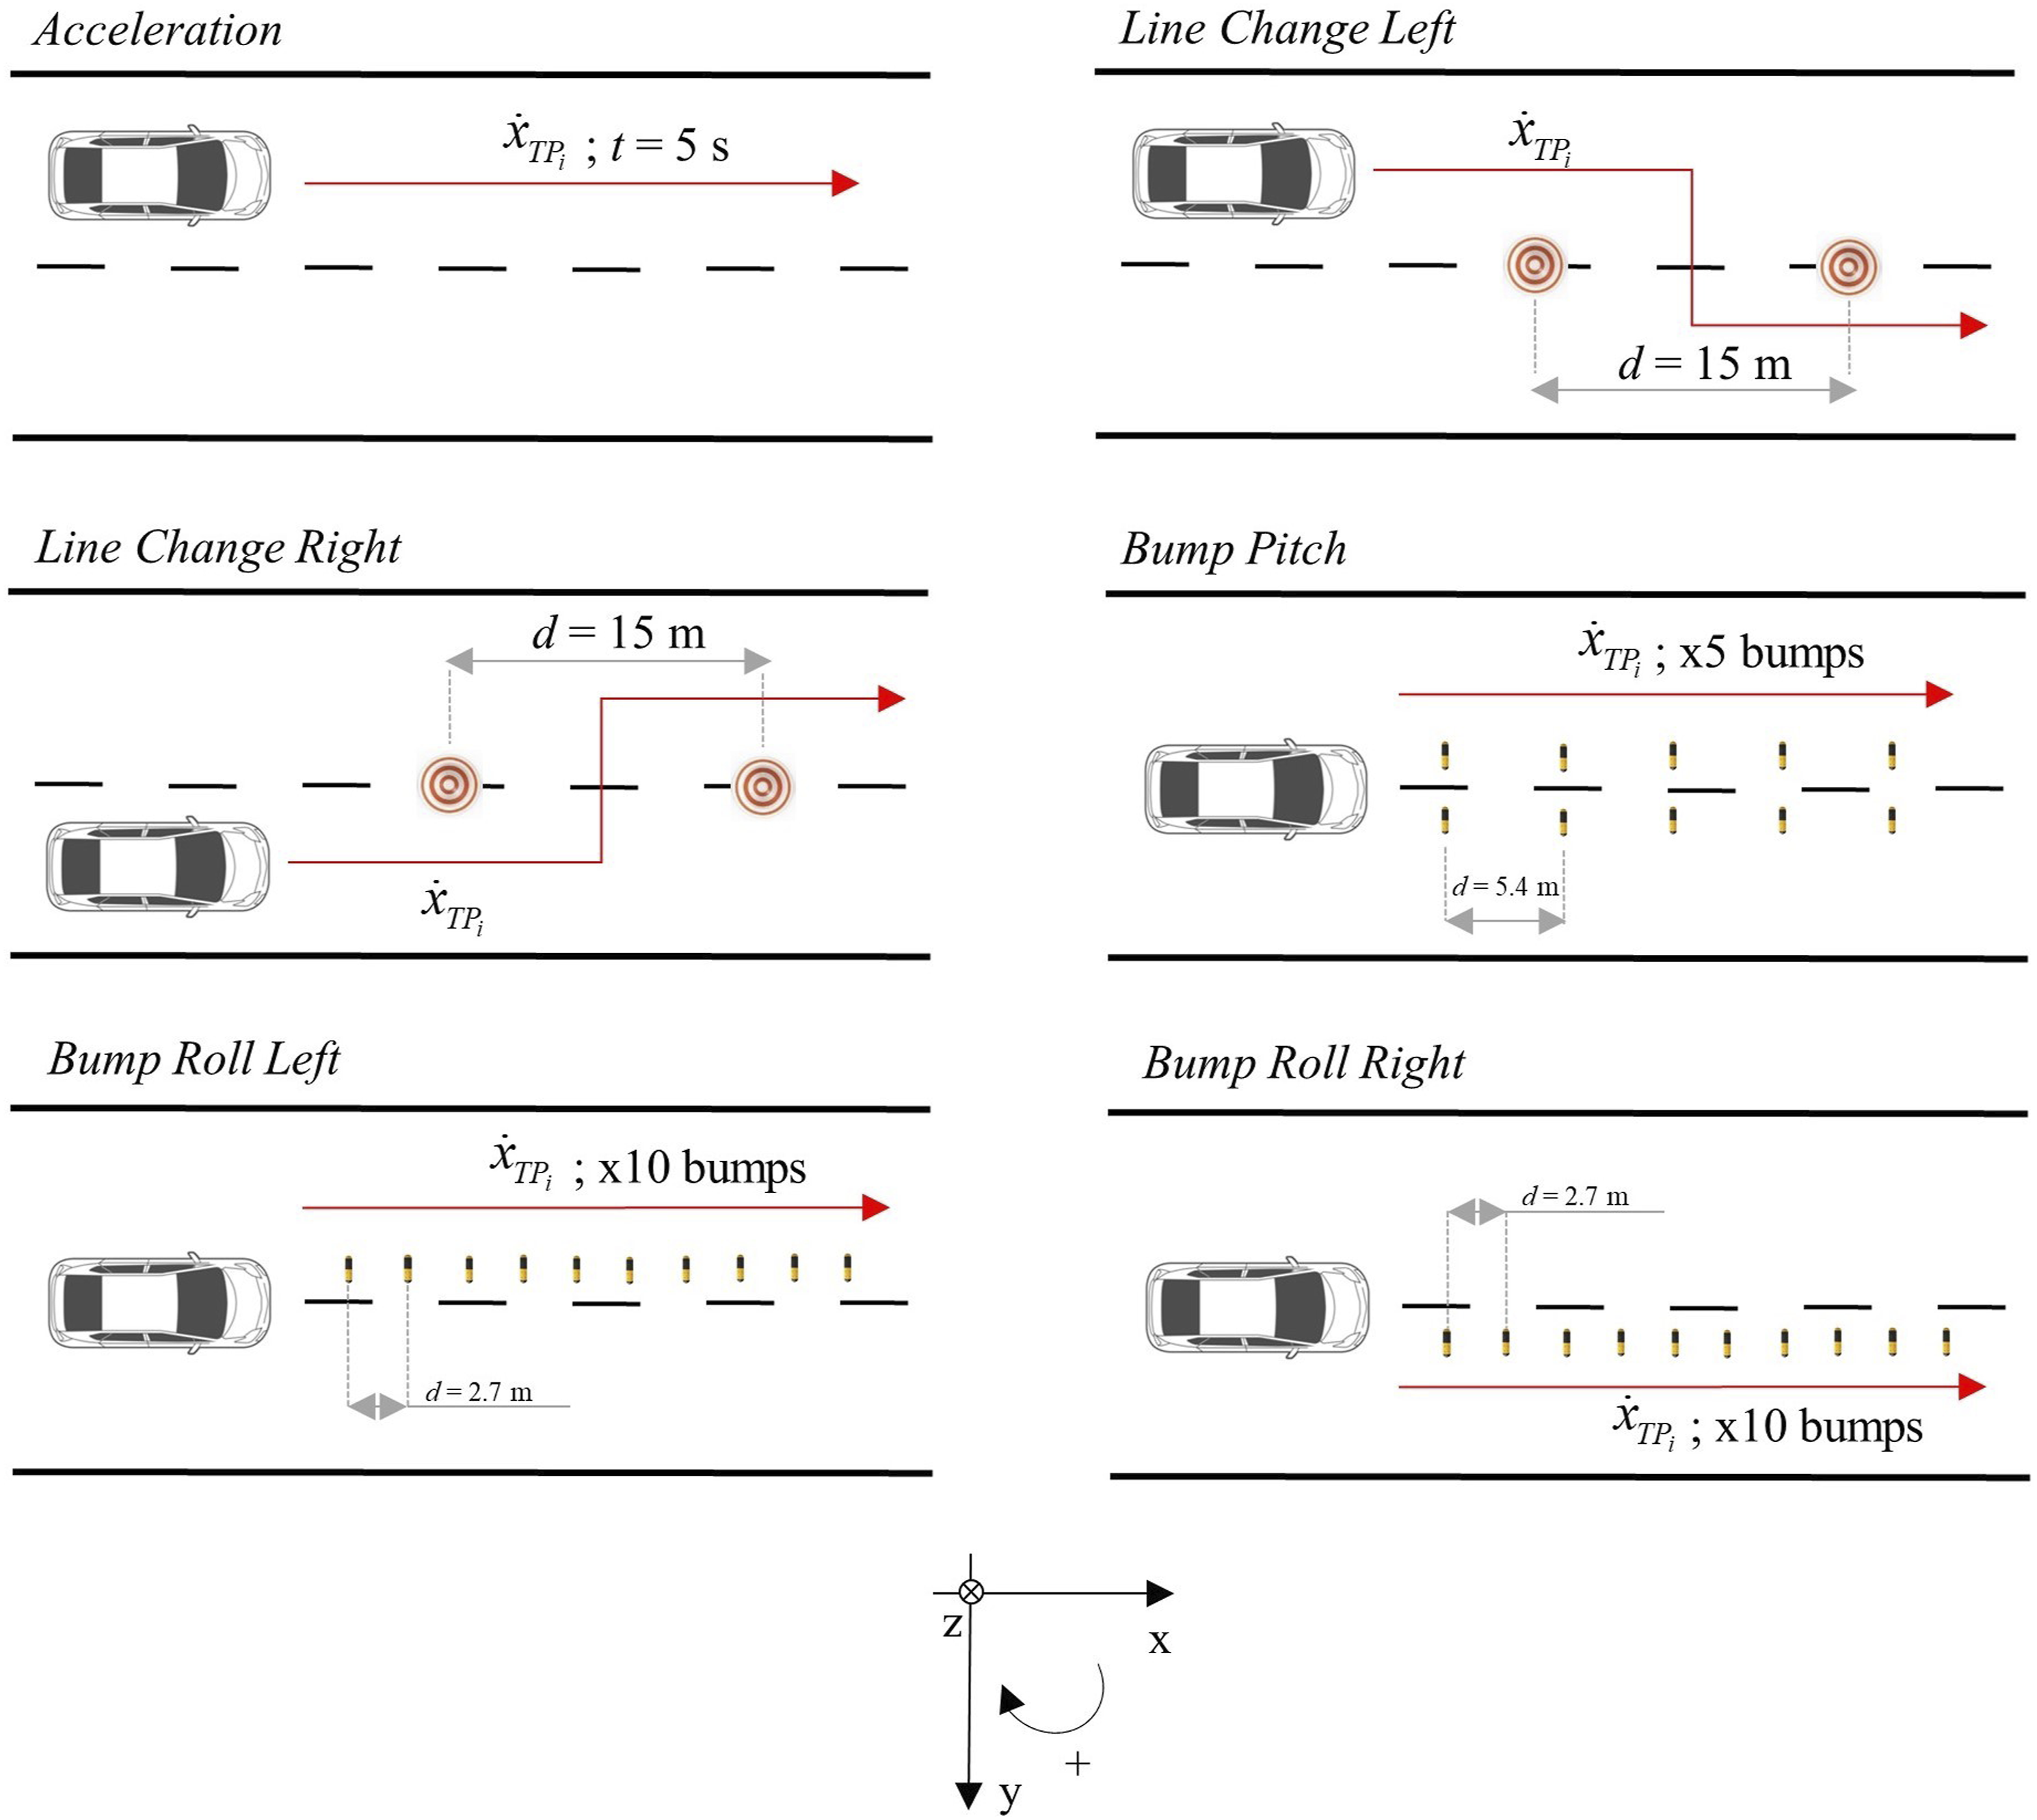
Then, this experimental campaign has been divided into two groups of tests depending on the origin of the excitation: excitation coming from the steering wheel or excitation coming from bumps, performing five repetitions for each test to ensure repeatability of results.
Moreover, since a Toyota Prius has regenerative braking capabilities, the specific vehicle configuration can alter the dynamic vehicle behavior while releasing the accelerator pedal or while pressing the brake pedal. Then, the maximum test speed for the Toyota Prius has been set at 50 km/h to avoid the combustion engine’s inception on the vibroacoustic behavior of the powertrain, as the electric motor works up to about this velocity.
On the one hand, tests with steering wheel excitation have been repeated for the test speeds 1. Acceleration test: performed according to GB/T 4970-1996 as stated in.
31
Excited axes: longitudinal and vertical. 2. Lane change: performed according to ISO 4138 as stated in.
31
In order to consider the non-symmetry of the car in the Y-axis, this test has been done with right-hand and left-hand line changes. Excited axes: lateral and yaw.
On the other hand, tests where rubber bumps have been considered have been repeated for the test speeds 1. Bump pitch: bump pitch with the wheels of both sides simultaneously separated at a distance two times the wheelbase (2.7 m), being the excited axe, pitch. 2. Bump roll: bump roll with one-side wheels independently at a distance equal to the wheelbase. In order to consider the non-symmetry of the car in the Y-axis, this test has been done with the left and right wheels in two different tests, being the excited axe, roll.
Then, all the tests from Figure 2 have been carried out according to the conditions established in (ISO 15037-1, 2019). The driving environment and vehicle conditions for the experimental campaign are detailed now.
Environment conditions
Regarding the track, all tests have been carried out on a new, smooth, clean, dry, and uniform paved road surface. The international roughness index (IRI) for new, reconstructed, and rehabilitated roads in Spain is 1.5–2.5 mm/m, which corresponds to a “good” or “very good” asphalt quality. 38
Moreover, the gradient of the paved test surface to be used does not exceed 2% in any direction when measured over any distance interval between that corresponding to the vehicle track and 25 m. The ambient wind velocity has not exceeded 5 m/s during all tests (ISO 15037-1, 2019).
Vehicle conditions
The test vehicle is a Toyota Prius III Generation (2013), this is, a passenger car in accordance with (ISO 3833, 1977).
Regarding the tires, they have run in for at least 150 km on the test vehicle without excessively harsh use and they have been balanced before performing the tests and maintained in the same position for the complete experimental campaign (ISO 15037-1, 2019). Tires have a tread depth of at least 90% of the original value across the whole breadth of the tread and around the whole circumference of the tire and they have not been manufactured more than 1 year before the tests (Jan-2021). Finally, tires have been inflated to the pressure as specified by the vehicle manufacturer for the test vehicle configuration at the ambient temperature of the tests (20°C), this is, 250 kPa.
Moreover, the four pressurized passive twin-tube hydraulic shock absorbers Vogtland 967,003 have been replaced to avoid a malfunction of the suspension system that could influence the dynamic behavior of the vehicle during the tests.
Care shall be taken to generate a minimum deviation in the location of the center of gravity and in the moments of inertia as compared to the loading conditions of the vehicle in normal use, in accordance with (ISO 2416, 1992). In consequence, the test mass has been between the complete vehicle kerb mass (ISO 1176, 1990) (1.395 kg) plus driver and test equipment (56 kg; combined mass should not exceed 150 kg) and the maximum authorized total mass (ISO 1176, 1990) (1.790 kg).
Finally, all relevant vehicle components shall be warmed up prior to the tests in order to achieve component temperatures representative of normal driving conditions. A procedure equivalent to driving at the test speed for a distance of 10 km has been performed for that end (ISO 15037-1, 2019).
Measurement instrumentation and layout
On the one hand, four 356A16 triaxial piezoelectric PCB sensors have been used in order to obtain the vibration signal of the sprung mass in the MPC of the Toyota Prius to be used as the reference inputs in the Stewart Platform. On the other hand, a Brüel and Kjaer model 4515 seat-mounted triaxial accelerometer designed for full-body vibration measurement in the field has been used to measure the output accelerations in the contact point between the seat and the driver in the Toyota Prius and in the Stewart Platform.
Sprung mass vibration sensors
Technical specifications of PCB 356A16 accelerometer.
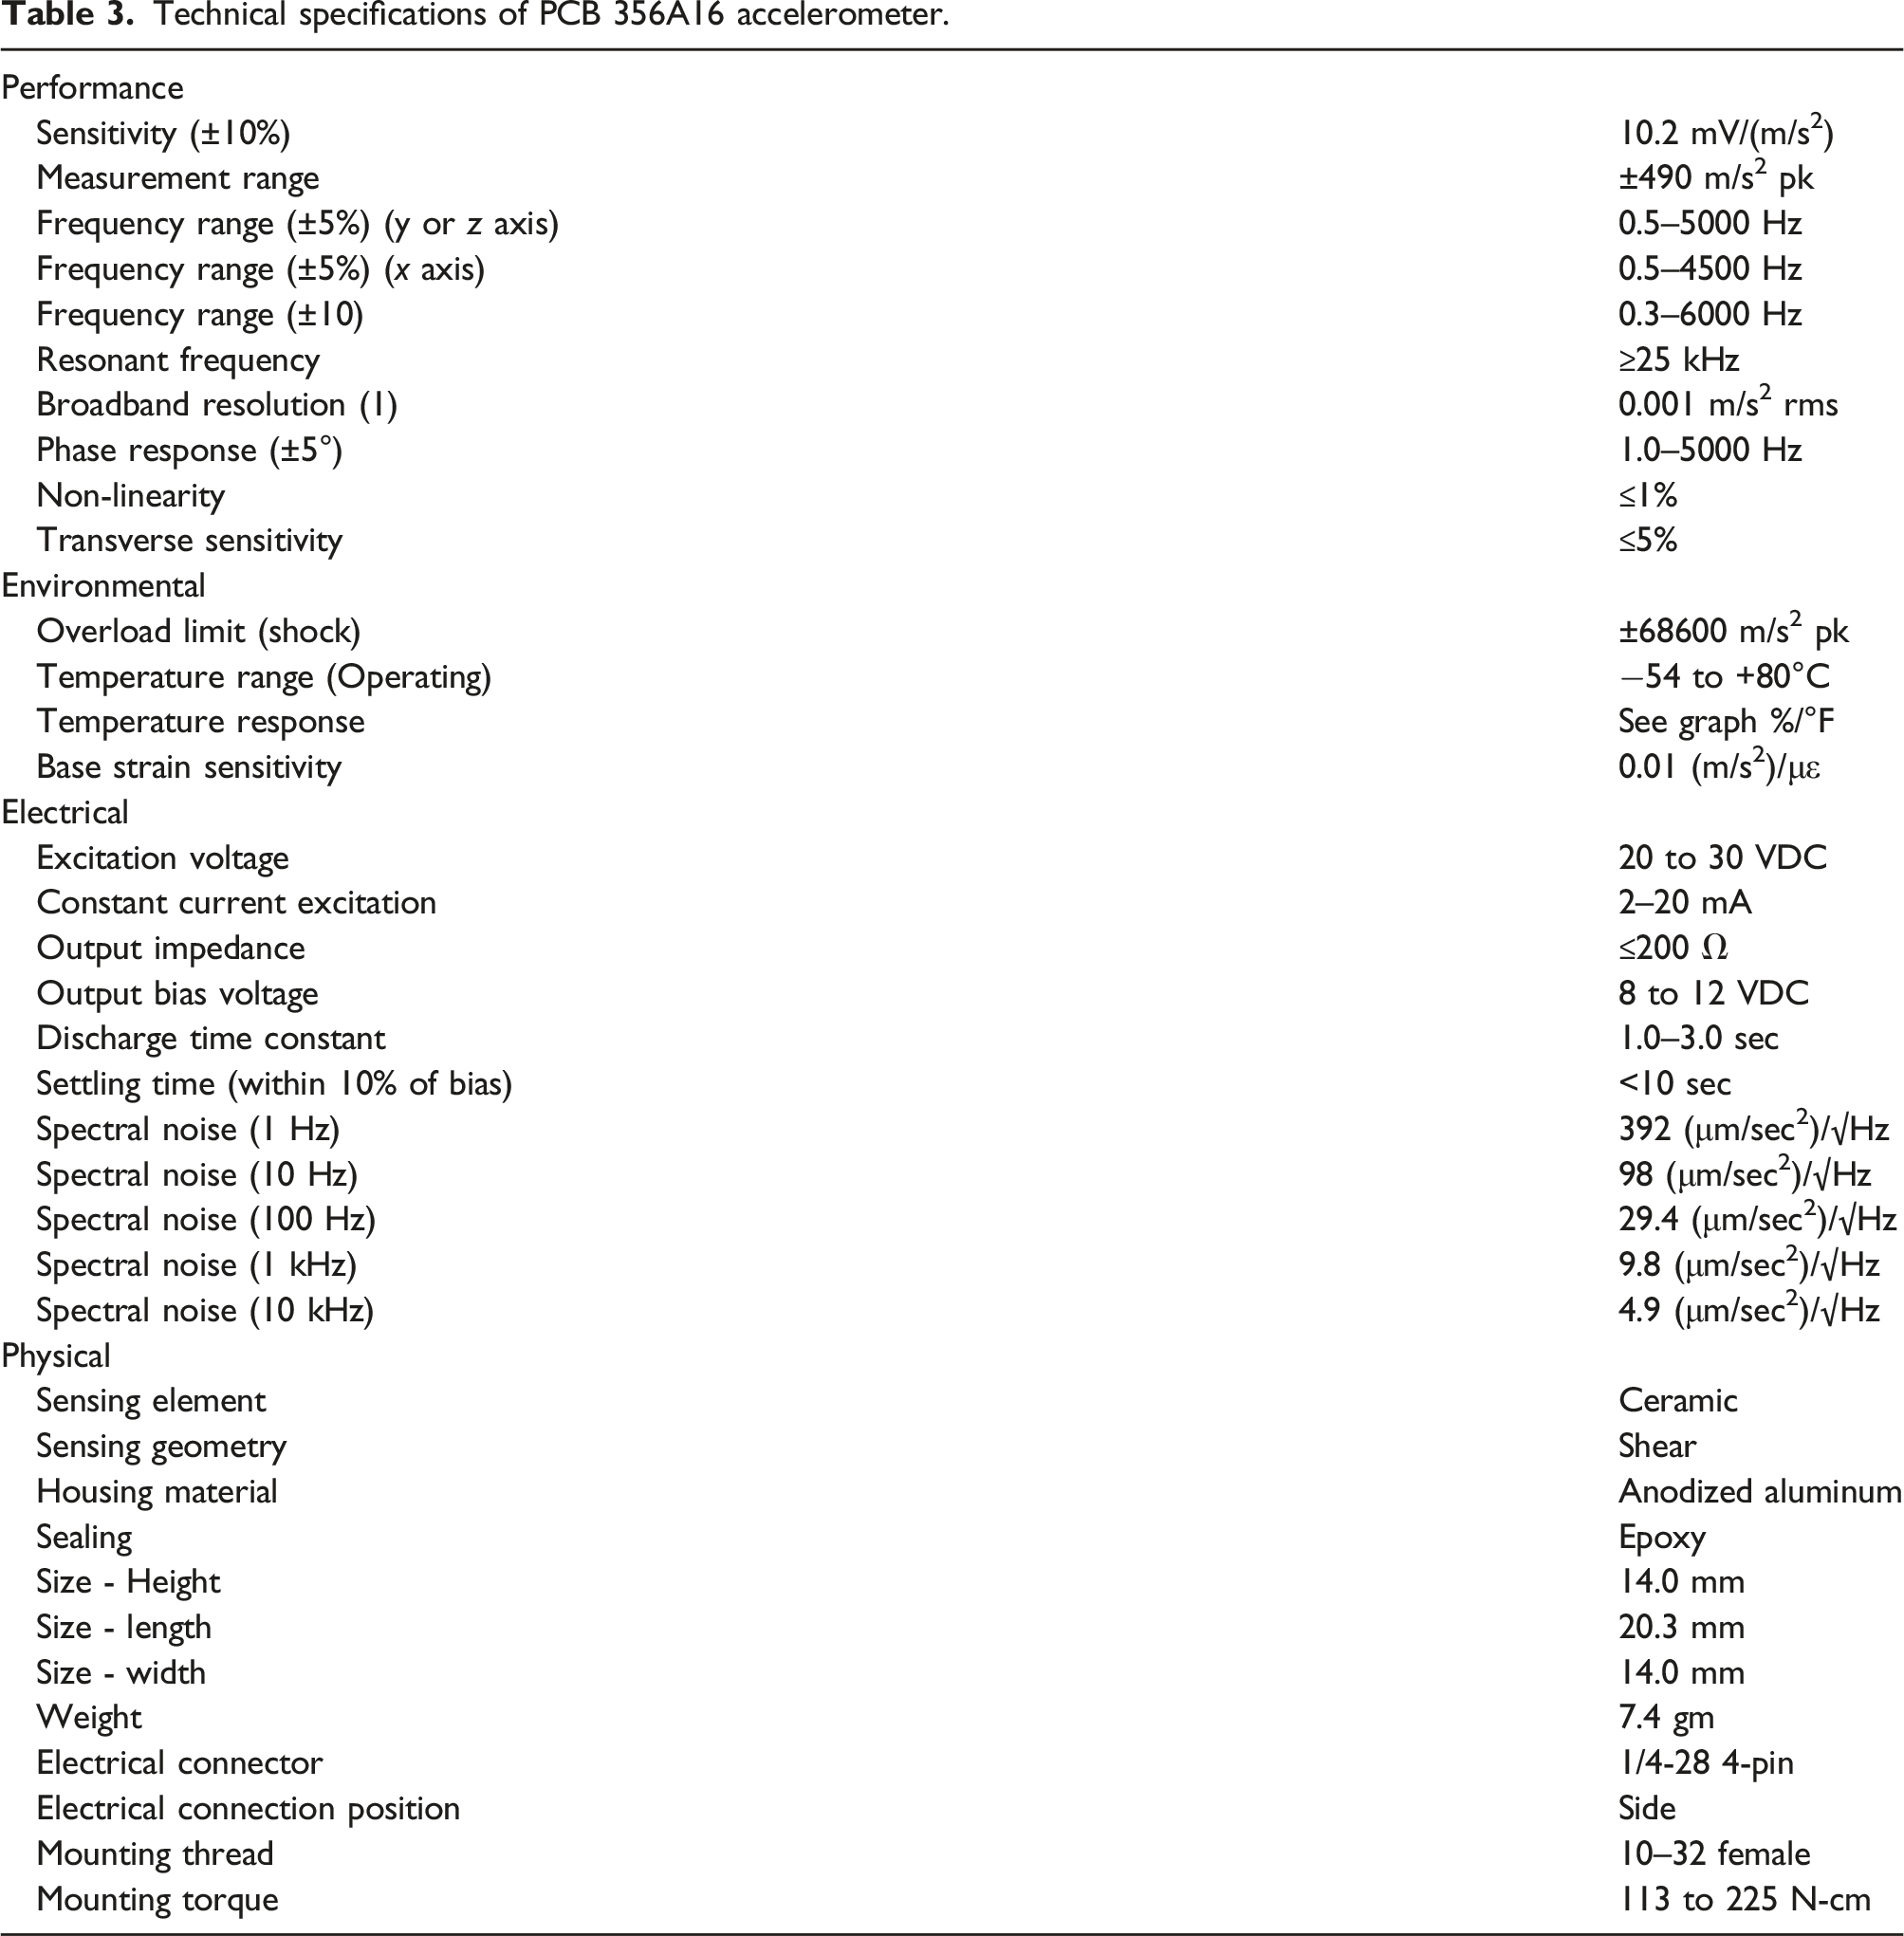
As can be seen in Table 3, the selected accelerometers are suitable for measuring real road signals with frequency components in the 1–10 Hz range in the three axes with a sensitivity of 10.2 mV/ms2. Moreover, the maximum accelerations measured fall within the range of admissible accelerations of the driving platform (see Table 1). The sampling frequency used in the measurements was 4960 Hz since the sampling frequency should be at least five times the highest frequency in the nominal frequency range (ISO 8041-1, 2017).
The PCB sensors have been located on the upper flat part of the four suspension corners through adhesive mounting bases, since smooth surfaces and stiff adhesives provide the best high frequency response. The adhesive mounting base attachment method involves attaching a base to the test structure, then securing the sensor to the base. Since the used bases are manufactured of “hard-coated” aluminum, they provide electrical isolation to eliminate ground loops and reduce electrical interference that may propagate from the surface of the test object.
Figure 3 shows the layout of the four sensors referenced to the MPC of the Prius considered for the measurement of the accelerations of the body for each experiment from section Comfort tests. Notice that the reference system of the Toyota Prius matches the reference system of the Stewart Platform (see Figure 1), this is, the SAE coordinate system (x+ forward; y+ right; z+ down). Sensors layout in the Toyota Prius.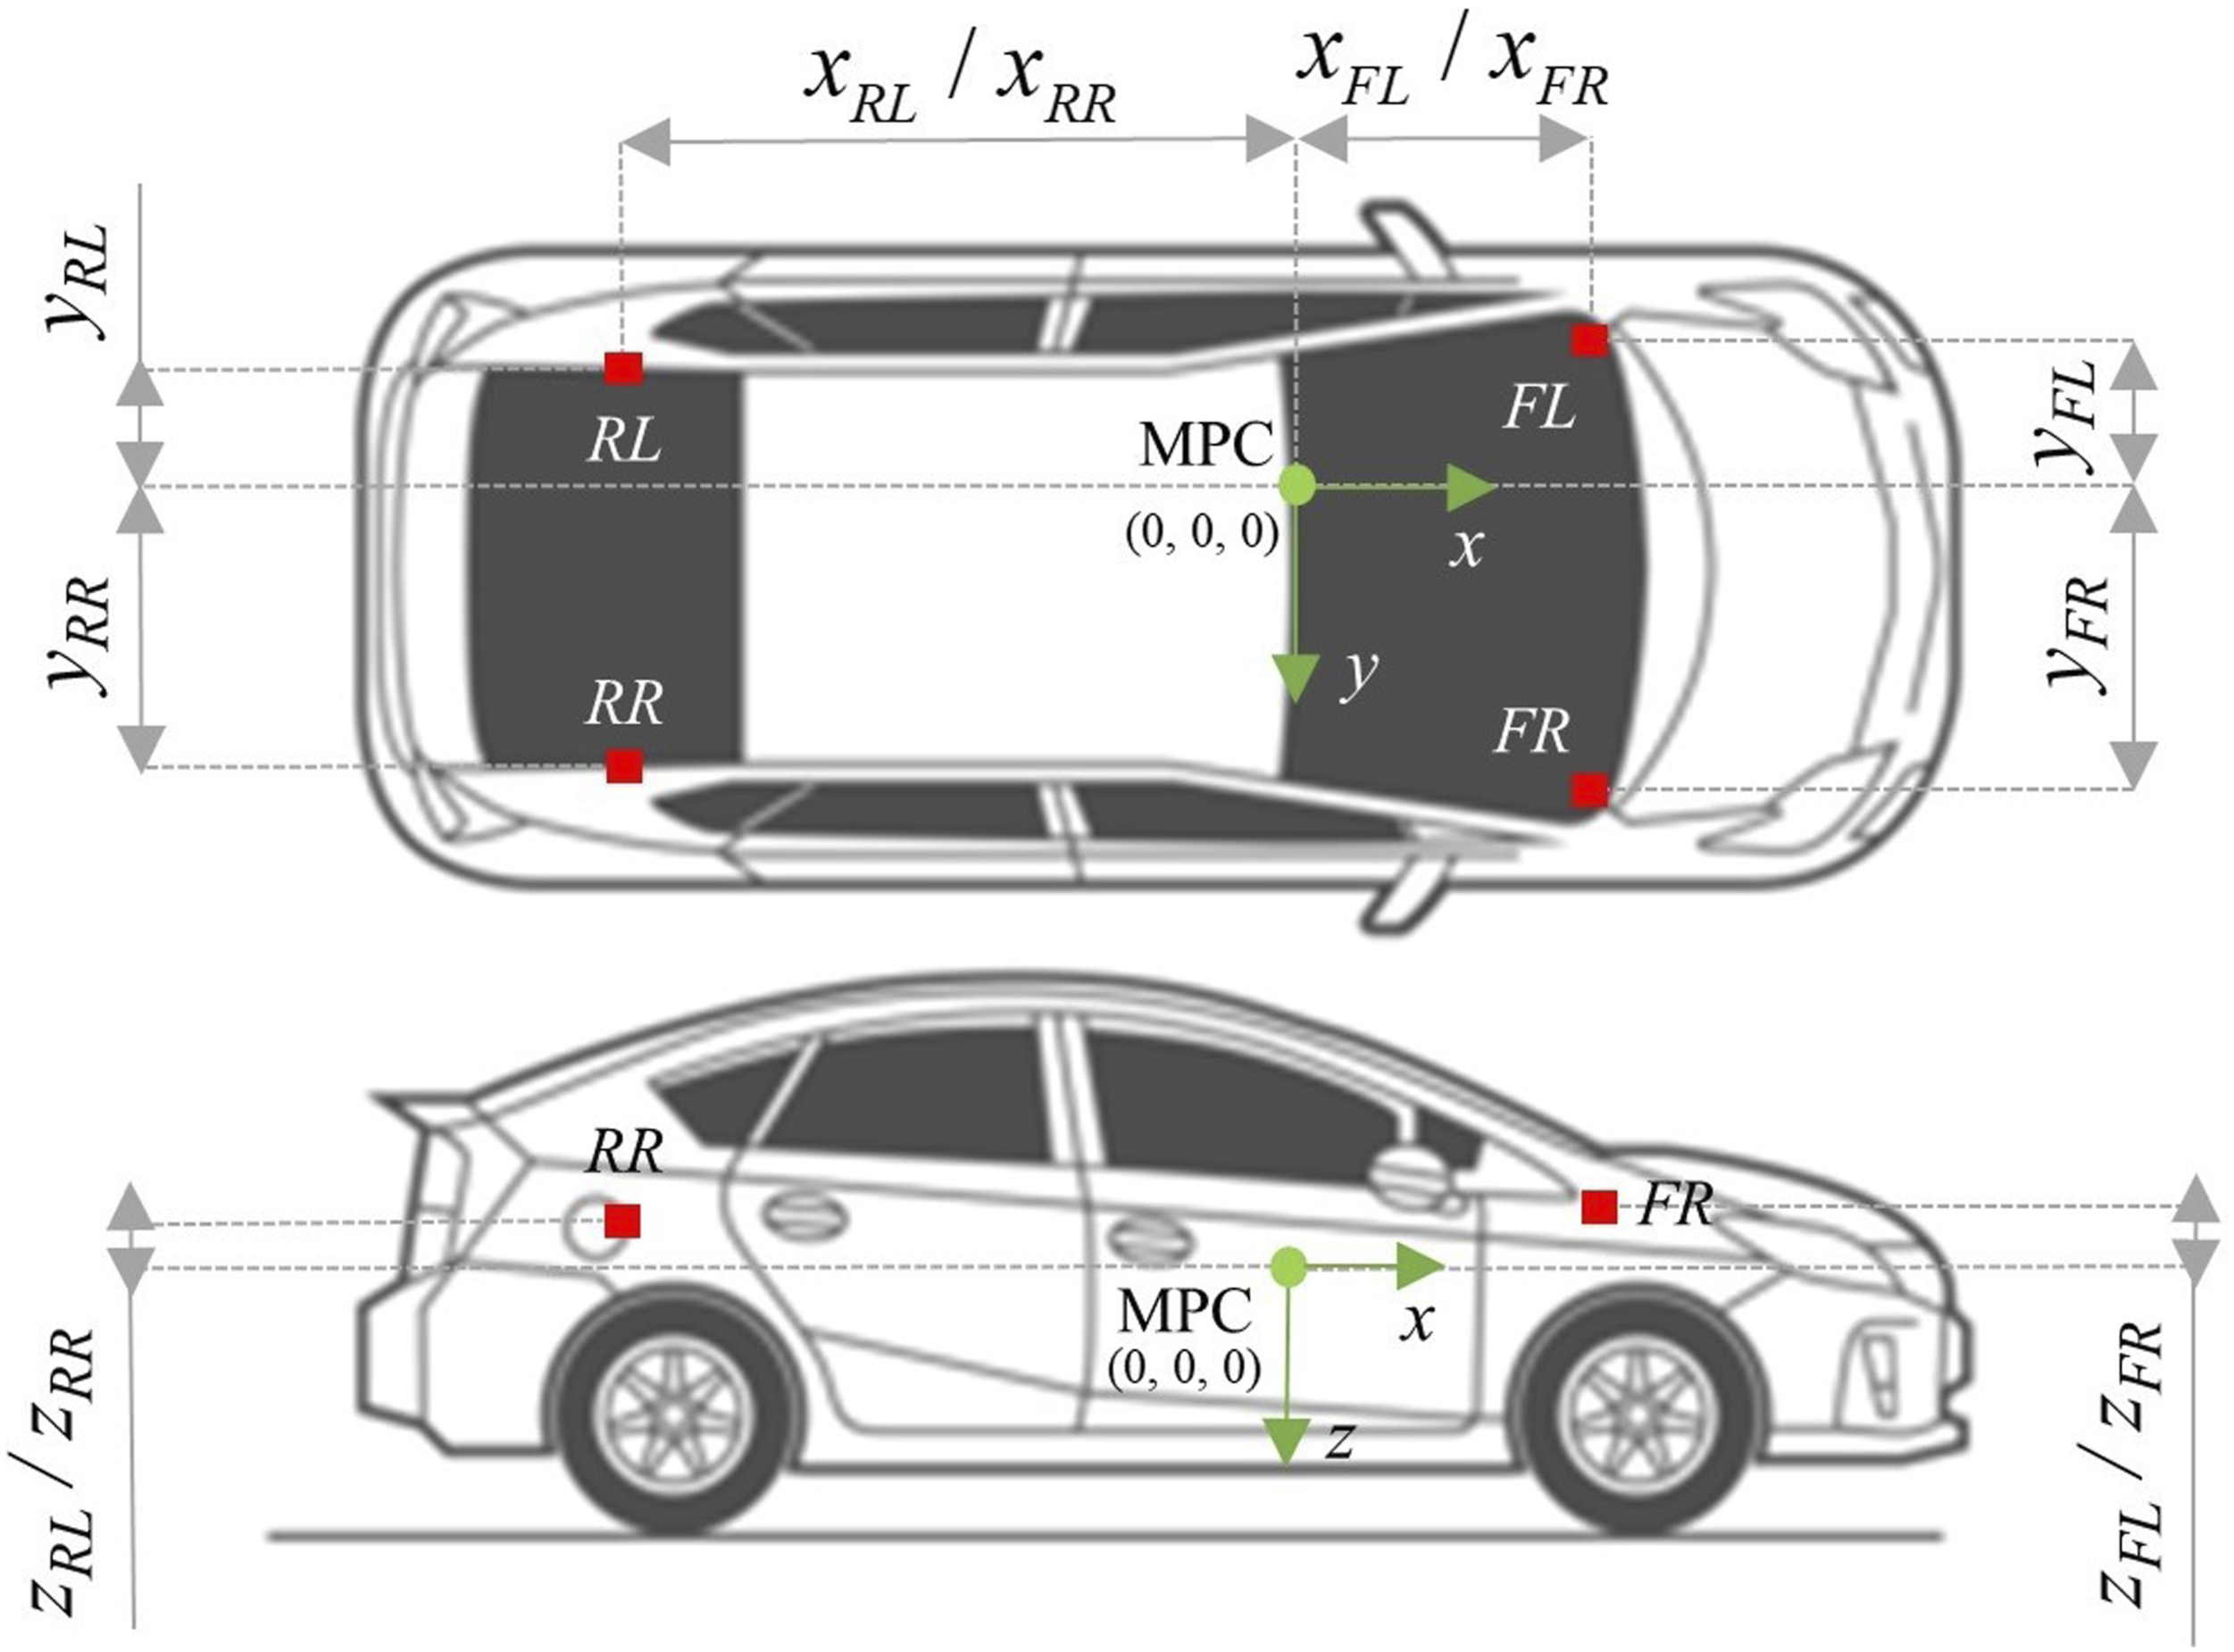
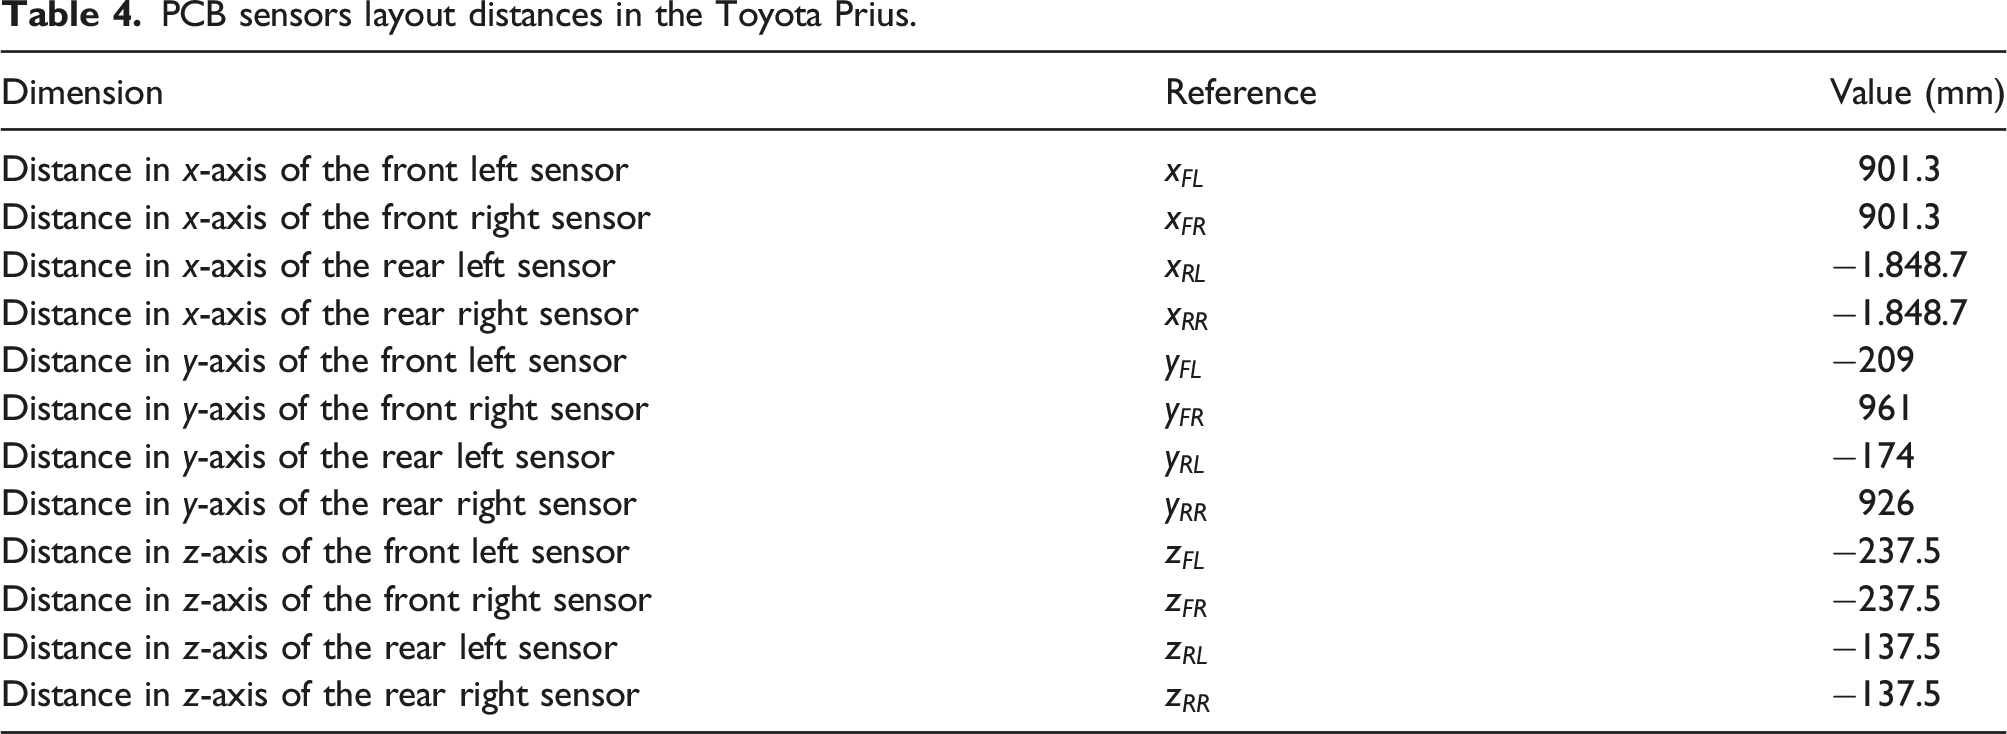
PCB sensors layout distances in the Toyota Prius.
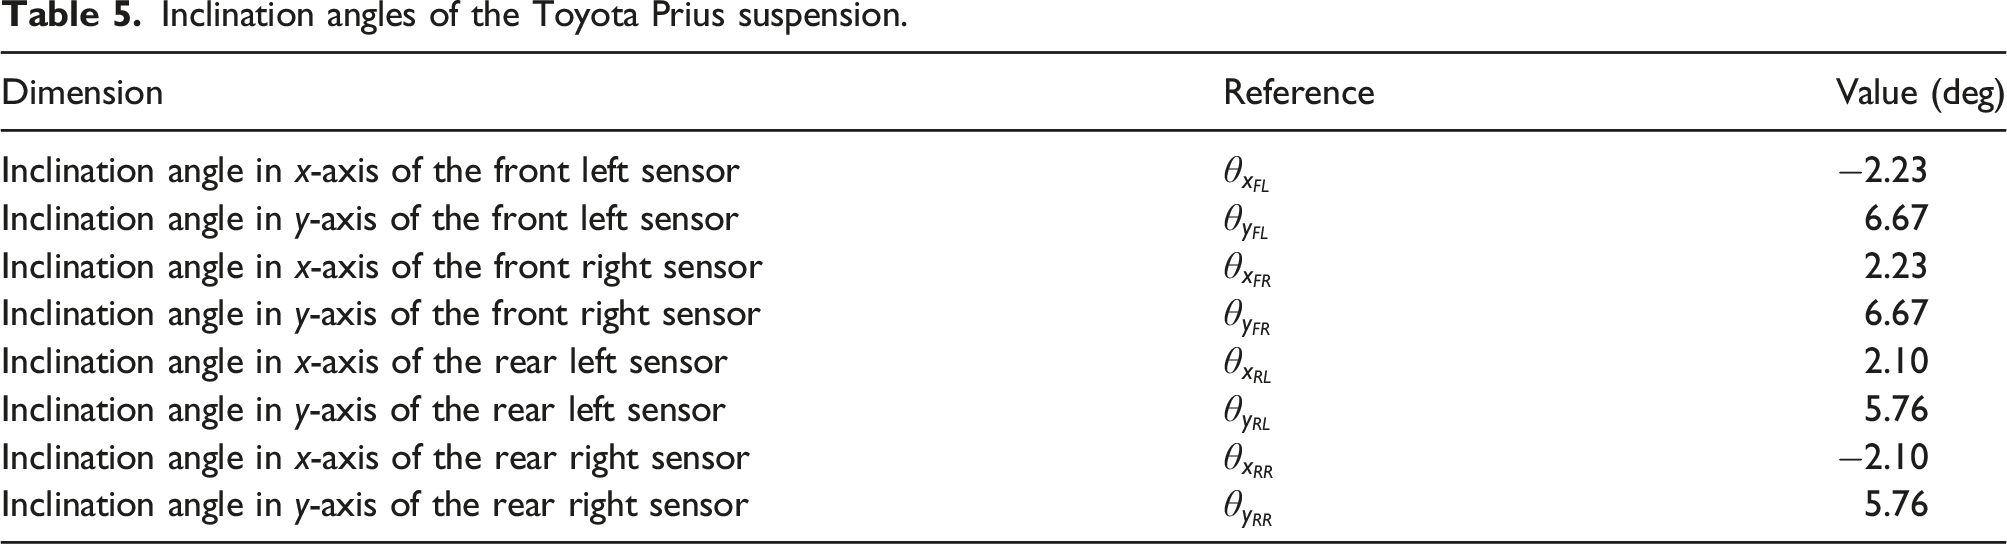
Inclination angles of the Toyota Prius suspension.
Measured acceleration with the PCB sensors in the SAE reference system.
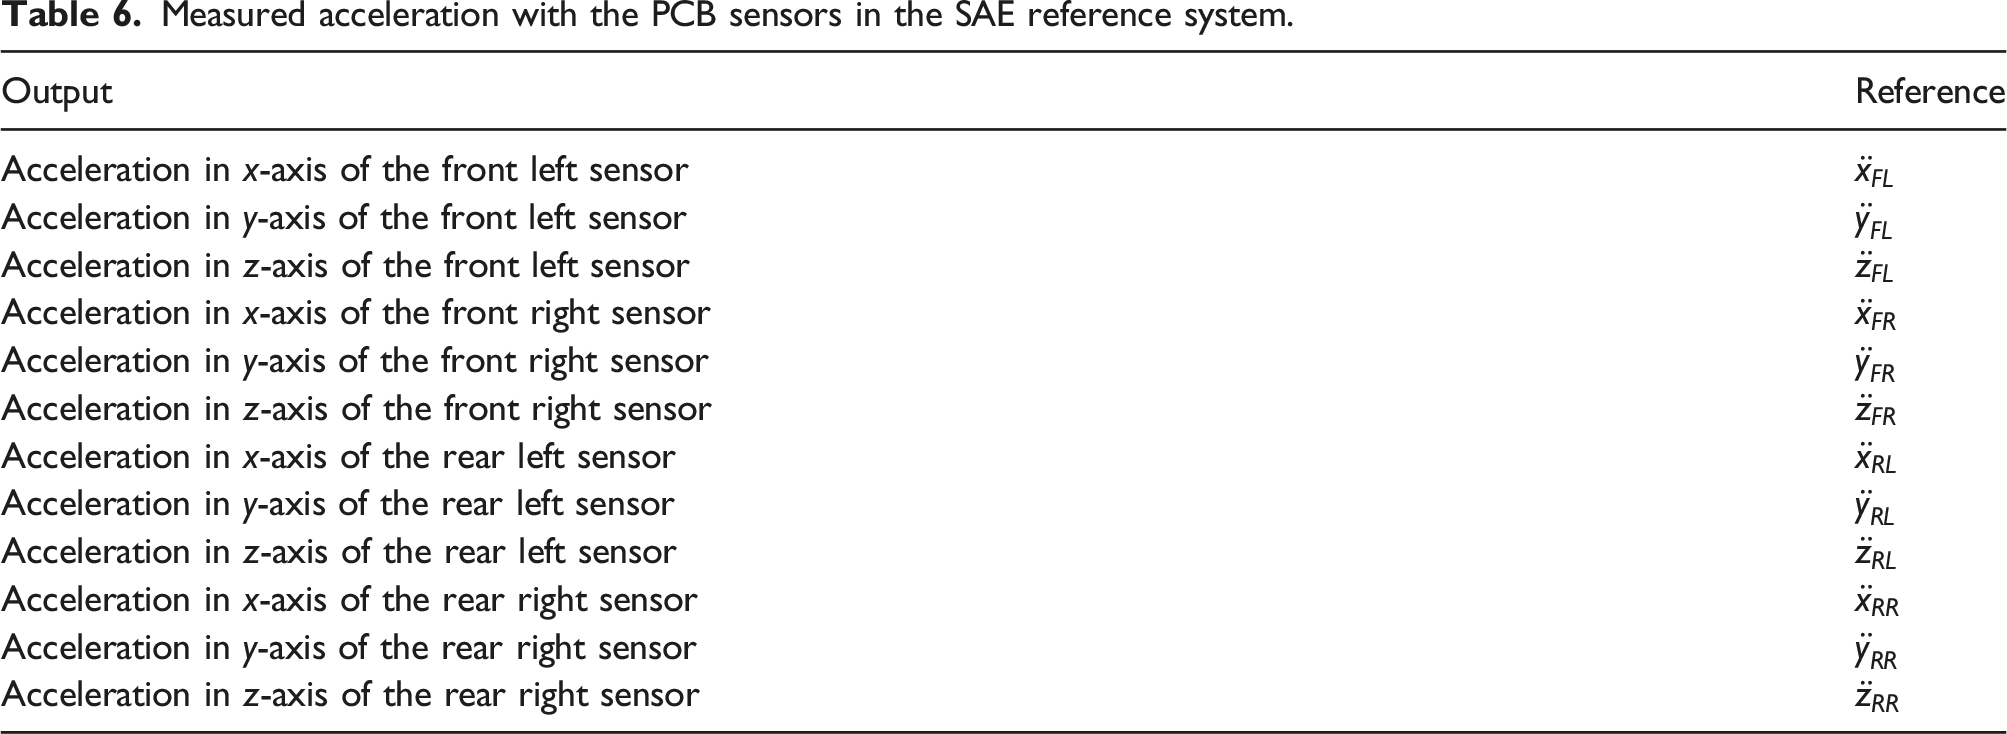
The 12 accelerations from Table 6 are then used to obtain the 6 accelerations in the MPC of the Toyota Prius. Since the excitations obtained in the MPC of the Toyota Prius will be used as the reference inputs to excite the MPC of the Stewart Platform (Figure 1), it is necessary that both MPC refers to the same spatial point. Otherwise, the vibrations transmitted to the seat could be different in both platforms because of different excitation origins. To avoid this, the MPC of the Toyota Prius is at the same position as the MPC of the Stewart Platform referenced to the steering wheel.
Position of the MPC of the Toyota Prius and the Stewart Platform.
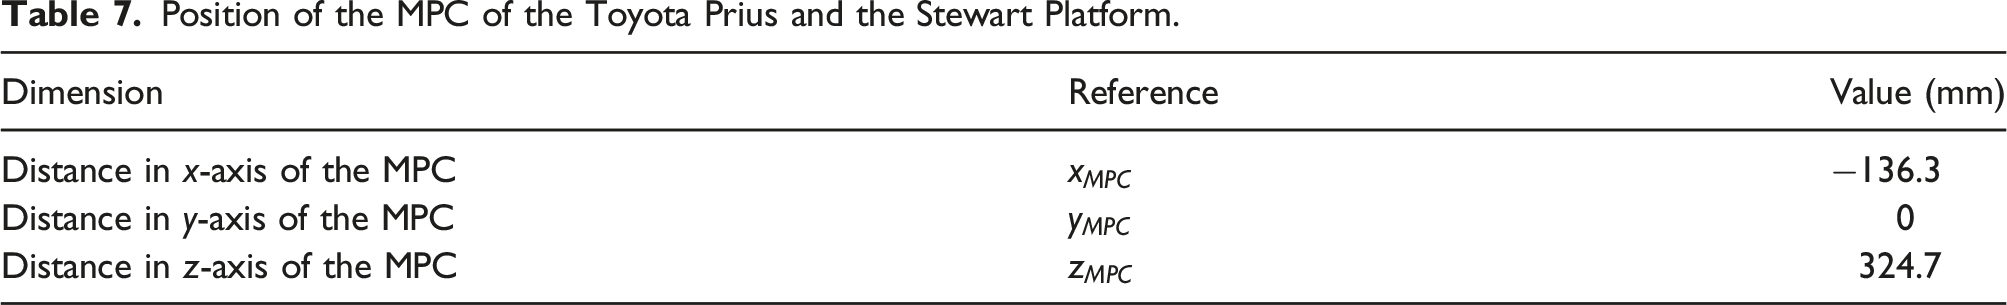
Distances from Table 7 can be used to locate both the MPC of the Stewart Platform and the MPC of the Toyota Prius.
Seat sensor
The seat accelerometer type 4515 is specially designed for whole-body vibration analysis and has been used for the measurement of the acceleration in the contact point of the seat and the driver in order to validate the Stewart Platform from Figure 1 for ride comfort applications by means of the VDV.
Technical specifications of Brüel and Kjaer 4515 seat accelerometer.
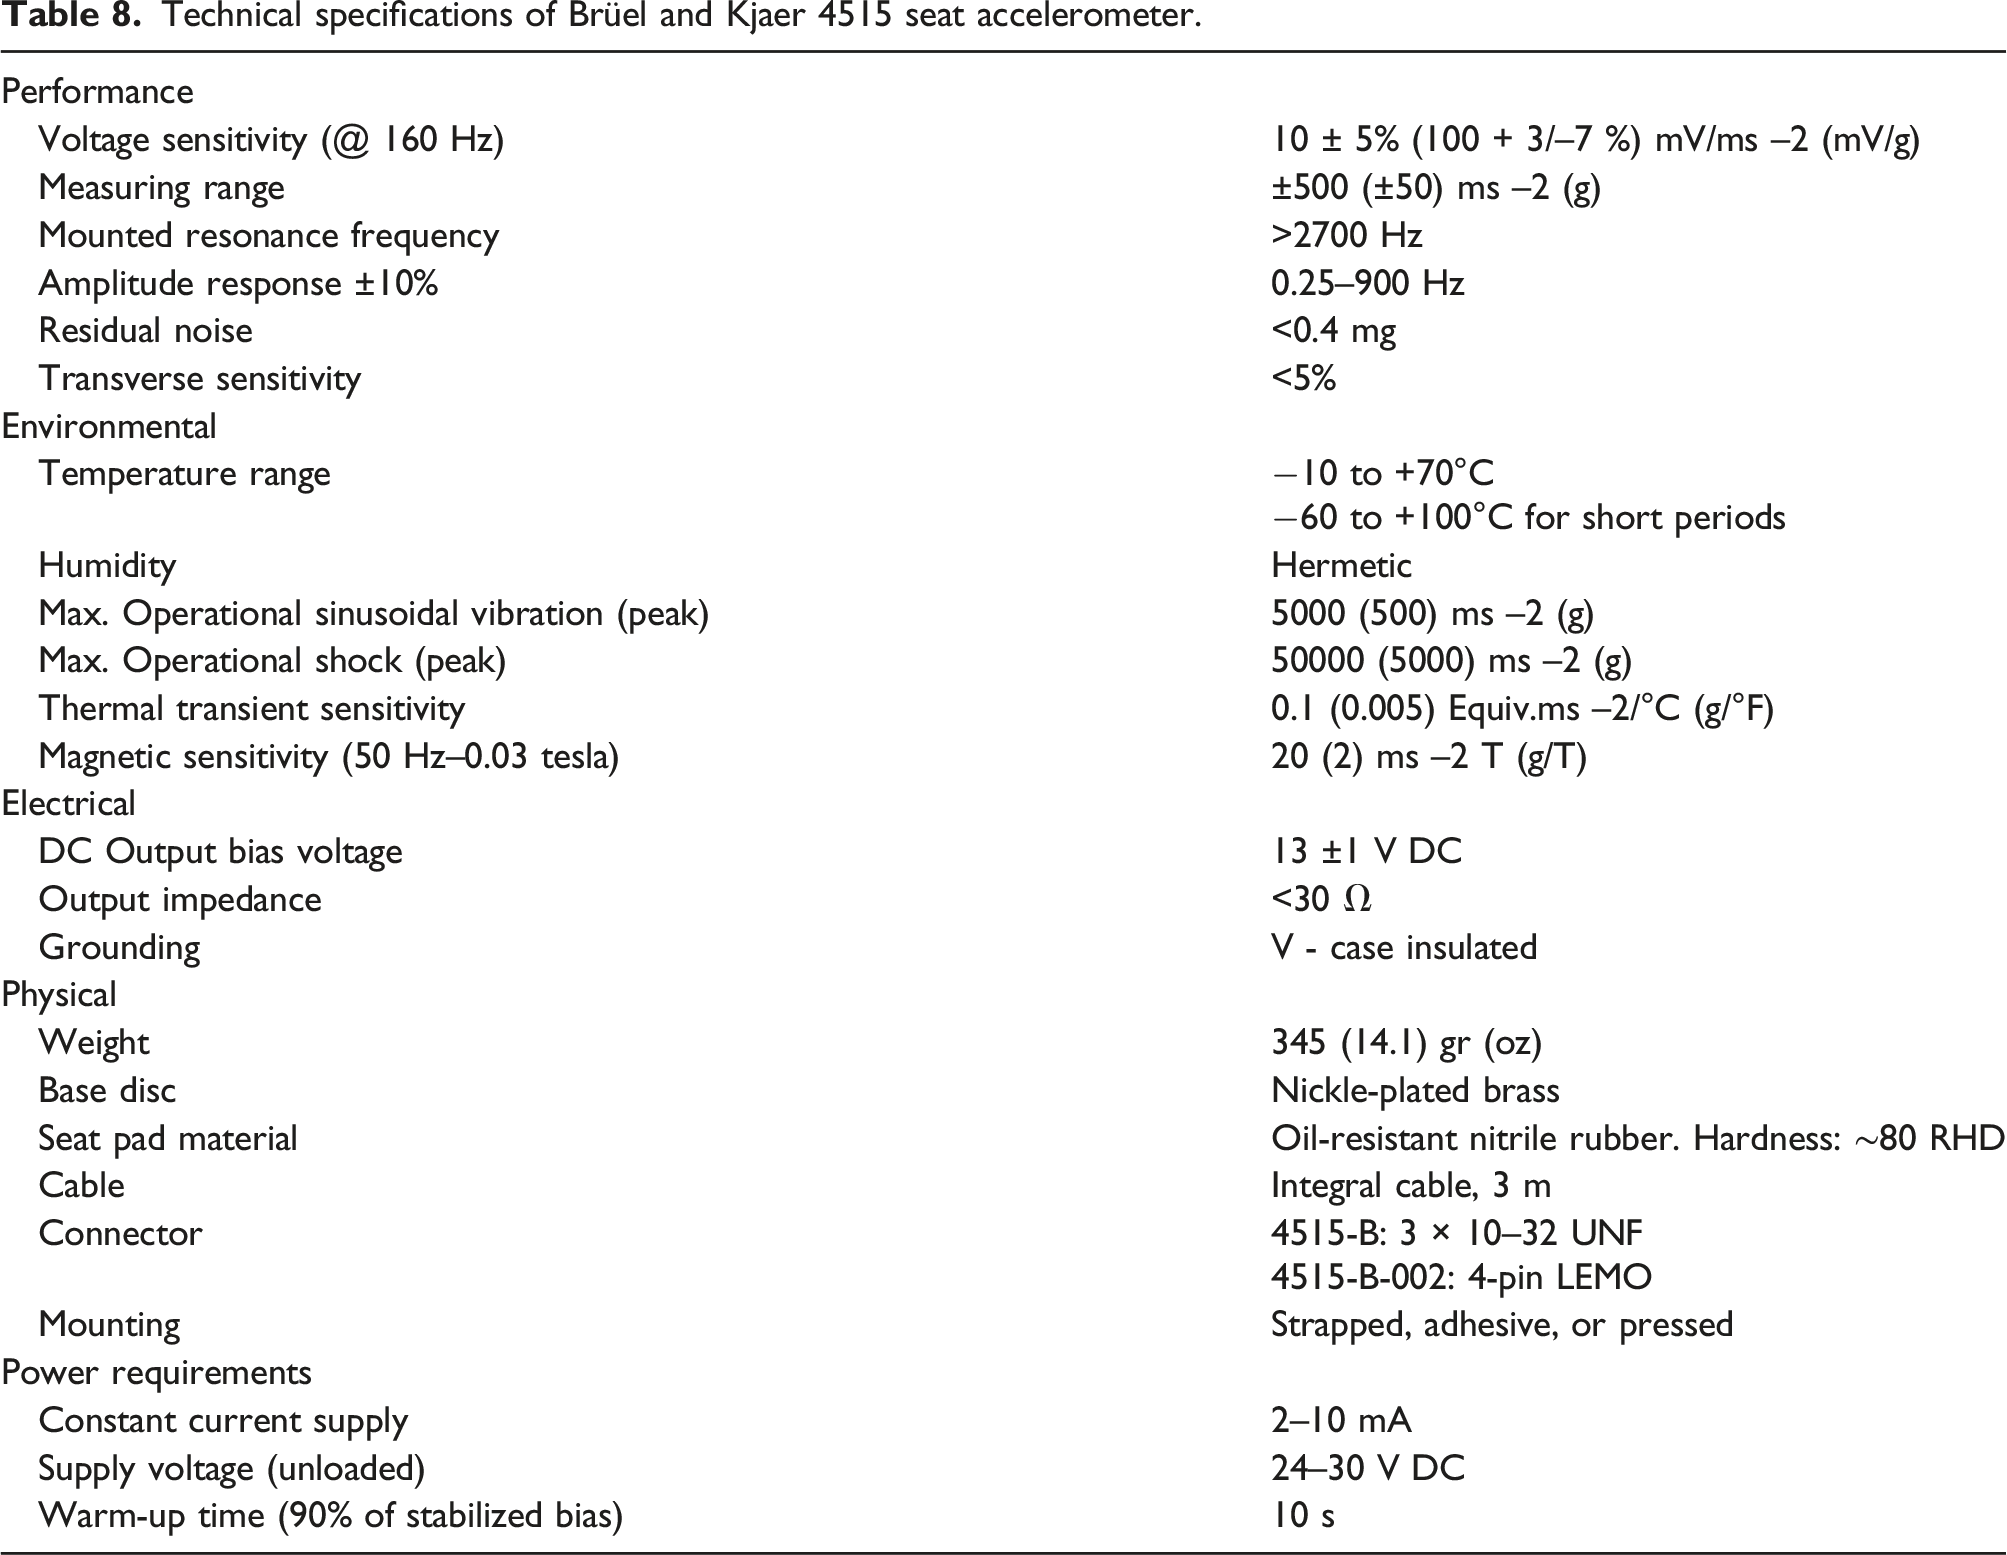
As shown in Table 8, the BK 4515 seat accelerometer is suitable for the evaluation of comfort in all three linear axes in the frequency range under study (1–10 Hz) with a sensitivity of 10 mV/ms2. The sampling frequency used in these measurements is
In Figure 4, the location of the seat accelerometer referenced to the steering wheel is shown. These measurements have been considered for both, seat positioning referenced to the Toyota Prius steering wheel and seat positioning referenced to the simulator steering wheel. Sensors layout in the Toyota Prius.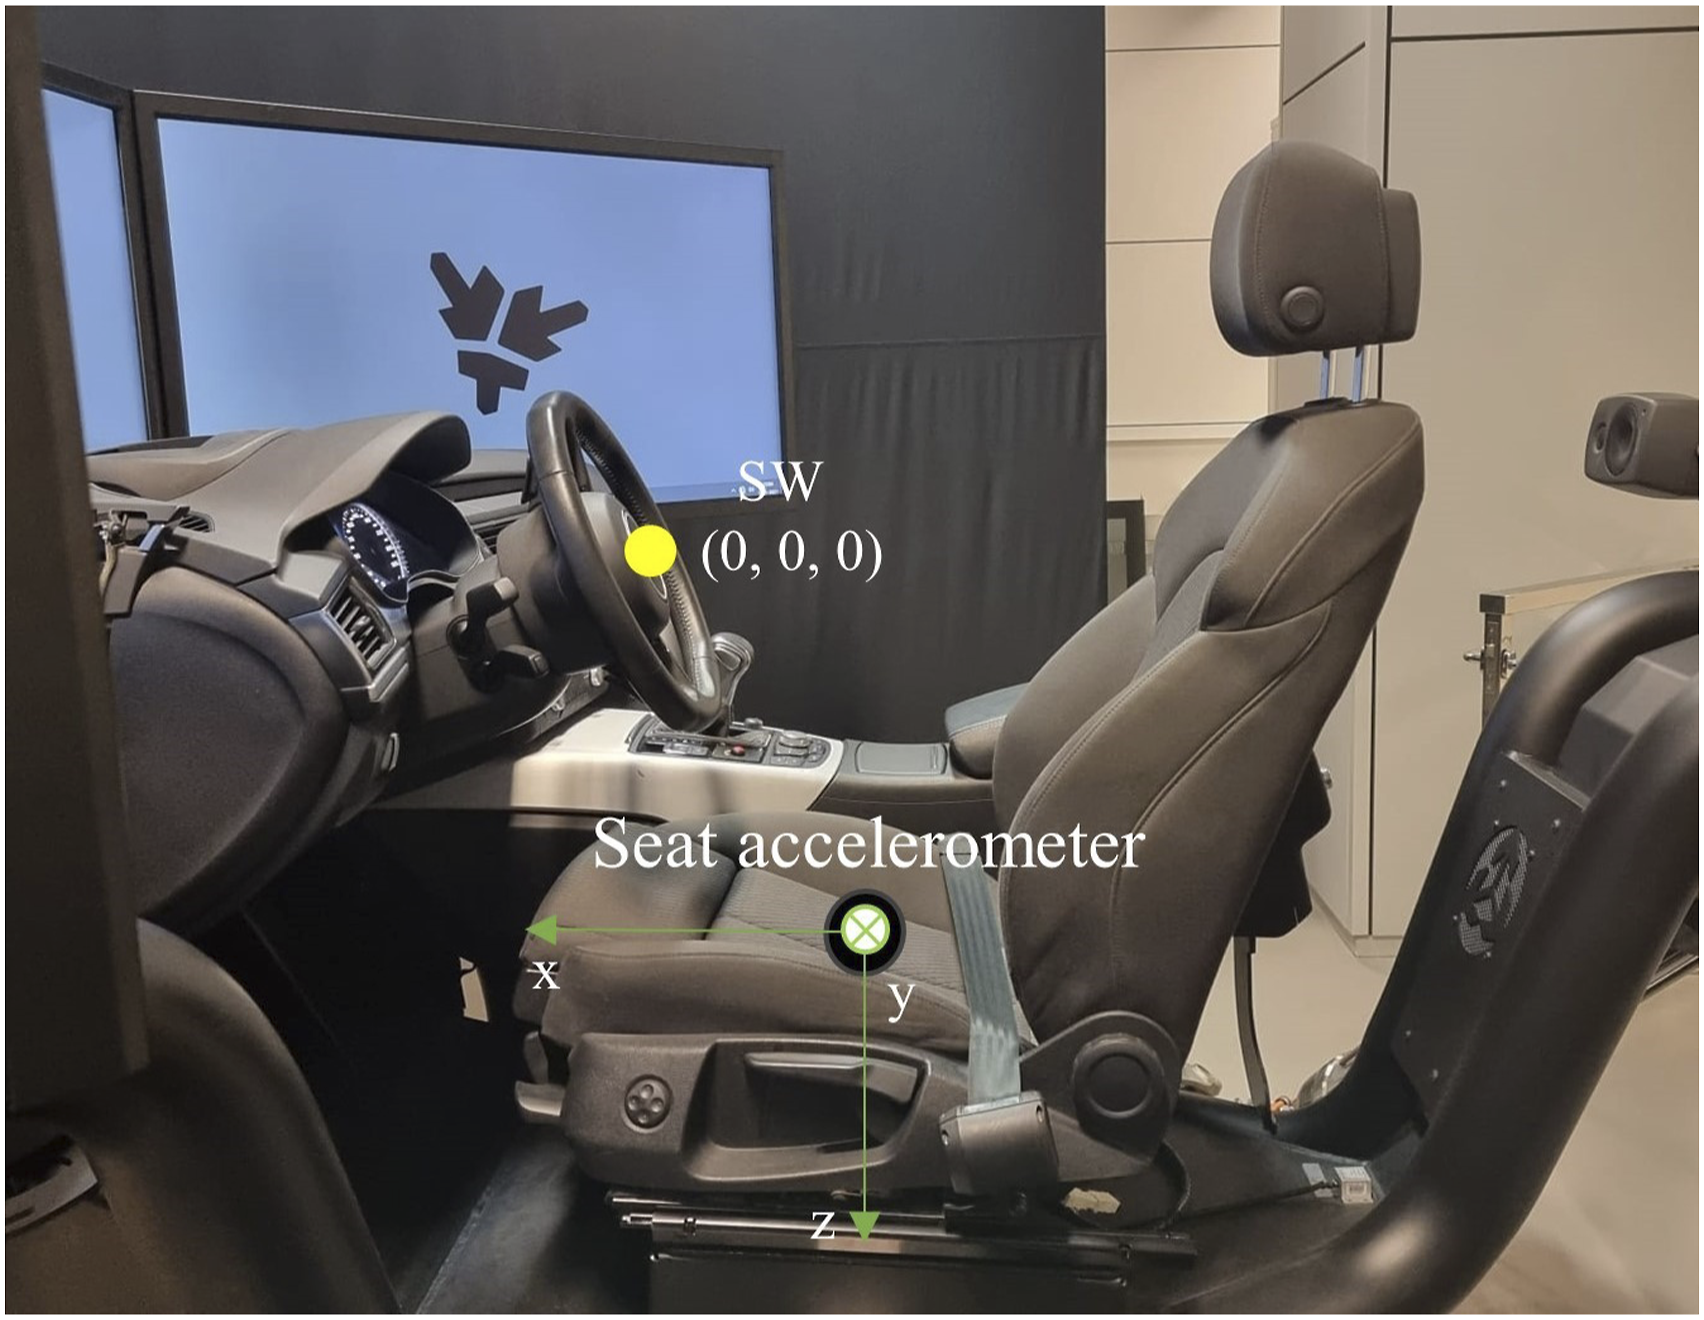
Seat sensor position.
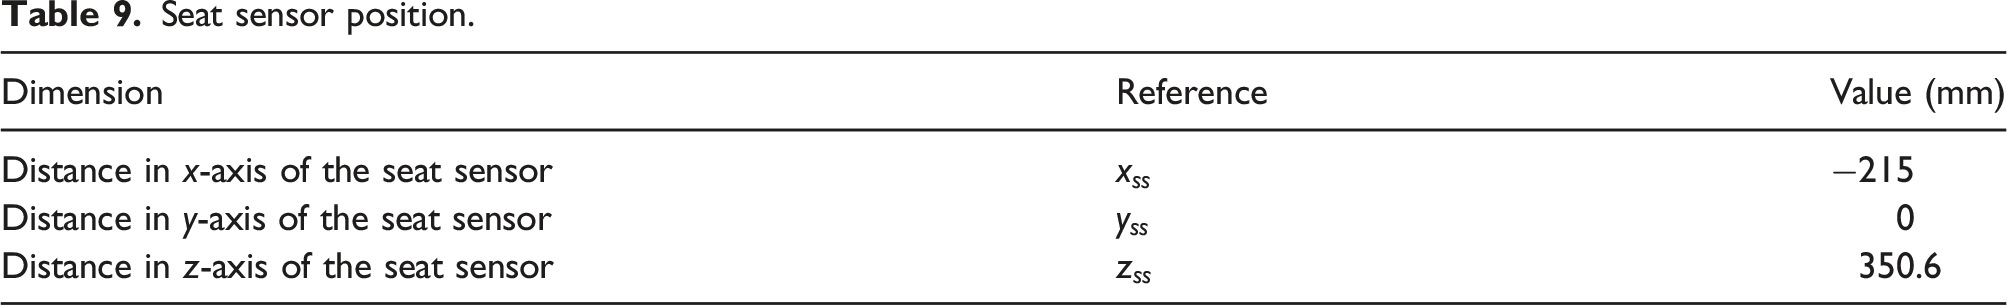
Notice that the reference system of the sensors is x+ backward; y+ right; z+ up. Then, the measured accelerations must be converted to the SAE reference system of the Prius and the Stewart Platform. In consequence, accelerations in the longitudinal and vertical axis must be considered in the opposite direction than the row measurement. Moreover, the Toyota Prius seat has an inclination angle
Since the measurements in the Prius and in the simulator have been obtained considering the same driver and seat structure, discrepancies in the VDVs potentially influenced by different transmissibilities have been avoided.
Sprung mass vibration signals
In order to obtain the vibration of the sprung mass for each test, the bump roll right test at 5 km/h will be explained as an example in this section (consider that this methodology is applicable to the other experiments and velocities).
First, the 12 measured acceleration from Table 6 are filtered between 1 and 10 Hz as it is the studied frequency range. Then, the contributions in the three linear axis are obtained for each sensor according to the linear algebra theory using the rotation matrices in order to perform rotations in the Euclidean space.
Considering that the accelerometers from Figure 3, have an inclination angle around the x- and y-axis (see Table 5), the vector of linear accelerations of the SX sensor can be obtained as
being
Computed linear accelerations in the suspension corners.
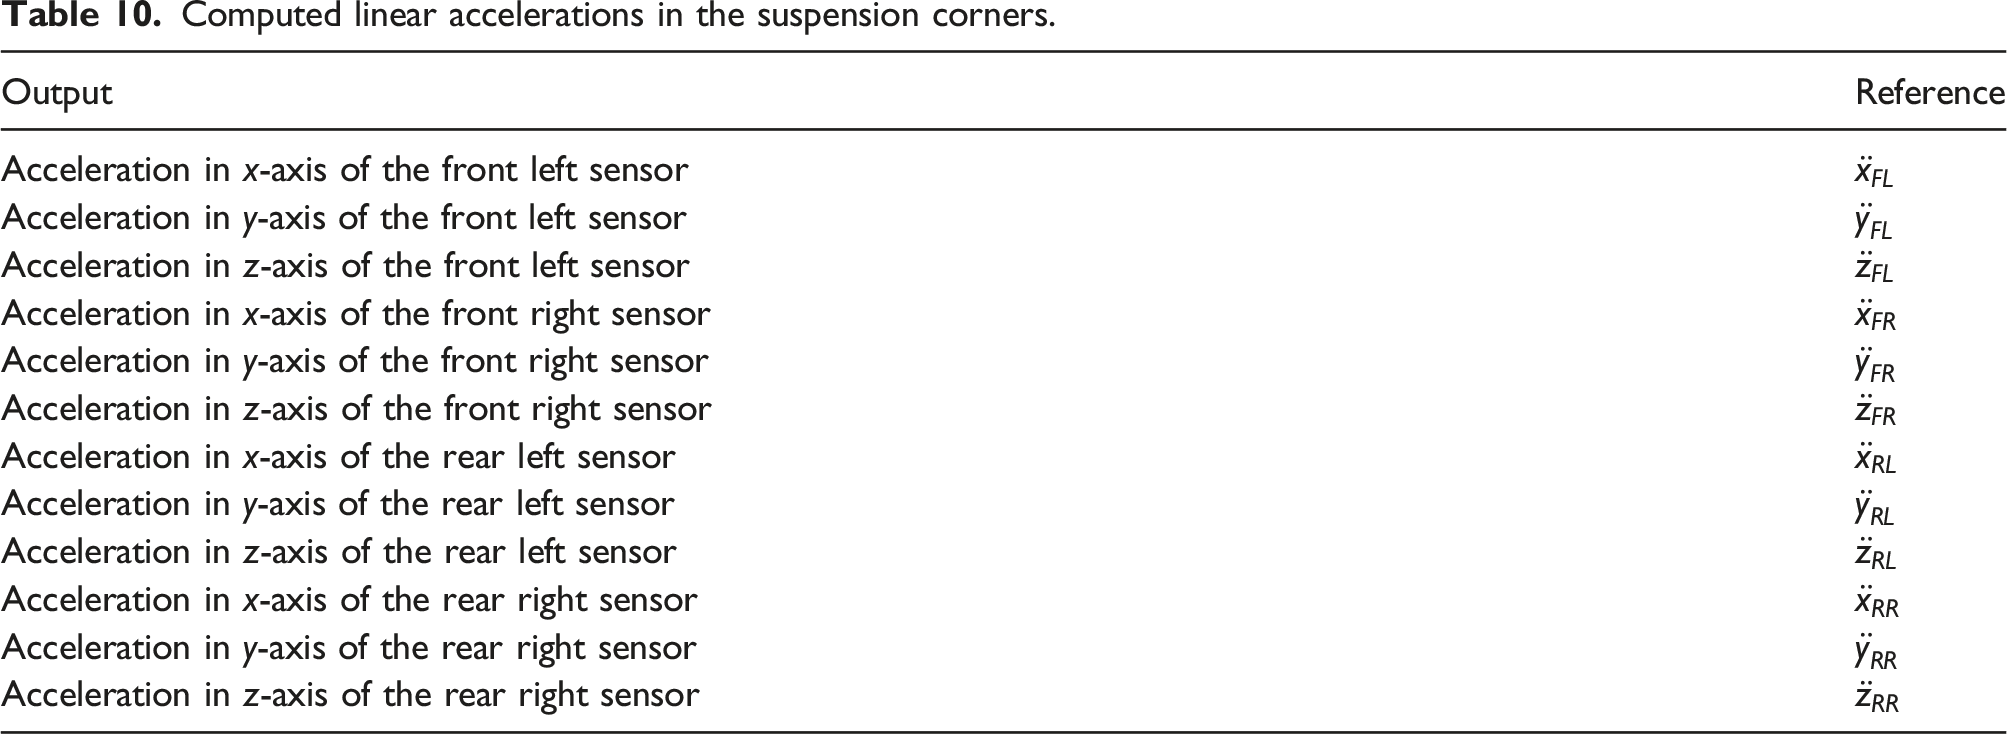
Figure 5 shows the linear accelerations gathered in Table 10 filtered from 1 to 10 Hz obtained from the row data from the four sensors located on the upper base of the suspension of the Toyota Prius (see Figure 3) for the bump roll right test at 5 km/h. These are the linear accelerations (x, y and z) measured in the front left (FL), front right (FR), rear left (RL), and rear right (RR) corners. Filtered linear acceleration outputs measured computed in the front left (FL), front right (FR), rear left (RL), and rear right (RR) suspension corners.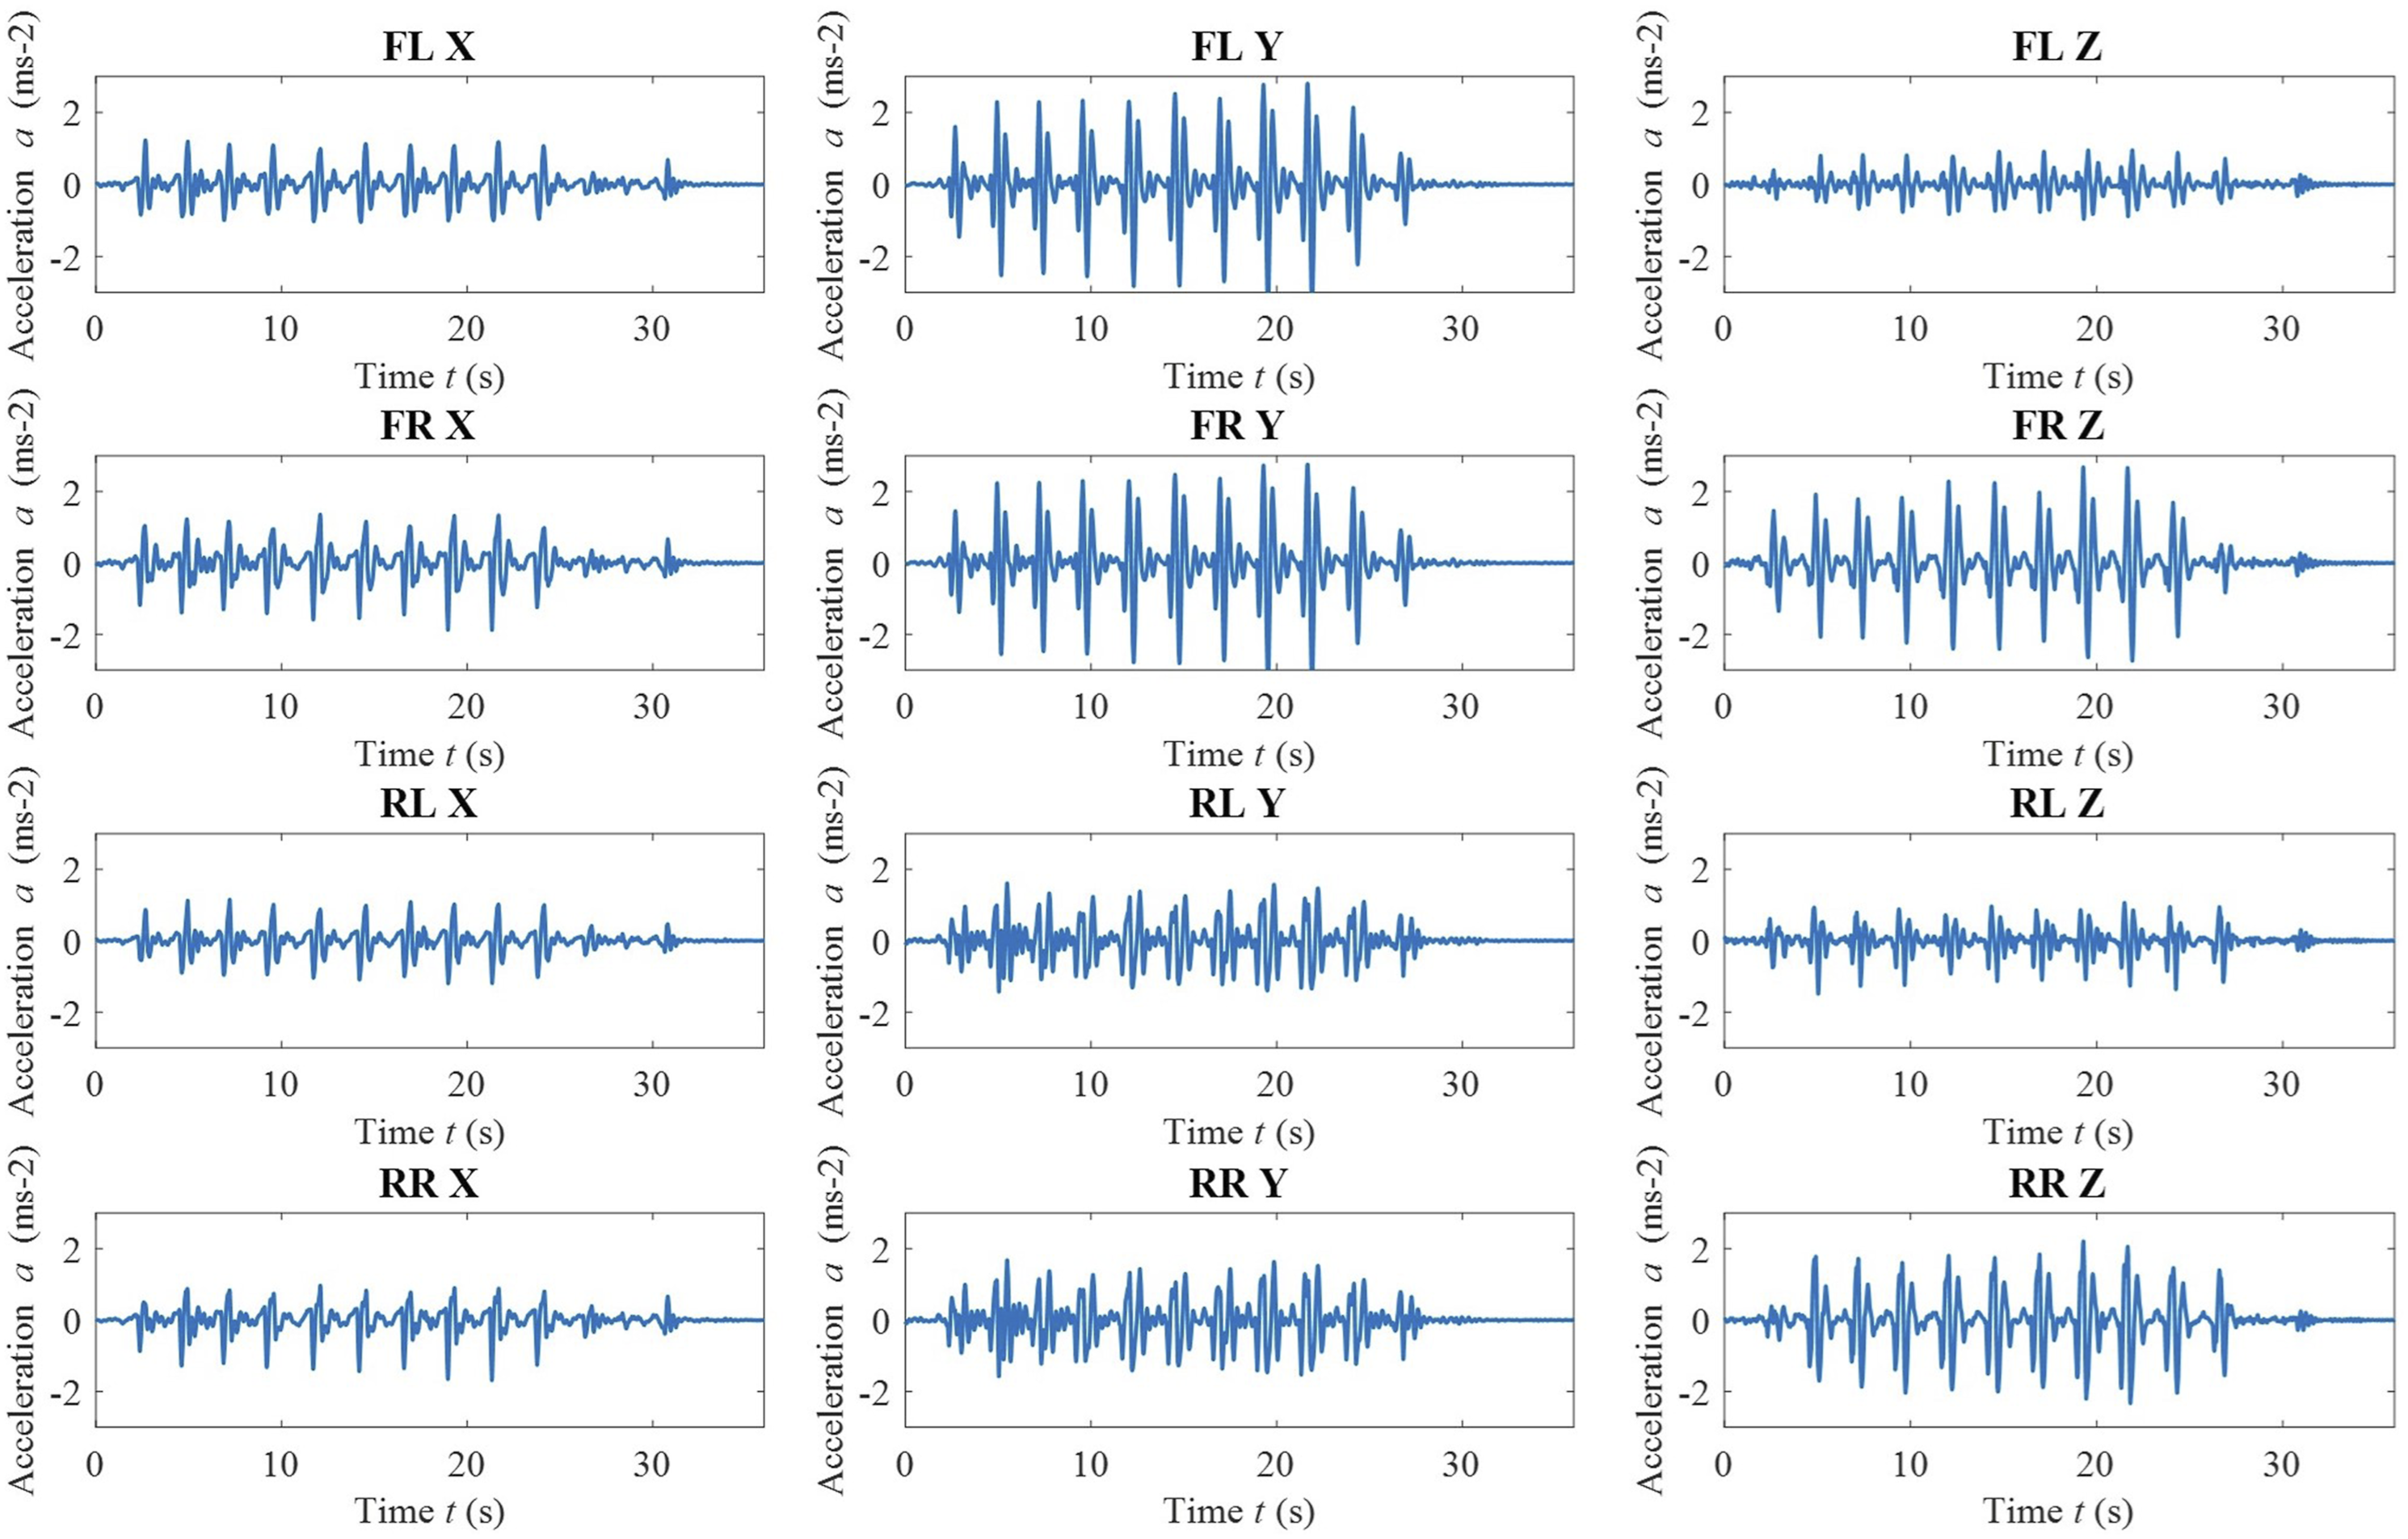
Now, accelerations from Figure 5 are used to calculate the 6 DOF accelerations in the MPC of the Toyota Prius. On the one hand, taking into account the kinematic model of an non-deformable rigid solid body, it follows that the total translation speed and acceleration are the same for all the points of the chassis.
39
Thus, the linear contribution derived from the translational accelerations in the MPC are the same for the three sensors.
On the other hand, the linear contribution derived from the rotational accelerations in the MPC have been obtained from the analysis carried out by Santos and García-Barruetabeña, 2021.
Following this analysis for the four sensors located on the upper base of the suspension corners and considering positive inputs in the three rotational DoF, the 12 linear acceleration outputs (see Table 10) can be defined as Accelerations of the sprung mass of the Toyota Prius computed at the MPC for the bump roll right at 5 km/h. (a) x-axis. (b) y-axis. (c) z-axis. (d) 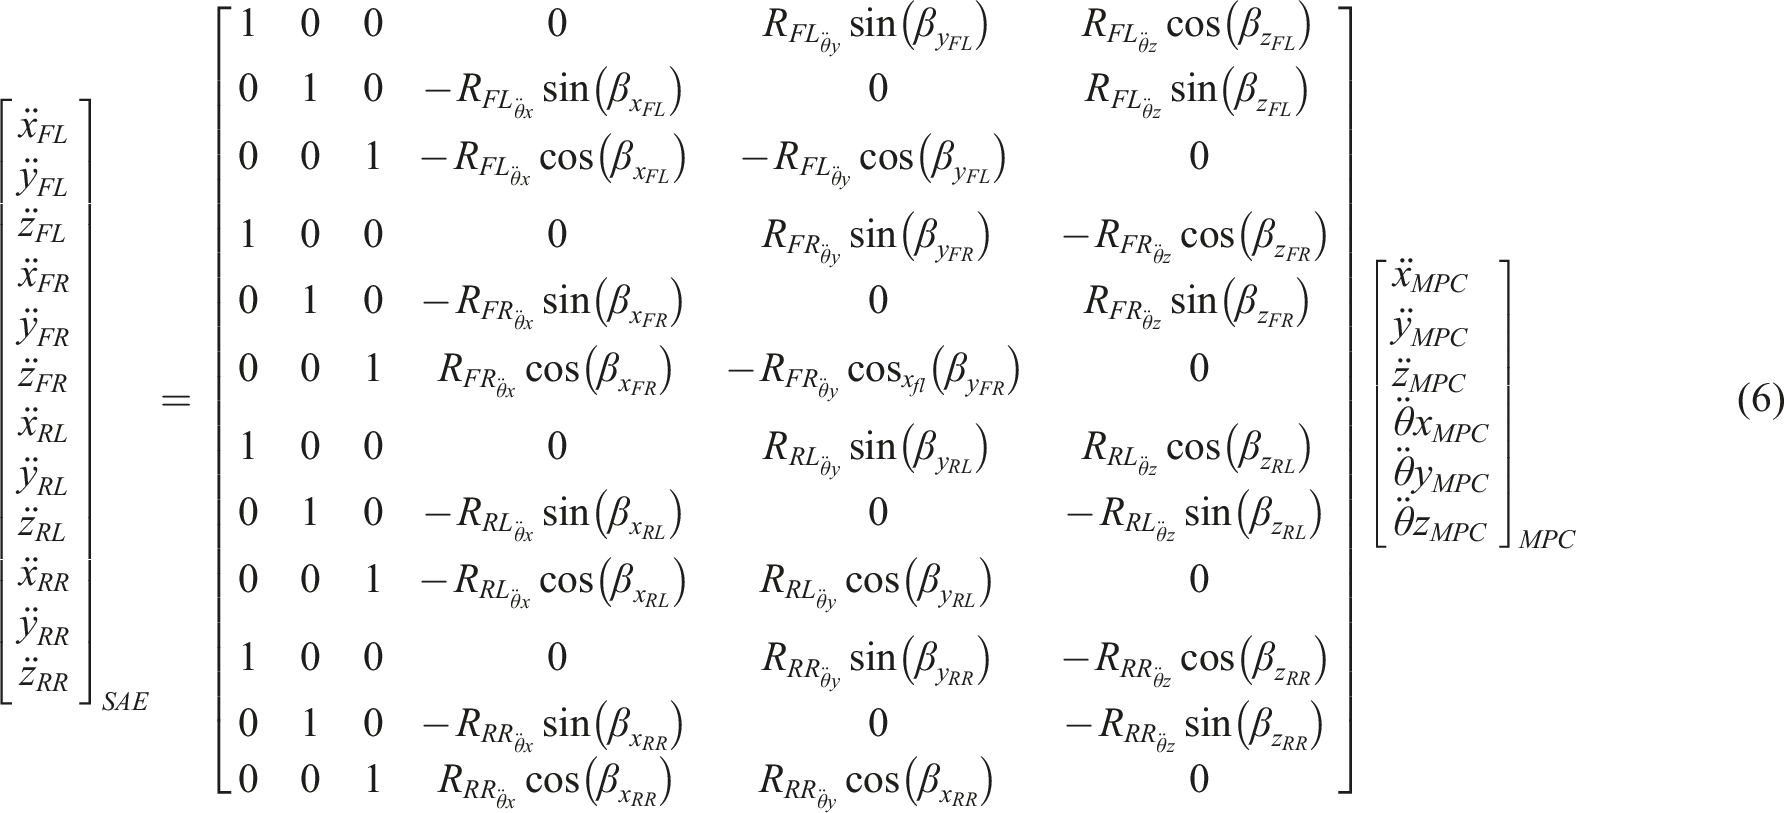
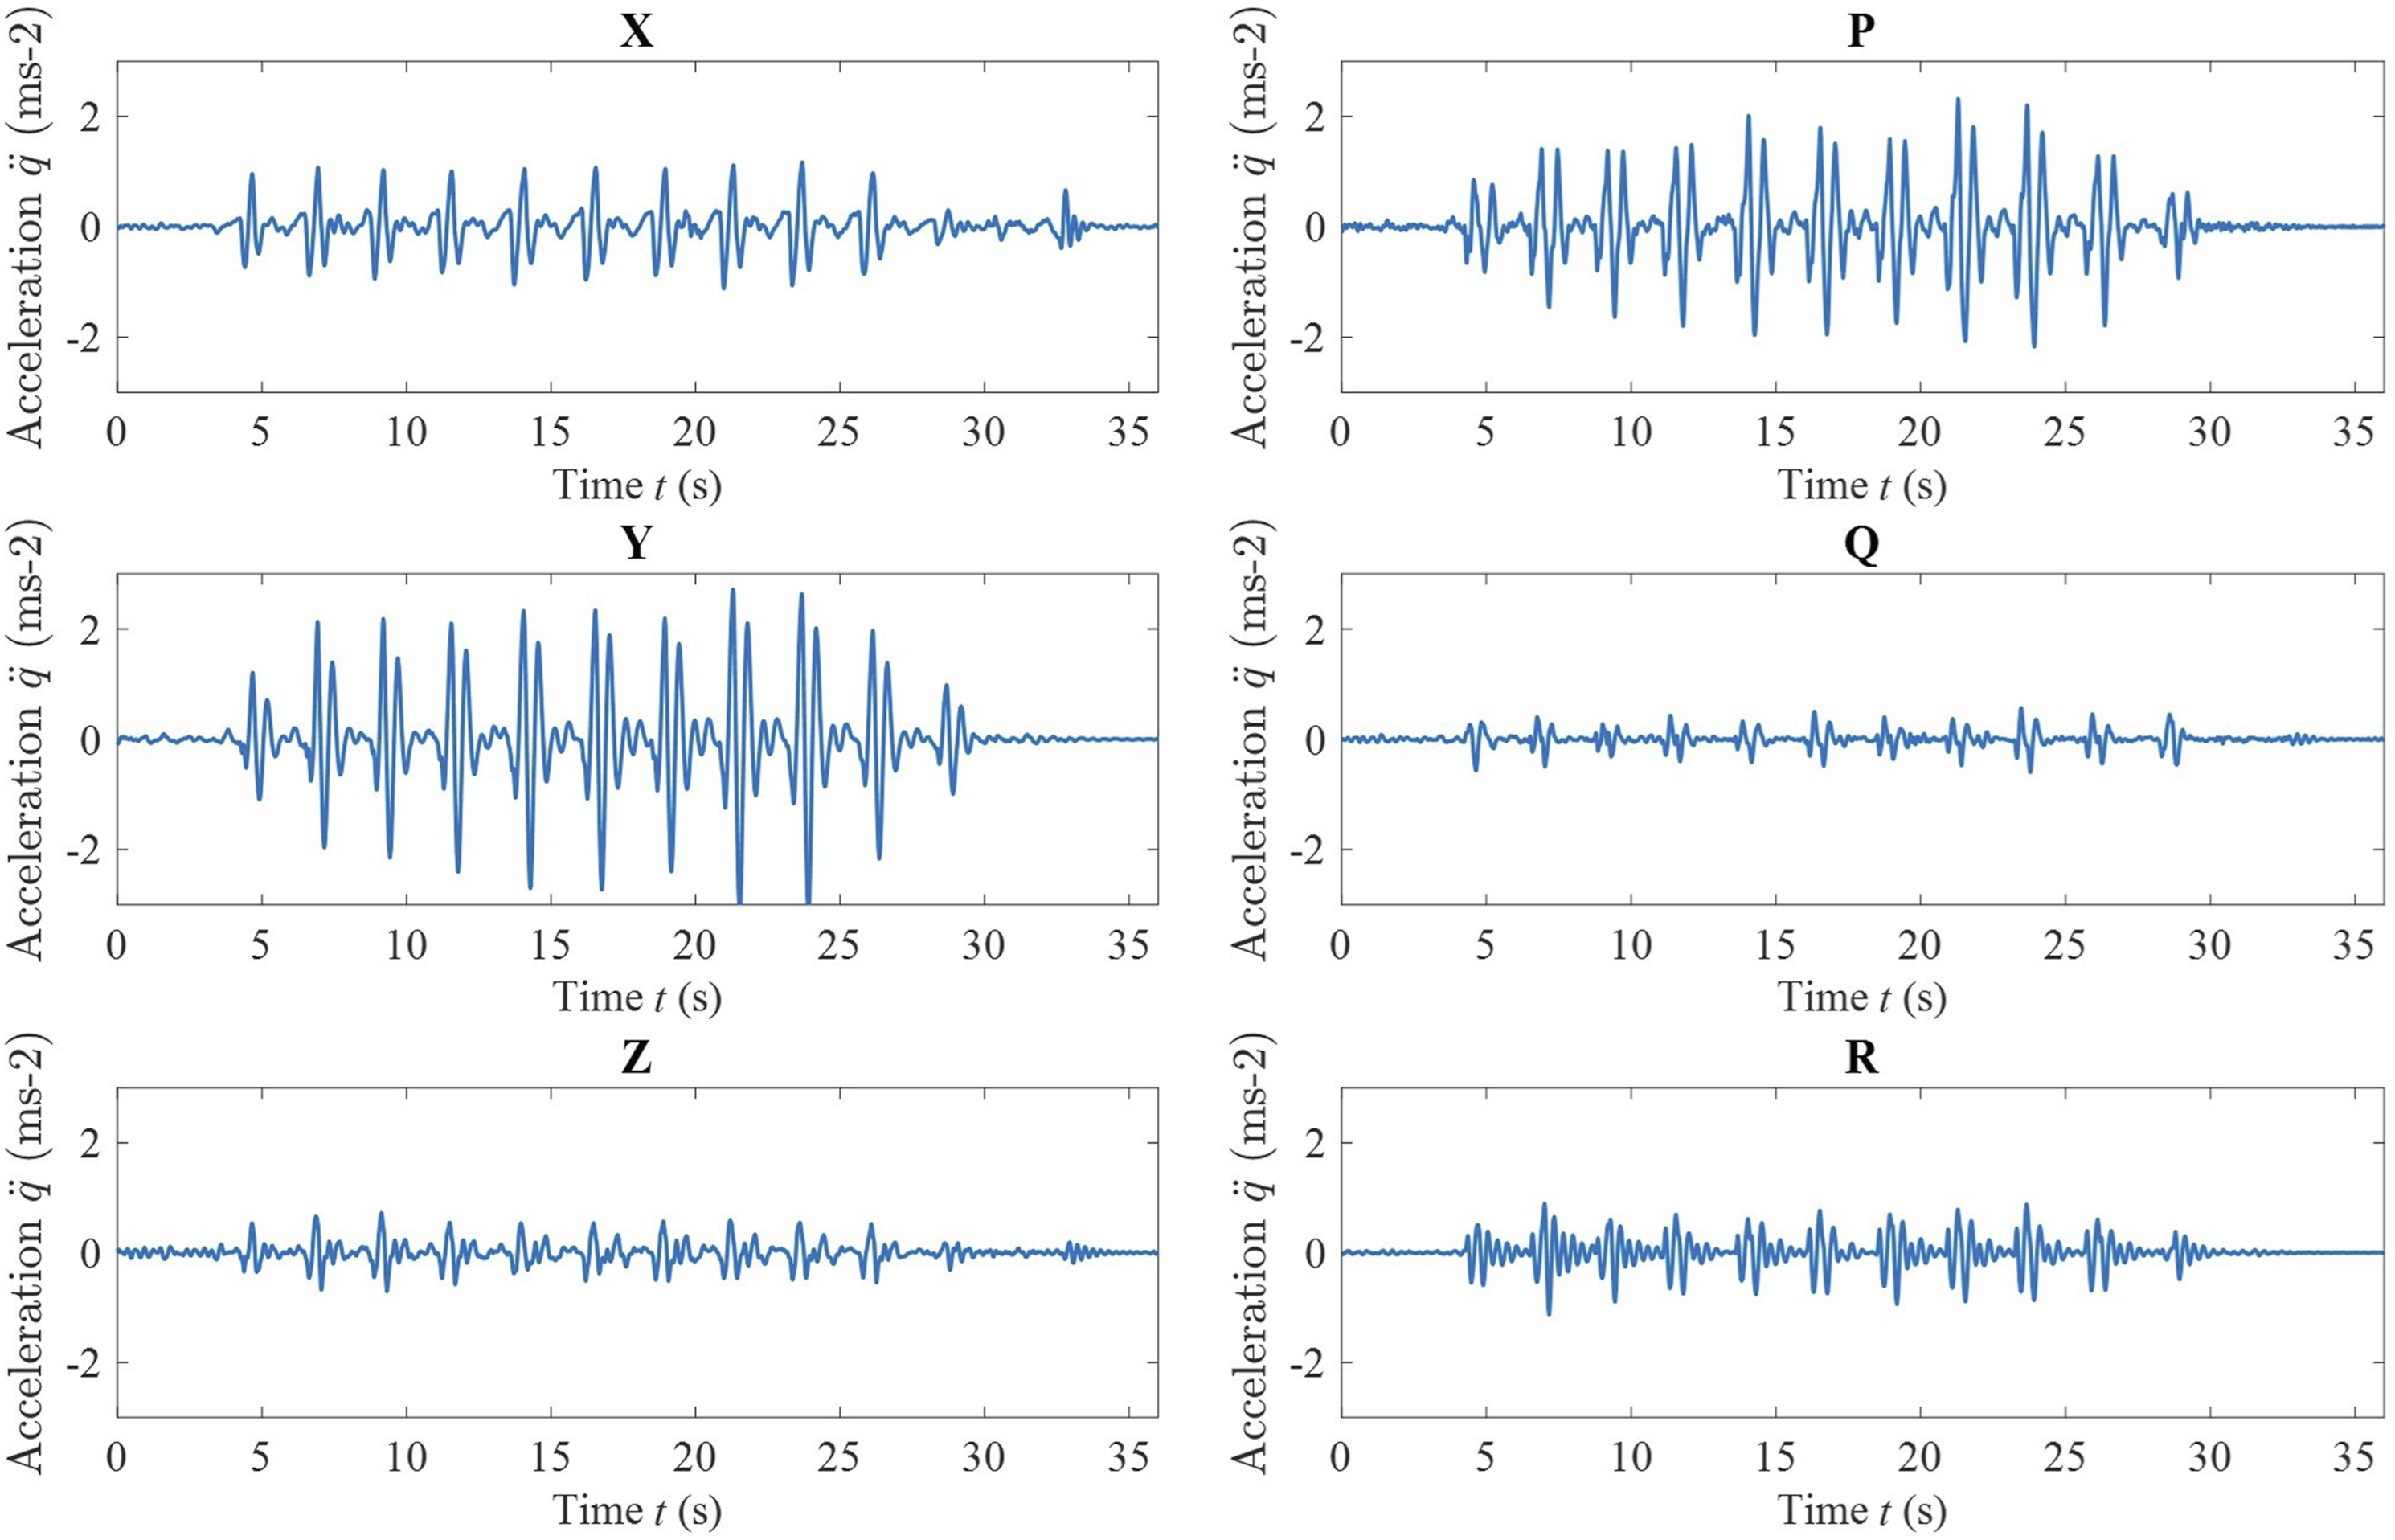
Then, accelerations from Figure 6 have been controlled according to the experimental control strategy proposed by Santos and García-Barruetabeña, 2021 in order to used them as the reference inputs to replicate the experimental campaign on the Stewart Platform for each evaluated test (see section Comfort tests). With this control, Figure 7 shows the temporal analysis and Figure 8 shows the frequency analysis of the inputs and outputs referenced to the MPC of the driving simulator. Temporal analysis of the inputs and outputs at the MPC of the Stewart Platform for the bump roll right test at 5 km/h. (a) x-axis. (b) y-axis. (c) z-axis. (d) Spectral analysis of the inputs and outputs at the MPC of the Stewart Platform for the bump roll right test at 5 km/h. (a) x-axis. (b) y-axis. (c) z-axis. (d) 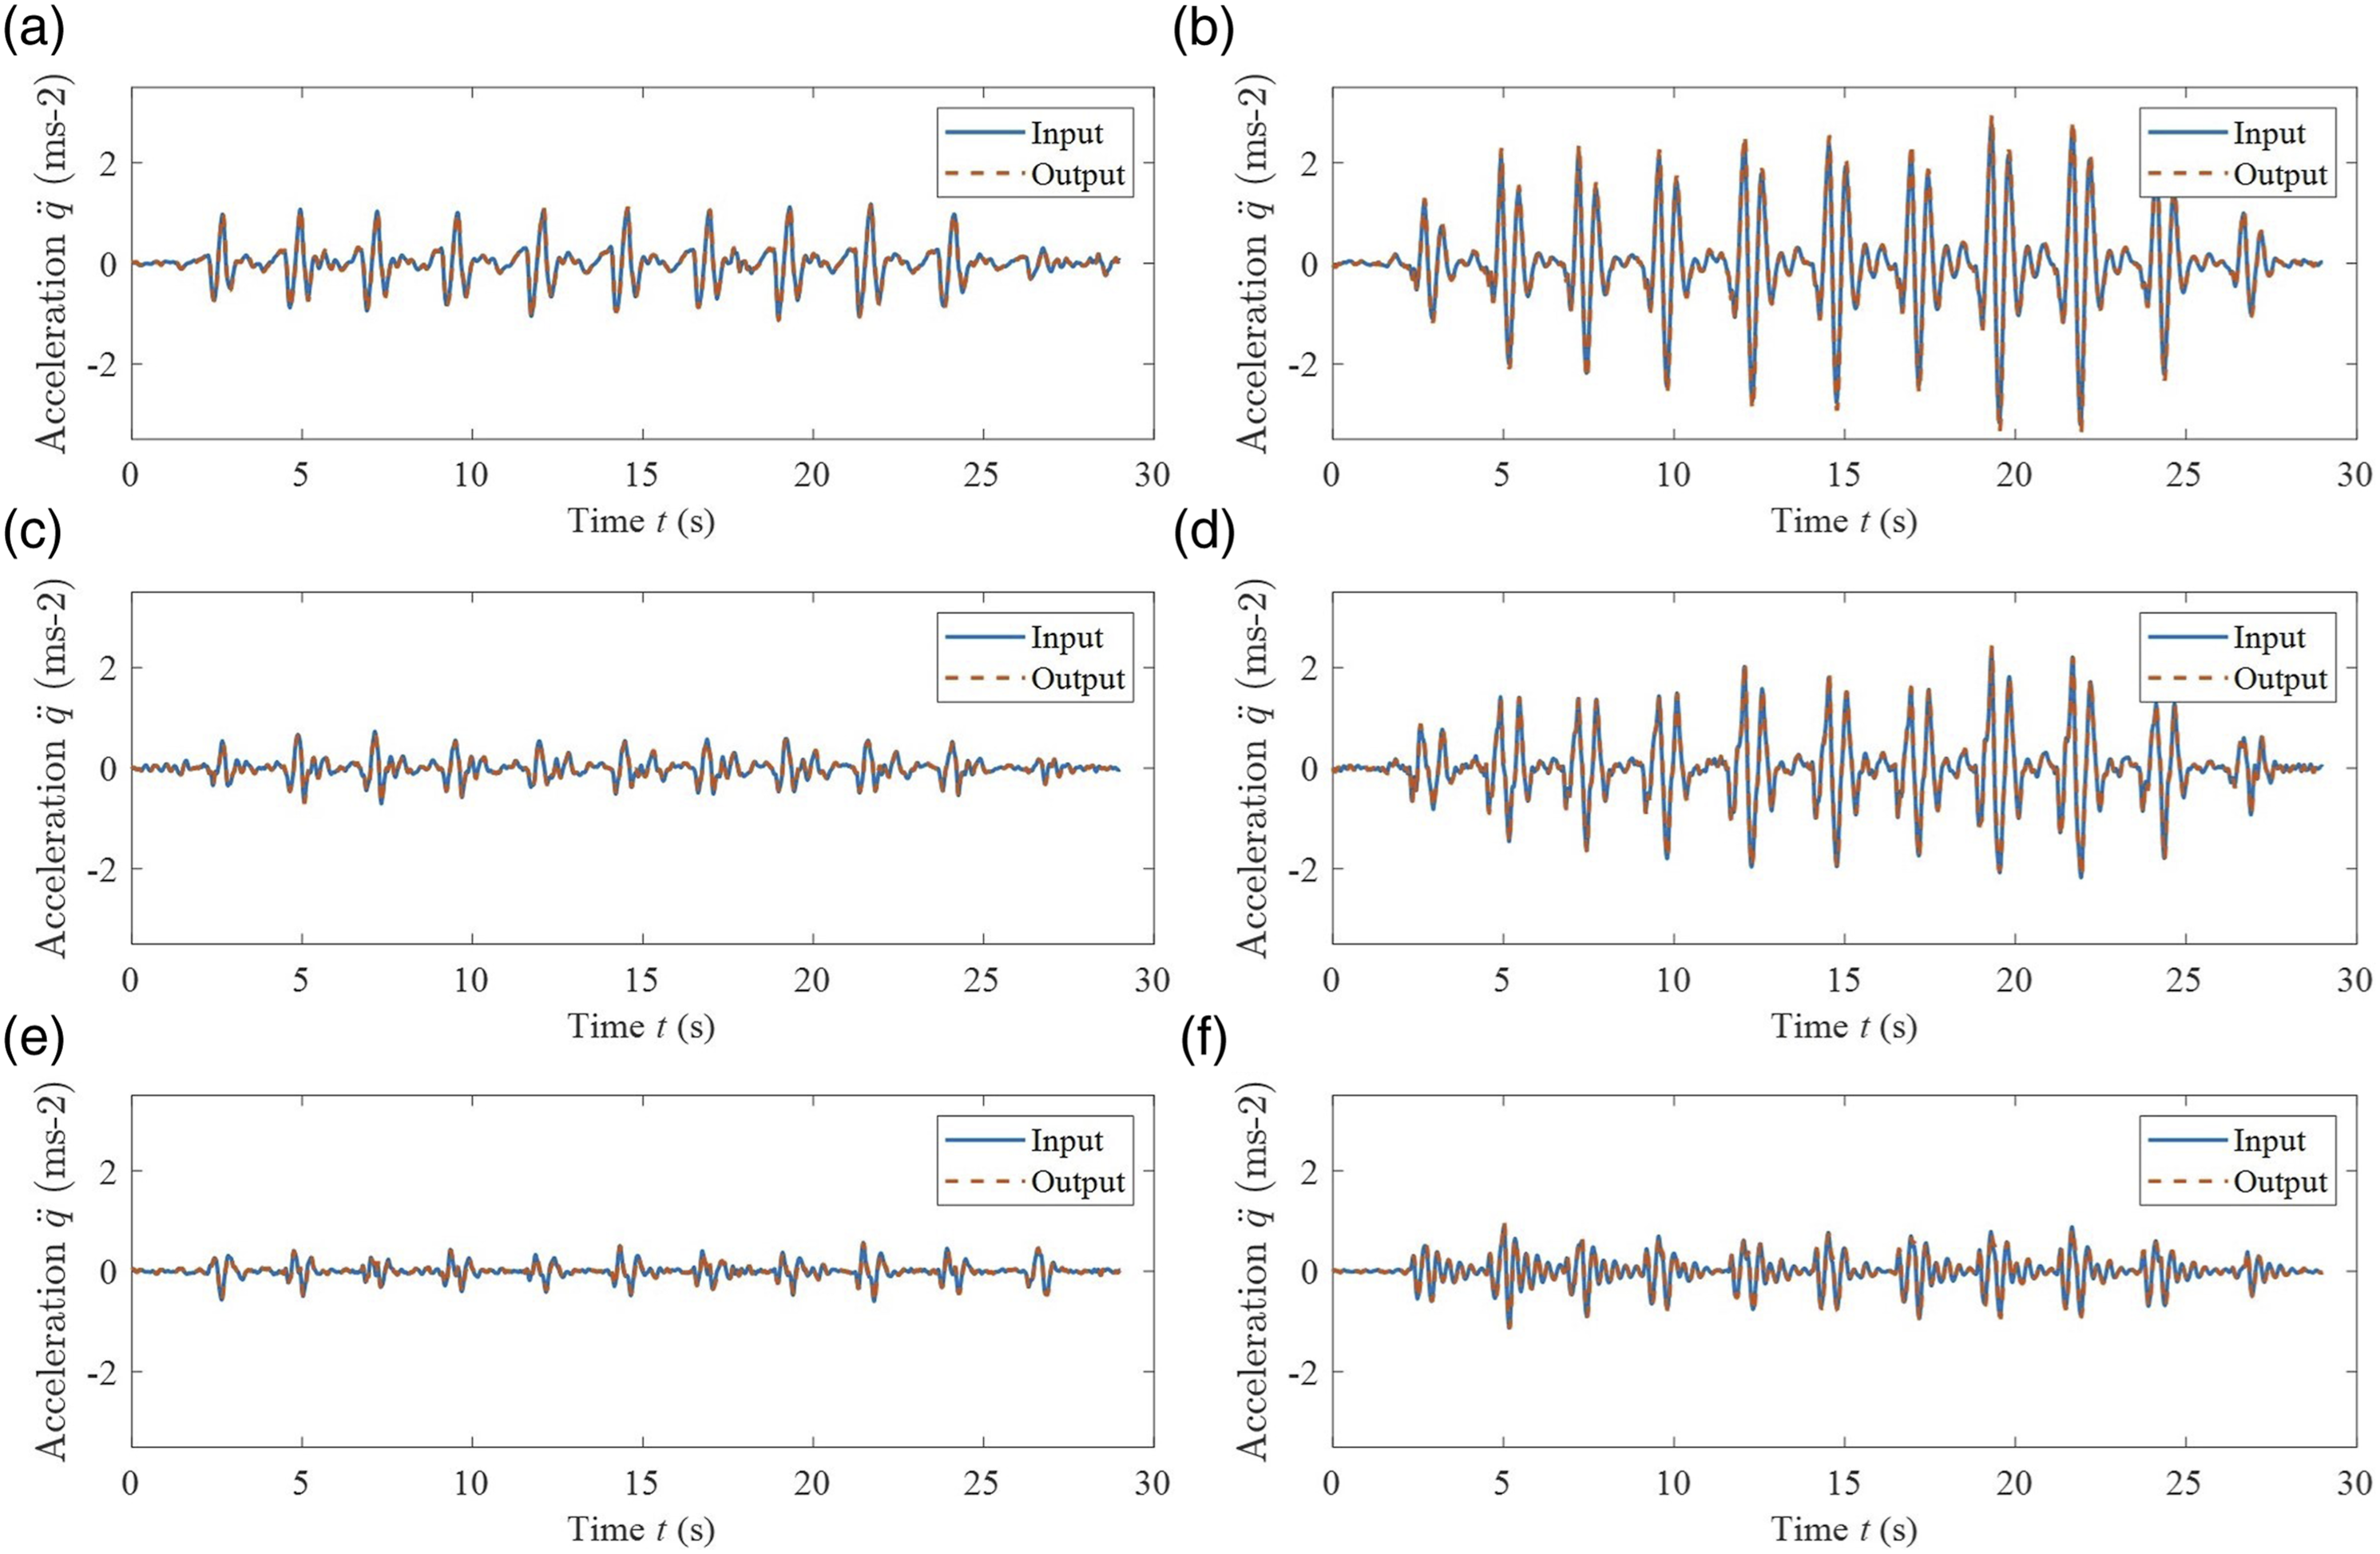
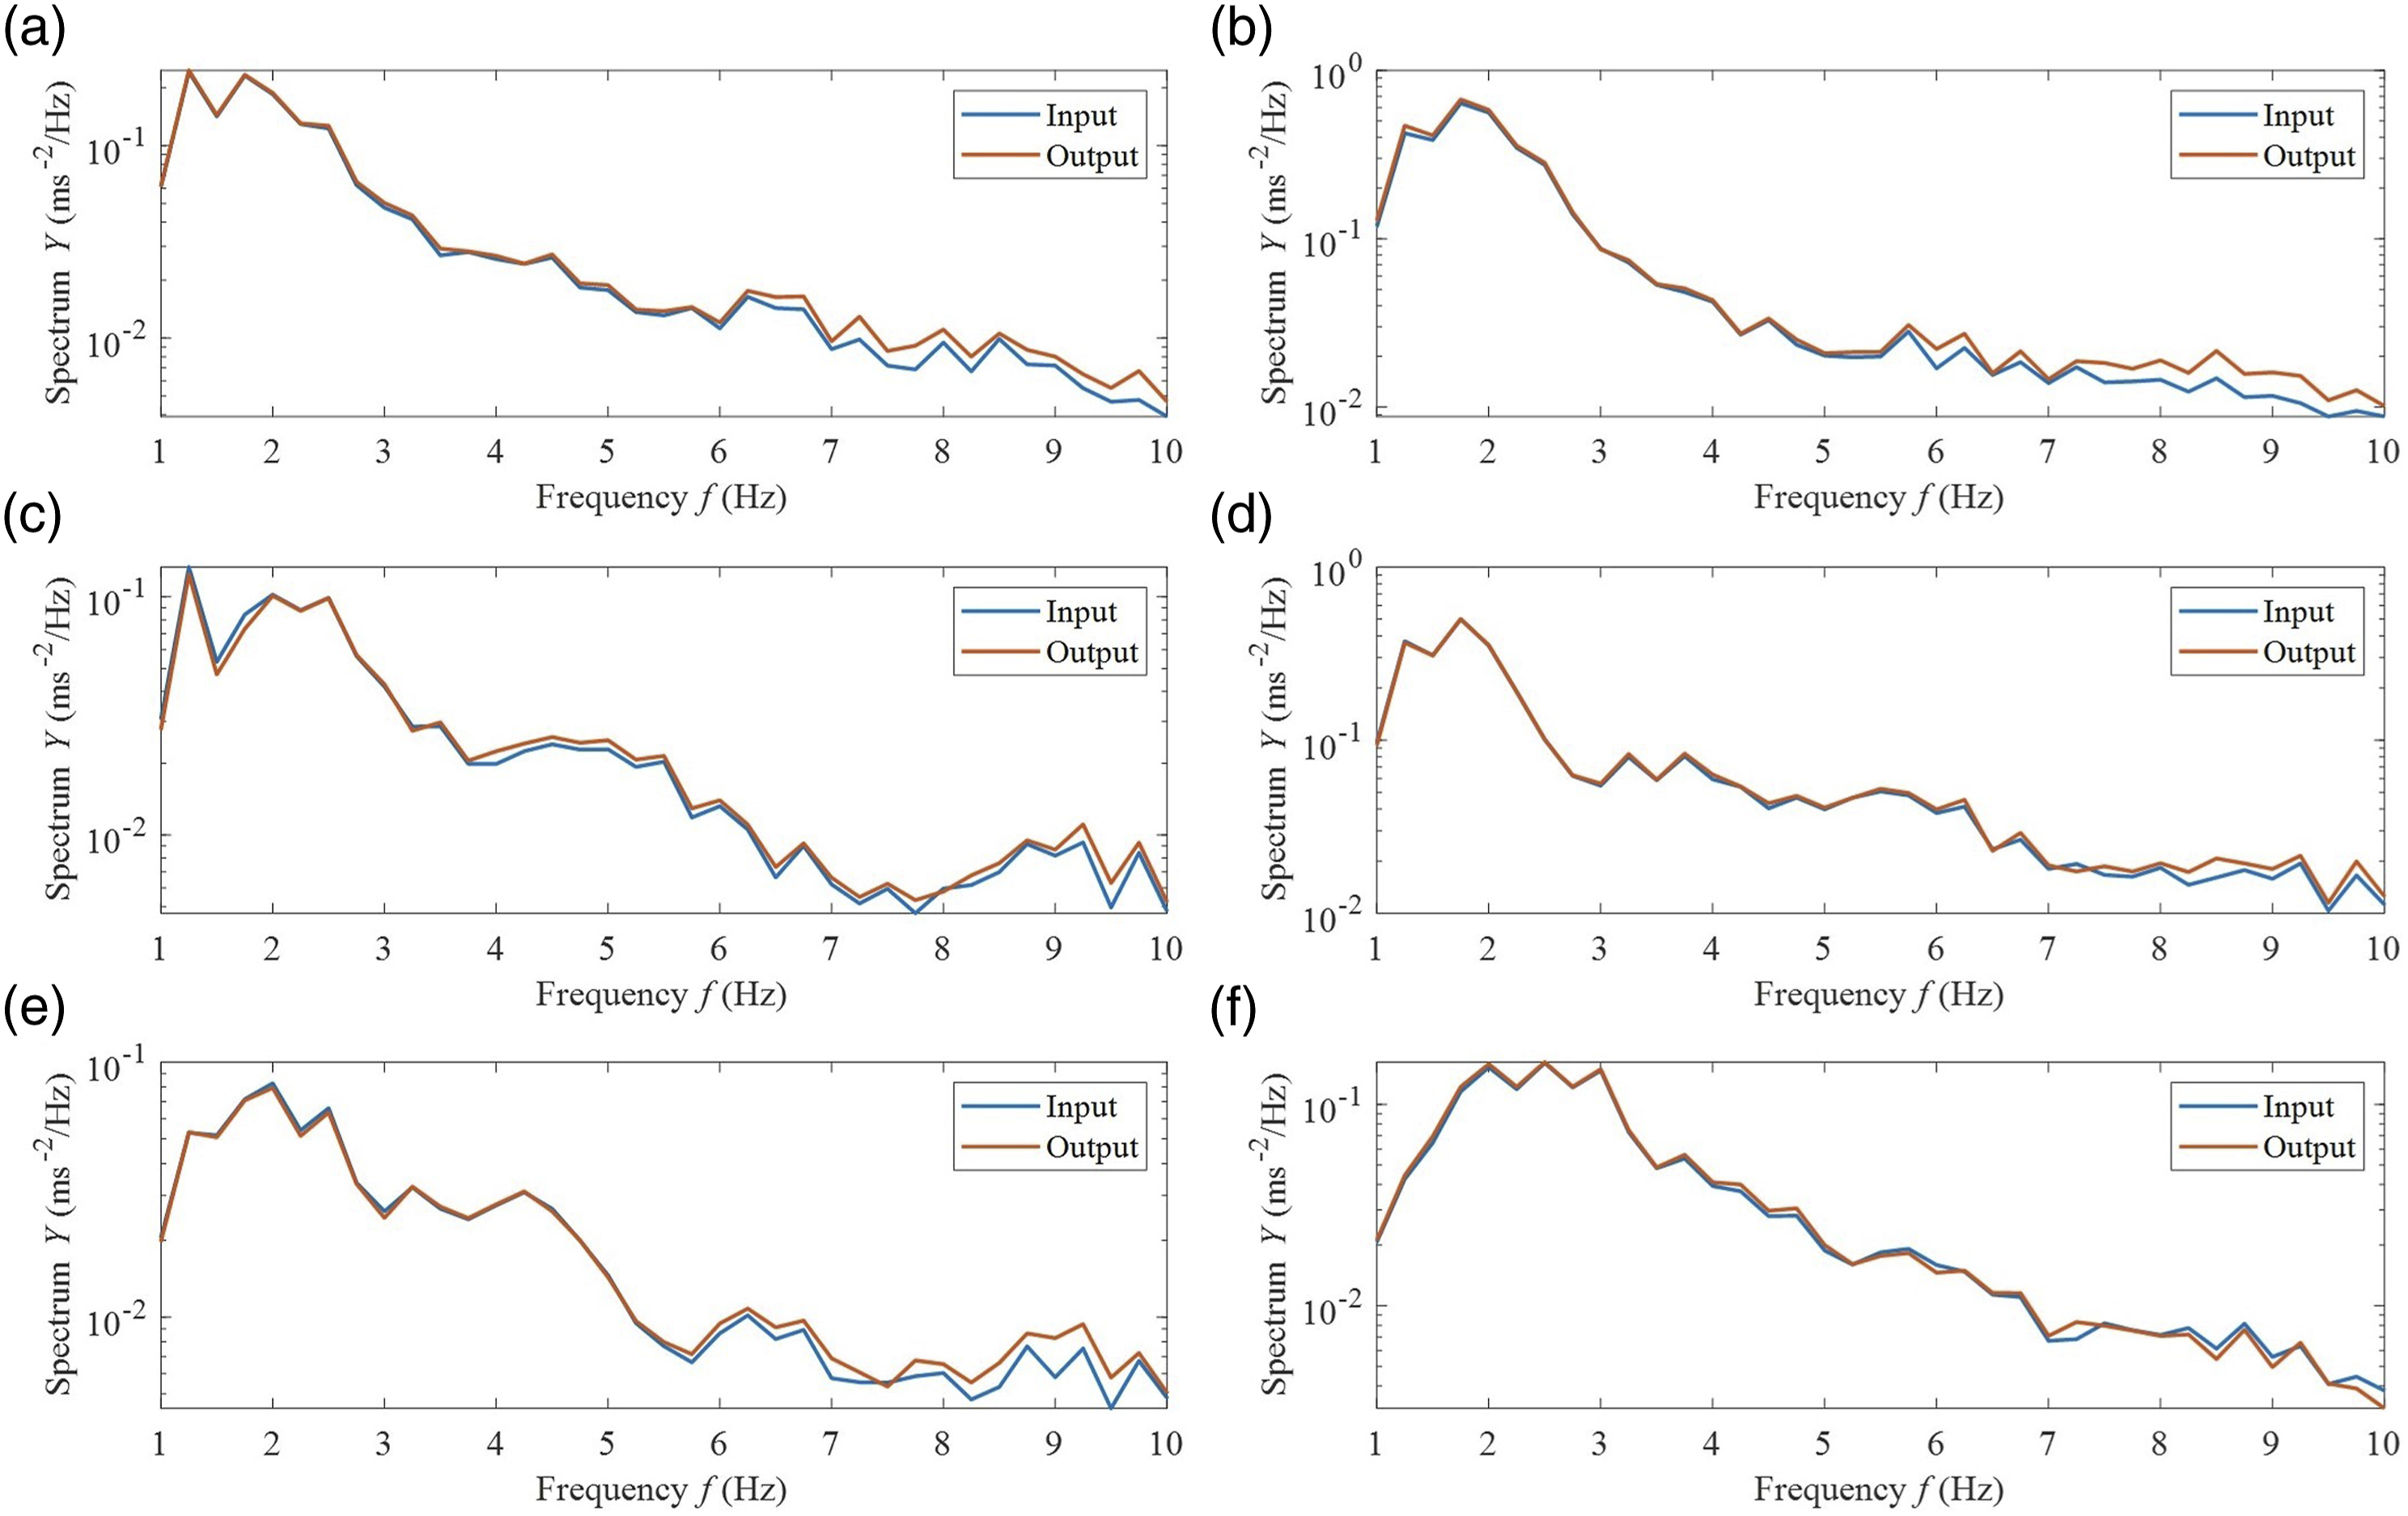
From Figures 7 and 8, it can be seen that the applied control strategy allows to obtain deviations of lower than 10% in any of the 6 DOF, having these maximum deviations in high frequency and low acceleration ranges. This behavior also occurs in the other testing scenarios (all maneuvers and all velocities).
Then, it can be concluded that, using the controlled accelerations of the Toyota Prius sprung mass derived from each maneuver, the Stewart Platform from Figure 1 can recreate the dynamics of a real passenger car with an accuracy greater than 90%.
Results and discussion
For the validation of the comfort simulation strategy on an electric Stewart Platform from Figure 1 under road driving scenarios, the experimental campaign carried out in the Toyota Prius has been replicated in the simulator in order to compare the VDV in the seat obtained in both platforms for each of the tests. To compute the VDV in the hexapod, the controlled sprung mass vibration signals obtained in section Sprung mass vibration signals have been used as reference inputs in the hexapod MPC.
Figure 9 shows, as an example, a time and frequency analysis of the accelerations measured at the seat for each of the tests of the experimental campaign described in section Comfort tests for the first testing velocity. This is, Time and frequency domain analysis of the seat accelerations. (a) Acceleration. (b) Bump pitch. (c) Lane change (from right to left). (d) Lane change (from left to right). (e) Bump roll right (only right wheels). (f) Bump roll left (only left wheels).
As can be seen in Figure 9, there is a good match between the signals measured in the Prius seat (blue lines) and the signals measured in the platform seat (orange lines) under the same driving maneuvers. From here, it can be deduced that the accelerations in the z-axis show the smallest deviations, which benefits the study since this axis is the one that has the greatest influence on comfort in passenger cars. 7 The x-axis (the second axis with the greatest influence on comfort) shows larger deviations, but with maximum errors at low speeds. Finally, the y-axis has maximum deviations in the high frequency range (appreciated in the bump roll left test), which may be due to the influence of the stiffness of the simulator screens on the dynamic behavior of the platform even after having applied the control strategy. Finally, it is seen that the main maneuver of the lane change tests occurs at a frequency lower than 1 Hz (this happens for all test speeds). Therefore, it is filtered out and the simulator does not realistically reproduce the dynamics of the experimental test. However, it can reproduce the vibroacoustic behavior of the car in 1–10 Hz frequency range for this maneuver, which is the frequency range under analysis in this thesis.
Total VDV and VDV per linear axis for the tests where the excitations come from the steering wheel.
Total VDV and VDV per linear axis for the tests where the excitations come from bumps.
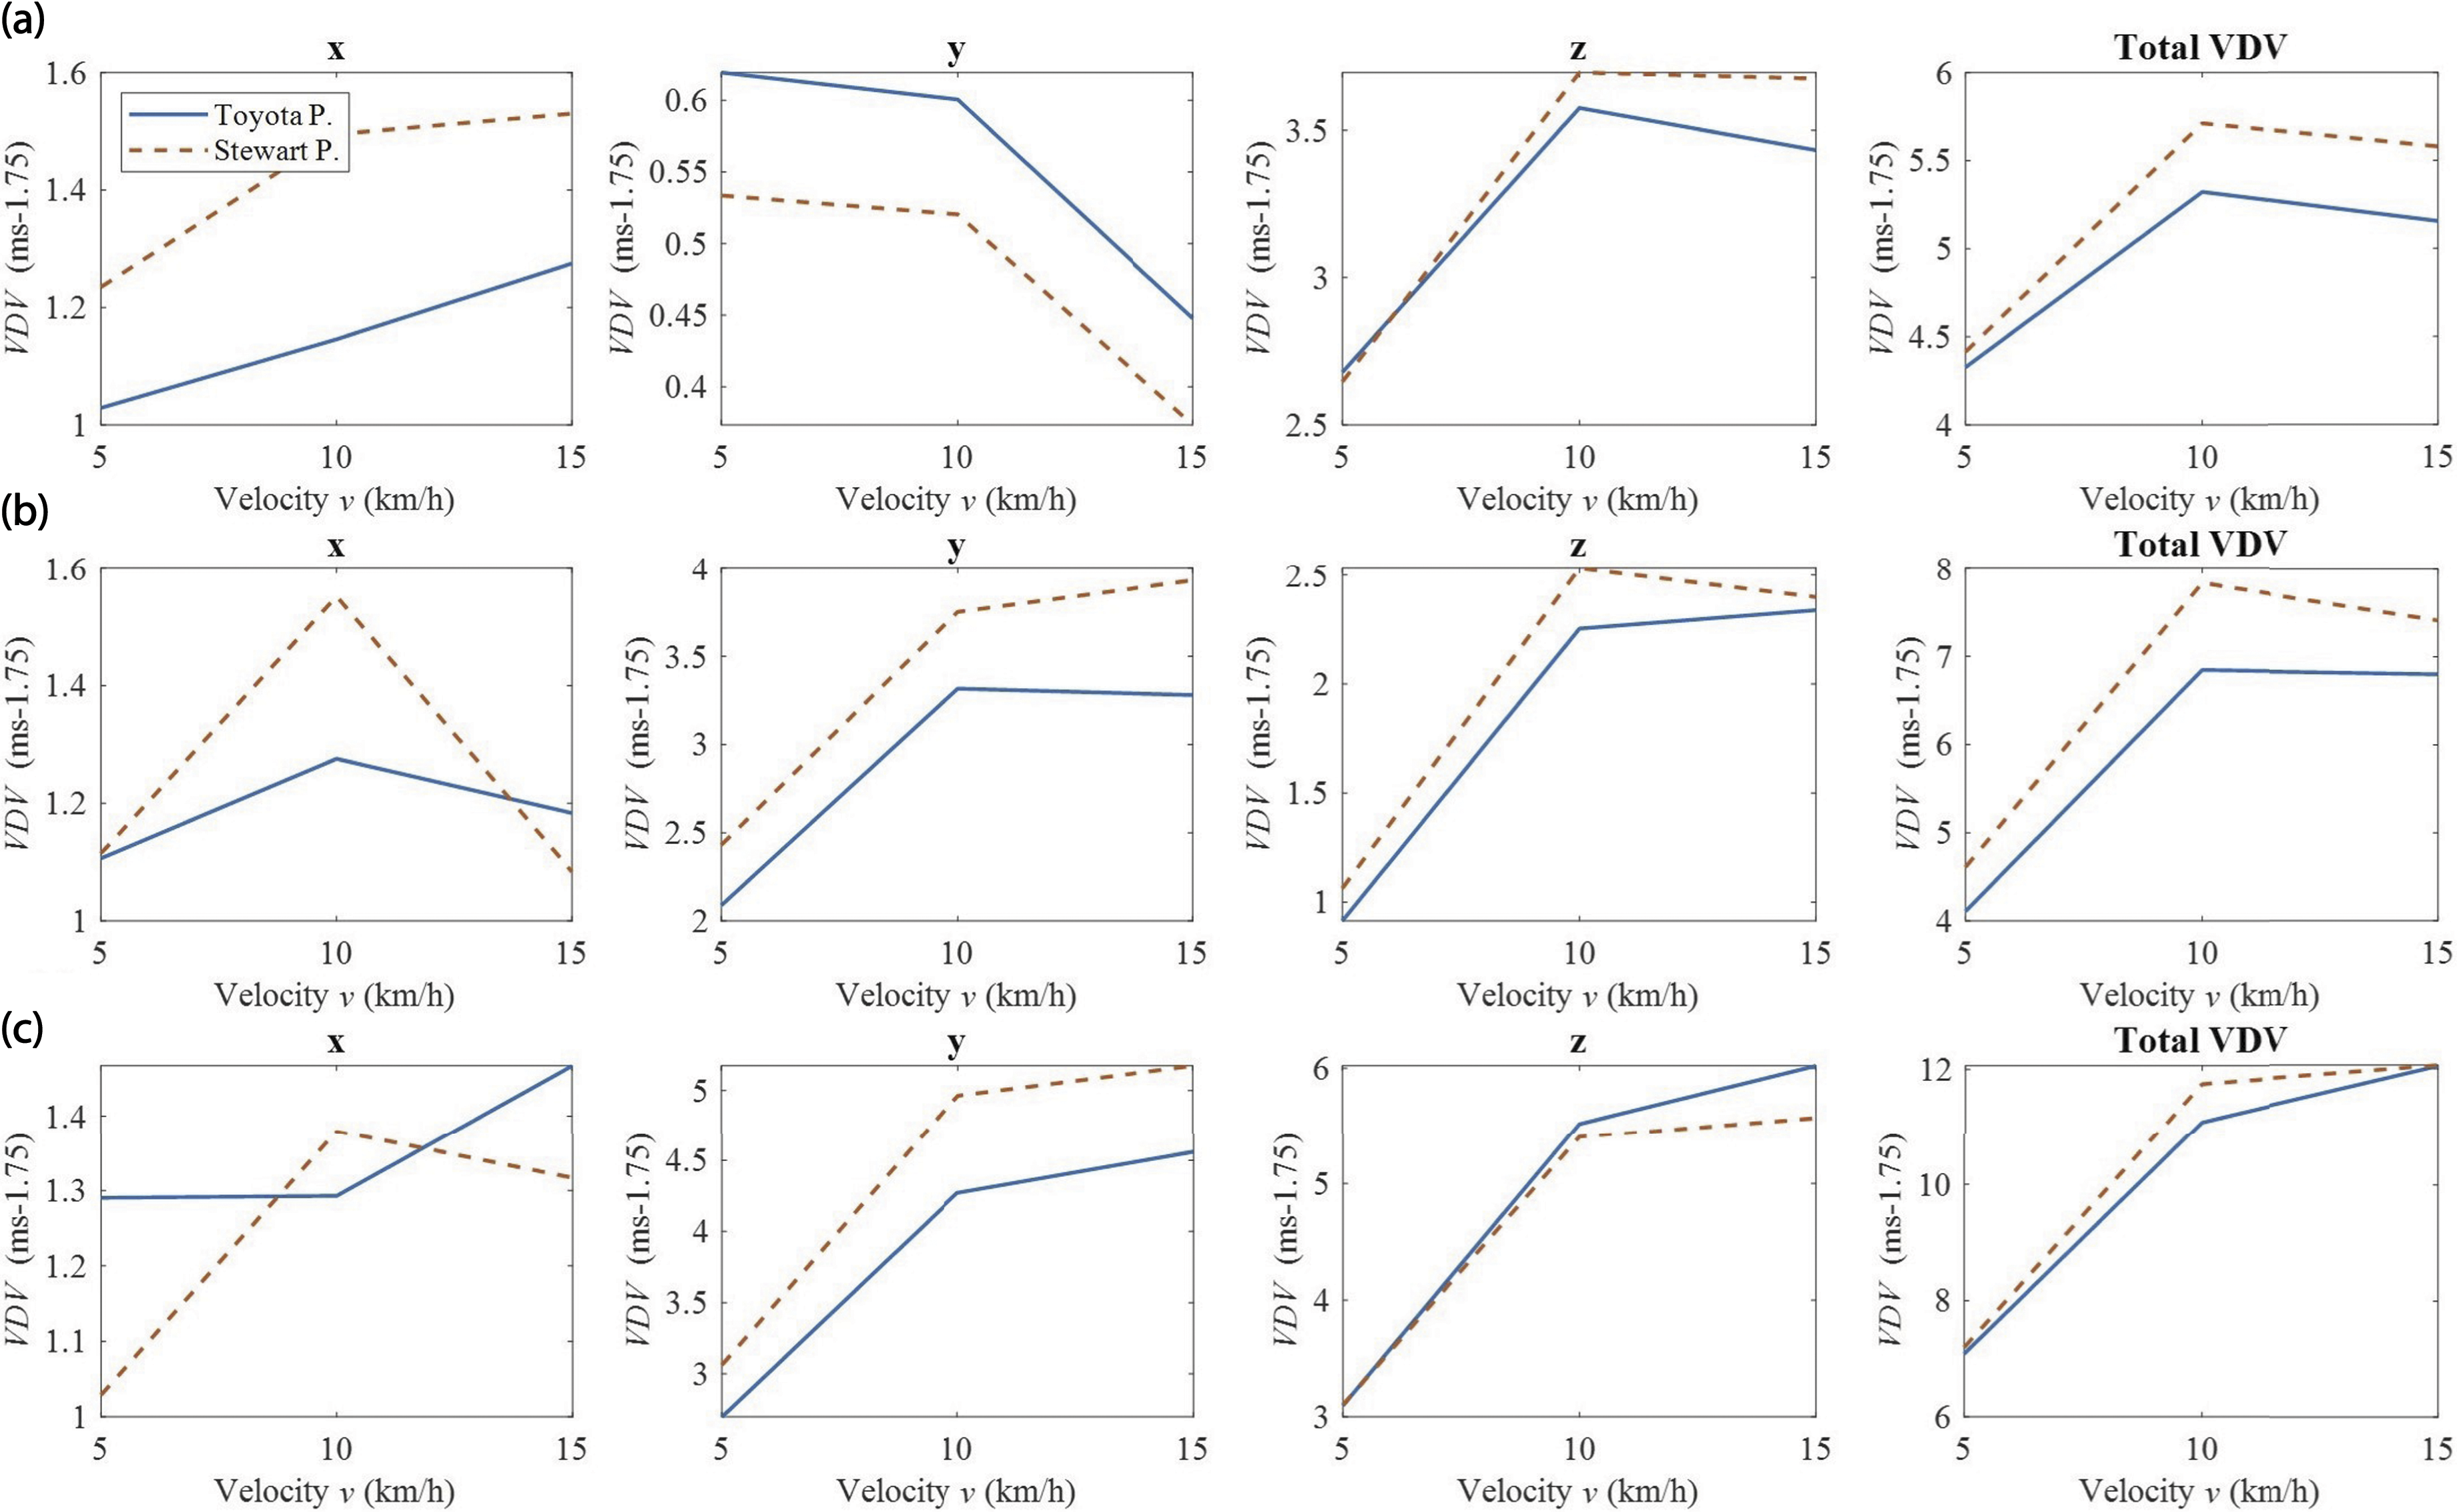
Based on the results shown in Tables 11 and 12, Figures 10 and 11 show a graphic analysis of the VDV for each axis and the total VDV for each maneuver as a function of velocity. Figure 10 refers to the experiments where the excitation comes from the steering wheel and Figure 11 refers to the experiments where the excitation comes from bumps. Analysis of the VDV and VDV per linear axis for the tests where the excitations come from the steering wheel. (a) Acceleration (b) Lane change (from right to left) (c) Lane change (from left to right). Analysis of the VDV and VDV per linear axis for the tests where the excitations come from bumps. (d) Bump pitch (e) Bump roll right (only right wheels) (f) Bump roll left (only left wheels).
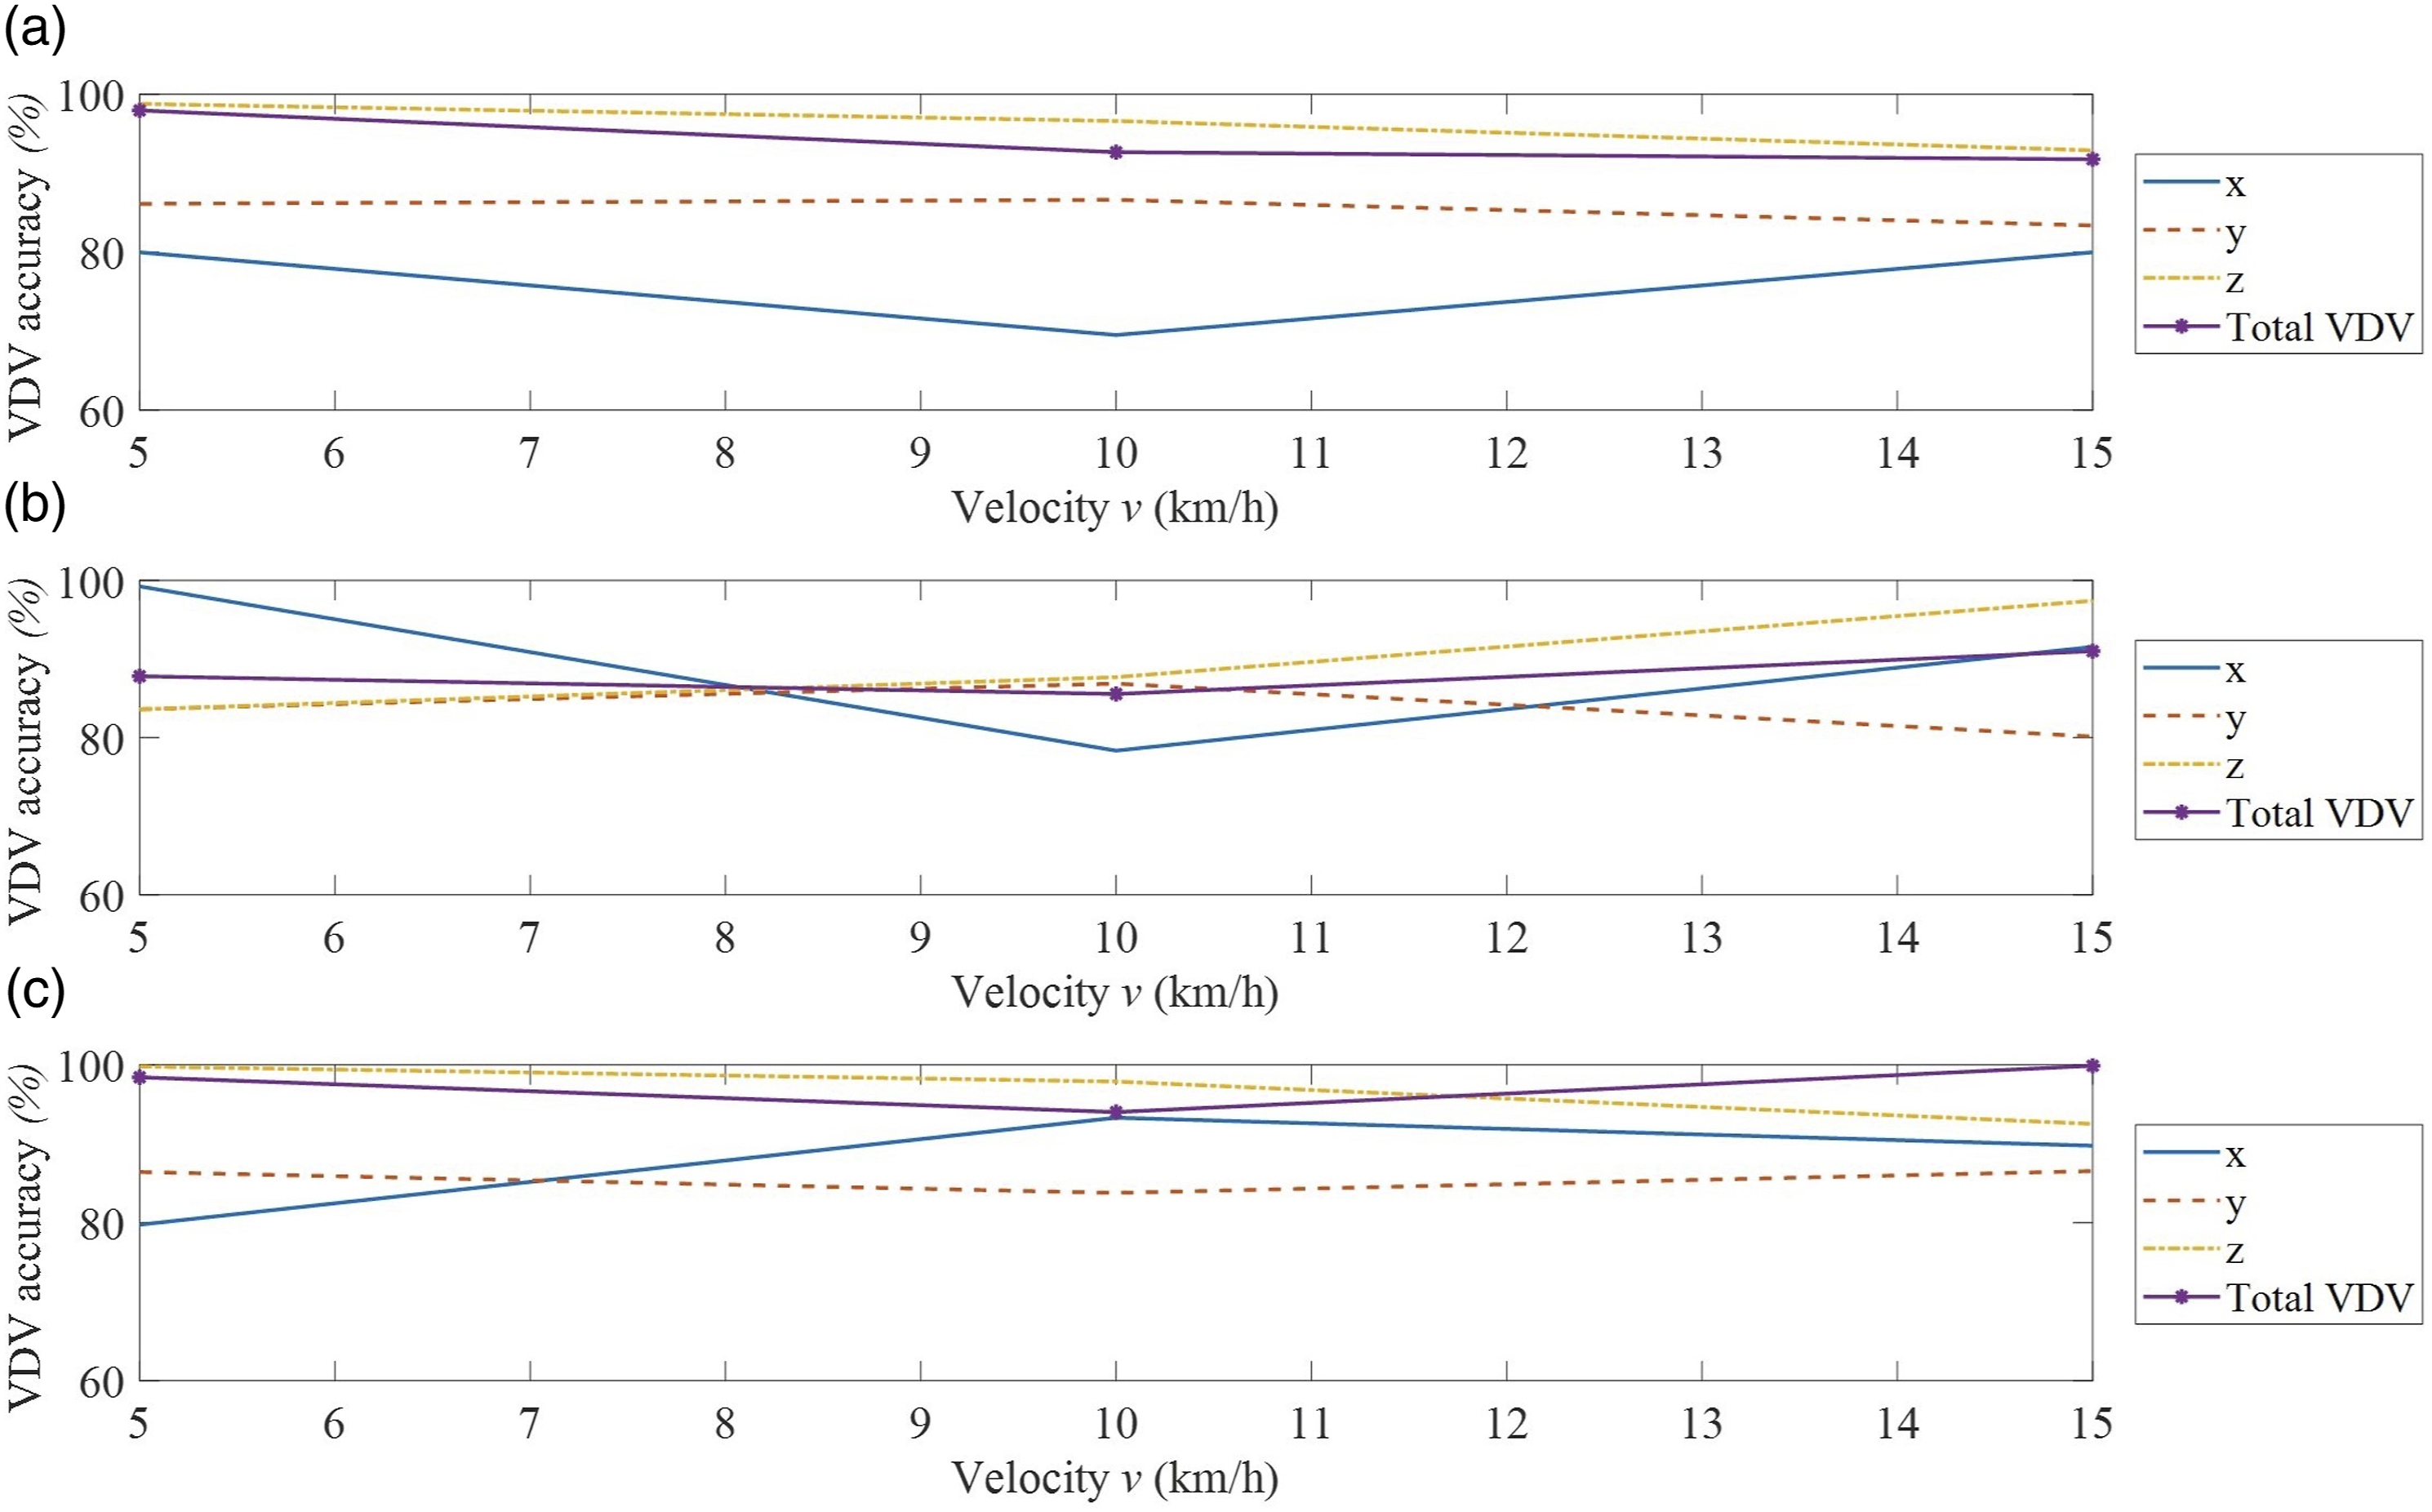
Also, an analysis can be made about the accuracy achieved in terms of VDV for each axis and for the total VDV in each maneuver, as shown in Figures 12 and 13. Analysis of the accuracy of the VDV and VDV per linear axis for the tests where the excitations come from the steering wheel. (a) Acceleration (b) Lane change (from right to left) (c) Lane change (from left to right). Analysis of the accuracy of the VDV and VDV per linear axis for the tests where the excitations come from bumps. (d) Bump pitch (e) Bump roll right (f) Bump roll left.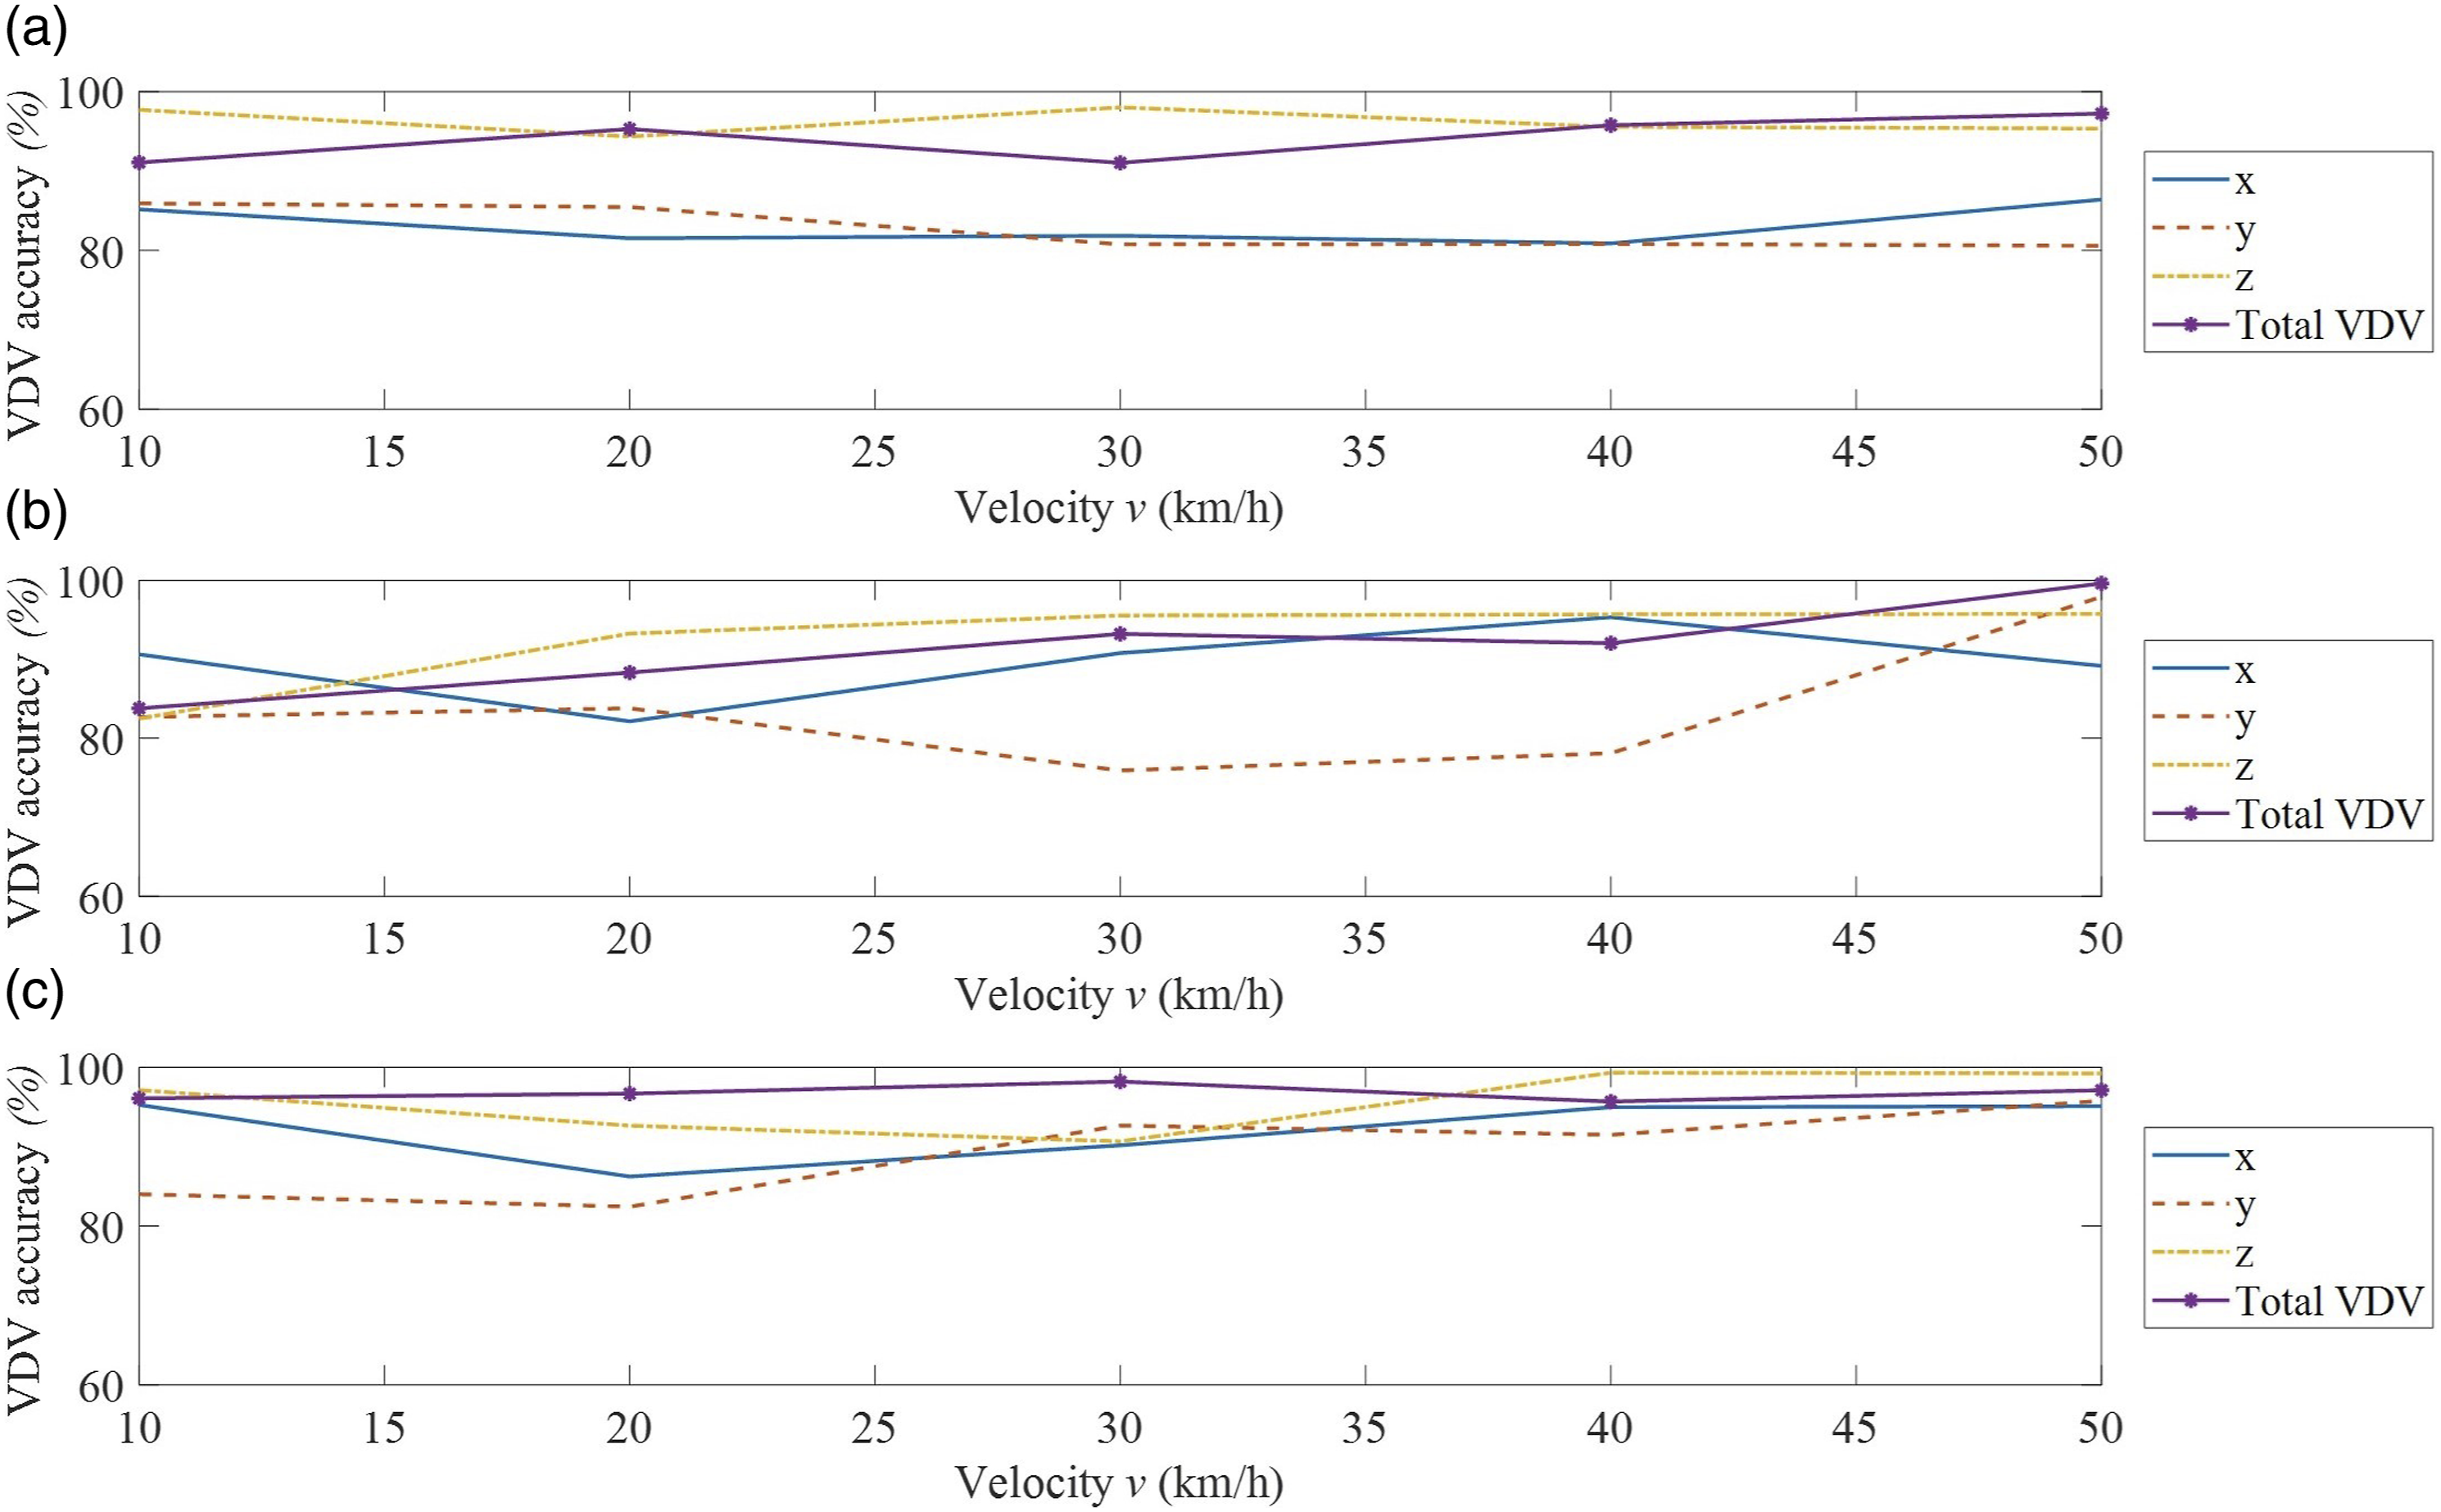
Regarding the first set of tests, from Table 11, Figures 10 and 12, some conclusions can be drawn. First, the VDV increases with the testing velocity of the car since the higher the speed, the higher the accelerations of the sprung mass. Second, it is confirmed that the z-axis has a remarkable influence on the ride comfort, even not being the main excitation axis. Consequently, it can be seen that its influence on the VDV is similar for the three groups of experiments where the excitations only come from the steering wheel.
There is also a notable influence of the y-axis on the VDV in the lane change experiments, given the lateral accelerations produced in these scenarios and then induced to the driver. Although the main acceleration components have been filtered out because they are outside the 1–10 Hz range, it is seen that the remaining acceleration are also relevant. Moreover, a symmetric behavior of the car in the x-axis is appreciated, given the similarity of results between the right-to-left lane change test and the left-to-right lane change test. In any case, the deviations found may be mainly due to the experimentation and the deviations induced by the driver in the maneuver. In terms of longitudinal accelerations, x-axis does not have a great influence on comfort at this level of driving speeds.
Finally, concerning the simulator’s ability to recreate the vibroacoustic behavior of a road vehicle for these tests, Figure 12 reports an accuracy higher than 80% for all axes, while the total VDV accuracy is higher than 90% in most cases, being y the axis with more deviations. This can be strongly related to the higher inaccuracies of the simulator for this axis even considering the control strategy explained in Santos and García-Barruetabeña, 2021.
Regarding the second set of tests, from Table 12, Figures 11 and 13, other conclusions are drawn. First, the linear relationship between speed and VDV is no longer as evident as in the previous cases. It is true that the VDV increases with speed, but there is a higher increase in discomfort (and a consequent higher increase in the VDV) from 5 and 10 km/h than from 10 and 15 km/h (see y-VDV, z-VDV, and total VDV from Figure 11). This is because the bumping profile is close to excite the natural frequency of the car (around 1.2 Hz) in the z-axis at this velocity.
This fact has been experimentally noticed in the conducted comfort tests. Second, it is again confirmed that the axis with the greatest influence on the VDV, and therefore on comfort, is the z-axis. This especially occurs in pitch tests where this axis is significantly excited. Finally, in the bump roll scenarios, there is no symmetry in the behavior of the car, being the tests on the left wheels more uncomfortable. This is mainly due to a higher weight ratio on the left axle (around 4.3% higher), which generates higher forces on this axle when going over bumps and consequently higher accelerations.
Finally, concerning the simulator’s ability to recreate the vibroacoustic behavior of a road vehicle for these tests, Figure 13 reports an accuracy higher than 80% on all axes (except in the x-axis and y-axis at 10 km/h for the bump pitch test), while the total VDV accuracy is higher than 85% in most cases. Again, y and x are the axes with more deviations. In addition, the VDV obtained in the simulator is higher than the VDV obtained in the Toyota Prius for most cases. This may be due to the fact that the accelerations at the MPC under test are the highest of the entire campaign, which may influence the final deviations in terms of the platform performance.
In short, the accuracy of the platform when it tries to recreate the same vibroacoustic behavior in the seat with respect to a passenger vehicle is greater than 85% in the worst case. Thus, the comfort simulation strategy on an electric Stewart Platform under road driving scenarios is validated.
Conclusions
In this work, the validation of the comfort simulation strategy on an electric Stewart Platform for ride and comfort applications has been presented. 1. According to the validation strategy followed in this study, it has been demonstrated that an electric Stewart Platform is able to replicate the dynamic behavior of a road vehicle signals, and therefore, it can be used as a tool for comfort evaluation at the contact point of the seat and the driver. 2. The comfort tests selected for the experimental campaign demonstrate that comfort can be evaluated on a Stewart Platform in the 6 degrees-of-freedom in the low frequency range (1–10 Hz). 3. According to the validation methodology presented in this study, it can be stated that with an electric Stewart Platform it would be possible to evaluate comfort in real time by considering high-level vehicle models and advanced suspension dynamic model.
As a result, it is demonstrated that strategy performed over a Stewart Platform is a valid procedure for whole-body vibration comfort assessments in the low frequency range (1–10 Hz).
Footnotes
Declaration of conflicting interests
The author(s) declared no potential conflicts of interest with respect to the research, authorship, and/or publication of this article.
Funding
The author(s) disclosed receipt of the following financial support for the research, authorship, and/or publication of this article: The work presented in this paper has been carried out with the great support and the technological capabilities of AIC-Automotive Intelligence Center and University of Deusto.