
Abstract
Signal processing of flutter flight test data enables verification of aircraft flutter design, and the signal from a flutter flight test excited by atmospheric turbulence is a particularly important form of the flutter test. Owing to the randomness of atmospheric turbulence excitation, multi-channel analysis of turbulence responses at various positions in the same component can improve the analytical accuracy of flutter signal processing. The relationship between the maximum singular value of the multi-channel turbulence response power spectral density matrix and the system self-power spectral density function is elucidated herein using a frequency domain decomposition method. However, there is a contradiction in the power spectral density function between the spectral line density and the spectral line smoothing calculated based on the periodogram of the frequency domain decomposition. By applying an autoregressive spectral model, the power spectral density function of the turbulence response is calculated to achieve spectral line smoothing and sufficient spectral line density. Additionally, the power spectral density function is then used to construct the power spectral density function matrix of the multi-channel turbulence response, and the maximum singular value curve is calculated based on the singular value decomposition of each spectral pin. Finally, the modal parameters of the turbulence response signal are estimated via multi-modal frequency domain fitting. The developed approach is validated based on simulations and flutter flight test turbulence response signals.
Keywords
Introduction
The Power Spectral Density (PSD) function of a multi-channel turbulence response signal can be analyzed and calculated according to the characteristics of random excitation of a turbulence response. Additionally, Singular Value Decomposition (SVD) can be performed for each spectral pin based on the orthogonality of the frequency domain to obtain the maximum singular value of the entire frequency band. Considering the relationship between the maximum singular value curve and the system self-power spectral density function, the modal parameters of the multi-channel turbulence response signal can be estimated. It is worth noting that the smoothness of the maximum singular value curve and the spectral line density influence the modal parameter estimation results when performing multi-modal frequency domain fitting. The PSD function of the turbulence response signal calculated by the periodogram method based on windowing logic can increase the smoothness of the spectral line while reducing the spectral line density, thereby impacting the modal parameter estimation results. This paper applies parameterized spectral analysis to compute the PSD function of the multi-channel turbulence response signal using an autoregressive (AR) spectral analysis method. Moreover, the contradiction between spectral line density and spectral line smoothing is further elucidated to provide a solid basis for frequency domain multi-modal fitting.
Autoregressive spectral modeling of time series data is an important research aspect of time series spectral analysis. 1 In autoregressive modeling, a time series spectrum is calculated by an autoregressive method, which can effectively increase spectral line smoothing while ensuring spectral line density. Kay et al. 2 studied the effect of noise on the autoregressive spectral estimator and demonstrated the anti-noise performance of the estimator by comparing various noise parameters. Kanai et al. 3 performed autoregressive spectral estimations of signals with low signal-to-noise ratios by applying a phase matching technique. During the fault identification and classification of rolling element bearings, the important features of the time-varying autoregressive spectrum are extracted to determine the features required for fault detection; this approach ultimately improves the fault detection performance. 4 Li et al. 5 analyzed electrocardiograph (ECG) signals using an autoregressive model. Yao et al. 6 established autoregressive statistical pattern recognition algorithms for damage detection in civil structures using autoregressive spectral analysis. Atyabi et al. 7 studied the autoregressive order problem in autoregressive spectral analysis, confirmed the consistency of a high-order autoregressive model and the Auto Regressive and Moving Average (ARMA) model, and theoretically verified their results based on ECG signals. Choi et al. 8 verified cardiac sound murmur classifications based on autoregressive spectral analysis and a support vector machine technique. The research discussed confirms the feasibility of autoregressive parameterized spectral analysis. For structural response signals excited by random noise, the PSD function is calculated via parameterized spectral analysis, which can effectively reduce the contradiction between spectral line density and spectral smoothness caused by non-parametric spectral analysis. Moreover, for a structural response signal excited by random noise, the power spectrum can be calculated through high-order autoregressive spectrum estimations; however, it is very difficult to eliminate spurious modes based on the autoregressive model parameters because the autoregressive model order is too high. Therefore, in this work, only the power spectrum of the response signal is calculated through autoregressive spectral analysis, and then, the modal parameters of the turbulence response signal are estimated based on a frequency domain decomposition method. Brincker et al. 9 developed a frequency domain decomposition approach, wherein the periodogram method is applied to calculate the power spectral density function of the structural response signal. However, the periodogram method employs a windowing method to smooth the spectral line. Windowing can effectively increase spectral line smoothing, although it simultaneously reduces spectral line density. Therefore, the contradiction between spectral line smoothing and spectral line density is difficult to resolve in non-parametric spectral analysis. Zhang et al. 10 estimated the modal parameters of the structural response signal associated with the environmental excitation of a bridge structure by applying a least-squares fitting method to the single-degree-of-freedom system in the frequency domain. Schulze et al. 11 estimated the modal parameters of the flutter test turbulence response signal of an F/A-18 using a frequency domain decomposition method, although they still employed the periodogram method to calculate the power spectral density of the turbulence response signal. This is an important distinction that highlights the novelty of the present research relative to previous studies. Through parametric spectral analysis considering spectral line smoothing and spectral line density aspects, the accuracy of turbulence response signal modal parameter estimation can be further improved.
Related methods
Autoregressive spectral analysis
To calculate the power spectrum of an autoregressive process, assuming the original input signal has a total order of M, the autoregressive process can be expressed as


After introducing

The maximum entropy power spectrum can be converted into an autoregressive model spectrum for further calculations. The autoregressive model in equation (1) is deformed as
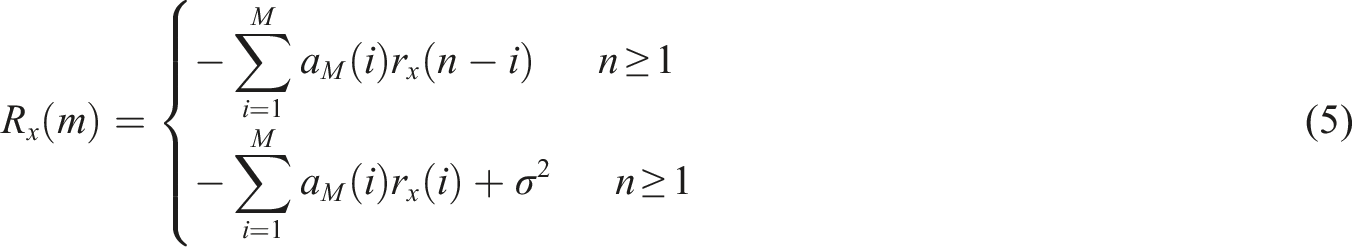
Equation (5) can be converted into its matrix form to give
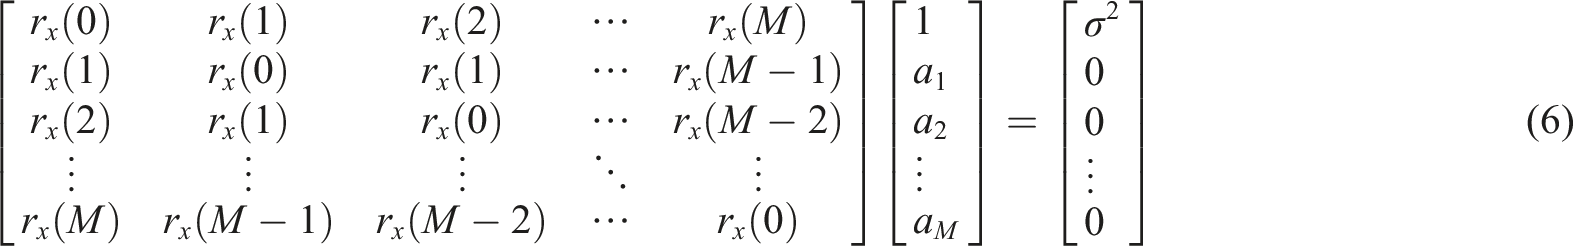
Equations (5) and (6) are the Yule-Walker equations of the AR model.
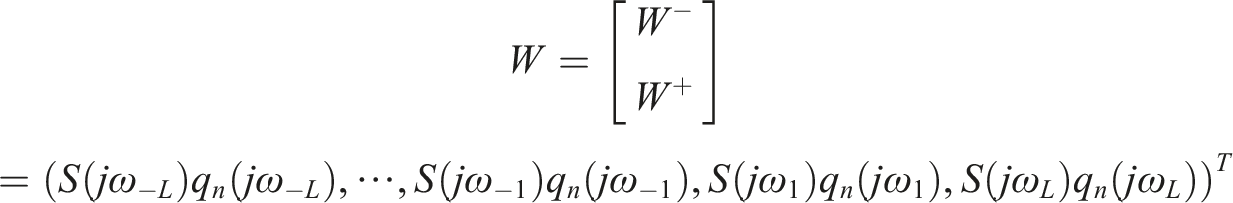
Maximum singular value and power spectrum of the system
According to the relationship between the input and output spectral density functions and the frequency response function (FRF) of the system, the following equality can be expressed
12

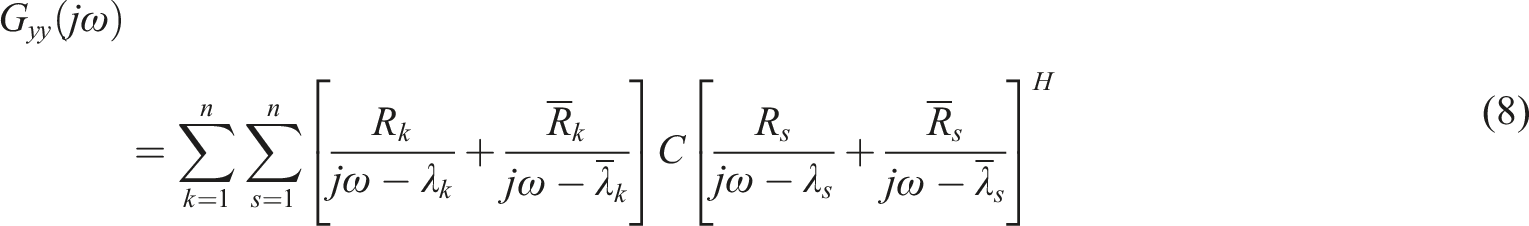


This indicates that for a randomly excited system, the power spectrum of the multi-channel excited signal is a flat spectrum, and the correlation PSD function matrix is a diagonal matrix. A comparison of equations (9) and (10) reveals that the maximum singular value of the PSD function matrix
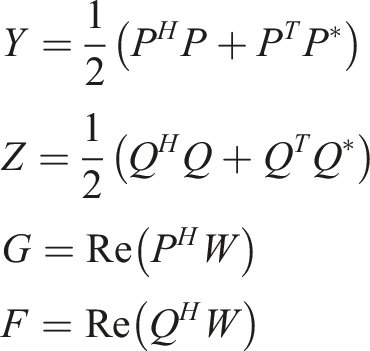
Multi-modal frequency domain modal parameter estimation
The rational fraction polynomial is used in the orthogonal polynomial method to perform a frequency polynomial fitting of the maximum singular value curve. The model parameters can be calculated from the estimated FRF based on the rational fractional polynomial. The FRF for a linear time-invariant system can be expressed as

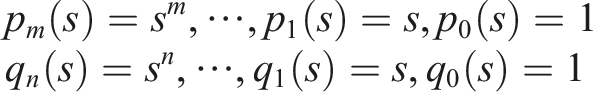
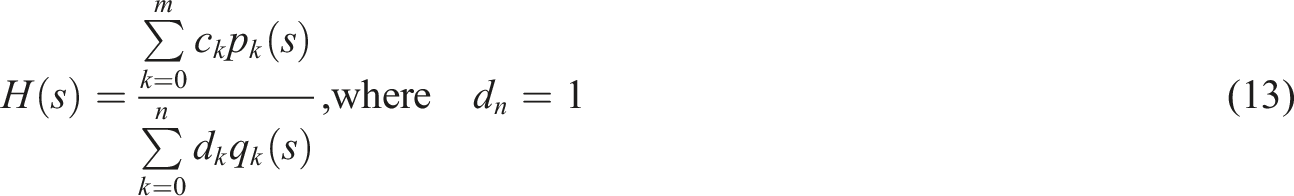
In practical engineering, it is often impossible to measure the FRF over the entire S-plane, and therefore, only the data that cover the entire frequency axis are considered. These data comprise the frequency response function, i.e.
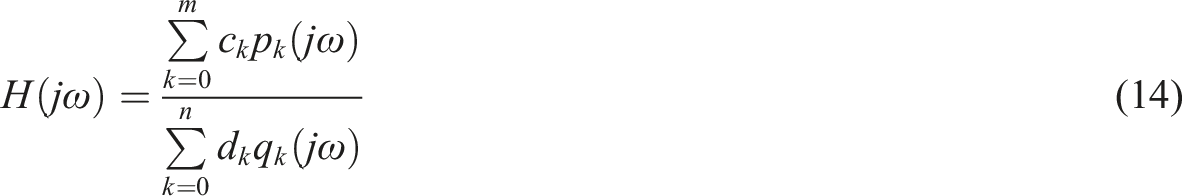

The error between the theoretical model of the FRF (i.e. a rational fraction of equation (14)) and the actual measurement result can be expressed as
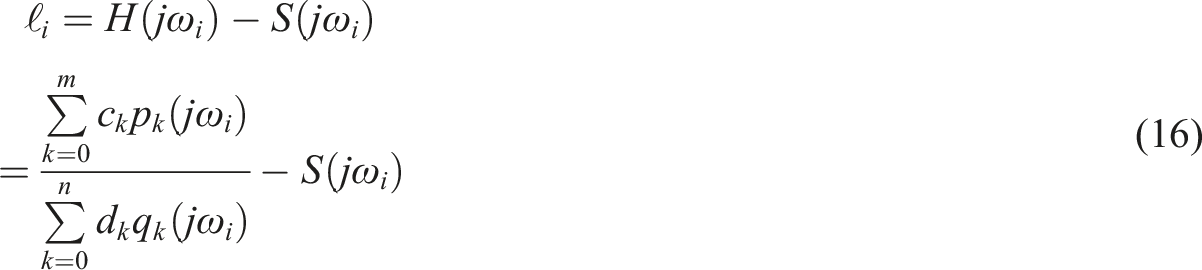
To linearize the coefficients
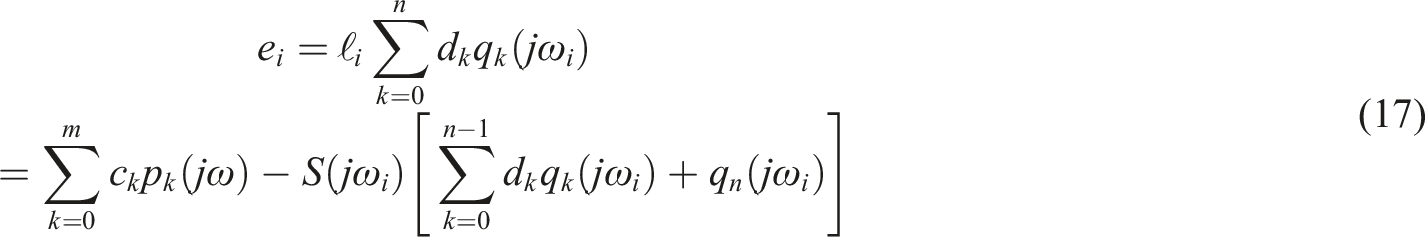
The error is defined by equation (18)


To determine the minimum error value

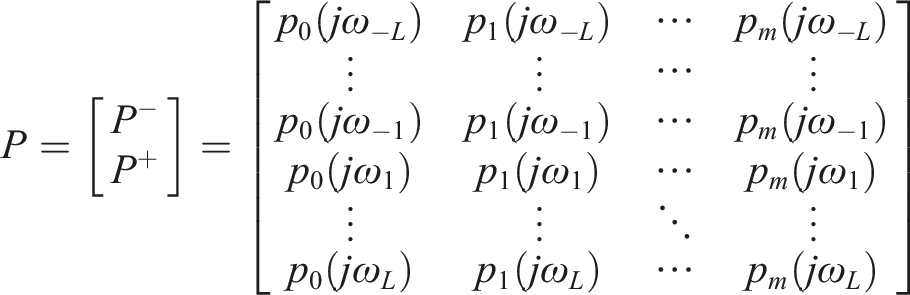
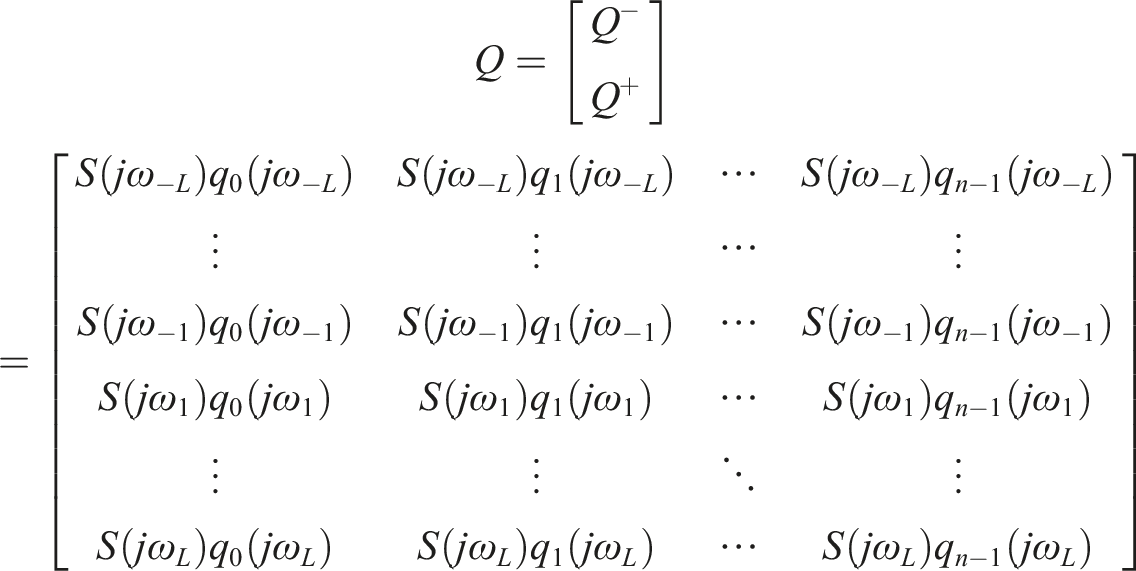
According to equations (19) and (20), the matrix relationship in equation (21) can be defined as

In equation (21), if

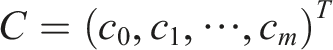
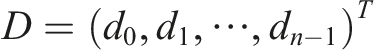
The C and D matrices can be obtained by expanding equation (23) to

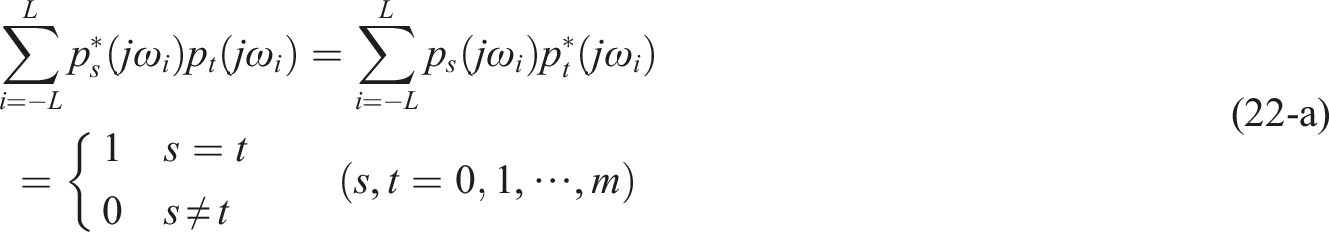
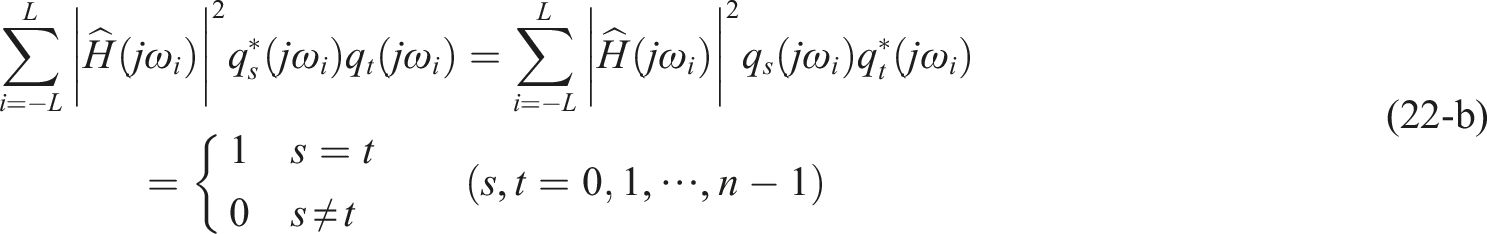
Satisfying the conditions shown in equations (22a, b) renders
Method validation
Autoregressive spectral analysis and periodogram spectral analysis
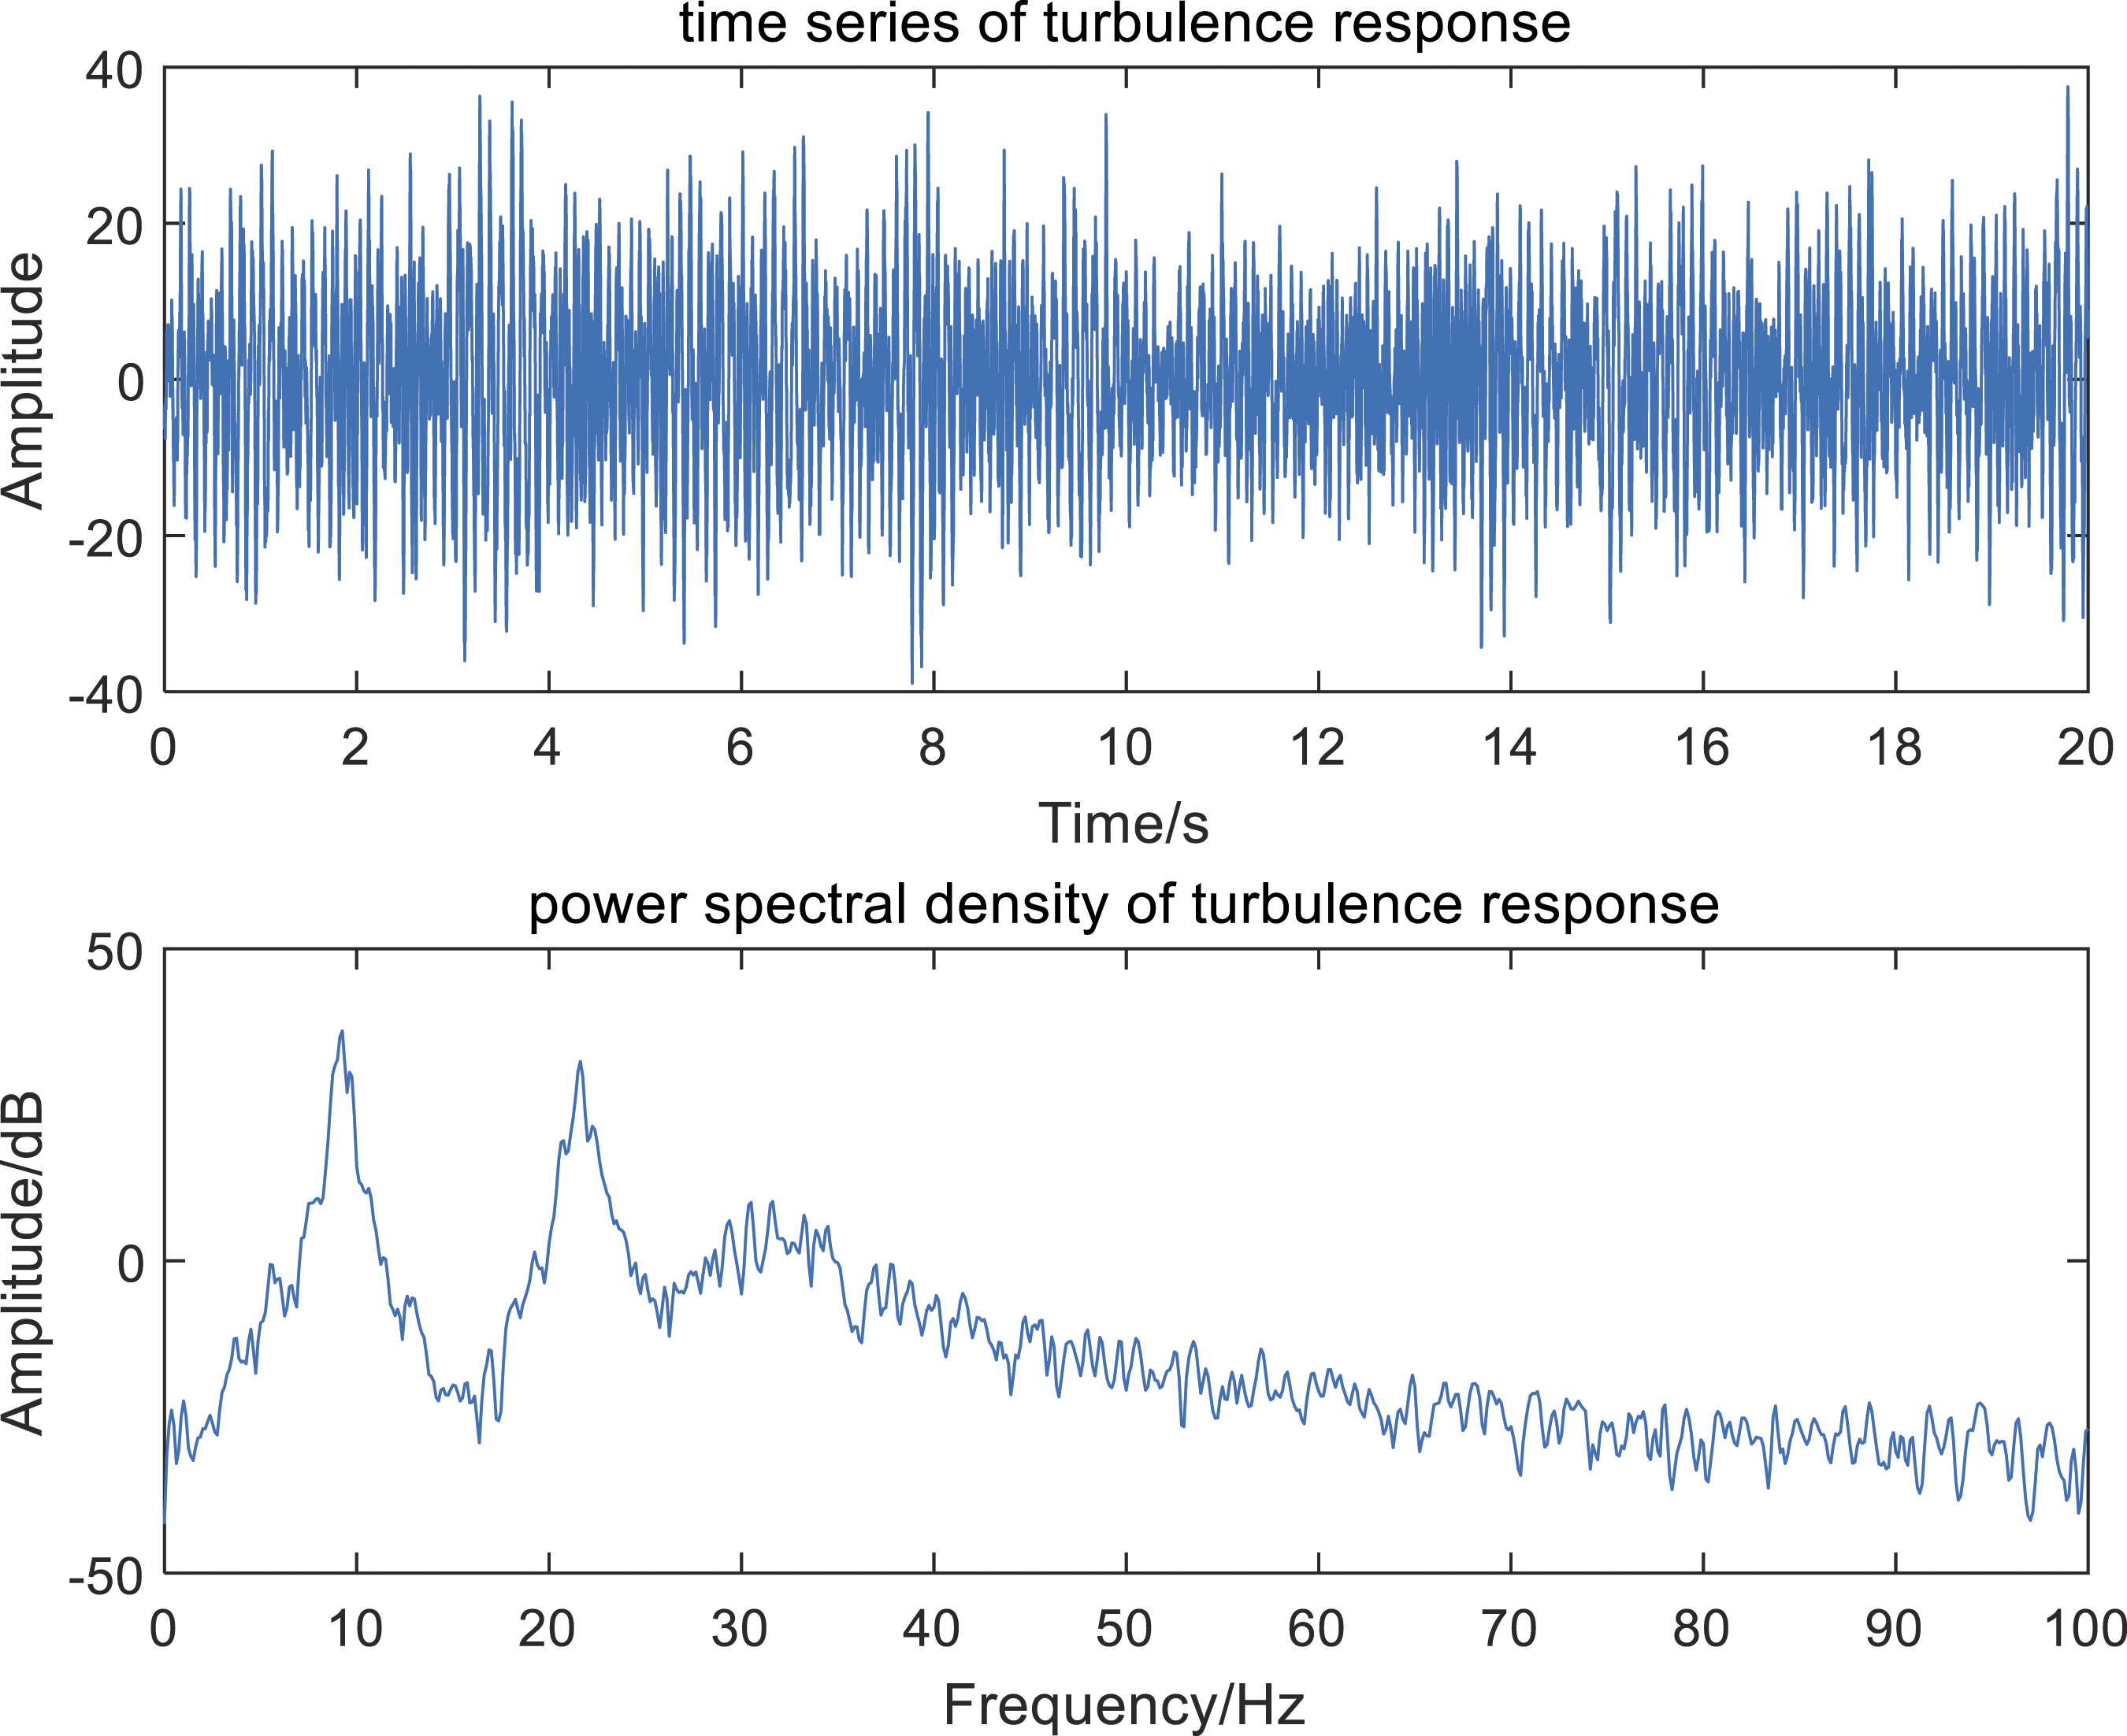
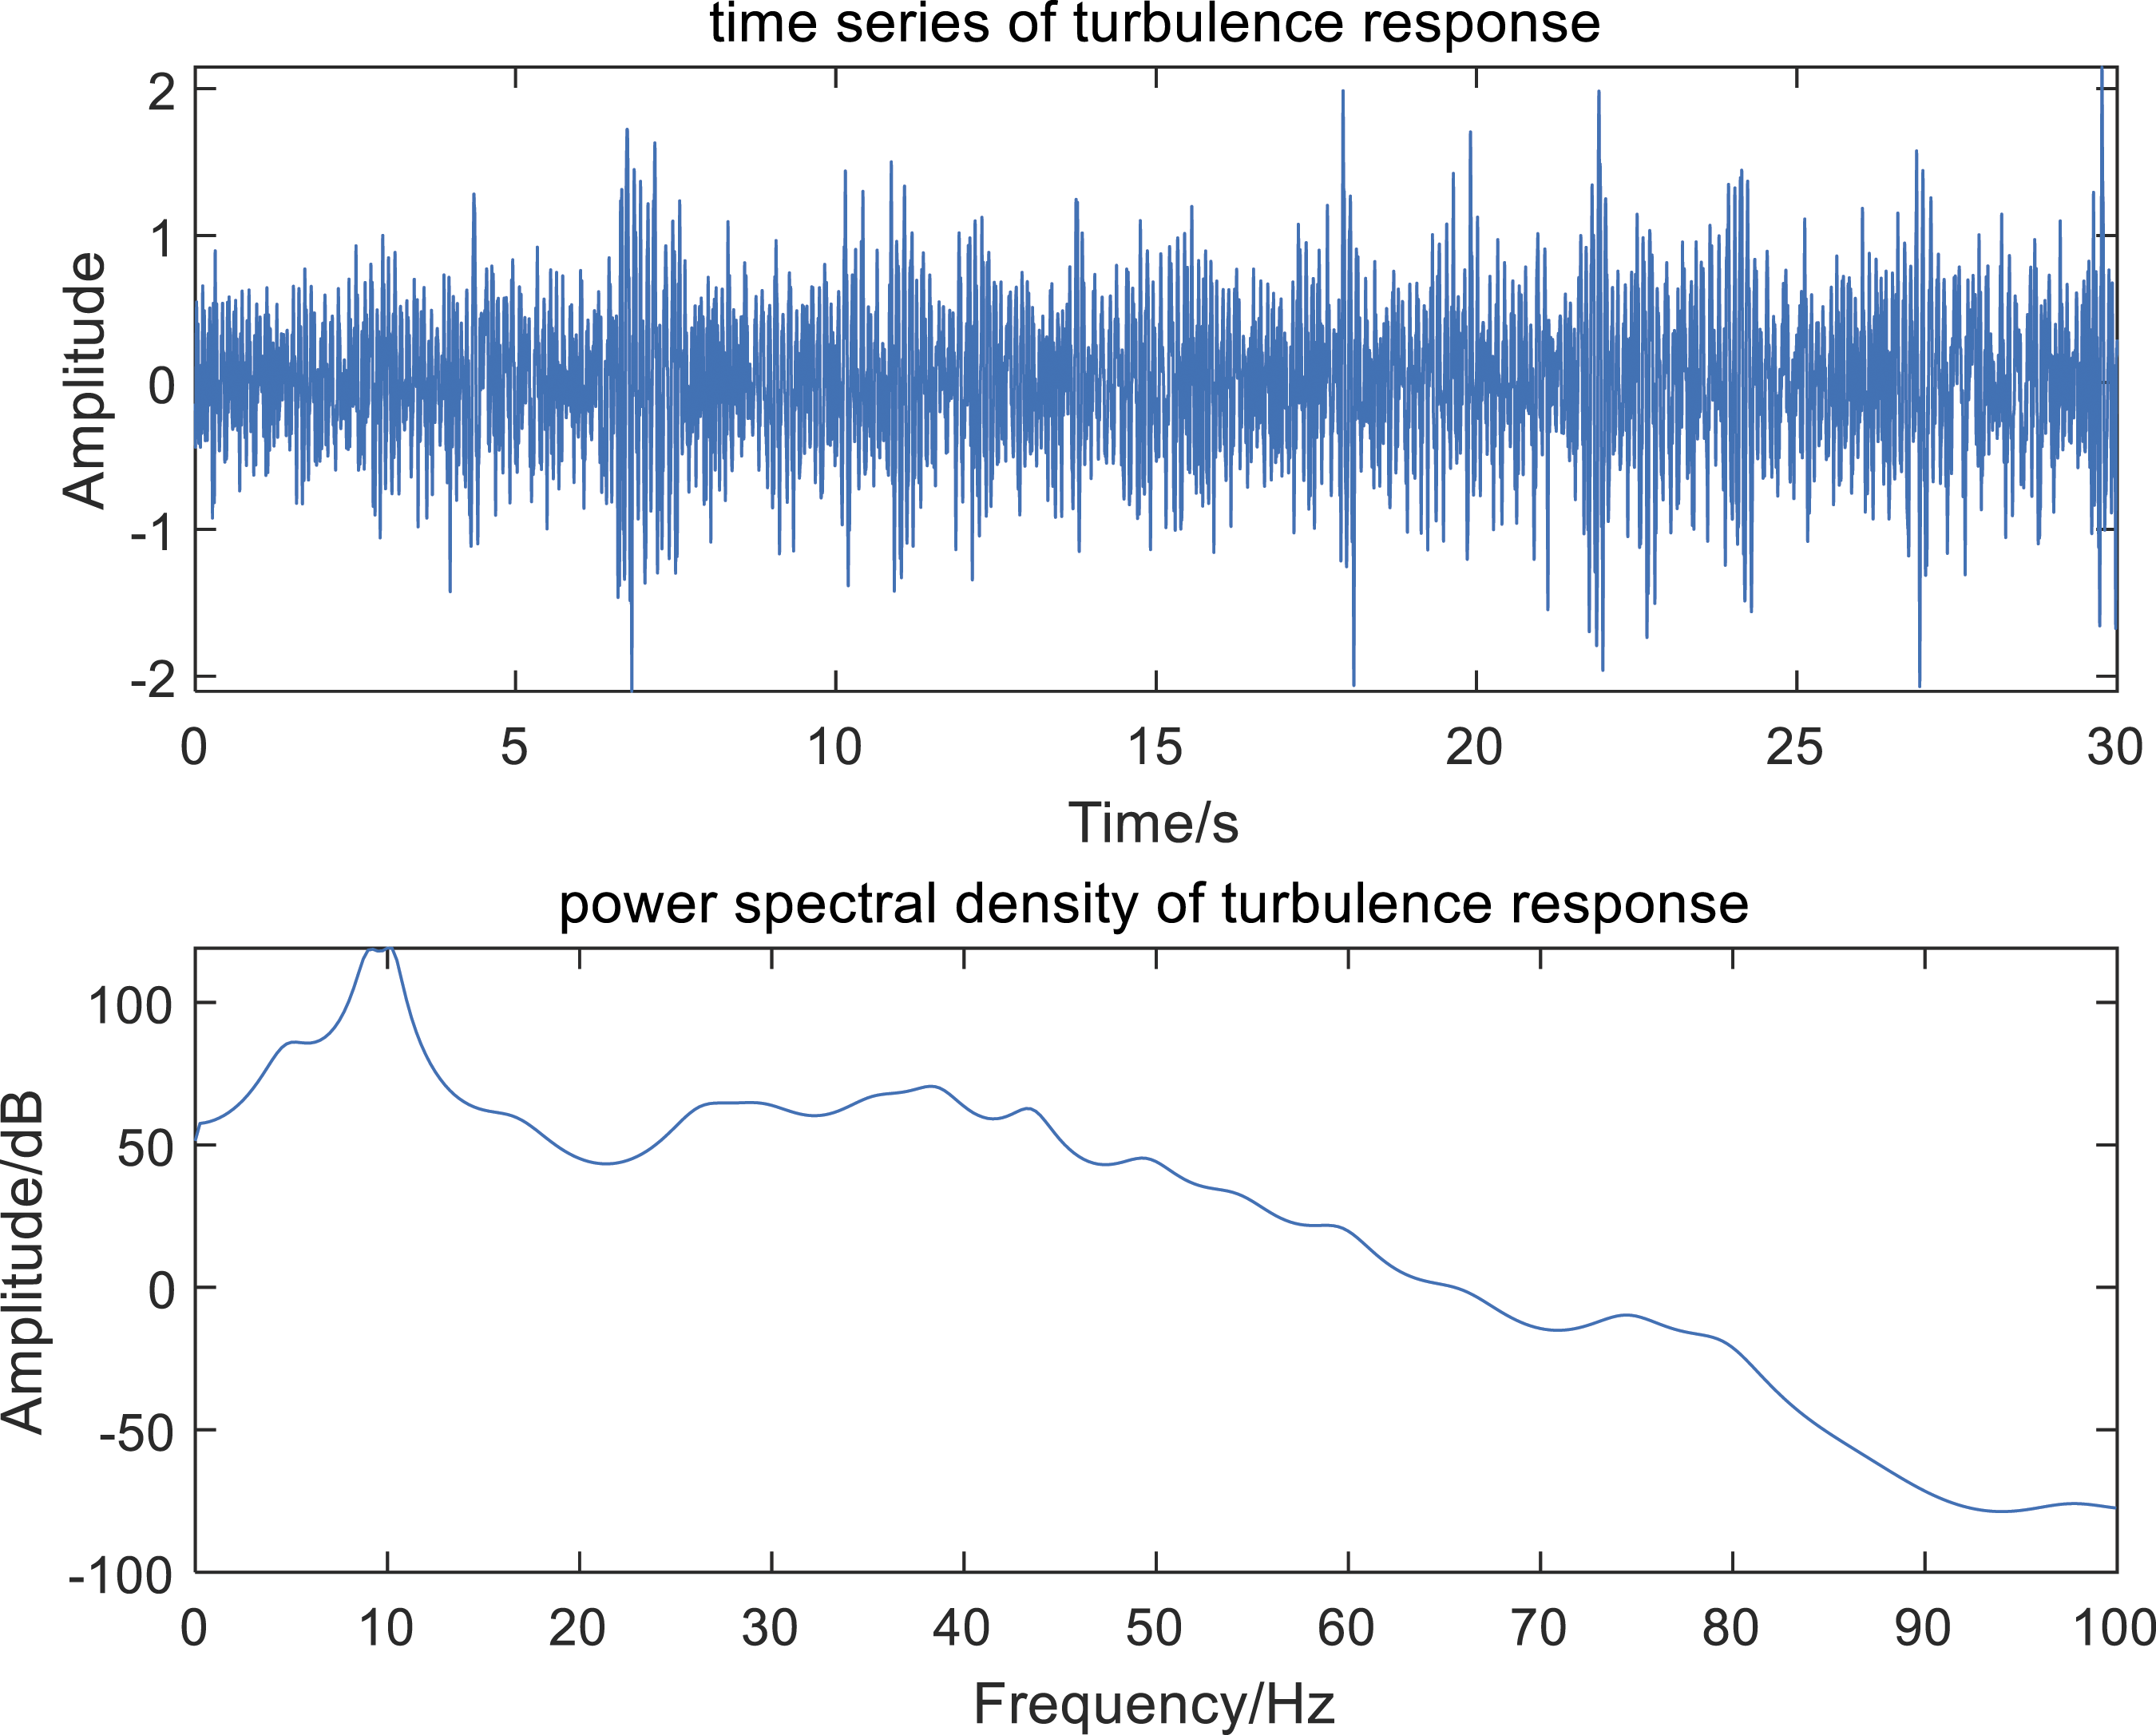
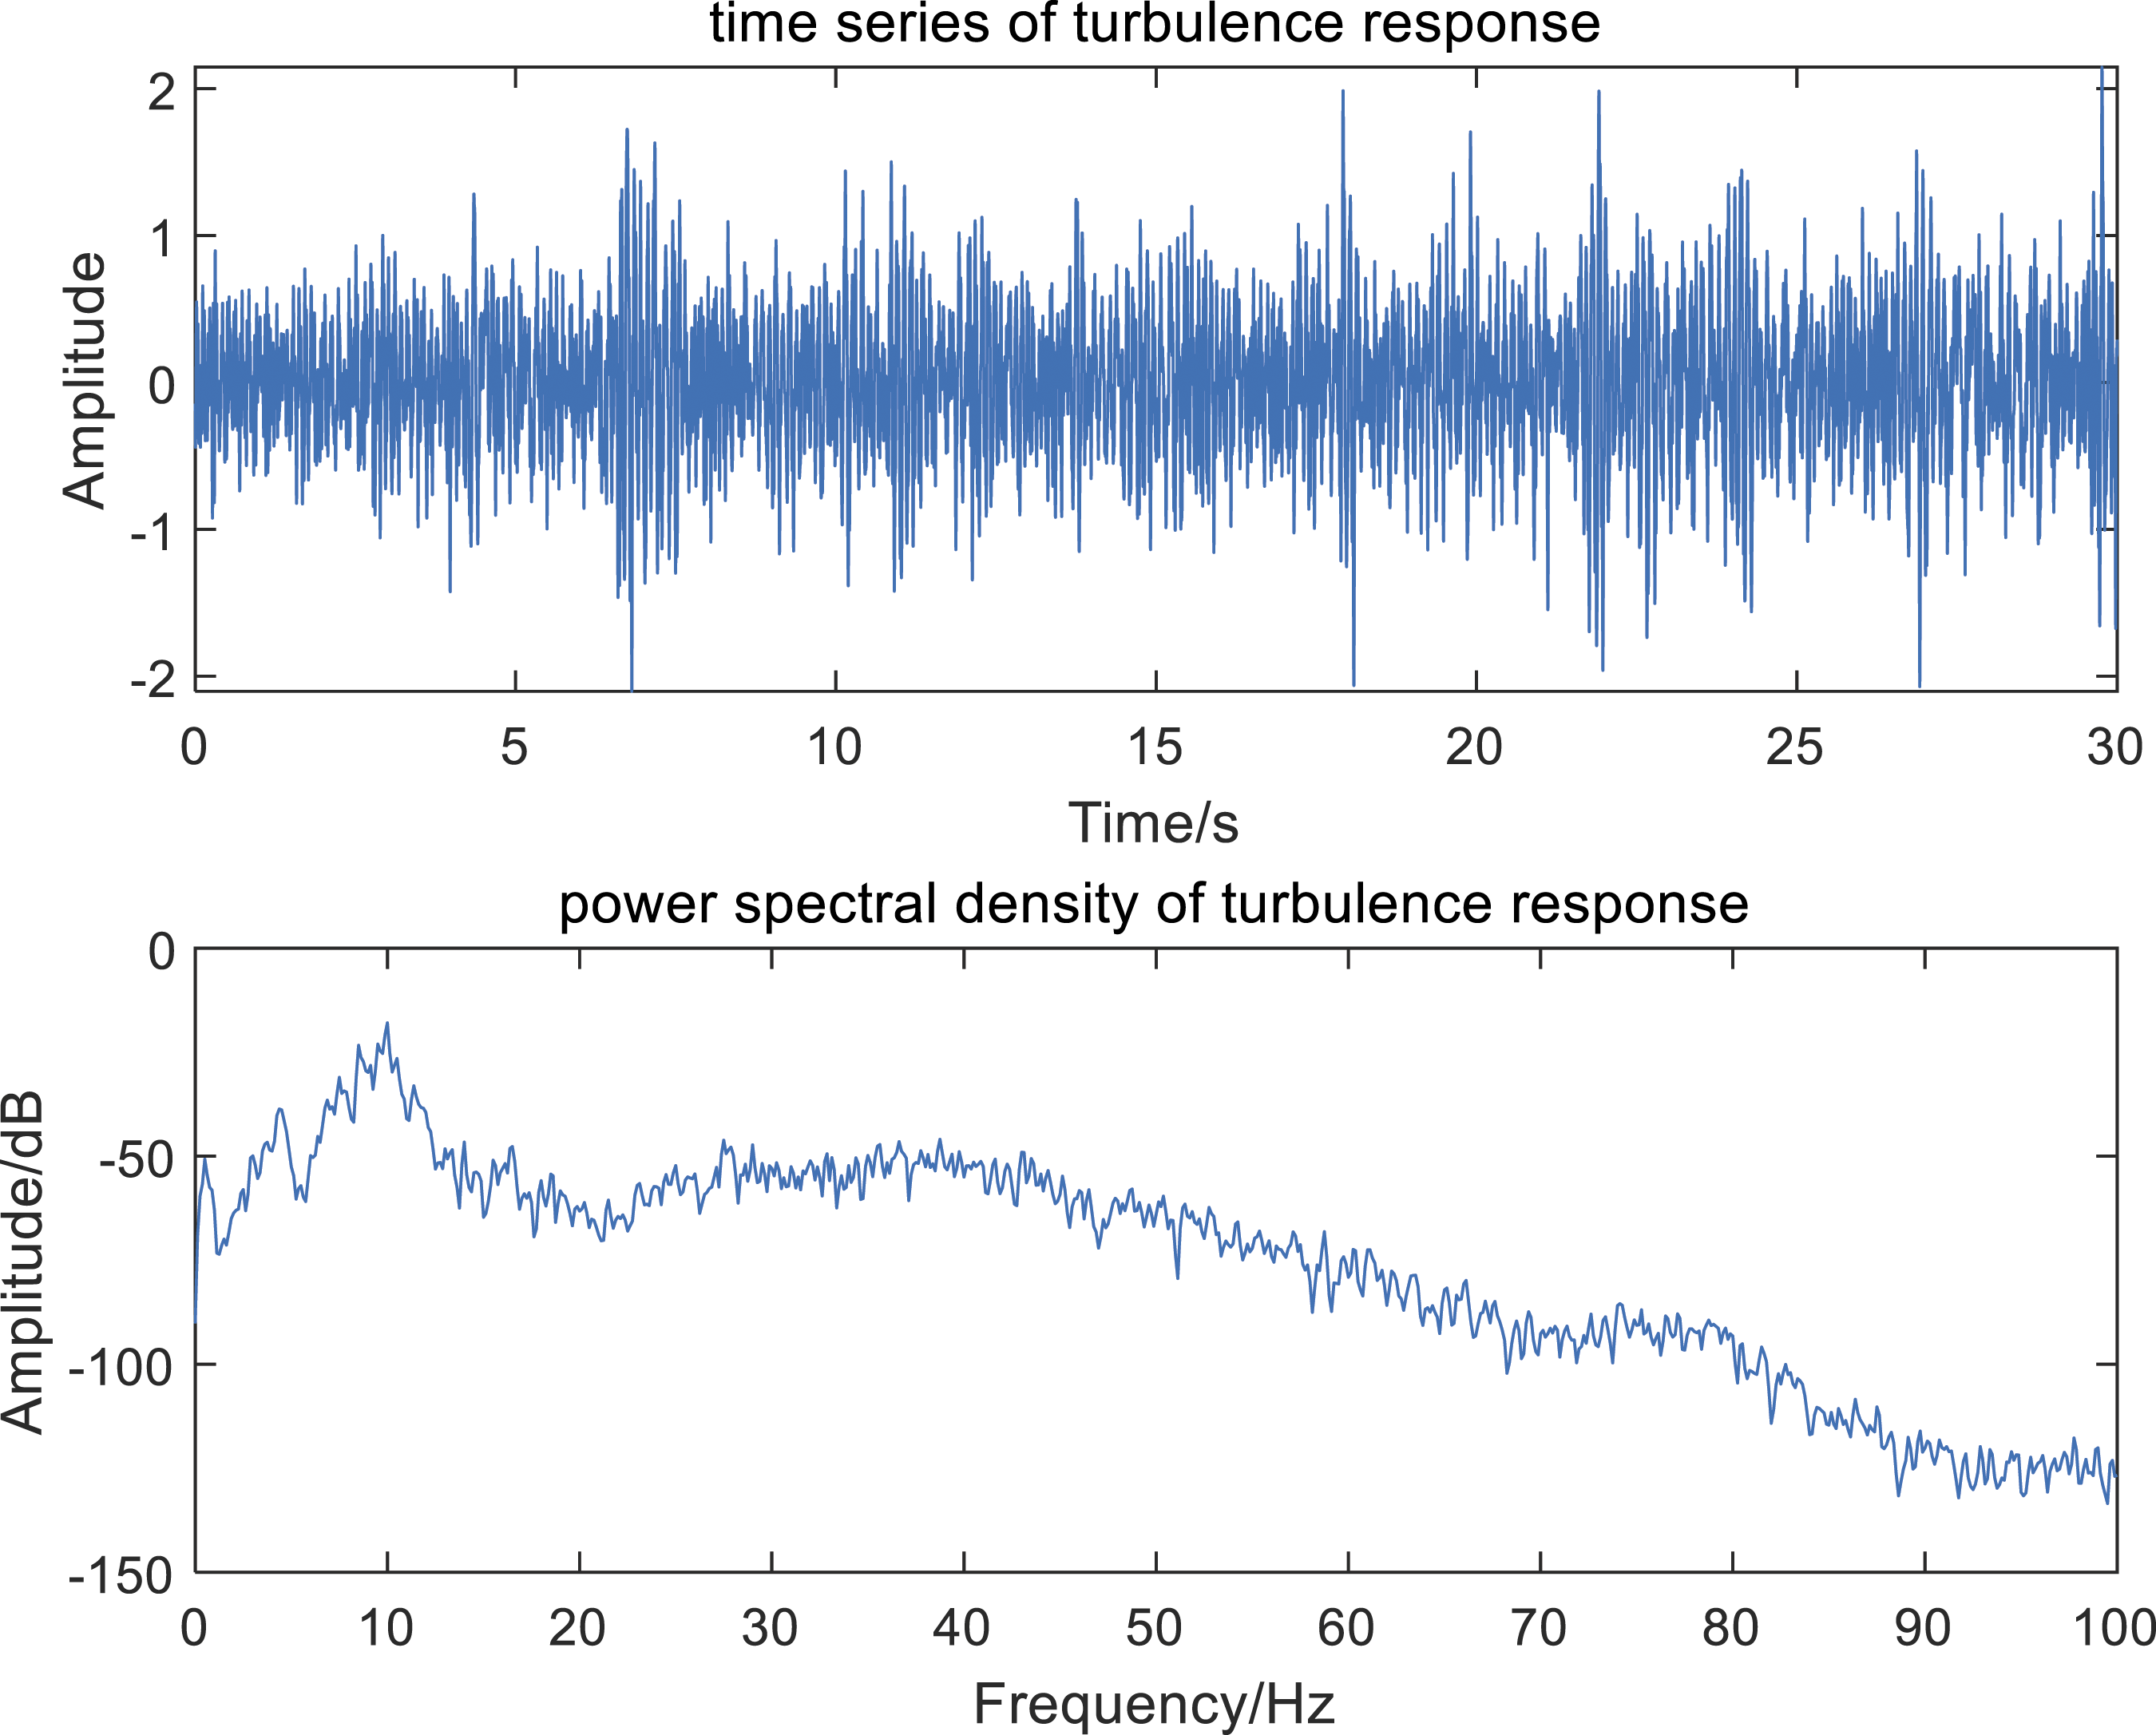
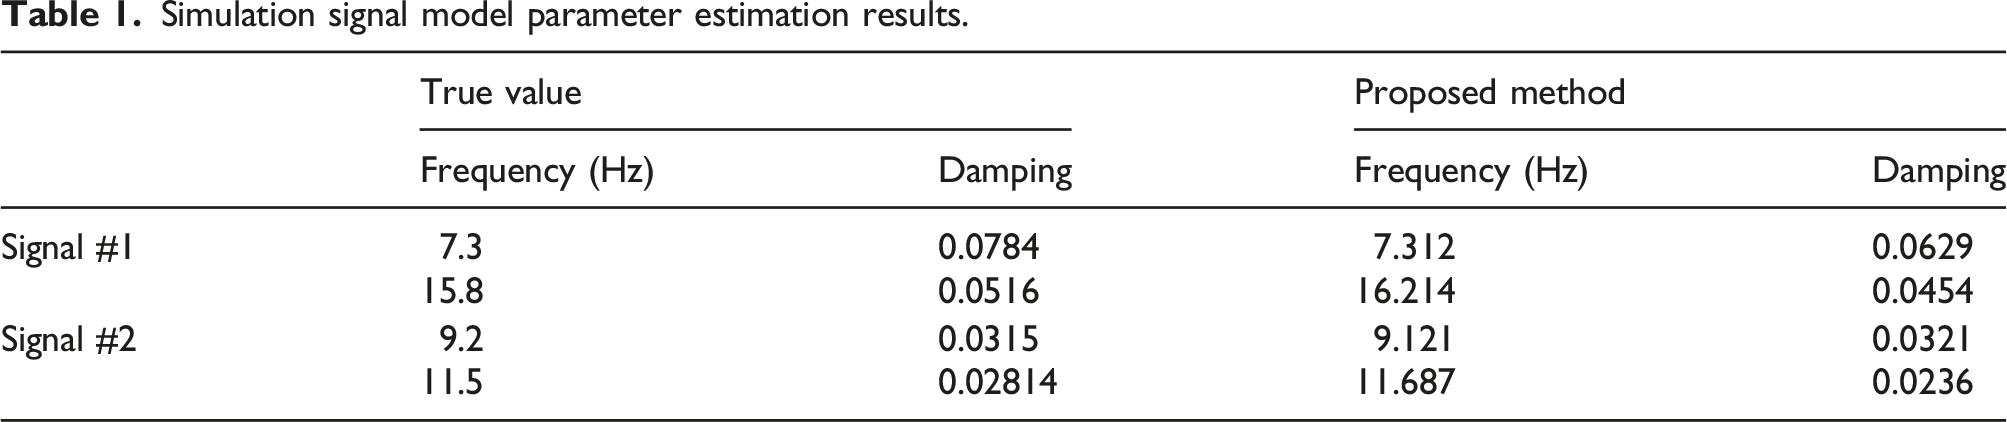
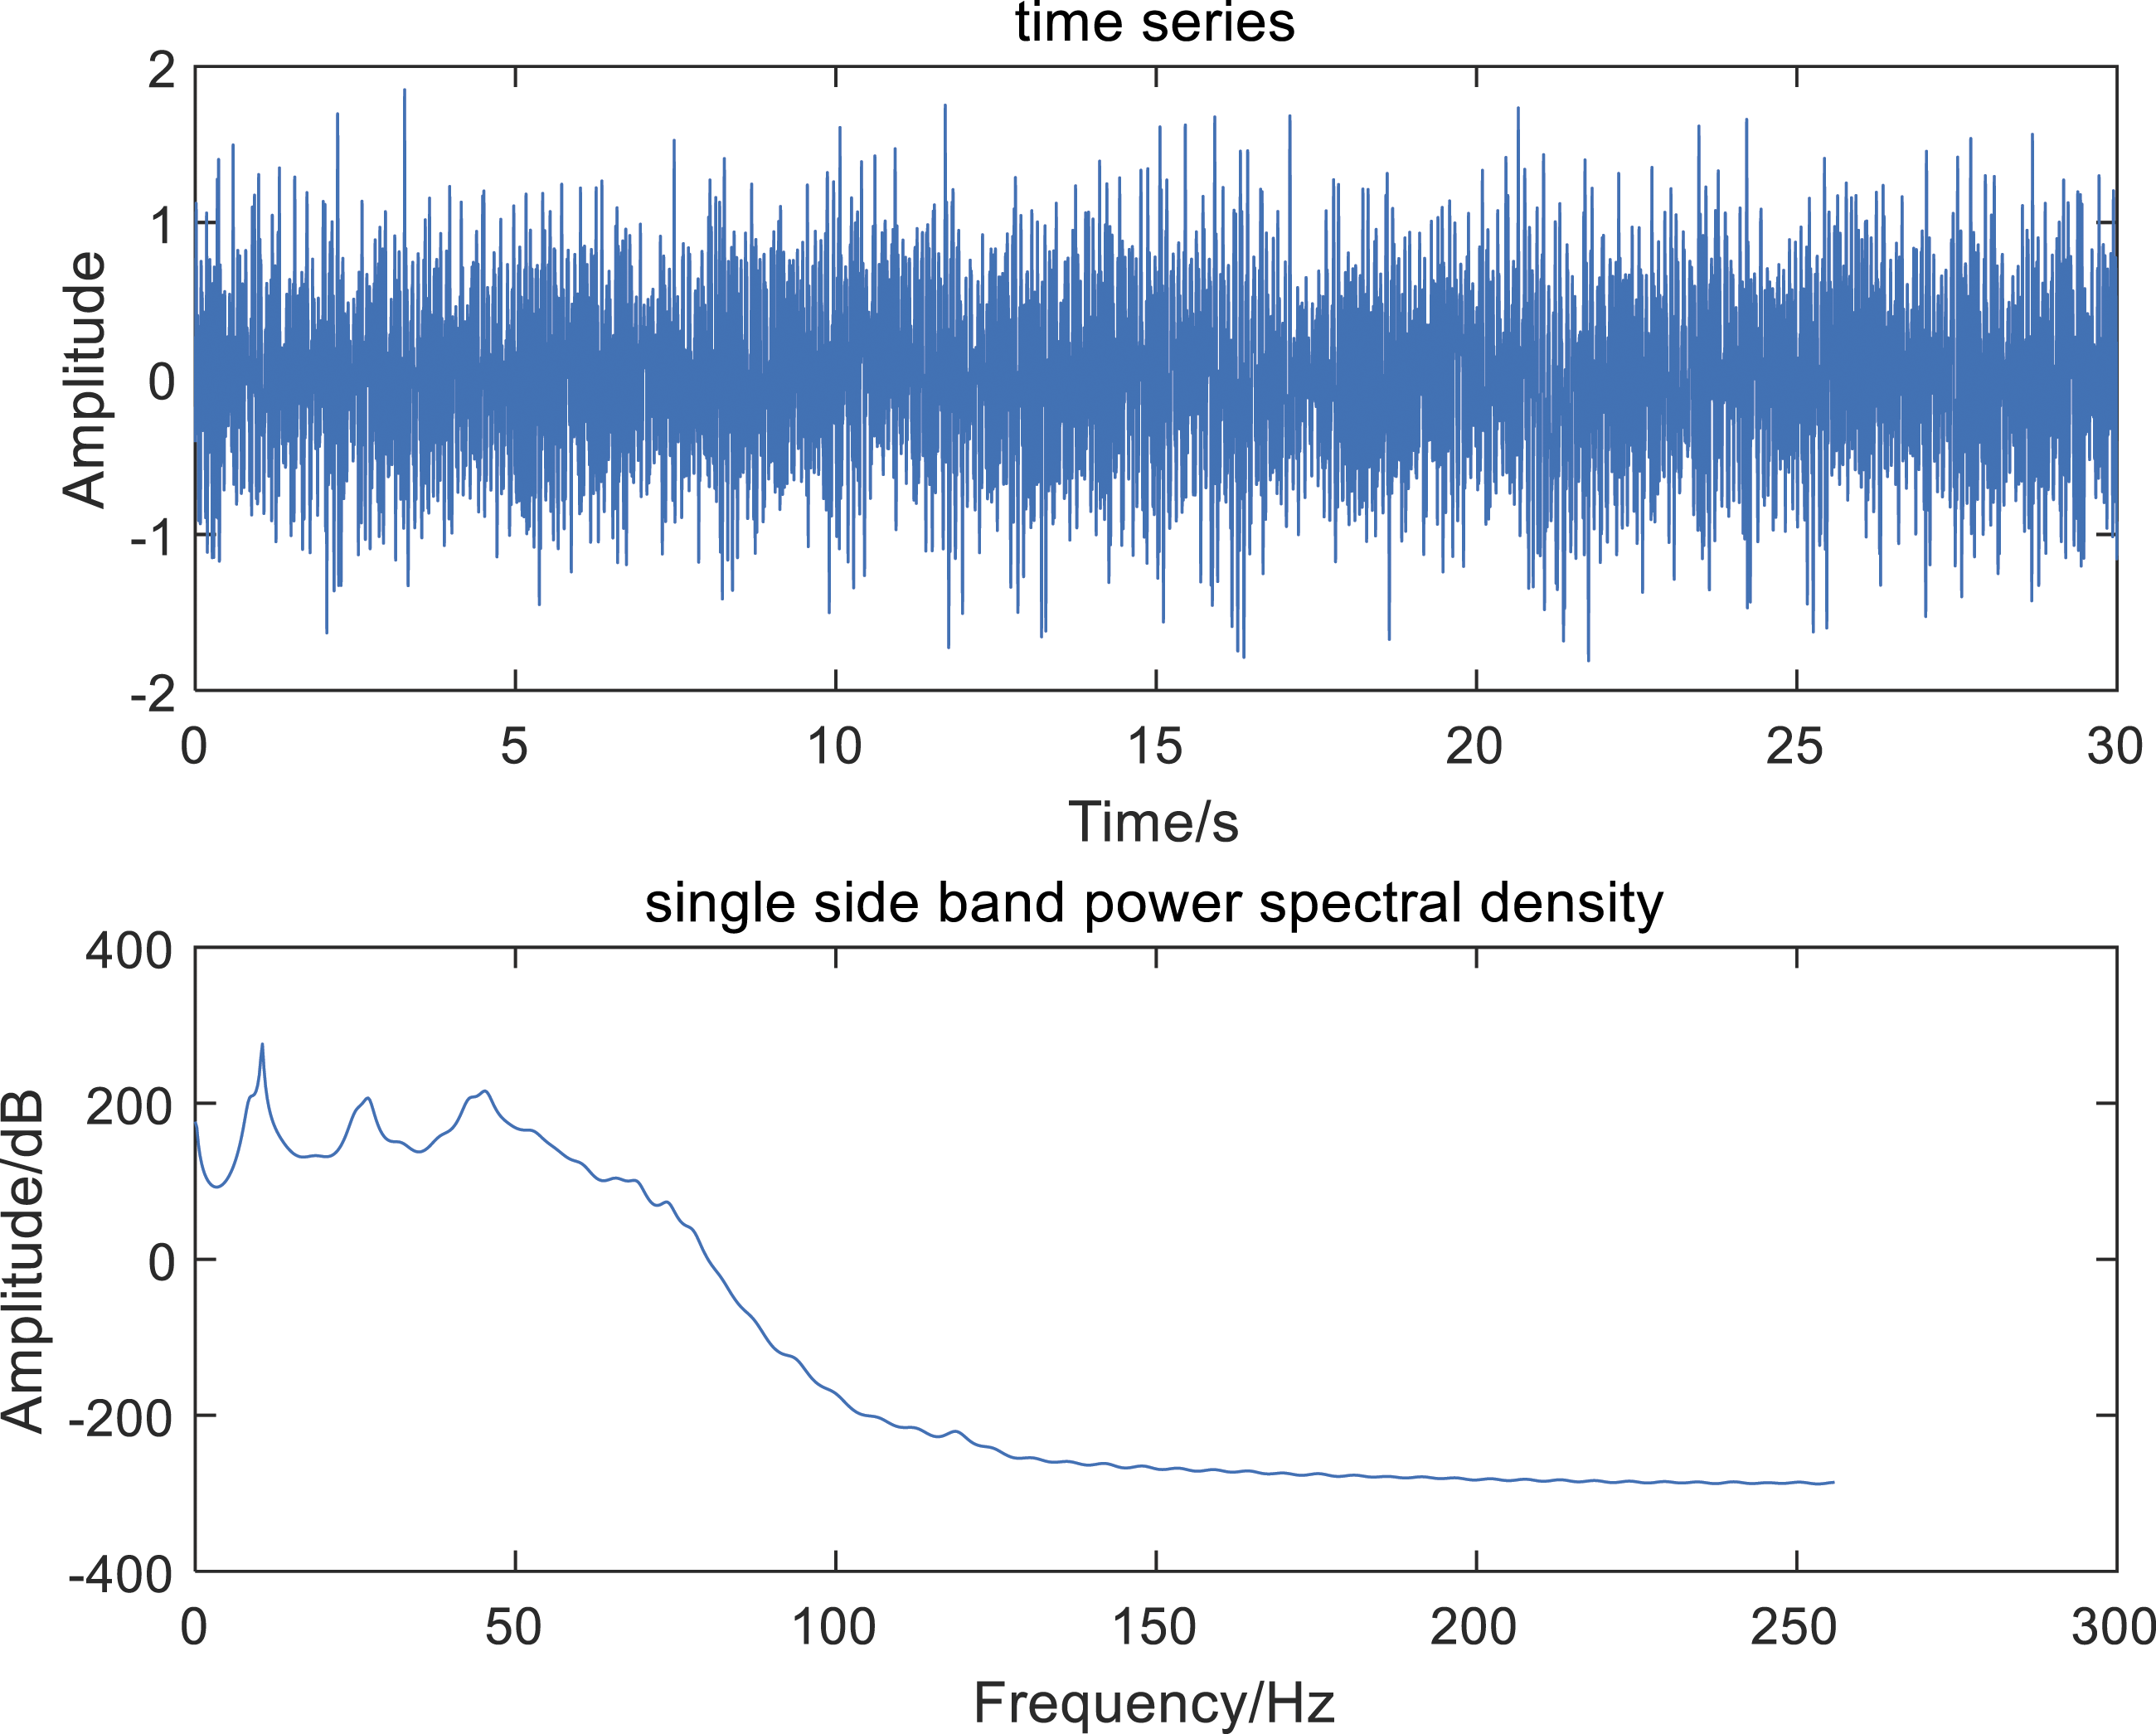
The AR parameter spectral analysis results were compared with the traditional non-parametric periodogram spectral analysis results. Figures 1 and 2 show the PSD functions calculated based on the AR spectrum and the periodogram method, respectively, using the same set of simulated signals. Figures 3 and 4 present the comparative results from different methods that were used to analyze data from flutter flight tests. The PSD results show a frequency band range of 1–100 Hz. It is clear that the AR spectrum can describe the modes contained in the turbulence response more smoothly, whereas the PSD of the periodogram method contains more noise. The noise has a significant influence on the results of spectral line fitting in the frequency domain. In general, this comparison reveals that parameterized spectral analysis can attain a smoother power spectral density function if the spectral line density is the same as that in the periodogram method. Time series and PSD calculated from the AR spectrum of the simulated signal. Time series and PSD calculated from the periodogram of the simulated signal. Time series and PSD calculated from the AR spectrum of a flutter flight test signal. Time series and PSD calculated from the periodogram of a flutter flight test signal.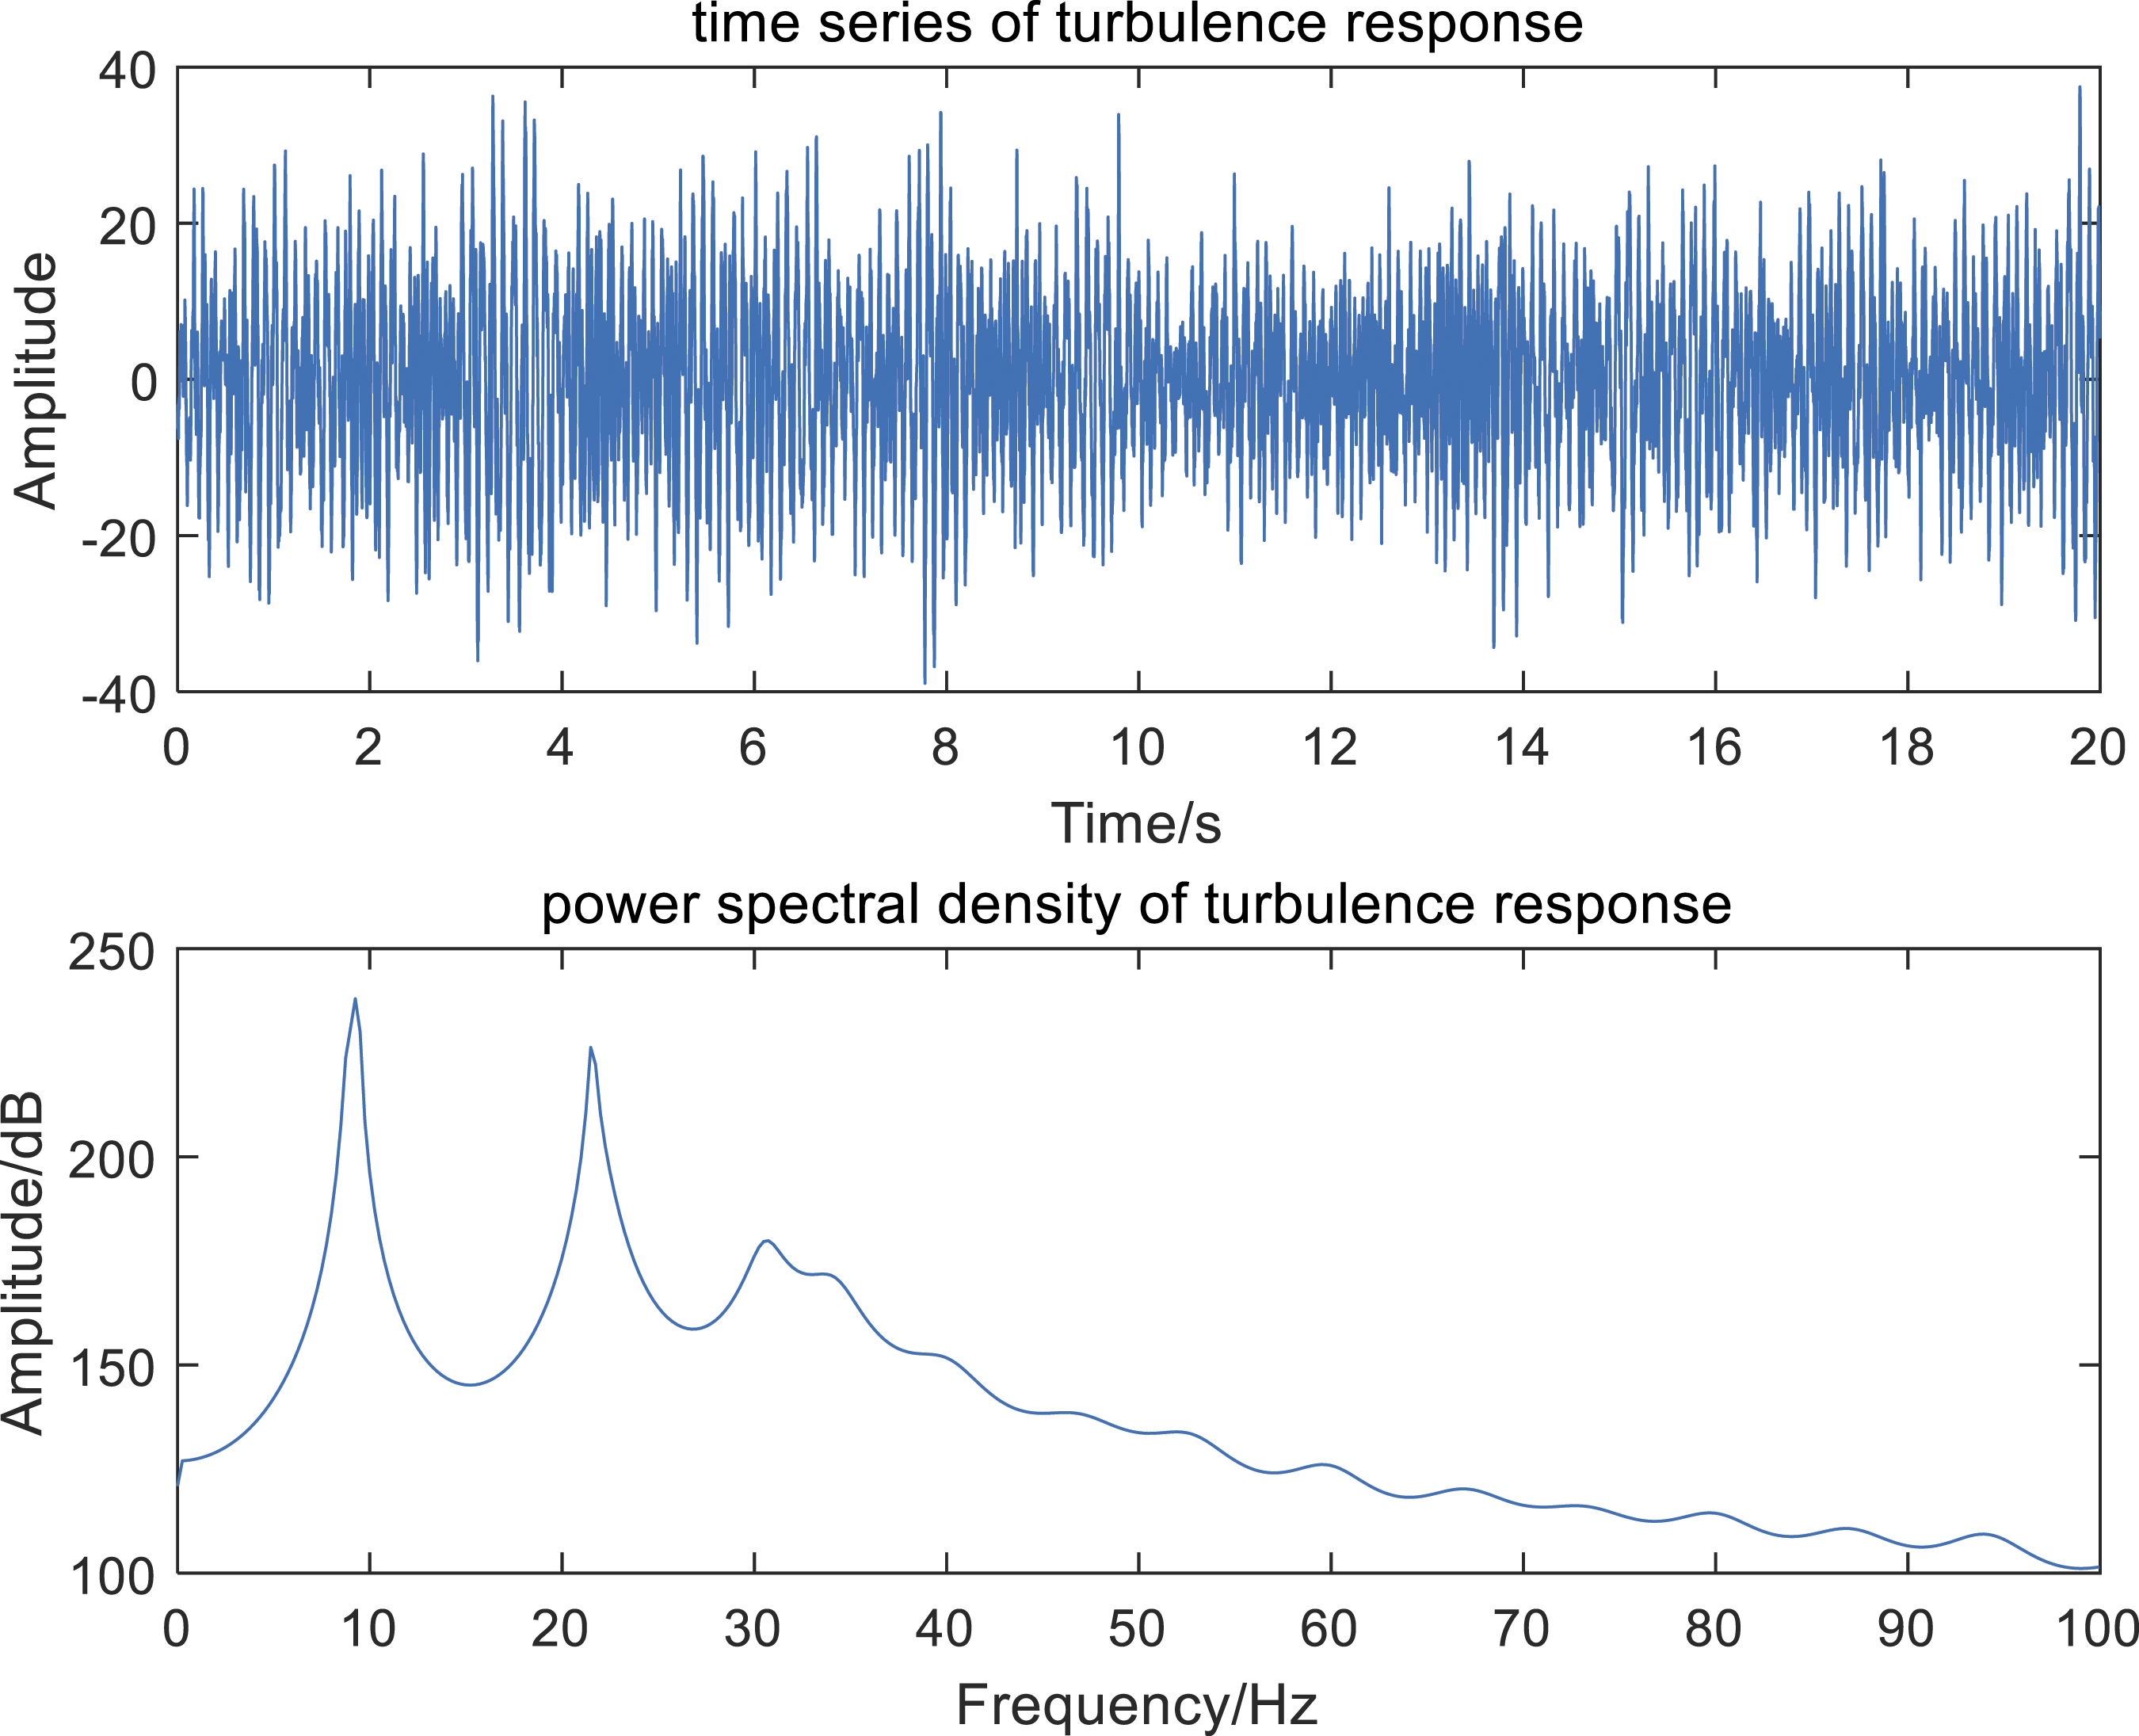
Simulation verification
The simulation signal was used for model parameter estimation to verify the proposed method. The impulse response of the structural system is expressed as


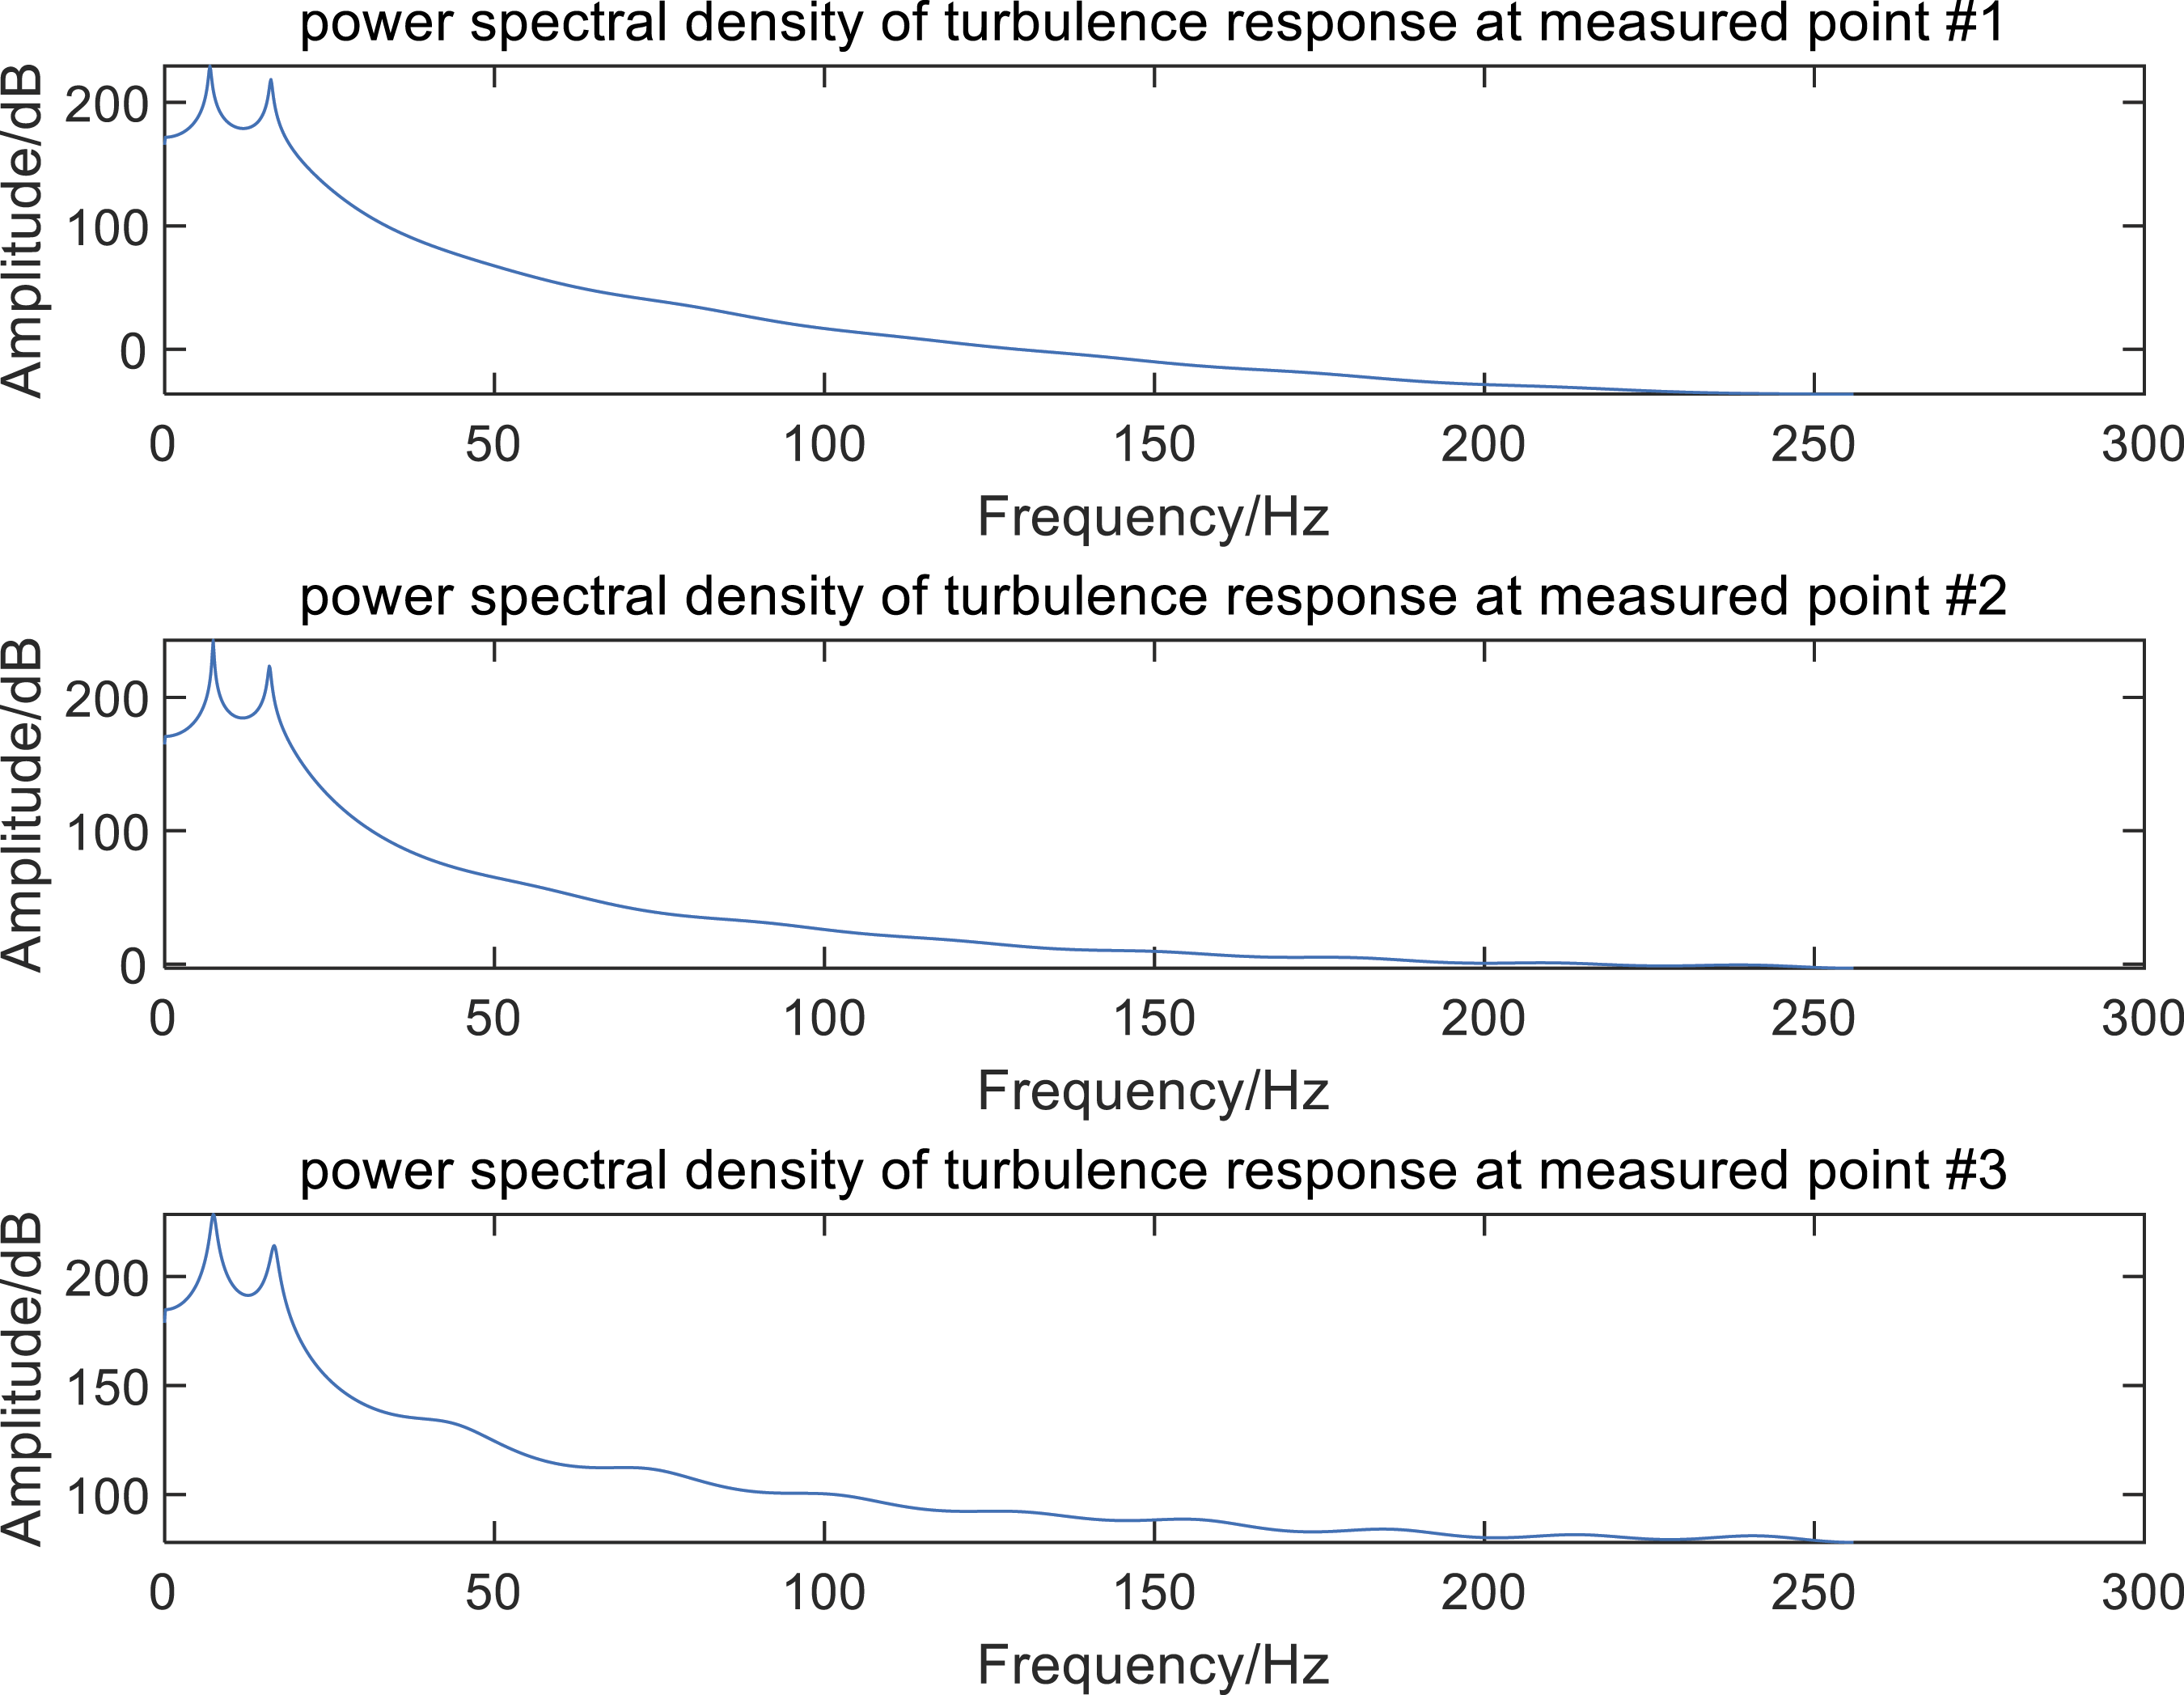
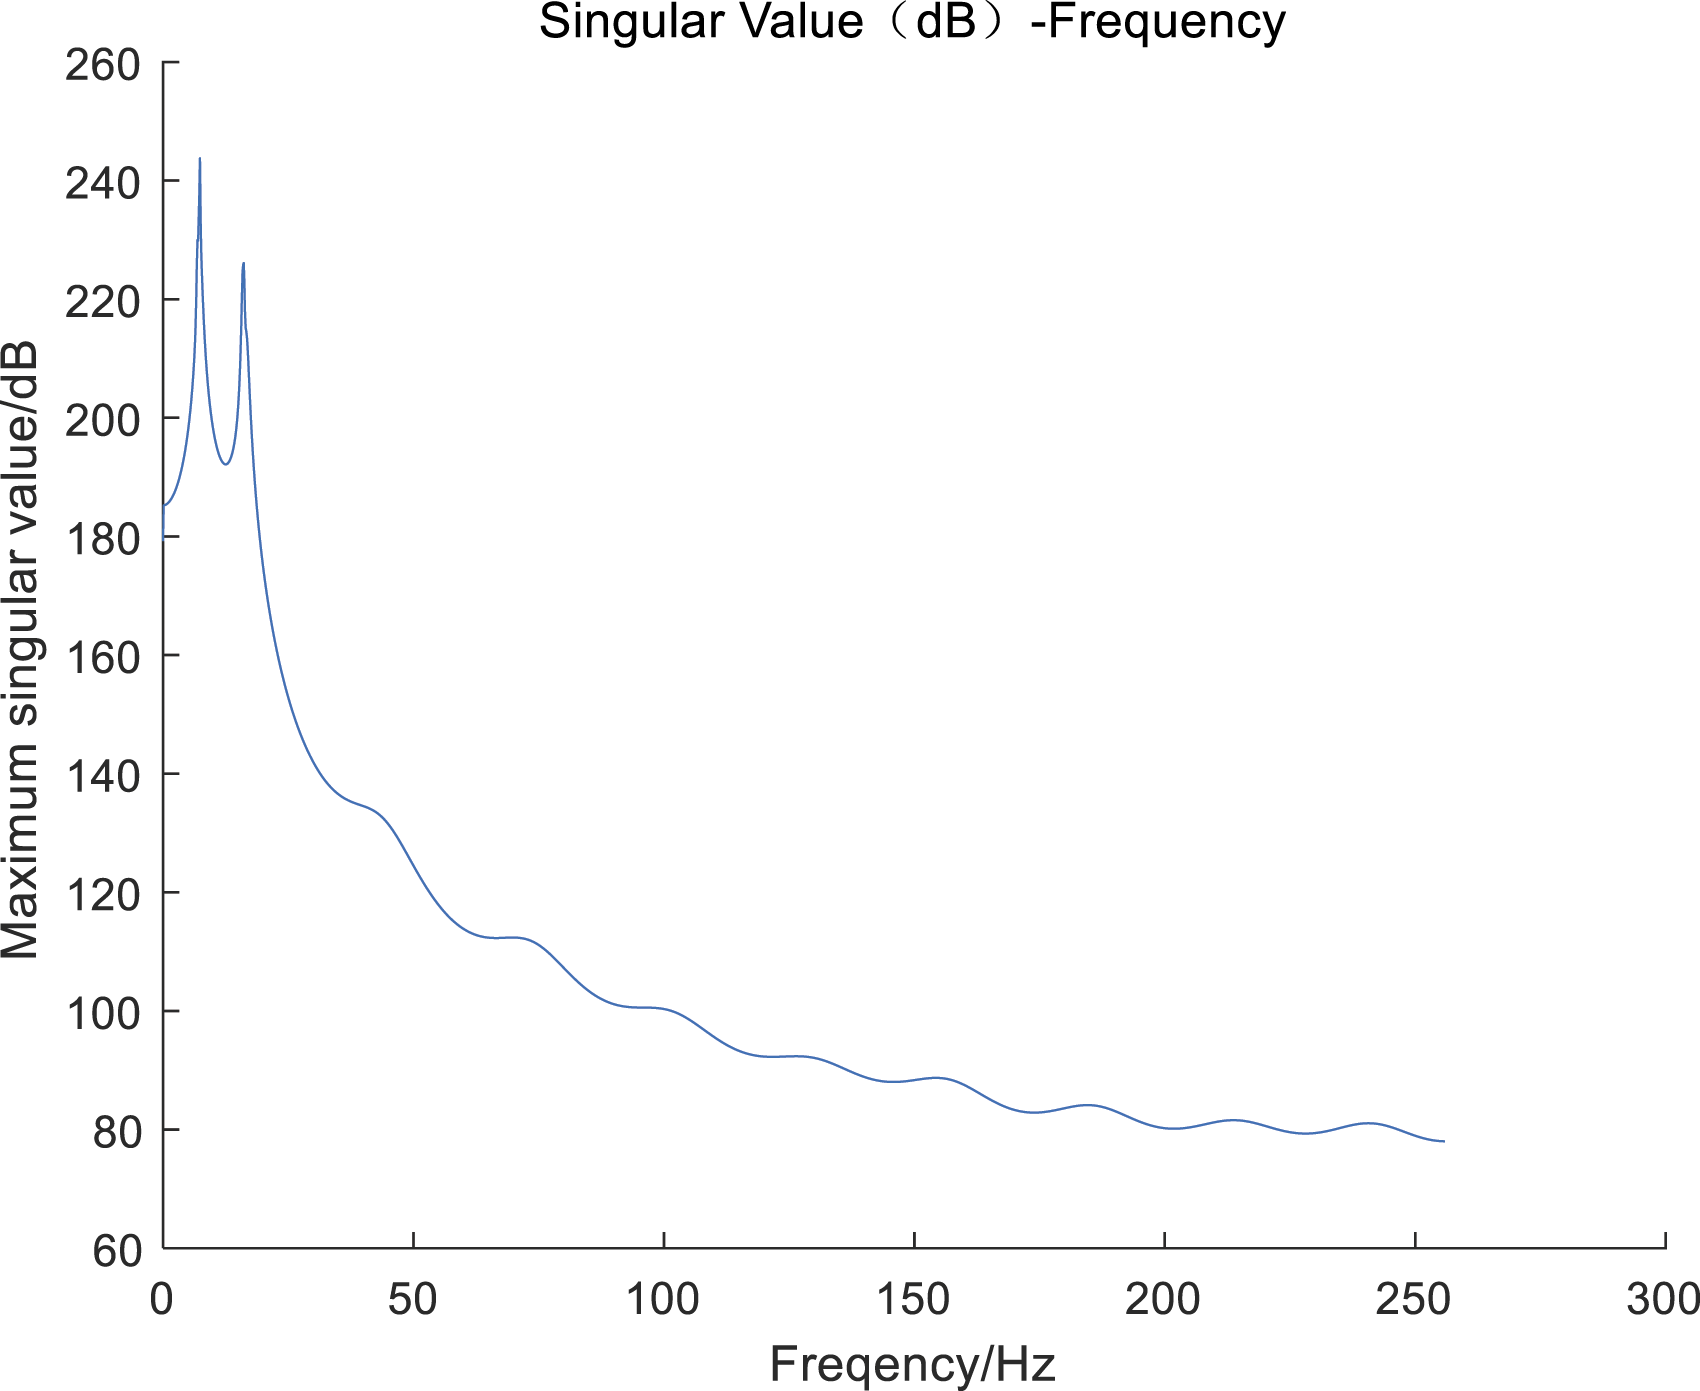
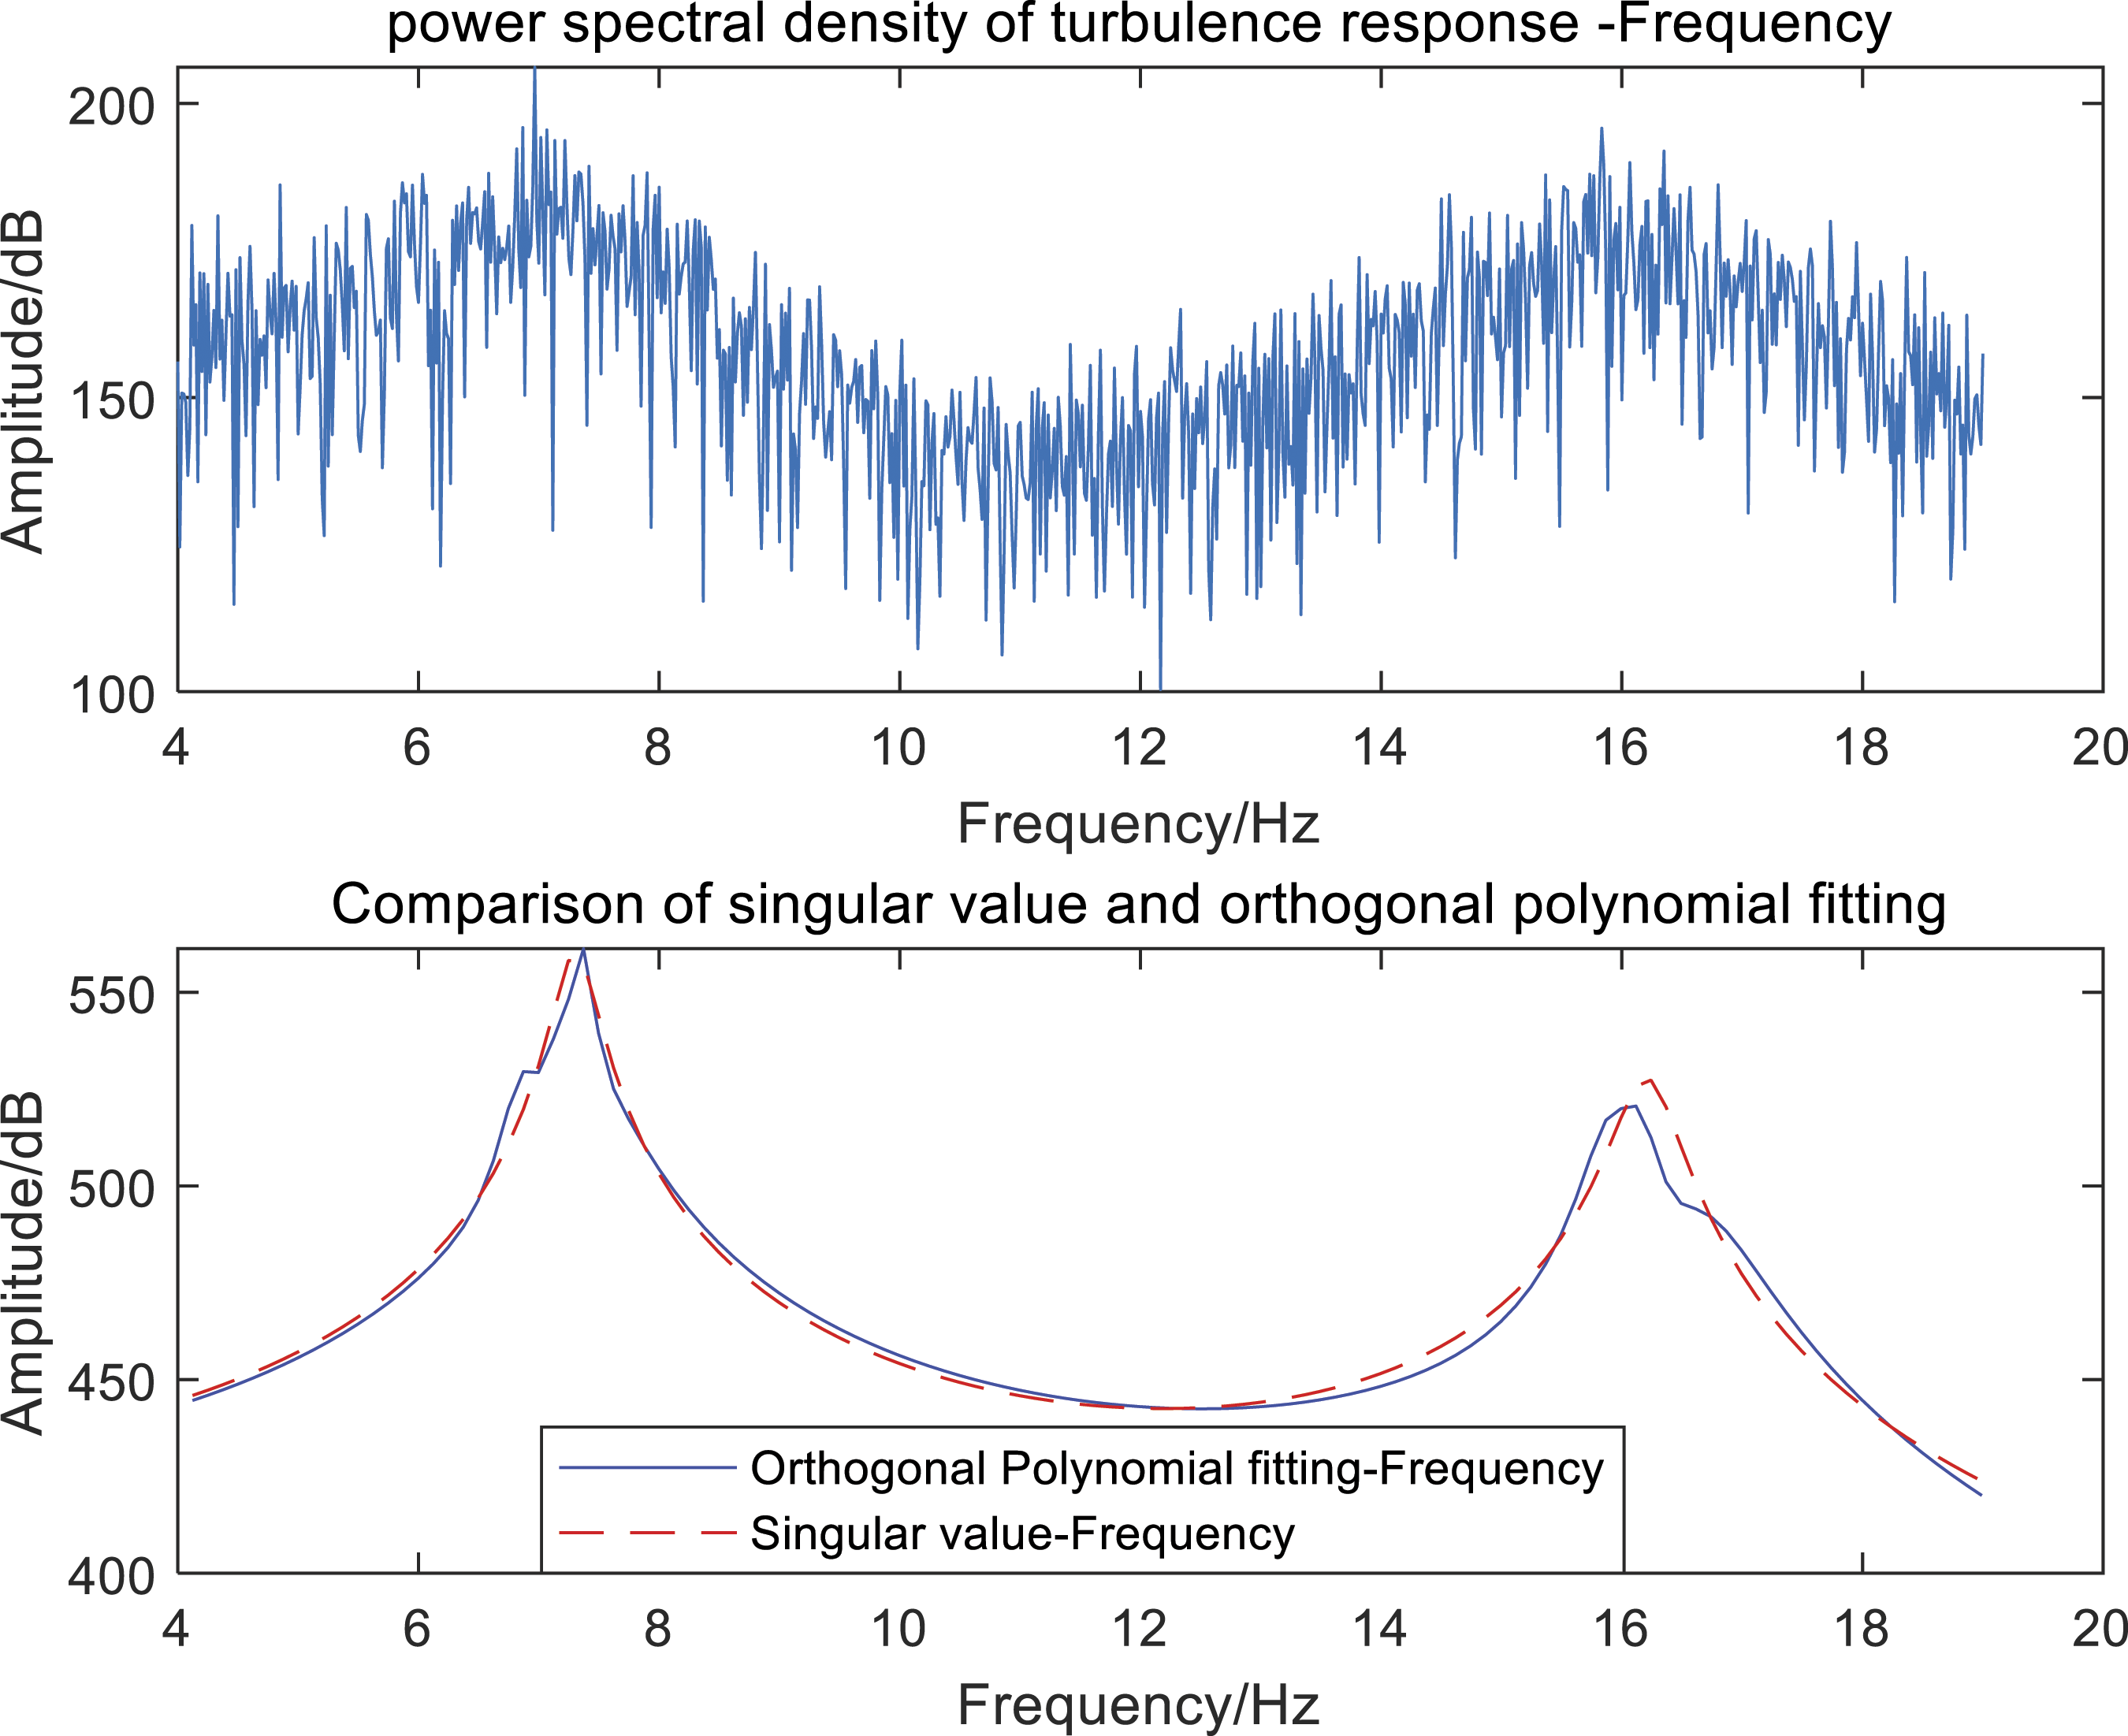
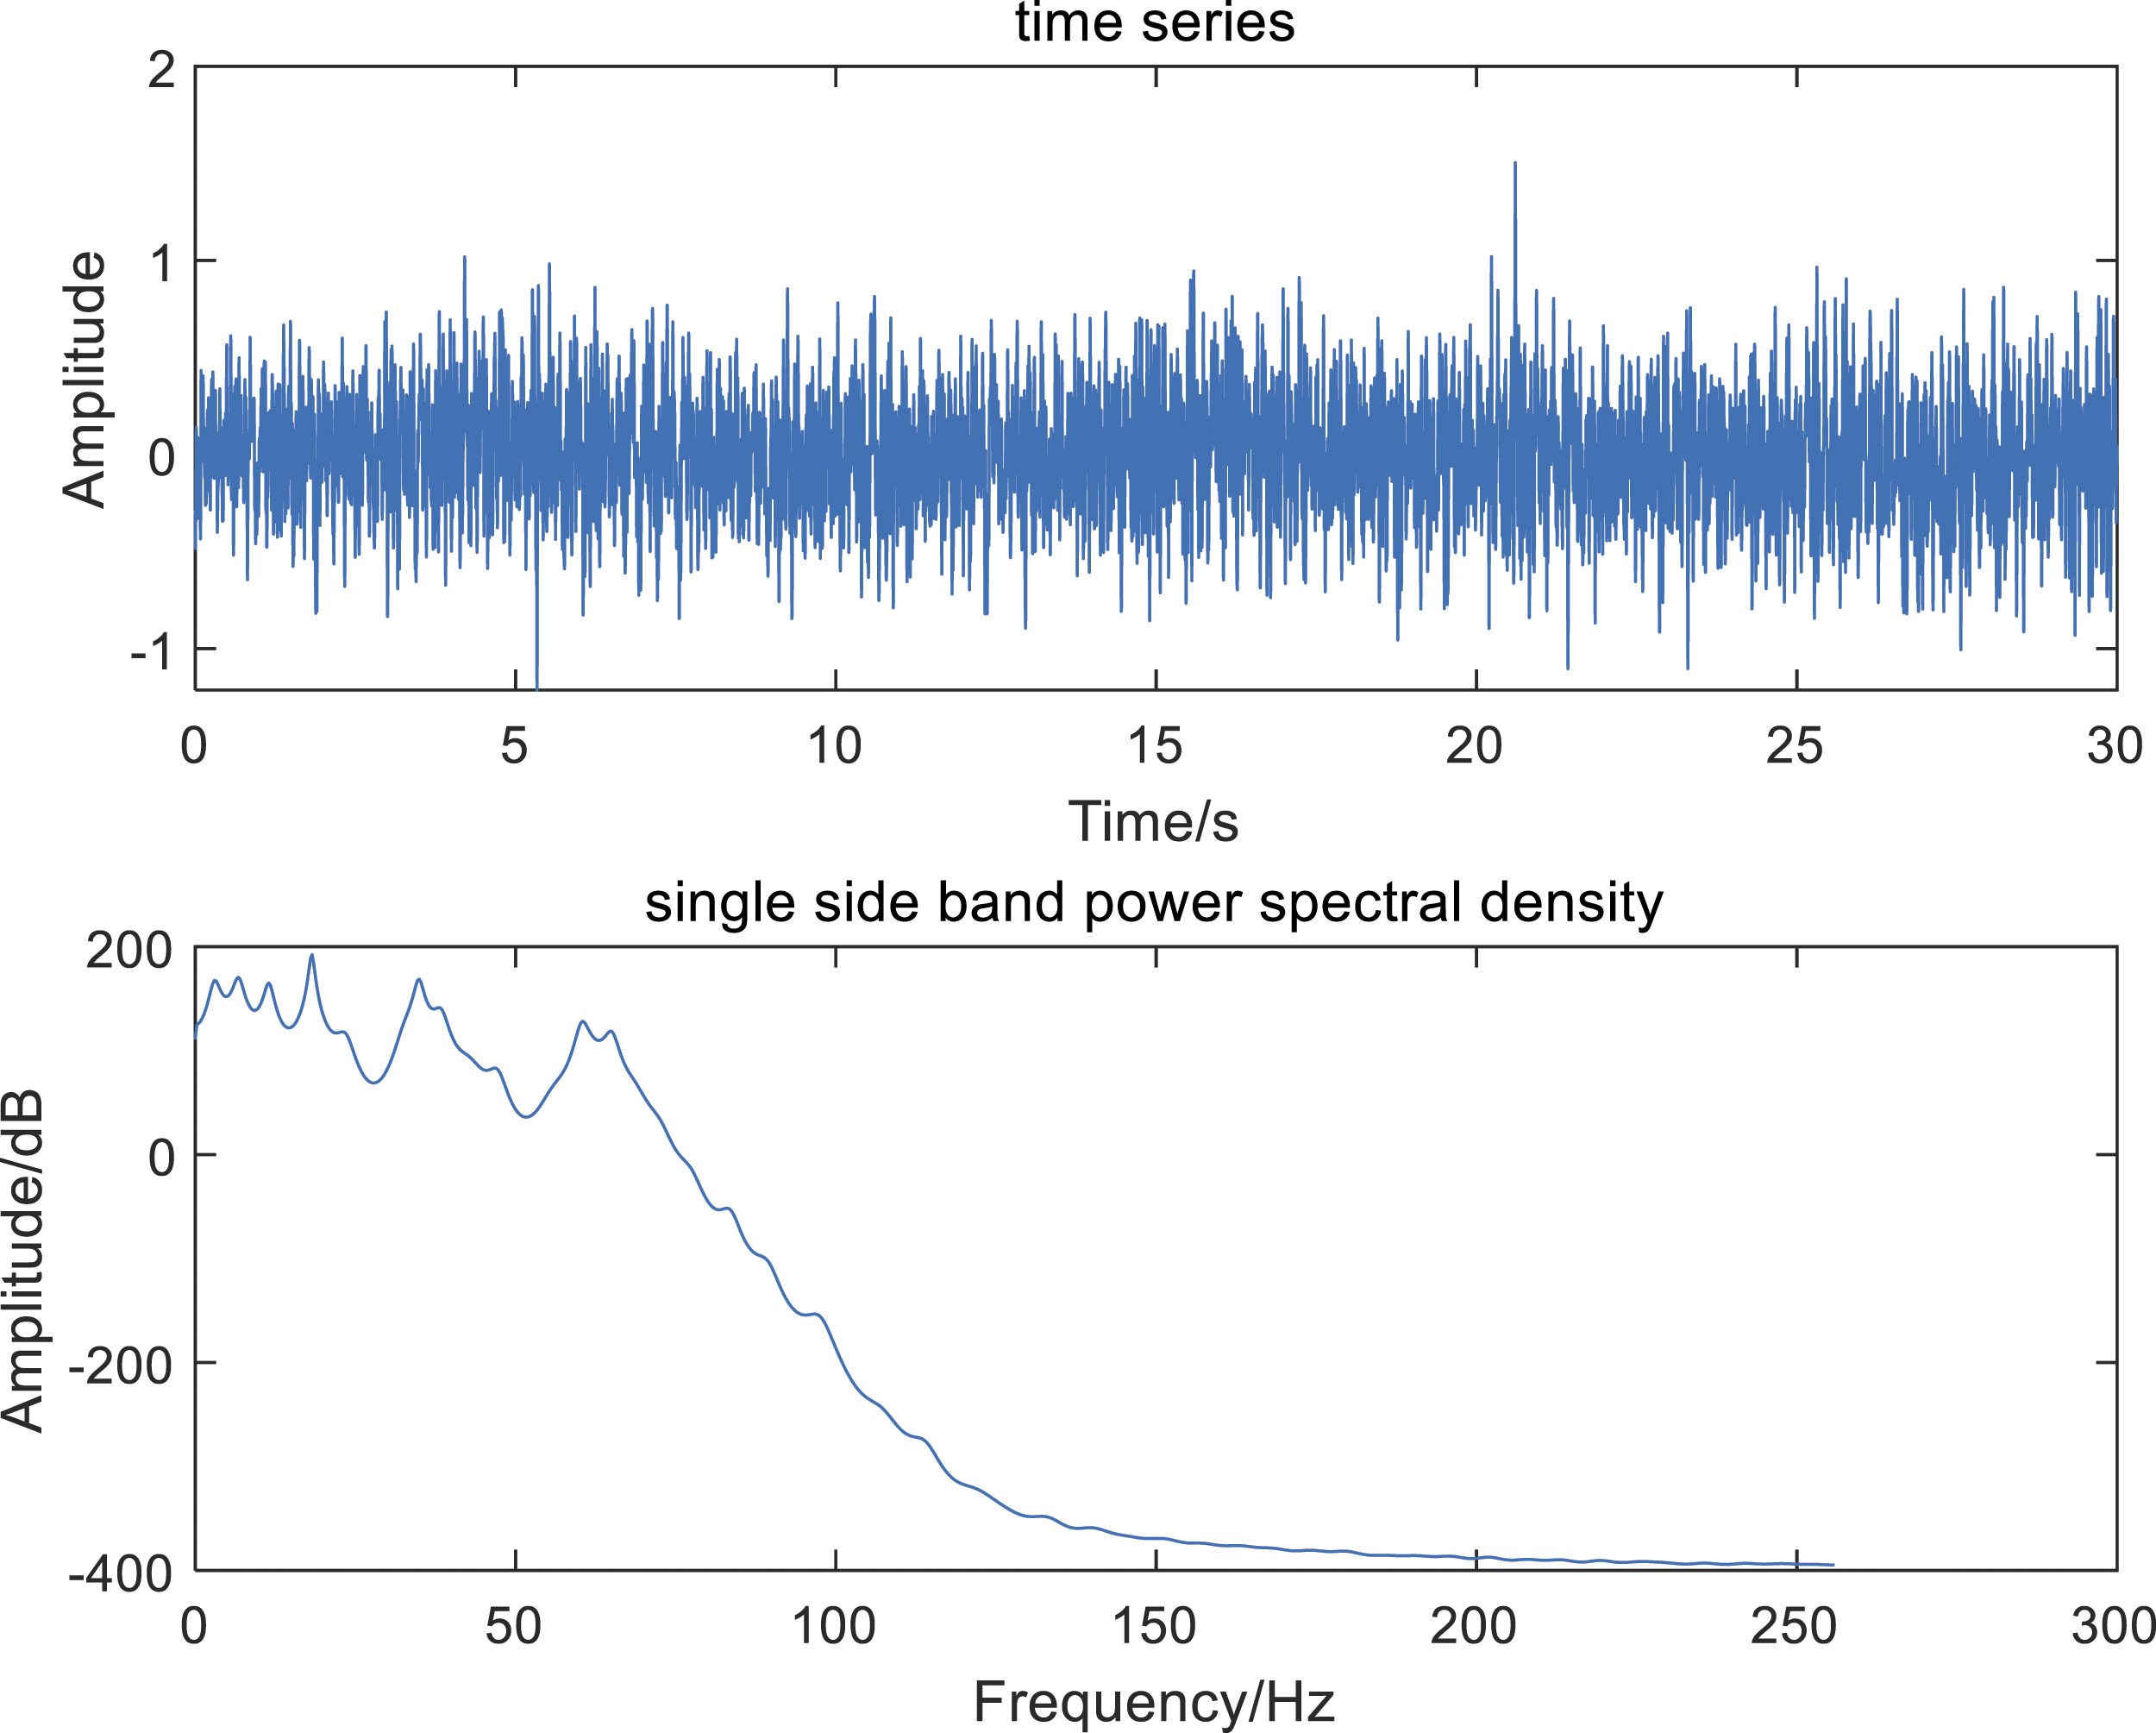
The relevant methods can be simulated and verified based on the calculation principle of the described simulation signals. The second-order modal frequencies of simulation signal #1 were set to 7.5 and 15.25 Hz, corresponding to modal damping values of 0.0784 and 0.0516, respectively. Figure 5 shows the turbulence response signals under different random excitation conditions. Figure 6 shows the PSD function of the turbulence response signal calculated based on AR parameter spectral analysis. Figure 7 presents the singular value curve corresponding to the multi-channel turbulence response signal. Figure 8 shows the PSD function of the turbulence response signal based on FFT calculations (top) and the modal parameter estimation result (bottom), where the blue curve represents the maximum singular value curve obtained from the frequency band analysis, and the red dotted line shows the system identification fitting result. Time series of the three channels’ turbulence responses. PSDs of the three channels’ turbulence responses based on the AR spectra. Singular value curve of the three-channel turbulence response. FFT of channel #1 (top) and model parameter estimation results (bottom).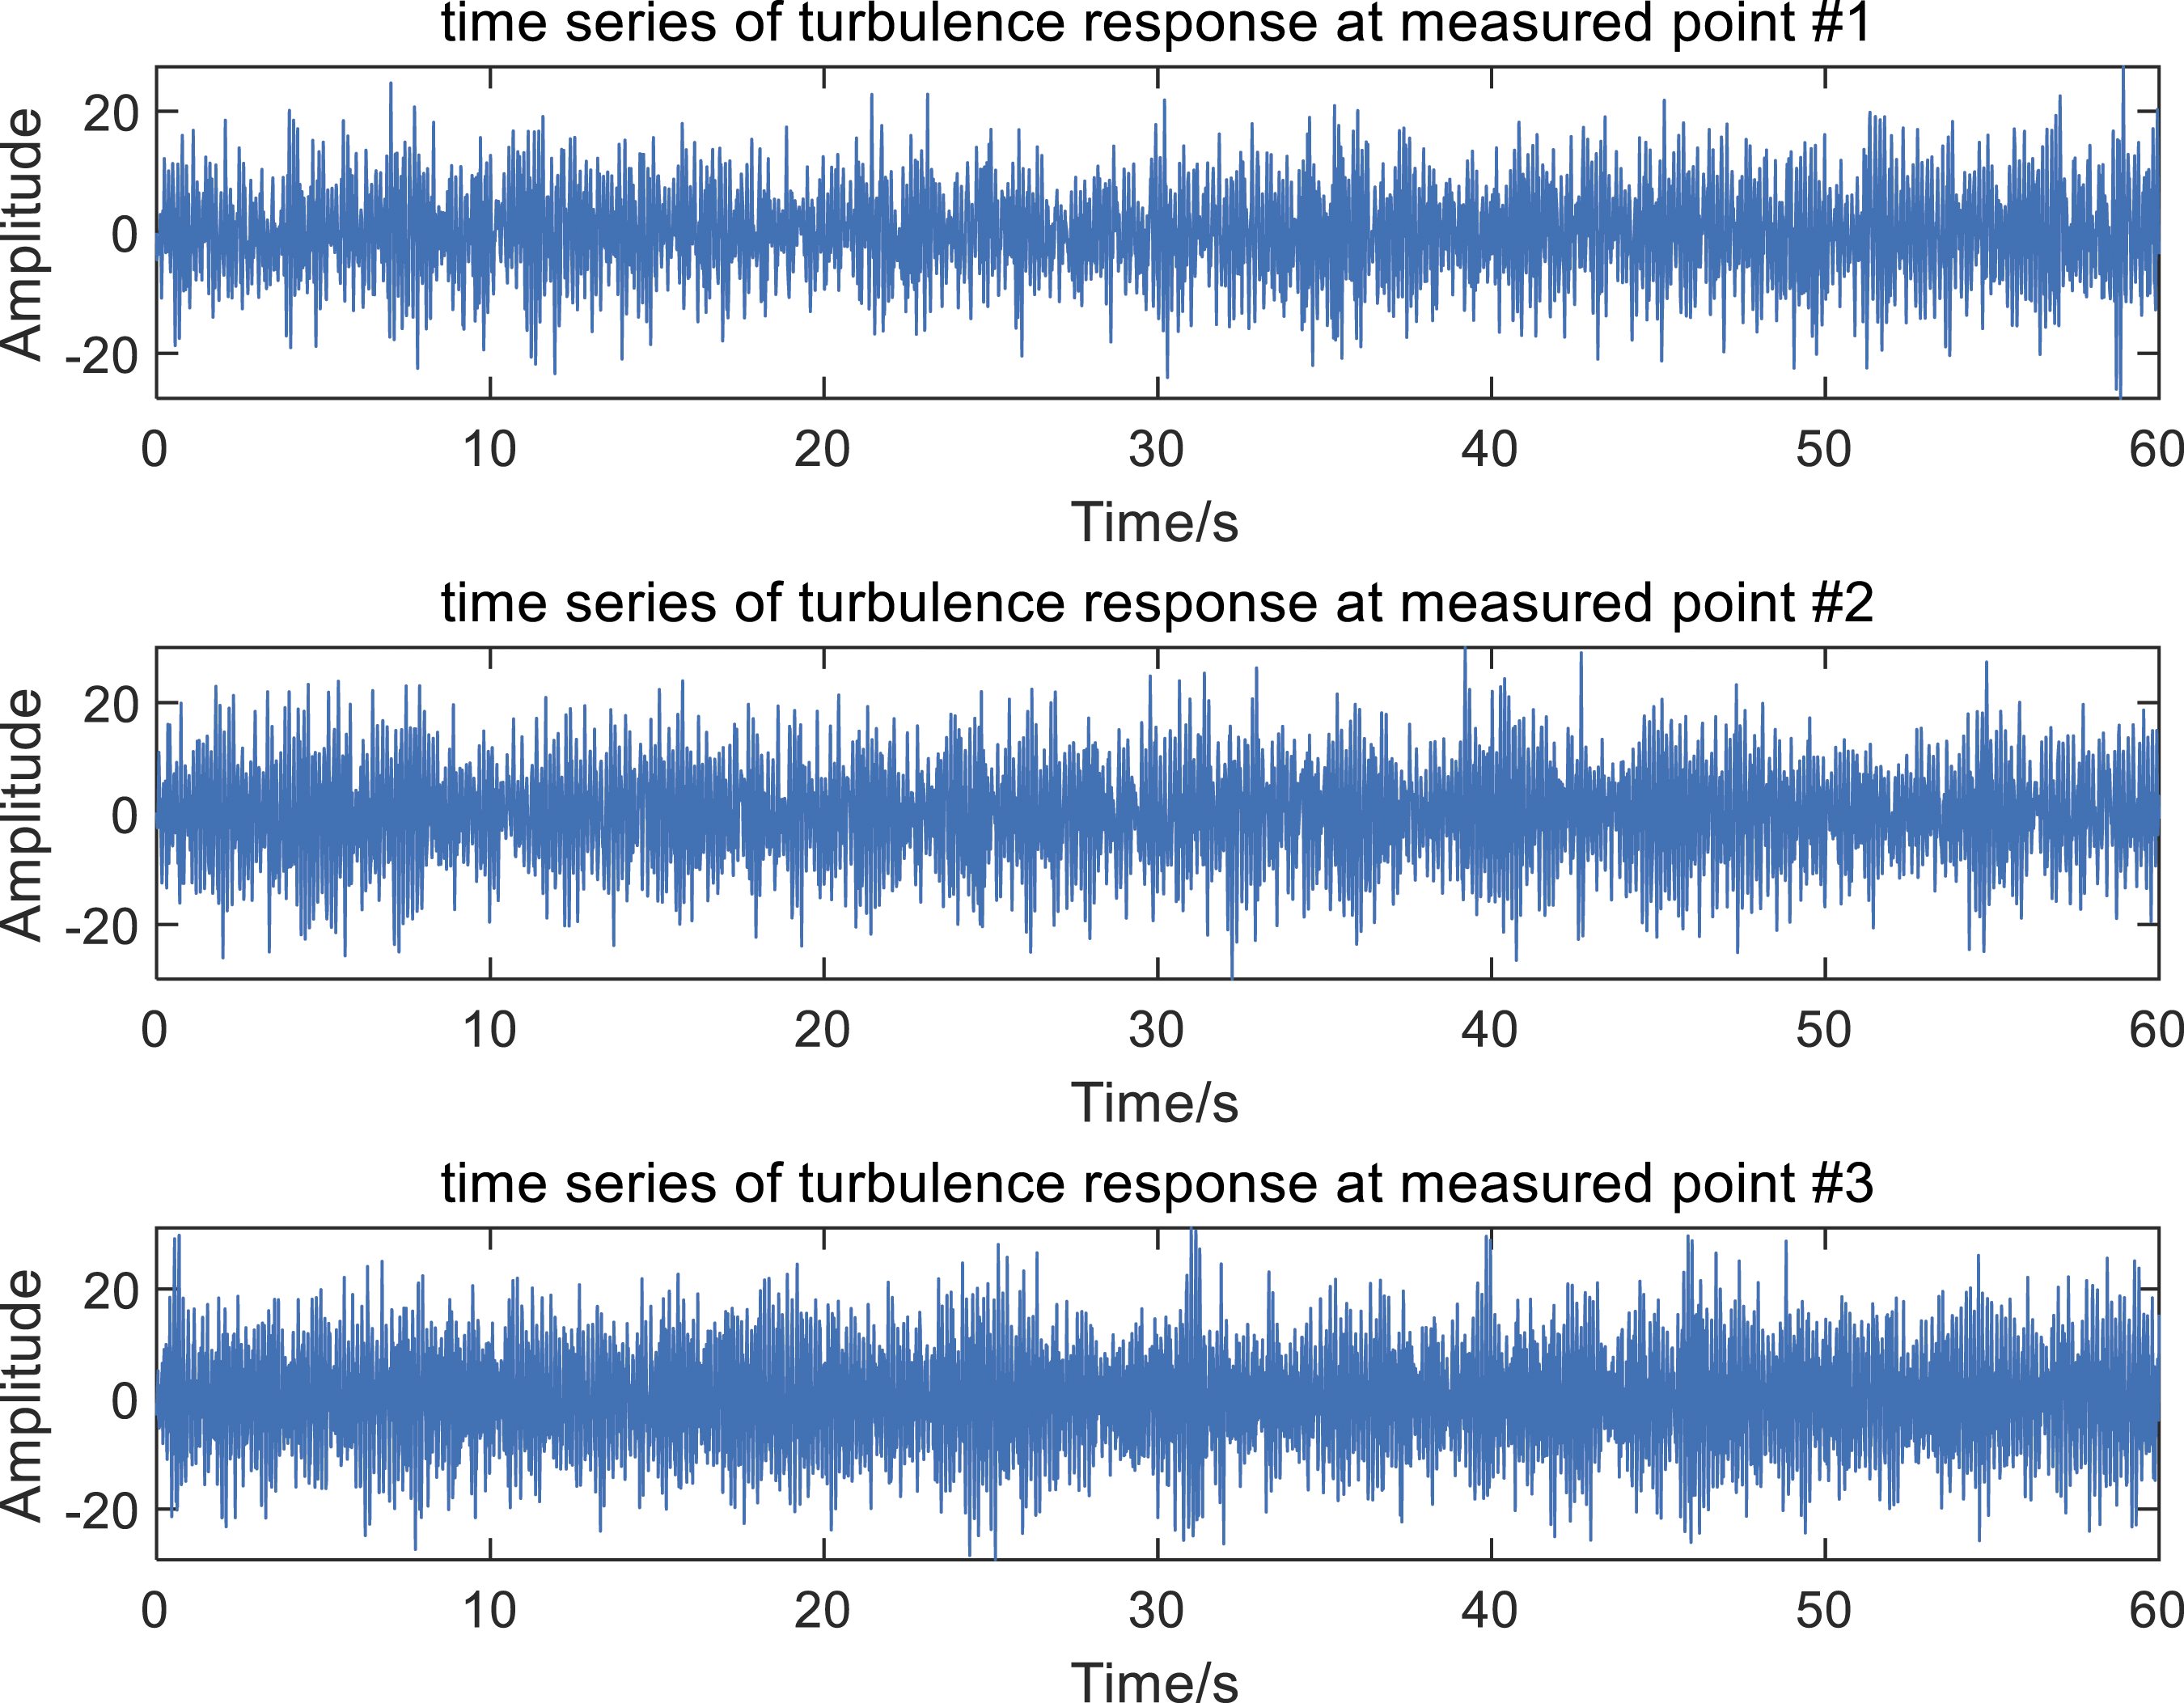
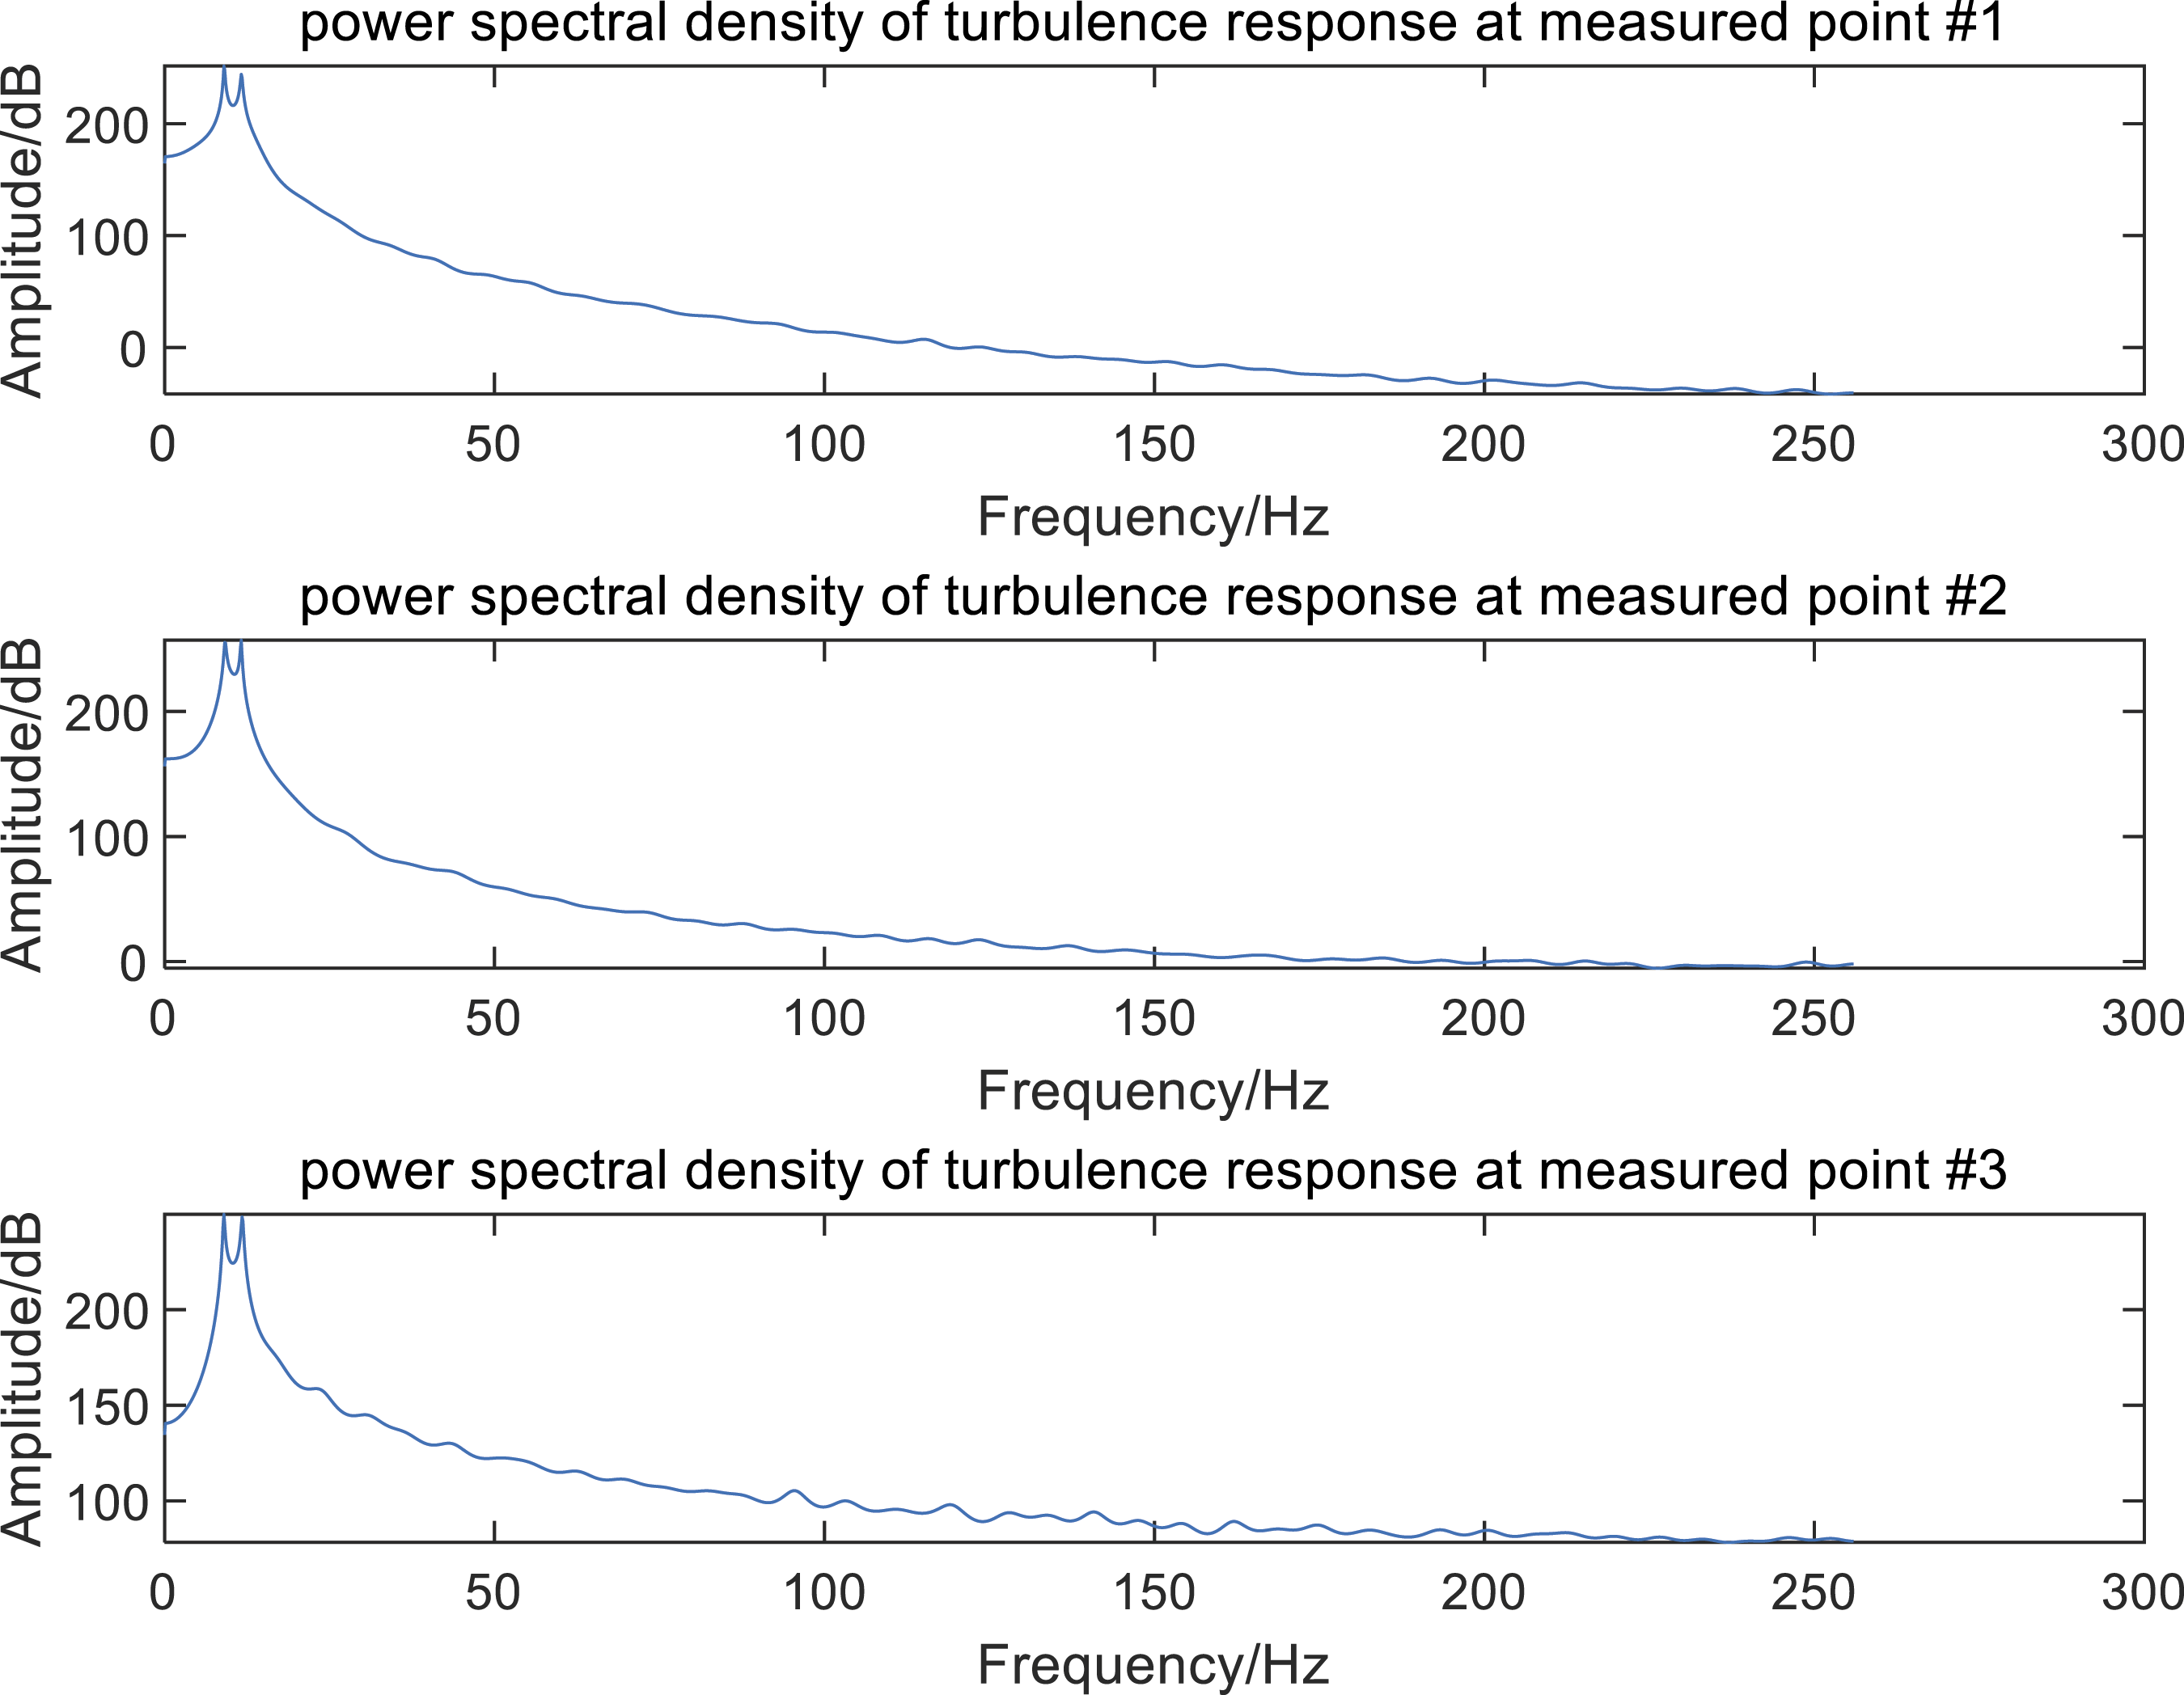
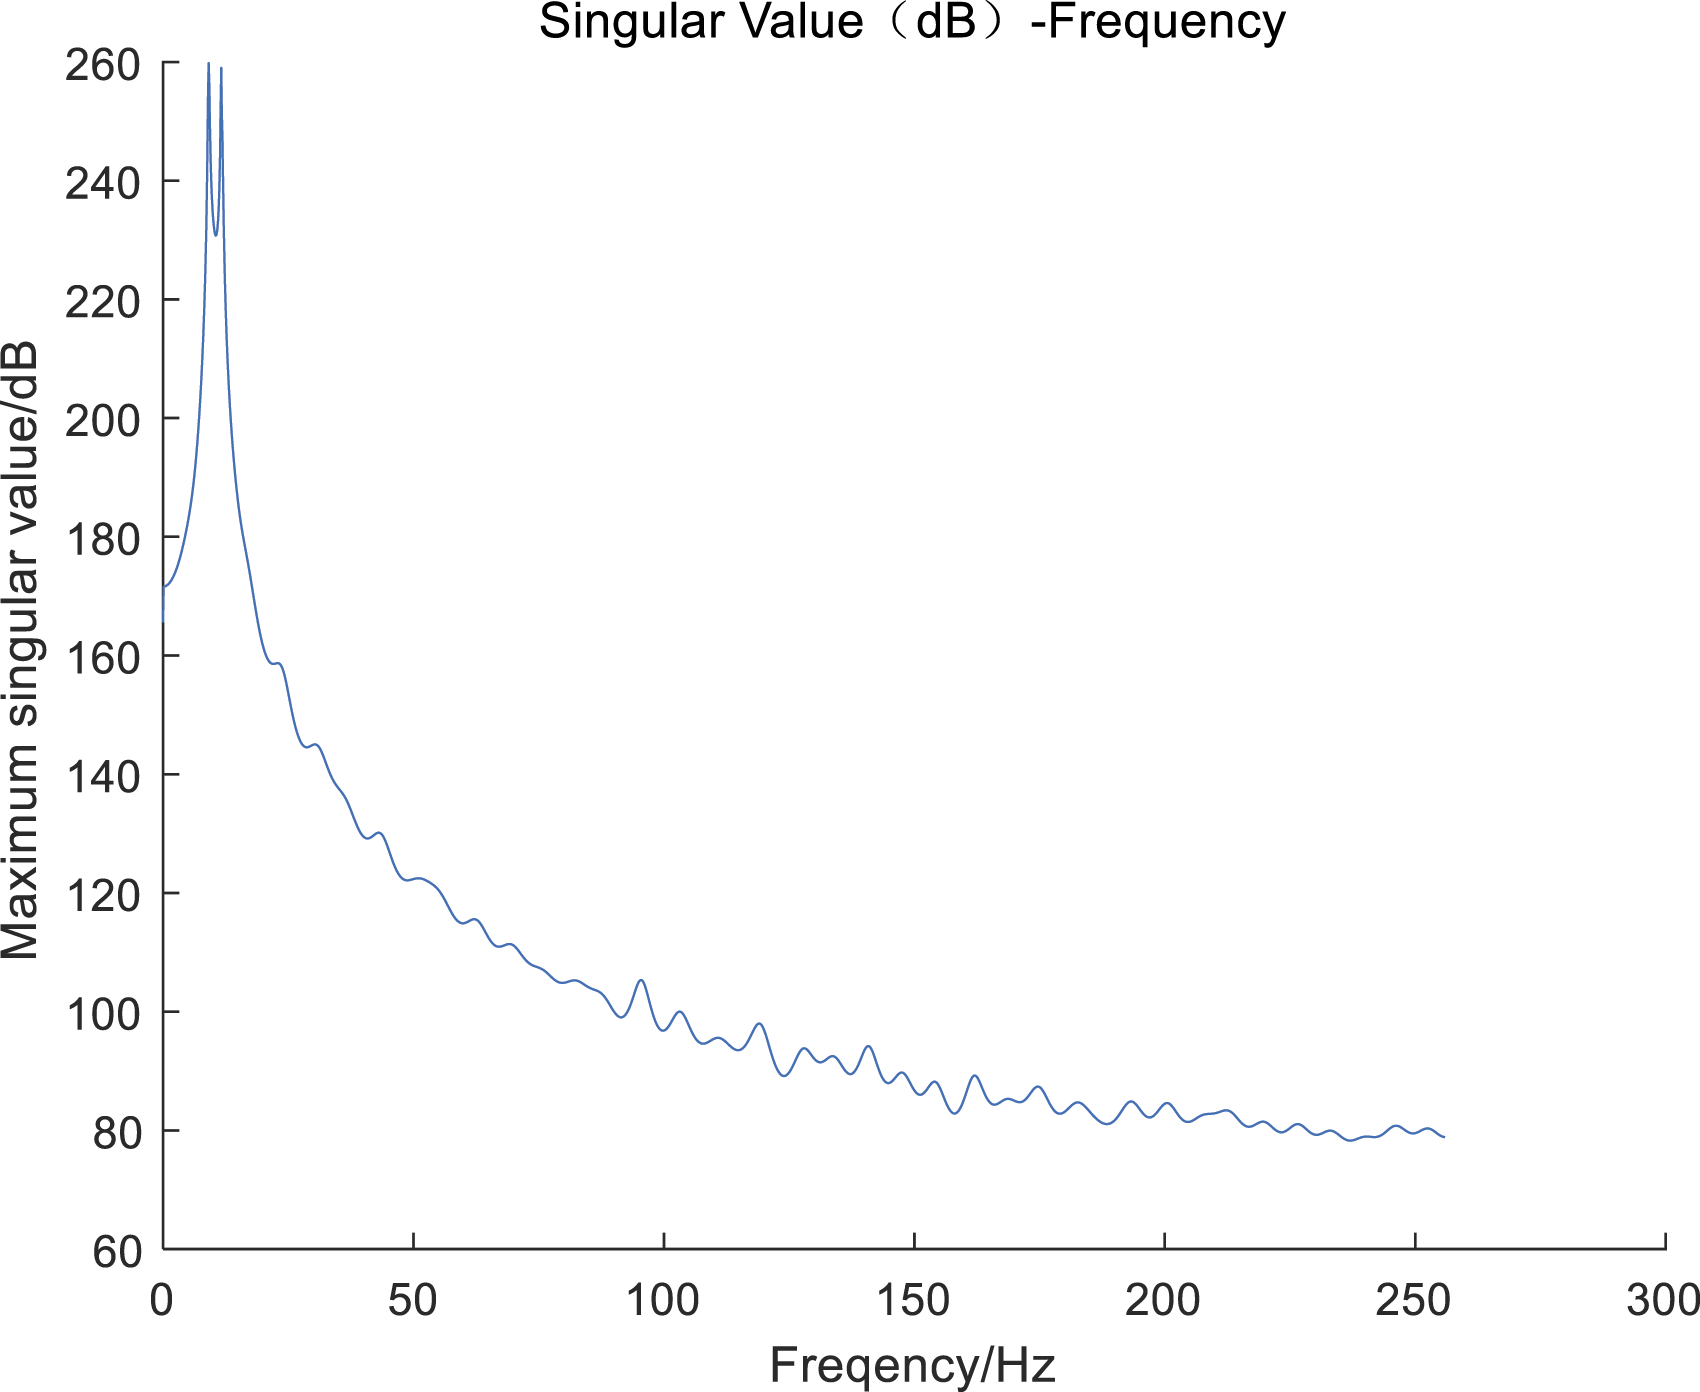
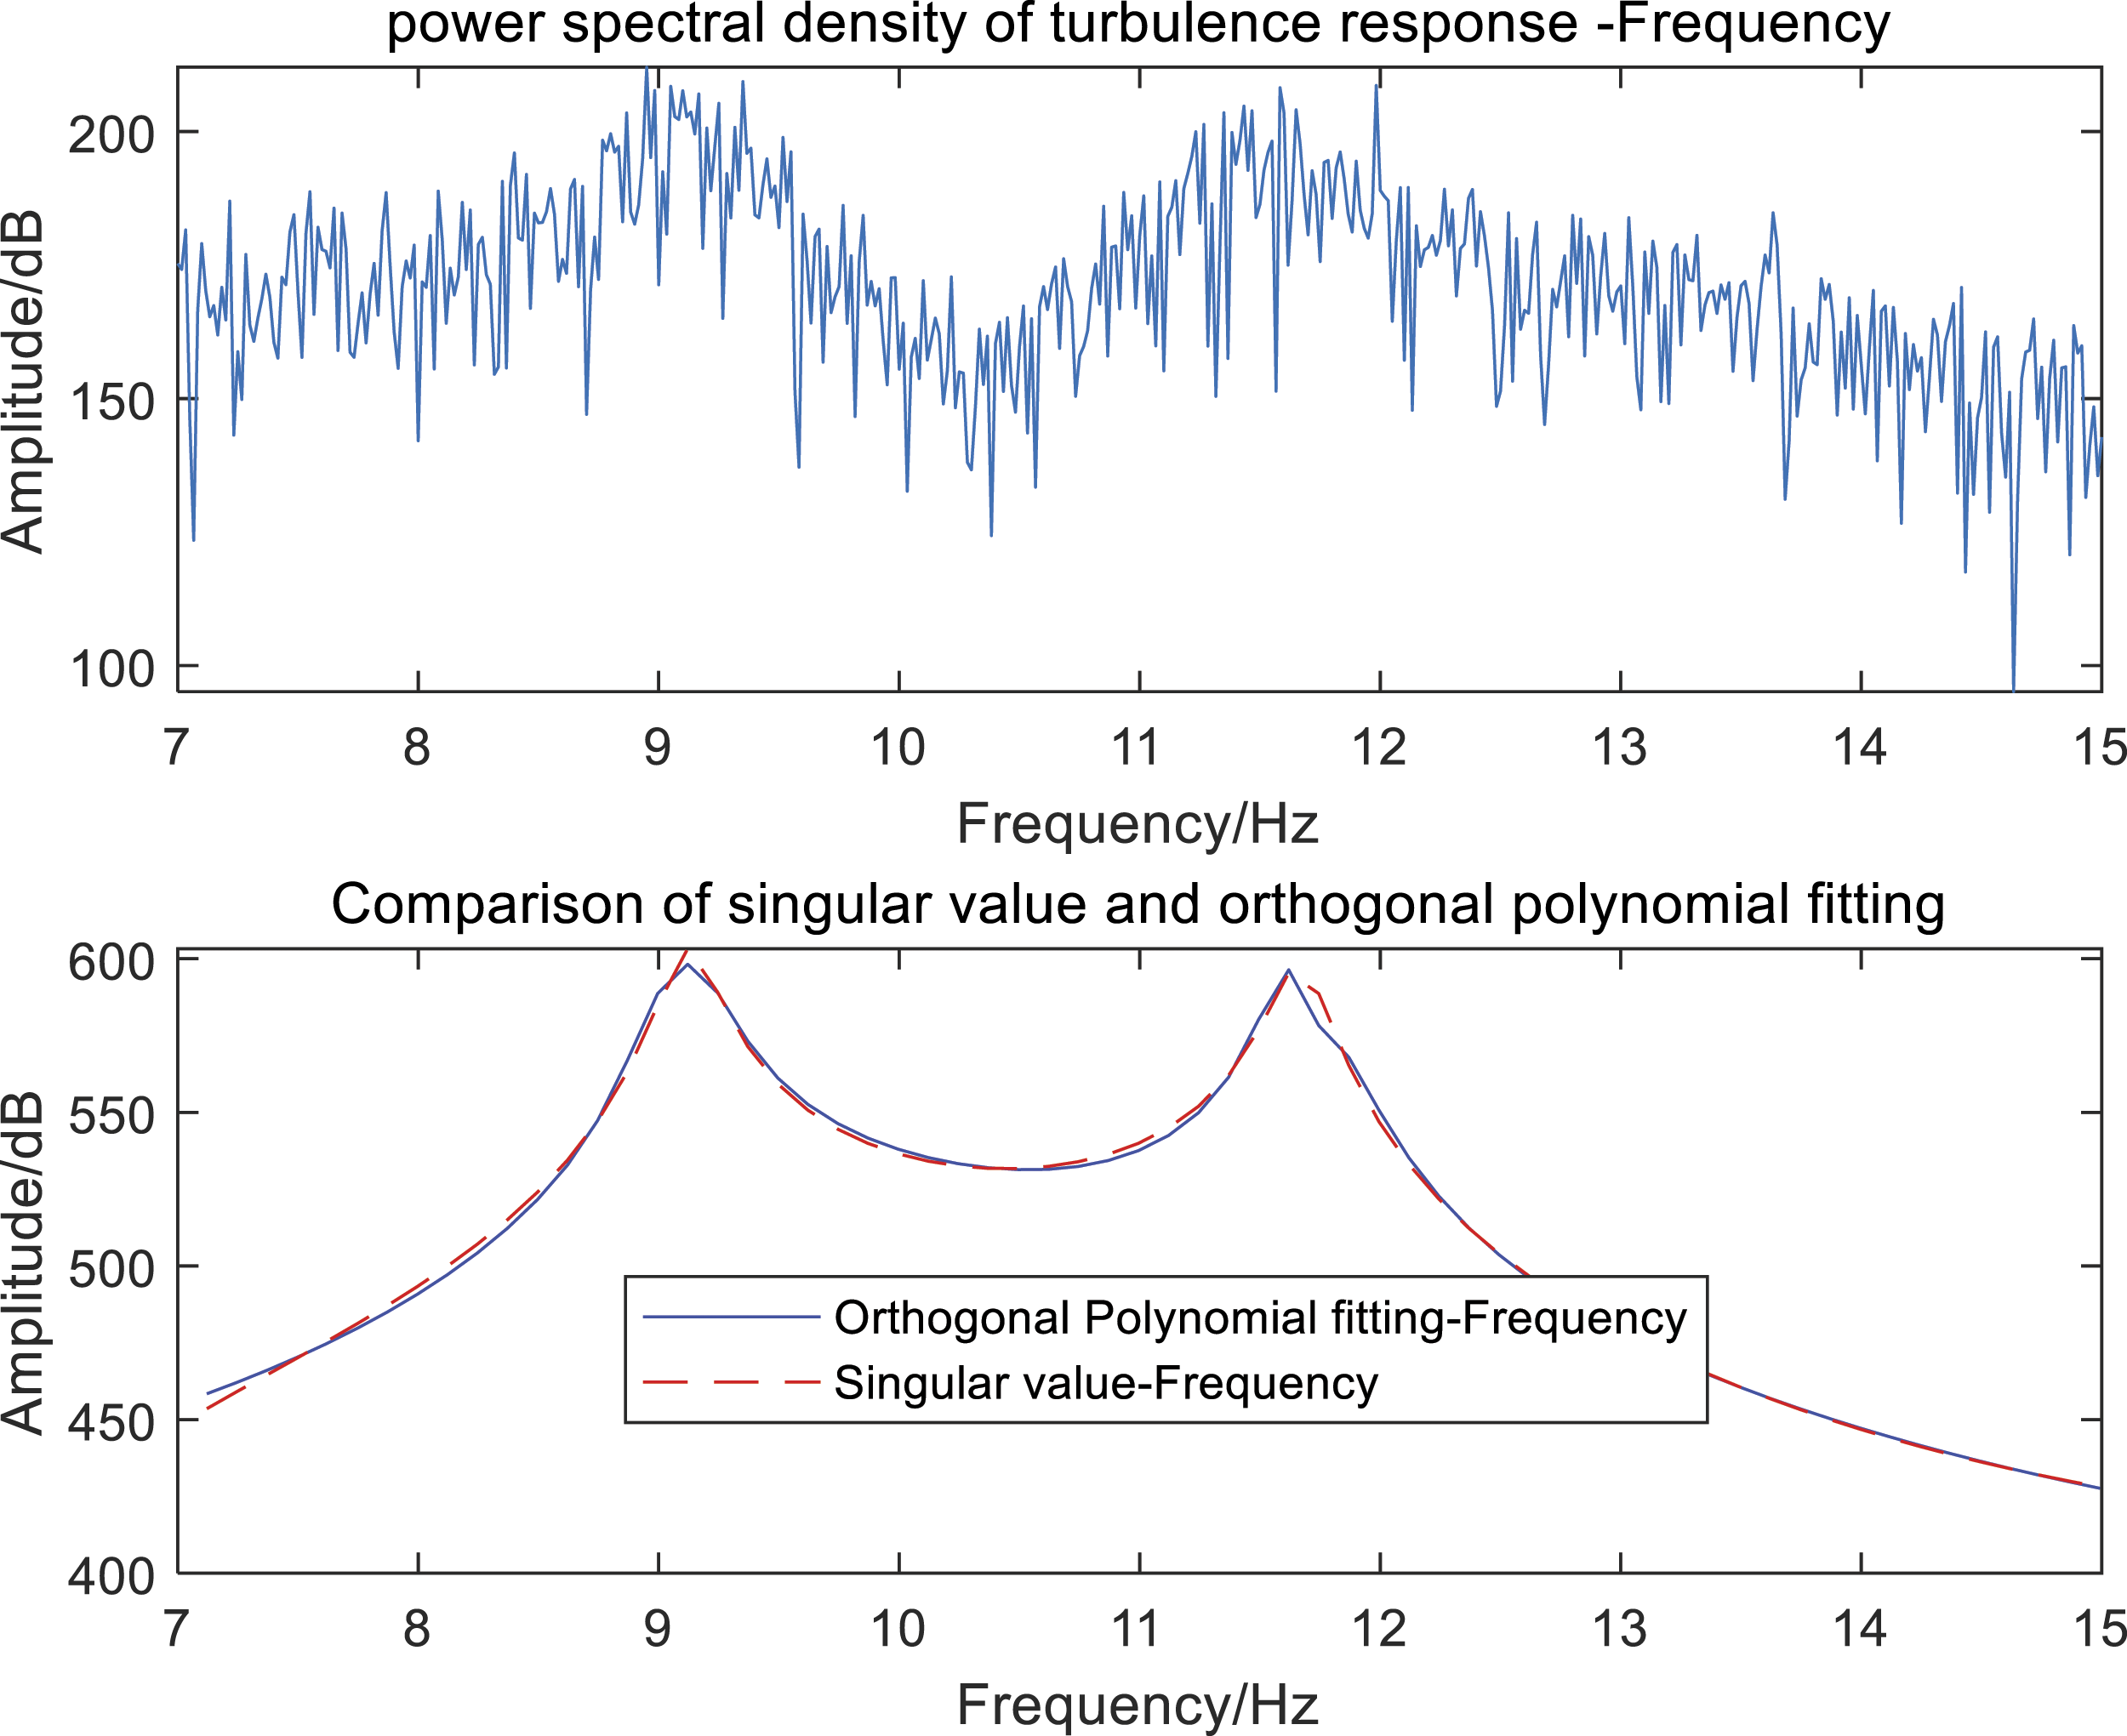
Because the flutter is due to second-order modal coupling, the second-order modal frequencies of simulation signal #2 were set to 9.2 and 11.53 Hz, corresponding to modal damping values of 0.0315 and 0.02814, respectively. Figure 9 shows the time series waveform of simulation signal #2, and Figure 10 shows the PSD function of the corresponding turbulence response signal. Figure 11 presents the maximum singular value curve of the multi-channel turbulence response signal corresponding to the PSD function matrix. Figure 12 shows the PSD function of the turbulence response signal calculated using the FFT method (top), and the blue and red dotted curves in Figure 12 (bottom) represent the maximum singular value curve of the analysis frequency band and the multi-modal frequency domain fitting of the modal parameter estimation results, respectively. Time series of the three channels’ turbulence responses. PSD of the three channels’ turbulence responses based on the AR spectra. Singular value curve of the three-channel turbulence response. FFT of channel #2 (top) and model parameter estimation results (bottom).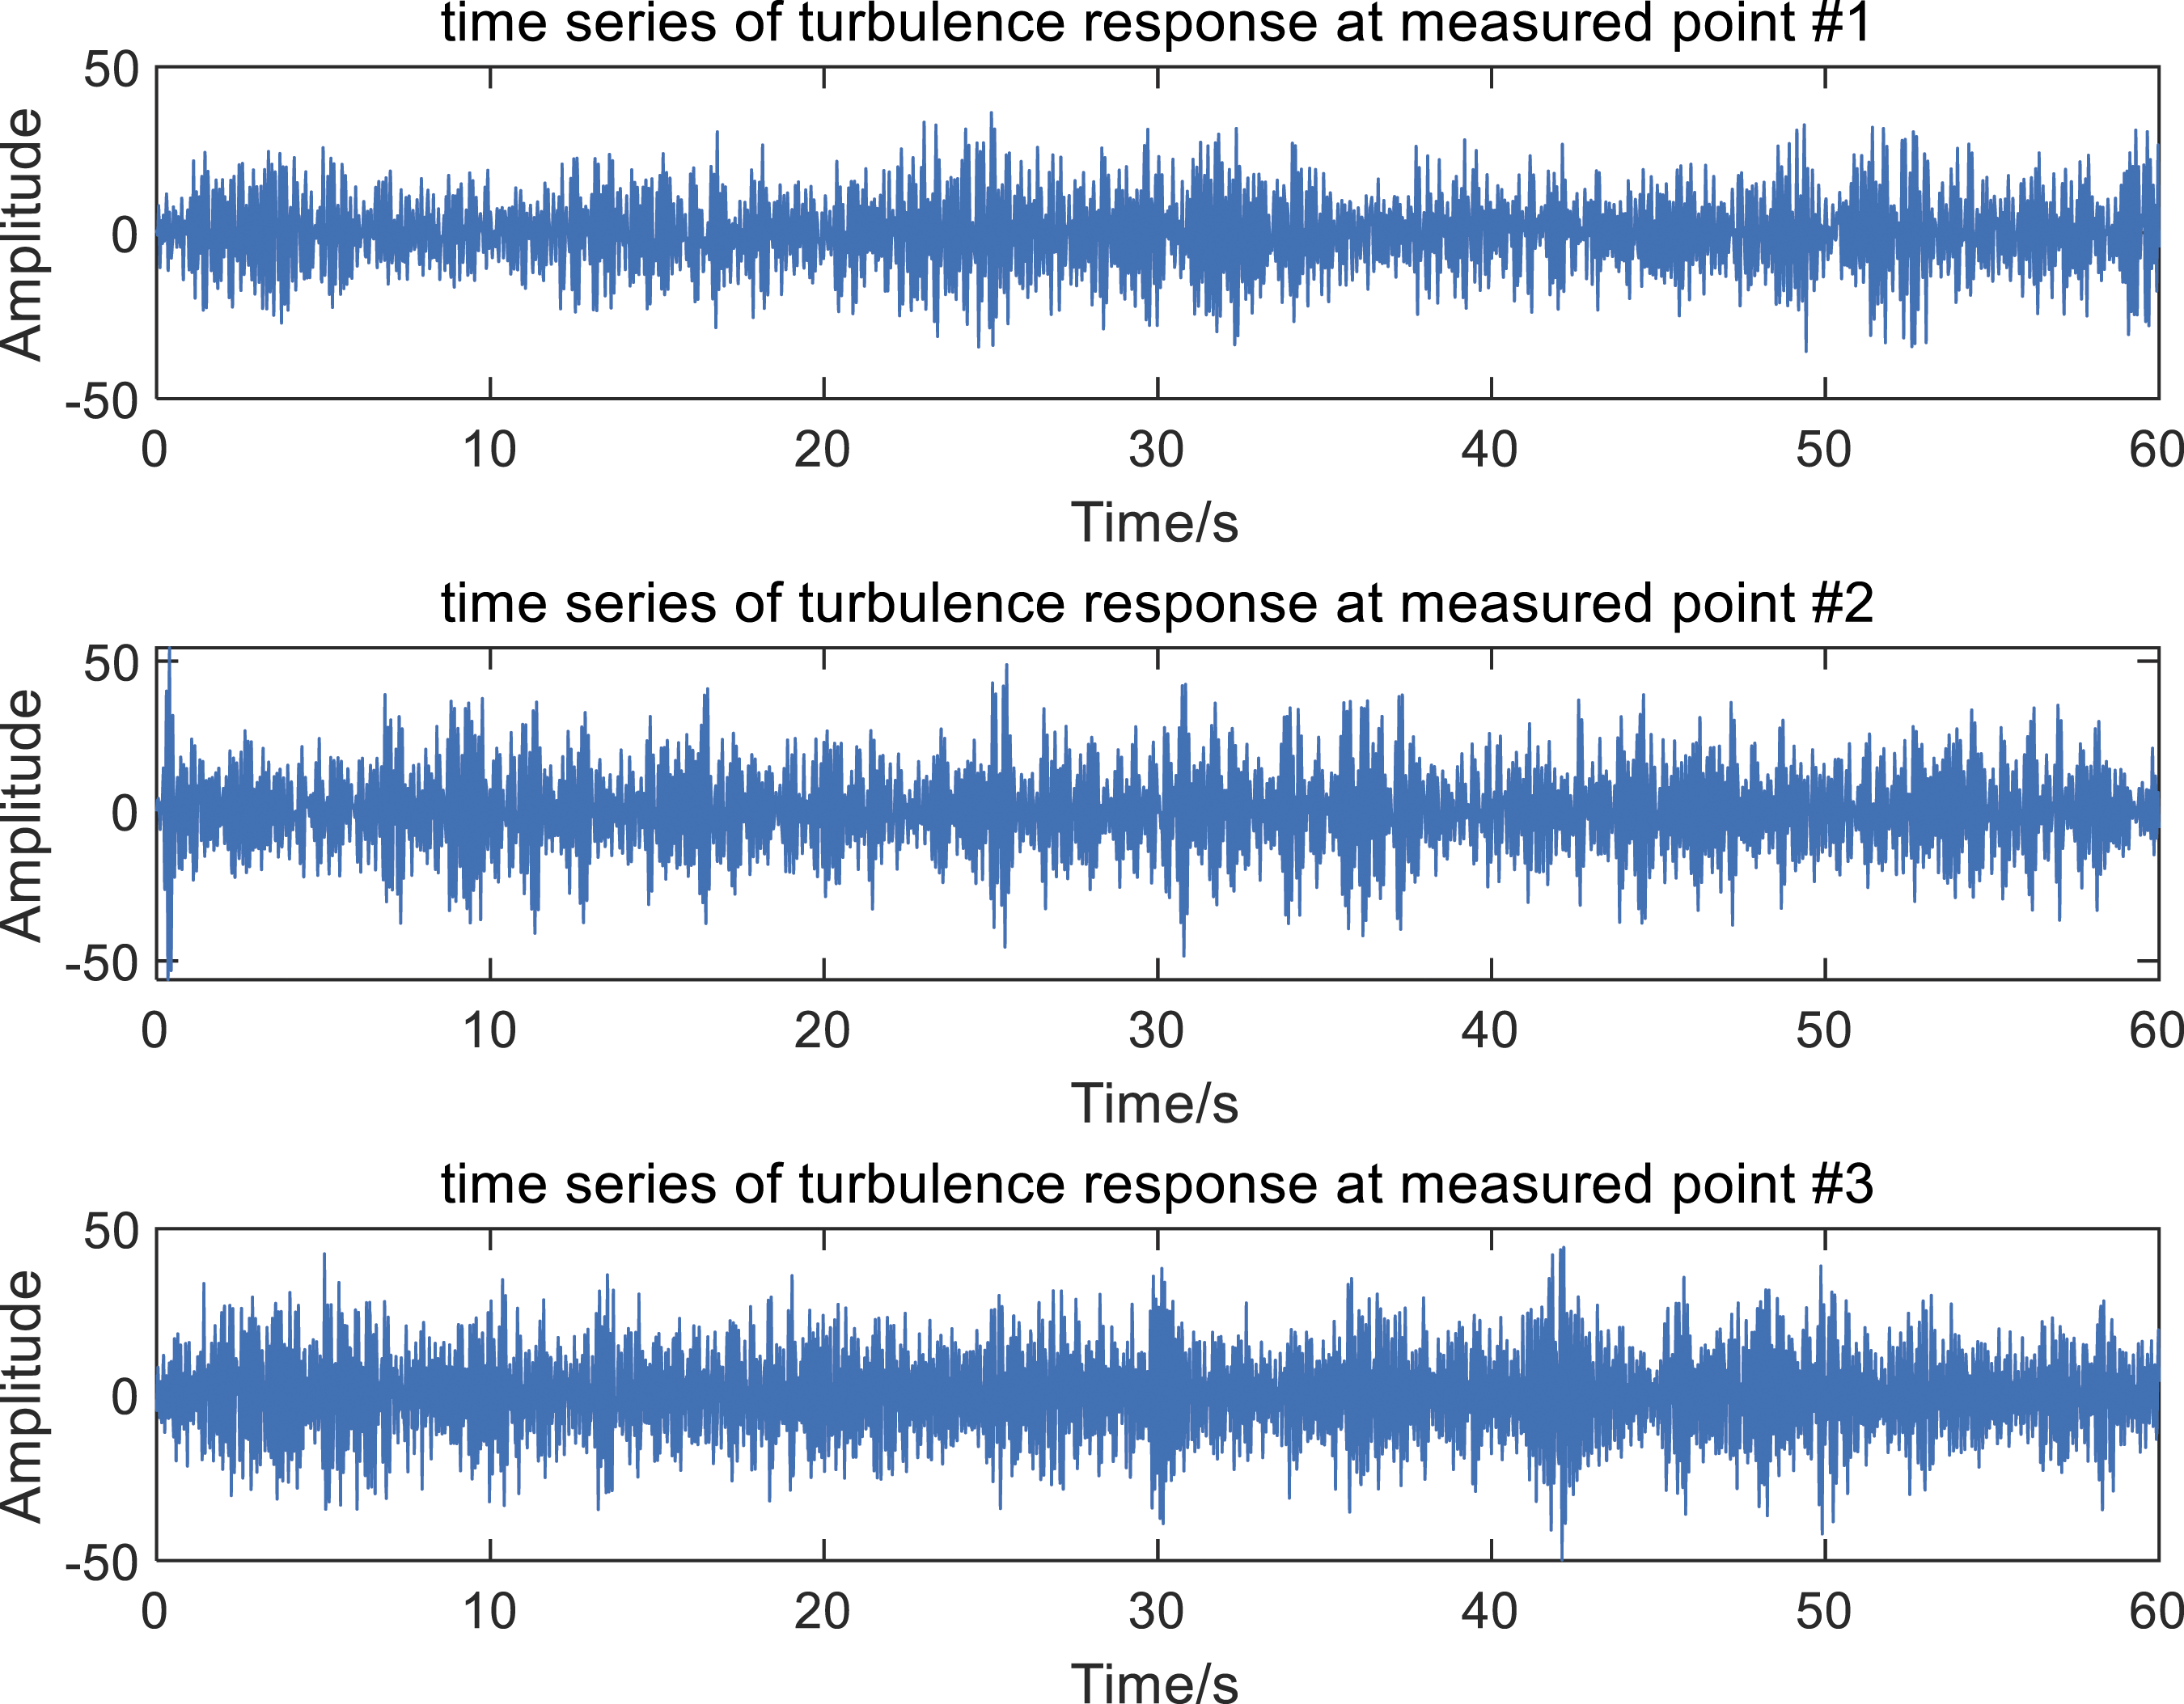
Simulation signal model parameter estimation results.
Flutter flight data verification
The flutter flight test turbulence response signal of a certain type of aircraft provided the engineering measurements that were used to verify the proposed method. The response signals from 12 channels of acceleration sensors arranged at different positions on the left and right wings served as the multi-channel turbulence response signals for analysis. Among them, two channels (CH1 and CH2) were selected to display the time series and PSD of the response signals. The PSD functions, which were calculated from the parametric AR spectral analysis, are shown in Figures 13 and 14 (bottom). Time series and PSD of CH1 turbulence response from the wing. Time series and PSD of CH2 turbulence response from the wing.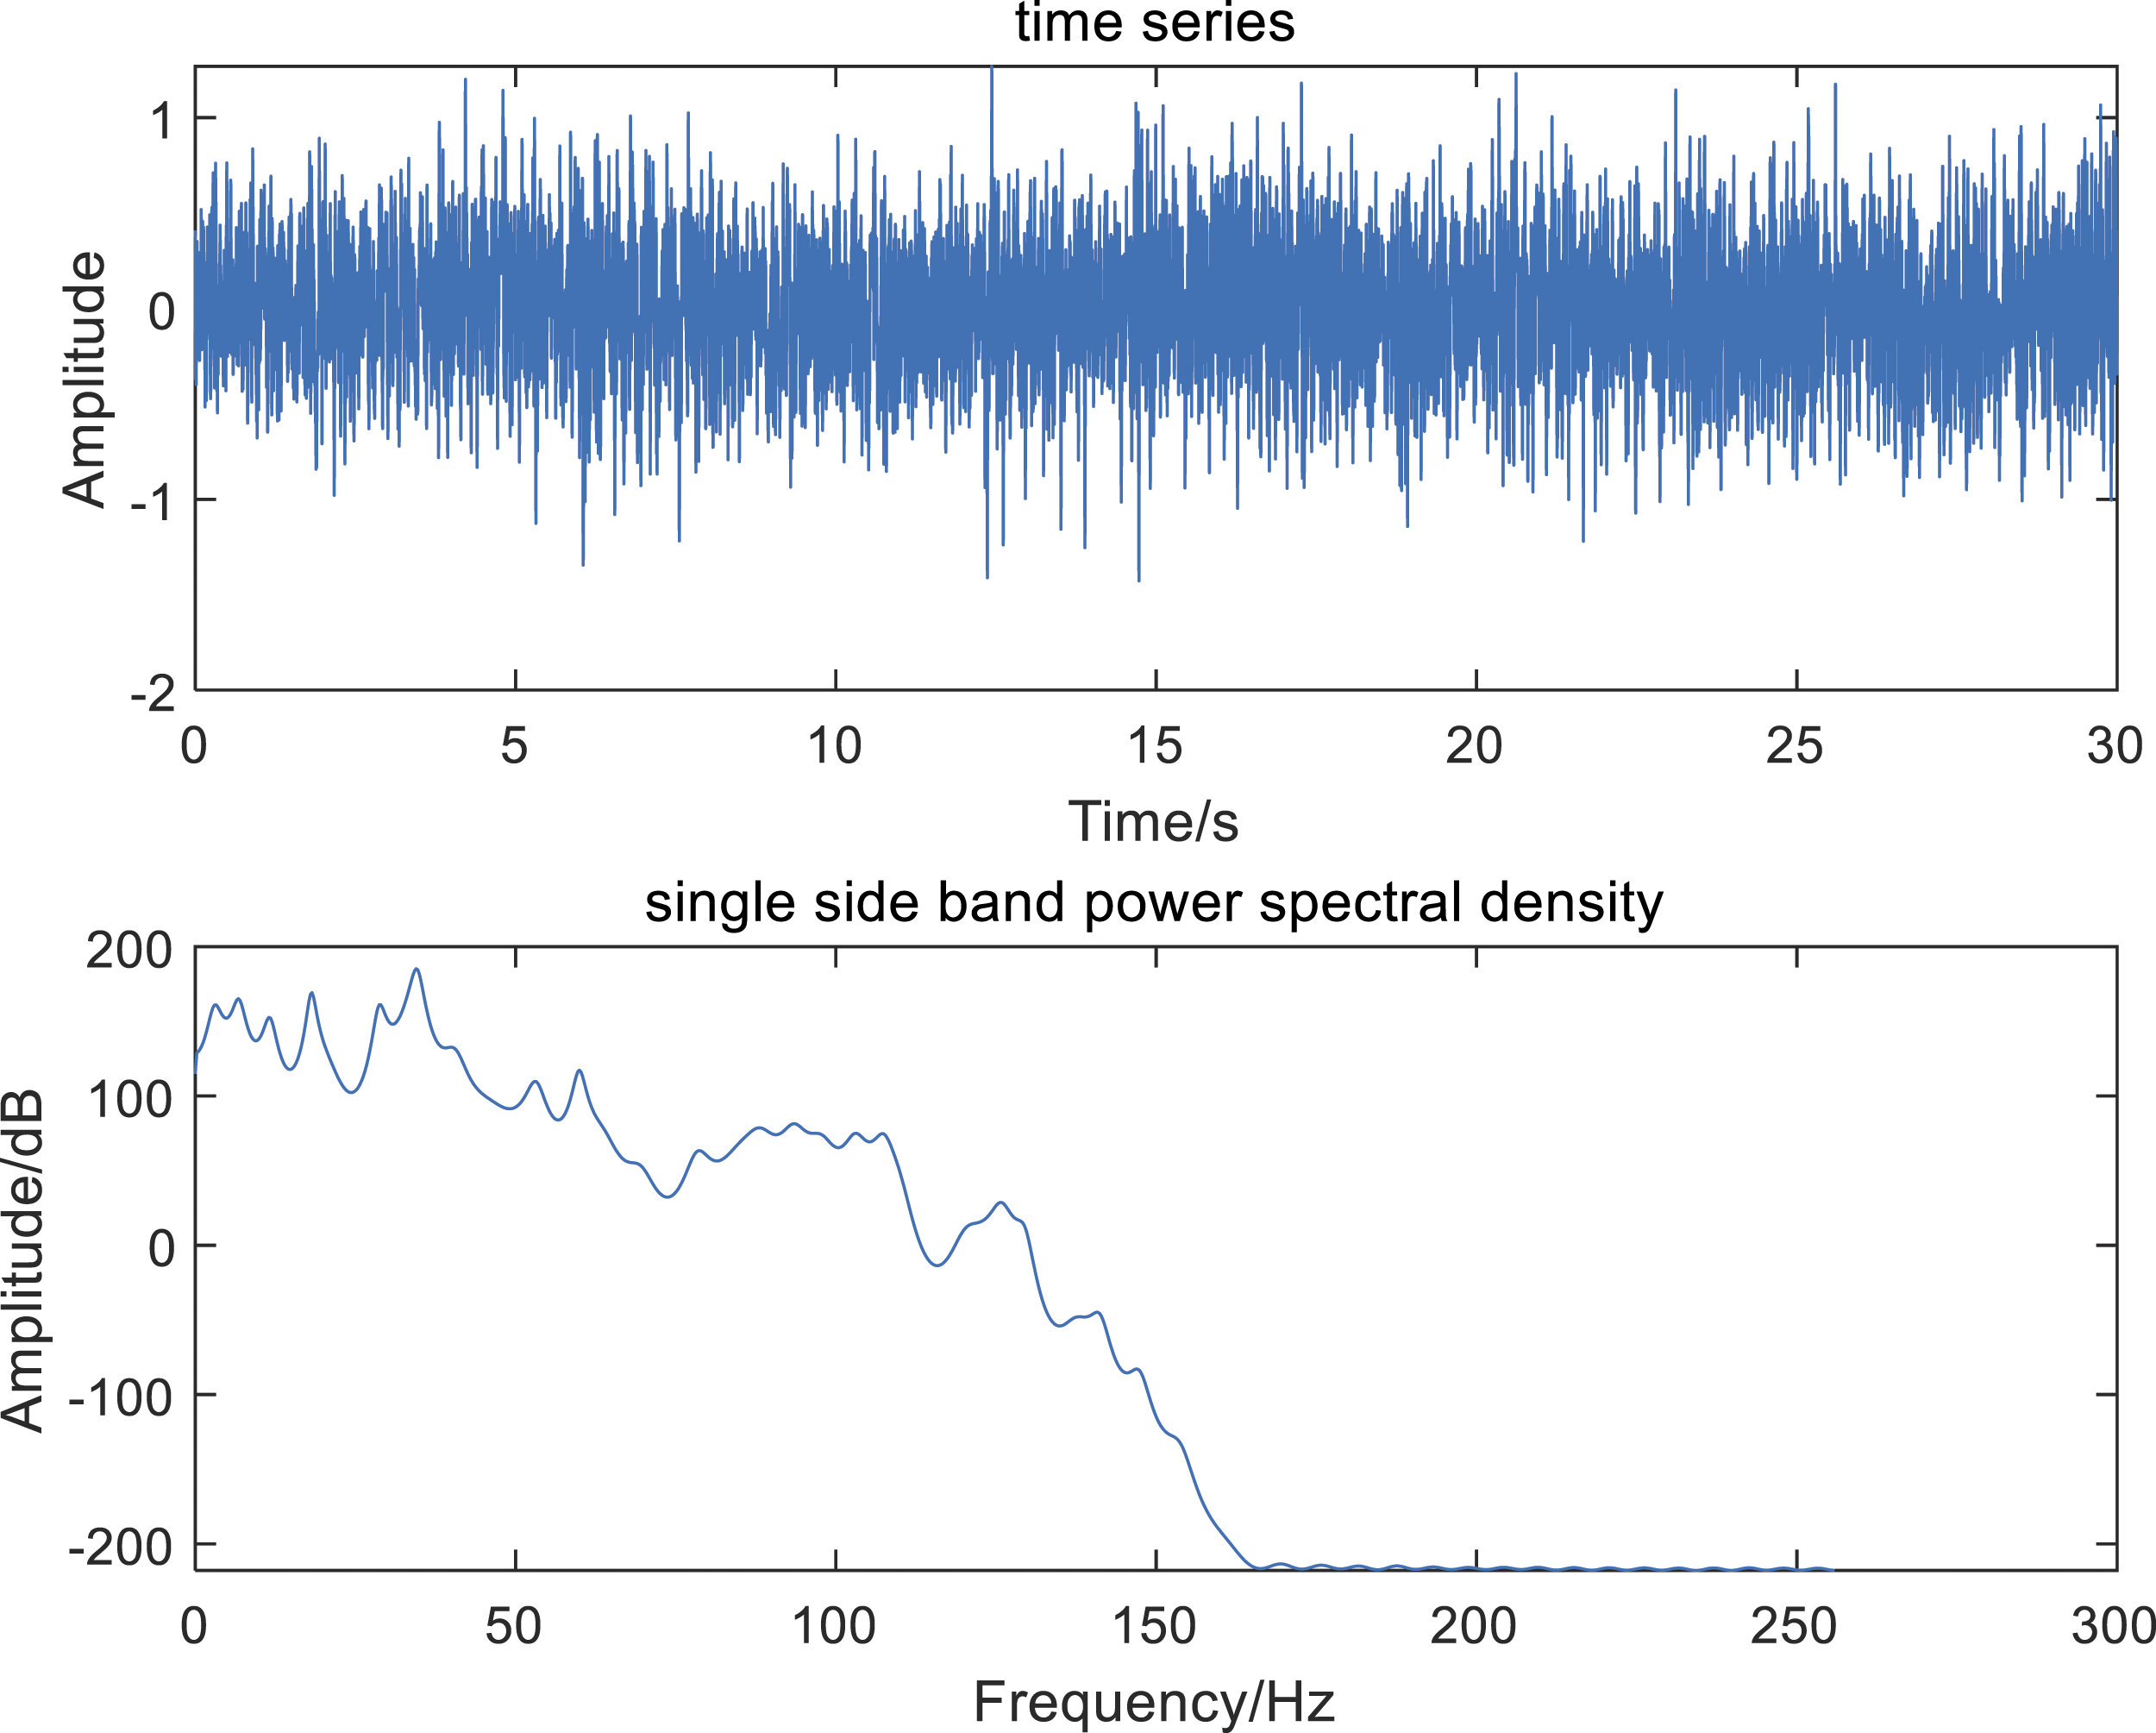
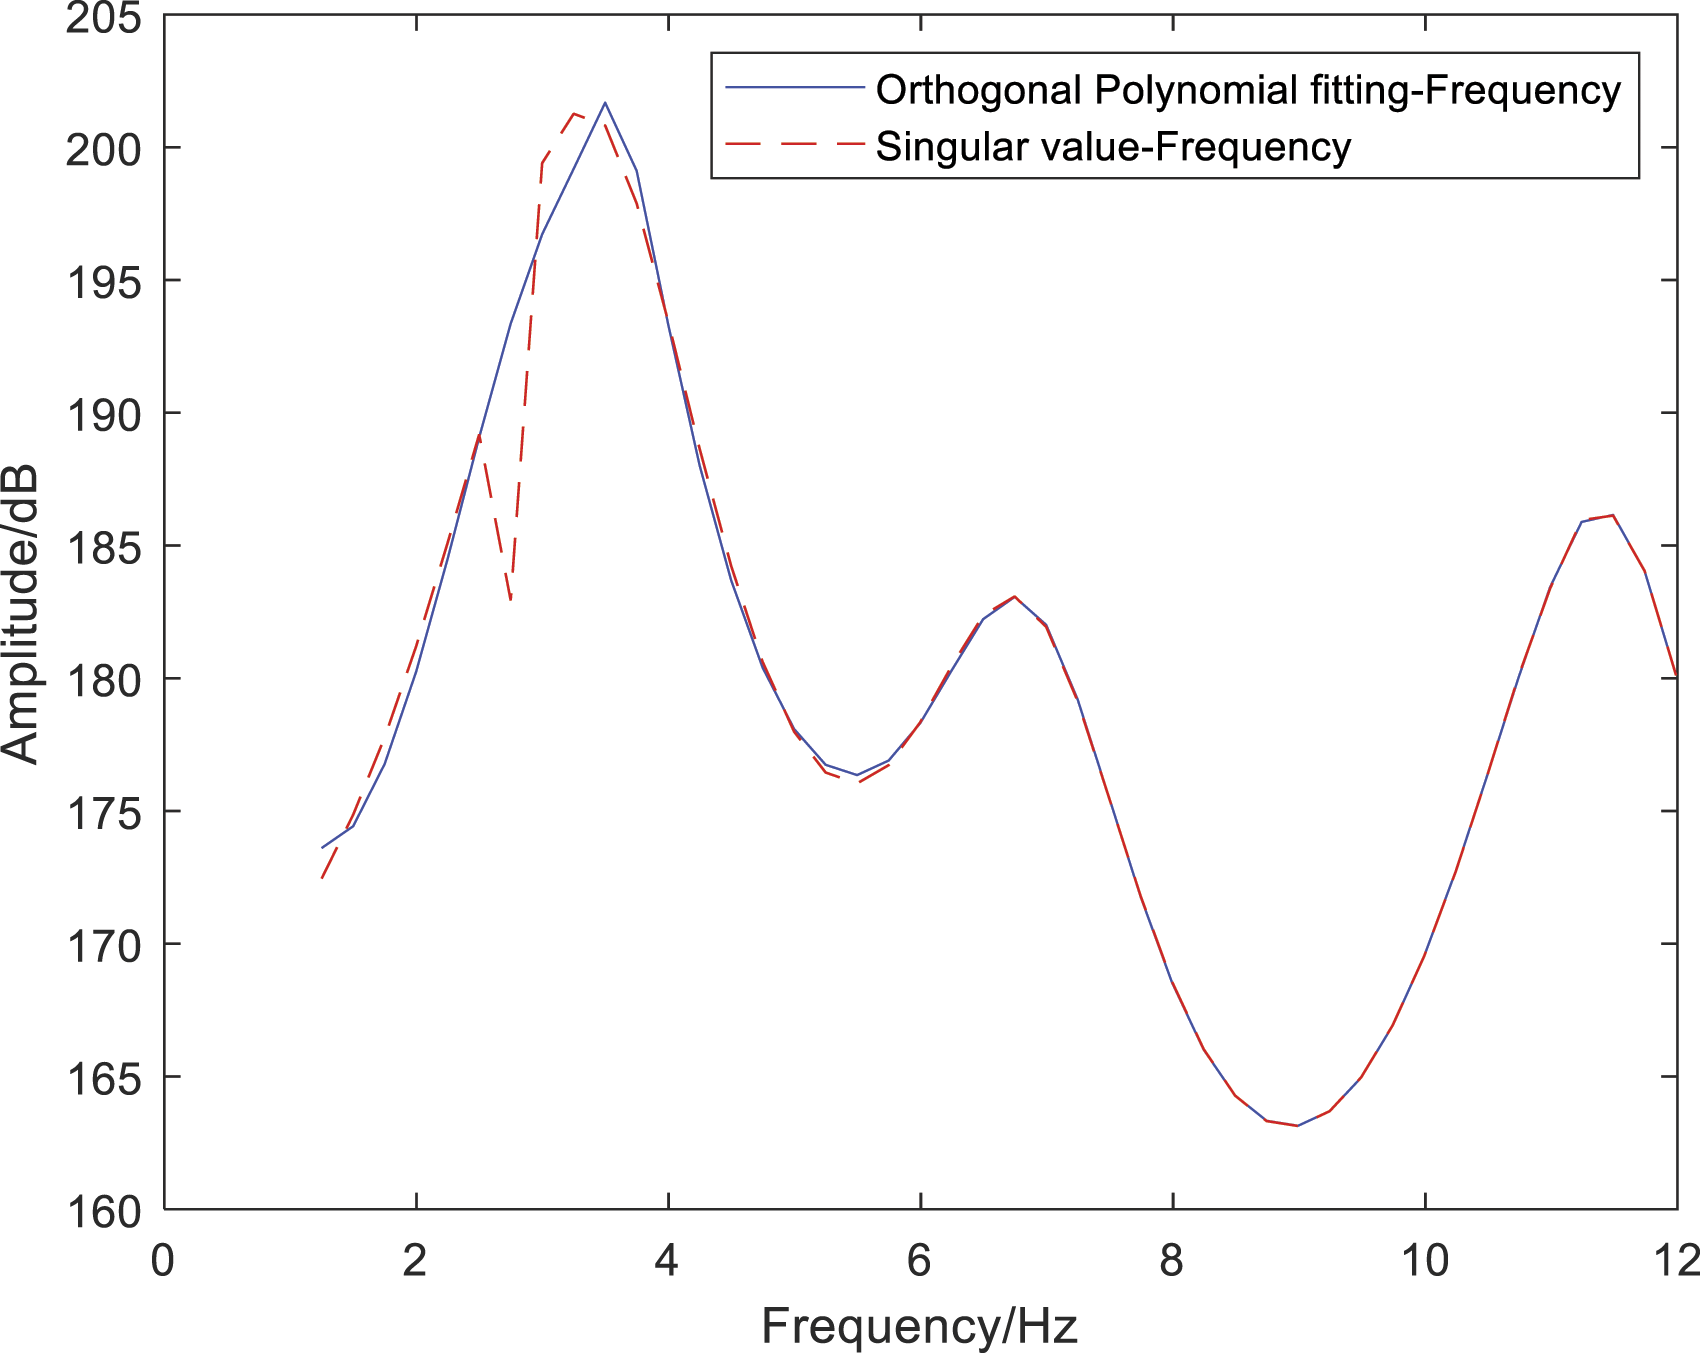
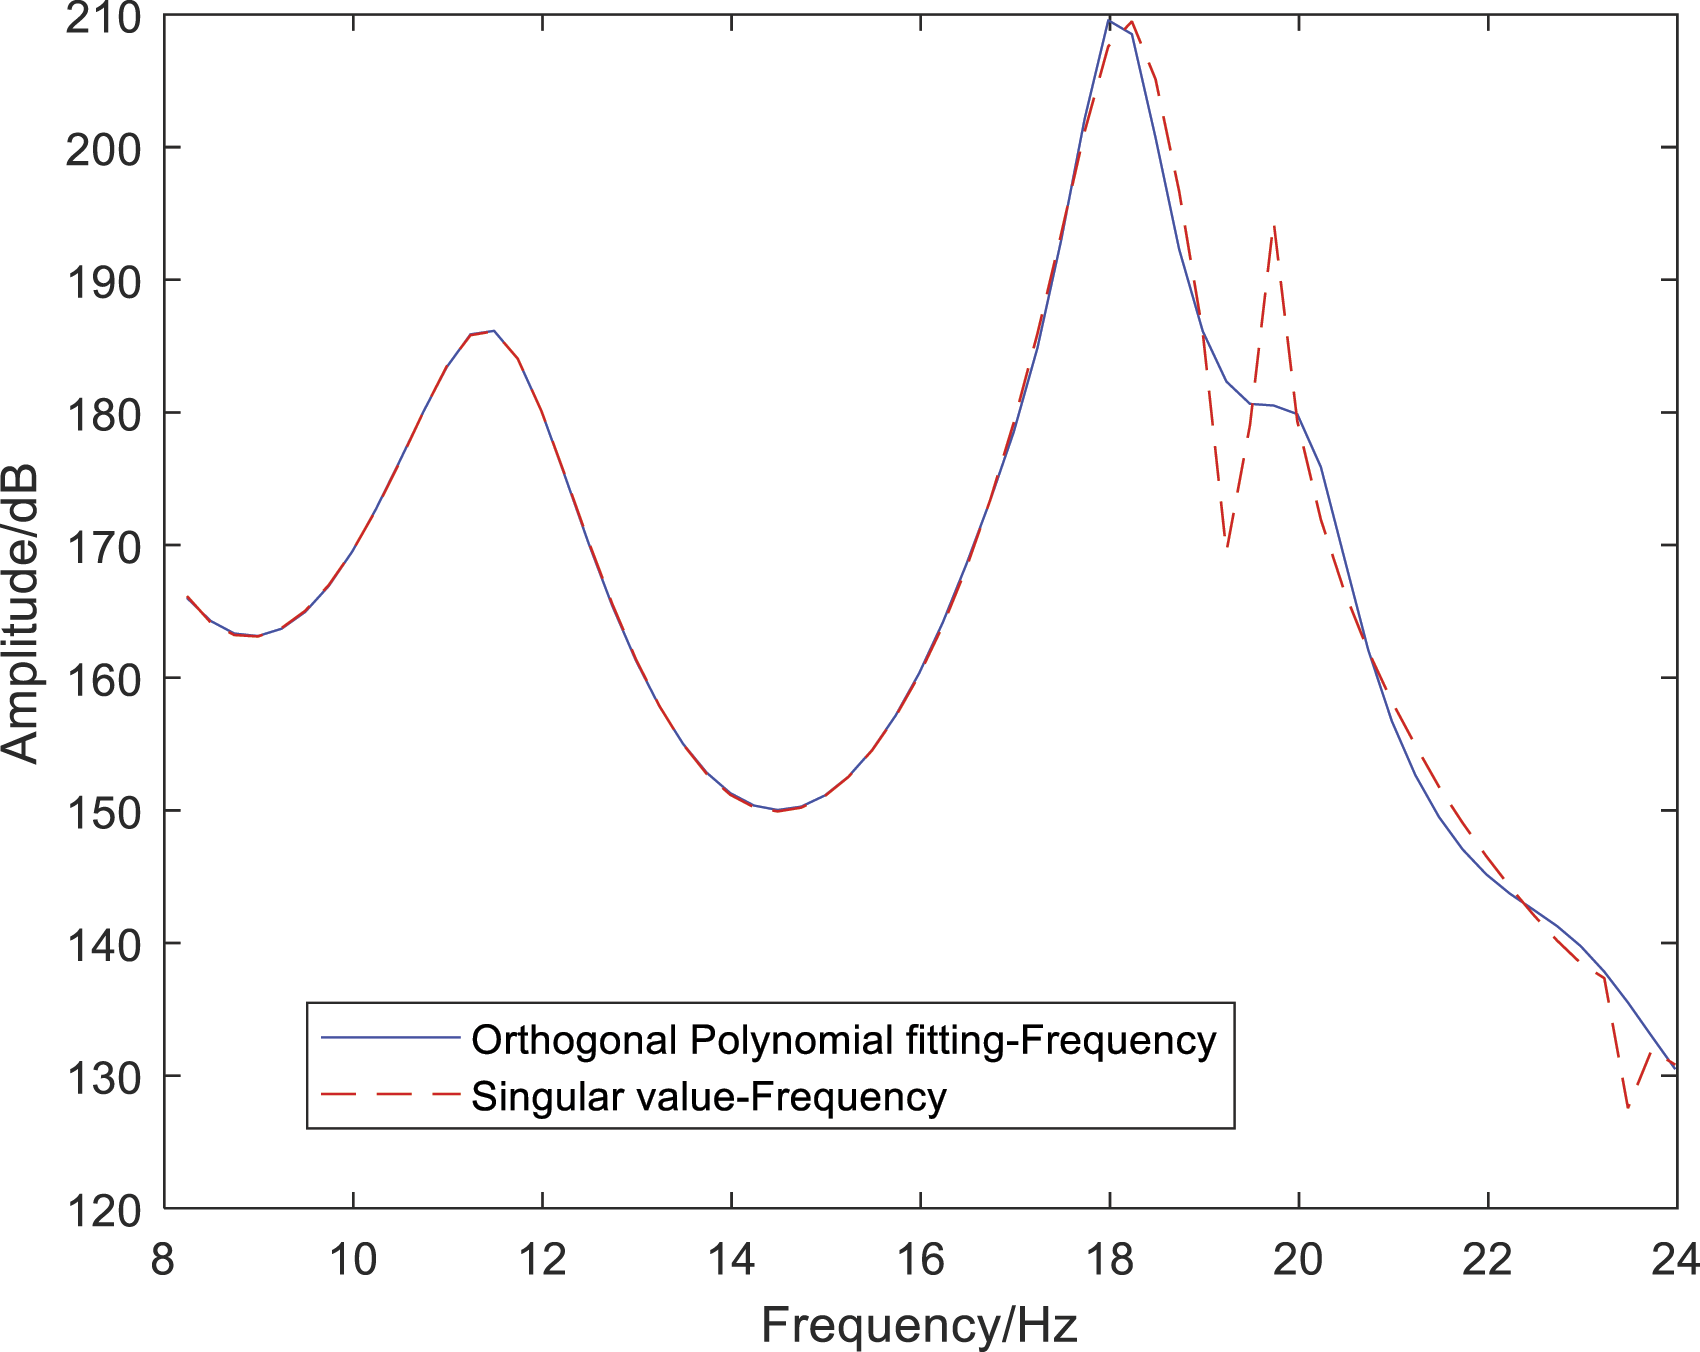
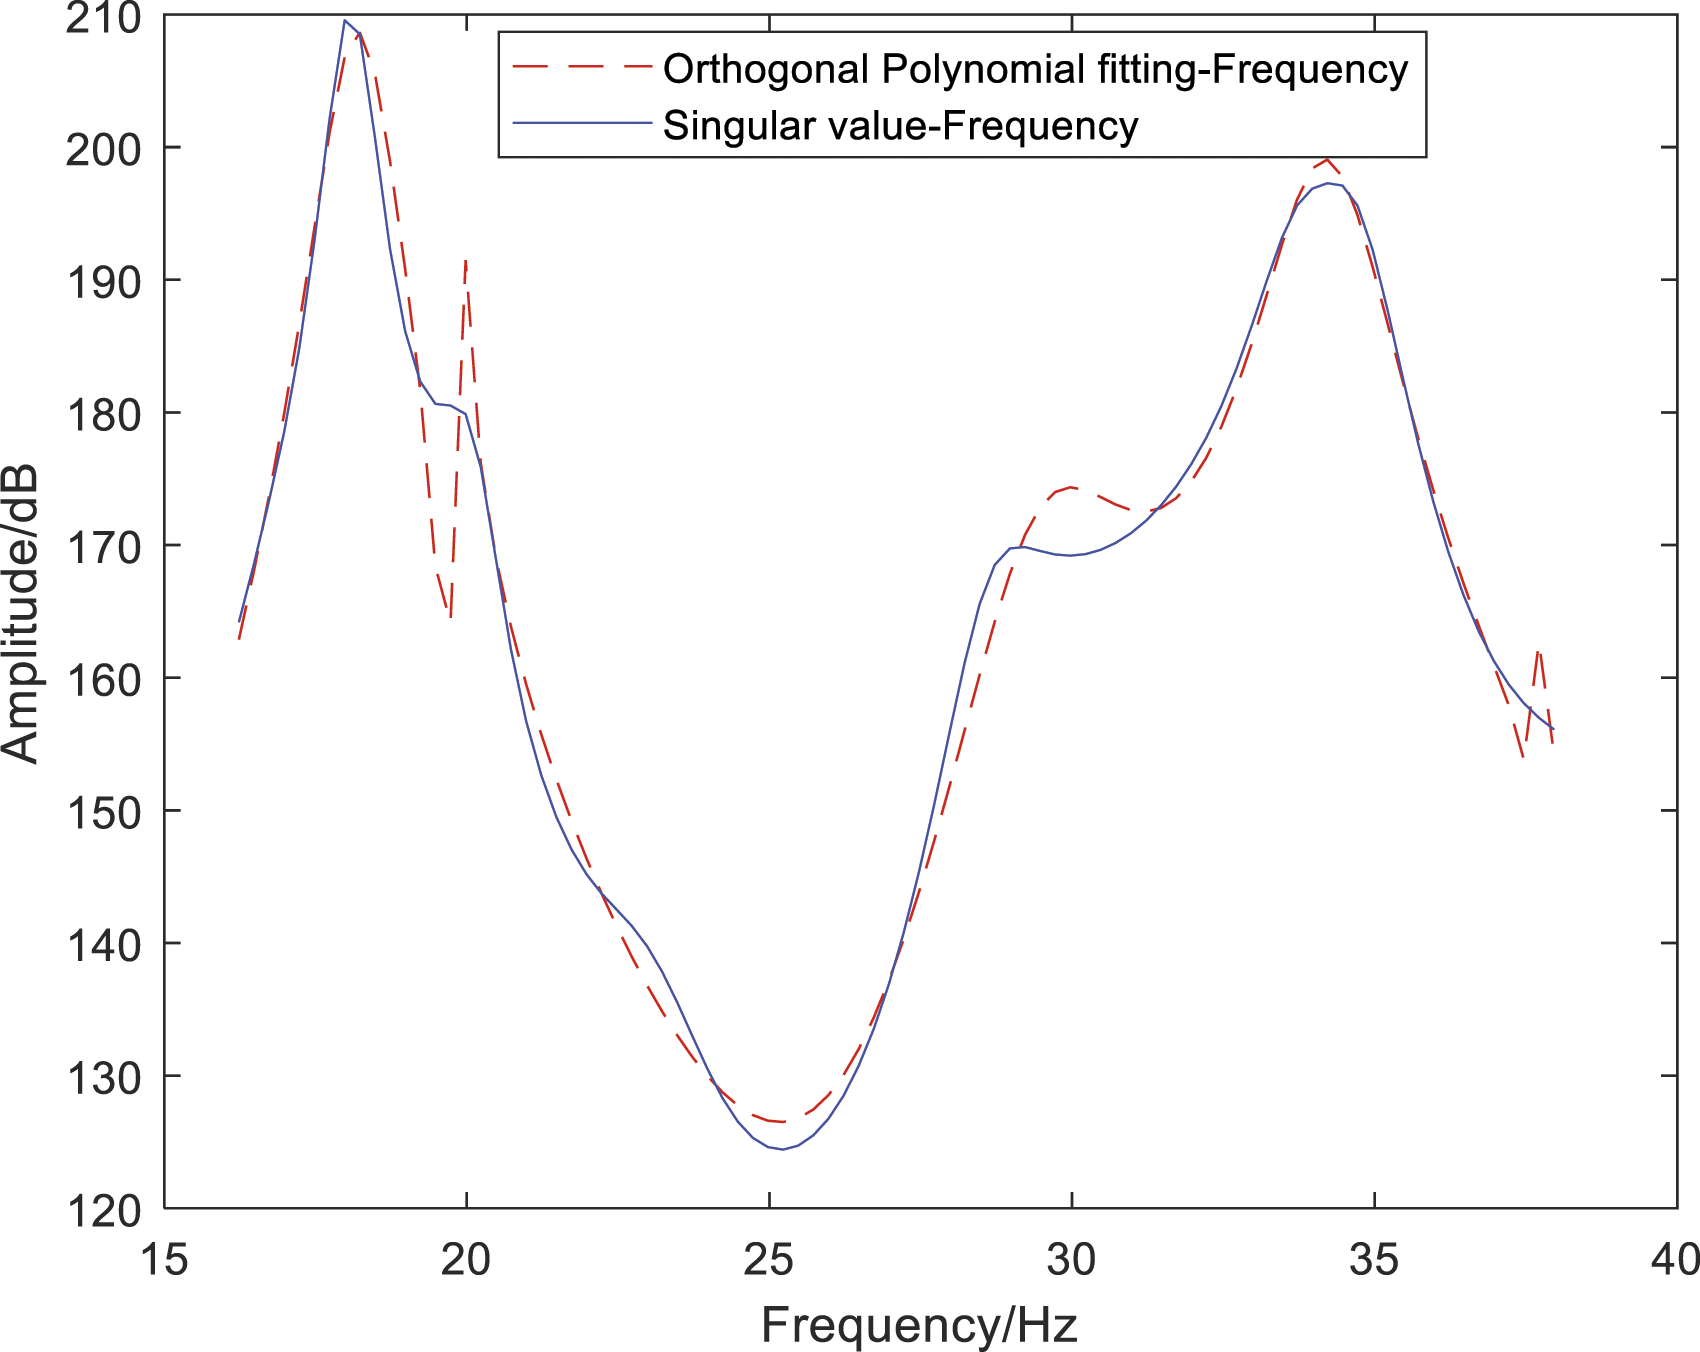
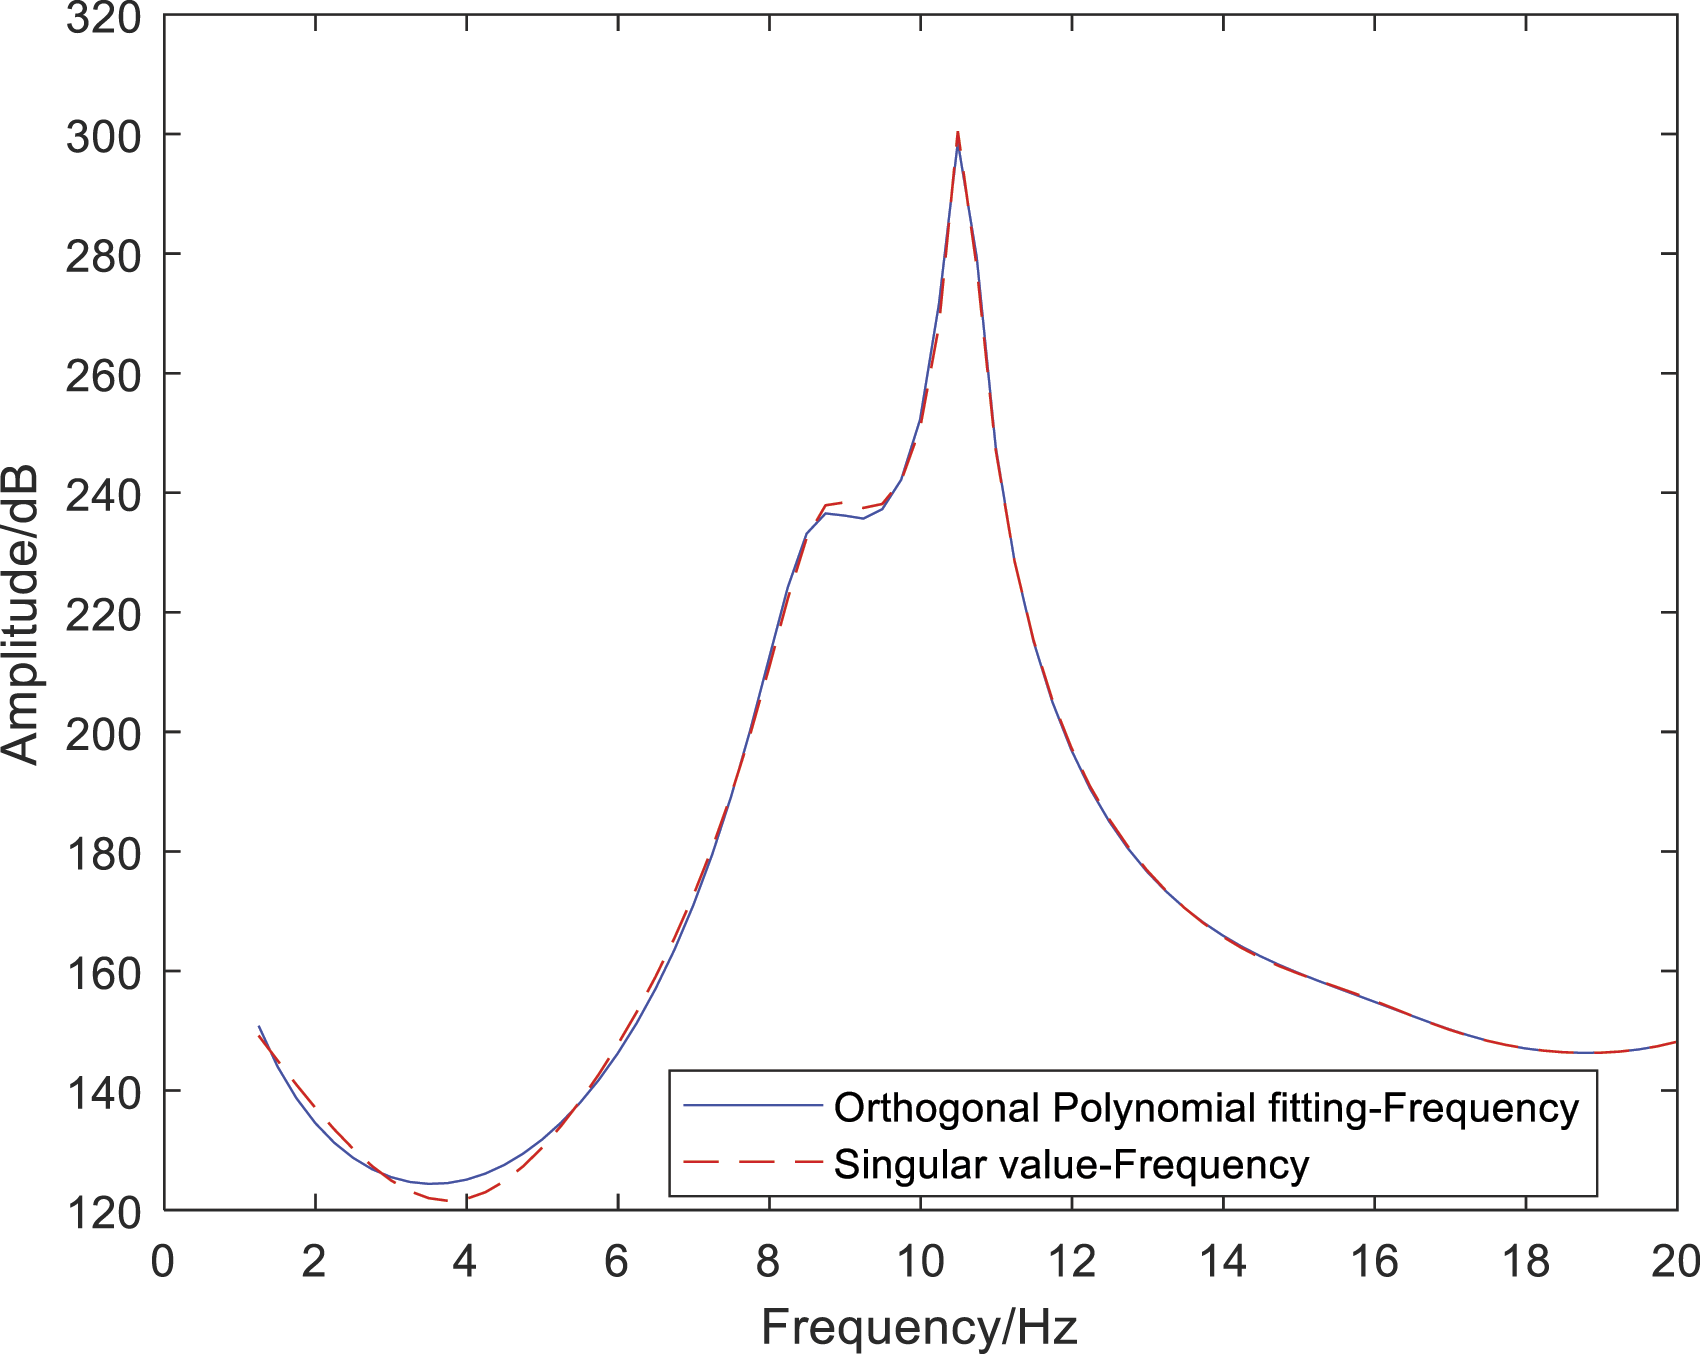
Based on these multi-channel turbulence response signals and the relevant theoretical methods described in section related methods, the PSD function matrix of the multi-channel turbulence response signal was calculated, and the corresponding maximum singular value curve was obtained via SVD of the PSD matrix (Figure 15). Furthermore, various frequency bands were fitted, and the modal parameters corresponding to the analyzed frequency bands were estimated (Figures 16–18). Singular value curve of the multi-channel turbulence response from the wing. Model parameter estimation results in the 1–12 Hz frequency range. Model parameter estimation results in the 8–24 Hz frequency range. Model parameter estimation results in the 16–38 Hz frequency range.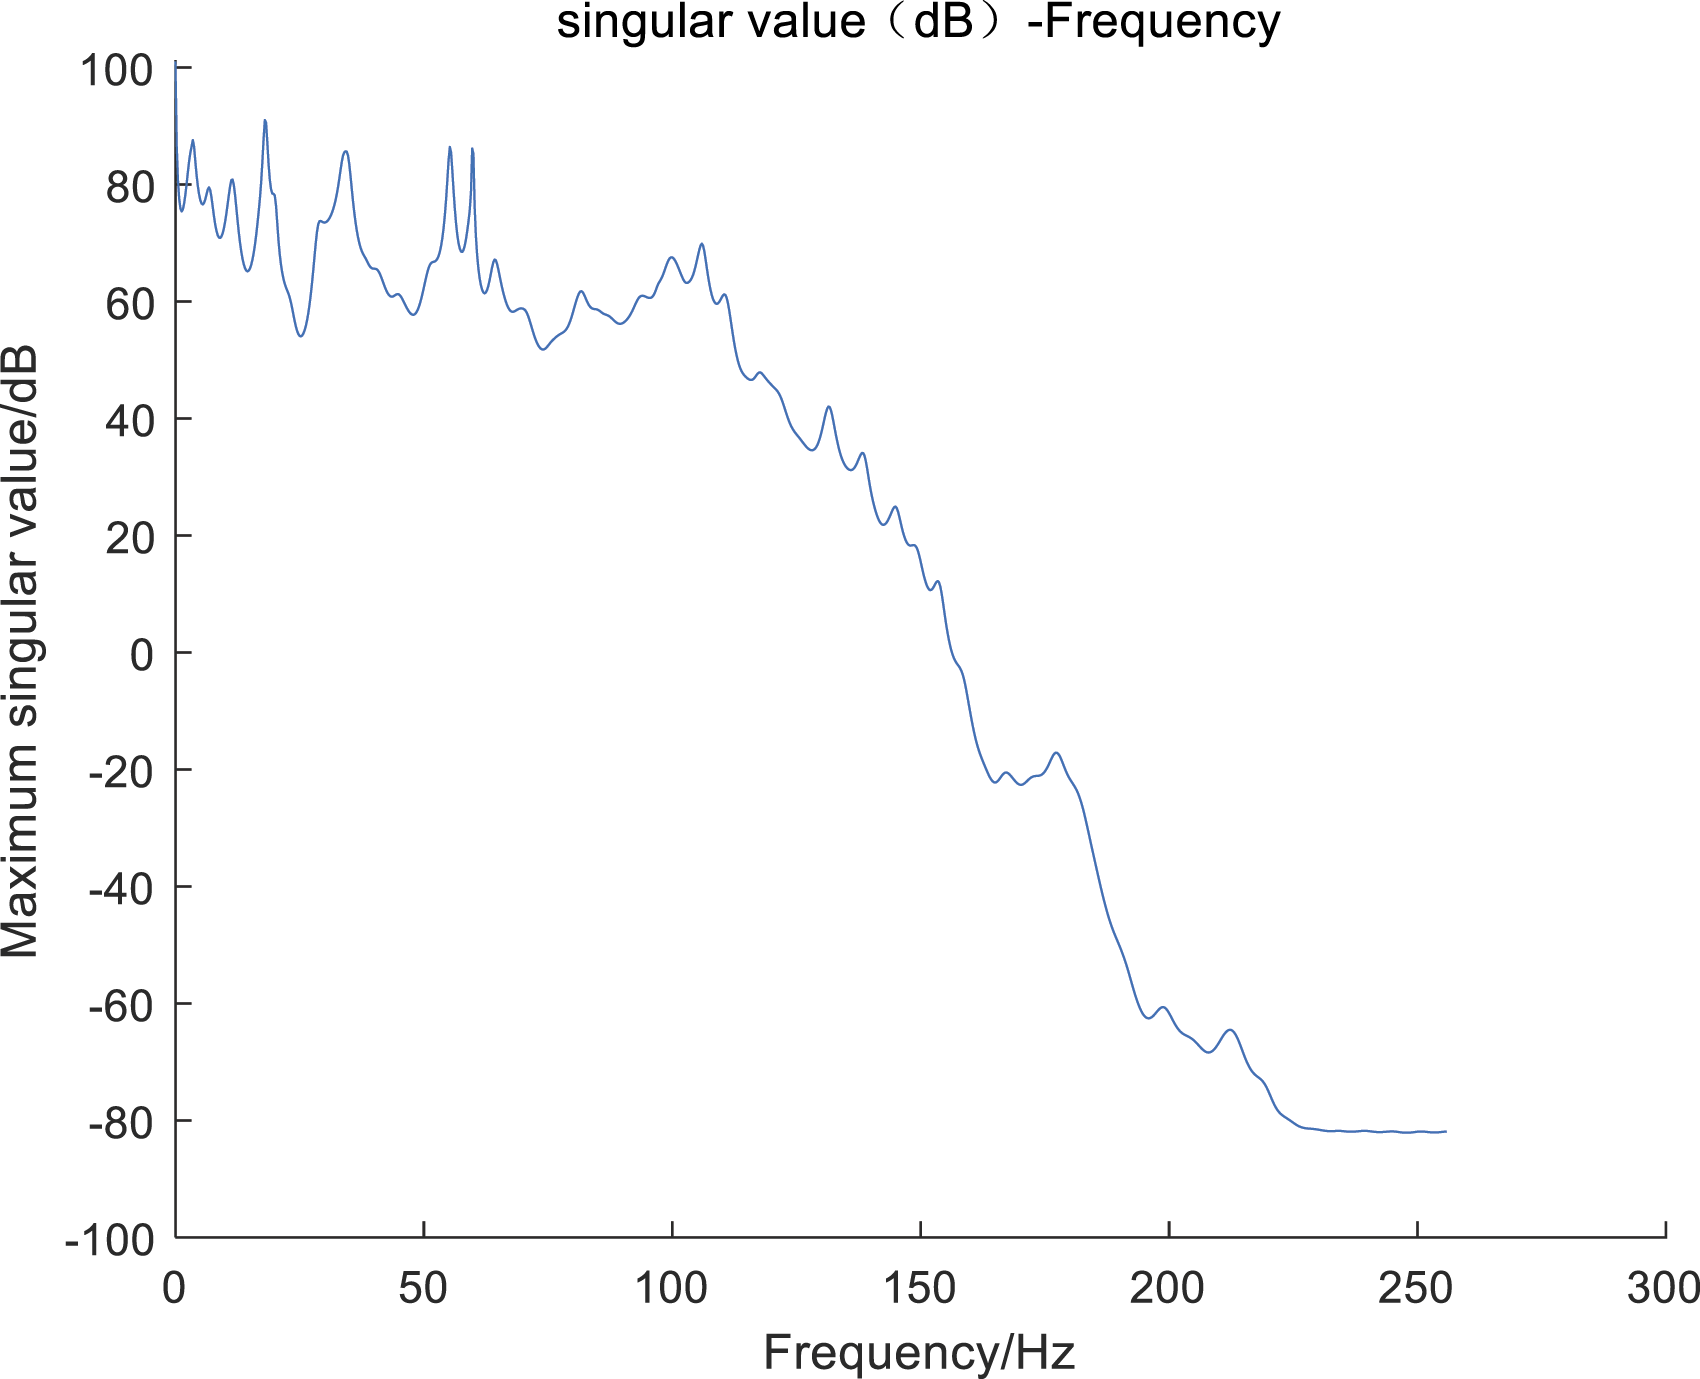
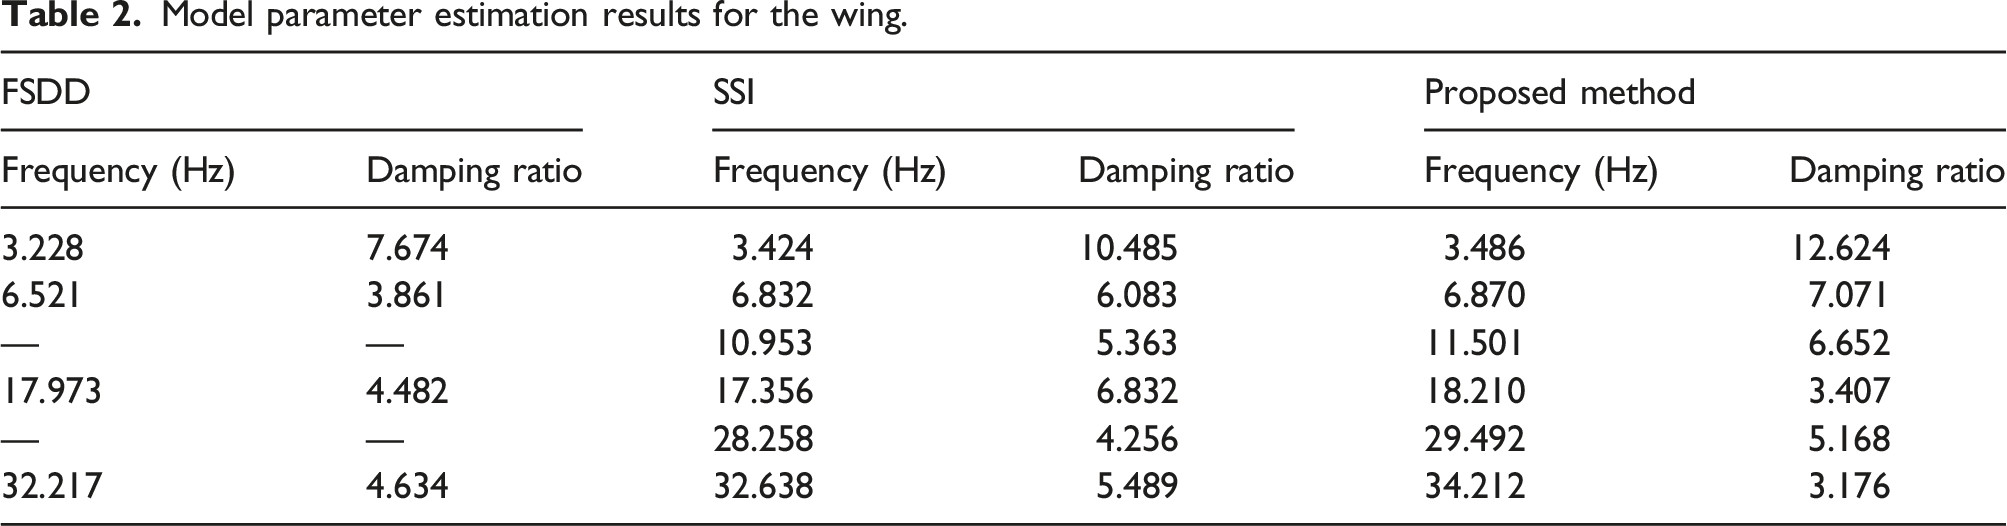
Model parameter estimation results for the wing.
Next, the modal parameters of the acceleration turbulence response signal of the horizontal tail were estimated based on the wing acceleration turbulence response signal analysis. Figures 19–20 present the acceleration turbulence response signals of the horizontal stabilizer at different positions, along with the corresponding parameterized power spectra. Time series and PSD of CH1 turbulence response from the horizontal tail. Time series and PSD of CH2 turbulence response from the horizontal tail.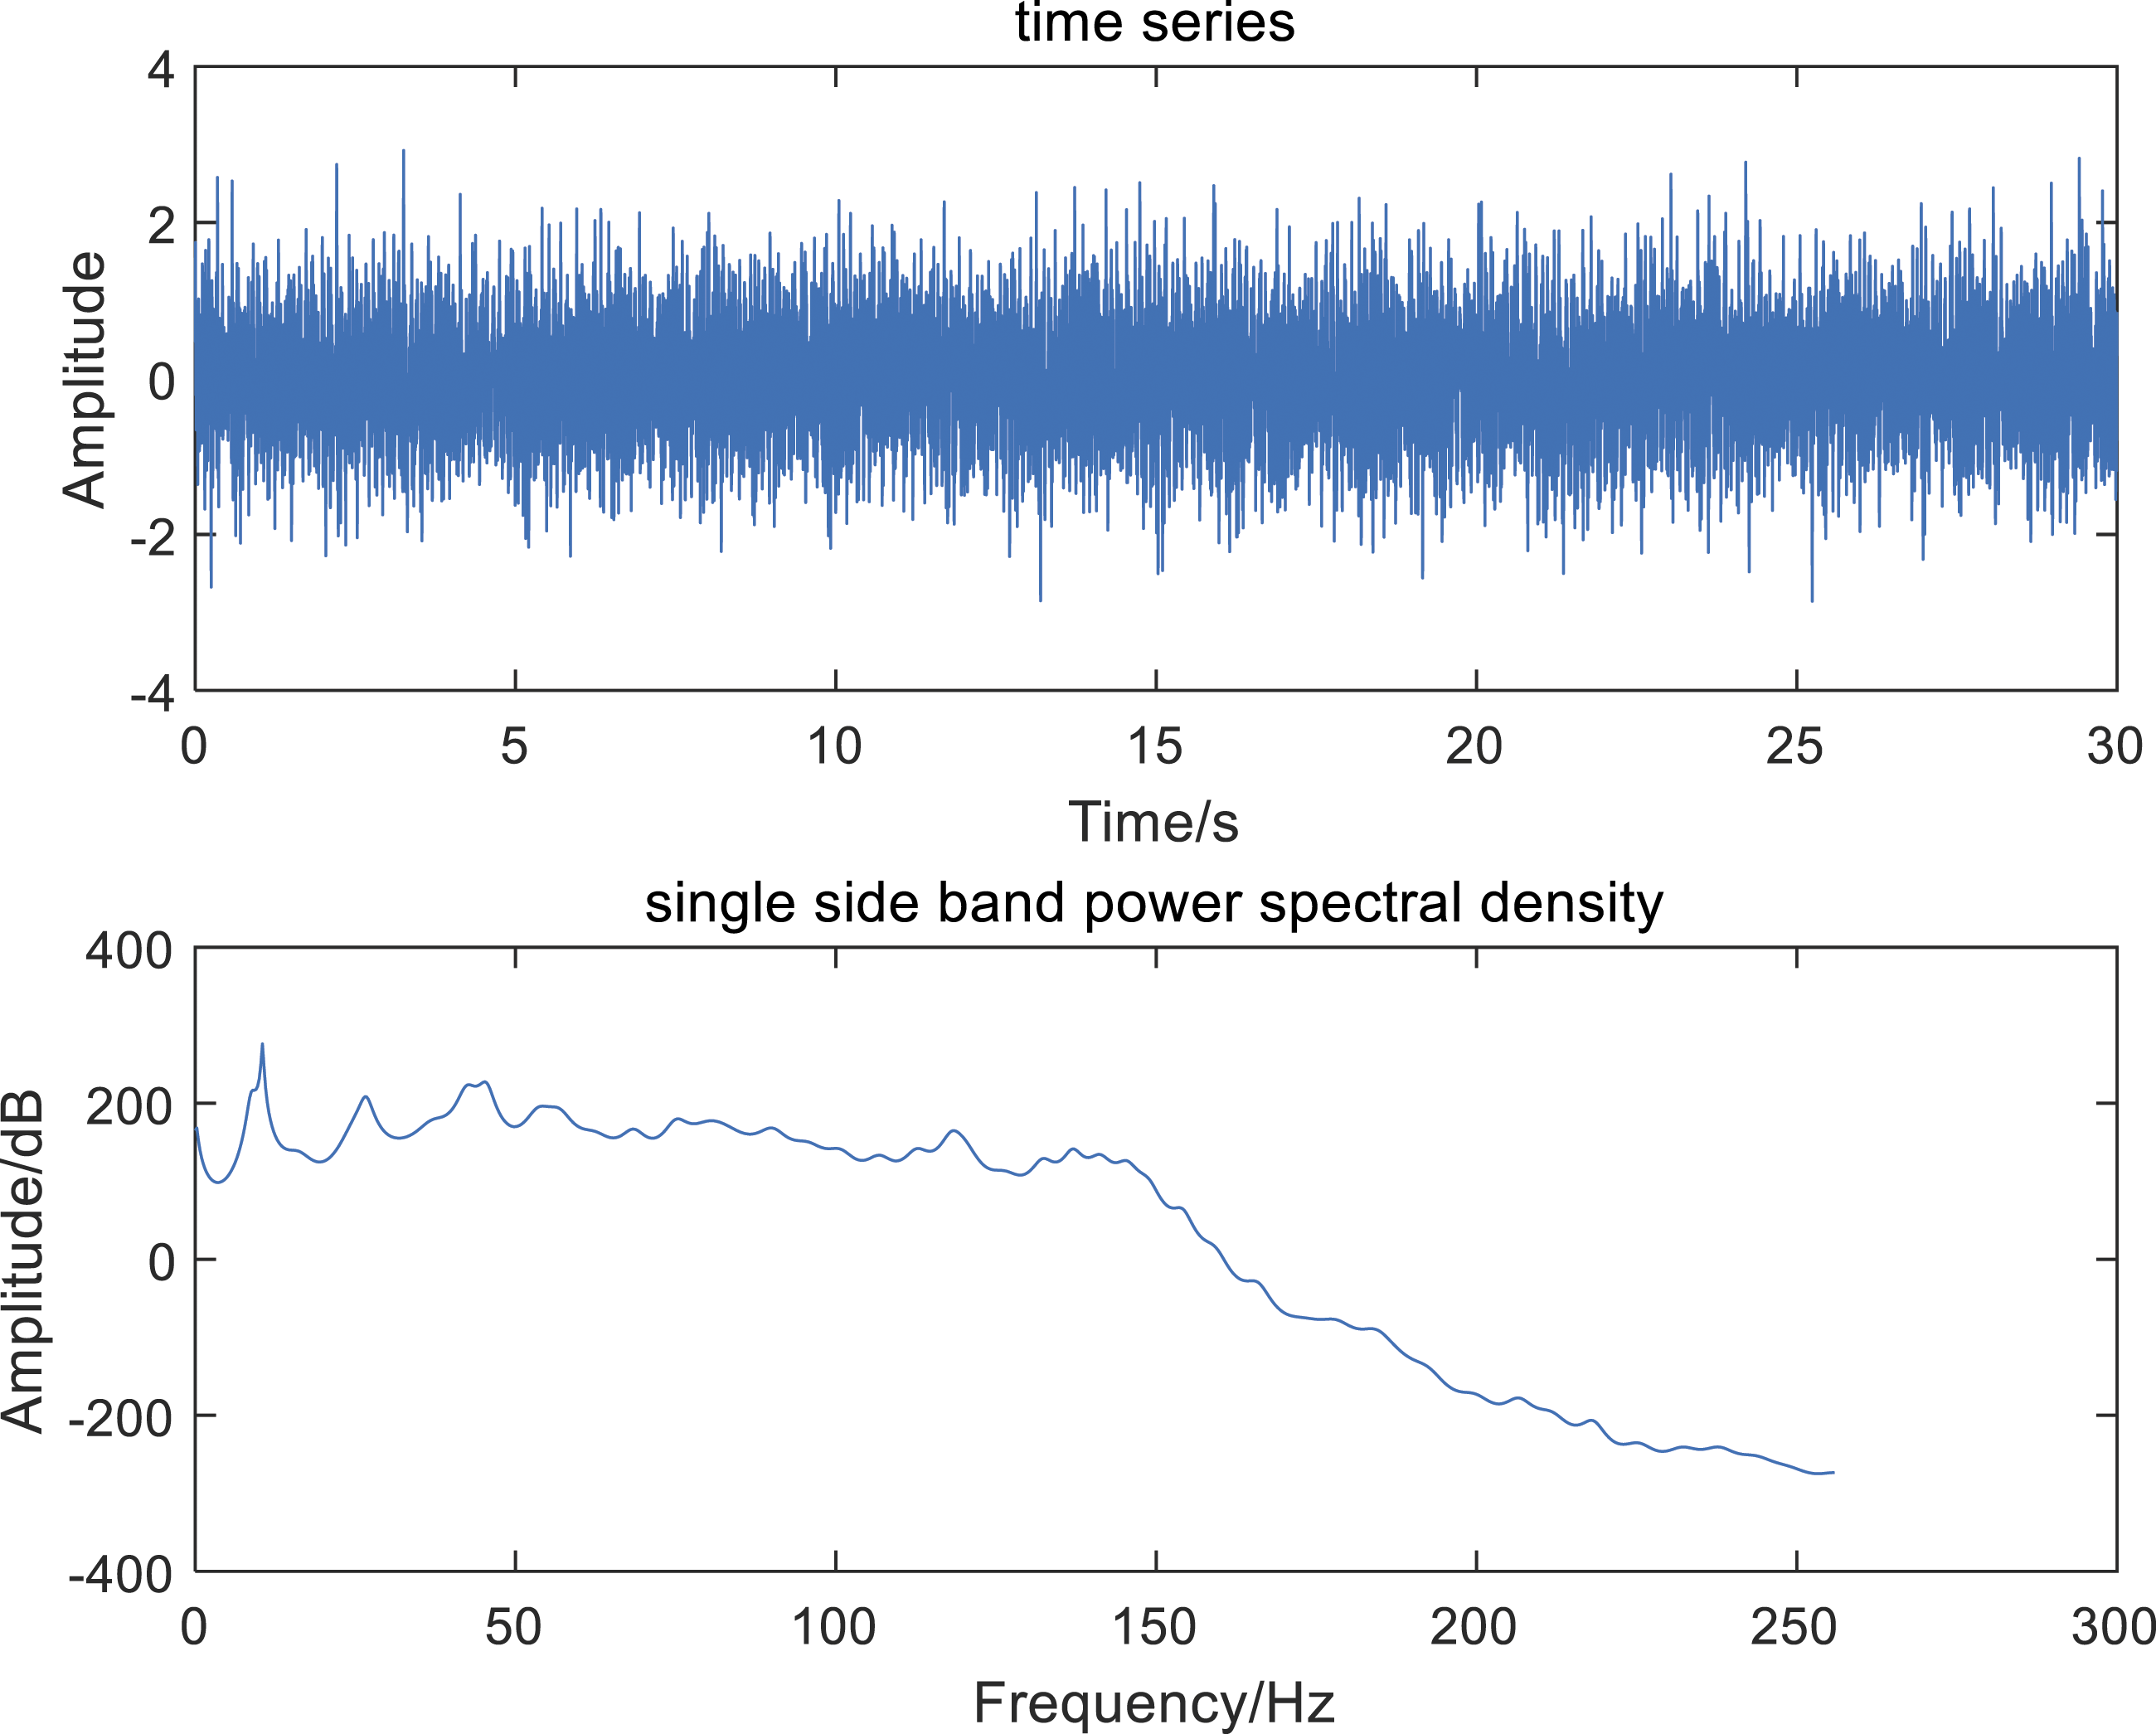
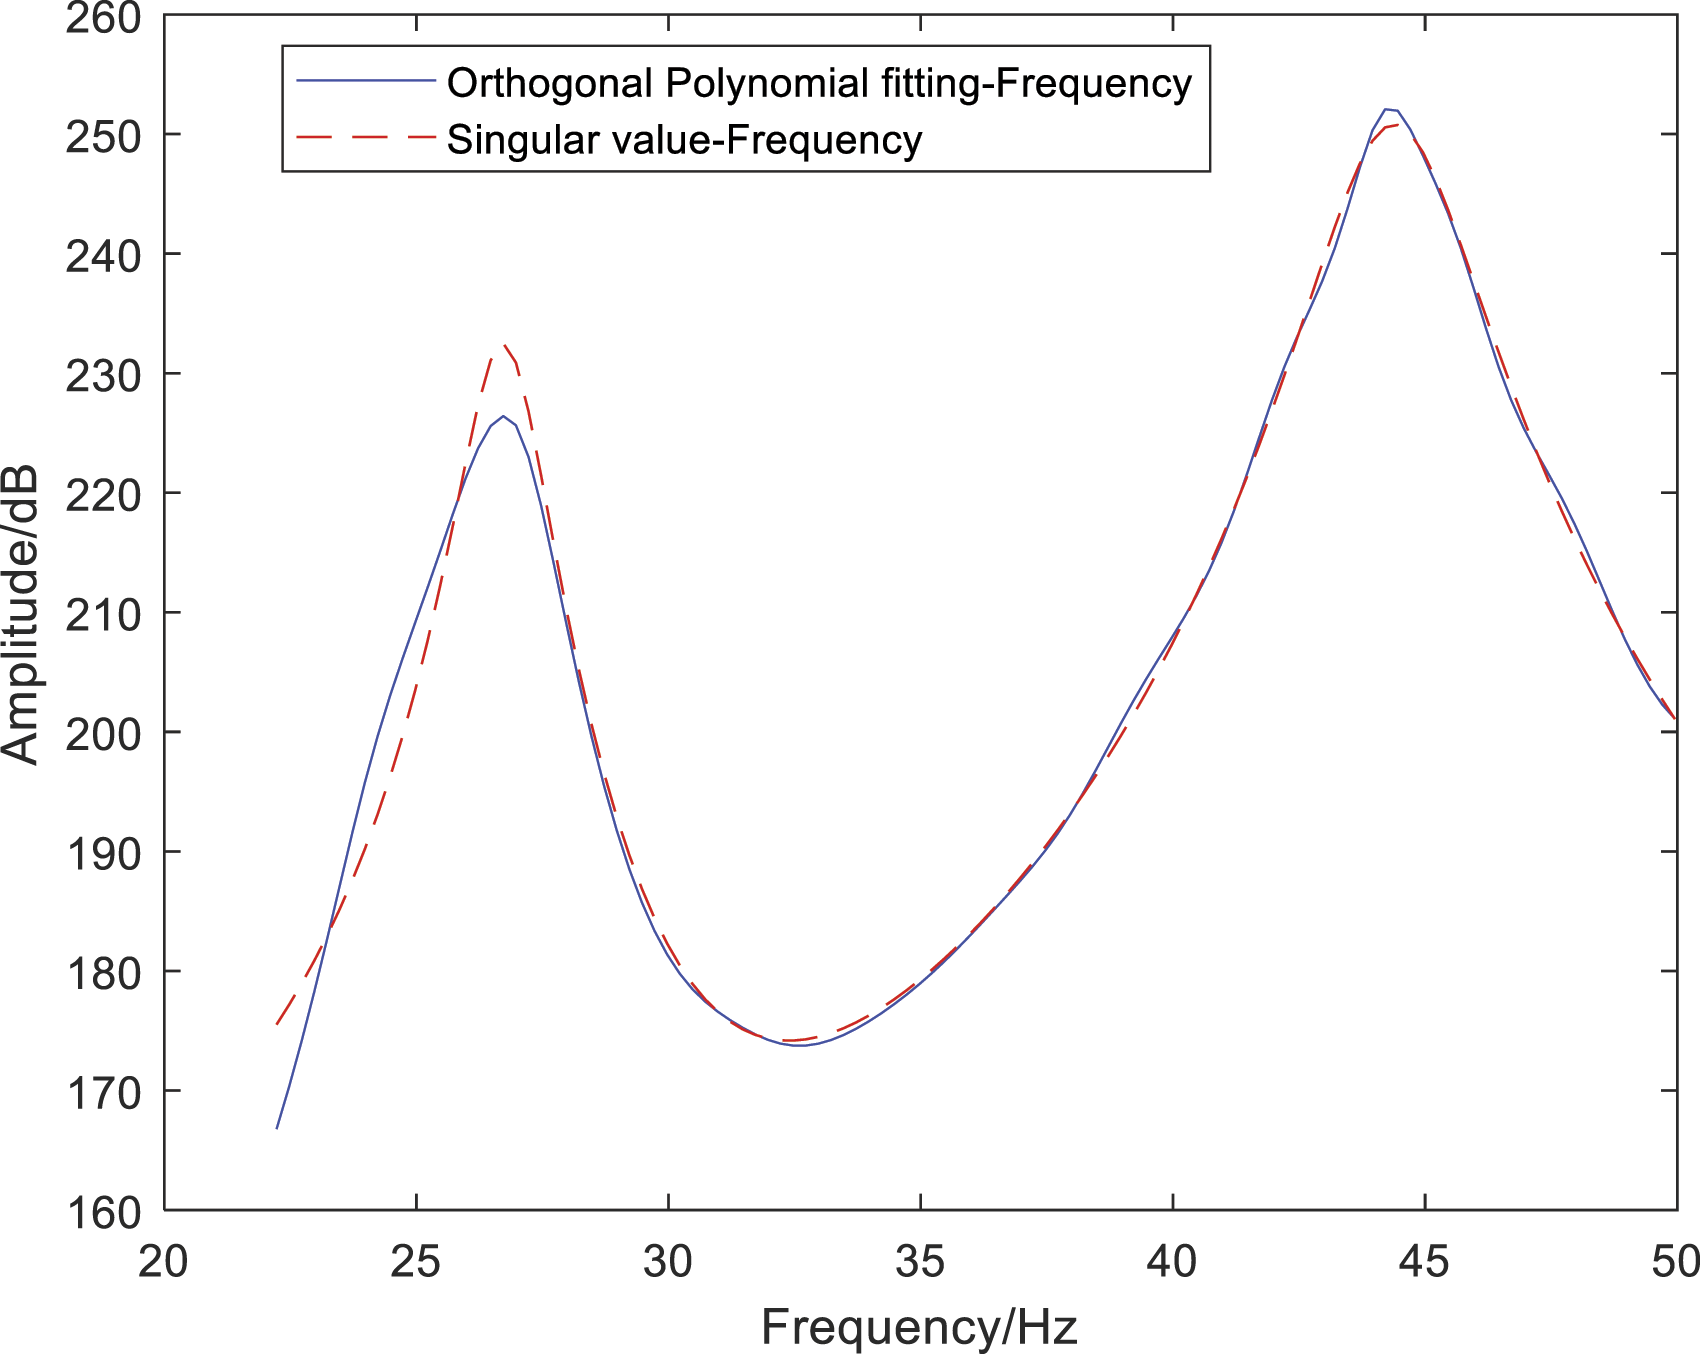
Considering the turbulence response signals of the horizontal stabilizer and the calculated PSD function matrix of the turbulence response signals from multiple channels, SVD was performed at each frequency pin, and the maximum singular value curve was calculated (Figure 21). Figures 22–23 present the modal parameter fitting results over distinct frequency intervals. Singular value curve of the multi-channel turbulence response from the horizontal tail. Model parameter estimation results in the 1–20 Hz frequency range. Model parameter estimation results in the 22–50 Hz frequency range.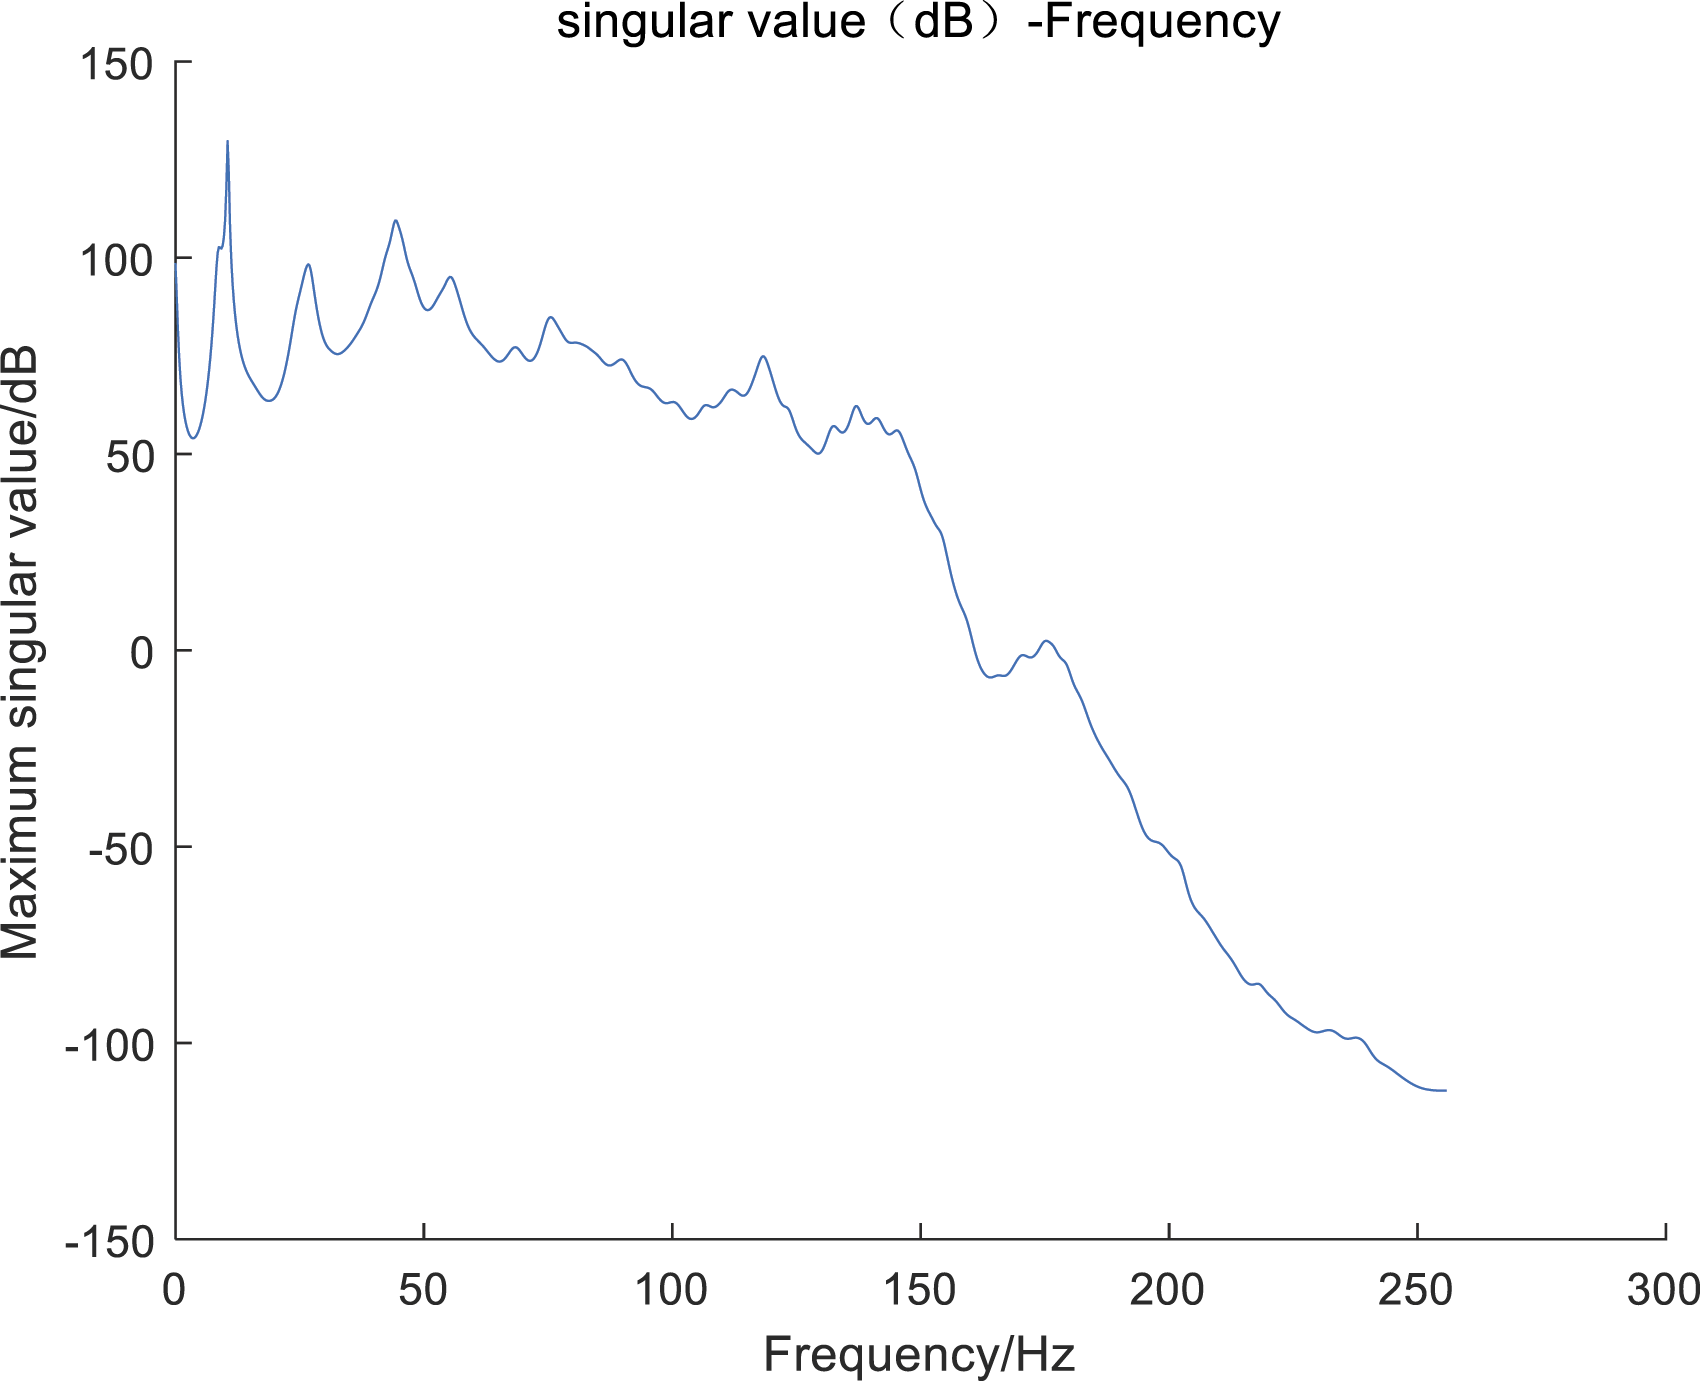
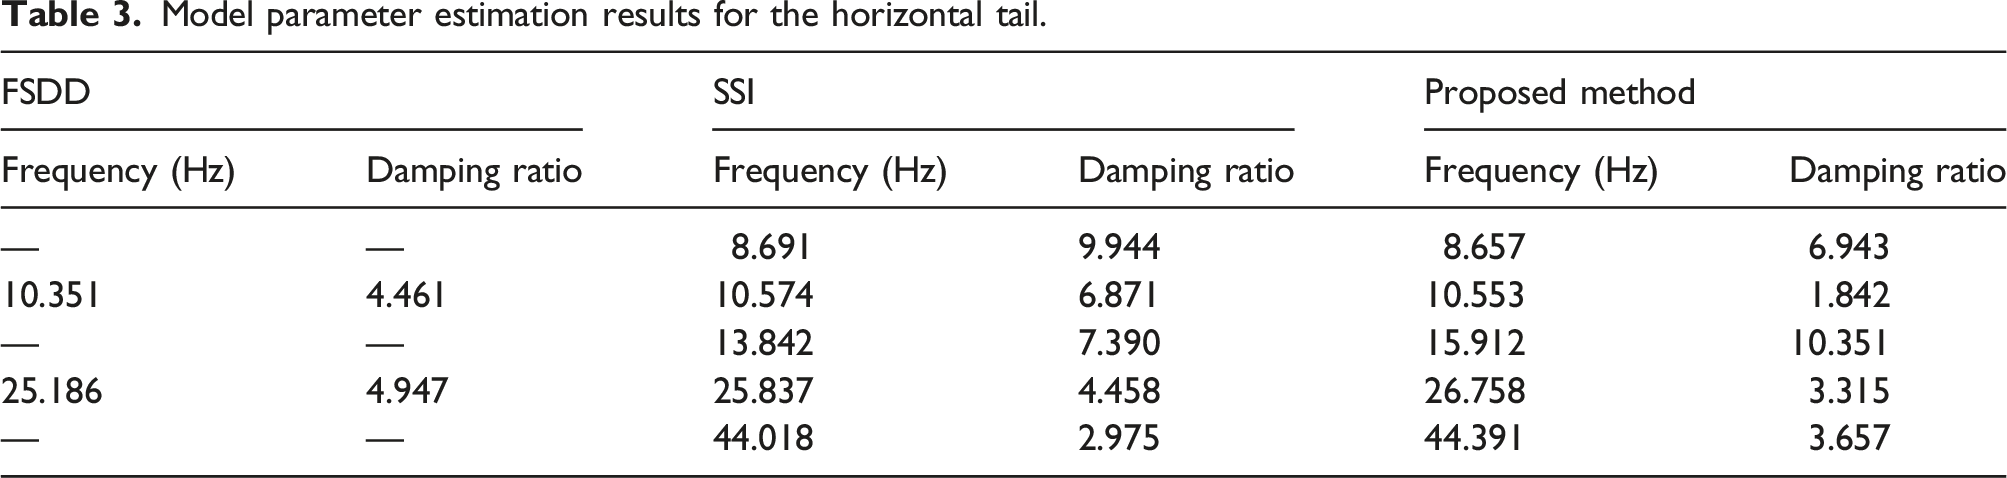
Model parameter estimation results for the horizontal tail.
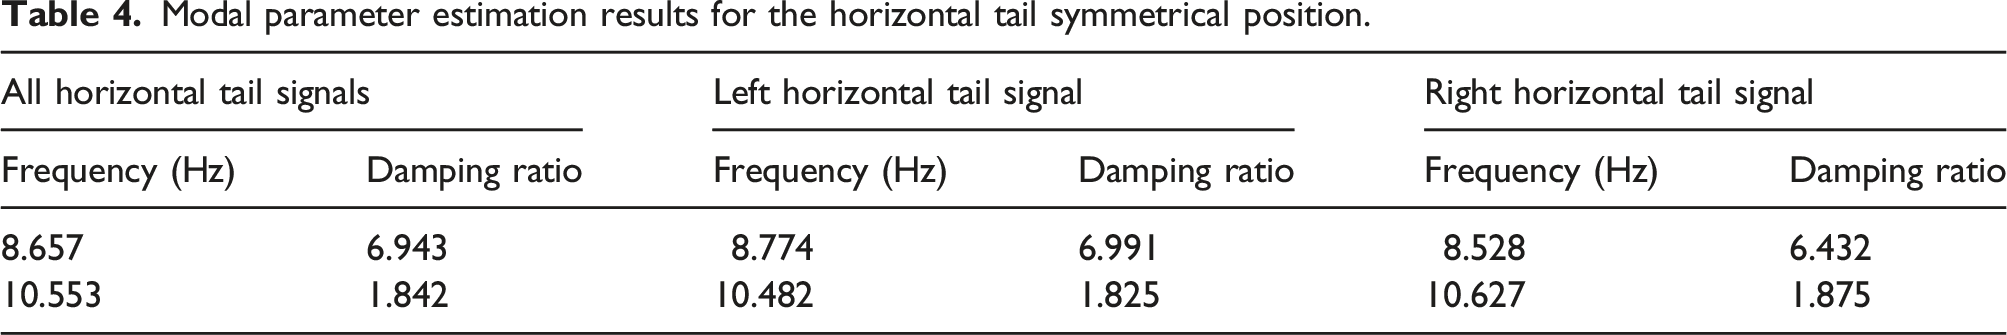
Modal parameter estimation results for the horizontal tail symmetrical position.
Conclusions
The power spectral density function of turbulence response was calculated by applying parametric spectral analysis, taking into account the spectral line density and spectral line smoothing of the power spectral density function. The developed method was used to obtain a smooth maximum singular value curve, thereby improving the precision and accuracy of frequency domain multi-modal fitting. Based on simulation verifications and modal parameter estimations of flutter flight test data, this report compares the developed approach with SSI and a frequency-spatial domain decomposition method. Thus, the reliability and engineering applicability of the method described herein are confirmed.
Supplemental Material
Supplemental Material - Model parameter estimations of the multi-channel turbulence response from flutter flight tests based on autoregressive spectra
Supplemental Material for Model parameter estimations of the multi-channel turbulence response from flutter flight tests based on autoregressive spectra by Shiqiang Duan and Hua Zheng in Journal of Low Frequency Noise, Vibration and Active Control
Supplemental Material
Supplemental Material - A prospective randomised comparative study of dynamic, static progressive and serial static proximal interphalangeal joint extension orthoses
Supplemental Material for Model parameter estimations of the multi-channel turbulence response from flutter flight tests based on autoregressive spectra by Shiqiang Duan and Hua Zheng in Journal of Low Frequency Noise, Vibration and Active Control
Footnotes
Declaration of conflicting interests
The author(s) declared no potential conflicts of interest with respect to the research, authorship, and/or publication of this article.
Funding
The author(s) disclosed receipt of the following financial support for the research, authorship, and/or publication of this article: This work was supported by theInnovation Foundation for Doctor Dissertation of Northwestern Polytechnical University (Grant no. CX2021077) and the Fundamental Research Funds for the Central Universities (Grant no. 31020190MS702).
Data availability statement
The flutter flight testing data used in this study are included within the supplementary information files.
Supplemental Material
Supplemental material for this article is available online.
References
Supplementary Material
Please find the following supplemental material available below.
For Open Access articles published under a Creative Commons License, all supplemental material carries the same license as the article it is associated with.
For non-Open Access articles published, all supplemental material carries a non-exclusive license, and permission requests for re-use of supplemental material or any part of supplemental material shall be sent directly to the copyright owner as specified in the copyright notice associated with the article.