
Abstract
Rotating machines are widely used as components of various industries around the world, and its normal operation of rotating machines is important. Thus, condition monitoring and fault diagnosis of rotating machines have considerable attention in recent years. Industrial statistics illustrate that 40% of total large machine breakdowns happened due to broken bearings, while for small machines, the analogous number reaches up to 90%. This study aimed at researching fault diagnosis of journal bearings using the support vector machine (SVM) method. The experimental systems of vertical and horizontal rotating shafts were developed. There was no adding any initial artificial failure in the bearing, and a little muddy water was used, and long-term vibration data in both systems were obtained in the normal operation of the machines until bearing damages occurred in the journal bearing (3-hour tests were conducted repeatedly and total 128 datasets for vertical shaft and 24 datasets for horizontal shaft were obtained). A feature selection method is focused, and a hybrid feature selection method by combining Fisher score (FS) and a sequential forward selection (SFS) method was proposed. Its accuracy and efficiency was proved experimentally with 97.14% and 100% for vertical shaft and 100% for horizontal shaft. Furthermore, as a result of the SVM model and hybrid feature selection method, the most important feature for journal bearing of horizontal rotor system was clarified as mean value of RMS, and only this feature can give good diagnosis result. It is useful suggestion in selecting the features for the fault diagnosis of horizontal rotating machines.
Keywords
Introduction
Rotating machines are widely used as components of various industrial and agricultural plants around the world and are indispensable to our lives. Therefore, its normal operation of rotating machines is important, and any fault of the rotating machinery possibly causes a breakdown of the entire mechanical system, which may reduce the reliability, security, and availability of the machinery. Thus, condition monitoring and fault diagnosis of rotating machines have considerable attention in recent years. Rotating machines generally operate under tough working environment and is therefore frequently subject to faults. 1 In order to improve the reliability and availability of rotating machines, research on machine failure prediction mainly using machine learning is being actively pursued. Industrial statistics illustrate that 40% of total large machine breakdowns happened due to broken bearings, while for small machines, the analogous number reaches up to 90%. 2 Therefore, intelligent monitoring and fault diagnosis methods for bearings have considerable attention from researchers in recent years.
There are many machine learning methods can be used for intelligent fault diagnosis, such as artificial neural network (ANN), support vector machine (SVM), and so on. ANN is known as a typical machine learning; Al-Raheem et al. 3 presented a new technique for an automated detection and diagnosis of rolling bearing faults which using ANN classifier optimized by a genetic algorithm in 2008. In addition, Kanai et al. 4 proposed a system for model-based estimation (MBE) for deep groove ball bearings and condition-based monitoring (CBM) using ANN in 2016. In 2006, Hinton et al. proposed an autoencoder, which is a dimensional compression algorithm, and it became possible to capture the features of the neural network itself. Deep learning using autoencoders and multi-layer neural networks has emerged, causing a third boom in machine learning. This trend also affected failure diagnosis, and deep learning was also applied to failure diagnosis. In 2021, Gecgel et al. 5 classified hydrodynamic journal bearing wear using deep learning algorithms.
The two machine learning methods introduced earlier have the problem that the processing process is black-boxed and cannot be explained. In general, huge data and lots of computing time are required to get good performance in these two methods. Therefore, this study focuses on the SVM, which is a learning model with the best recognition performance even in the case of small sample size among many currently known methods. Since it has high recognition performance and is not easily affected by noise data, many failure diagnosis methods using SVM have been developed. In 2017, Unal et al. 6 used Hilbert transform (HT) and power spectral density (PSD) for rolling bearings to extract features from the original audio signal and SVM for classification. Furthermore, Salunkhe et al. 7 proposed a method using a SVM and a mathematical model for early failure detection of damper rolling bearings in 2020.
It is worth noting that failures in the research studies above are artificially created. Sometimes, the actual failure in the real machine is not like these artificially created failures, and the resulting vibration characteristics may be significantly different. Therefore, in our research, we demonstrated the long-term rotating test for the rotating shaft system (both vertical and horizontal shafts) supported by the journal bearing with a little muddy water, and collected all the operation data of shaft vibration from normal stage to the damaged stage. Therefore, the failures obtained in this study were caused by natural operation without any artificially created failure, and the data will be closer to the real situation.
Another point to be noted is appropriate feature selection. In the application of the machine learning method, selecting and calculating appropriate features are very essential to the model training. However, for a long time, many researchers have focus on proposing new feature calculation methods for better classification. However, not so many studies on methods selecting features have been investigated, especially the ones for the SVM classification. In this perspective, Yi-Wei Chen et al. 8 proposed a filter method called Fisher score (FS) to make feature selection in 2006. In 2014, Nannan Gu et al. 9 improved this Fisher score (FS) method. In the practical application of SVM theory such as fault diagnosis, many researchers applied feature selection methods to save computing time and get better performance. Yan-li Ma et al. 11 proposed a novel fault diagnosis method for rotating machinery by extracting fault features with multivariate multiscale fuzzy distribution entropy (MMFDE), selecting sensitive ones with Fisher score (FS), and identifying working state with SVM in 2021.
However, it is not enough only using filter method like Fisher score to select features in most circumstances because it completely ignores the performance of selected features on specific classifiers and evaluates the features individually, which is another point discussed in this study. In 2014, Silvia Cateni et al. 10 proposed a feature selection method combined Fisher score (FS) and exhaustive search. Although it is a good idea to combine filter method and wrapper method, exhaustive search using the wrapper method 12 is so time-consuming and memory-consuming, and because of that, it may not be difficult physically to implement in many practical cases with large sample sizes and many features.
In this study, mainly three original points are investigated. First, it is an application of SVM to fault diagnosis of real long-term vibration data of journal bearing with a little muddy water without adding any initial artificial failure. Two types of rotor systems, horizontal rotor system and vertical rotor system, were investigated. Experiments were carried out, and the data of the bearing from new normal stage to the damaged stage was obtained in the normal rotating condition. The features for training SVM model were calculated, and SVM models were trained using these features. After the training of SVM model, a hyperplane was created based on SVM model to separate data in two stages: normal (before failure) and abnormal (after failure). Then, this hyperplane was used to judge the state of bearings by determine which stage the data belong to.
Second original point is the investigation of feature sensitivity to the SVM model for journal bearing diagnosis by the feature selection method. Sequential forward selection (SFS) is used as a wrapper method to replace exhaustive search method, and a hybrid feature selection method by combining Fisher score (FS) and the sequential forward selection (SFS) method was proposed to select more important features from all the features for SVM models for journal bearing diagnosis. The efficiency and accuracy of this proposed hybrid feature selection method are evaluated.
Finally, the third original point is to identify the most important feature in the vibration signal for the diagnosis of journal bearing is investigated. Both vertical and horizontal rotor systems are investigated and discussed, and the most important feature for the diagnosis of journal bearing in the horizontal shaft is addressed.
Methodology
SVM method and mathematical derivation
SVM method is a classic machine learning method, 13 and through further research, 14 and the now mature SVM theory was finally developed.
A visualization of the most basic binary classification SVM model is shown in Figure 1. The green line denotes maximum-margin hyperplane, while black dash lines denotes margins, which are for an SVM model trained with samples from two classes. SVM classifier tries to create a hyperplane between two different series of points of the dataset to separate the different classes, and an optimum hyperplane is obtained when a problem solved. The data points (or samples) near the hyperplane explain the margin and are called the support vector of the machine algorithm. The development of SVM and the specific mathematical deduction are introduced in detail in the papers15–17 which are not repeated here. SVM method.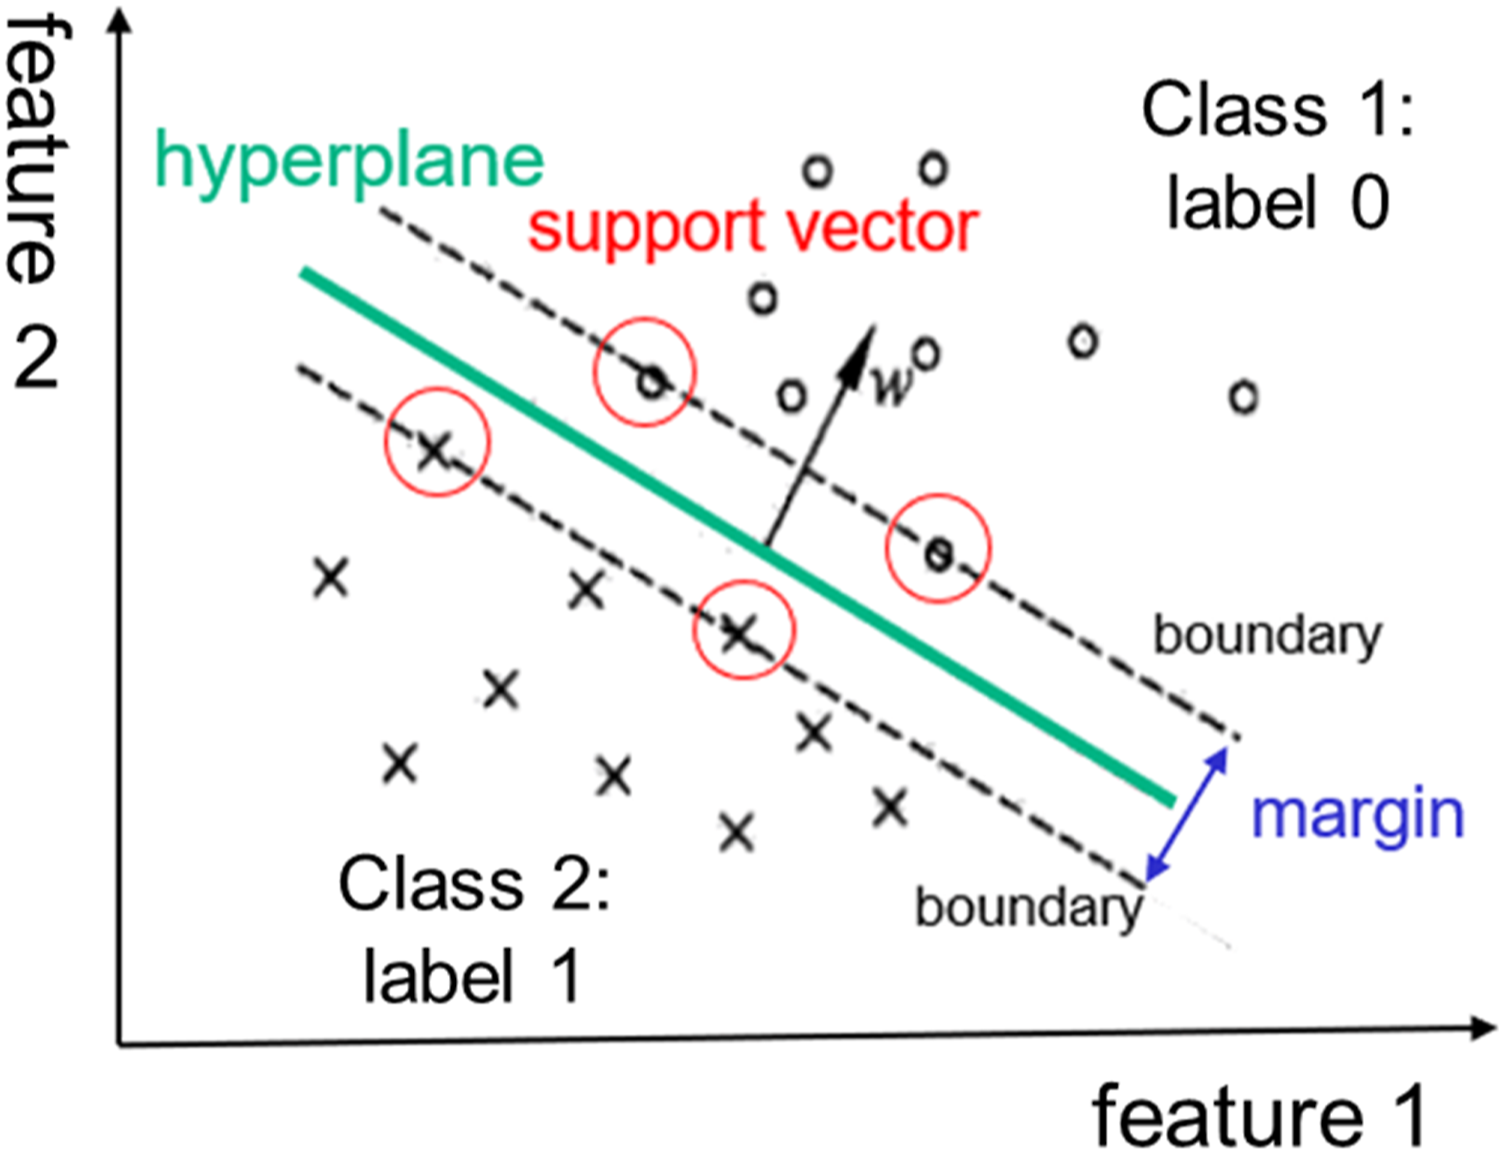
Comparing with other machine learning method, the SVM method has many advantages, such as it can perform well even at a small sample size while costing less computing time. This method always gets optimized solution. In addition, it can solve nonlinear problem and multi-classes cases. On the other hand, SVM classifier is sensitive to missing data because SVMs only rely on a subset (support vectors) of observation, 18 which is a disadvantage of this method. However, there are many ways to deal with this problem.19,20 Regarding this point, this study will not go into details.
Feature generation
Feature generation is the process of taking raw, unstructured data and defining features (i.e., variables) for potential use in statistical analysis. This study used some common features in two domains: time domain and time-frequency domain. They will be introduced in this section.
Time domain features
Some of time domain techniques are used for condition monitoring, such as root mean square (RMS), skewness, kurtosis, and so on21,22. These features are shown as examples in the following. Here,
Root mean square (RMS)
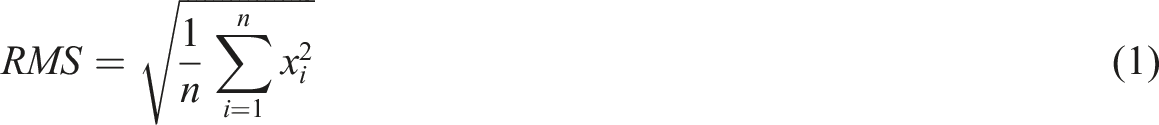
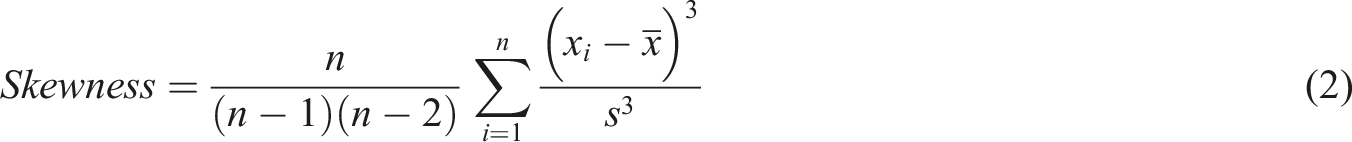


In this research, 6 kinds of features in time domain are used: the mean value of RMS, kurtosis and skewness, and coefficient of variation (C.V.) of the mean value of RMS, kurtosis, and skewness. They are referred as: RMS average, kurtosis average, skewness average, RMS average C.V., kurtosis average C.V., and skewness average C.V.
Every file contains data of 30 s. First, features (RMS, kurtosis, and skewness) of data for each 0.5s are calculated and obtained 600 datasets. Then, mean value and its C.V. of these 600 datasets is calculated to obtain “average” and “C.V.”
Time-frequency domain features
A discrete wavelet transform (DWT) is a transform that decomposes a given signal into number of sets, where each set is a time series of coefficients describing the time evolution of the signal in the corresponding frequency band. 23 The wavelet function used was Daubechies (N = 20), and one-dimensional wavelet decomposition from level 1 to 4 was performed. Its mathematical formulas are shown below:
After expanding the function


Here,
Feature selection method
In machine learning and statistics, feature selection is the process of selecting a subset of relevant features for use in model construction. Feature selection techniques are often used to avoid the curse of dimensionality and get shorter training times. In addition, it can improve the performance of the model in some cases. In recent years, it is proved that feature selection can improve data’s compatibility with a learning model class 24 and encode inherent symmetries present in the input space. 25
The feature selection techniques in machine learning can be broadly classified into the following categories: supervised techniques and unsupervised techniques. Supervised techniques can be used for labeled data, and are used to identify the relevant features for increasing the efficiency of supervised models like classification and regression. Unsupervised techniques are usually used for unlabeled data. As this paper uses SVM method, which is a supervised method, supervised techniques of feature selection are used. In supervised techniques, this study proposes the hybrid technique of filter method and wrapper method.
Filter method (Fisher score)
In filter methods, the selection of features is independent of the classifier used. They rely on the general characteristics of the training data to select features with independence of any predictor. 26
Filter methods always rank scores of features by using a proxy measure instead of the error rate. For example, the Fisher score method: distances between data points of every feature are measured. In Fisher score method, scores of features are ranked according to this criterion: the feature is given higher score if distances between data point indifferent classes are larger, while the distances between data points in the same class are smaller. The equation of Fisher score method
8
is shown as below
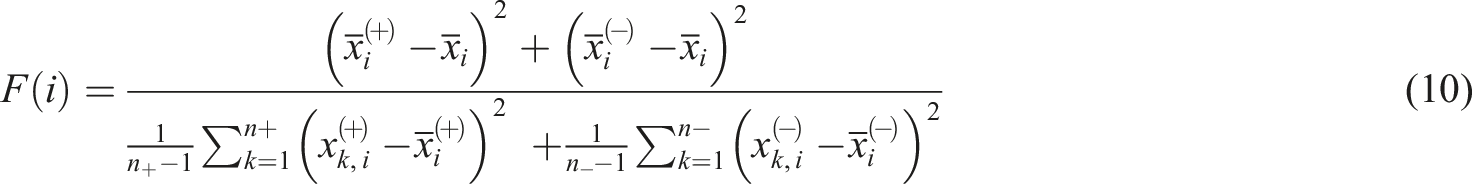
In this equation,
Wrapper method (sequential forward selection (SFS) method)
Wrapper methods work by evaluating a subset of features using a machine learning algorithm that employs a search strategy to look through the space of possible feature subsets, evaluating each subset based on the quality of the performance of a given algorithm. Wrapper models involve optimizing a predictor as part of the selection process. They tend to give better results. 26 Wrapper methods use a predictive model to score feature subsets. Each new subset is used to train a model, which is tested on a hold-out set. Counting the number of mistakes made on that hold-out set (the error rate of the model) gives the score for that subset. Filter methods are usually computationally less expensive than wrappers.
In this study, sequential forward selection (SFS) is used as a wrapper method. This SFS method is simple and effective. It always starts from the empty set, sequentially add the feature
Proposed hybrid feature selection method
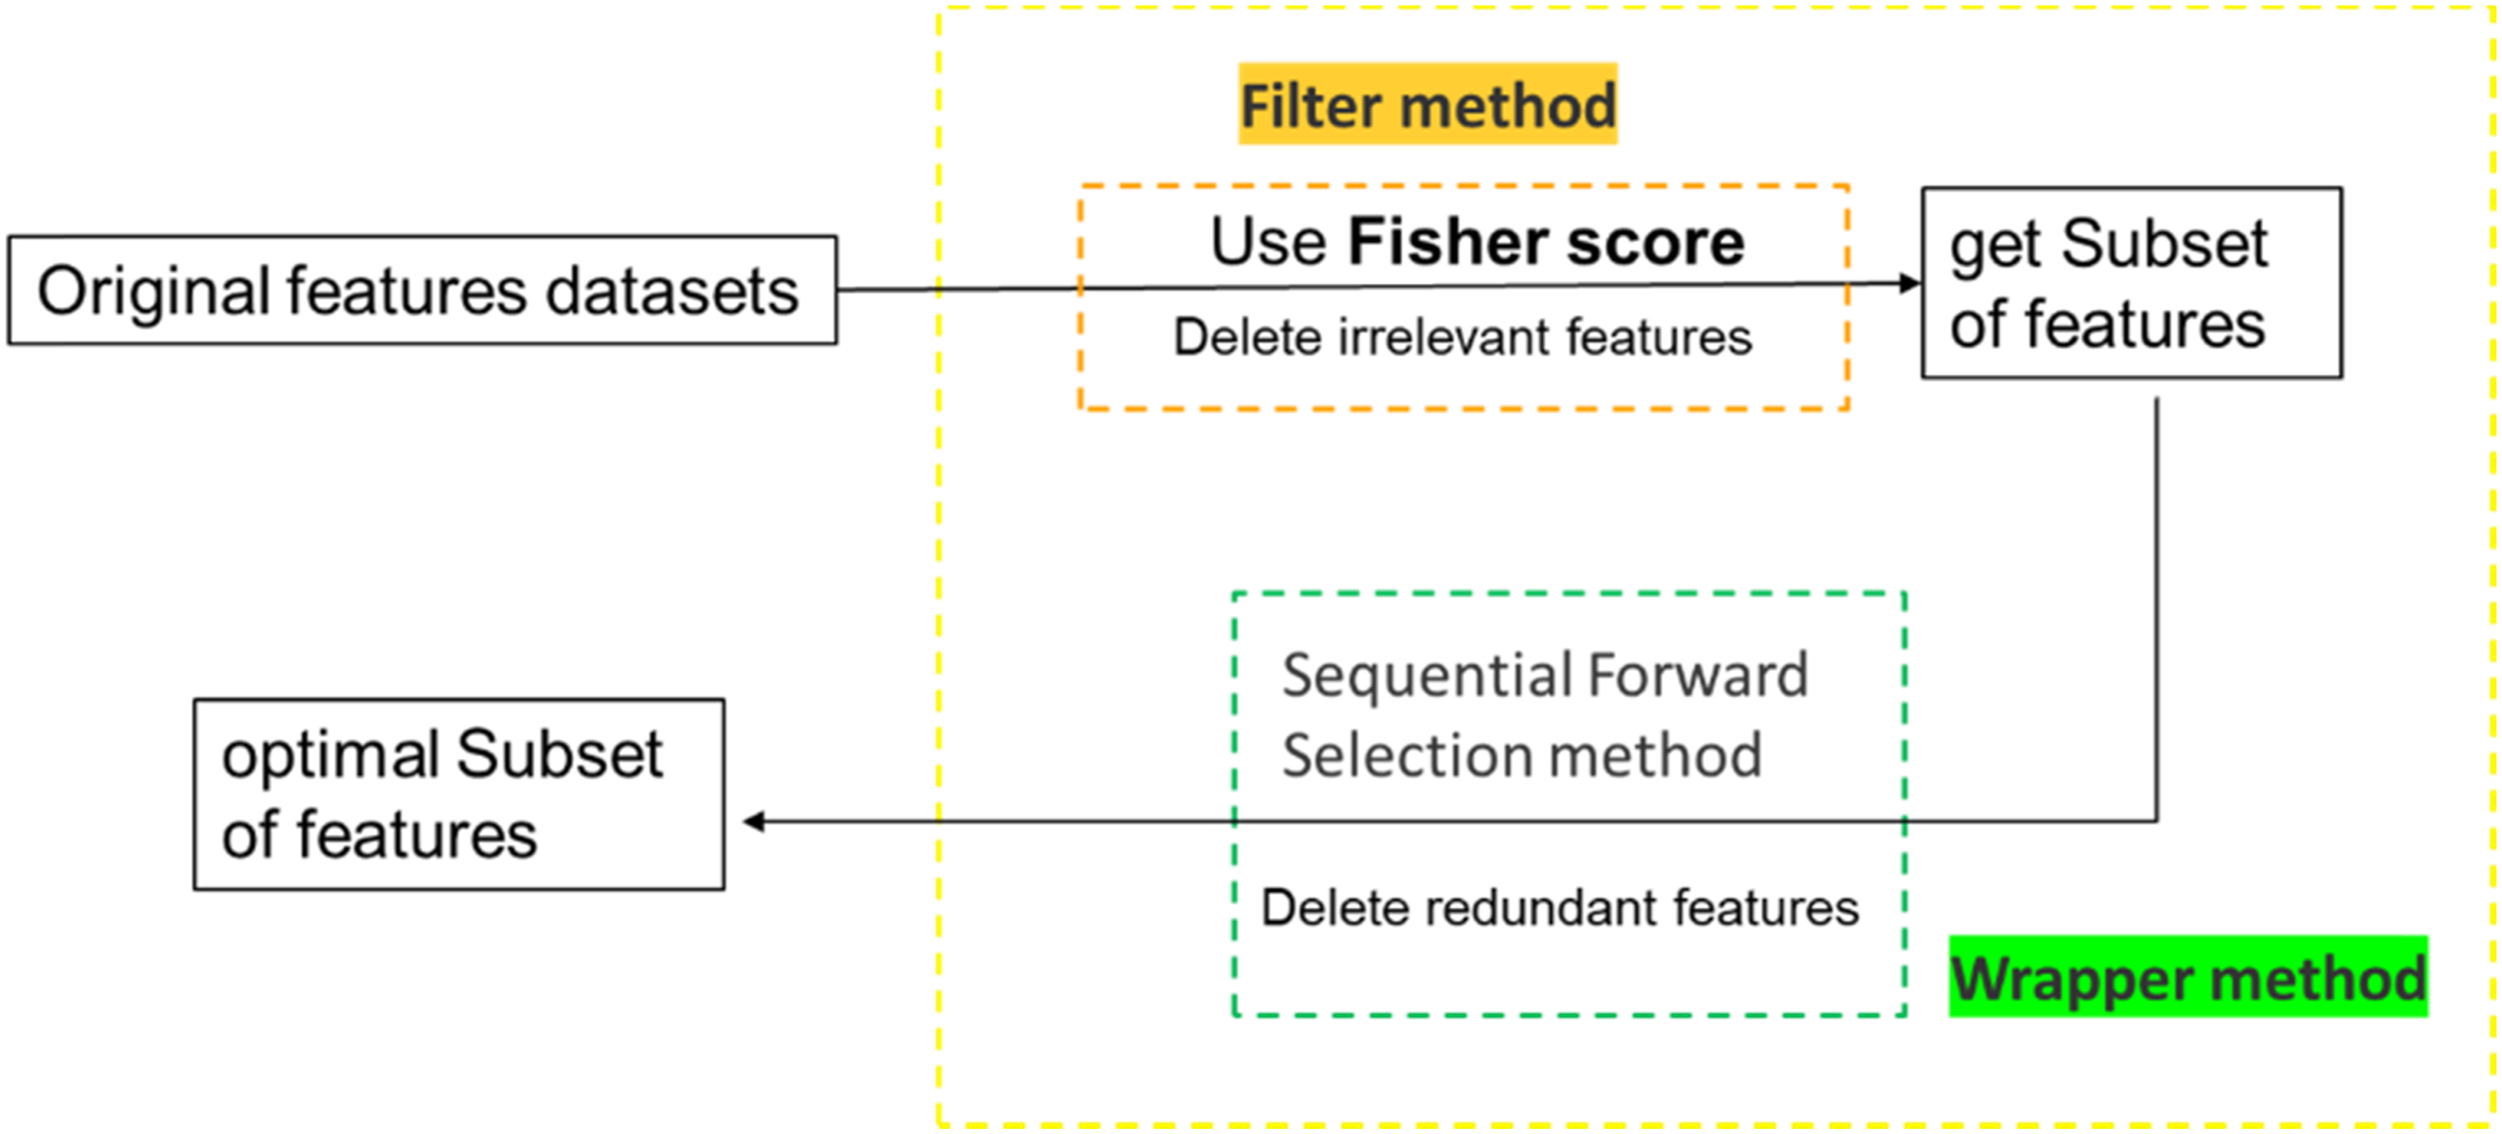
A proposed hybrid feature selection method is the combination of Fisher score (FS) and sequential forward selection (SFS) method, and it aims to select more important features from all the features for SVM models for journal bearing diagnosis. Procedures of diagnosis by SVM method and proposed hybrid feature selection method are shown in Figure 2 and Figure 3. Here are the steps in detail: Diagnosis procedure using SVM method. Procedure of proposed feature selection method.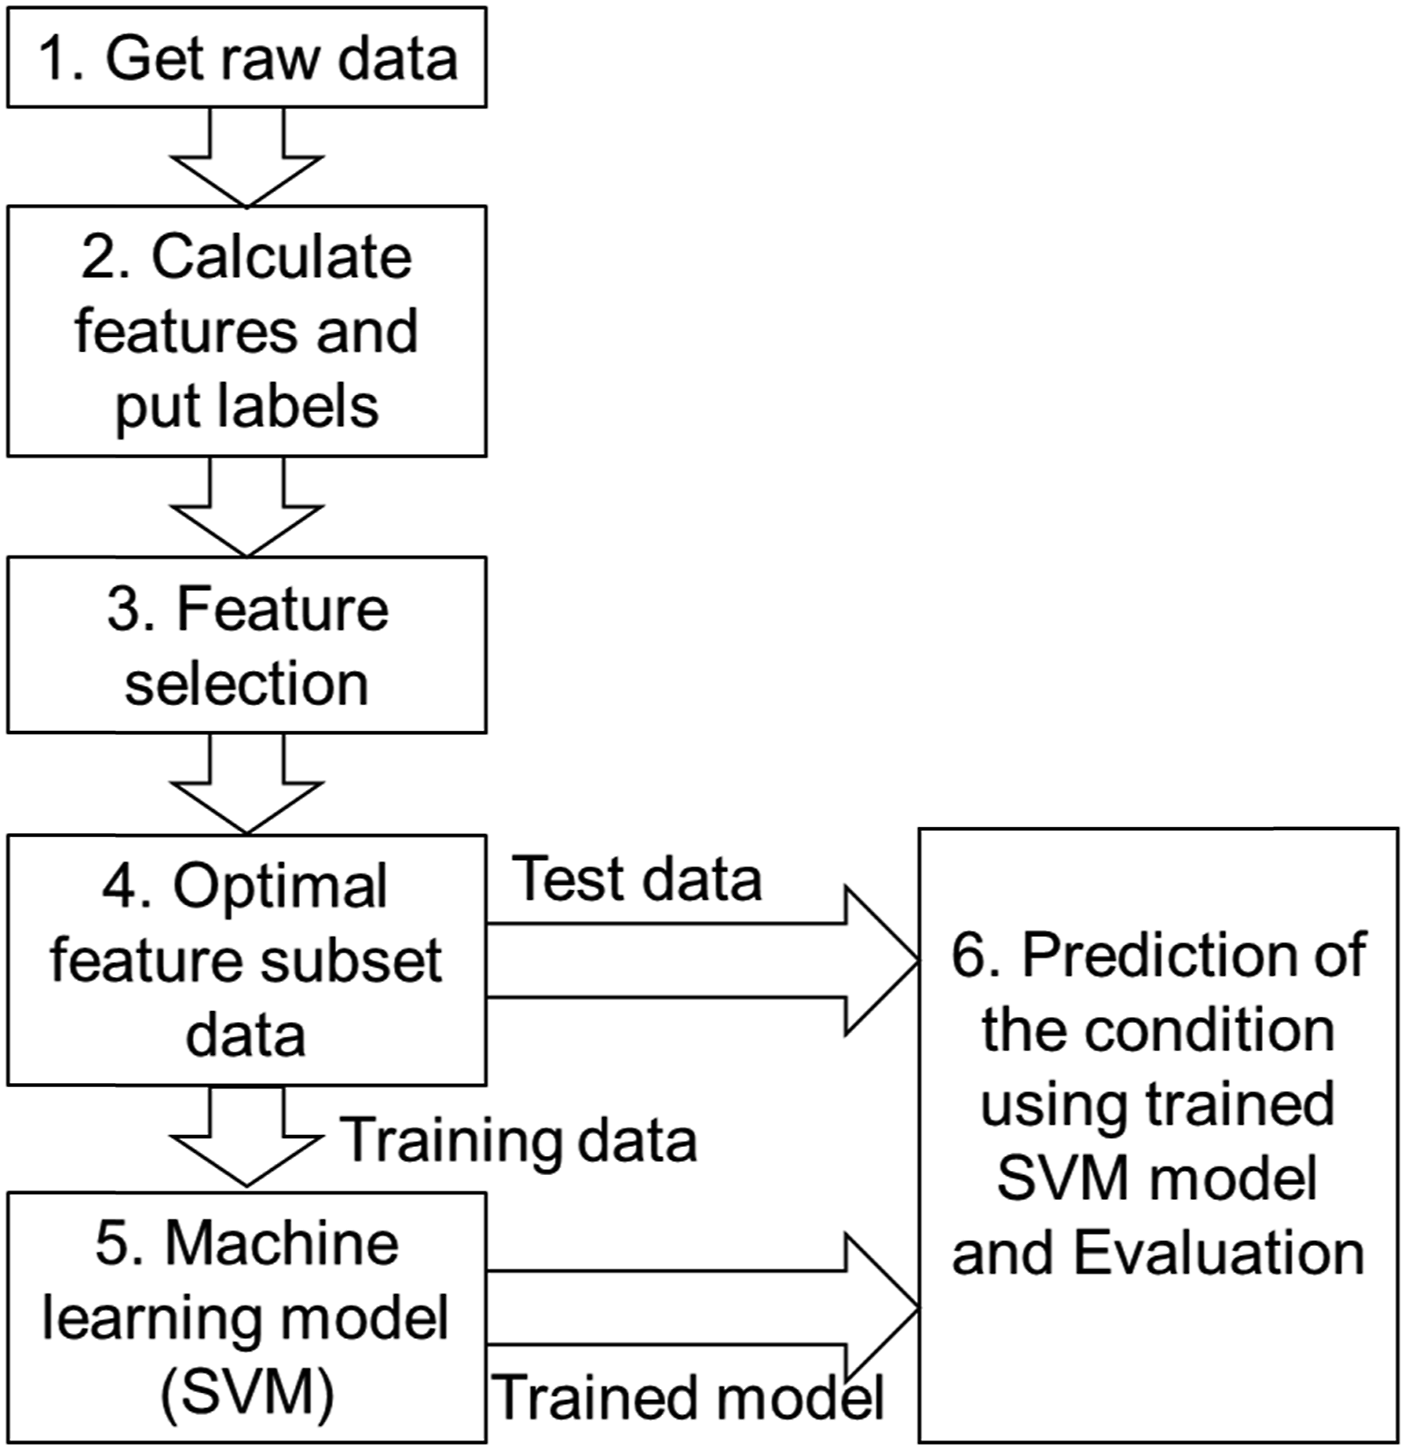
(a) Get raw data from experiments.
(b) Feature generation (calculating features including features in time domain, frequency domain…) and put labels according to the experimental records.
(c) Feature selection: first using Fisher score method to delete the irrelevant features, then using SFS method to delete redundant features.
(d) Dividing data into training dataset and test dataset.
(e) Model training: inputting training dataset and corresponded labels to train SVM model (including kernel function selection).
(f) Model prediction: use the test dataset and trained model to make prediction.
(g) Evaluation: calculate the accuracy of the SVM model.
Experiment and data description
Test rigs and journal bearing description
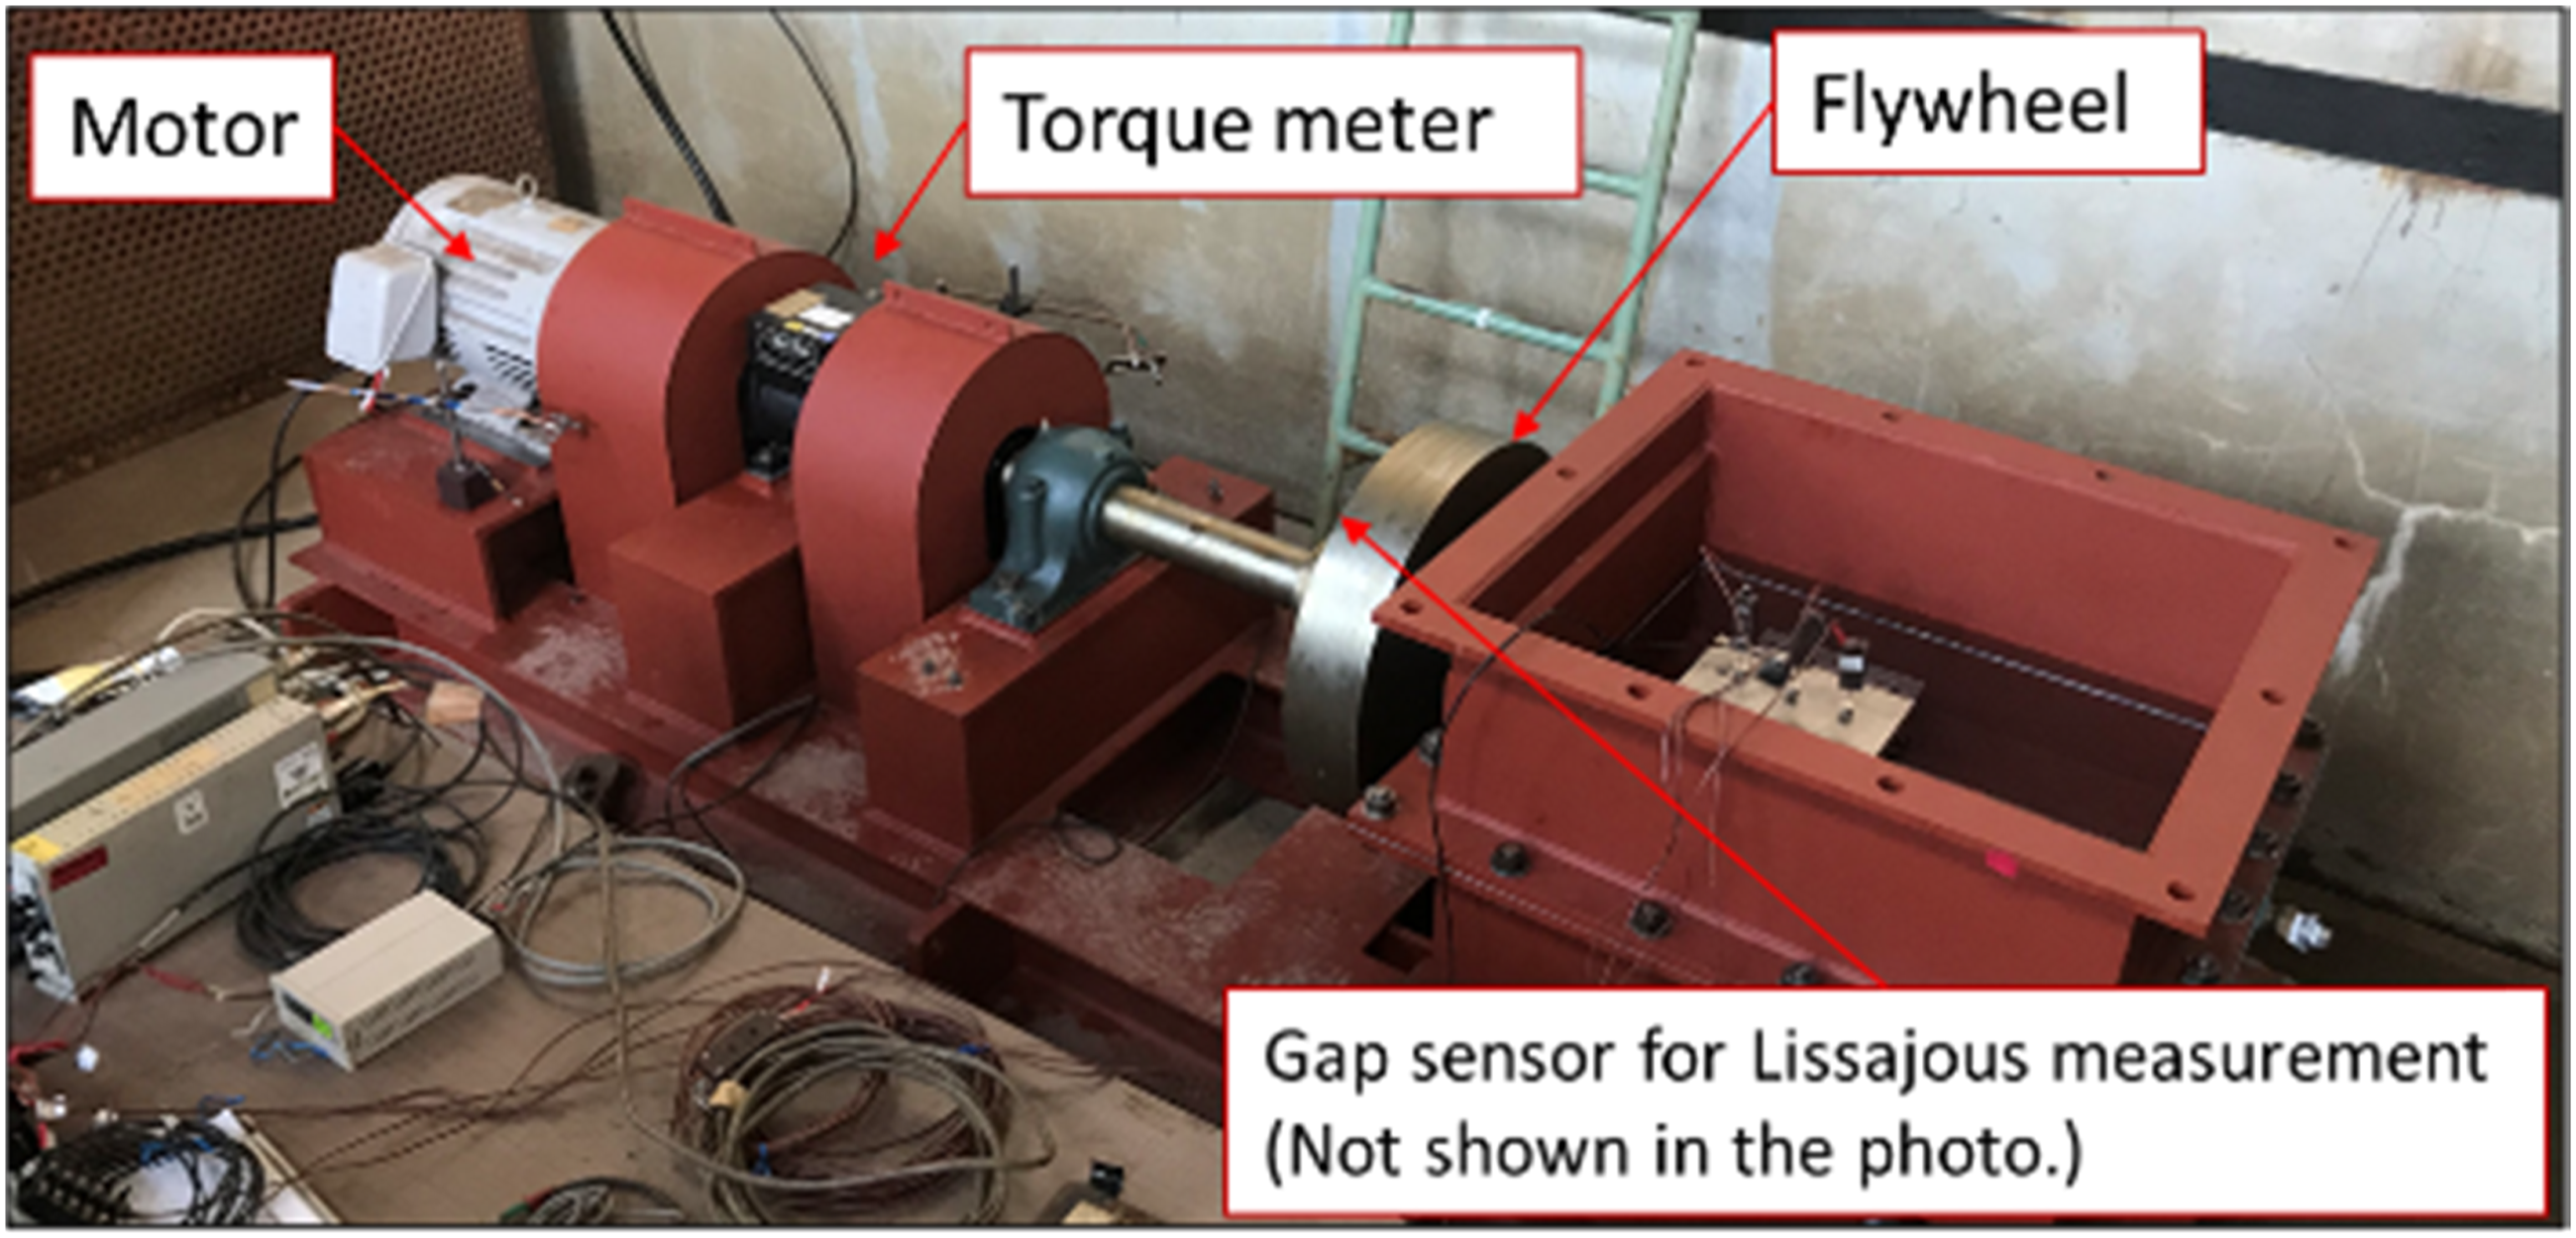
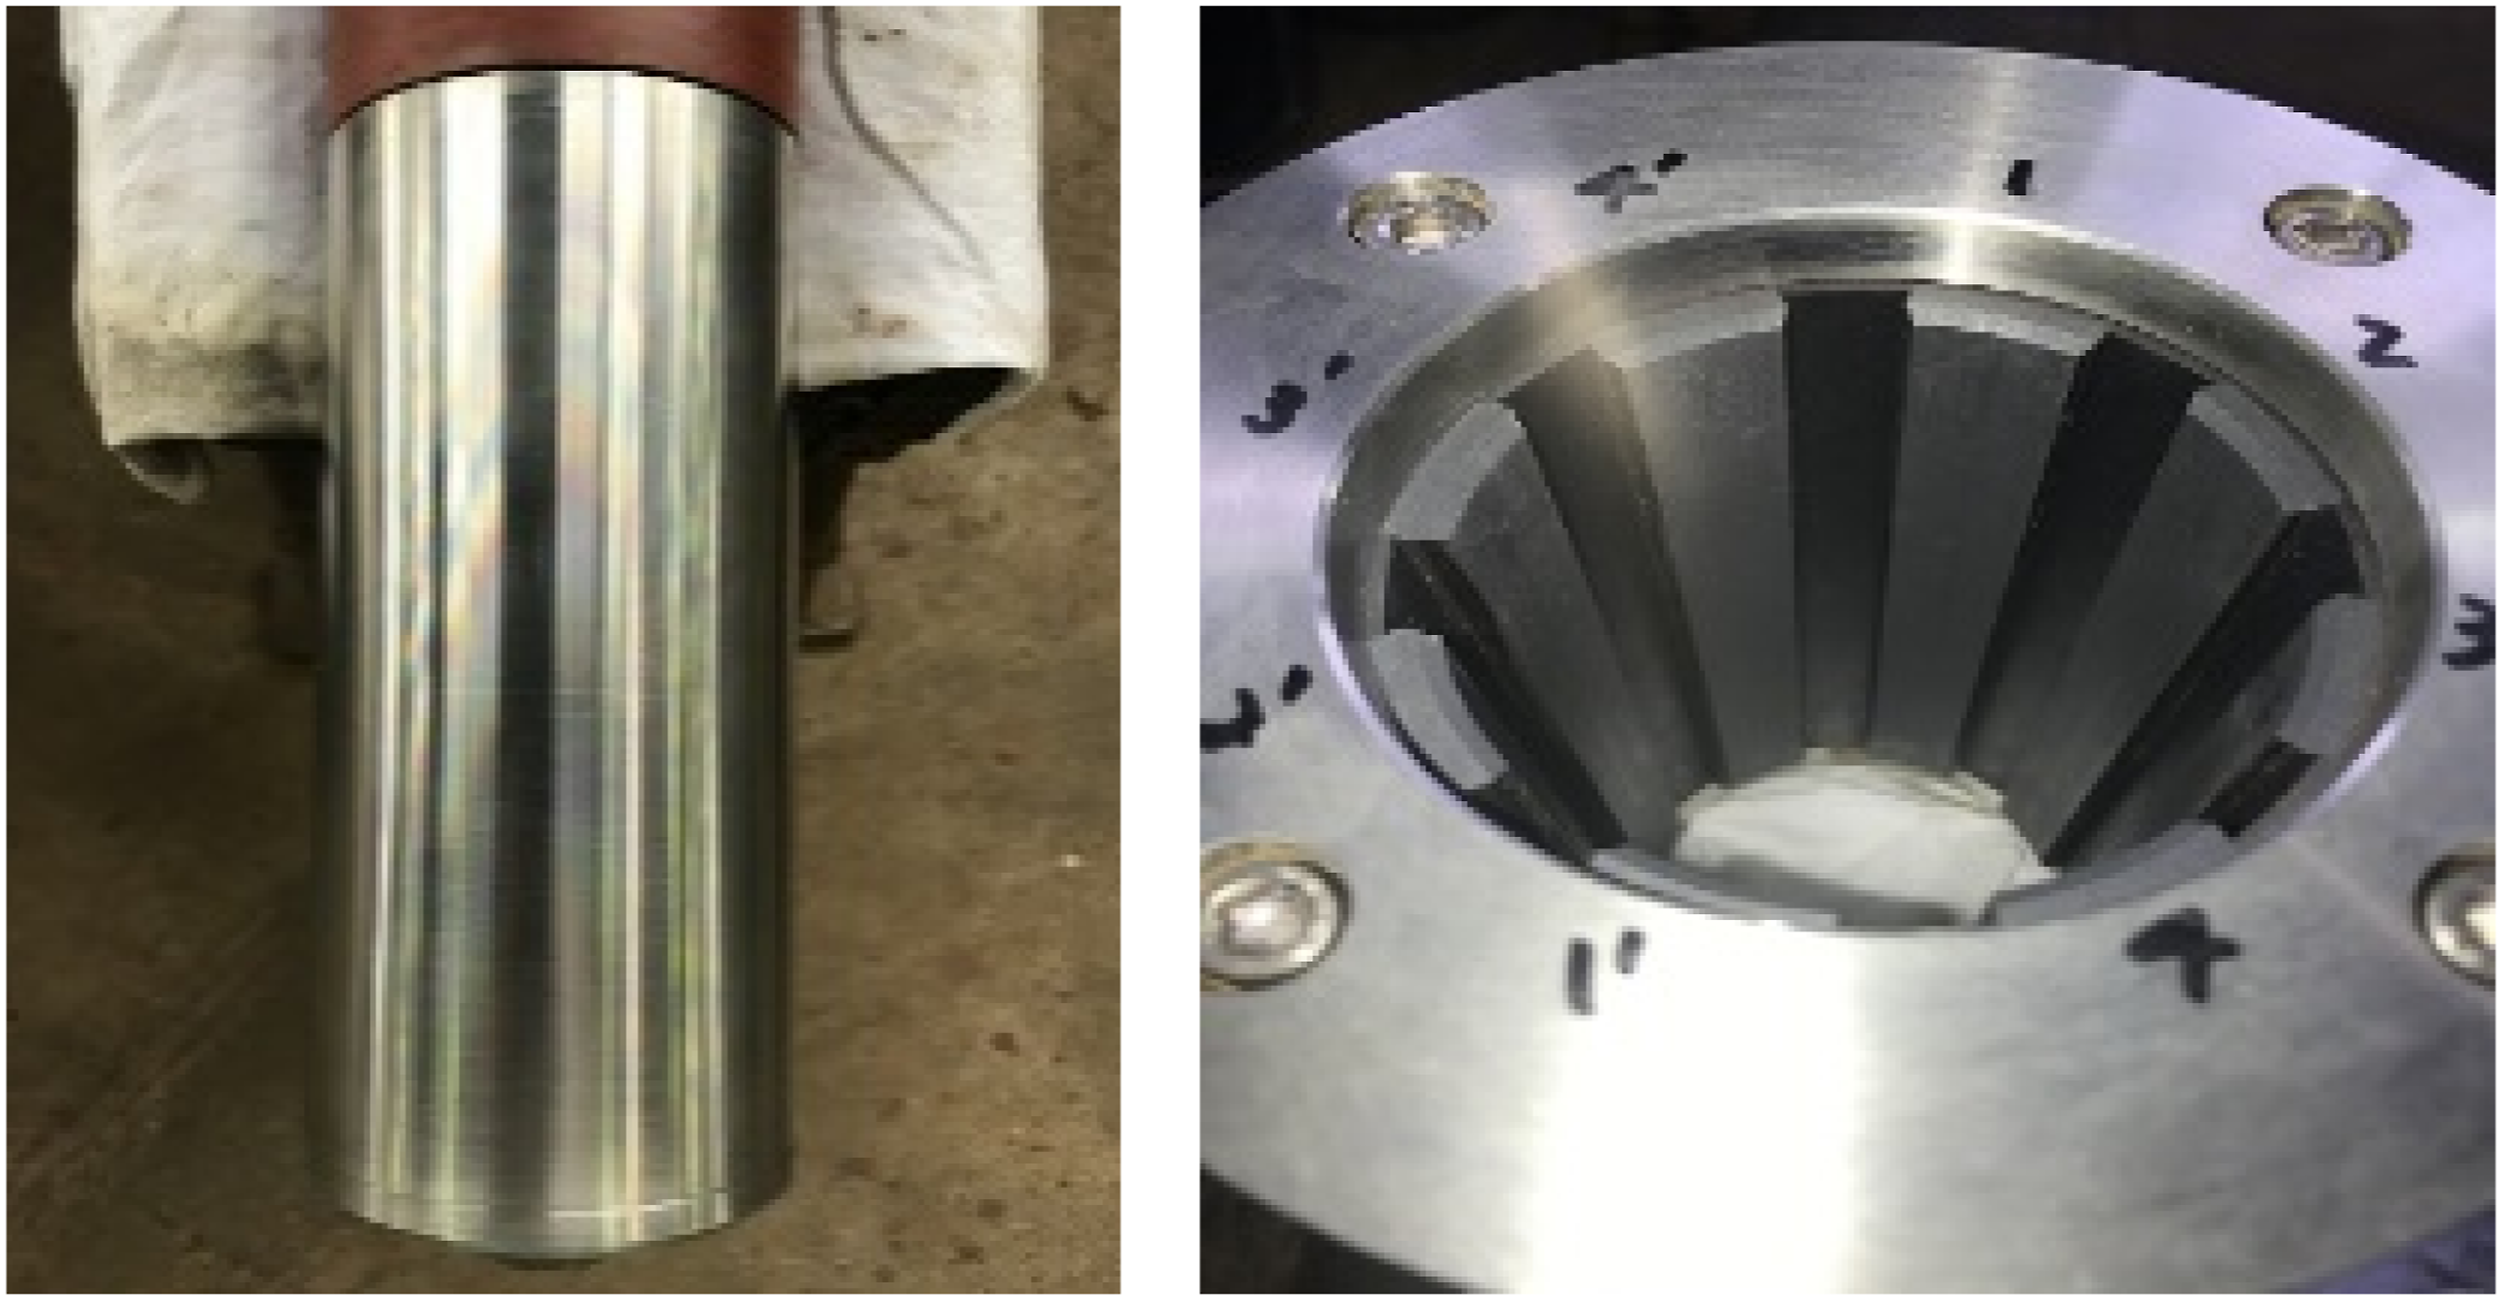
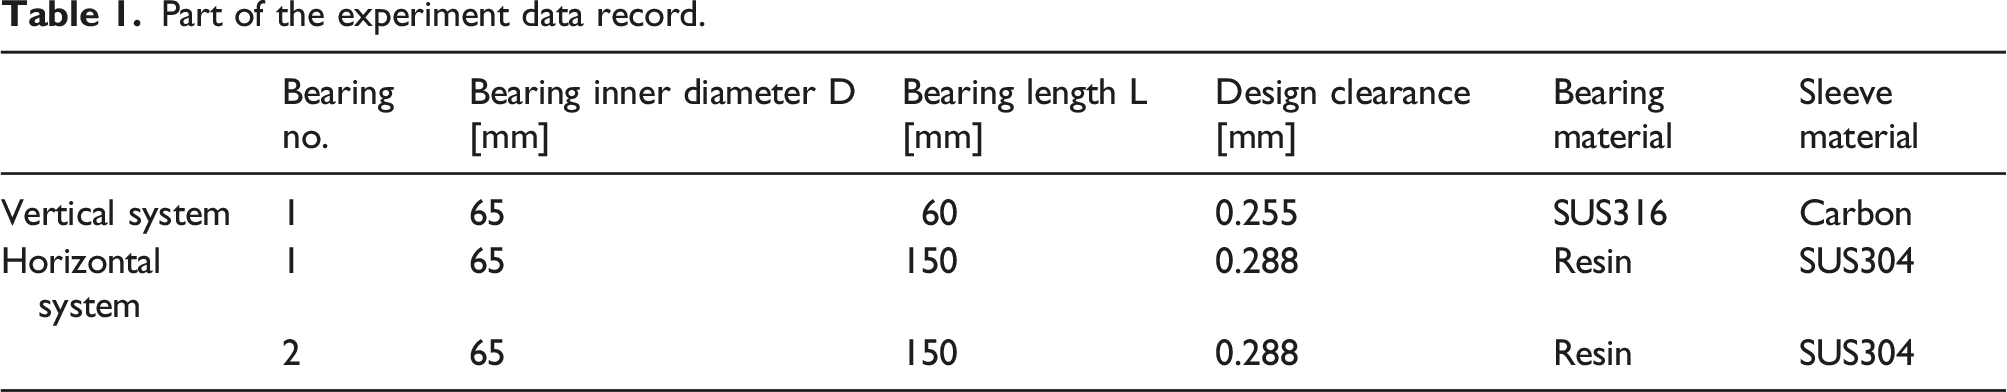
The experimental equipment and experimental data of journal bearing with a little muddy water used in this study are explained in this section. Two experimental test rigs are used: the vertical and the horizontal rotor systems. These are shown in Figures 4–8. The parameter values of the journal bearings and test rigs parameters are shown in Table 1. Both systems were periodically stopped, and the damage was checked. Vertical rotor system. Testrig of vertical rotor system. Journal bearing part of vertical shaft. Horizontal rotor system setup. Journal bearing part of horizontal shaft. Part of the experiment data record.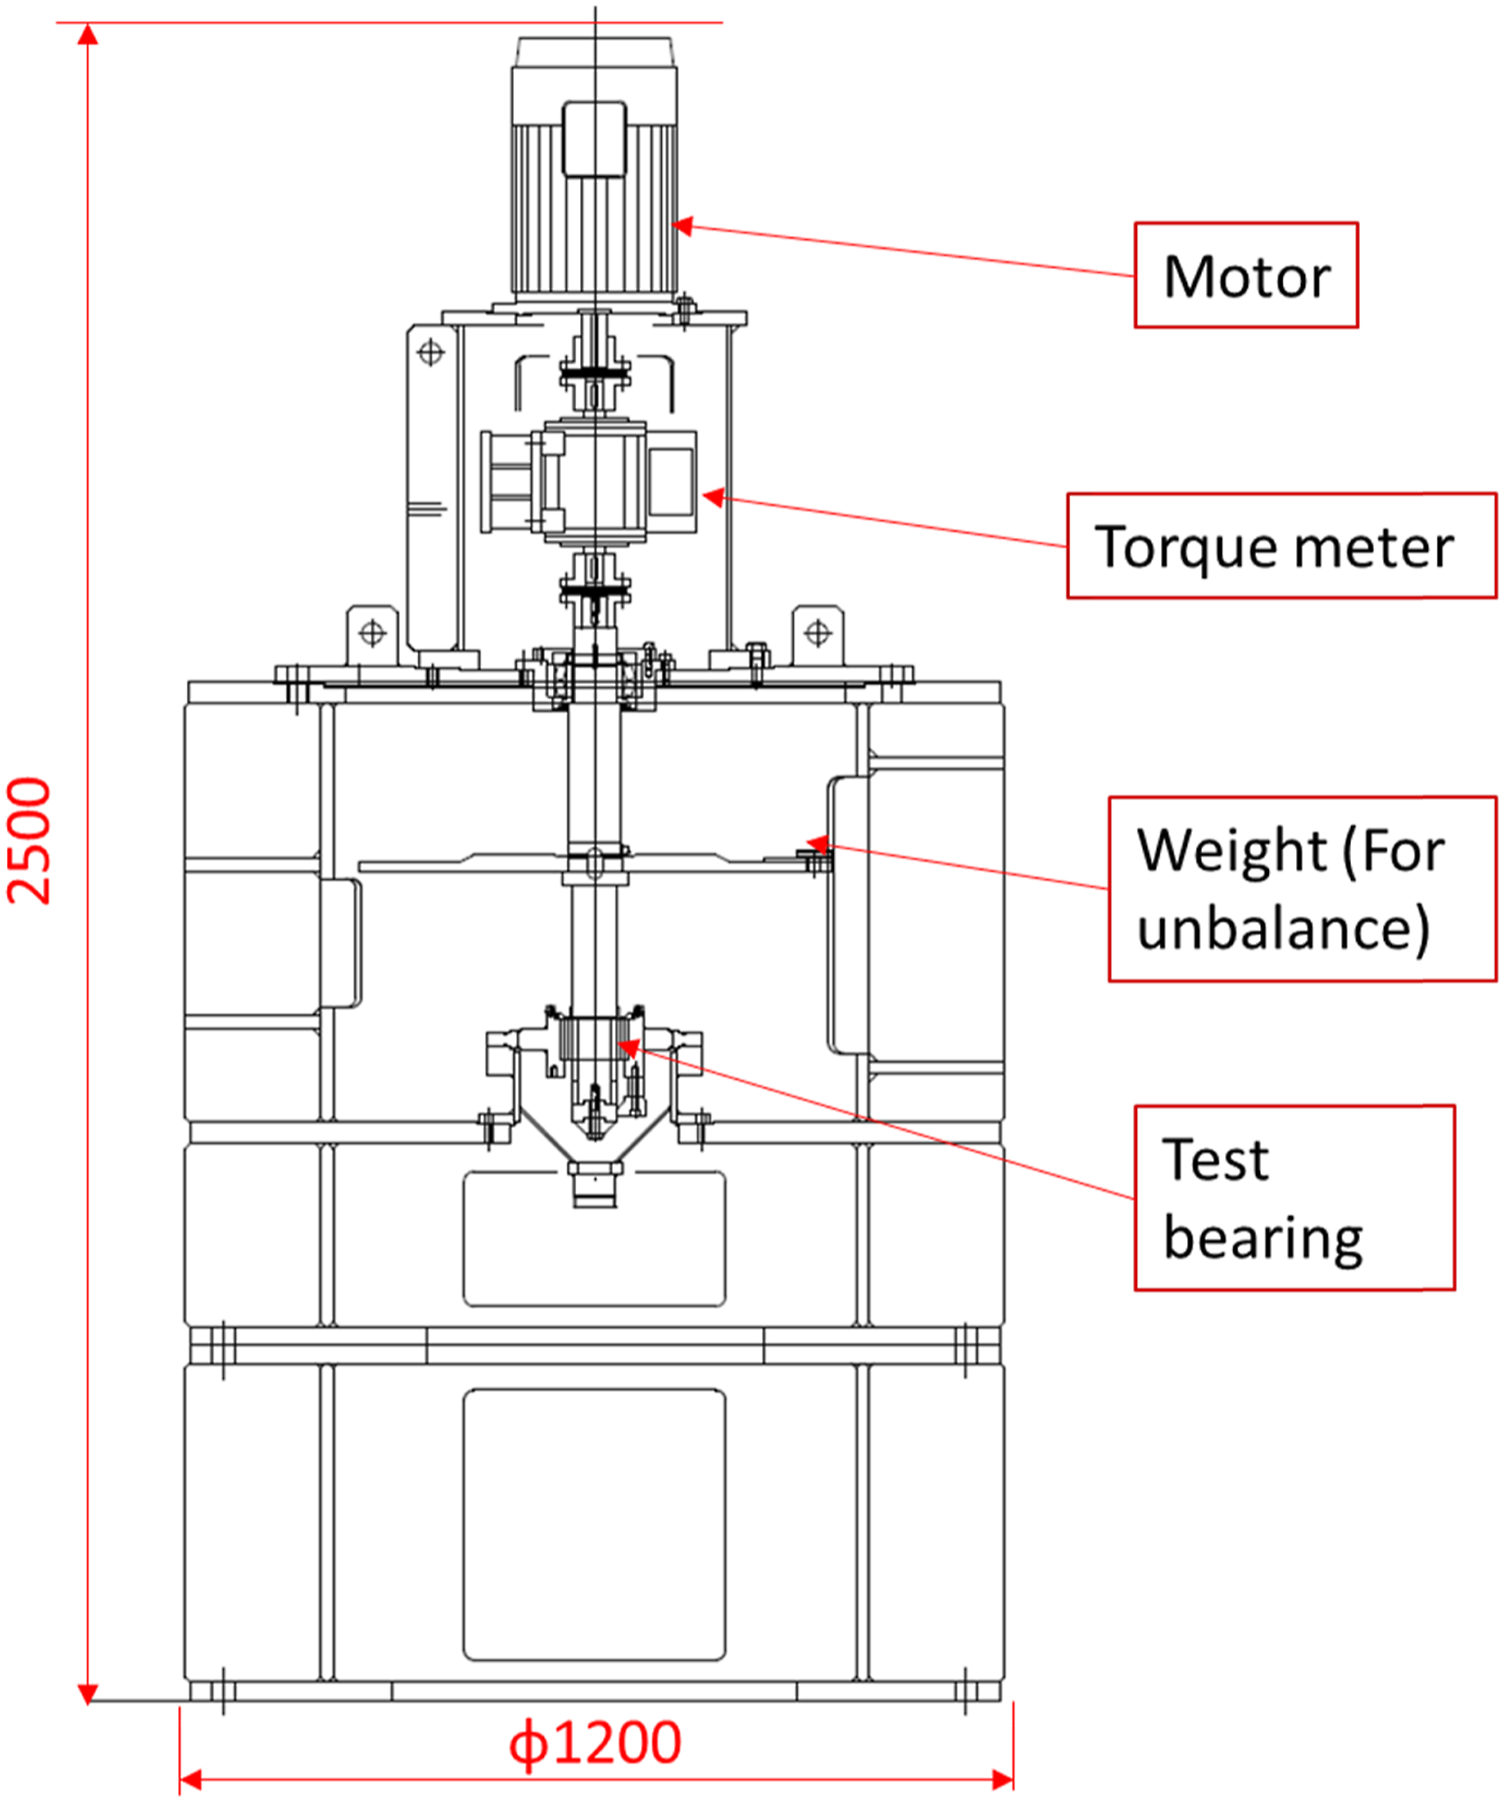
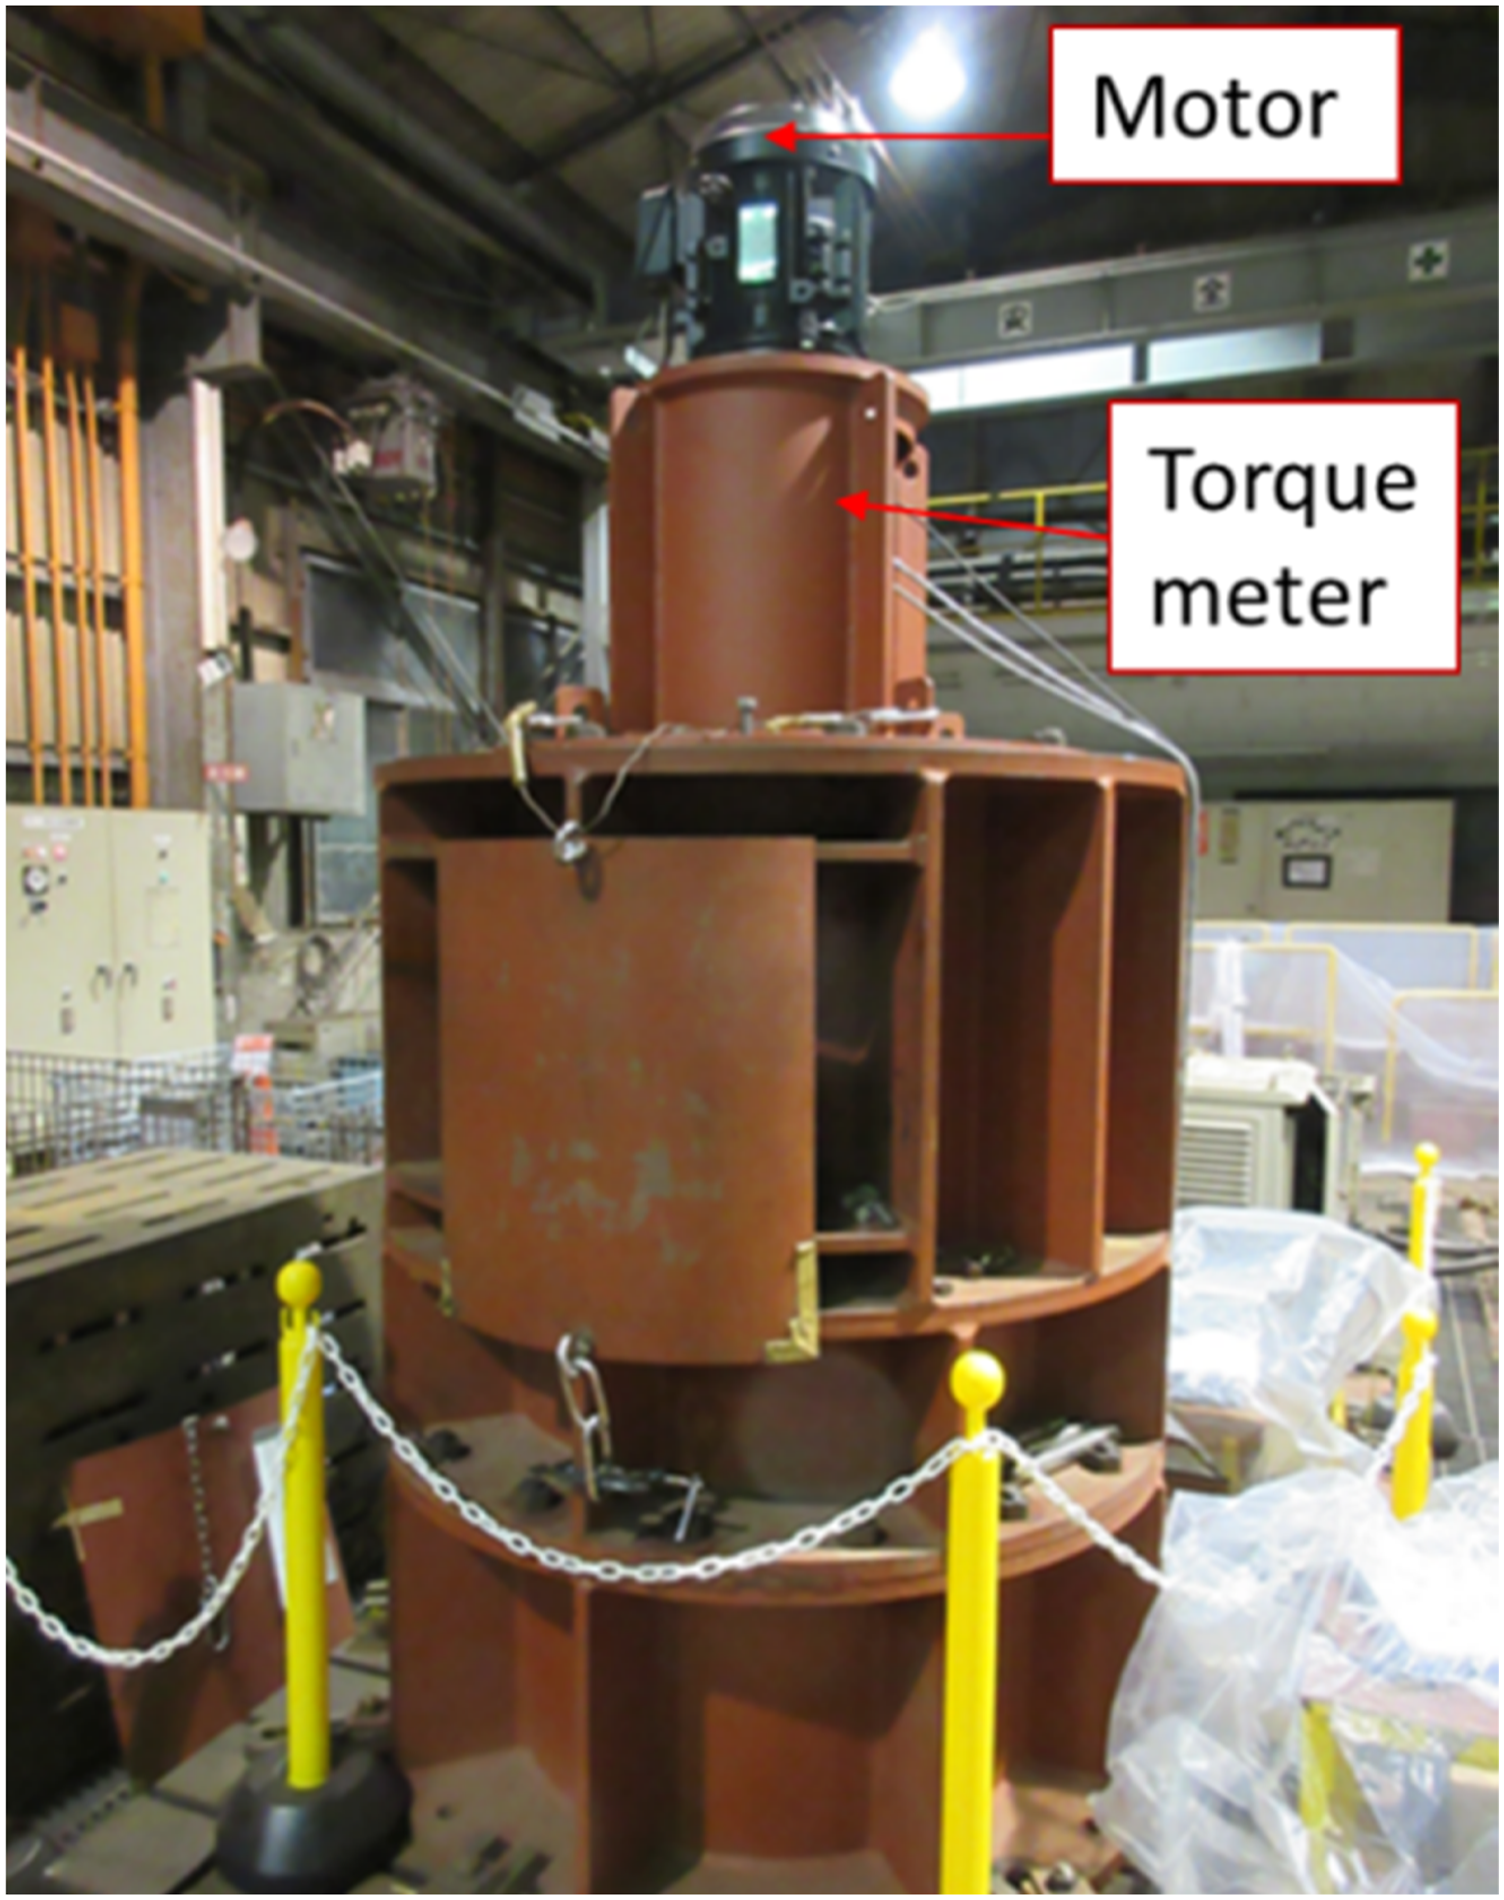
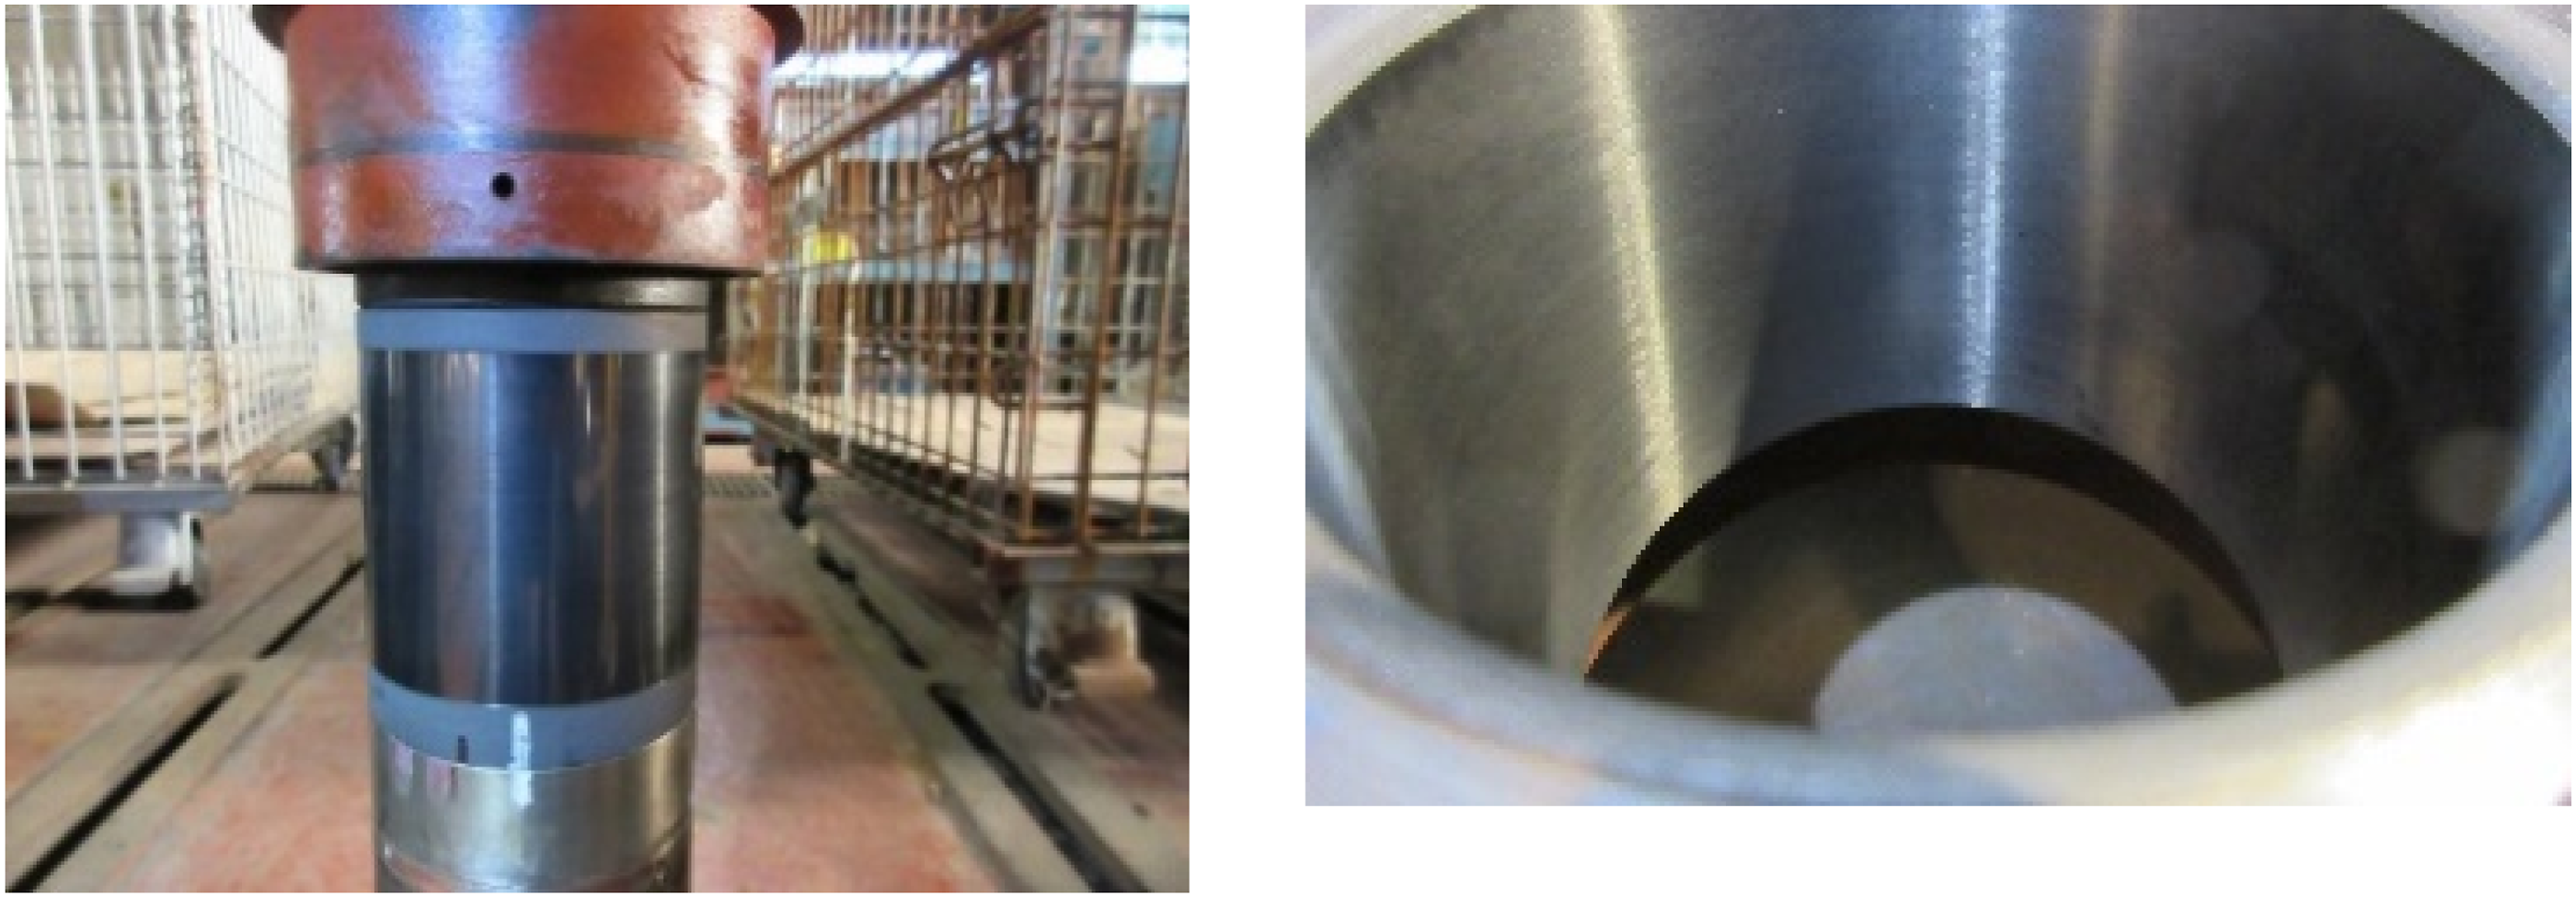
Figures 4 and 5 show the test rig of vertical rotor system. The shaft was driven by the motor attached at the upper end, and the lower end of the shaft was supported by the journal bearing. Figure 6 shows the shaft part and bearing part of the journal bearing. In the vertical rotor system experiment, the journal bearing has no obvious physical damage even after the long-term experiment with a little muddy water. Therefore, the obtained data was for only one journal bearing.
Figure 7 shows the test rig of horizontal rotor system. The shaft was driven by the motor attached at the one end of the shaft, and the other end of the shaft was supported by the journal bearing. Figure 8 shows the shaft part and bearing part of the journal bearing of horizontal shaft. In the horizontal axis experiment with a little muddy water, the vibration gradually changed, and the journal bearing was replaced due to wear and peeling. Therefore, data for two journal bearings were obtained.
Vertical rotor system
Horizontal rotor system
Experimental data statement
Vertical rotor system
Rotation speed ω: 1358 rpm (22 Hz).
Materials: Bearing SUS316, sleeve carbon.
Sampling: 3000Hz.
Sampling is performed every 36 s, each sampling time is 30 s, and the sampling frequency is 3kHz. Every file contains 30s’ data. The vertical rotor system experiment is carried out for 3 hours a day. In order to investigate the running condition effect, the data are classified in three groups: (1) at startup, (2) 1.5 h after the start of operation, and (3) before the stop of operation (3 h after the start of operation) and numbered them.
This 3h test was conducted for total 57 days (about 171h in total). However, the operating condition was still normal and the journal bearing is in good condition visually in periodic check. Figure 9 shows the signal of journal bearing temperature and torque. Some changes happened with the journal bearing temperature and the torque between 40h∼50 h (No.40–48) and after 100 hs’ running (No.89–128). Change of journal bearing temperature and torque in vertical rotor system.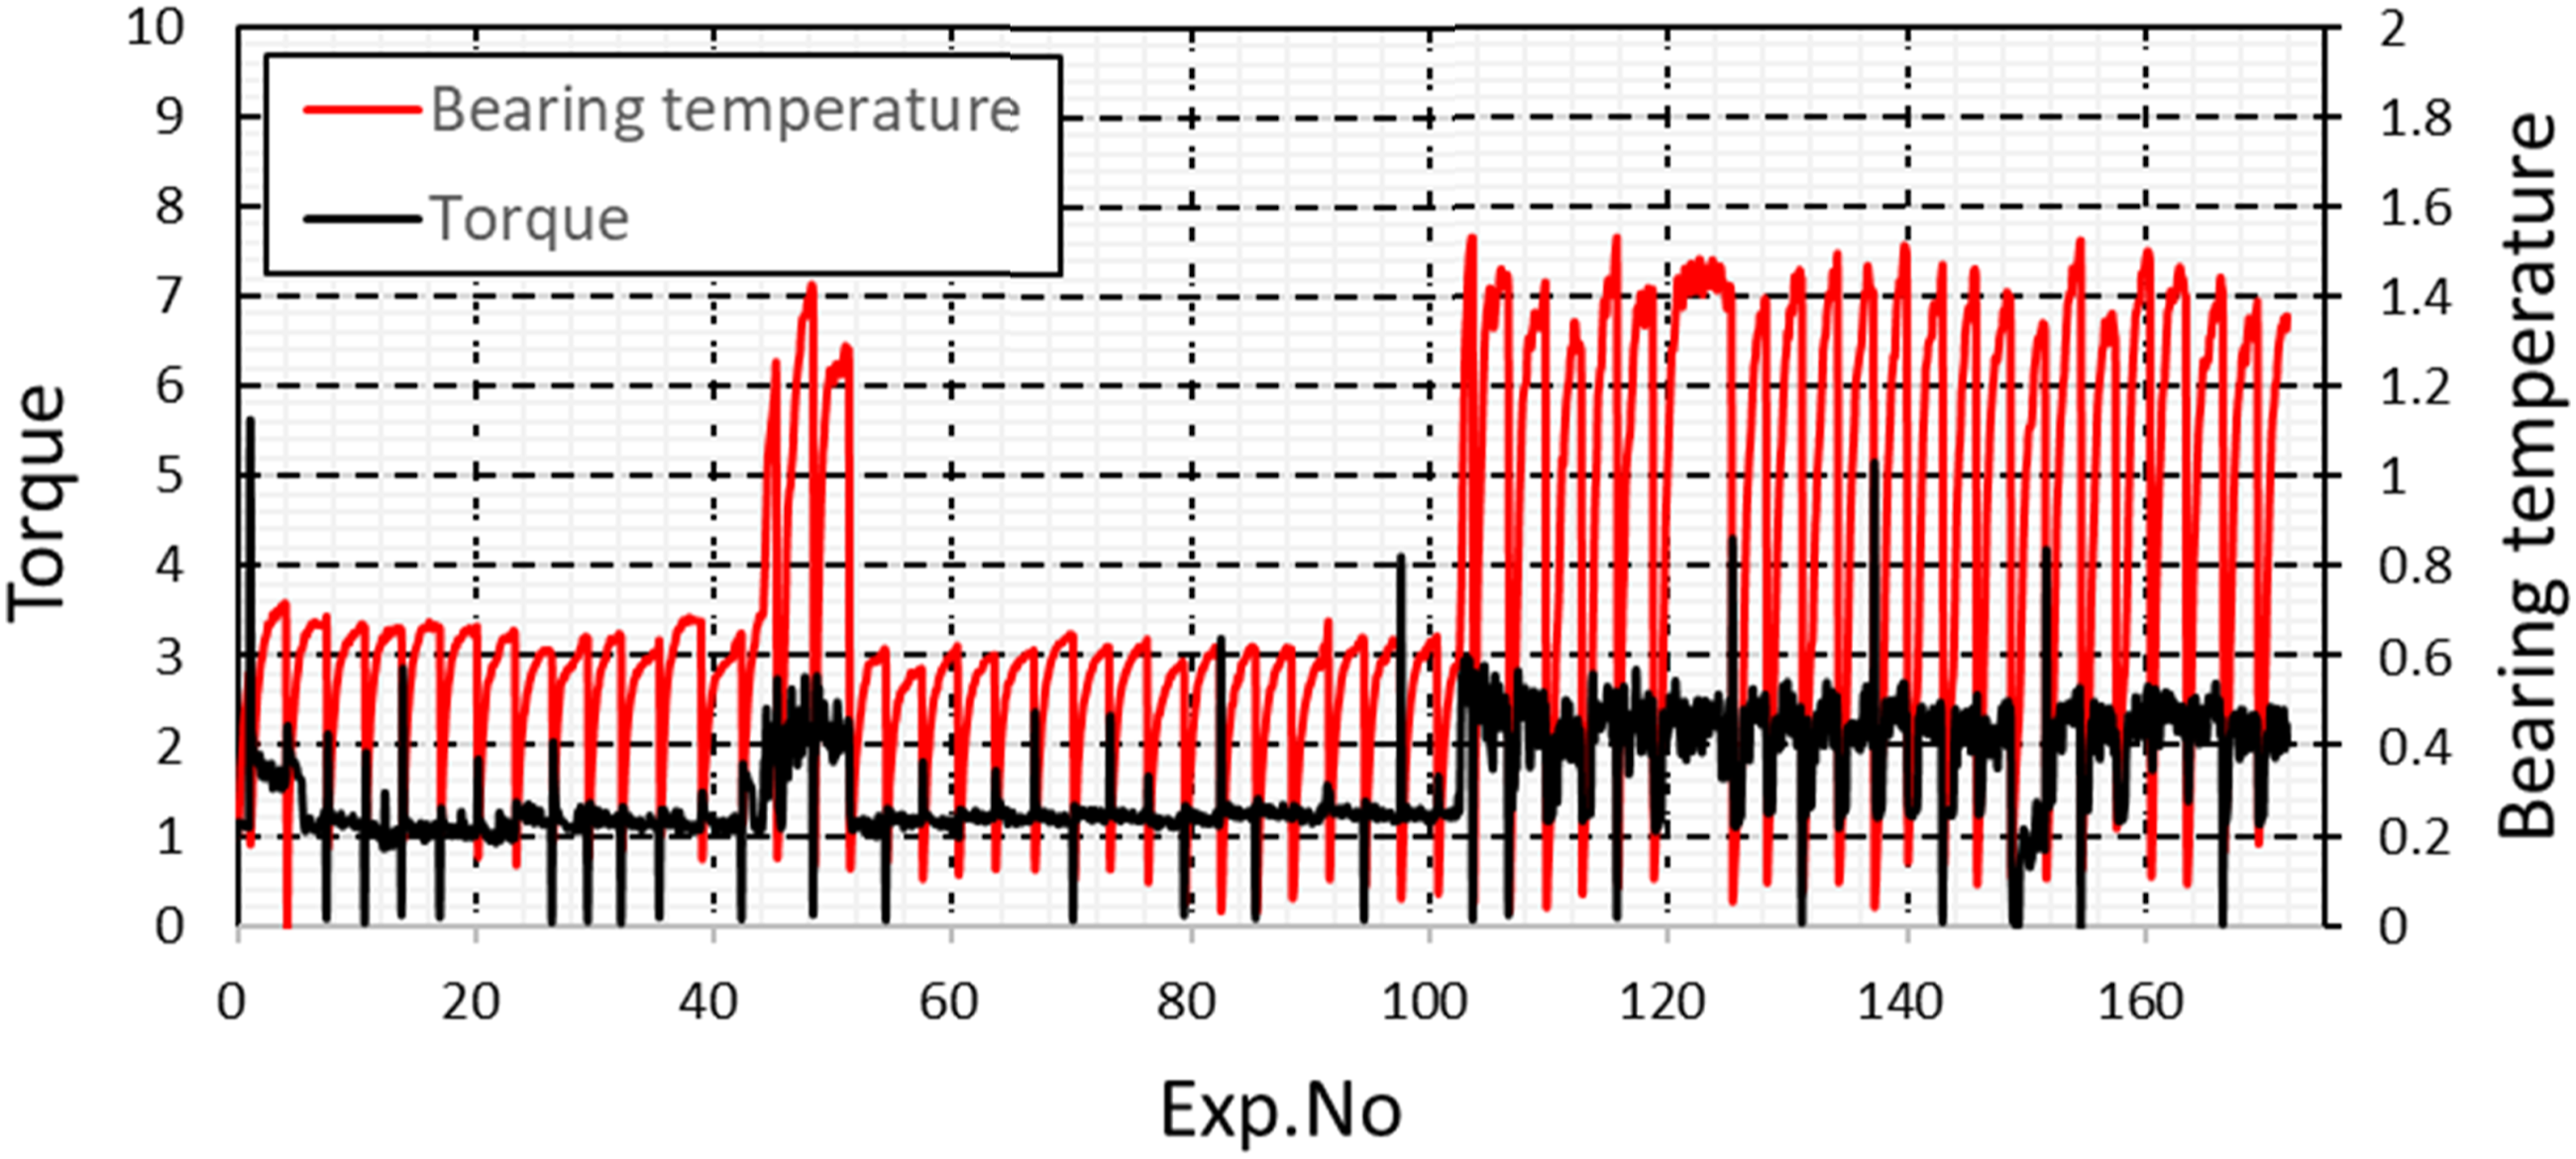
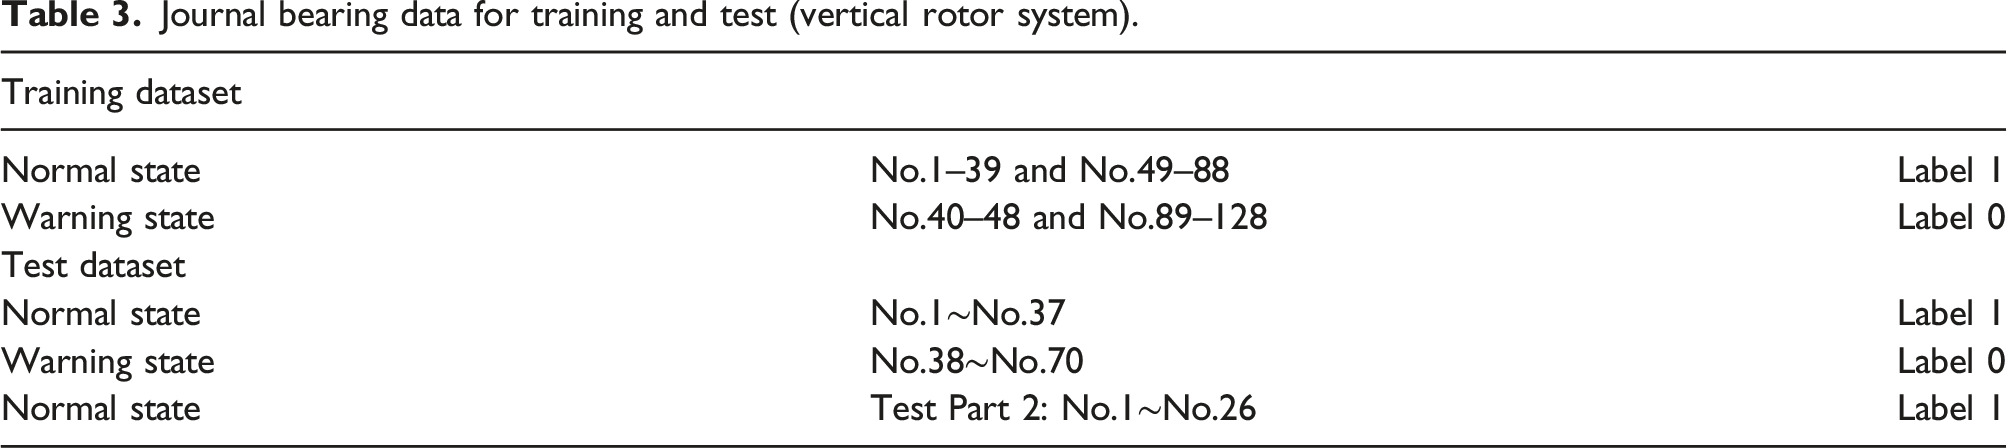
Training dataset for SVM modeling were data from No.1 to No.128 (1∼143h). Then, trained SVM model was tested. The test datasets are divided into two parts and numbered:
selected randomly from rest files collected in this period: 1h∼143h, No.1∼No.70
selected randomly from files collected in this period: 143h∼171h, No.1∼No.26
Horizontal rotor system
Rotation speed ω: 500 rpm (8.3 Hz).
Material: Bearing = Resin, shaft sleeve = SUS304.
Sampling: 1000Hz, 30s.
Except the sampling frequency, the data collection method of the horizontal system was similar to that of vertical system. During the use of the journal bearing 2, significant peeling was found after the data of No.15, which was the first periodic check. Figure 10 shows the change of journal bearing temperature, and it also indicates the change at around the data of No.15. Change of temperature in horizontal rotor system.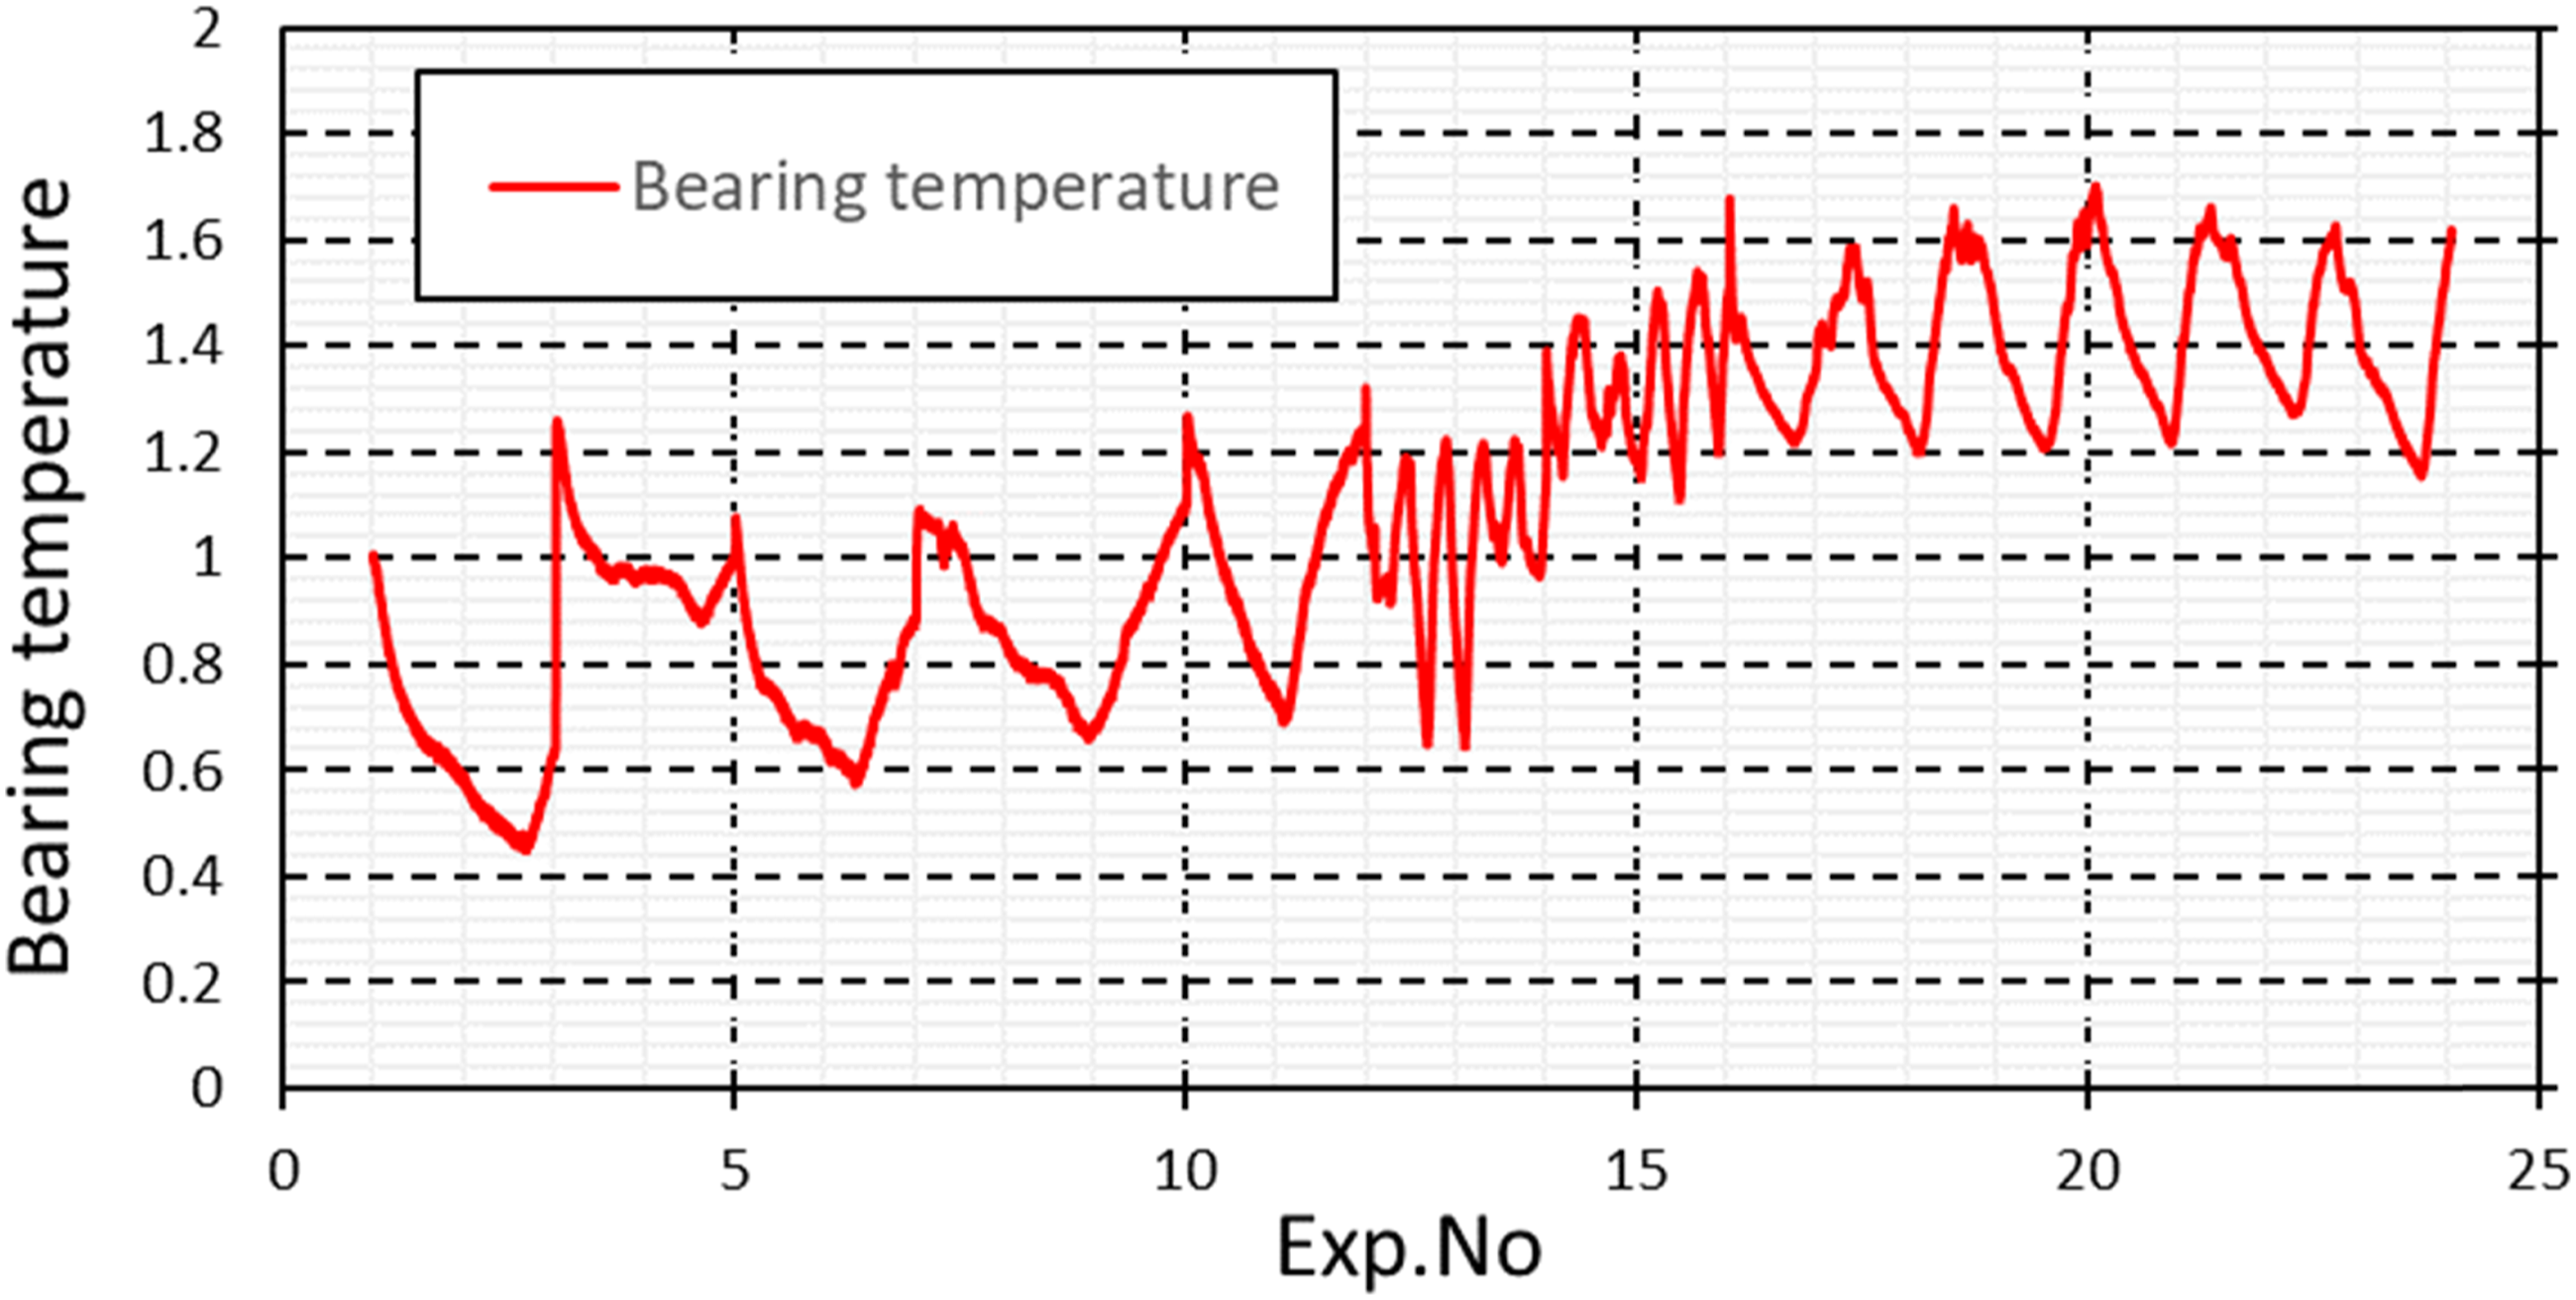
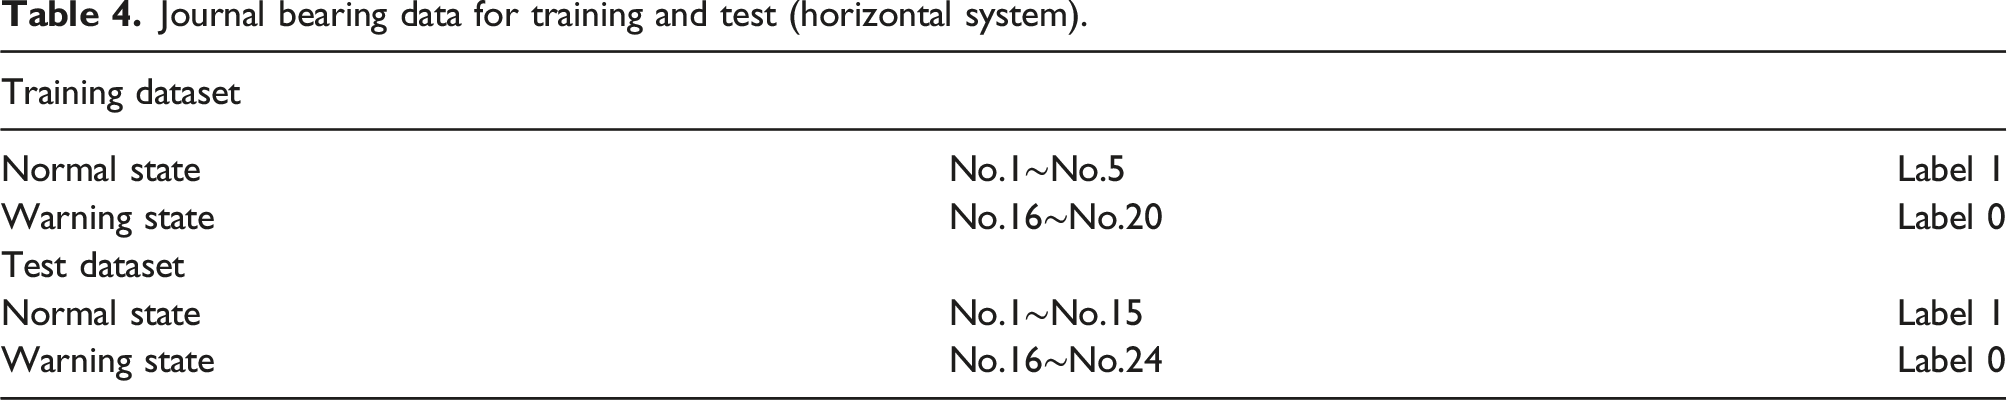
In the modeling of the SVM, data No. 1 to 15 were used as the data in normal condition and data No. 20 to 24 were used as warning condition. Then, the trained SVM model was tested using both the data No. 16 to 24 which was after peeling (labeled as warning data) and the data No. 1 to 15 which was before peeling (labeled as normal data).
Analysis of feature signals
Calculation of feature signals
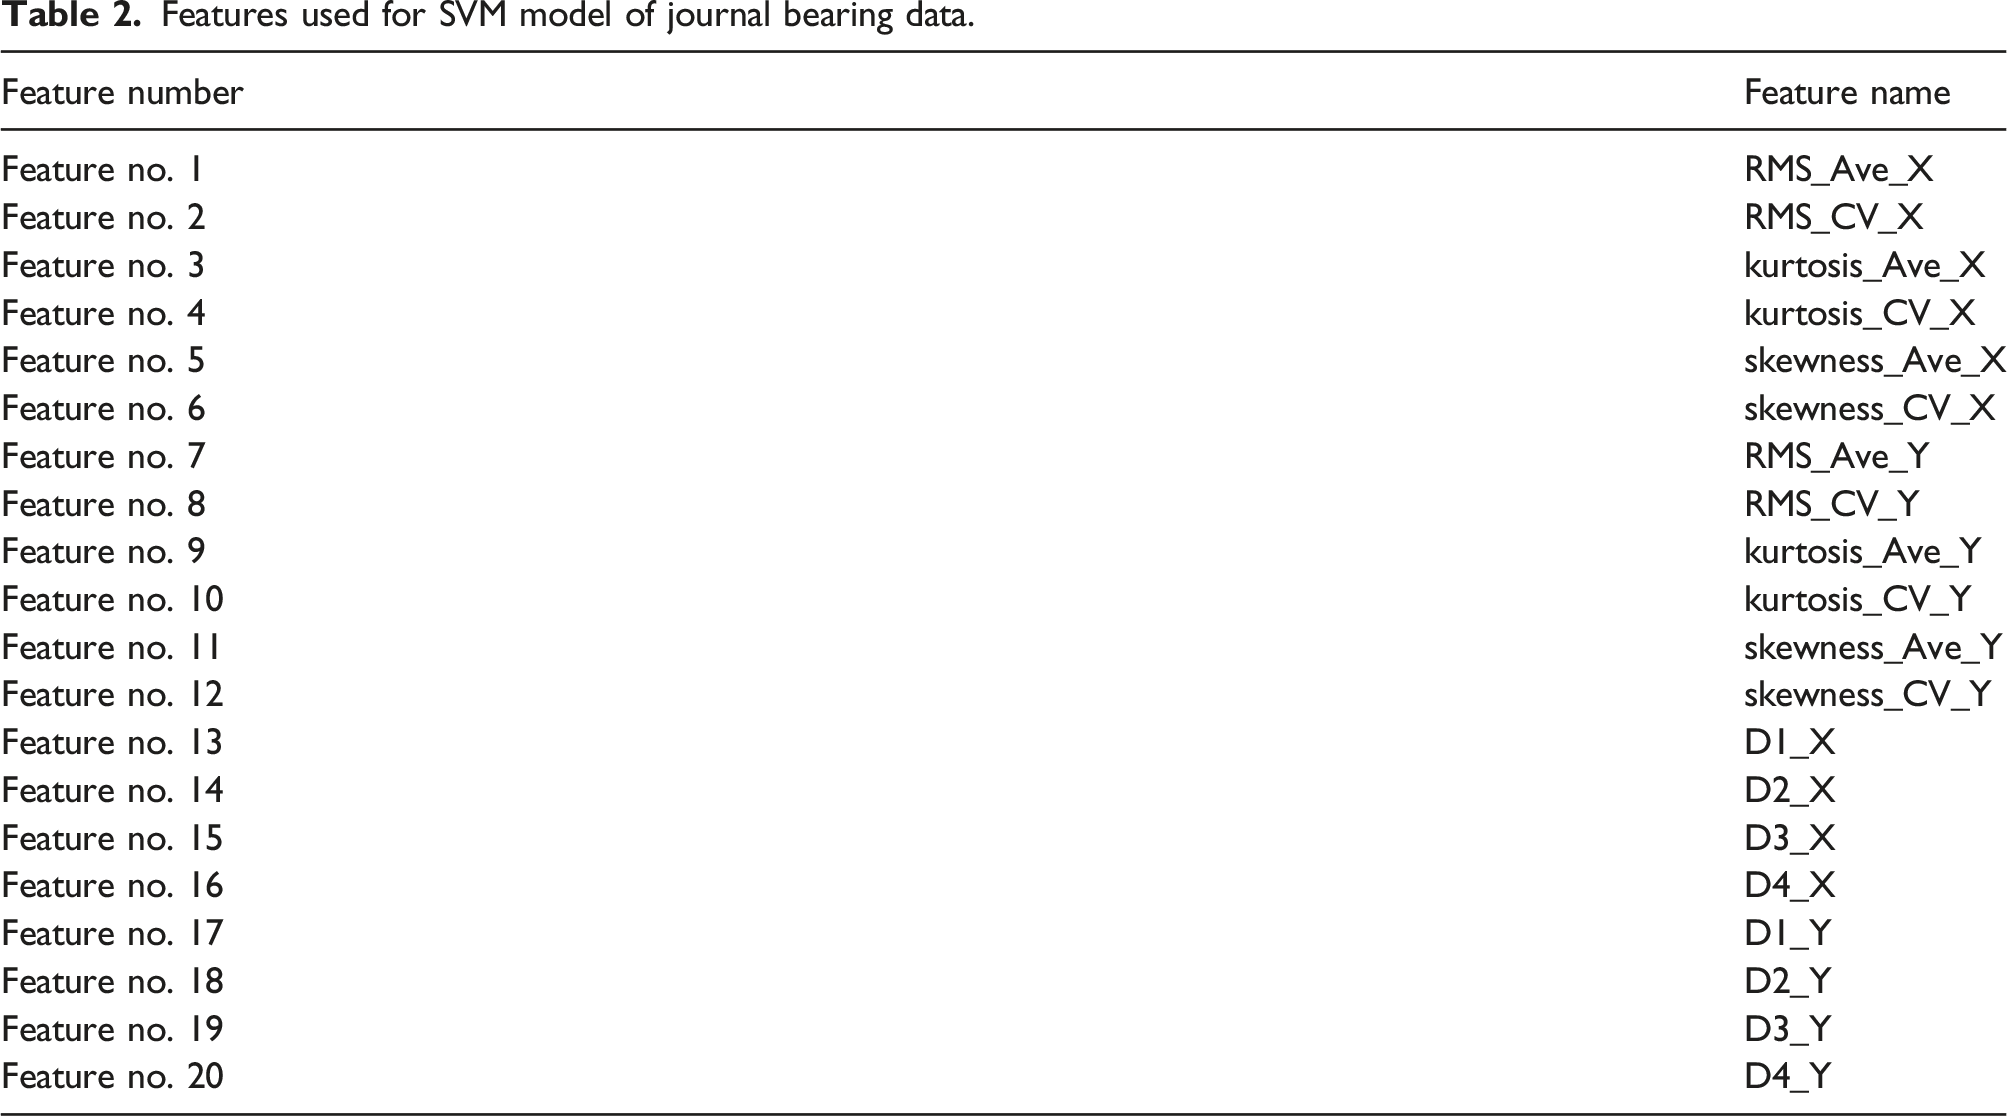
Features used for SVM model of journal bearing data.
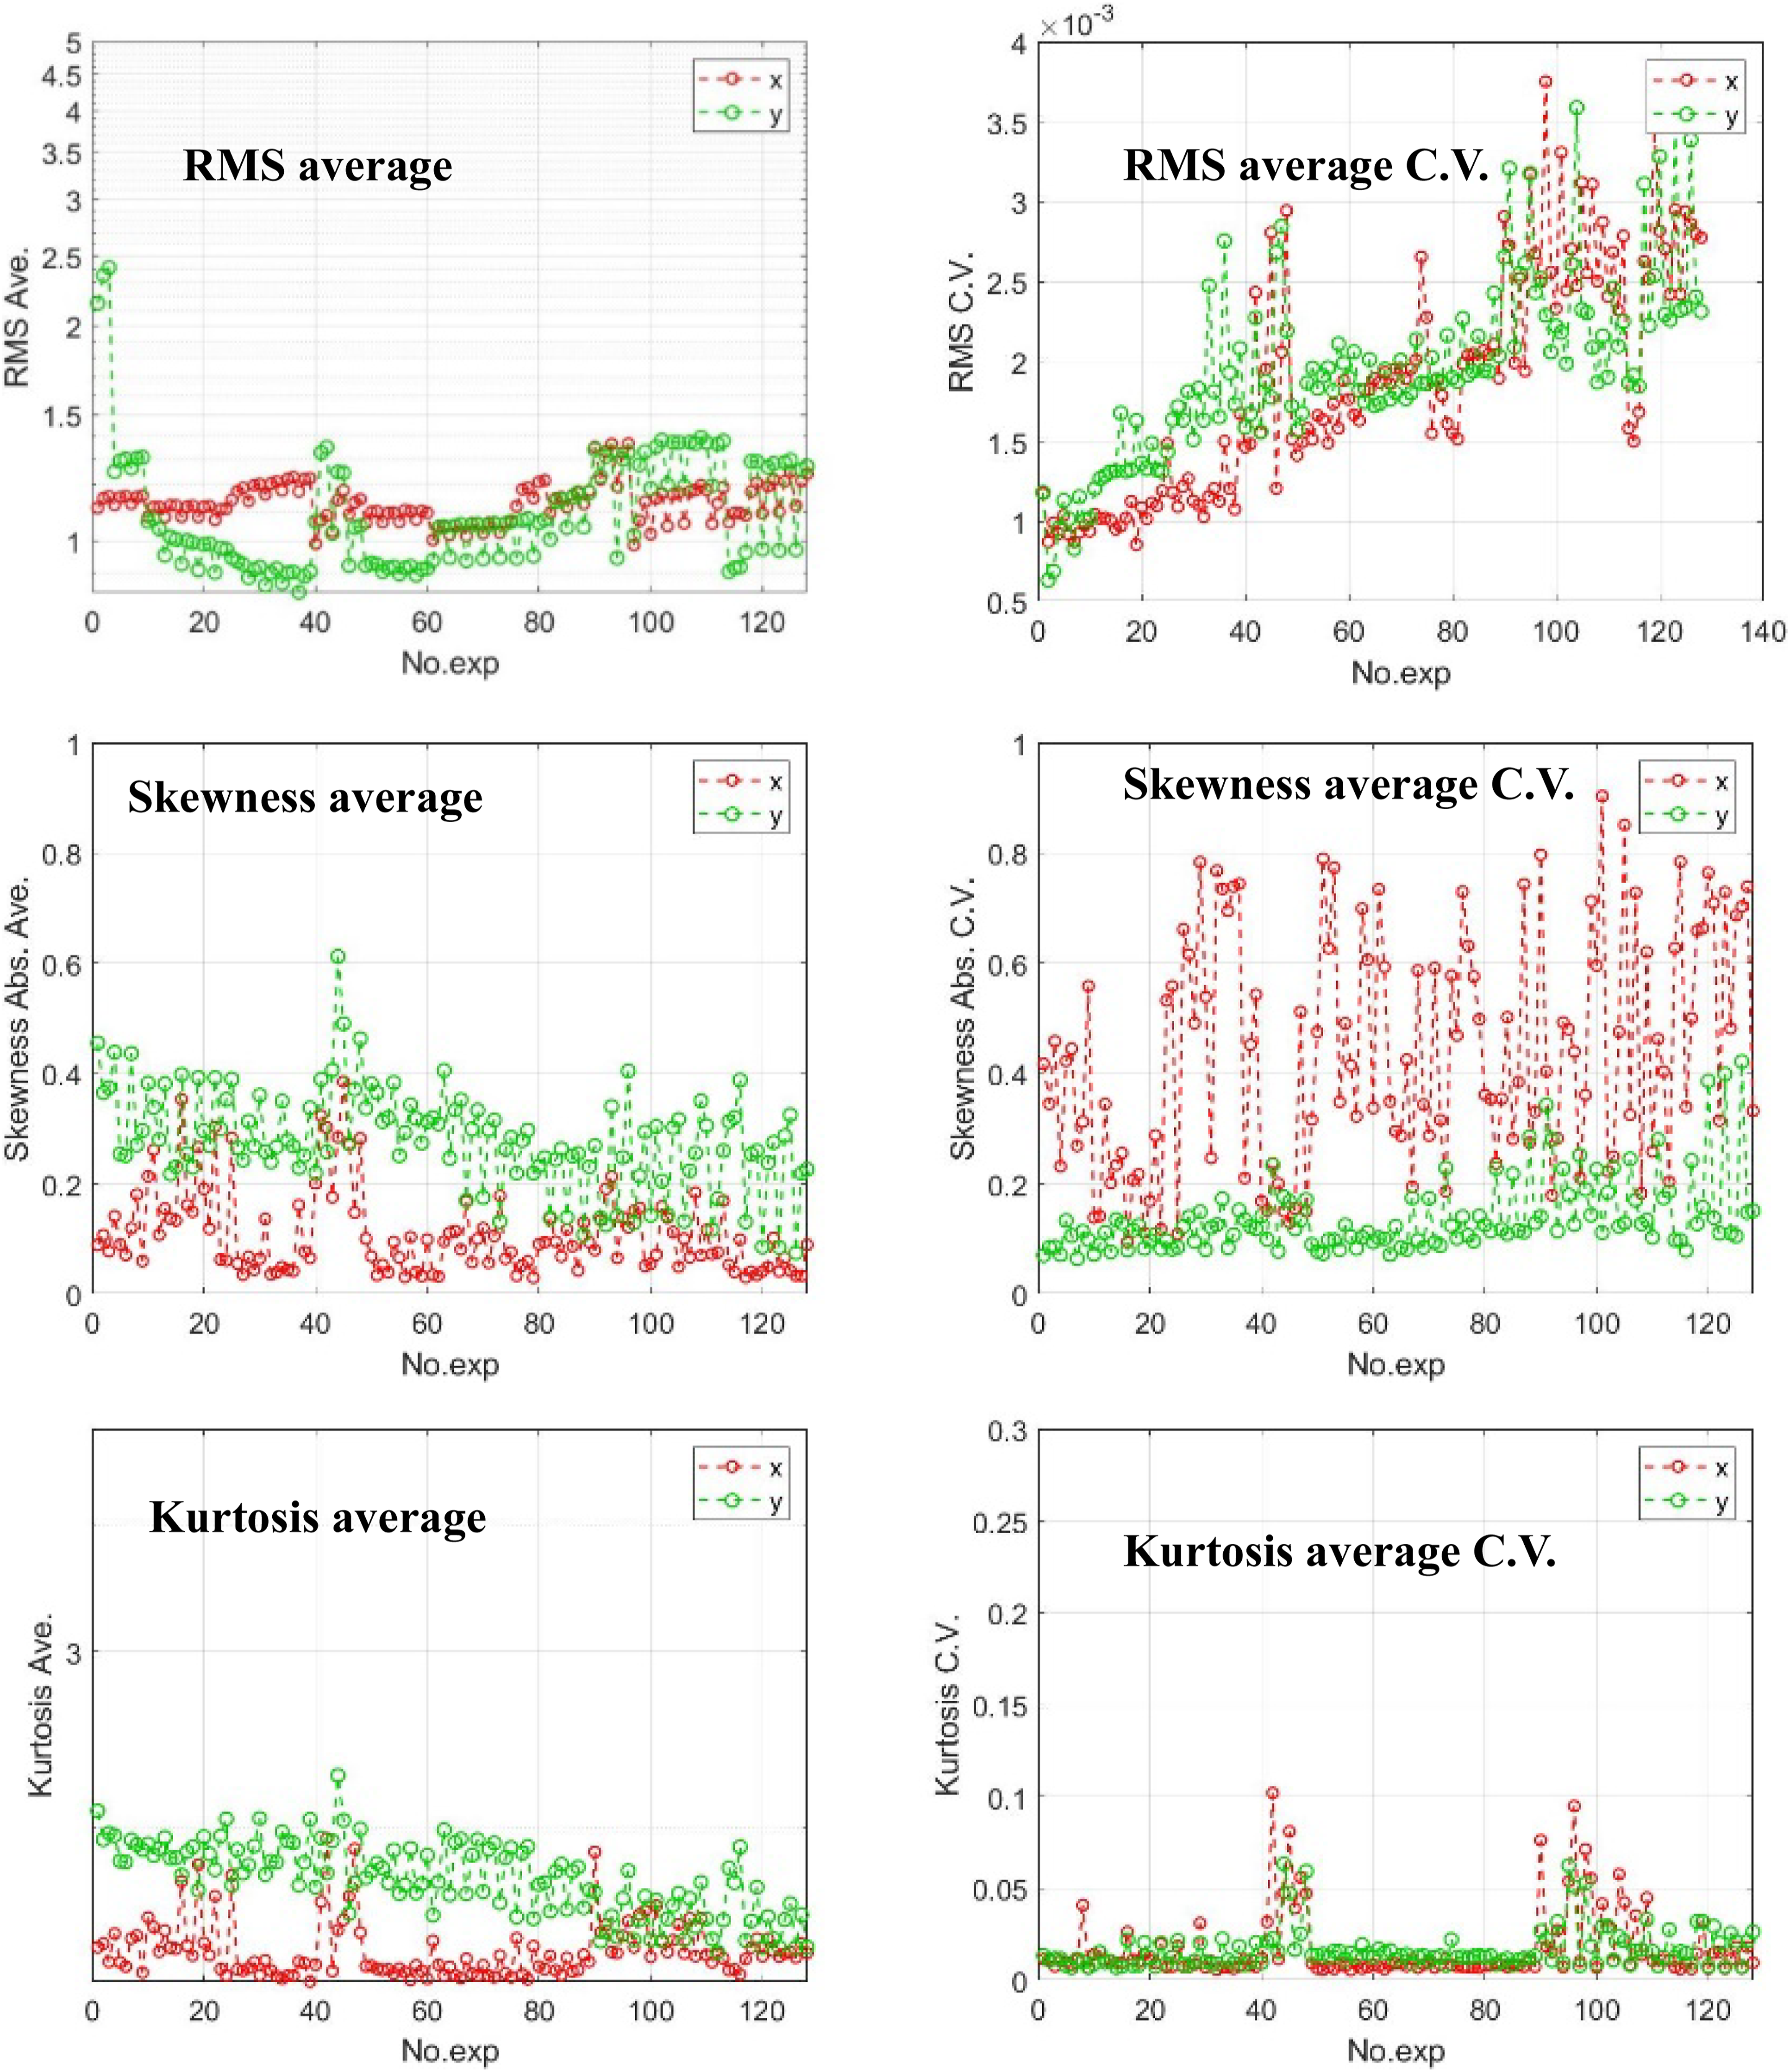
Features of vertical rotor system in time domain.
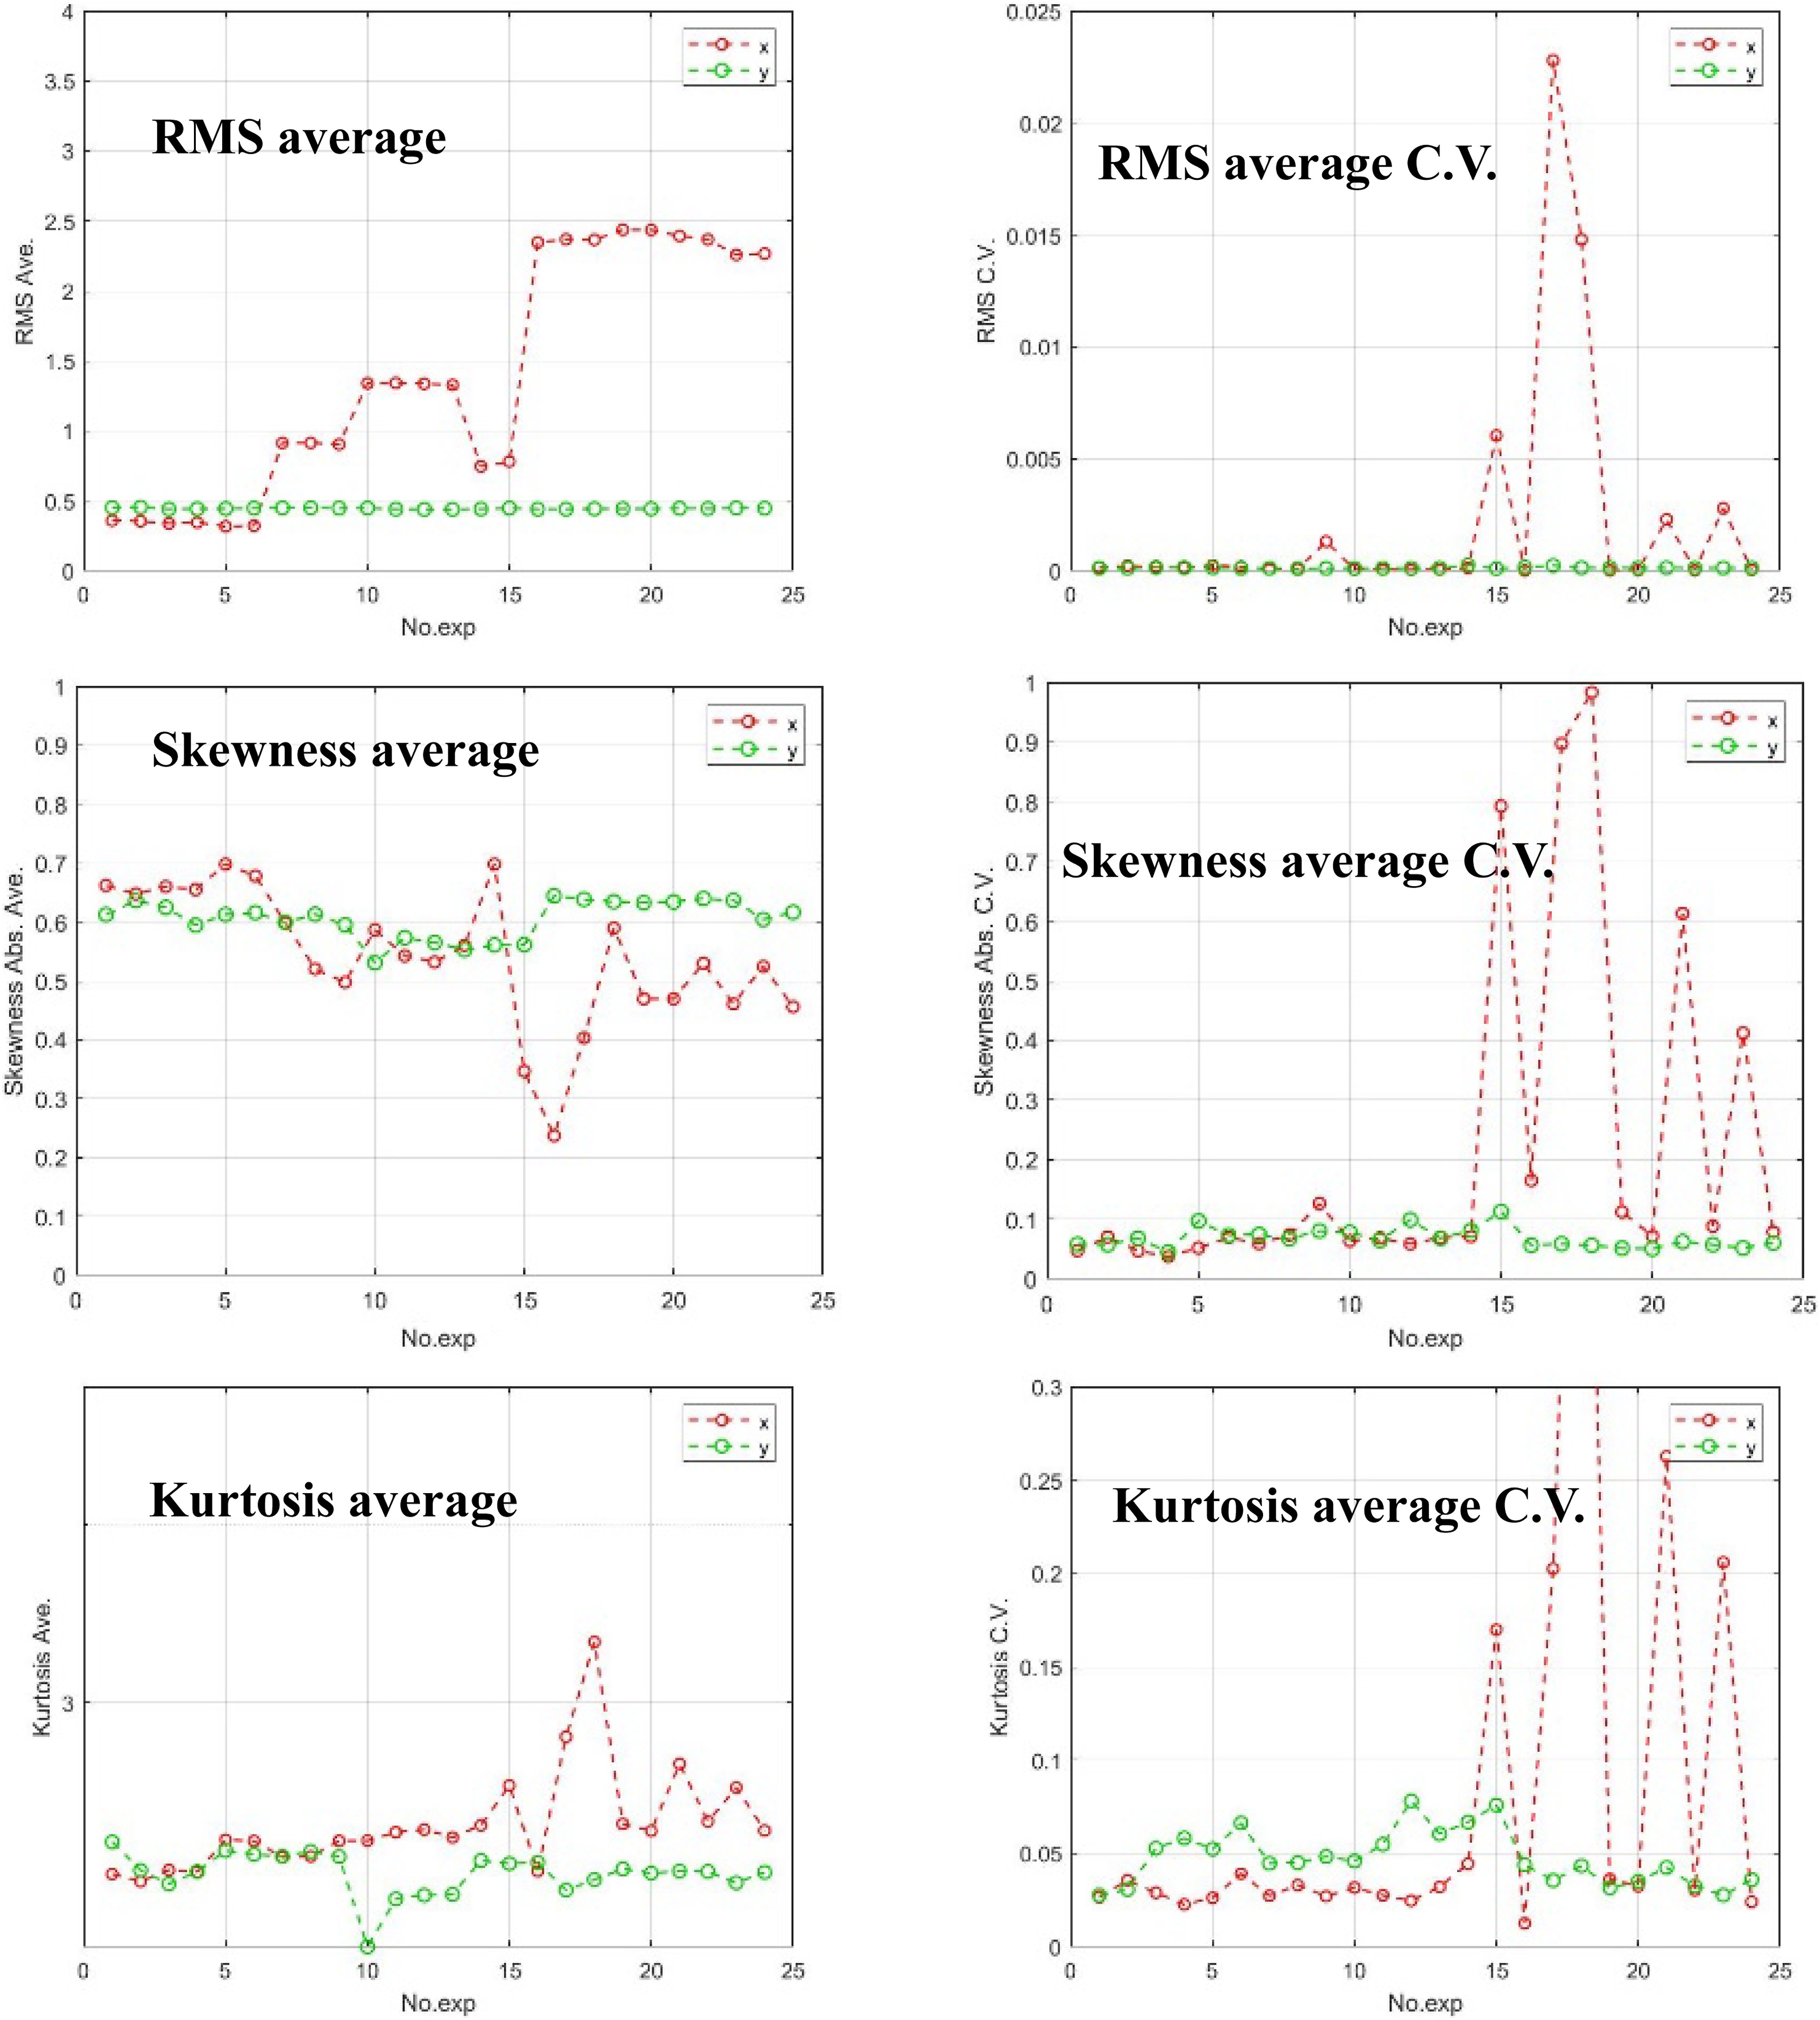
Features of horizontal rotor system in time domain.
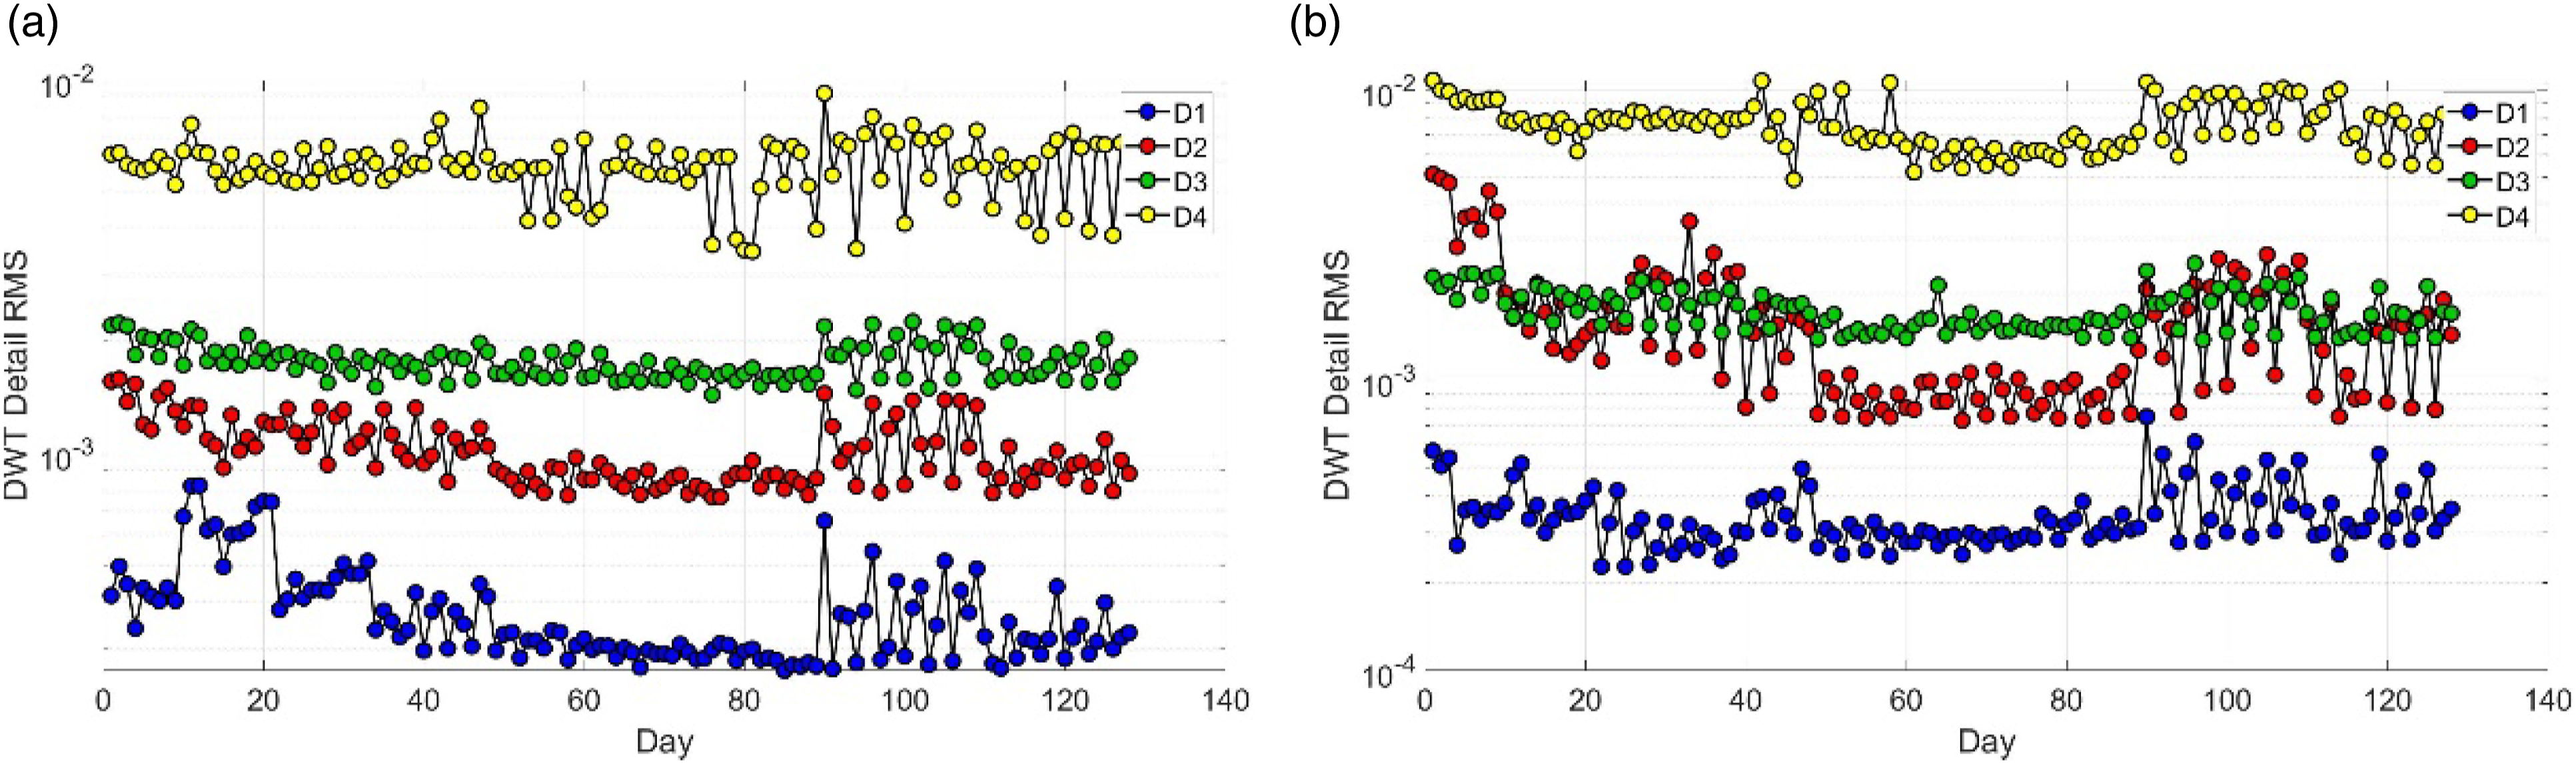
Features of vertical rotor system in time-frequency domain (a) DWT transformation in x direction (Lv1∼Lv4) and (b) DWT transformation in y direction (Lv1∼Lv4).
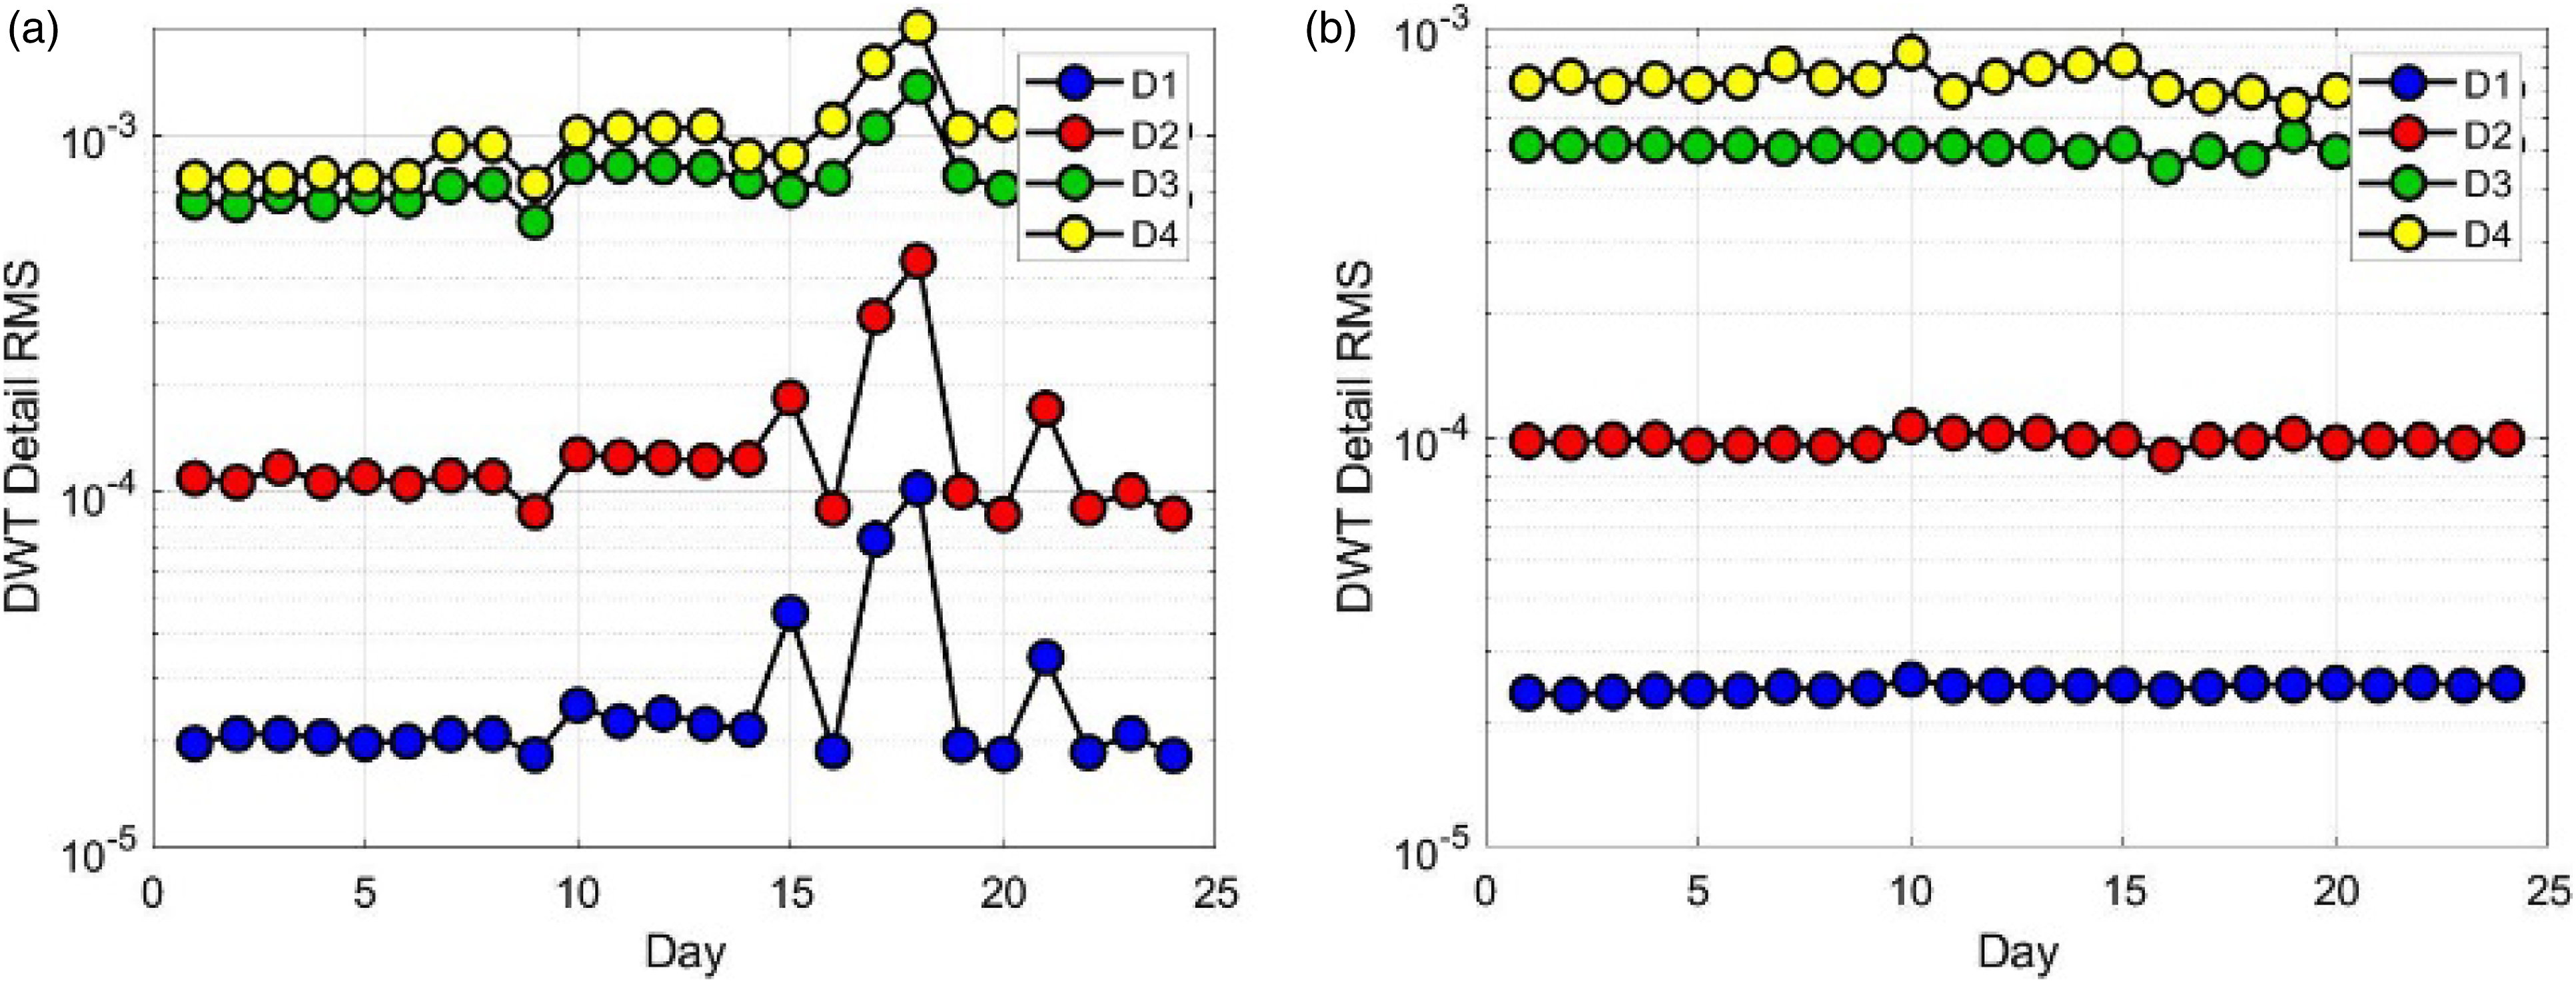
Features of horizontal rotor system in time-frequency domain. (a) DWT transformation in x direction (Lv1~Lv4) and (b) DWT transformation in y direction (Lv1~Lv4).
Label the samples
Vertical rotor system
Journal bearing data for training and test (vertical rotor system).
Horizontal rotor system
According to Experimental data statement and Figure 11, labels are defined based on the changes of journal bearing temperature and periodic check of journal bearing (peeling after Exp No.15).
Journal bearing data for training and test (horizontal system).
Fault diagnosis result and discussion
Kernel functions
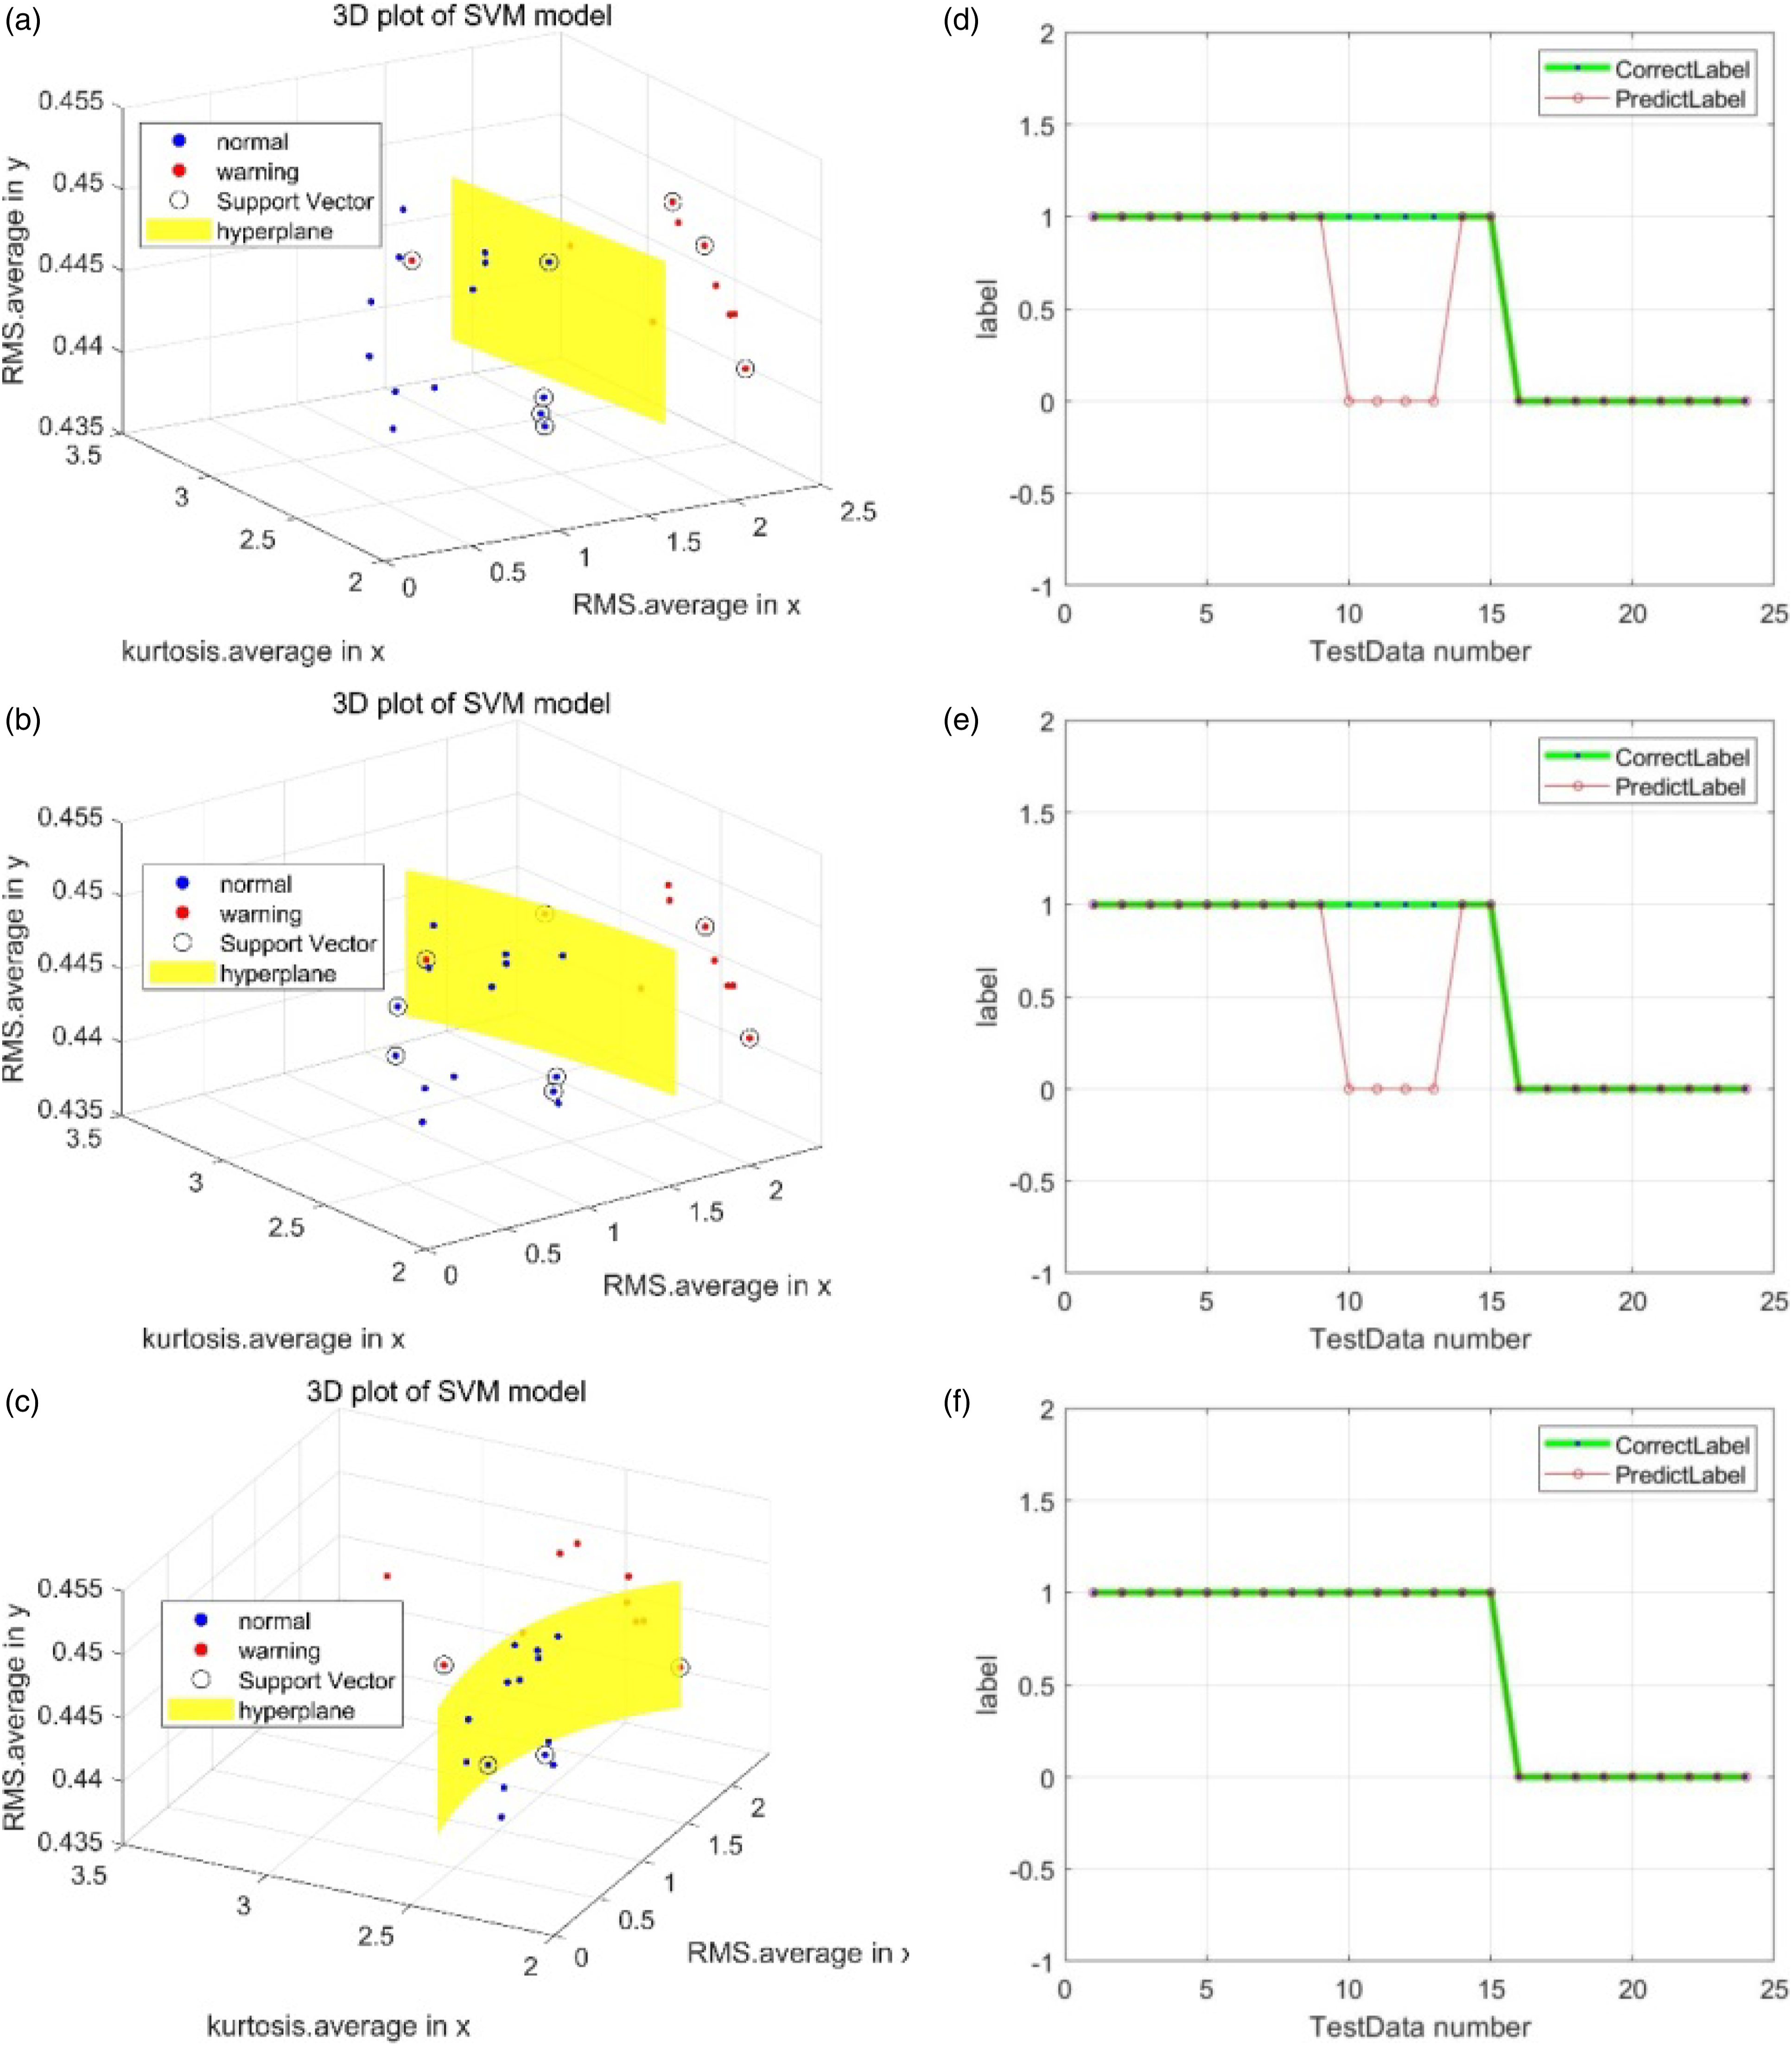
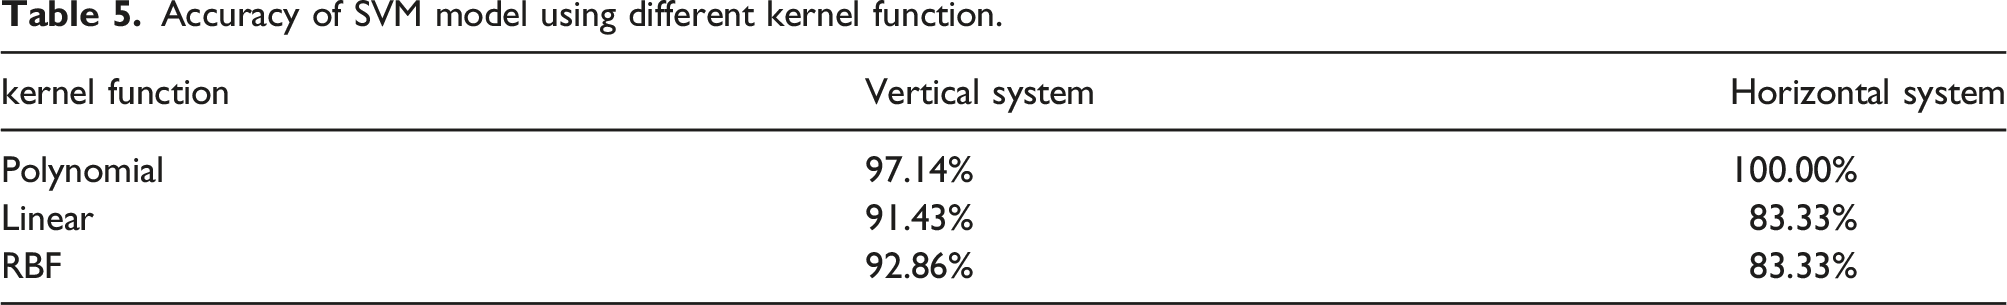
This section shows the result of fault diagnosis of the journal bearing of vertical and horizontal rotor systems, respectively. Figures 15 and 16 show 3D plots of SVM models for both vertical and horizontal systems using the trained SVM model. Three different kernel functions are used and prediction accuracy was compared. In these figures, all 20 features are used in the training and testing of SVM model. Both figures, for vertical and horizontal rotor systems, show that: figures a, b, and c indicate the hyperplane of support vector successfully distinguish the normal and warning conditions. As a result, Figures d, e, and f show that the prediction result significantly agreed with the correct label of data. Particularly, Figure 16(f) shows good agreement of prediction label and correct label. Table 5 shows a summary of these results for both vertical and horizontal rotor systems shown in Figure 15 and Figure 16. It proves the polynomial kernel function is the most appropriate one for SVM model of journal bearing in both vertical and horizontal systems. 3D plot and prediction results of SVM model - vertical rotor system. (a) visualization using linear kernel function, (b) visualization using RBF kernel function, (c) visualization using RBF kernel function, (d) prediction result using polynomial kernel function, (e) prediction result using linear kernel function, and (f) prediction result using RBF kernel function. 3D plot and prediction results of SVM model - horizontal rotor system. (a) visualization using linear kernel function, (b) visualization using RBF kernel function, (c) visualization using RBF kernel function, (d) prediction result using polynomial kernel function, (e) prediction result using linear kernel function, and (f) prediction result using RBF kernel function. Accuracy of SVM model using different kernel function.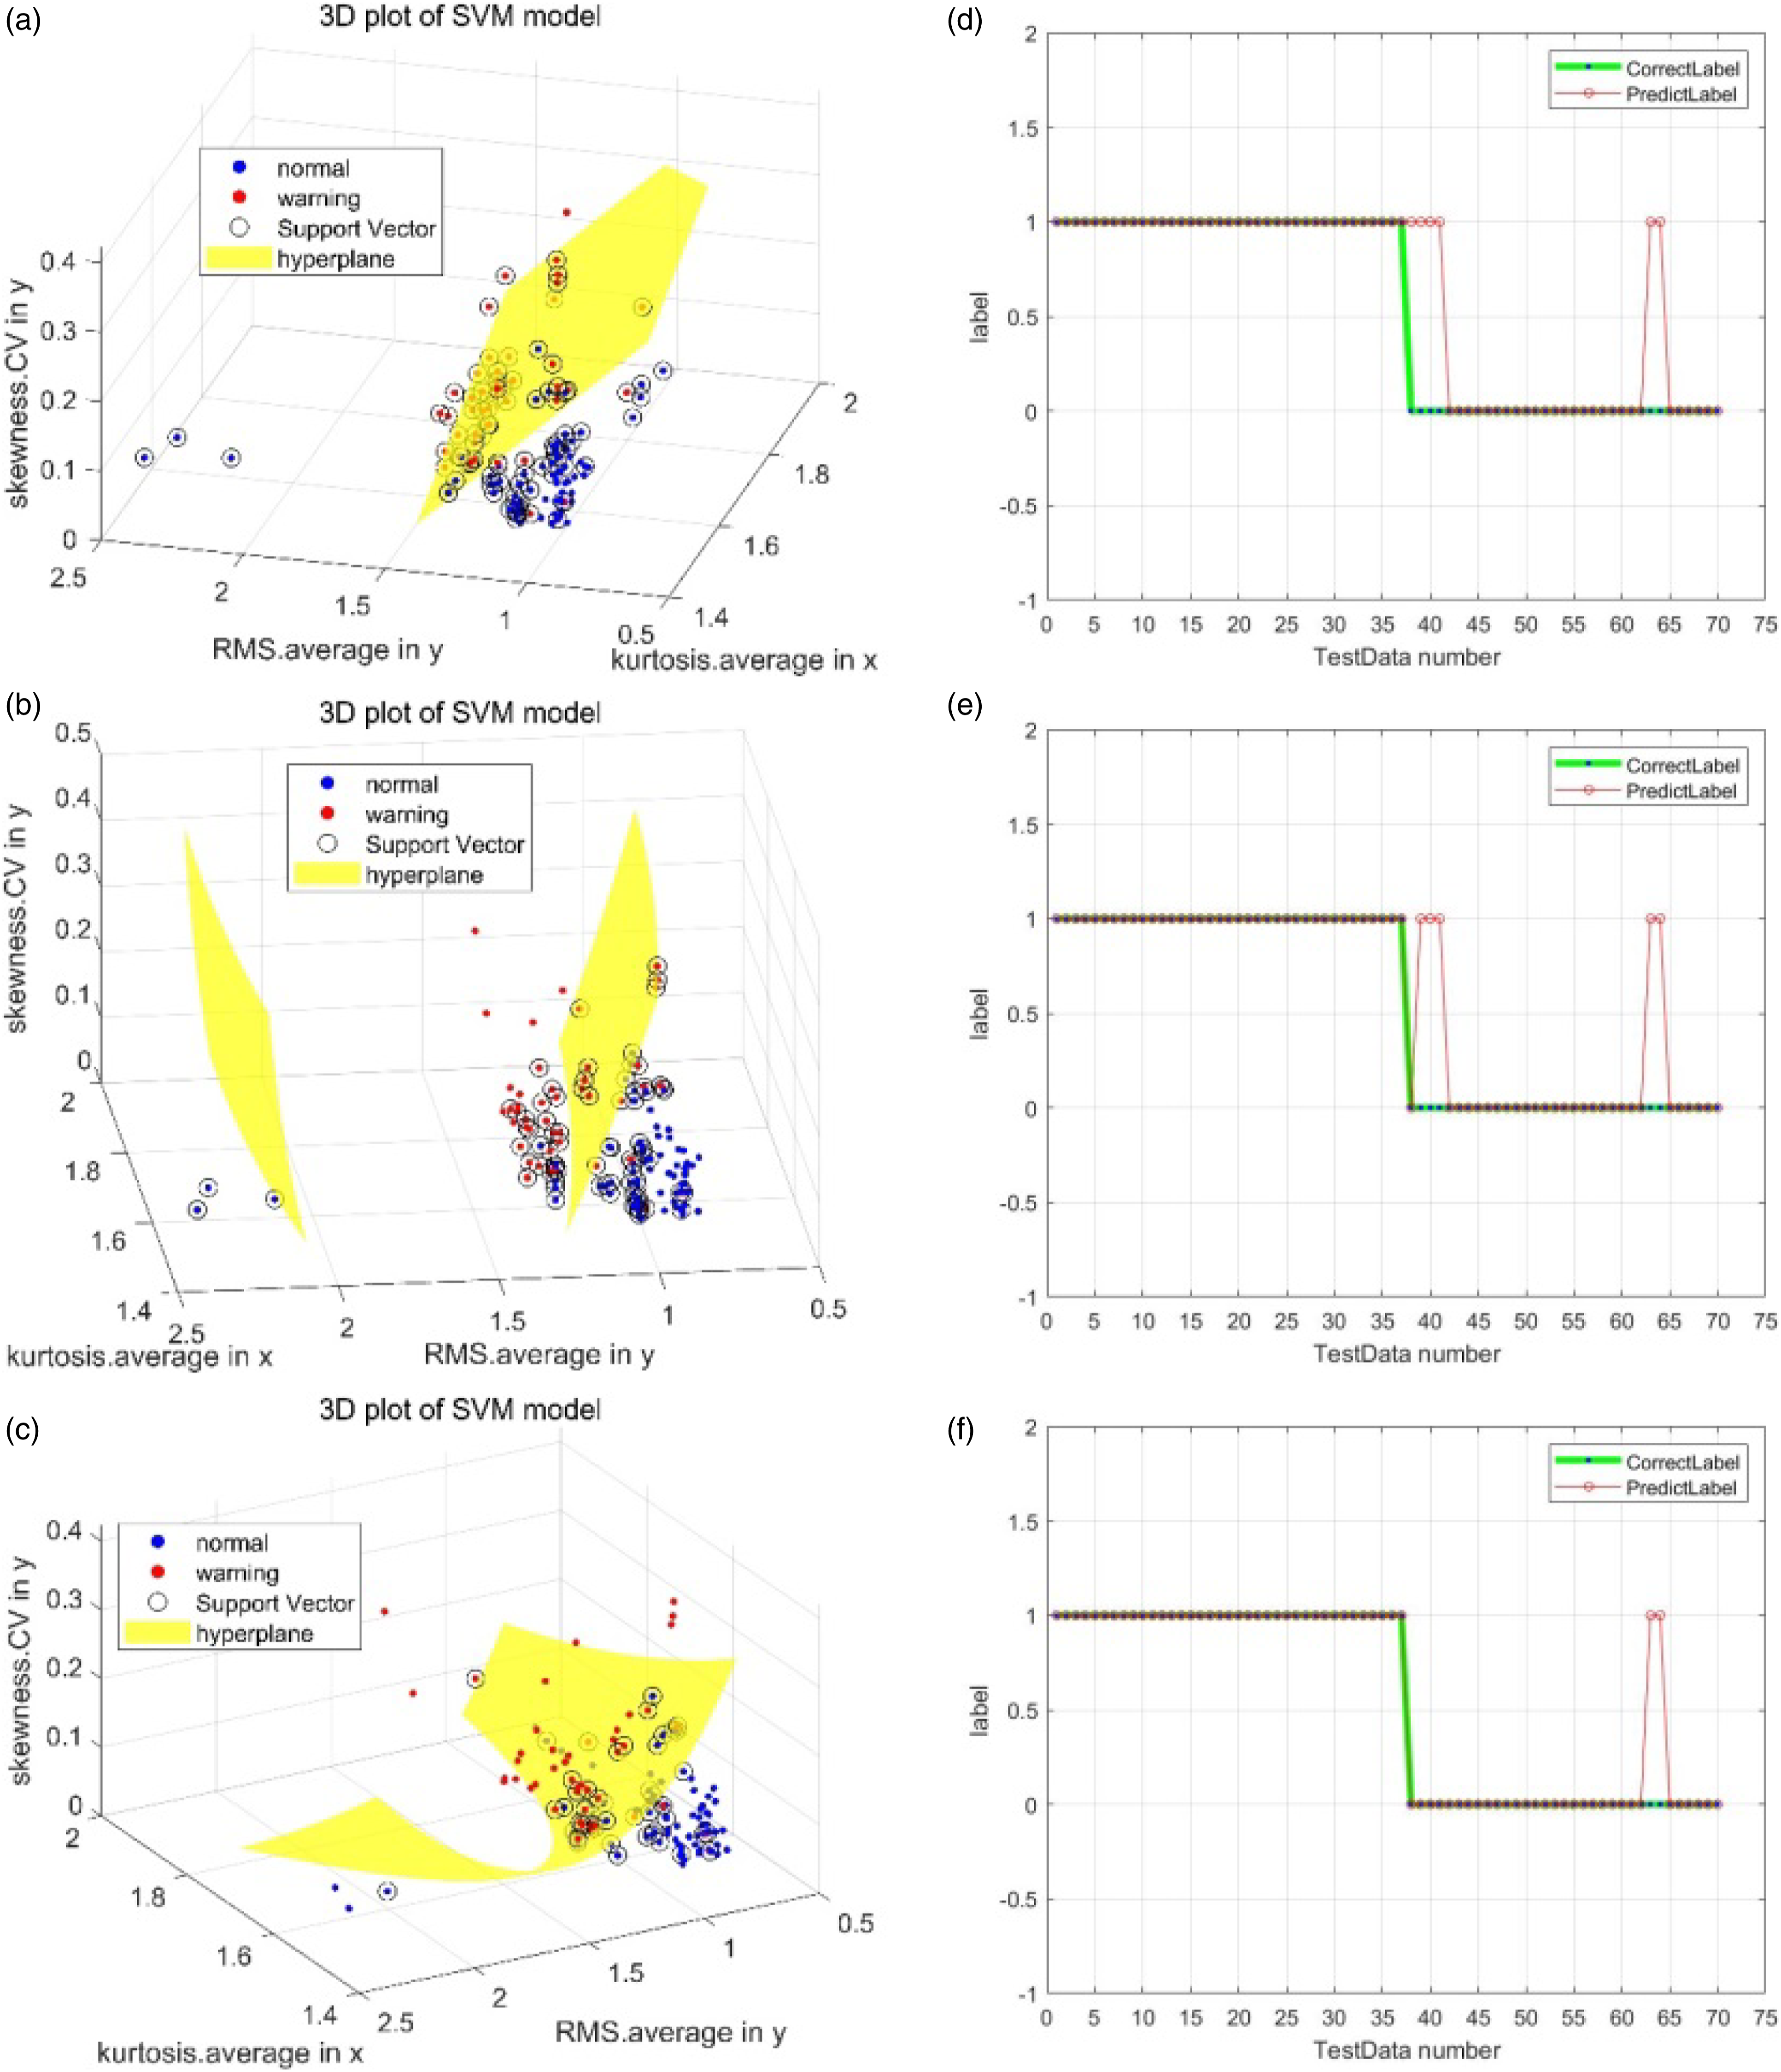
Discussion on the feature selection using hybrid method
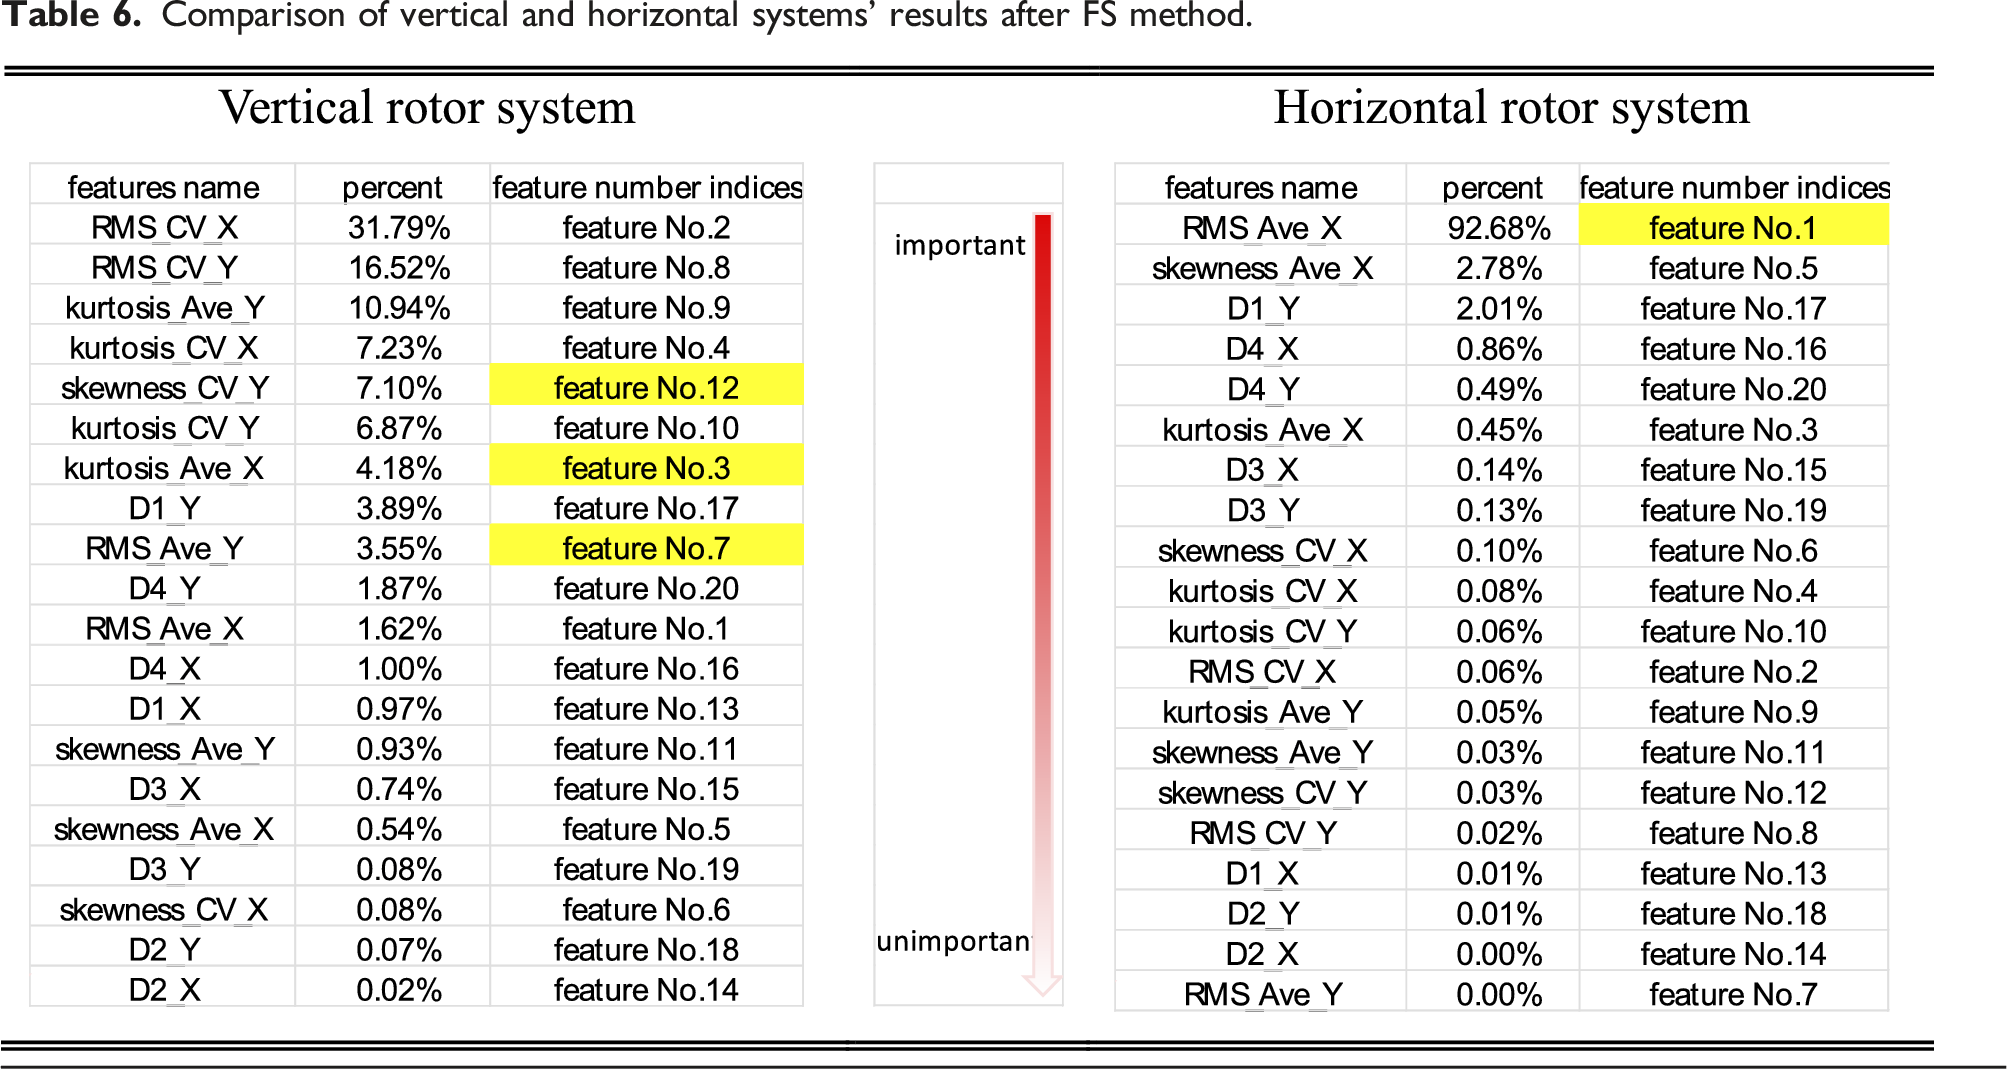
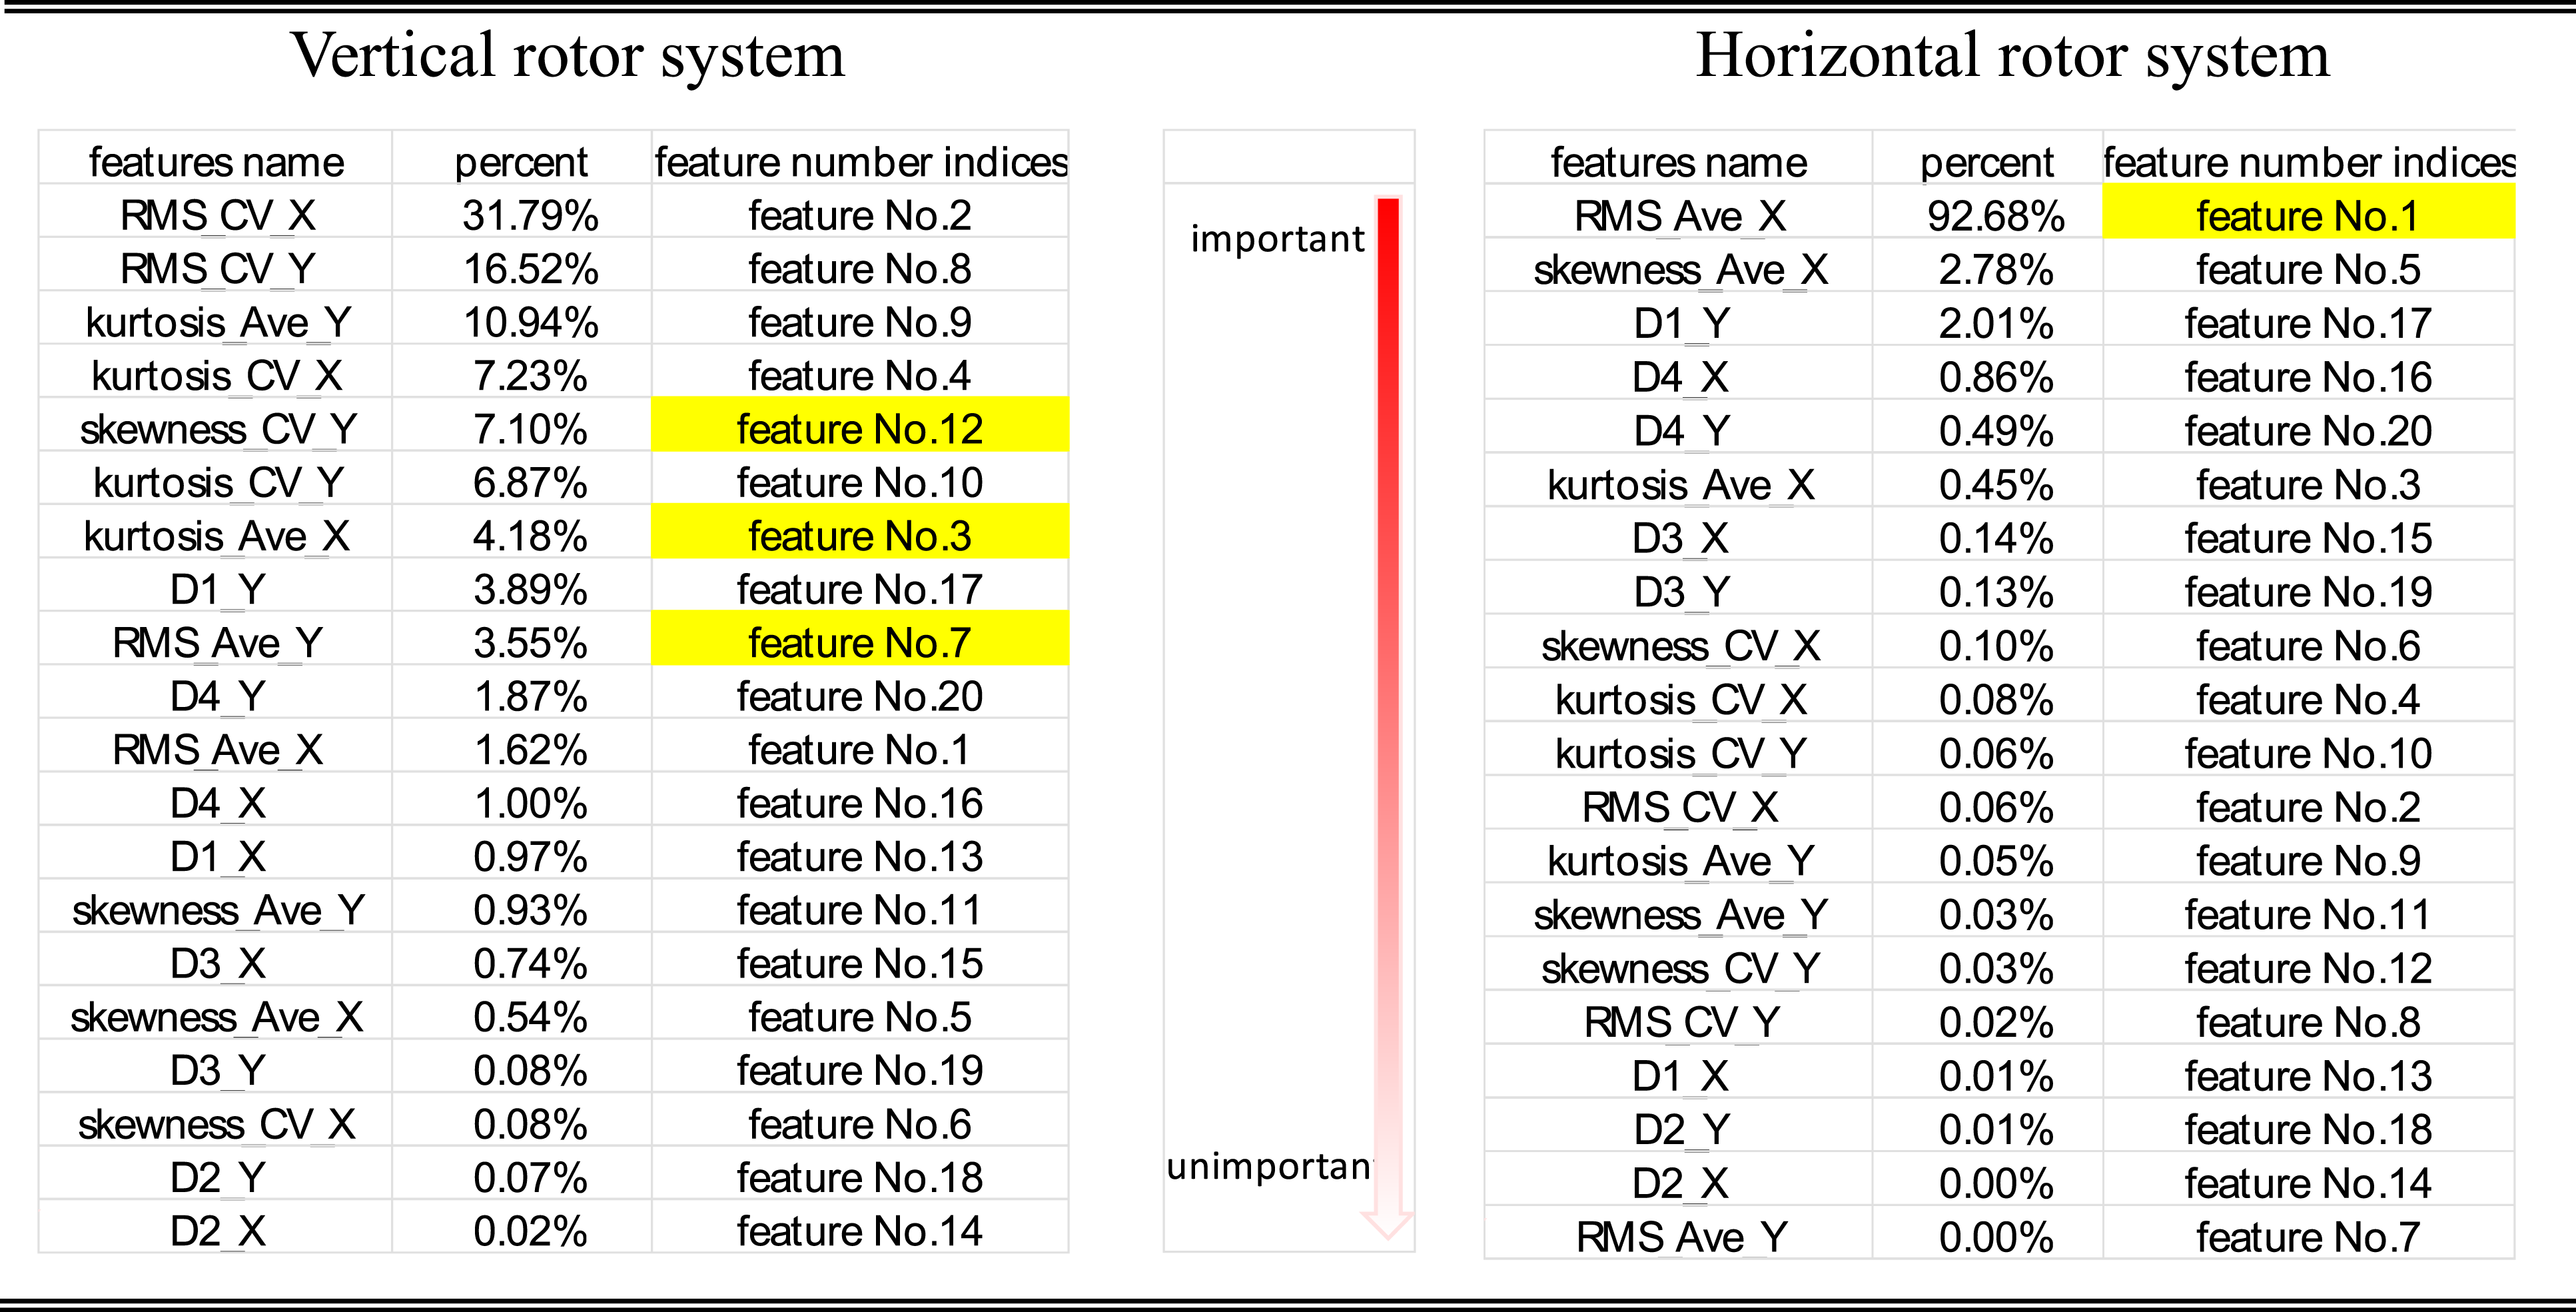
Comparison of vertical and horizontal systems’ results after FS method.
Optimal subset using hybrid method of both Fisher score method and SFS method.
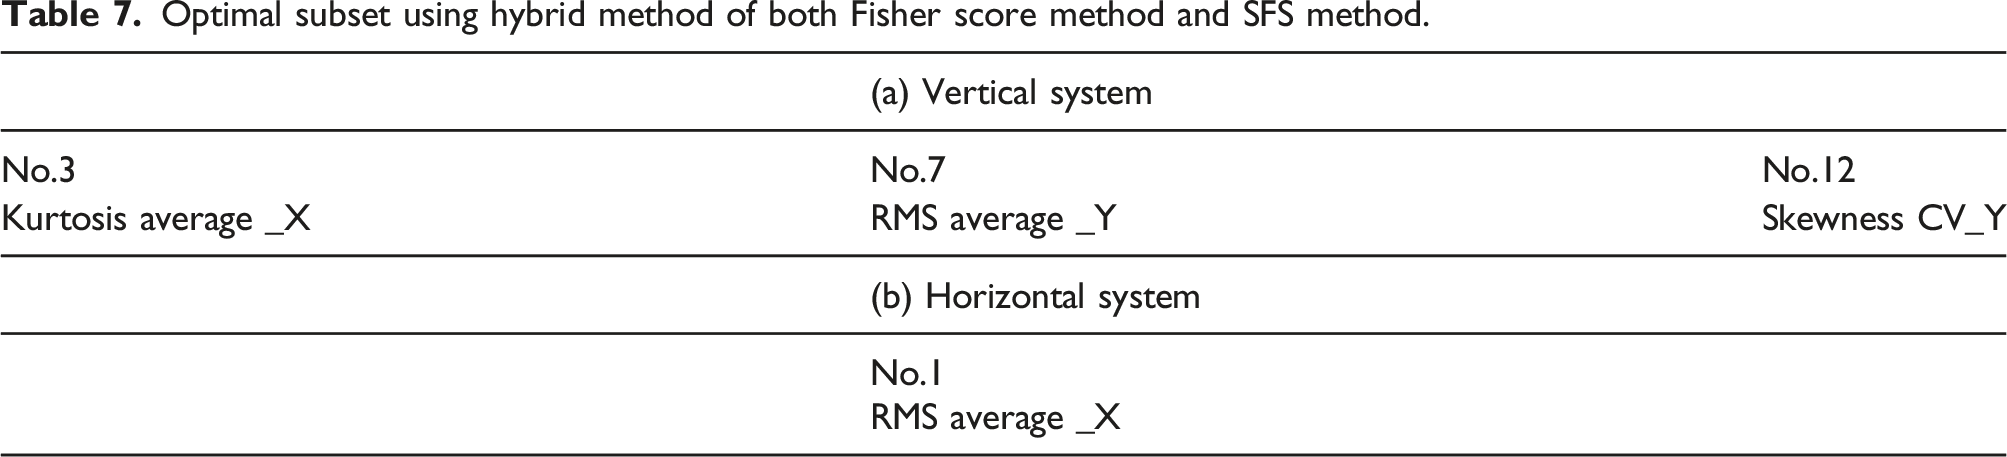
Note that the optimal feature sets shown in Table 7 for the case of vertical rotor system are not highest ones in the ranking result of FS method shown in Table 6. This is the appearance of the unsolved drawbacks of filter model (Fisher score), which is that it completely ignores the performance of selected features on specific classifiers and evaluates the features individually. However, wrapper models involve optimizing a predictor as part of the selection process which tends to give better results. The optimal feature subset should depend on the specific biases and heuristics of the classifier such as wrapper method. It explains the difference between the results of FS (filter method) and SFS (wrapper method) are different, and the proposed hybrid method using their advantages.
Figures 17 and 18 show the validity of the optimal feature subset chosen by proposed hybrid method for vertical system. In either cases, the Figure 17(d) and Figure 18(d), which use all optimal features, show the best diagnosis result. Figure 19 shows the validity of the optimal feature chosen by hybrid method for horizontal system. In this case, Figure 19(a), which use optimal feature, shows the best diagnosis result, and it is the same as the case using all features shown in Figure 19(c). Prediction result of vertical rotor system (using polynomial kernel) - Test part 1. (a) using 1 feature: feature No.3, (b) using 2 features (No.3, 12), (c) using 2 features (No.3, 7), and (d) using 3 features (No.3, 7, 12). Prediction result of vertical rotor system (using polynomial kernel) - Test part 2. (a) using features randomly: No. 2,10,15, (b) using feature No. 12, (c) using feature No. 7, and (d) using selected features (No. 3, 7, 12). Prediction result of horizontal rotor system (using polynomial kernel). (a) using 1 feature: feature No. 1, (b) using features except No. 1, (c) using 20 features, and (d) using 1 feature No. 19.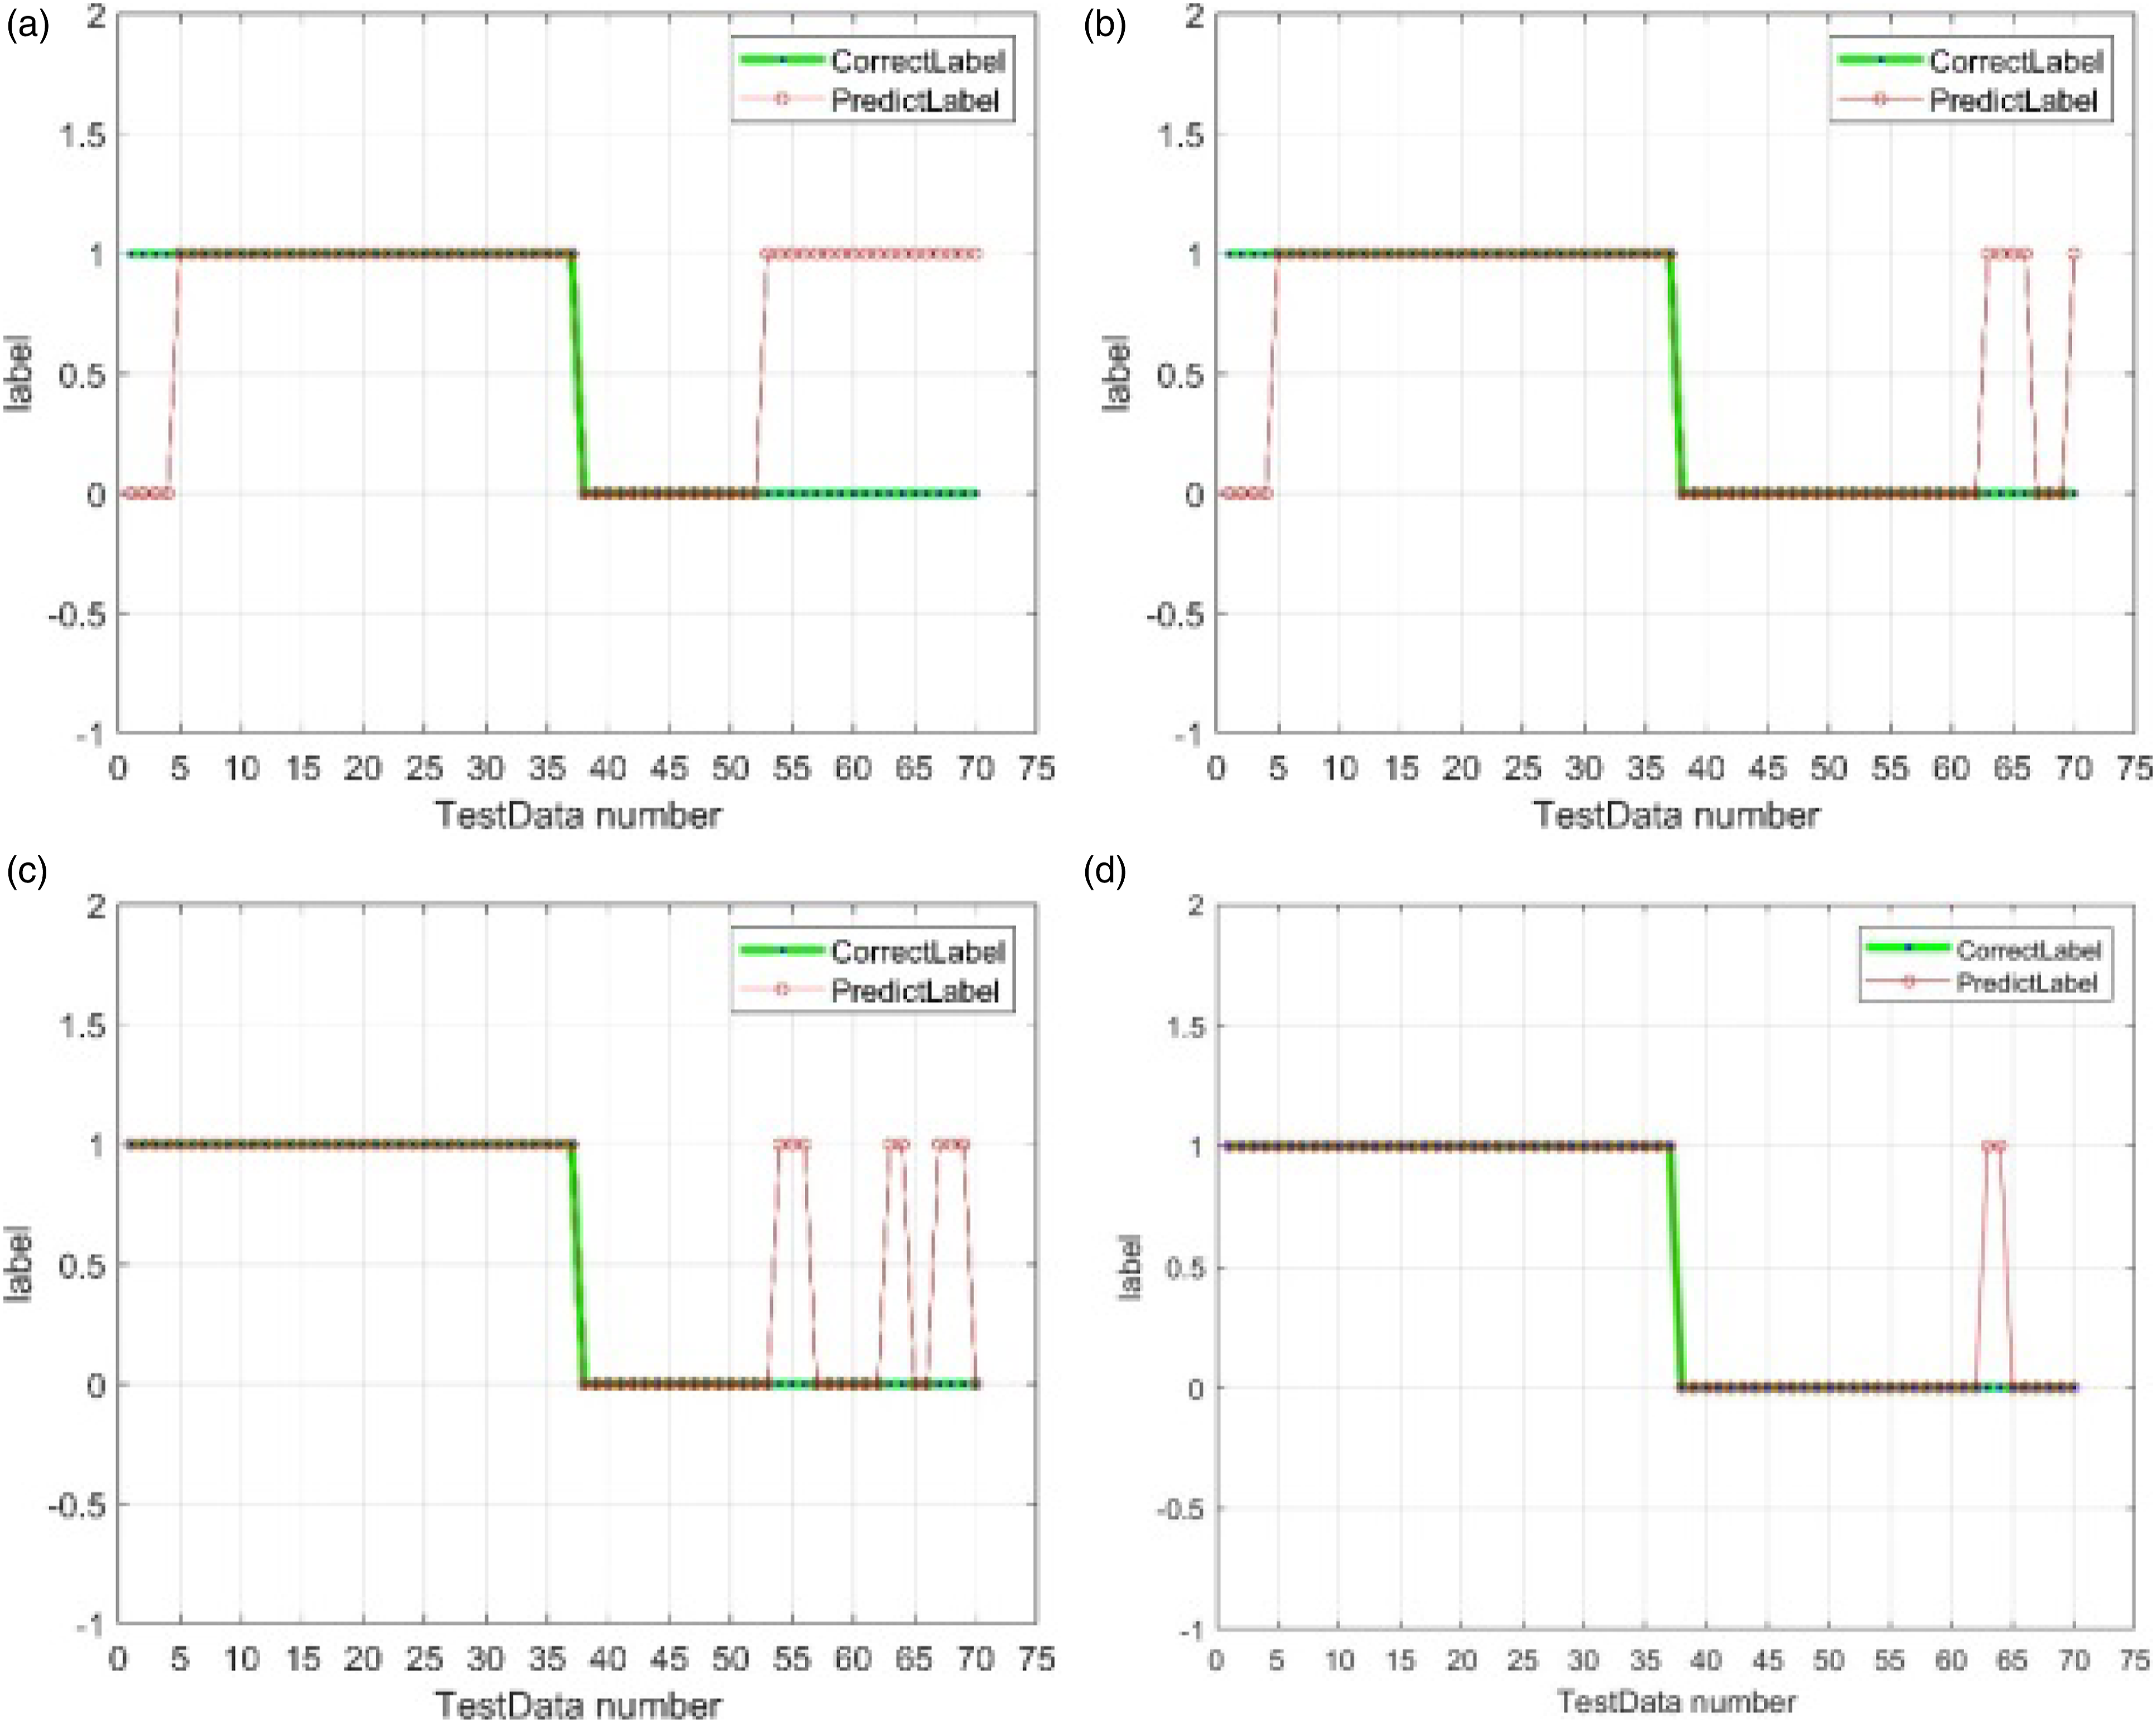
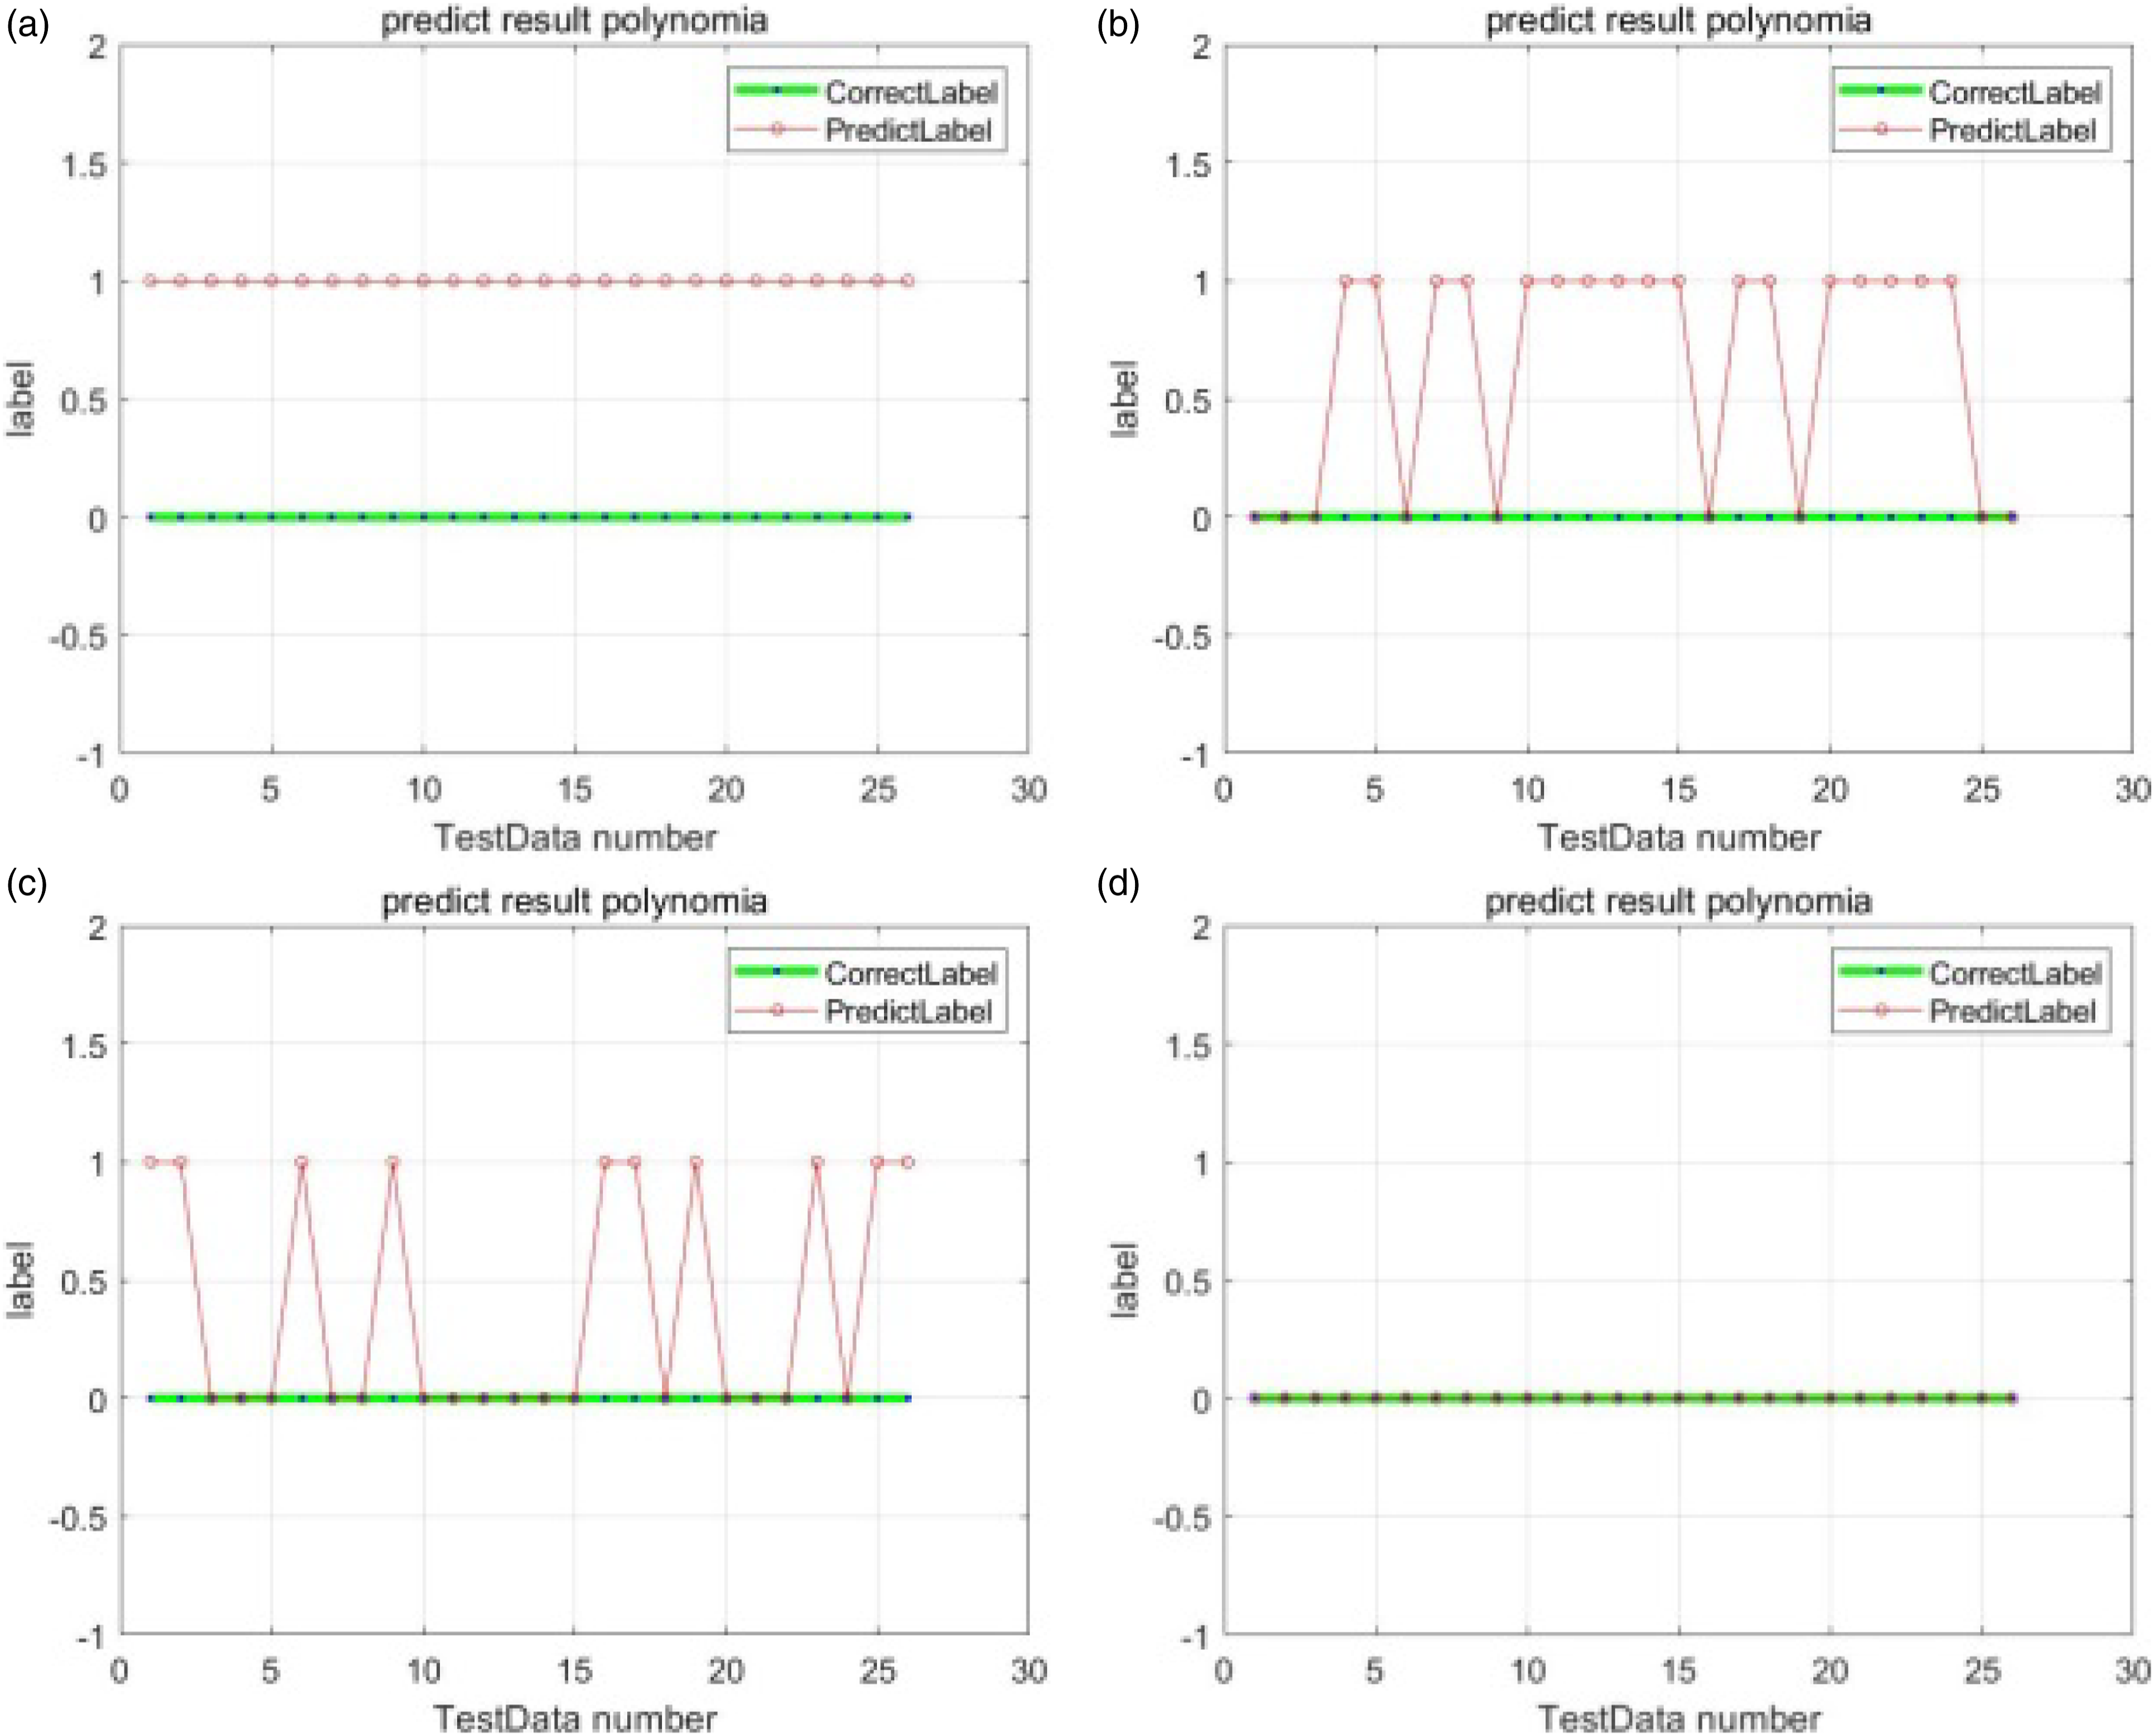
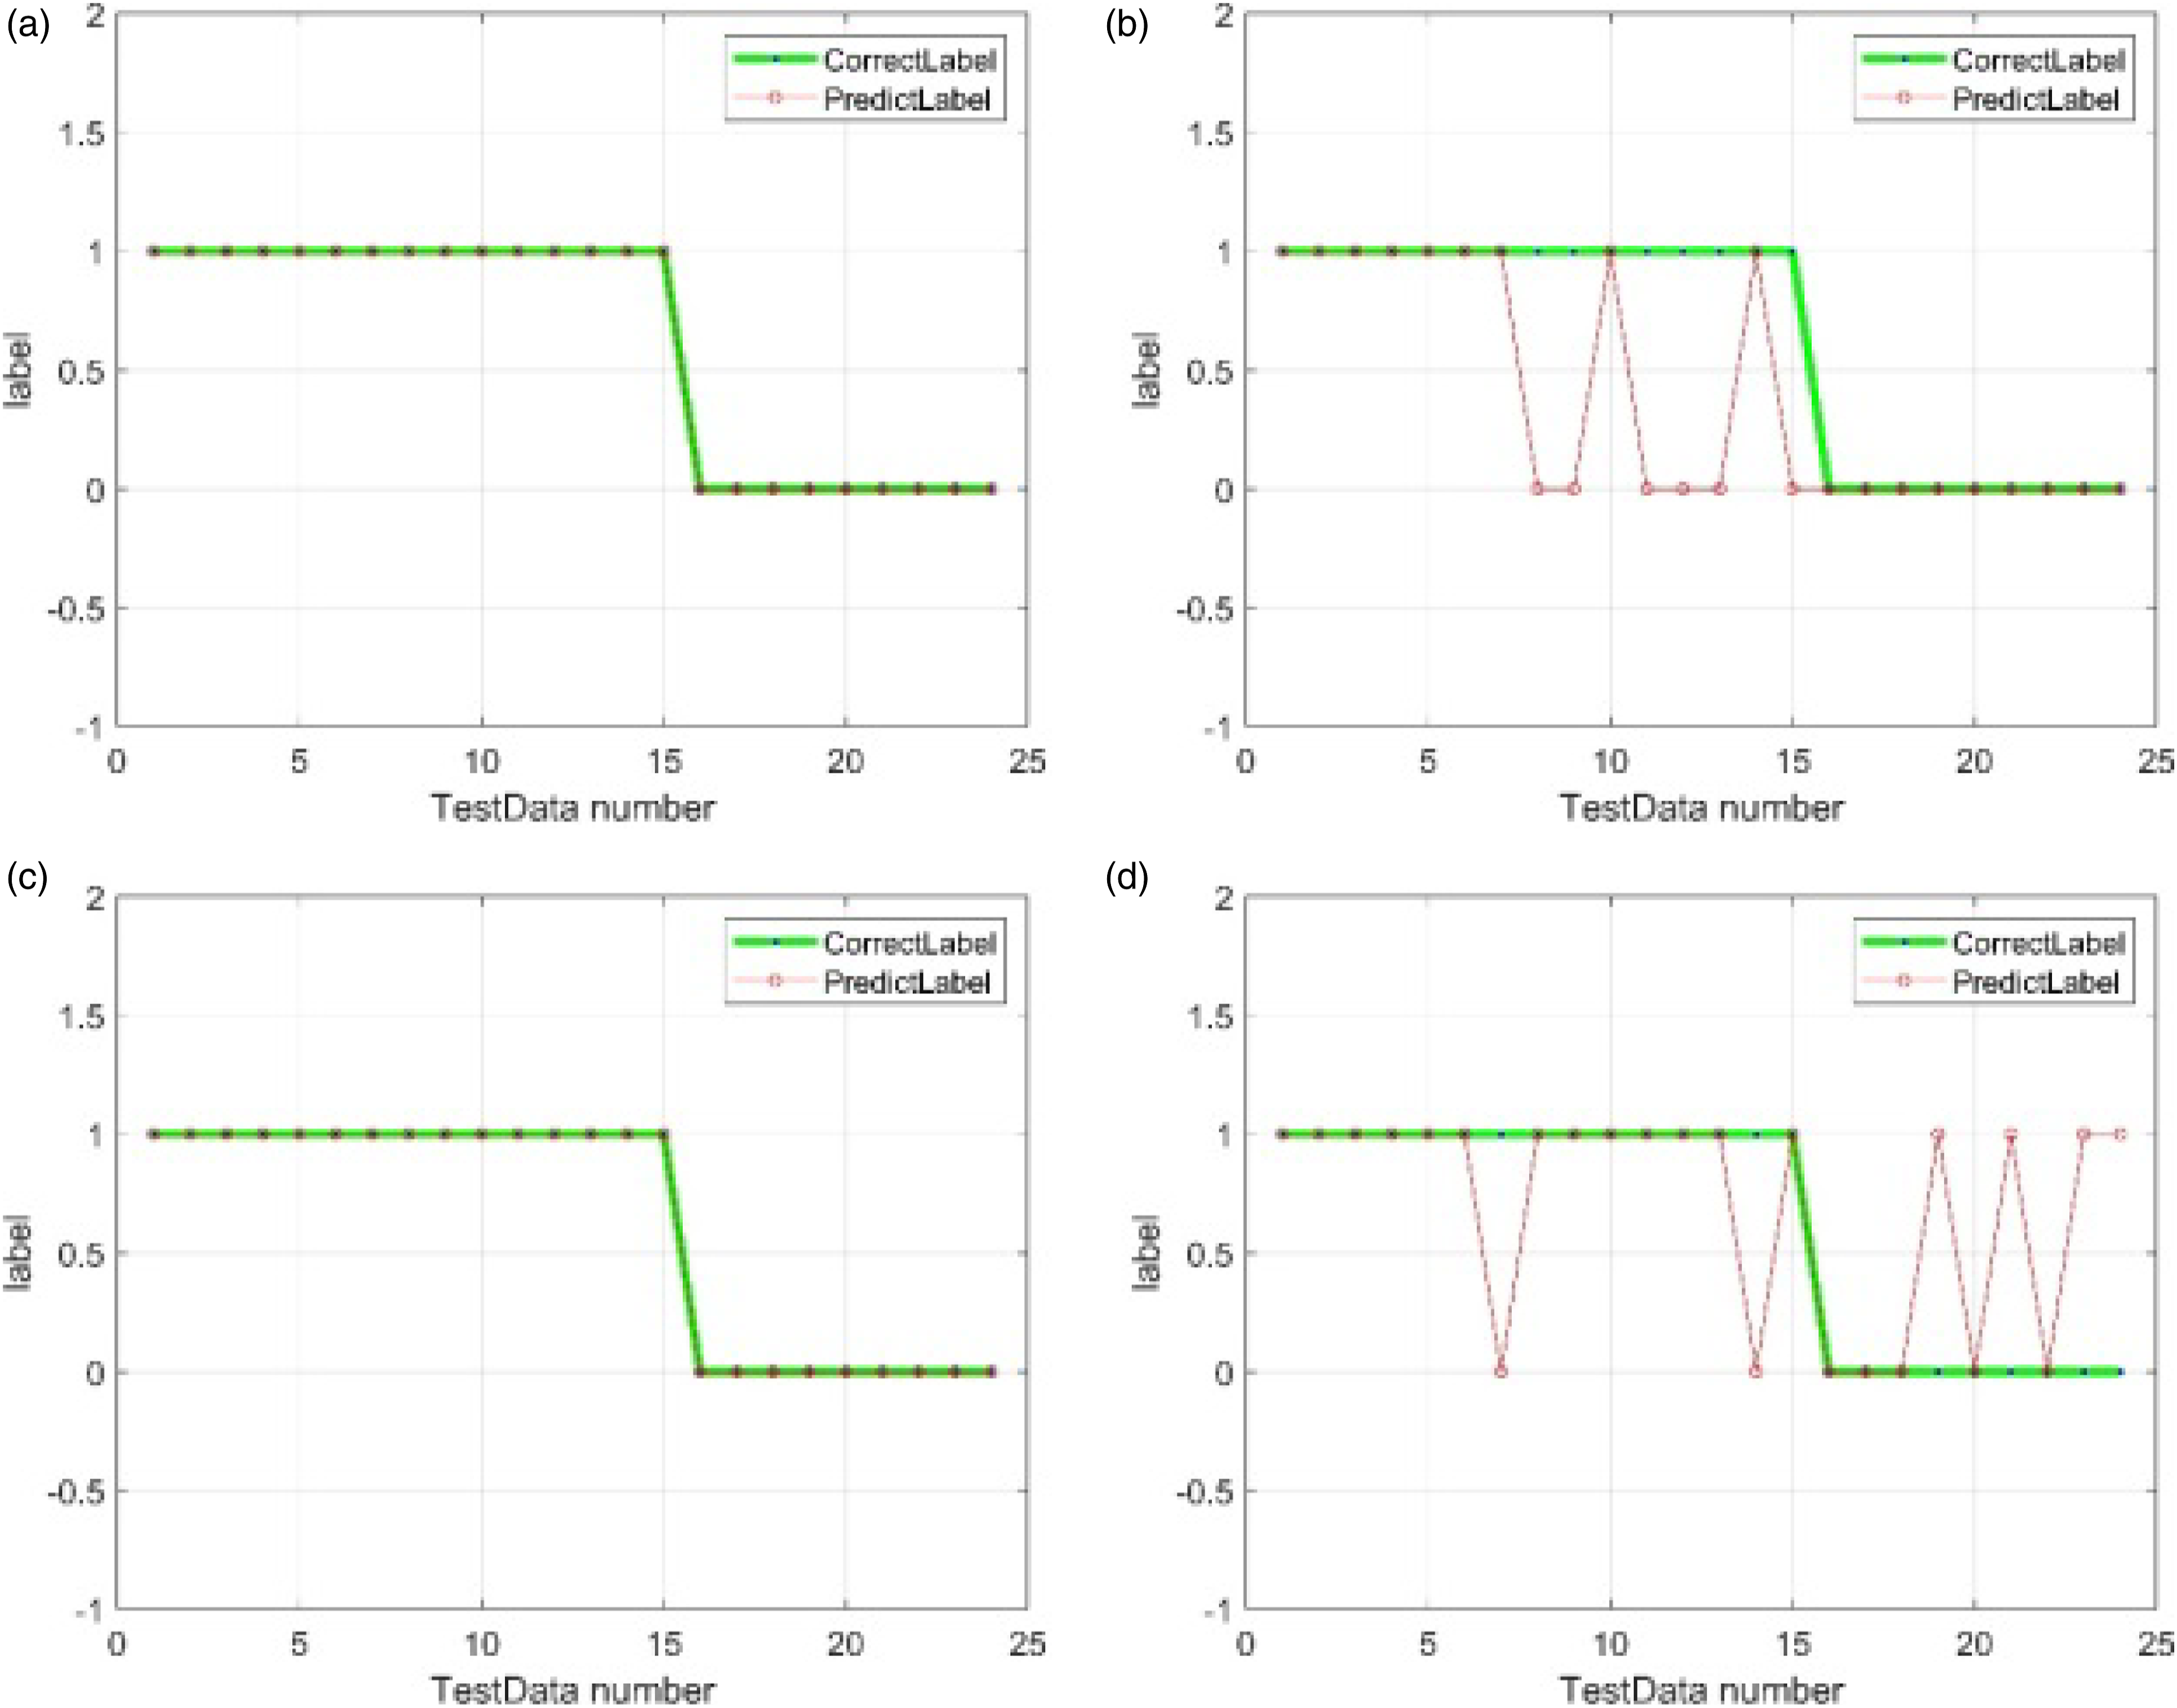
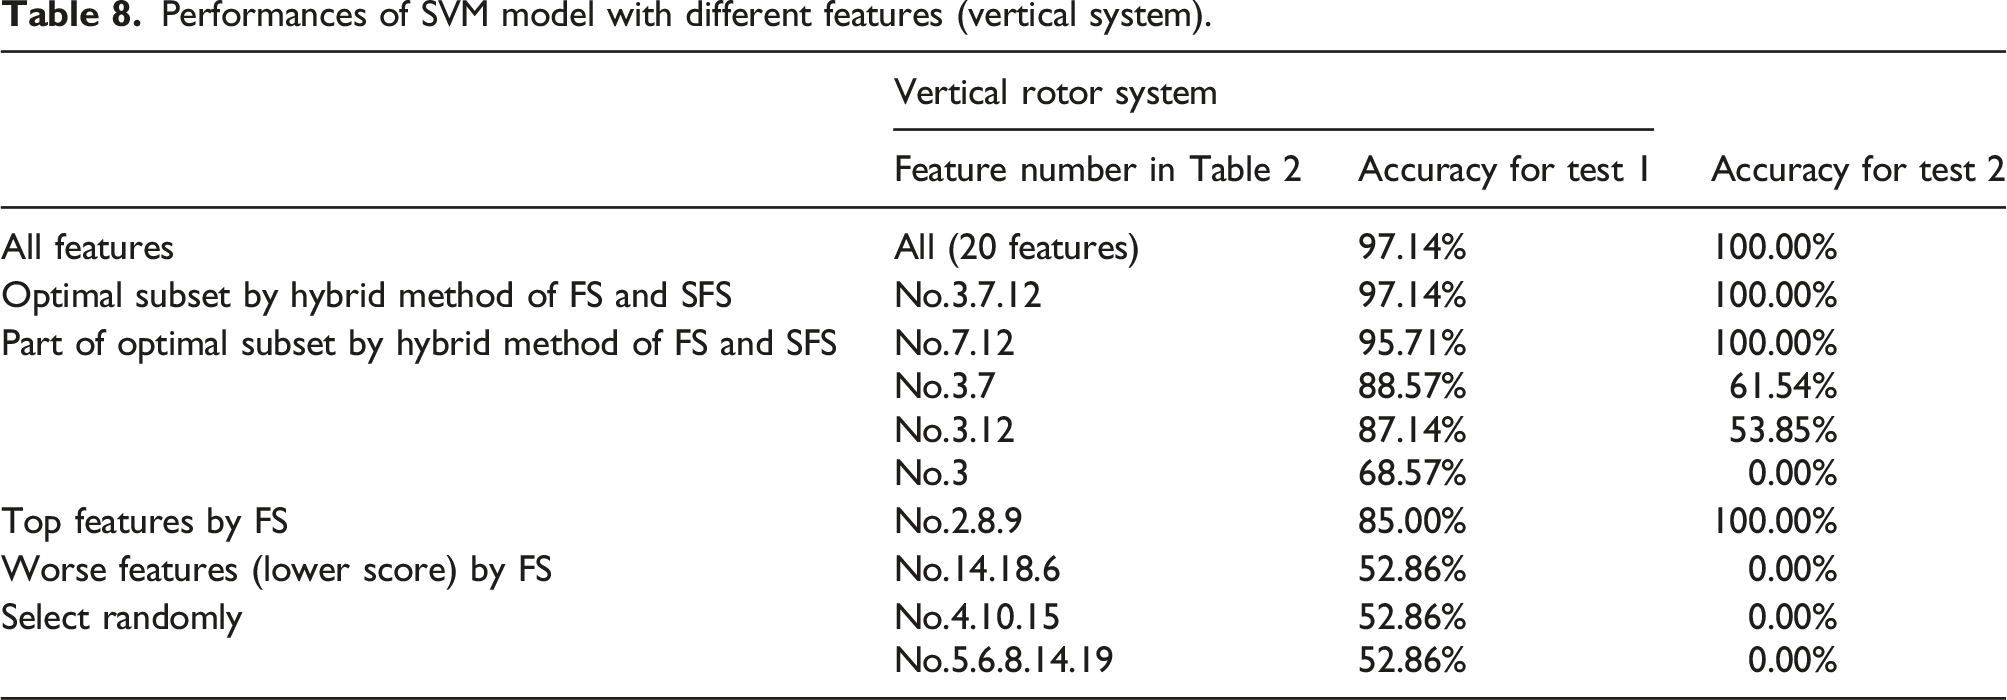
Performances of SVM model with different features (vertical system).
Performances of SVM model with different features (horizontal system).
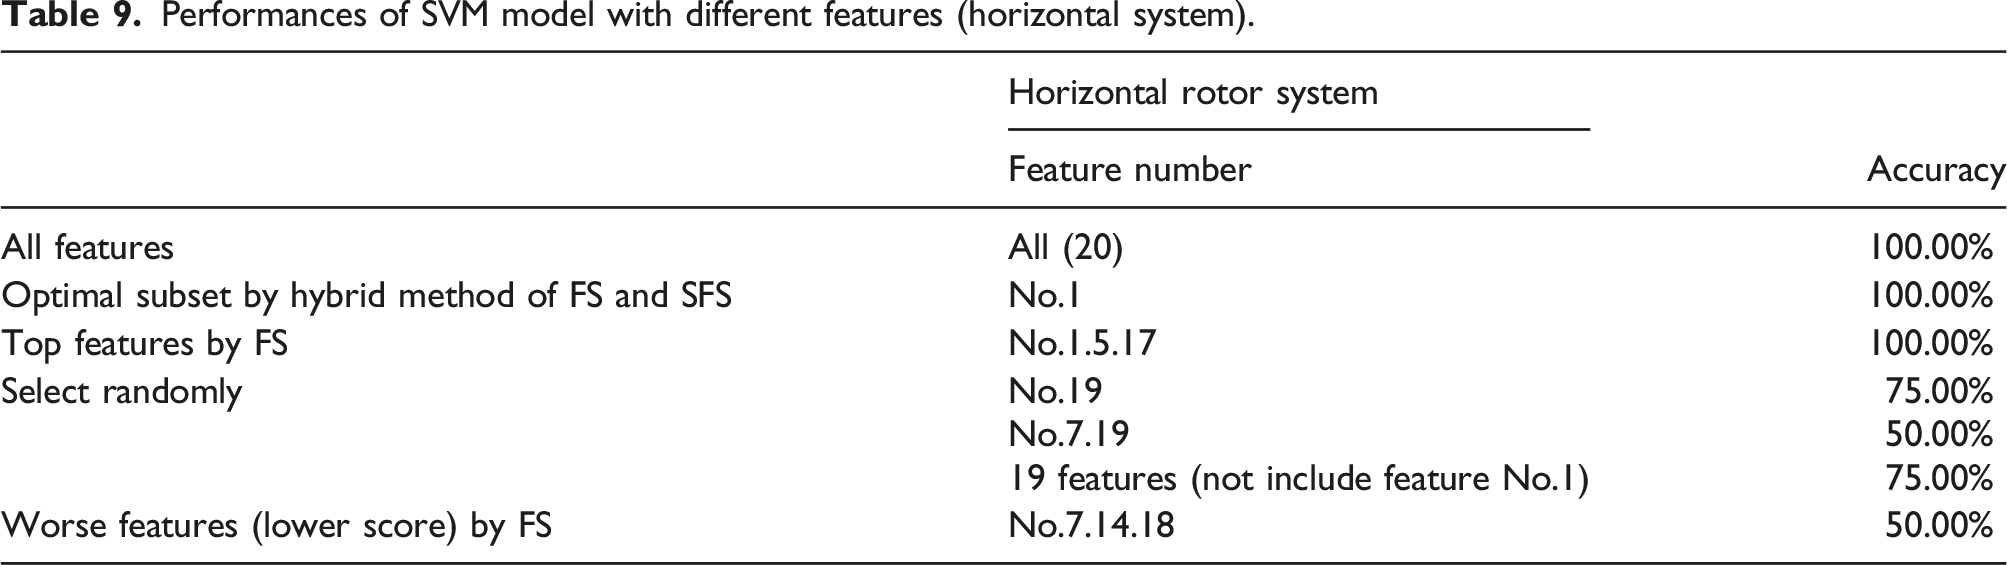
According to Table 6 and Table 7, when the weight of a feature is much higher than others like the case of horizontal system, optimal subset may be obtained by only performing the filter method. However, when the weights of certain features are largest and in same order, the results will be better by using the proposed hybrid feature selection method. When the results obtained by the filter method and results obtained by the wrapper method are inconsistent, wrapper models tend to give better results because it uses target function as a part of the selection process.
In addition, Table 8 and Table 9 show performances using all features are also good. Some papers illustrate that considering multiple features the accuracy of the classifier should be better because it increases the information available, but it is not always true. In some cases, performances of SVM model with optimally selected features will be better. Furthermore, even if the performances of using all features and using optimally selected features are the same, the proposed method can reduce the number of features, which decreases the computing time, memory, and the complexity of the model.
Last, this result indicates the most important feature for the journal bearing of horizontal rotor system is the mean value of RMS for horizontal direction. Its importance is very high, and the diagnosis may be possible by using this feature only. On the other hand, for the journal bearing of vertical rotor system, RMS average coefficient of variation is most important, and then mean value and average coefficient of variation for kurtosis and skewness are also important. However, their importance is not dominant, and it is difficult to choose a few features to perform the diagnosis with high accuracy.
Conclusion
In this research, long-term experiment was performed for both vertical and horizontal rotor systems supported by the journal bearing with a little muddy water, and experiment data of journal bearings are obtained and analyzed. There is no initial artificial failure added to the system, and the journal bearing failure was developed in the normal rotating condition. The support vector machine (SVM) method is applied for fault diagnosis and feature selection method was discussed. The most important feature for the journal bearing was also discussed. The following conclusions are obtained: (1) The long-term experimental data including some failure symptom was obtained successfully for both vertical and horizontal rotor systems supported by the journal bearing with a little muddy water without no initial artificial failure added to the system, and the journal bearing failure was developed in the normal rotating condition. (2) Choosing the appropriate kernel function is important for SVM model training. The accuracies of the SVM models are higher than 97% under the condition of selecting suitable kernel function and features. (3) A hybrid feature selection method combining filter method (Fisher score) and wrapper method (sequential forward selection) is proposed. The set of features are firstly reduced using a filter selection method, and then sequential forward selection is performed in order to obtain optimal subset of features in a reasonable time. The filter method such as Fisher score is efficient only in some cases, whereas the proposed feature selection method tends to give better results. The proposed feature selection method can decrease the computing time, memory, and the complexity of the model by reducing the number of features. (4) For the journal bearing of horizontal rotor system, the most important feature is the mean value of RMS for horizontal direction. Its importance is very high, and the diagnosis may be possible by using this feature only. On the other hand, for the journal bearing of vertical rotor system, RMS average coefficient of variation is most important, and then mean value and average coefficient of variation for kurtosis and skewness are also important. However, their importance is not dominant, and it is difficult to choose a few features to perform the diagnosis with high accuracy.
ORCID iDs
Tsuyoshi Inoue https://orcid.org/0000-0002-6913-9196
Shota Yabui https://orcid.org/0000-0001-5535-9473
Footnotes
Declaration of conflicting interests
The author(s) declared no potential conflicts of interest with respect to the research, authorship, and/or publication of this article.
Funding
The author(s) received no financial support for the research, authorship, and/or publication of this article.