
Abstract
The live load effect of bridge structure caused by traffic flow load is the largest in the sum of all live load effects. Study on the strain and deflection of the assembled beam bridge under the statistical stable traffic flow load can reveal the static effect and dynamic response law of the structure, and then evaluate the service performance of the structure. In this paper, the advanced bridge structure health monitoring technology is used to collect and analyze the traffic flow load parameters. First, according to the probability distribution function of each parameter in the traffic flow load model, the statistical stable traffic flow load is synthesized and the simplified bridge mechanical model is applied. Second, the variance and relative entropy are used to judge the statistical stability of the expectation, variance and probability density function of the static effect. Finally, the evolution law of the expectation, variance and probability density function of the static effect at different locations on the prefabricated beams of the whole bridge deck is analyzed when the static effect reaches the state of statistical stability.
Introduction
Traffic flow load is the primary live load of bridge structure. For bridges in normal service period, the traffic flow load borne by bridges is time-varying and random. With the extension of the inspection time, the randomness will gradually become stable. In a linear or weakly-nonlinear mechanical system, the static effect (strain and deflection) of bridge structure under traffic load will also show statistical stability.
As an important technology to ensure the safety of major civil engineering structures, structural health monitoring system has been rapidly developed and applied worldwide in recent years.1,2 The vehicle speed, vehicle weight, and transverse driving position of the moving vehicle on the bridge deck can be obtained by observation, and the weight information can be obtained by the weigh-in-motion (WIM) system. Through the statistical analysis of these observation information, the modeling of random traffic flow load can be realized. For the statistical and steady-state traffic flow load model on the two-dimensional bridge deck, it can be described by the event of vehicles on the bridge, vehicle speed, vehicle weight, and transverse driving position of vehicle in the lane. The Poisson distribution is commonly used to fit the probability of the number of vehicles passing through a certain cross-section.3,4 The randomness of vehicle speed can be fitted by Normal distribution, Logistic distribution, Gamma distribution, Weibull distribution, and Double Peak distribution.5–11 The randomness of vehicle weight can be fitted by Normal distribution, Lognormal distribution, Weibull distribution, Gamma distribution, Multi Peak distribution, and Extreme Value distribution.12–15 The randomness of transverse driving position of vehicle in the lane can be fitted by Double Peak distribution and Normal distribution.16,17 Through the latest proposed traffic load identification technology of the whole bridge deck, the statistical characteristics of the above parameters can be obtained more accurately, and the online measurement of the stable traffic flow load model can be realized.18–20
After obtaining the statistical and stable traffic flow load model, the model can be used to analyze the bridge structure effect. Some scholars established a random vehicle load model based on the short-term observation of traffic flow parameters through the specific cross-line of the bridge deck,21,22 and applied the load model to the mechanical model for mechanical effect analysis. Liu 23 simulated random traffic flow load, and studied the mean value of mid-span bending moment and bearing shear force of simply supported beams with different spans. Tang 24 simulated the mid-span bending moment and bearing shear force of bridge structure under random vehicle load according to the distribution law of vehicle weight, vehicle speed and transverse distribution position of vehicle in the short term, and proved that the load effect of simply supported beam and continuous beam with different spans could be described with logarithmic normal distribution. Combined with the cellular automata model at the micro level, more accurate traffic flow load simulation can be carried out. 25 Ruan 26 used the multivariate cell model and Monte Carlo simulation to simulate the random traffic load, and calculated the mid-span bending moment and bearing shear force of the simply supported beam by the influence line loading. Zhou 27 modeled the random traffic load based on the refined cellular automaton model, simulated the time-history curve of stress with the method of influence line loading, and analyzed the stress amplitude, which provided reference for the fatigue life analysis and fatigue resistance design of highway bridges. Based on the principle of probability and statistics, Jiao 28 proposed a reliability evaluation method of cable-stayed bridge combining the structural health monitoring system and the reliability method, and fitted the probability density function of the extreme strain of the main girder based on the Weibull distribution. Gao 29 studied the probability model of the extreme effect of traffic load during service period based on the health monitoring data of bridge structure. In order to evaluate the reliability of continuous rigid frame bridge, Li 30 found that the probability density function of stress effect of concrete bridge followed normal distribution.
Studying the statistical law of structural effect under random load can not only reveal the law of the static effect and dynamic response to evaluate the service performance of the structure but also verify the rationality of the use of design load to improve the design theory of new structures. In this concept, the paper researches the distribution of dynamic and static effect under steady traffic flow loads for assembled beam bridges, expecting to serve for further monitoring and evaluation of structural performance during service period.
Traffic flow load model
Traffic flow load model is an important tool for structural design and evaluation of bridge state. For the convenience of engineering application, the traffic flow load model should be simple and refined.
31
For the two-dimensional bridge deck, the parameters describing the phenomenon of random traffic flow include the event of vehicles on the bridge, the vehicle weight, the vehicle speed and the transverse position. Therefore, the random traffic flow model can be composed of the probability model of random vehicle on bridge, vehicle speed, vehicle weight, and transverse distribution of vehicles in the lane. Figure 1 shows the probability distribution function of parameters in the traffic flow model. Probability distribution function diagram of traffic flow model parameters.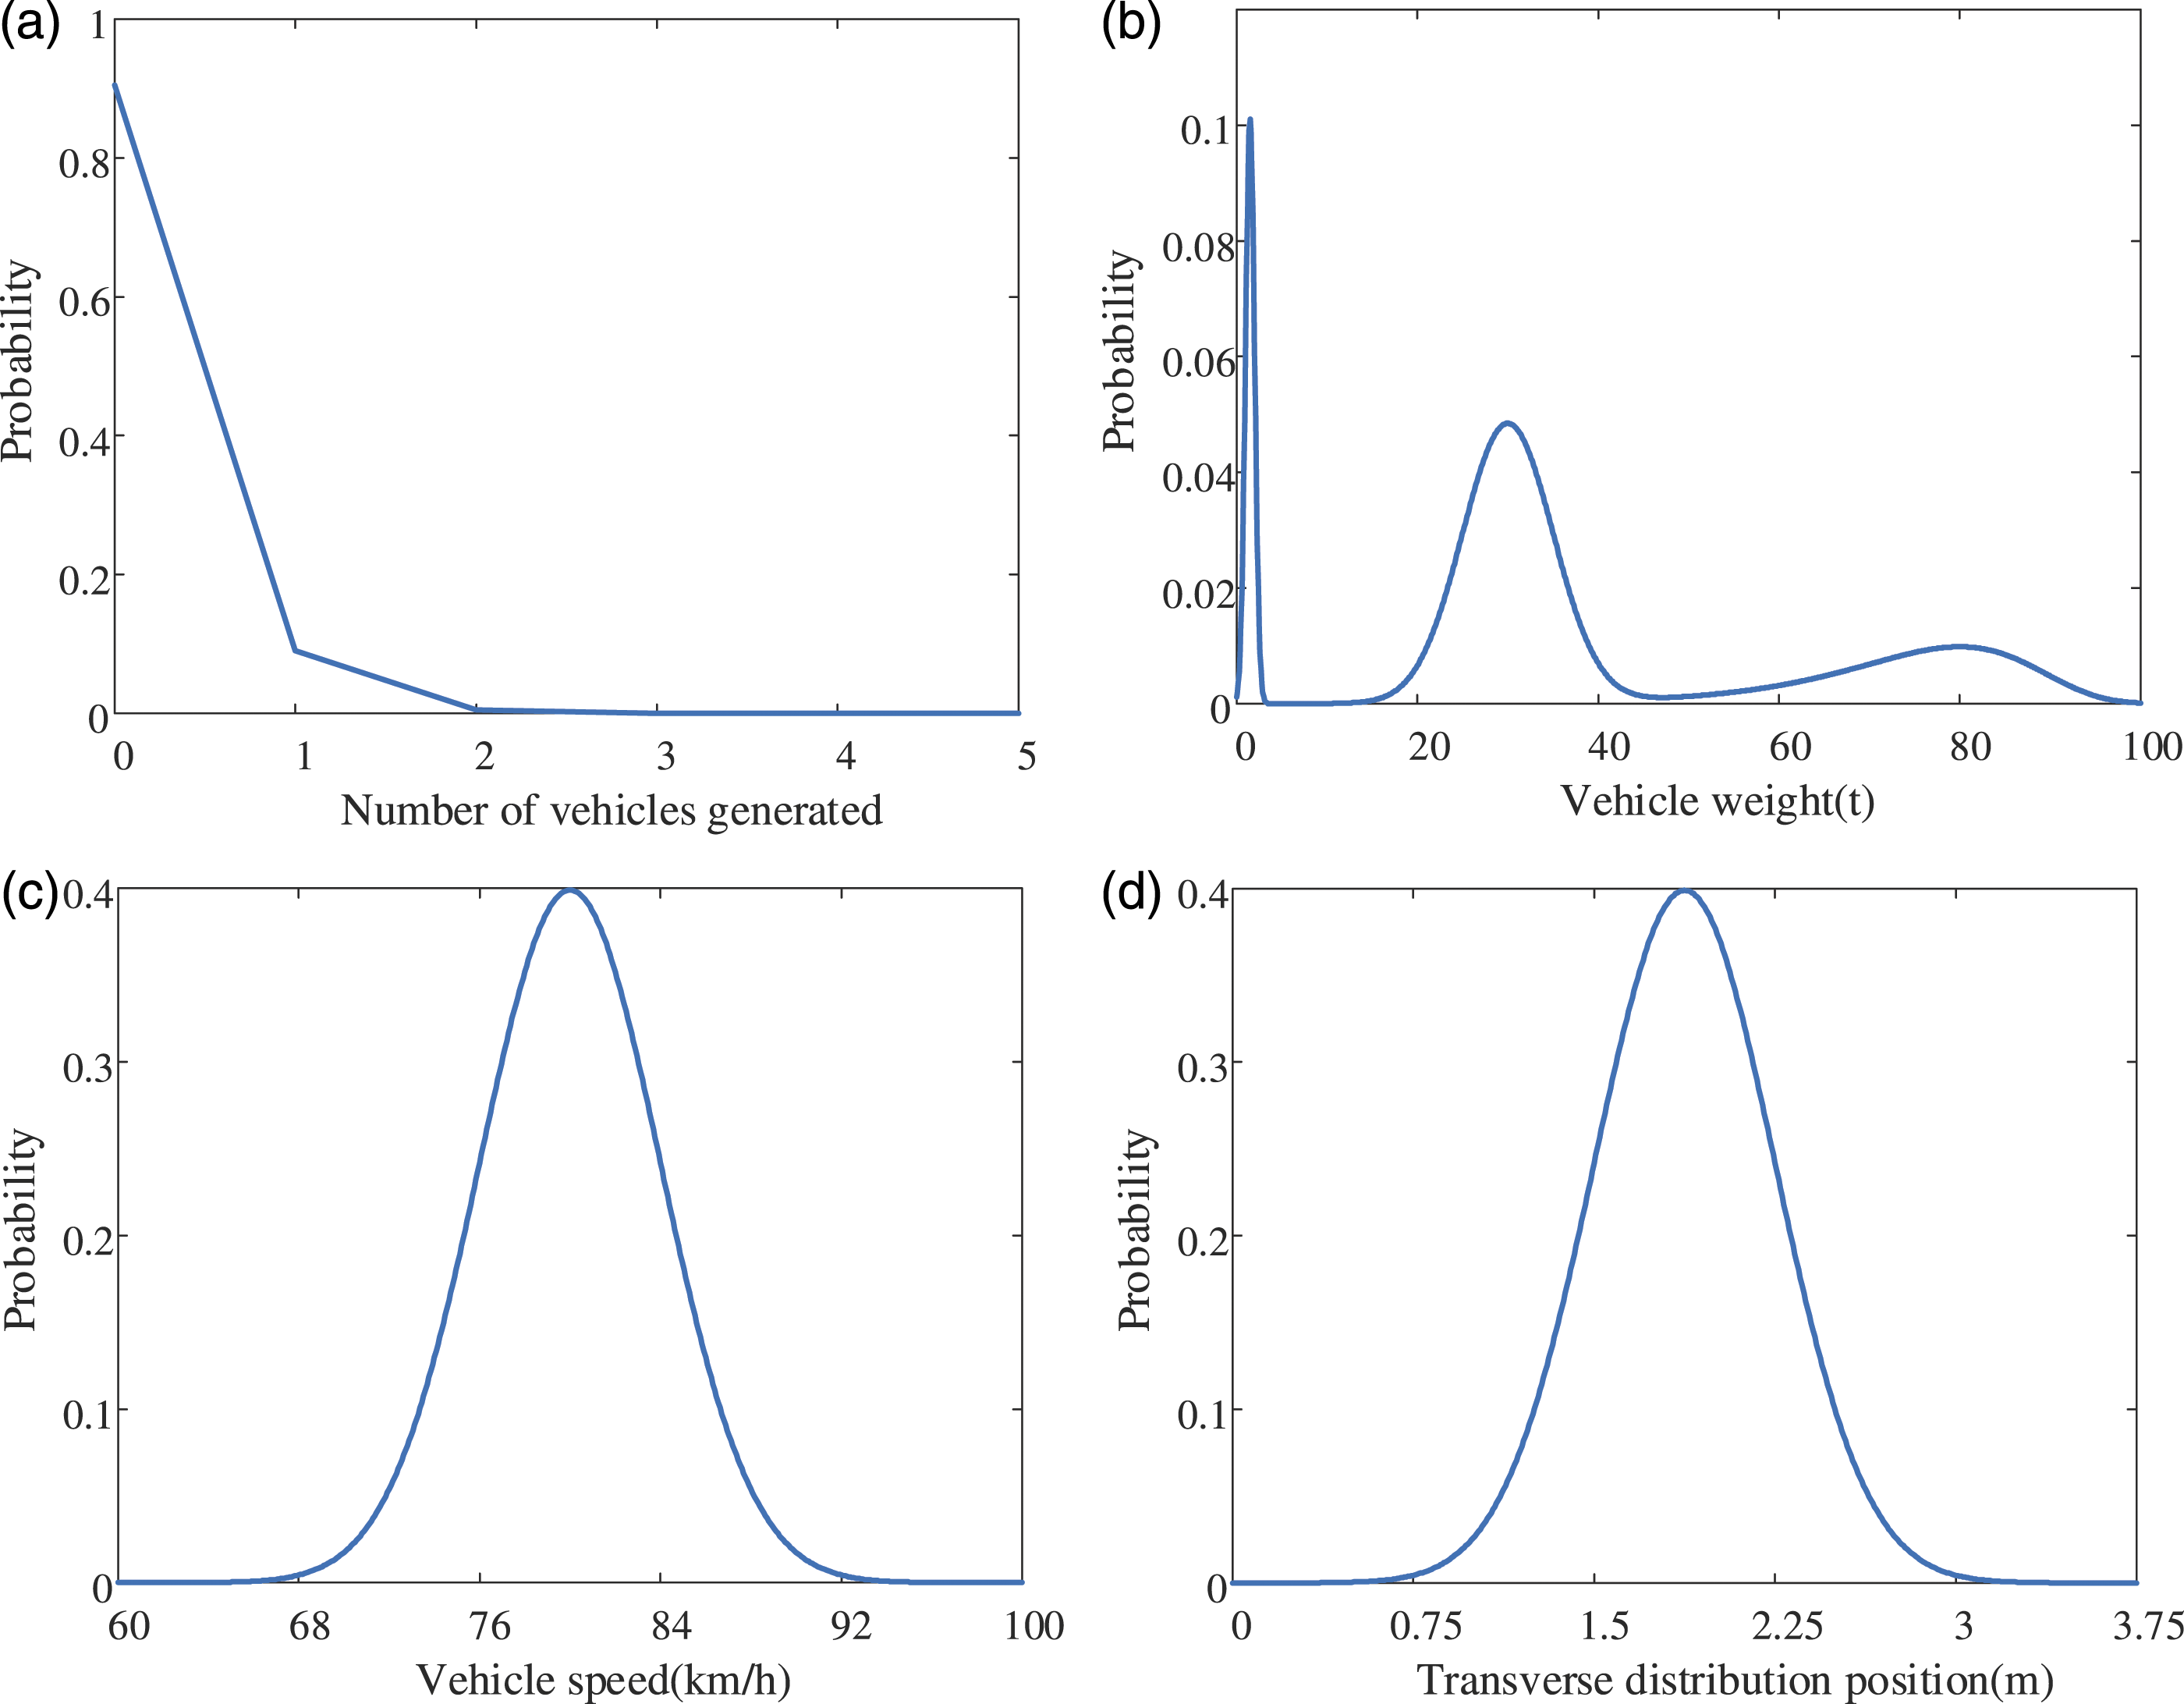
For random traffic flow with low traffic density, the interaction between vehicles can be ignored. Therefore, the Poisson probability distribution can be used to describe the random vehicle access to the bridge.32,33 The probability expression of Poisson distribution is as follows

The probability model of random vehicle weight is a Three-peak distribution, which is composed of two Normal distributions and one Extreme Value distribution. And the three peaks correspond to the vehicle weight of small vehicles, medium vehicles and large vehicles, respectively.32,33 The probability expression of Three-peak distribution is as follows

Vehicle speed has the characteristics of randomness and time-varying. Most researchers ignore the time-varying of vehicle speed when simulating traffic flow. The randomness of vehicle speed can be described by Normal distribution,32,33 the probability expression is as follows


Parameters of traffic flow model.
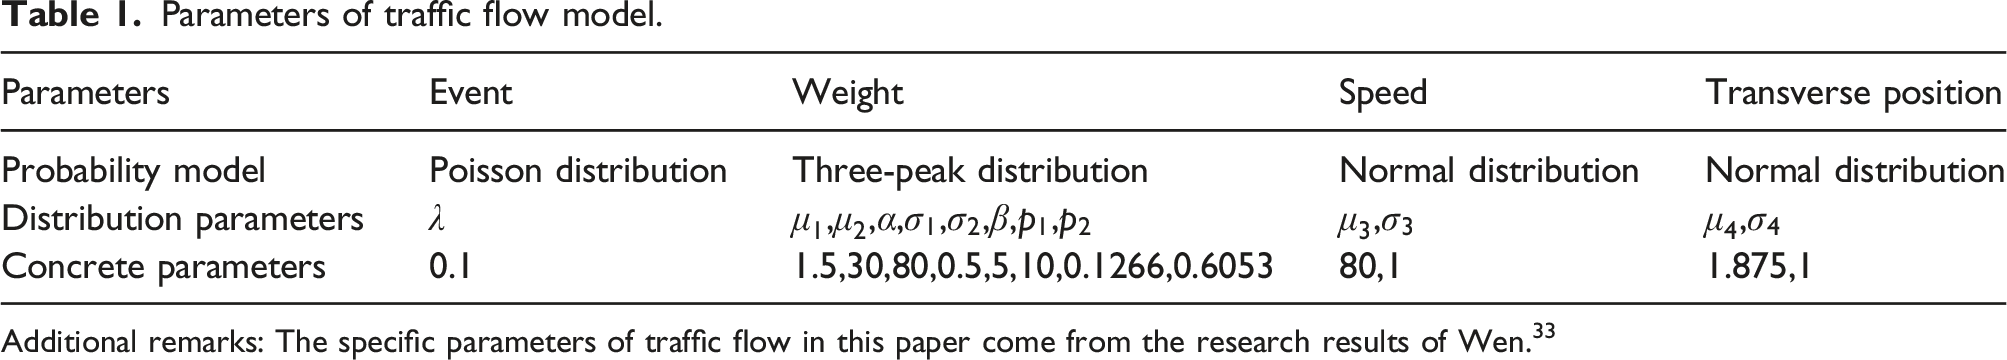
Additional remarks: The specific parameters of traffic flow in this paper come from the research results of Wen. 33
The key of Monte Carlo simulation of random traffic flow load is to generate random numbers with the same probability distribution function as the actual traffic flow parameters.
26
The specific steps of generating random traffic flow load are given in Figure 2. First, whether the vehicle is on the bridge at the moment is judged. If the vehicle is on the bridge, the random number is generated according to the probability distribution function of the traffic flow model parameters, and the vehicle speed, vehicle weight and transverse distribution position of the vehicle are given randomly by the random traffic flow load model. In the simulation process, the longitudinal position of the vehicle on the bridge deck is updated continuously. If the vehicle is off the bridge, the vehicle weight, vehicle speed, and transverse position information are deleted. At first, the vehicle load on the bridge deck is transversely distributed to each prefabricated beam, and the strain and deflection at any position are calculated according to the static effect influence line of the prefabricated beam. After the number of strain and deflection meets the requirements of statistical stability, statistical analysis is carried out. Monte Carlo simulation flow chart.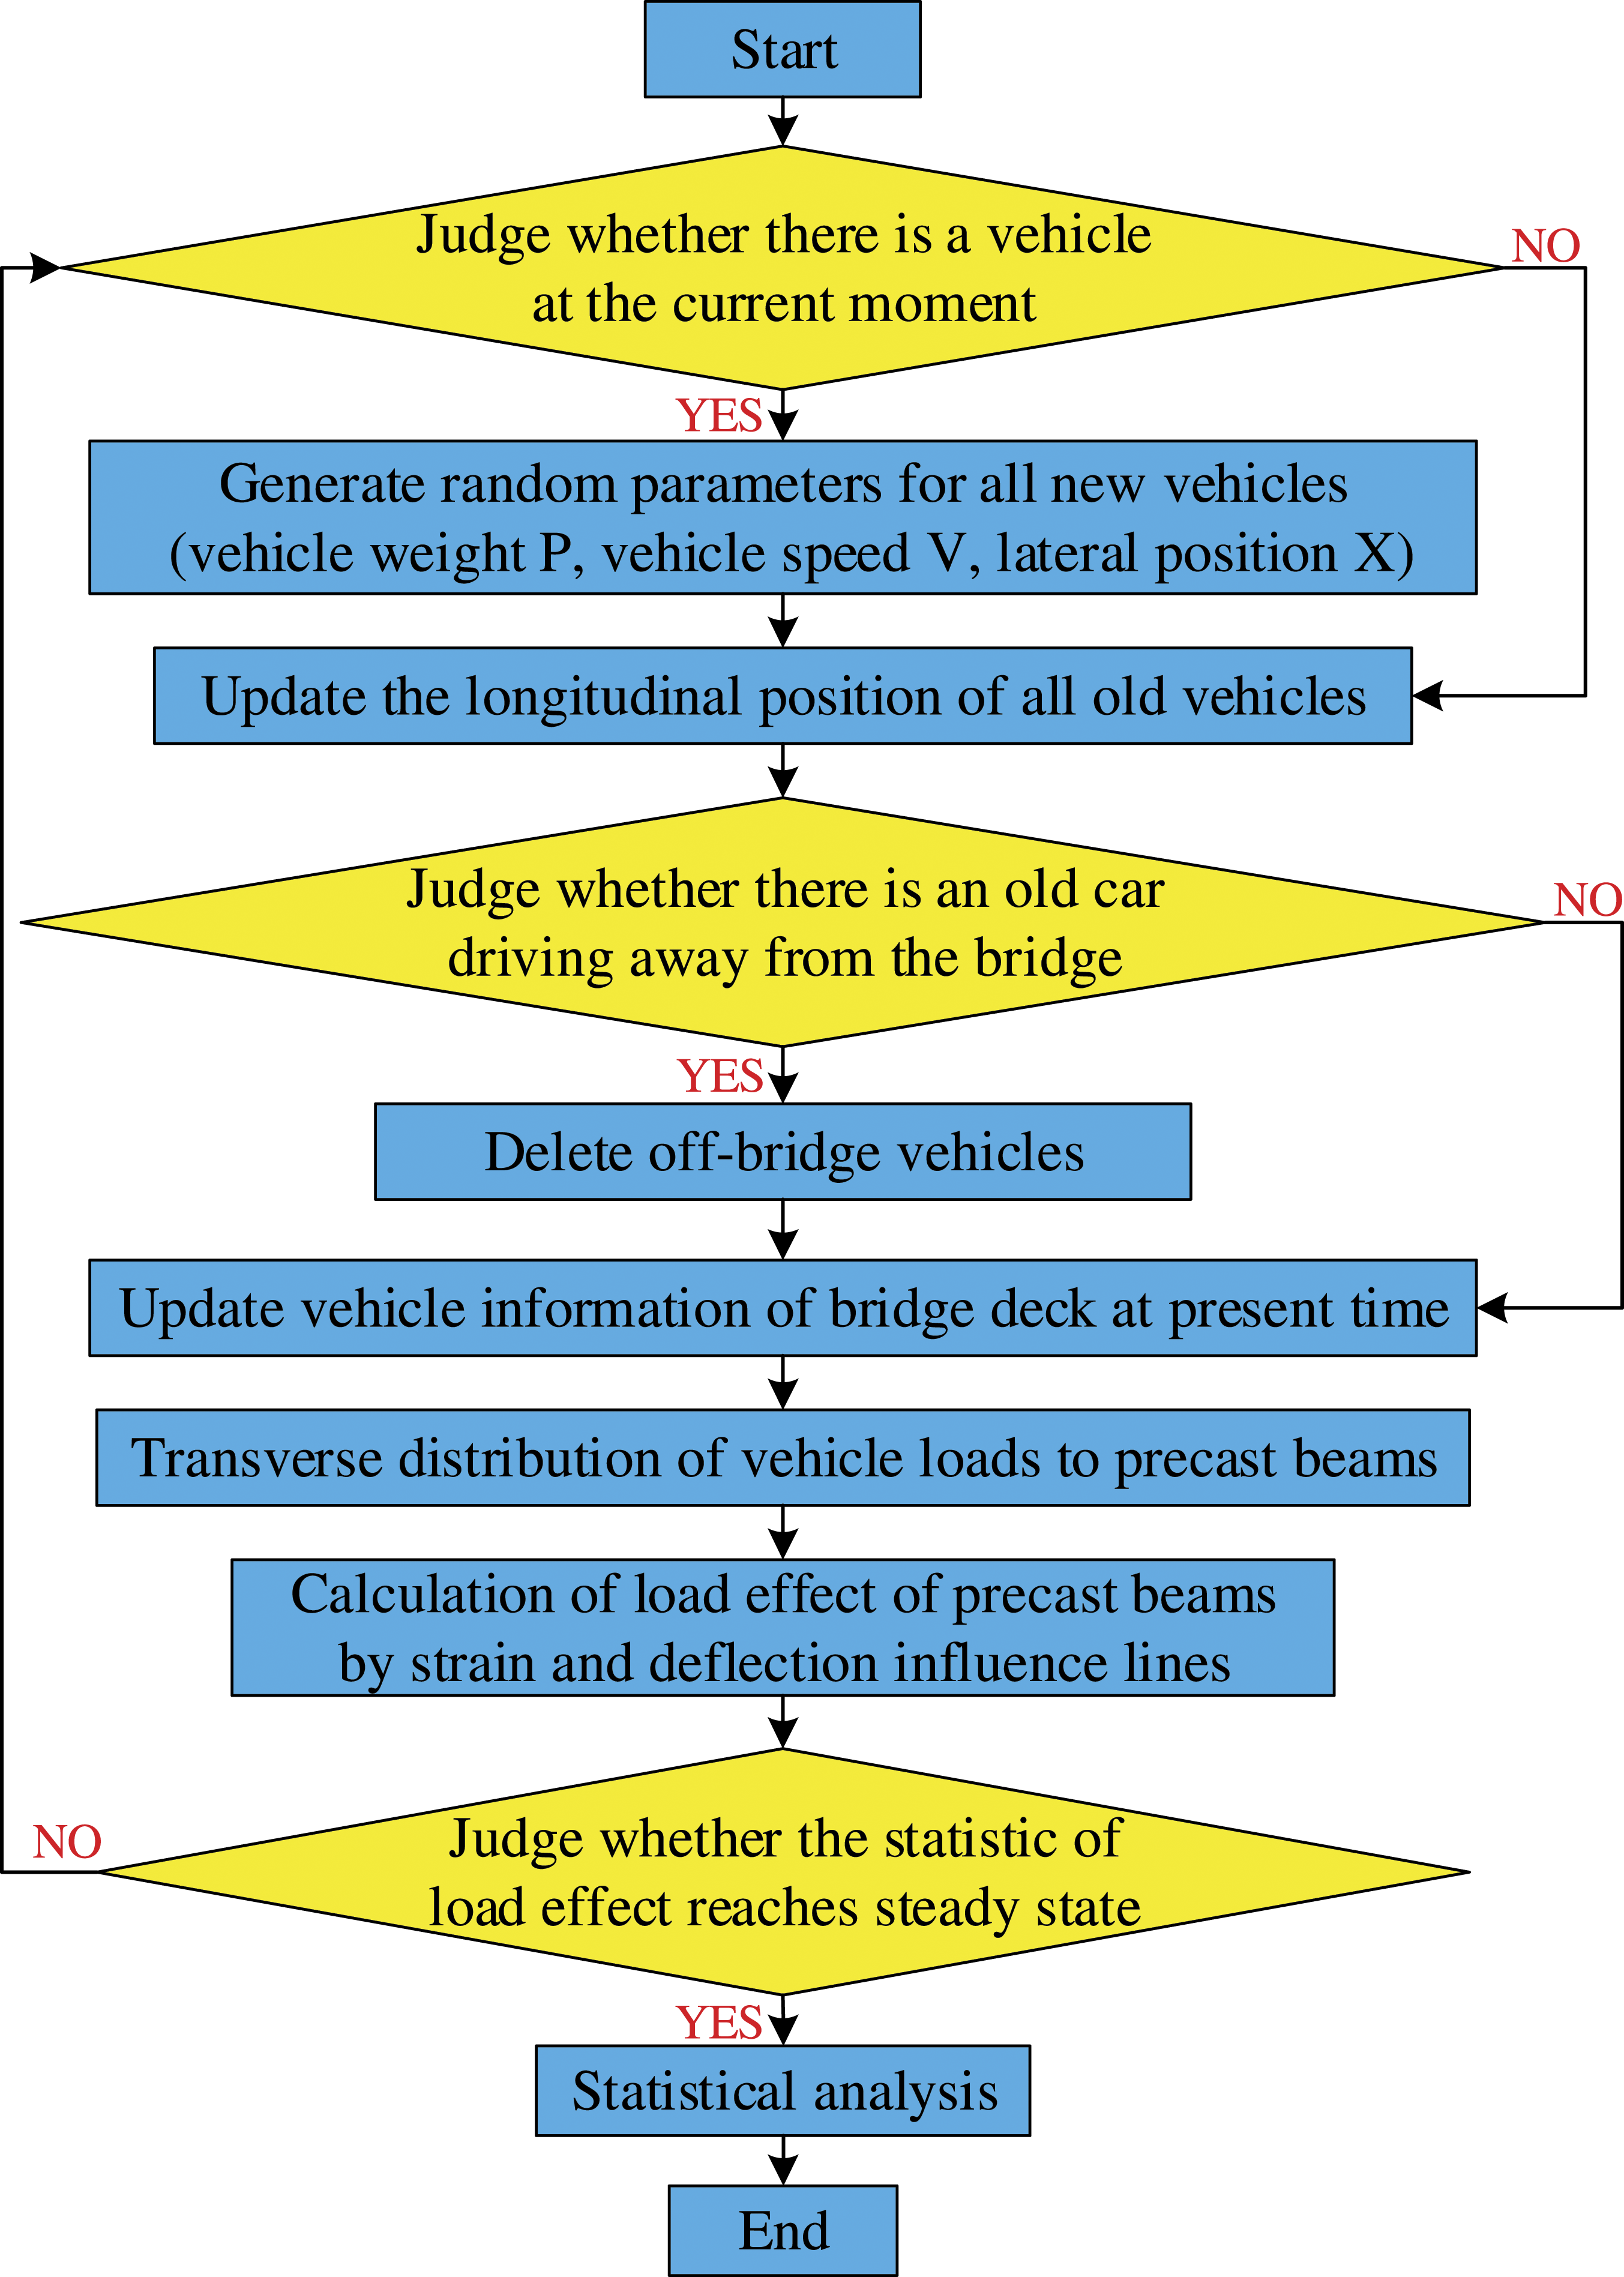
Simulation analysis of static effect of assembled beam bridge
Assembled beam bridge is widely used in the world. The stress form of assembled beam bridge is relatively simple, and a relatively simple mechanical model can be established to simulate and calculate the strain and deflection of bridge structure under traffic flow load on bridge deck. The traffic flow load on the bridge deck is distributed to the prefabricated beams of the bridge deck by the force transmission mechanism of the hinge joint. This force transmission mechanism ensures that all prefabricated beams work collaboratively at the same time, and avoids the occurrence of single plate bearing diseases. Therefore, the influence line of transverse load distribution of assembled beam bridge can be established so that the traffic flow load is allocated to each prefabricated beam according to certain rules. Then, the strain and deflection are calculated by the strain and deflection influence line of any position. Through Monte Carlo numerical simulation, the random and stable traffic flow load is generated, and the load is loaded on the static effect calculation model to obtain the two static effect of strain and deflection at any position of each prefabricated beam on the whole bridge deck.
Load transverse distribution influence line of assembled beam bridge
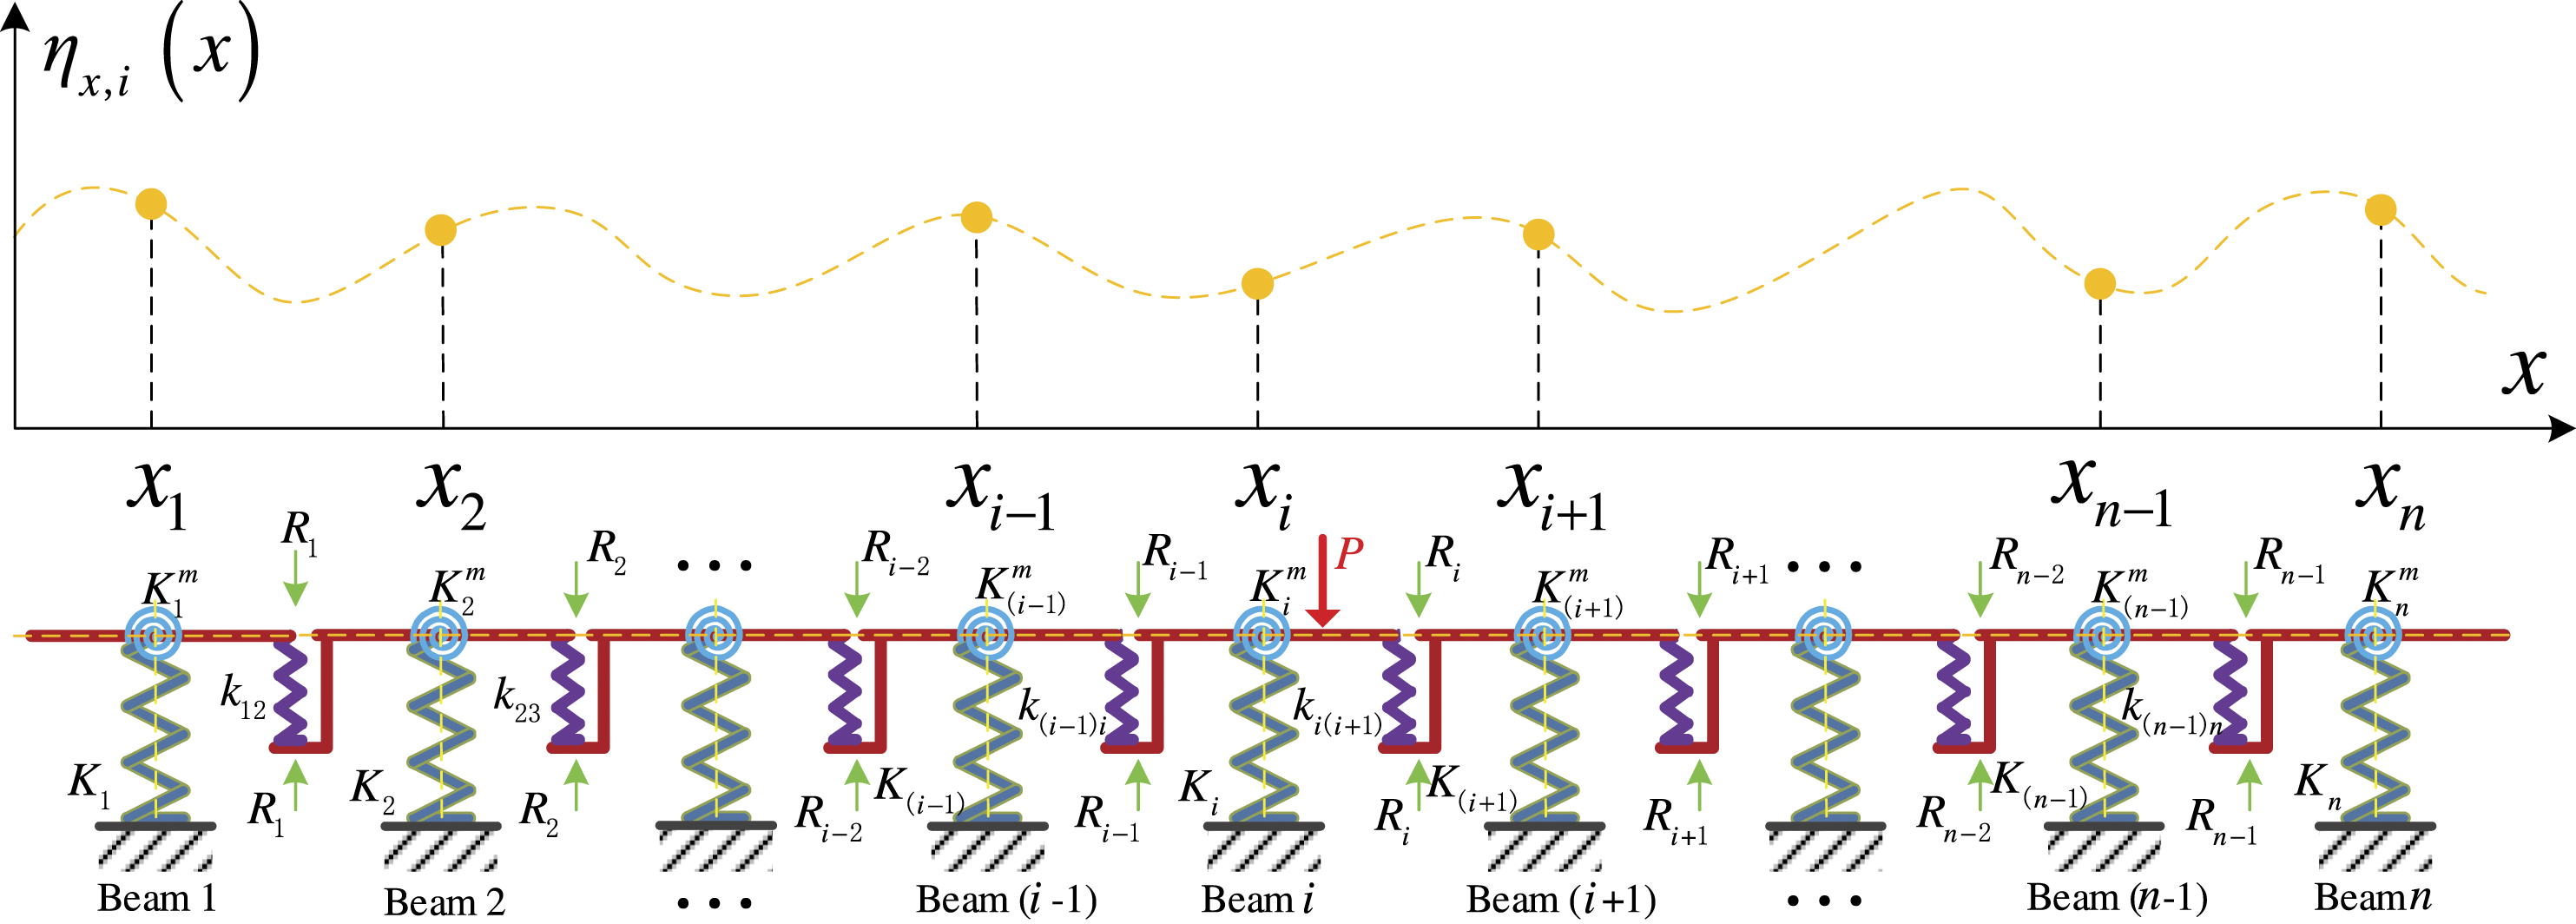
Each prefabricated beam is regarded as having vertical stiffness Ki and torsional stiffness Kmi. The prefabricated beam of the assembled beam bridge forms a whole through the transverse connection of the hinge joint. The hinge joint plays an important role in the force transmission, and the traffic flow load is distributed to each prefabricated beam in the form of shear force. All prefabricated beams connect the bridge deck horizontally into a whole by connecting springs, which have vertical stiffness 


The influence line of the transverse distribution of the load of the assembled beam bridge can be constructed. The traffic flow load is distributed to each prefabricated beam by loading the influence line. For the hinged plate beam method, the adjacent beams are regarded as hinged, and this connection mechanism only transfers shear force. On this basis, Wen
34
regarded hinge joints as springs with vertical stiffness, and established a simplified mechanical model, as shown in Figure 3. The load distribution of each prefabricated beam is calculated from the perspective of influence line. The calculation expression is as follows Mechanical model of load transverse distribution for prefabricated beam bridge.
The strain influence line of simply supported beam at any position
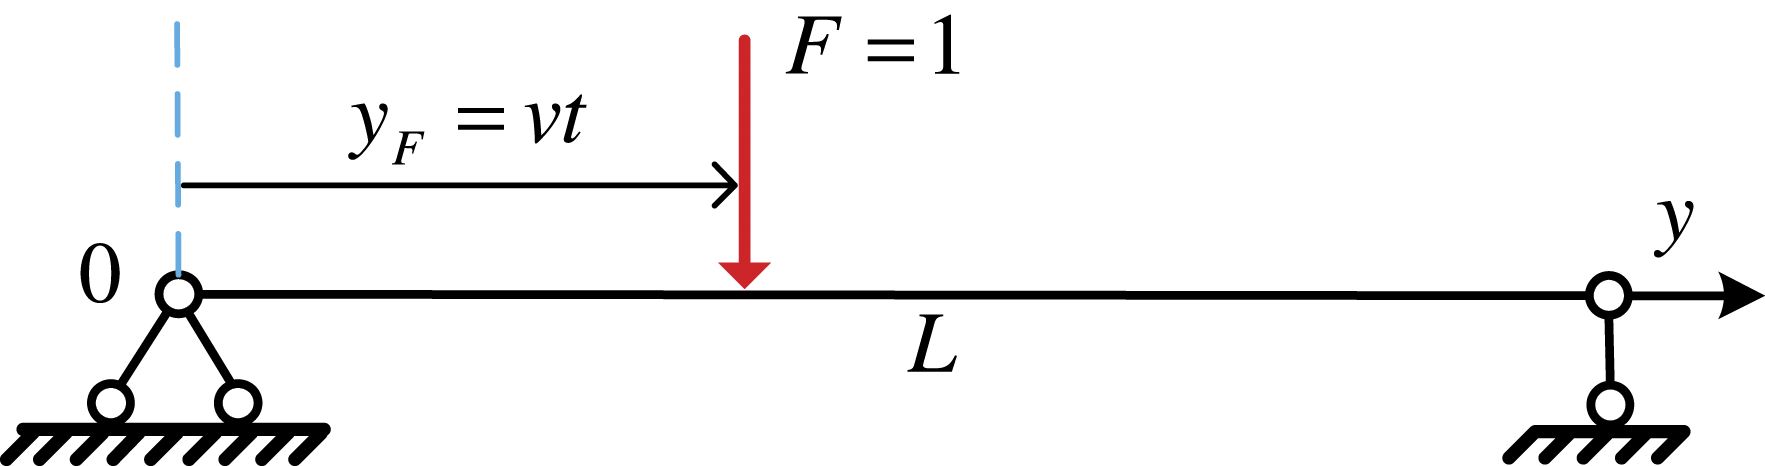
As shown in Figure 4, the bending moment influence line formula of simply supported beam under moving load is Diagram of moving unit force acting on the simply supported beam.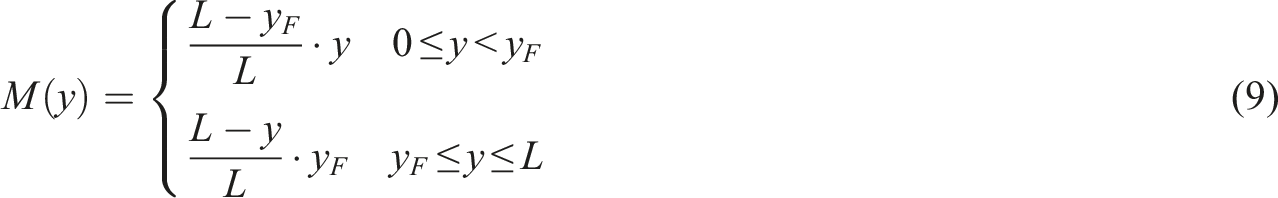
According to the calculation formula of strain and bending moment: 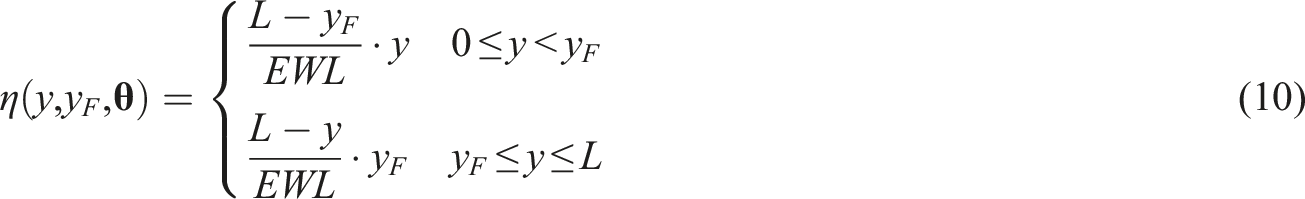
Under the action of the 
Under the traffic flow load consisting of 
The deflection influence line of simply supported beam at any position
Under moving load, the deflection influence line formula of simply supported beam is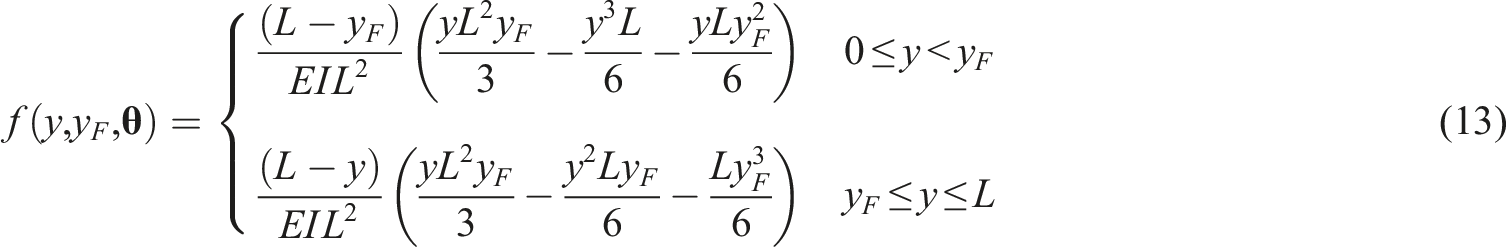
Under the action of the 
Under the traffic flow load composed of 
Numerical simulation
In order to explore the statistical law of strain and deflection of assembled beam bridges under steady and random traffic flow loads, a one-way and three-lane prefabricated hollow slab girder bridge was taken as the research object for numerical simulation. The span of the bridge is 20 m, and the total width of the bridge deck is 11.25 m, which is assembled by 9 prefabricated beams with width of 1.25 m, as shown in Figure 5. The geometric shape and physical properties of all prefabricated beams are the same. The moment of inertia is 0.0622 m4, the shear modulus is 1.3 × 10⁴ MPa, the sectional resistance moment is 0.1382 m3, and the elastic modulus of prefabricated concrete beams (C40 concrete) is 3.25 × 10⁴ MPa. The boundary condition is simply supported. Through Monte Carlo numerical simulation, the strain and deflection of each prefabricated beam at any position on the whole bridge deck are obtained. After 36,000 times of numerical simulation, the random traffic flow load gradually stabilizes. The strain and deflection of measuring points of the prefabricated beam are analyzed by expectation, variance, and probability density function statistical analysis. The method of calculating expectation in this paper is to calculate the expectation of the first n (n = 1,2, ..., 36,000) strain and deflection in turn. The variance of the first n strains and deflection effect is calculated in turn. Finally, 36,000 strain and deflection data at measuring points are fitted by probability density function curve. Cross-section of the assembled beam bridge.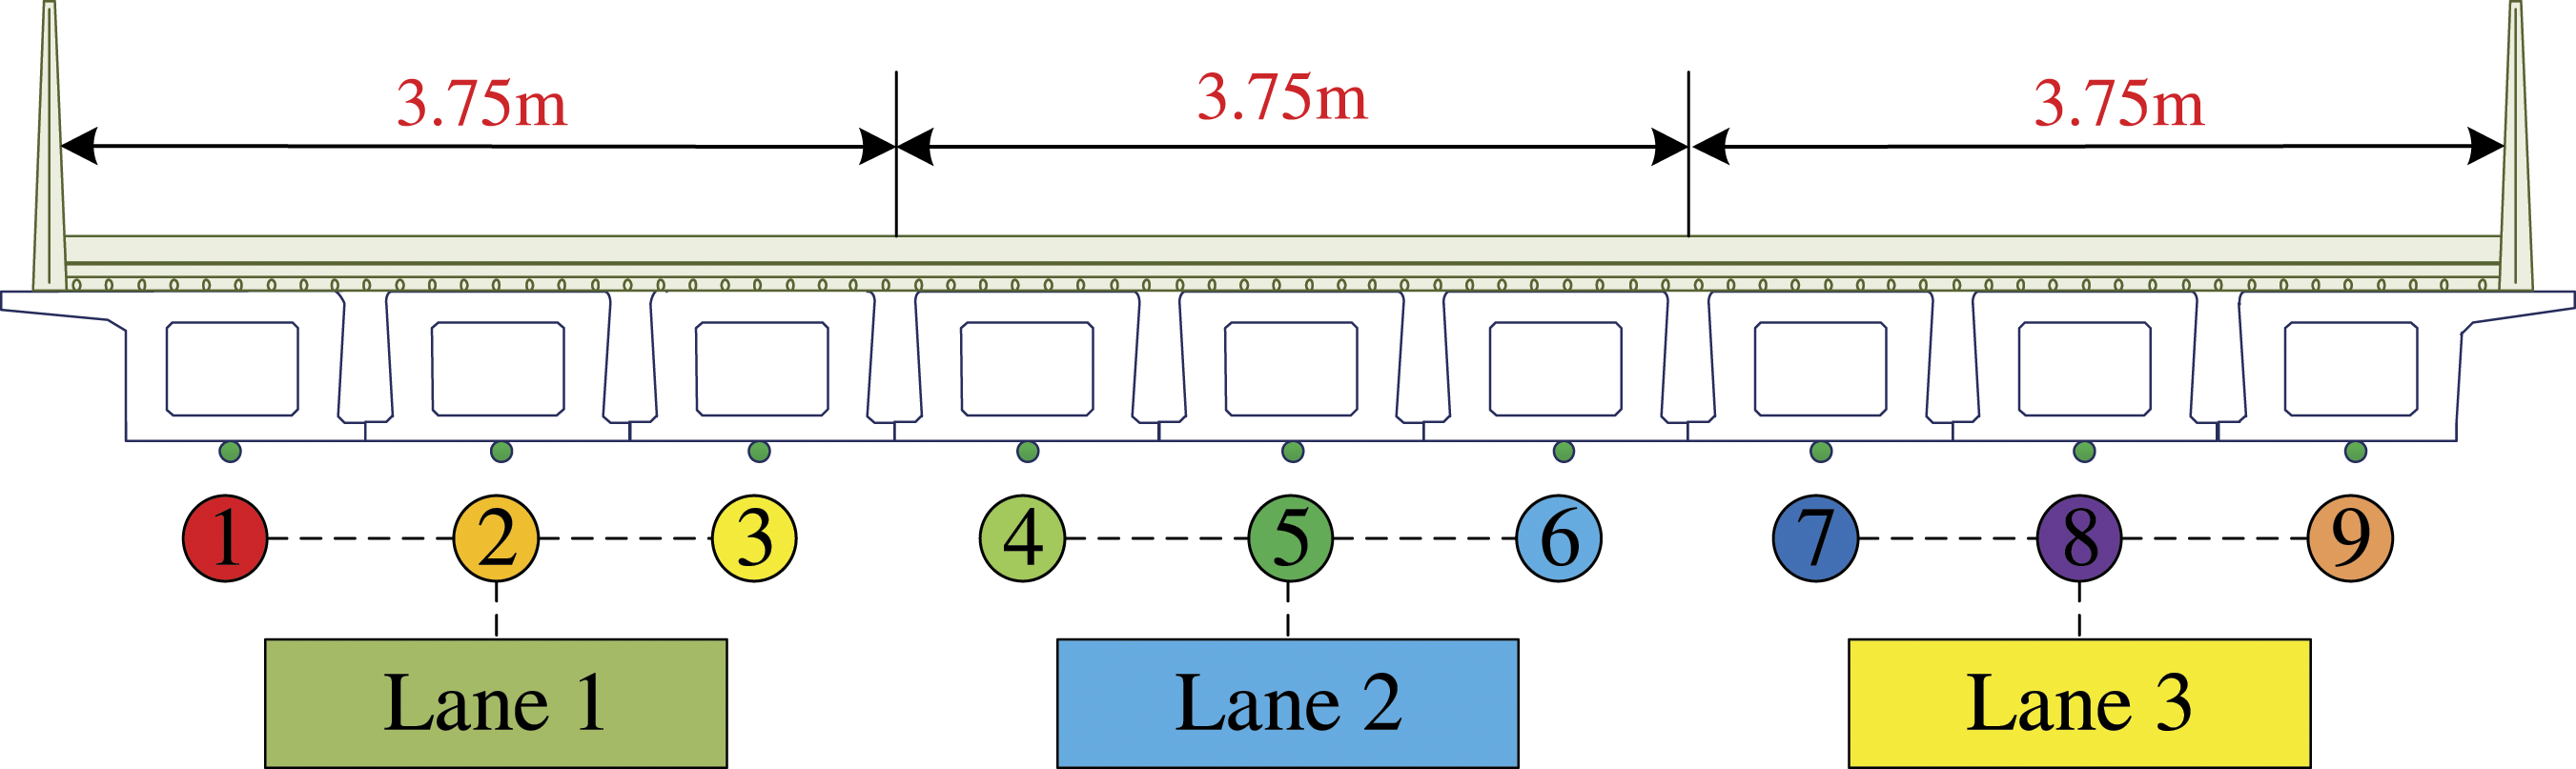
Statistical analysis of static effect
The Monte Carlo simulation is used to generate the random traffic flow load. With increasing number of simulations, the random traffic flow load gradually stabilizes, and the static effect also transits from the unstable state to the stable state. Therefore, it is crucial to judge the stable state of the static effect. First, the stability of static effect is analyzed. Second, the statistical laws of expectation, variance and probability density function of static effect of each measuring point of prefabricated beams are analyzed. Finally, the static effect of prefabricated beams on the whole bridge deck is statistically analyzed.
Statistical stability analysis of static effect
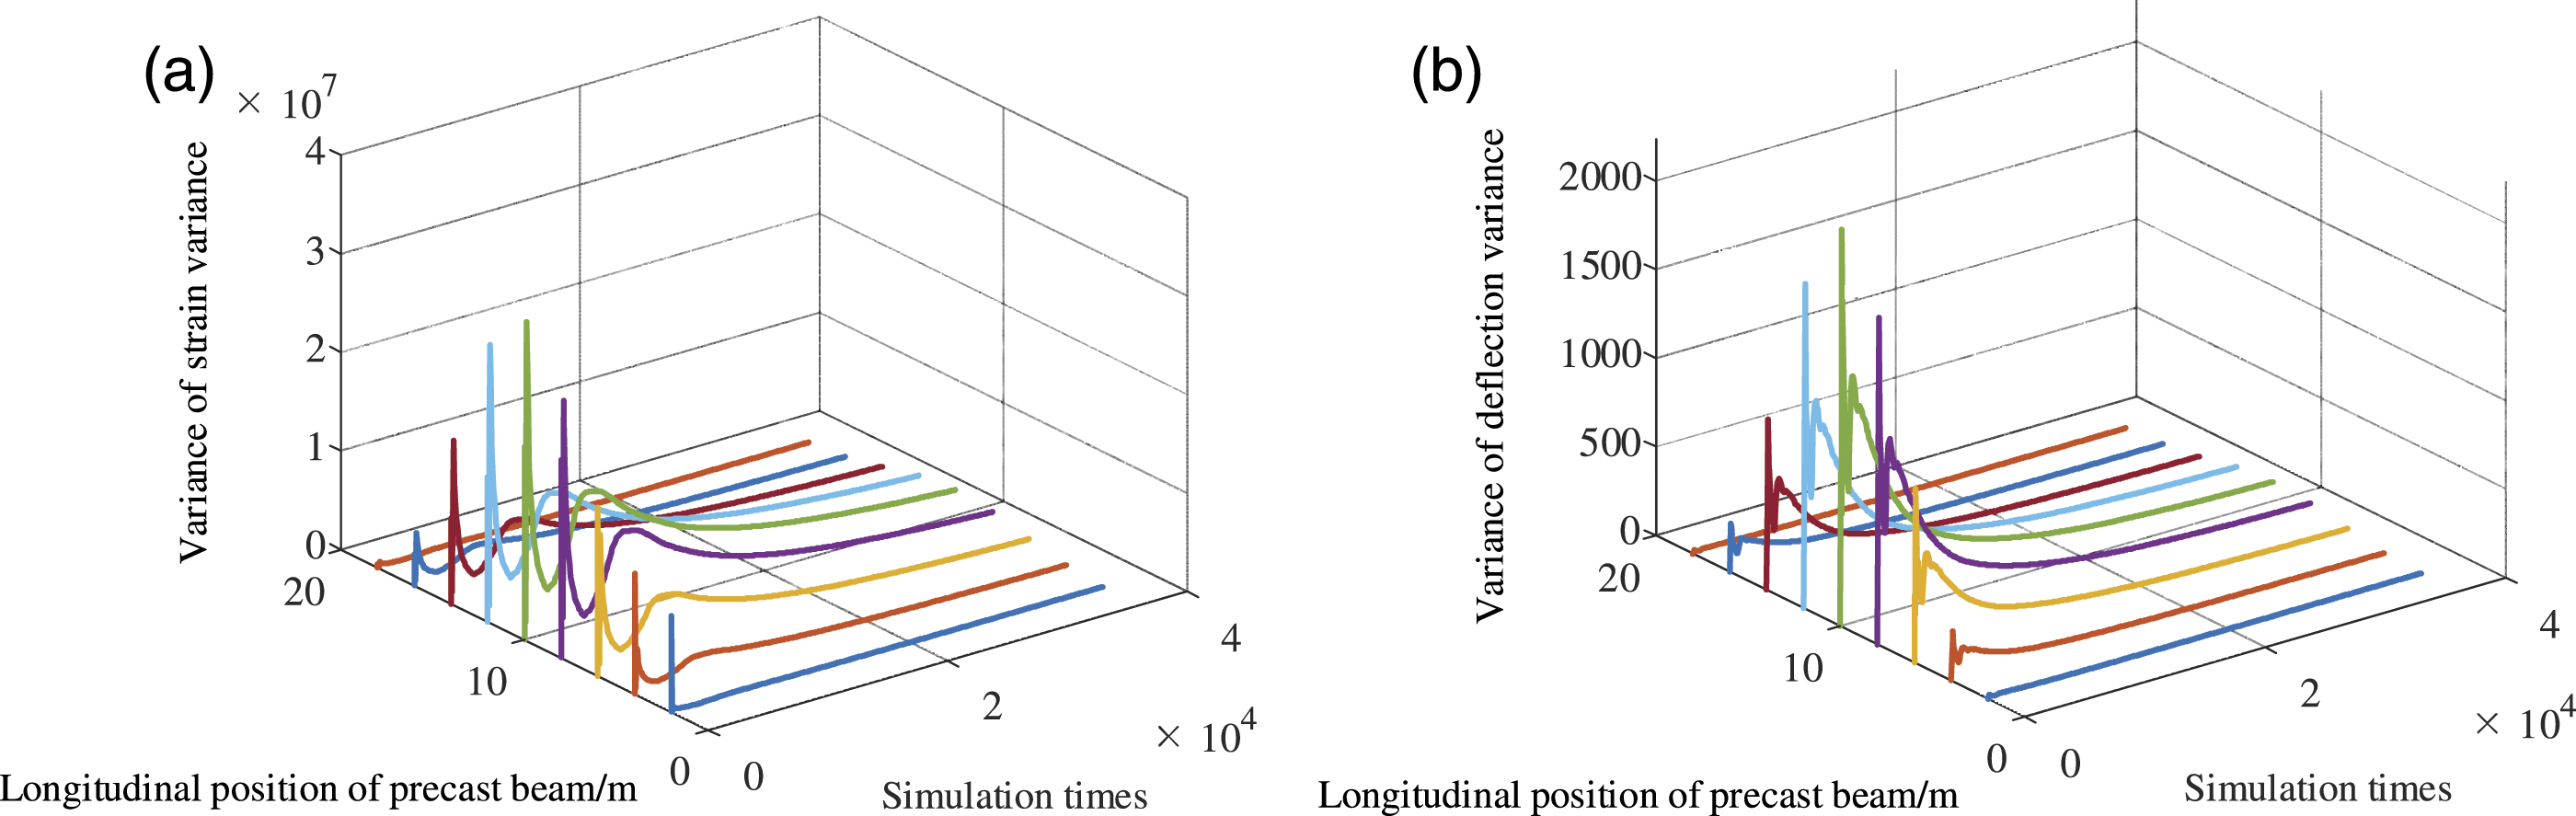
In order to study the statistical stability of static effect statistics (expectation and variance) at each measuring point of prefabricated beams, the statistical stability analysis of variance of static effect statistics is carried out. As shown in Figure 6 and Figure 7, when the number of simulation is small, the strain and deflection effect statistics are in a random and unstable state. With the increase of simulation times, the variance of static effect statistics of each measuring point increases first, then it decreases gradually, and finally it tends to 0. The static effect statistics transit from unstable state to stable state. Variance evolution curve of static effect expectation. (a) Variance of strain expectation at each measuring point of the prefabricated beam. (b) Variance of deflection expectation at each measuring point of the prefabricated beam. Variance evolution curve of static effect variance. (a) Variance of strain variance at each measuring point of the prefabricated beam. (b) Variance of deflection variance at each measuring point of the prefabricated beam.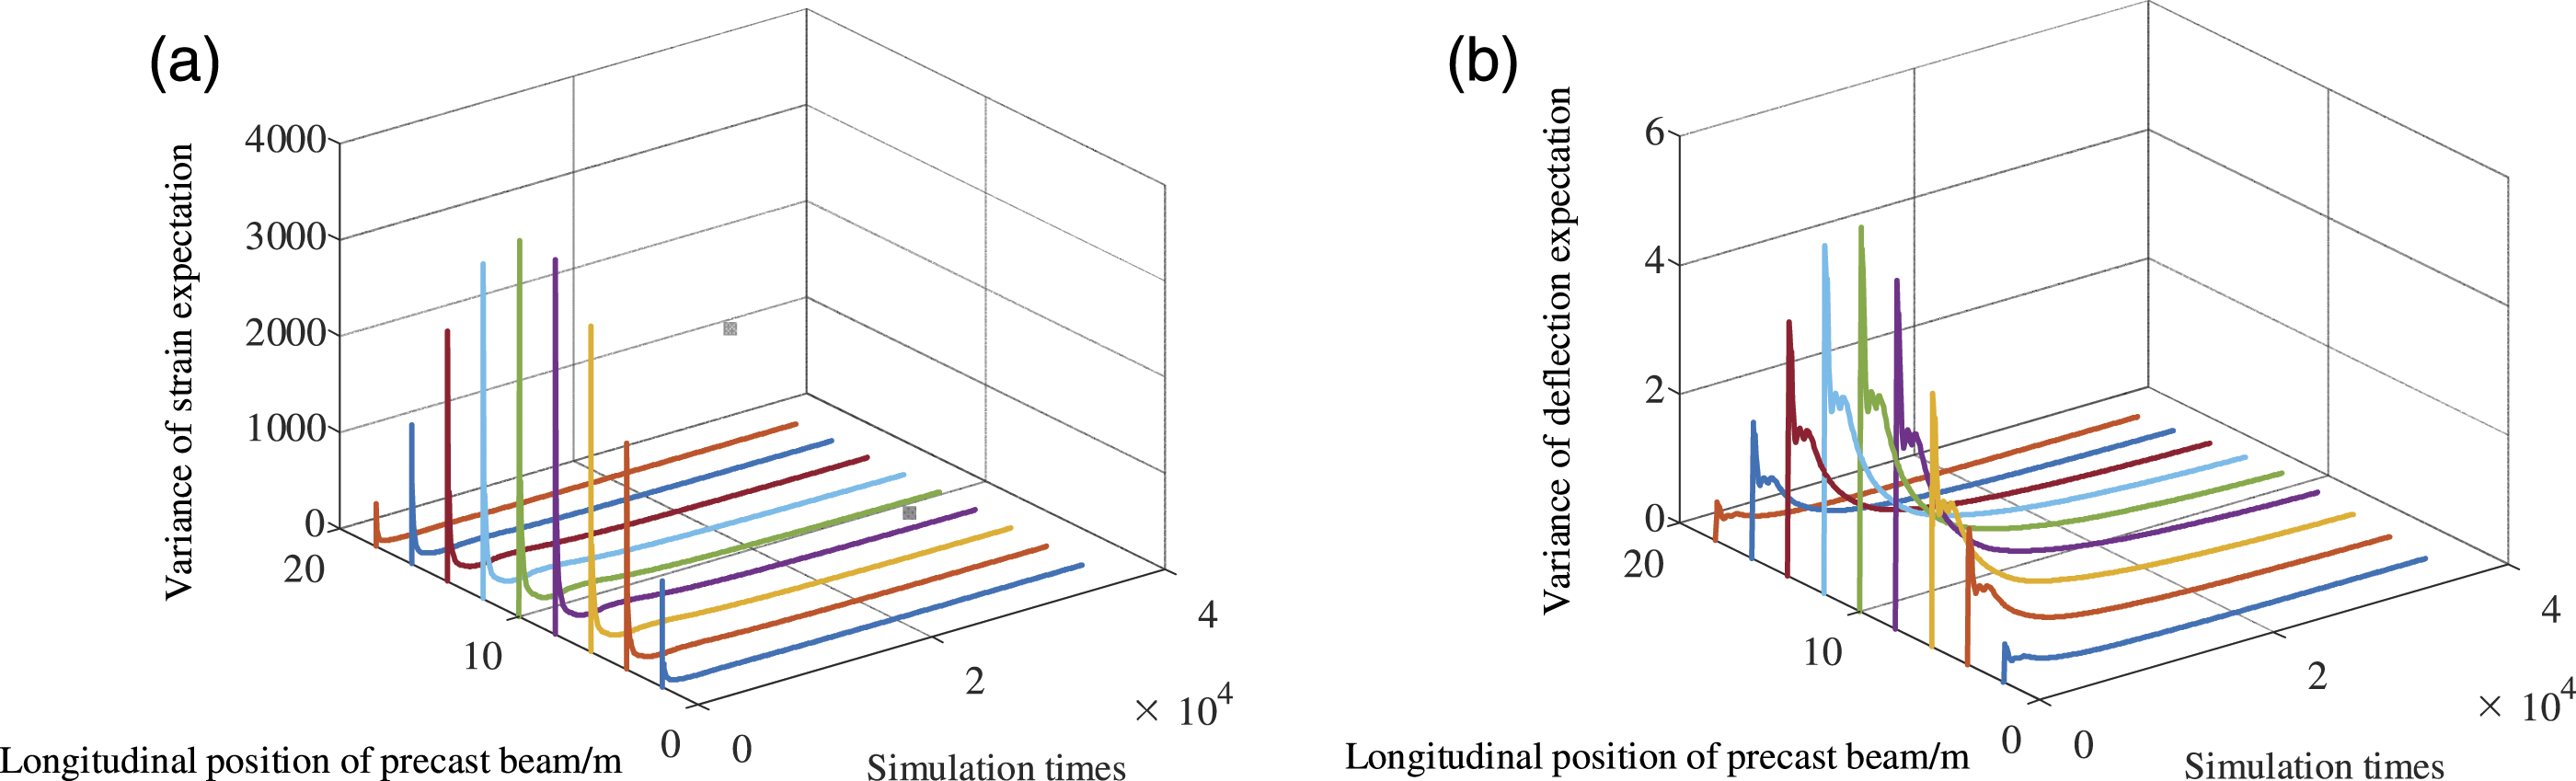
In statistical applications, the Kullback–Leibler Divergence (KLD) is often used to measure the degree of coincidence between the two probability distributions. When the KLD of the two probability distributions is equal to 0, it indicates that the two probability distributions are the same. In order to illustrate the statistical stability of the probability density function of static effect, the KLD of the probability density function fitted by the previous static effect and the probability density function fitted by the latter static effect are calculated with 1000 times as the calculation step. The KLD evolution curve of the probability density function of the static effect of each measuring point is drawn. As shown in Figure 8, when the number of simulations is small, the fluctuation of the KLD is large, indicating that the two probability density distribution functions have great differences. With the increase of simulation time, the KLD tends to be stable. When the simulation is 36,000 times, the KLD tends to 0, and the probability density function of the static effect can be regarded as the probability density function under steady state. KLD evolution curve of probability density function of static effect. (a) KLD of strain at each measuring point of the prefabricated beam. (b) KLD of deflection at each measuring point of the prefabricated beam.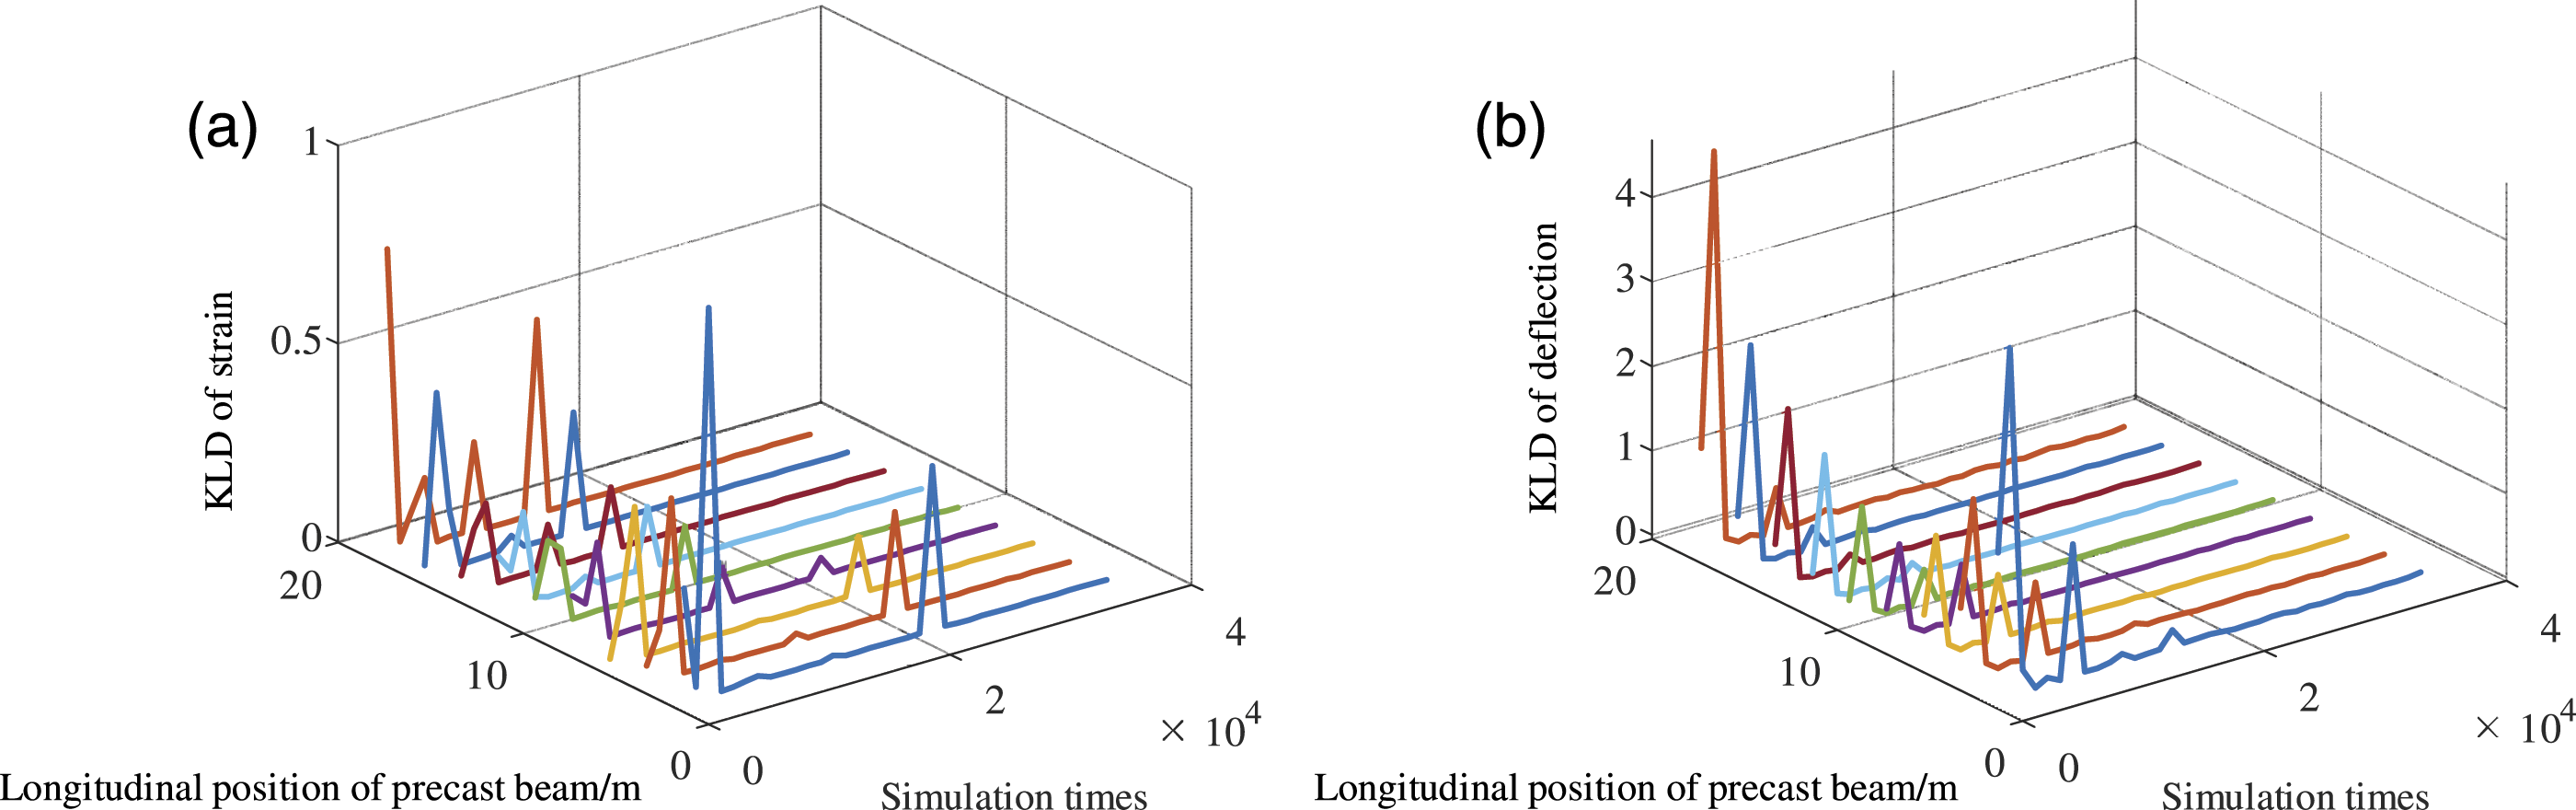
Statistical analysis of static effect
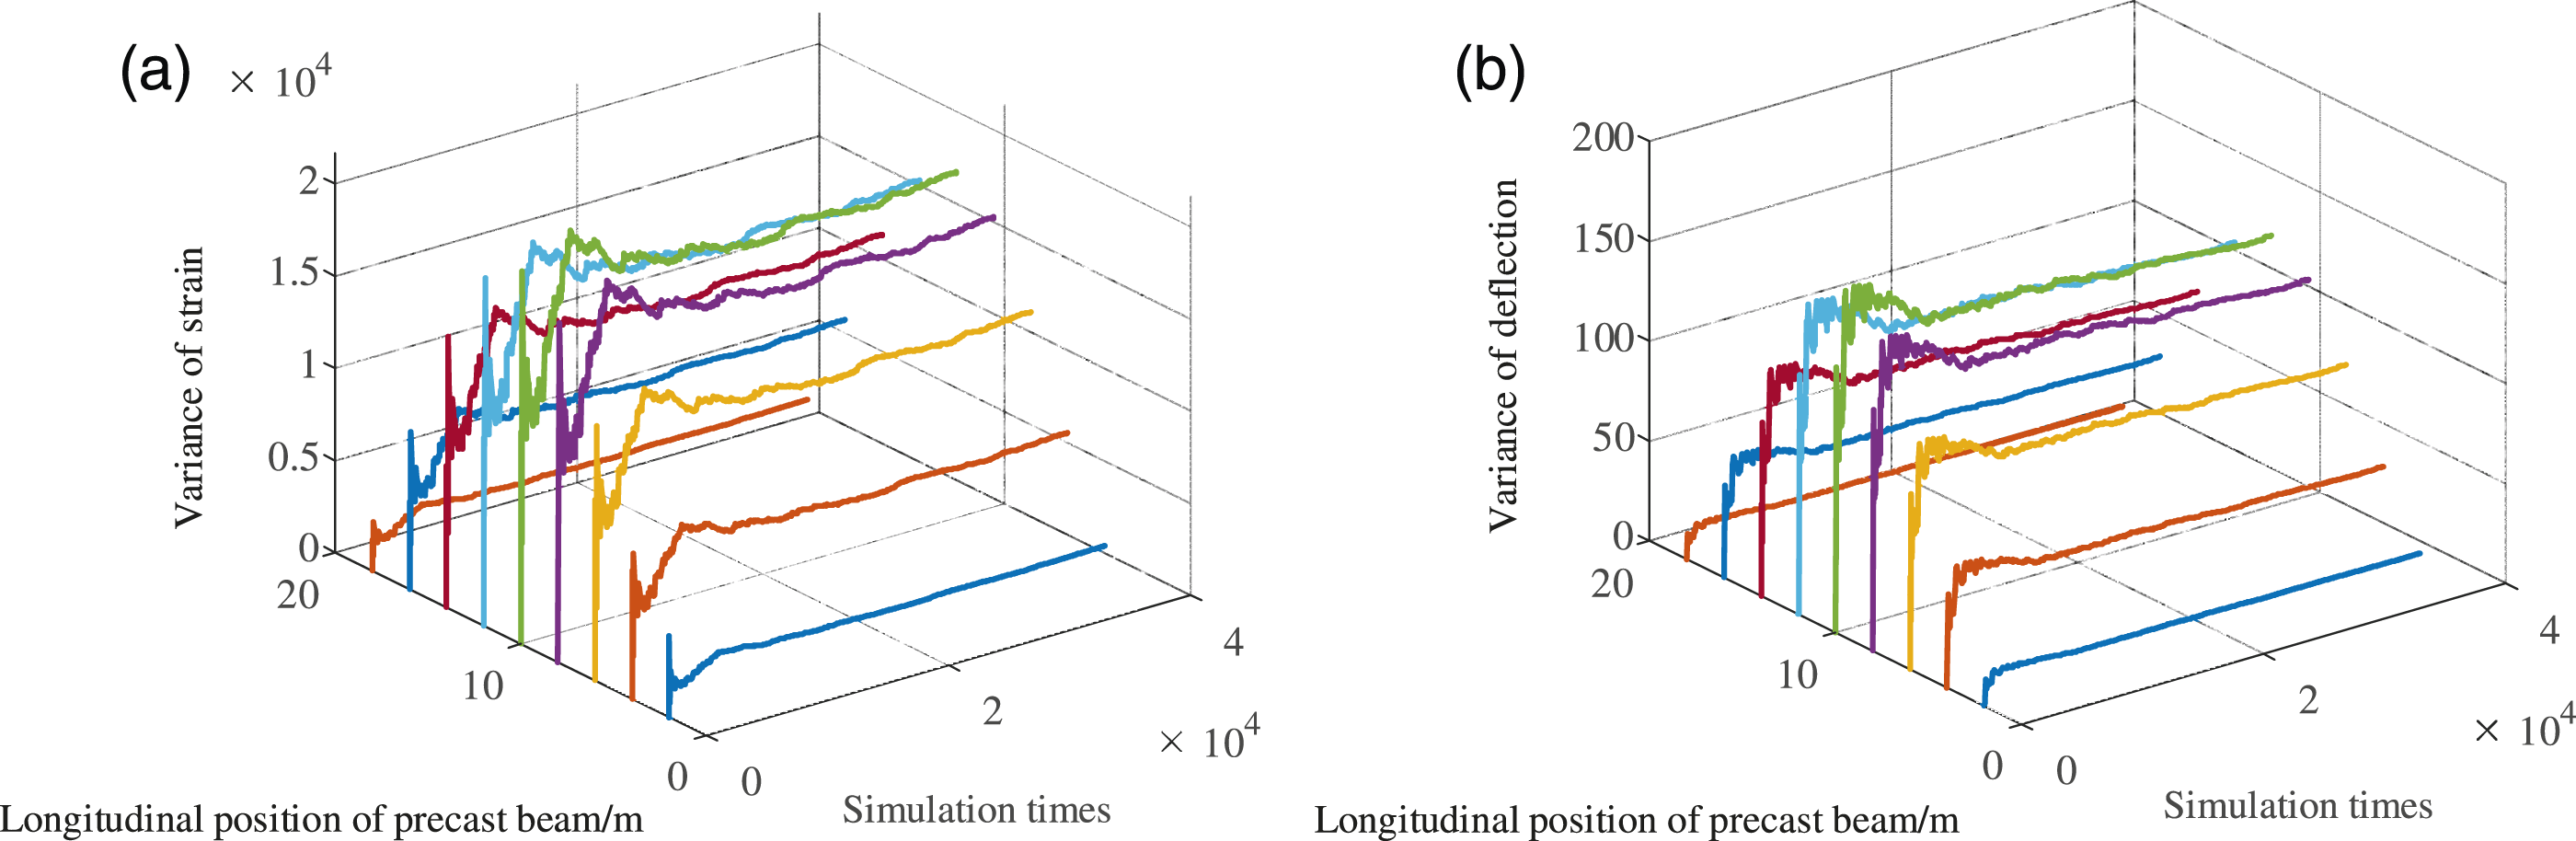
As shown in Figure 9 and Figure 10, the expectation and variance of strain and deflection of each measuring point of the prefabricated beam have the same evolution trend. When the number of simulations is small, the expectation and variance of the two static effect fluctuate obviously. The expectation and variance of the static effect of the mid-span position of the prefabricated beam have great fluctuation. The closer the measuring point to the end of the prefabricated beam, the smaller the fluctuation range of the expectation and variance of the static effect. When the random traffic flow load reaches a stable state, the expectation and variance of static effect of each measuring point of the prefabricated beam gradually converge. The static effect convergence value at the mid-span position of the prefabricated beam is greater than that at the end position of the prefabricated beam. The projection of the static effect convergence value of measuring points of the prefabricated beam on the yoz surface is in a parabolic shape, which can be fitted by parabola. Expectation evolution curve of static effect of No. 5 prefabricated beam. (a) Evolution of strain expectation at each measuring point of the prefabricated beam. (b) Evolution of deflection expectation at each measuring point of the prefabricated beam. Variance evolution curve of static effect of No. 5 prefabricated beam. (a) Evolution of strain variance at each measuring point of the prefabricated beam. (b) Evolution of deflection variance at each measuring point of the prefabricated beam.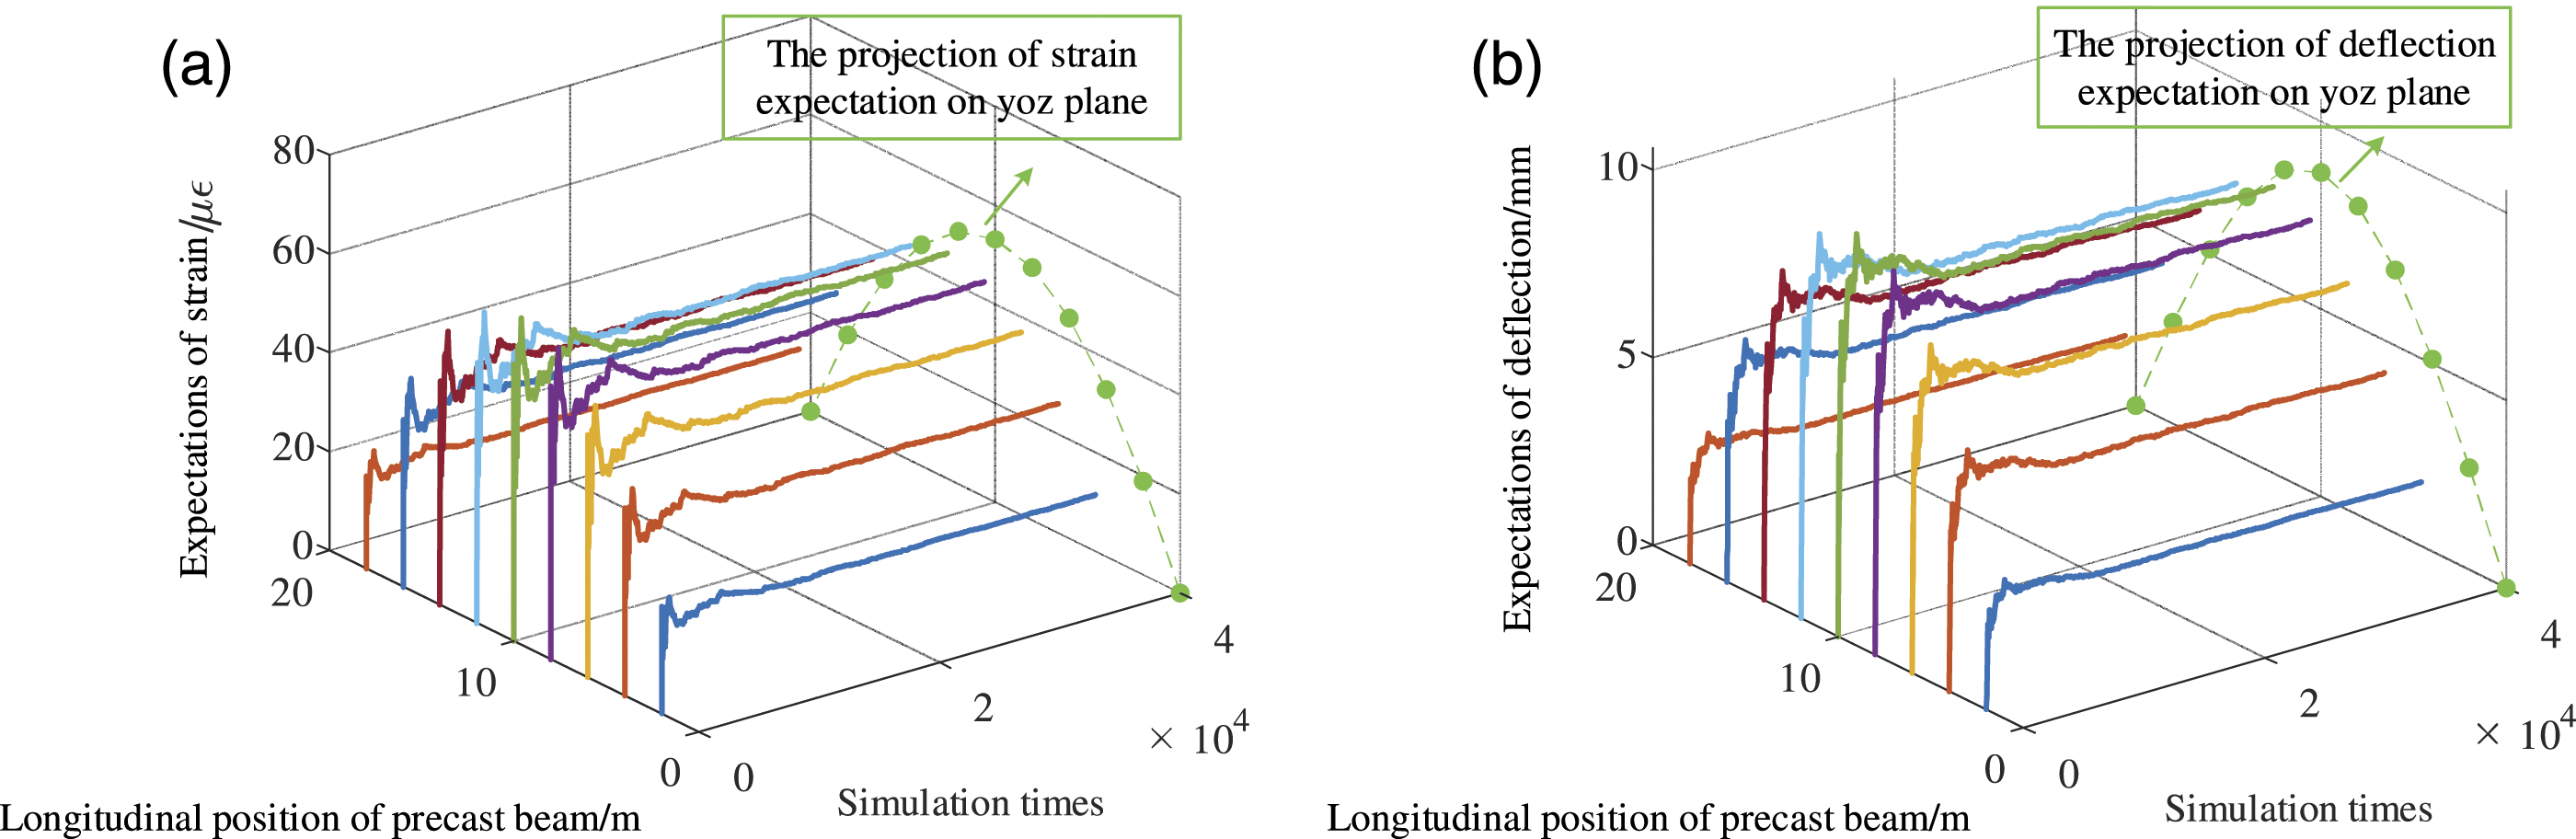
The statistical law of probability density of static effect at each measuring point of the prefabricated beam under stable state is studied, as shown in Figure 11. When the traffic load reaches a stable state, the evolution trends of the probability density function curves of the static effect of measuring points of the prefabricated beam are basically the same, and they are symmetrically distributed on the mid-span position. The peak value of the probability density function of the static effect at the end of the prefabricated beam is the largest. The closer the measuring point to the middle position of the prefabricated beam, the smaller the peak value of the probability density function. Evolution curve of probability density function of static effect of No. 5 prefabricated beam. (a) Evolution curve of strain probability density function. (b) Evolution curve of deflection probability density function.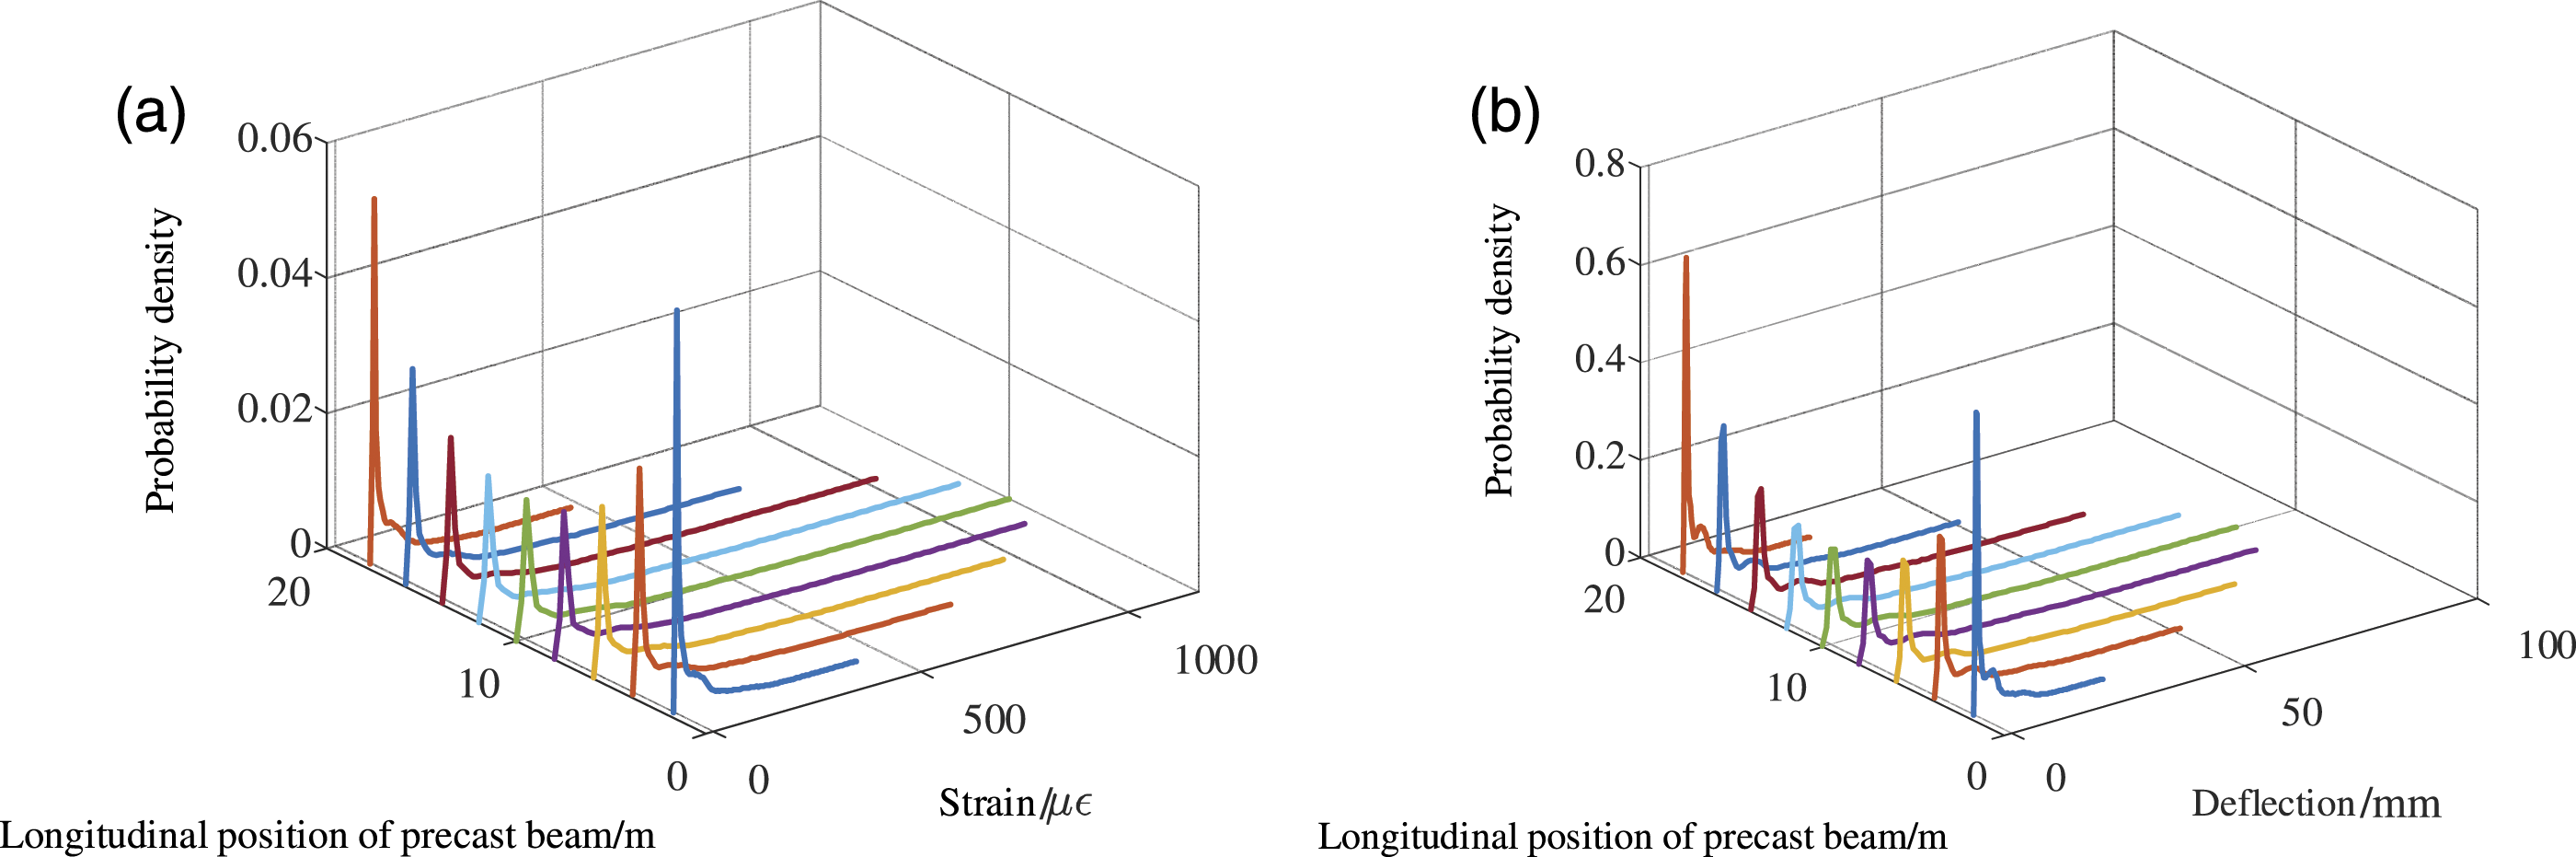
Statistical analysis of static effect expectation of whole bridge deck
In order to study the steady-state statistical law of the static effect of prefabricated beams of the assembled beam bridge, the statistical analysis of the static effect expectation is carried out, when it reaches a stable state. As shown in Figure 12, the peak values of the expectation parabolas of the strain and deflection of the second, the fifth, and the eighth prefabricated beam are significantly higher than that of the other prefabricated beams. The reason for this phenomenon is that the probability model of transverse distribution of traffic flow load in the lane is Normal distribution. The second, the fifth, and the eighth prefabricated beam are the largest probability of transverse driving position of traffic flow in their own lane. Expectation curves of static effect of prefabricated beams on the whole bridge deck. (a) Strain expectation curve of prefabricated beams on the whole bridge deck. (b) Deflection expectation curve of prefabricated beams on the whole bridge deck.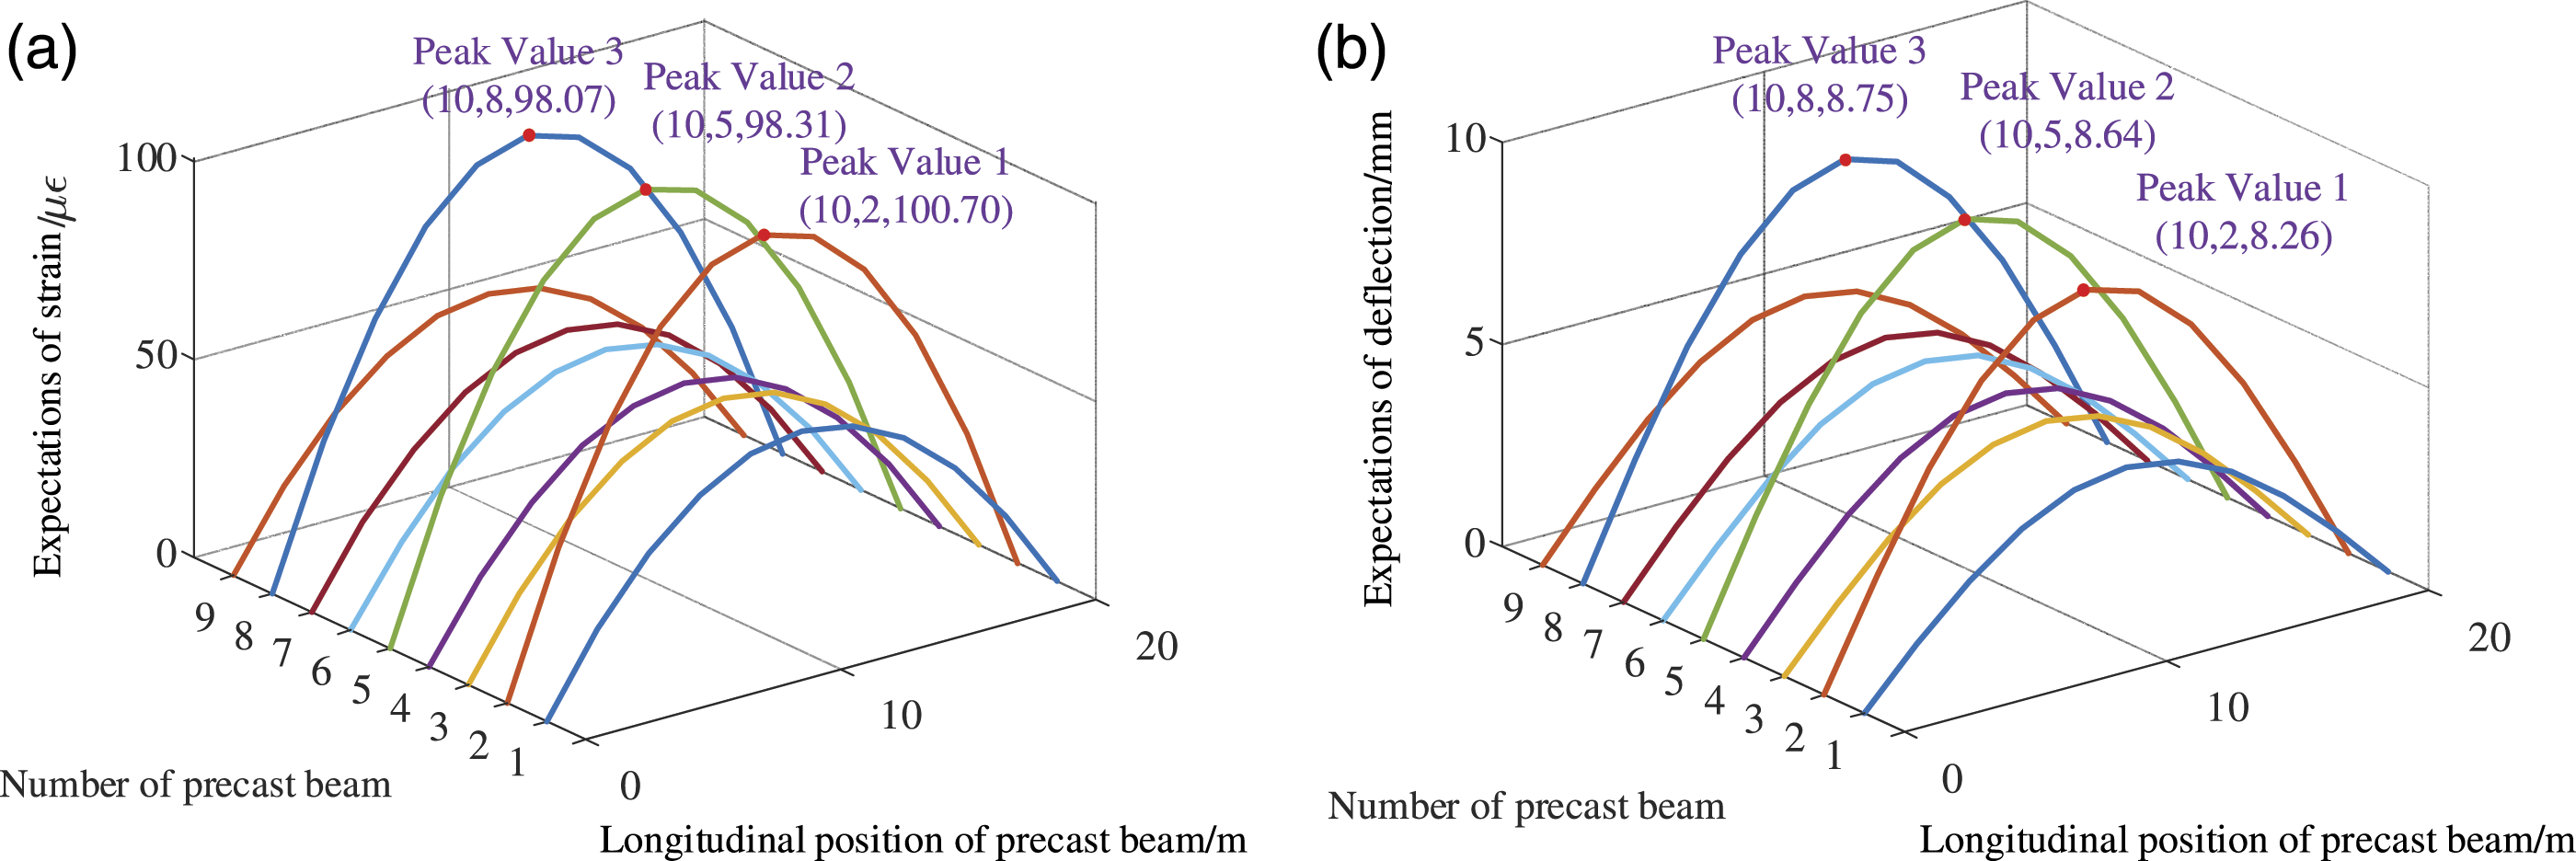
Conclusions
In this paper, a traffic flow load model and a static effect calculation model are established. Based on the Monte Carlo numerical simulation, the static effect of the assembled beam bridge under the action of statistical stable traffic flow load is simulated. Under the premise of stable state, the expectation, variance, and probability density function of the two static effect are statistically analyzed, and main conclusions are as follows: 1. Using the statistical information of the traffic flow parameters on the bridge deck, a random traffic flow load model is established to realize the numerical simulation of the load effect, which is helpful for the monitoring and evaluation of the structural performance during service period. 2. With the increase of simulation times, the random traffic flow load gradually stabilizes, and the statistics (expectation and variance) of the static effect at each measuring point of prefabricated beams also transit from unstable state to stable state. 3. When the random traffic flow load reaches a stable state, the convergence value of the static effect expectation at each measuring point of the prefabricated beam presents a parabolic shape. 4. When the traffic flow load reaches a stable state, the probability density function curves of the static effect of measuring points of the prefabricated beam have the same evolution trend, and they are symmetrically distributed on the mid-span position. 5. The probability model of transverse distribution position of traffic flow load in the lane is Normal distribution. For prefabricated beams in the same lane, the peak value of the parabola of strain and deflection expectation of the prefabricated beam in the middle of the lane is the highest, and the peak value of the parabola of strain and deflection expectation of the prefabricated beam on both sides of the lane is the lowest, and the remaining parabolas in the same lane are symmetrical about the intermediate prefabricated beam.
Footnotes
Declaration of conflicting interests
The author(s) declared no potential conflicts of interest with respect to the research, authorship, and/or publication of this article.
Funding
The author(s) disclosed receipt of the following financial support for the research, authorship, and/or publication of this article: This study is funded by the Research Start-up Fund for Special Professors of “Tianshan Scholars,” Xinjiang University, grant number: 620312327.