
Abstract
An improved sound transmission loss (STL) experimental technique based on the sound pressure method (SPM) and acoustic box method is proposed to investigate the temperature influence on the STL of the ribbed carbon fiber reinforced plastics aircraft panel. SPM principle is given. The measurement procedure of the improved STL technique is presented and its reliability is verified. STL variable characteristics of the panel within −40°C–40°C were measured. Results showed that temperature had a significant effect on the panel’s STL. The overall STL varied nonlinearly with temperature, whereas STL exhibited a fluctuation or monotony trend at a single center frequency. Temperature variation caused changes of STL peak/dip frequencies and redistribution of stiffness-controlled, resonance-controlled, coincidence-controlled, and damping-controlled regions. The causes of the aforementioned are given. This study reveals the relationship between temperature, thermomechanical parameters and STL. The findings have applications in the design, measurement, analysis, and theoretical development of composite structure acoustics.
Introduction
Sound transmission loss (STL), which is usually determined via experiments, is an important design index for aerospace structures. However, due to the temperature dependence of composite structures’ STL and the widespread use of composite materials in aerospace structures,1,2 STL experimental technologies developed at room temperature cannot fully meet measurement requirements under variable temperature environments. Meanwhile, this issue has not been addressed in the reported studies. In this paper, an improved STL experimental technique based on the sound pressure method (SPM) and acoustic box method (ABM) is proposed for demonstrating the vibroacoustic behavior sensitivity of a ribbed carbon fiber reinforced plastics (CFRP) aircraft panel at ambient temperature.
Aircrafts operate within a broad ambient temperature range, typically varying between −50°C and 50°C, for hours. Concerning spacecraft, ambient temperature is worse (typically −100°C to 200°C) within their mission. Studies have shown that composite structures’ properties (elastic modulus, damping loss factor, natural frequency, etc) strongly depend on temperature.3–6 Given that the aforementioned properties are related to STL, the temperature should affect composite structures’ STL. Therefore, researchers conducted some investigations on the acoustic analysis of composite structures. However, the main concerns were sound transmission mechanism,7–9 numerical simulation method,10–13 and composite acoustic design.14–16 The influence of thermomechanical behavior on composite structures’ STL is still a field of sporadic research.
Only a few papers have been reported. In 2013, the temperature-dependent STL was investigated based on statistical energy analysis. 17 Following that, several theoretical models were proposed. Xin 18 created a theoretical model of a simply supported plate and used numerical methods to determine its accuracy and feasibility. Li19,20 studied sandwich panels’ STL in a thermal environment using the mode superposition method and presented an analytical method for sandwich panels in thermal environments. Then, Zhou 21 investigated the sound radiation of porous functionally graded material (FGM) plates with a temperature gradient along with the thickness. Recently, Hu 22 proposed a semi-analytical model to analyze FGMs’ STL. Meanwhile, an analytical strategy was proposed to determine the thermal load’s effect on STL via parametric studies. 23 In mentioned studies, attention is paid to theoretical derivation and simulation modeling, experimental methods are rarely adopted.
The reason is that the STL analysis of composite structures at varying temperatures is still preliminary. The experimental theory24–27 is not perfect (thermal instability 28 problems), available techniques have not been proposed, and reliable measurement equipment for harsh environments (pull-in instability29–32 influence) has been developed deficiently. Therefore, theoretical modeling 33 and numerical simulation17,34 are the most viable options. Moreover, theoretical analyses and simulations are appropriate for studying various composite structures over a wide temperature range and are cost-effective compared to experimentation. Nowadays, in practice, the demand for STL measuring of composite structures has emerged and theoretical/simulation models should be modified via experiments. As a result, developing STL experimental technology under variable temperature environments is critical. Based on SPM and ABM, an improved STL experimental method is proposed in this study to reveal the relationship between temperature, thermomechanical parameters and STL.
The paper is organized as follows: In A Brief Statement of the Improved STL Experiment, Determination of Experimental Methods, Experiment principle, Measurement Objects and Experimental Devices, Measurement Process are introduced. Verification and Analysis of Experimental Results includes Reliability Analysis of Measurement Results, The Analysis of STL at Different Temperatures, Discussion of STL Variation. Finally, Conclusion discusses the concluding remarks and potential applications of the presented work.
A brief statement of the improved sound transmission loss experiment
Determination of experimental methods
As well known, the sound intensity method (SIM), 24 SPM,25,27 and ABM 26 are commonly used for experimental measurement of STL in the aviation field.
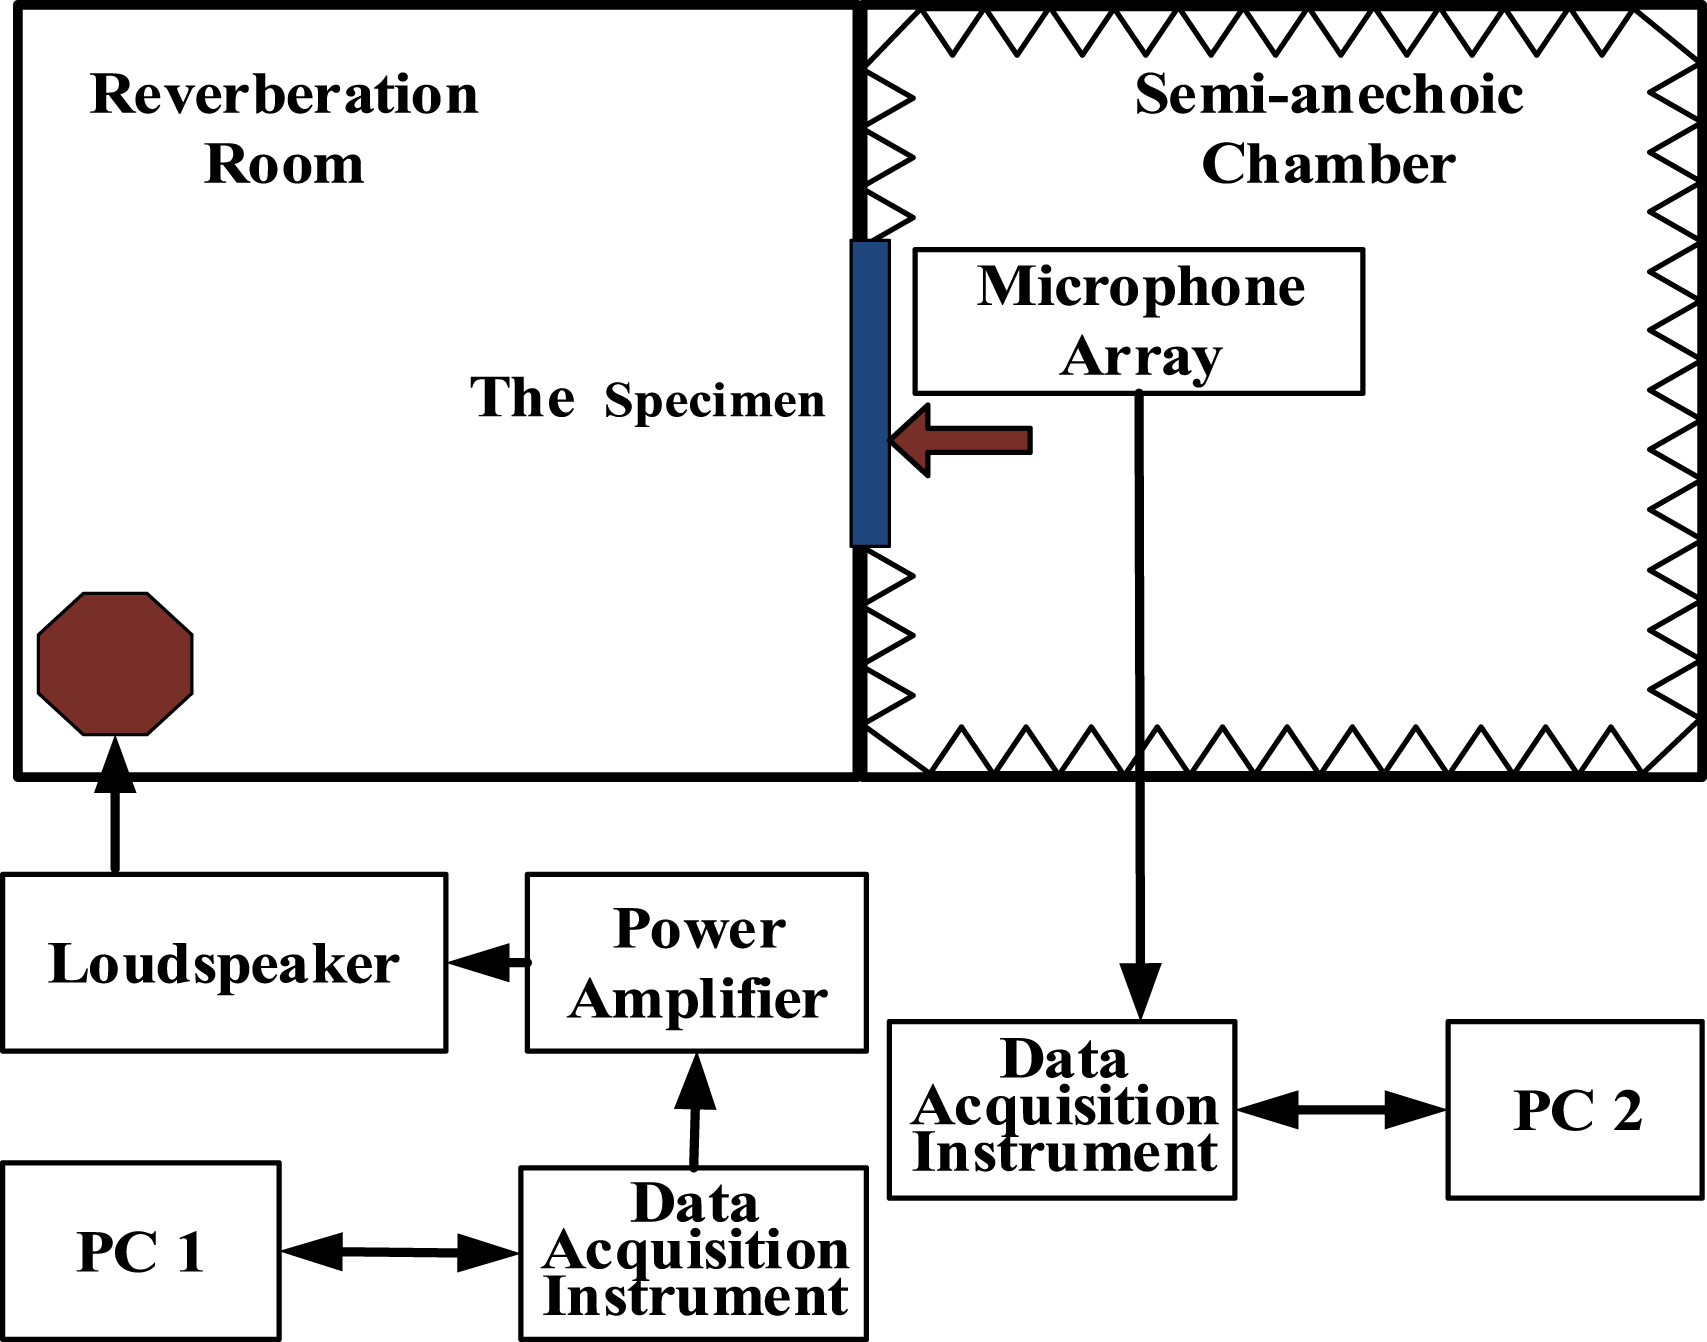
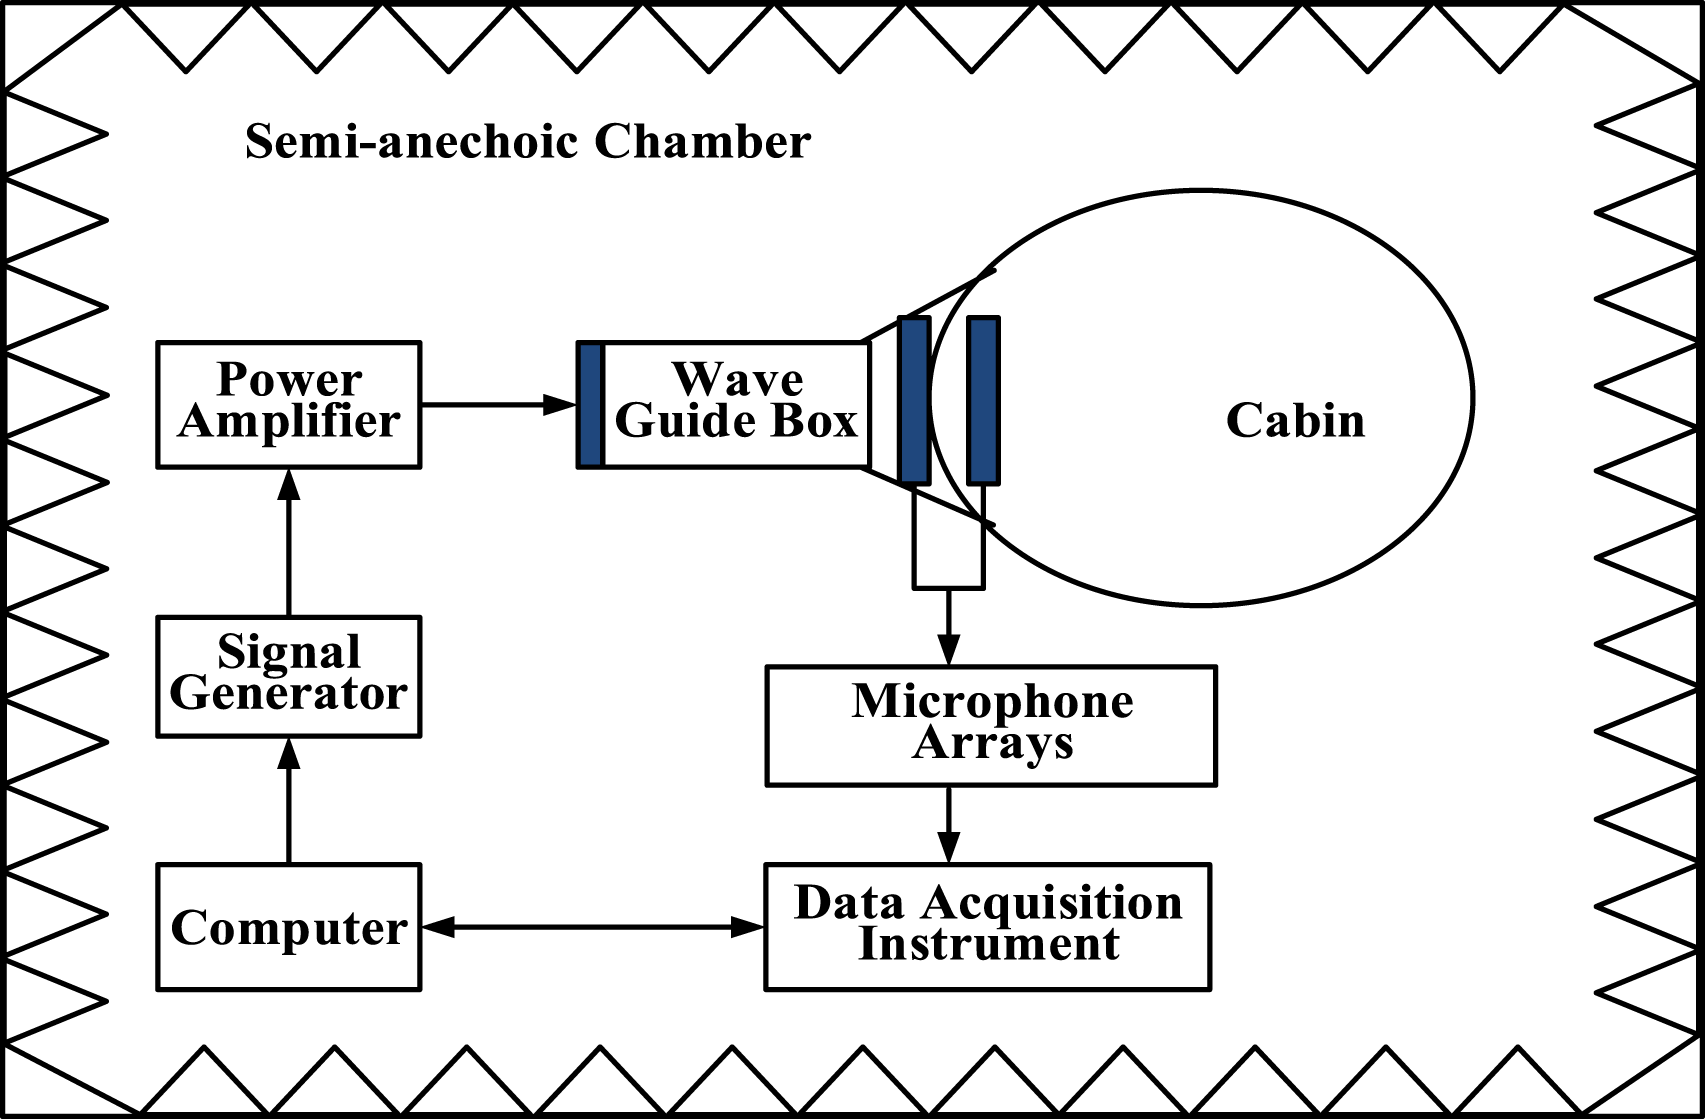
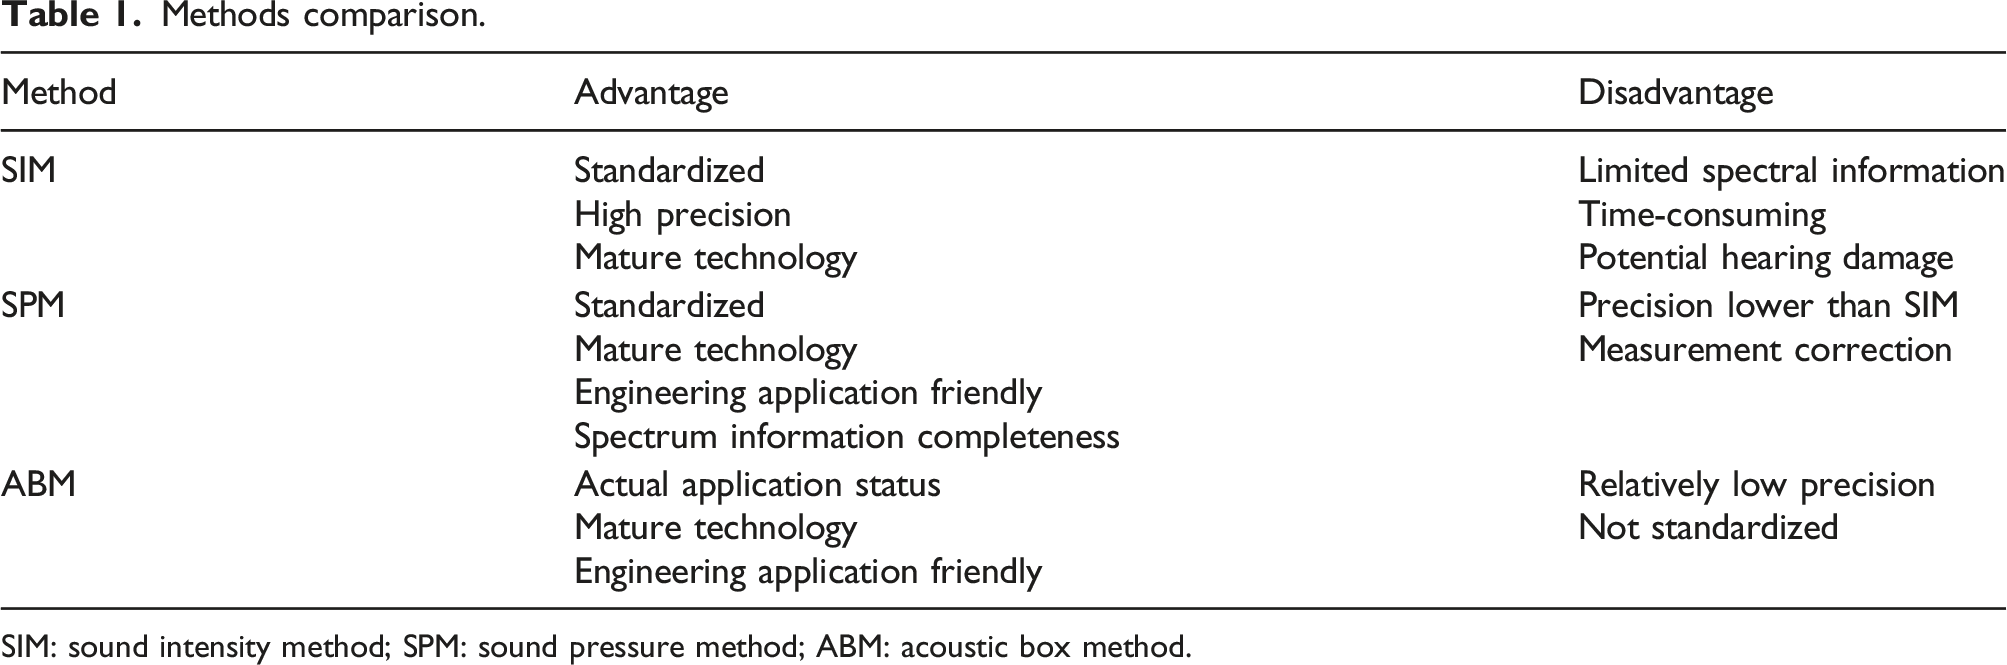
In SIM, incident/transmitted sound power is measured using the sound intensity probe (Figure 1). To improve measurement efficiency, SPM (Figure 2) is being developed, where sound pressure level (SPL) is used to determine incident/transmitted sound power. However, the experiment cannot be standardized for some cases. Hence, ABM is being developed (Figure 3). Since each method has advantages and disadvantages, it’s difficult to determine which method should be used in this study. So, a comparison of the three methods in Table 1 is given. Experimental system of sound intensity method. Experimental system of sound pressure method. Experimental system of acoustic box method. Methods comparison. SIM: sound intensity method; SPM: sound pressure method; ABM: acoustic box method.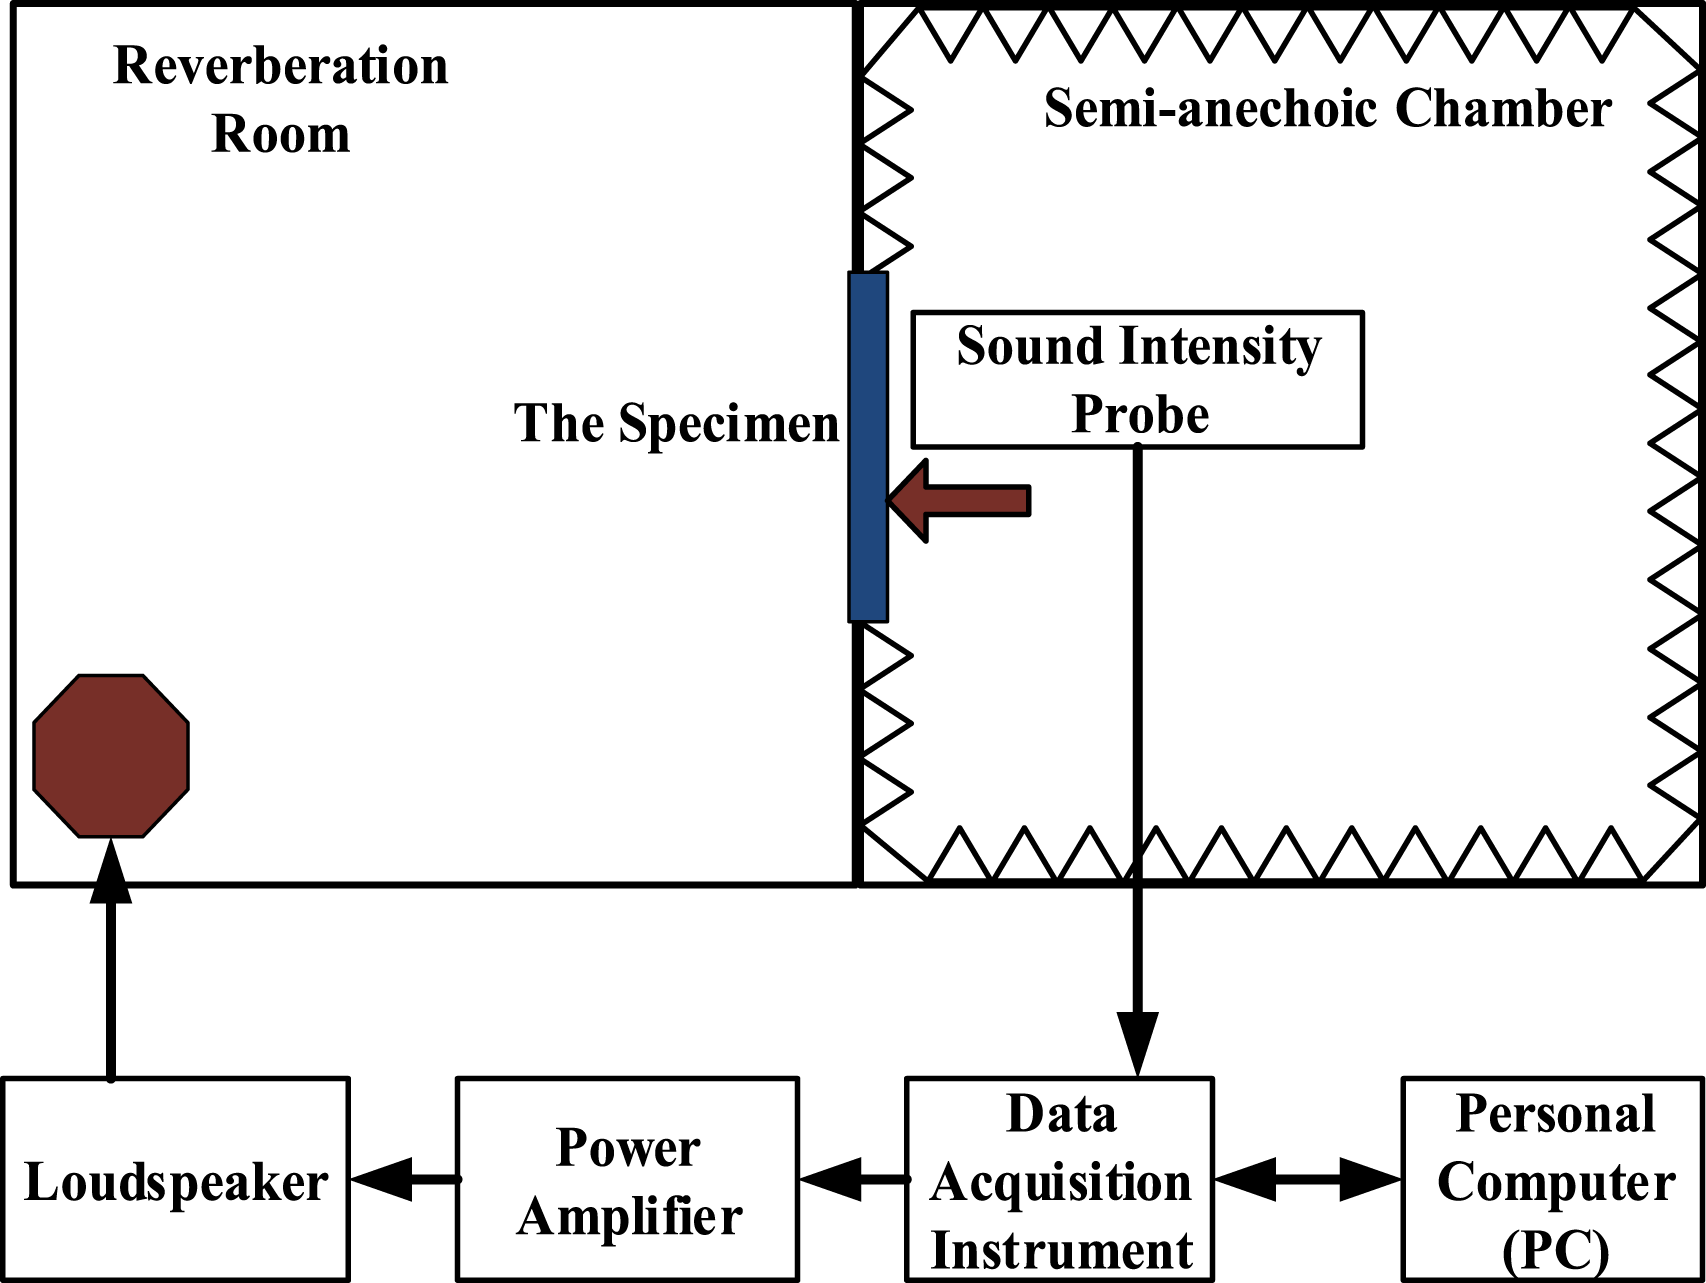
Considering the aforementioned comparison, the principle of SPM should be adopted. Based on existing experimental conditions, the design idea of ABM is applied.
Experiment principle
To introduce SPM’s principle, whose model has been shown in Figure 2, this section is given. It was assumed that the specimen was the only source-to-receiving sound transmission path. A diffusion sound field was created in the source room, then sound waves were randomly incident on the specimen, forcing the specimen to radiate sound. Sound energy density 


Transmitted sound power 
Then
Sound energy density 


By substituting equations (3), (4), (6)–(8) into equation (5), the STL is calculated as

In equation (9), 
In semi-anechoic chambers, 
In equation (12), the near field is ignored and assuming that the correction parameter does not vary with temperature. During measuring, microphones were arranged at 
Measurement objects and experimental devices
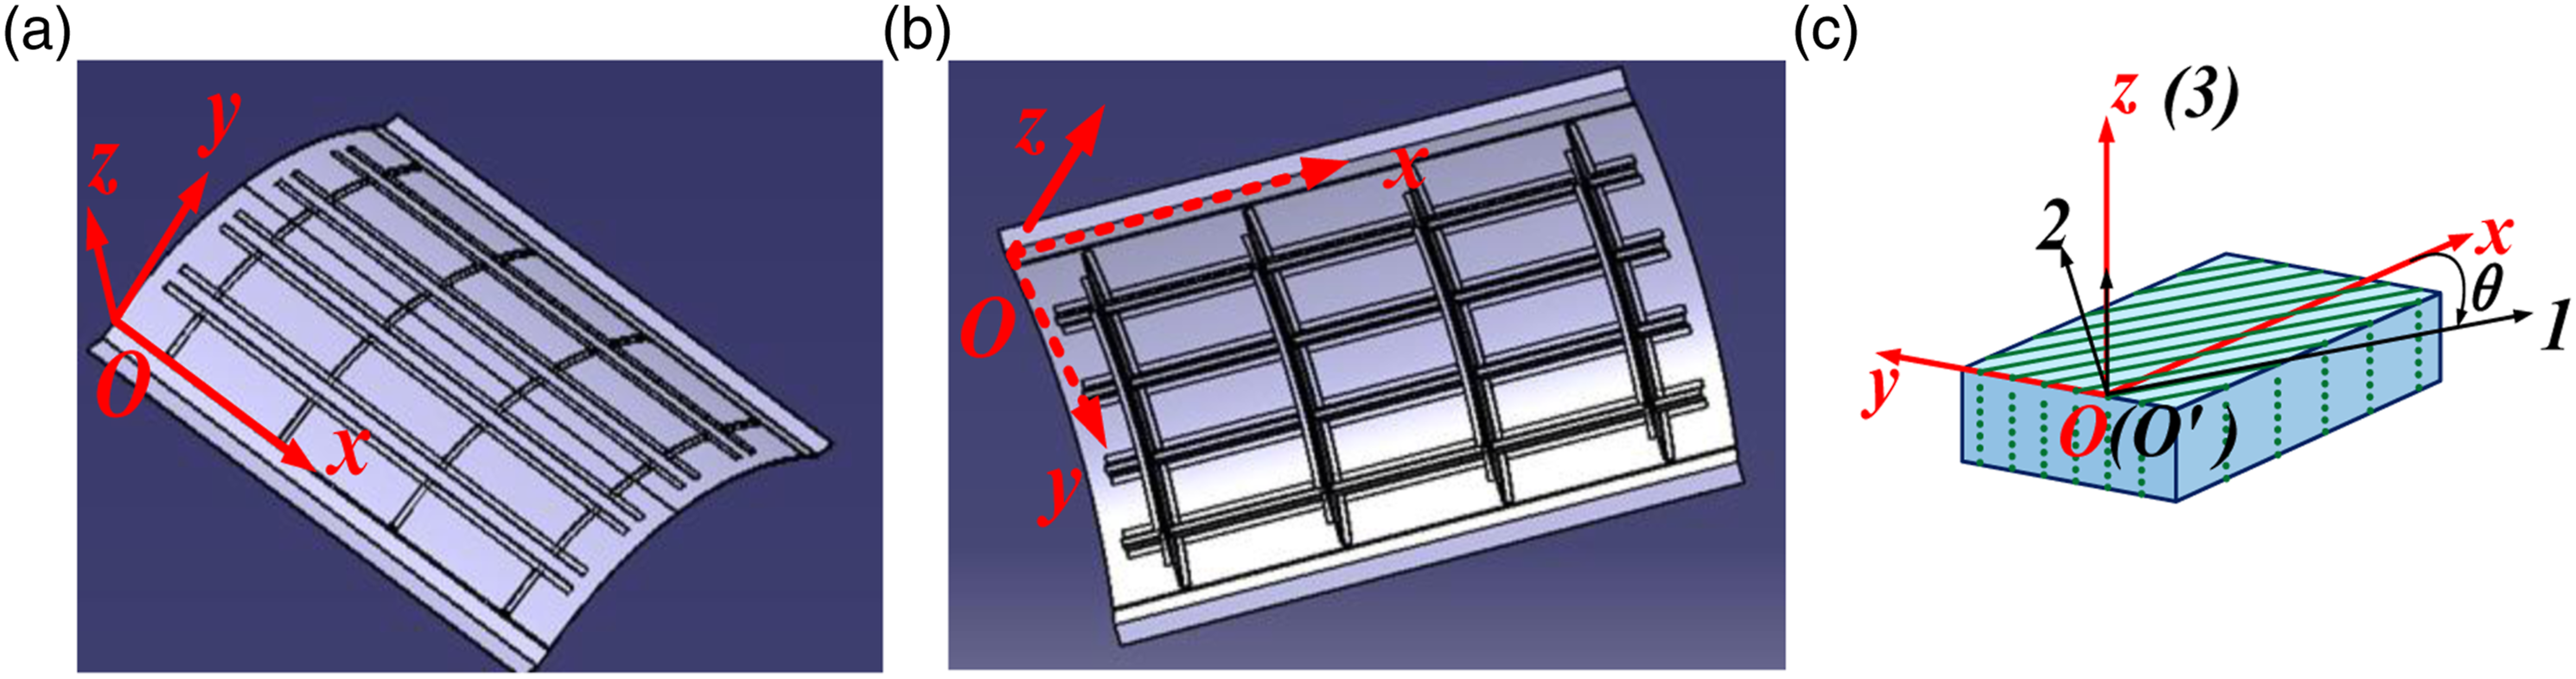
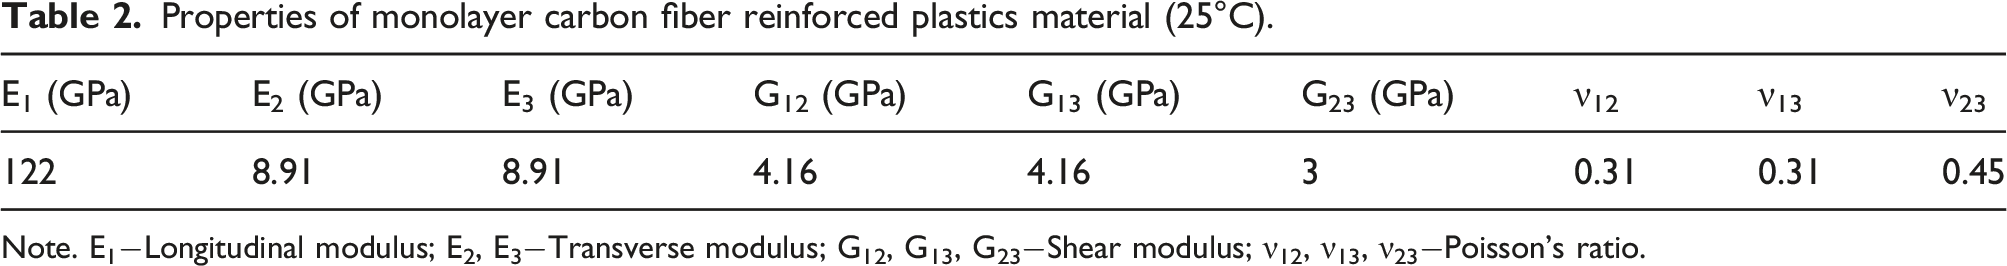
In order to investigate the temperature effect on composite structures’ STL via experiments, the experimental system shown in Figure 4 was proposed based on SPM and ABM. A ribbed reinforced CFRP aircraft panel (Figure 5) and an environmental simulator device (Figure 6) were designed and then manufactured. Table 2 shows the properties of monolayer CFRP. Scheme of the experimental system. Model of the panel (Oxyz: global coordinate; O’123: local coordinate; Panel size: 2240 mm × 1560 mm × 4 mm; Skin layer: [45/0/−45/90]4s). (a)Front (b) Back and (c) Relationship between local and global coordinate of monolayer carbon fiber reinforced plastics in the skin. The environmental simulator device. Indicators: External size: 4520 mm × 2950 mm × 2700 mm; Internal size: 3000 mm × 2500 mm × 1800 mm; Controllable temperature range: −55°C–90°C; Fluctuation: ±0.5°C; Accuracy: ±0.1°C; Uniformity: ±2°C; 25°C –−50°C time loss: ≤70 min; 25°C–85°C time loss: ≤30 min; Controllable humidity range: 30%–98%; Walls’ sound insulation: ≥40 dB. Properties of monolayer carbon fiber reinforced plastics material (25°C). Note. E1−Longitudinal modulus; E2, E3−Transverse modulus; G12, G13, G23−Shear modulus; ν12, ν13, ν23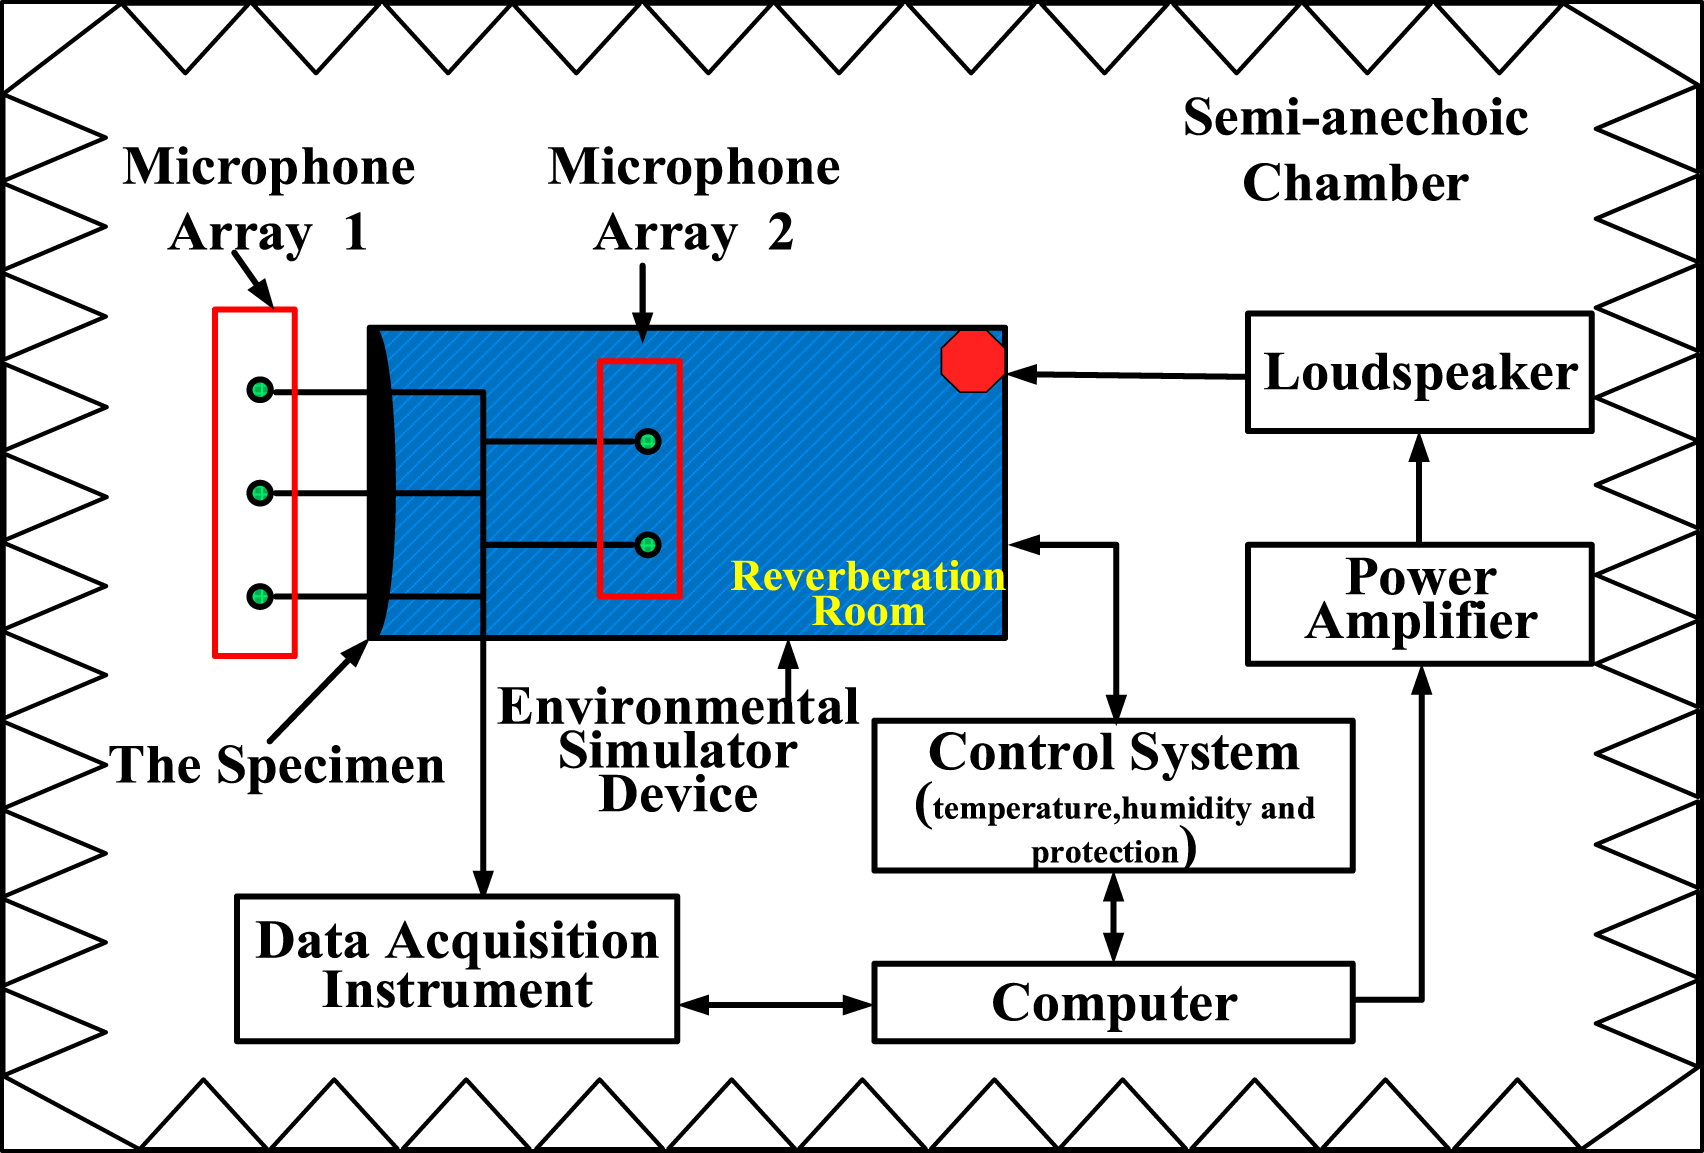
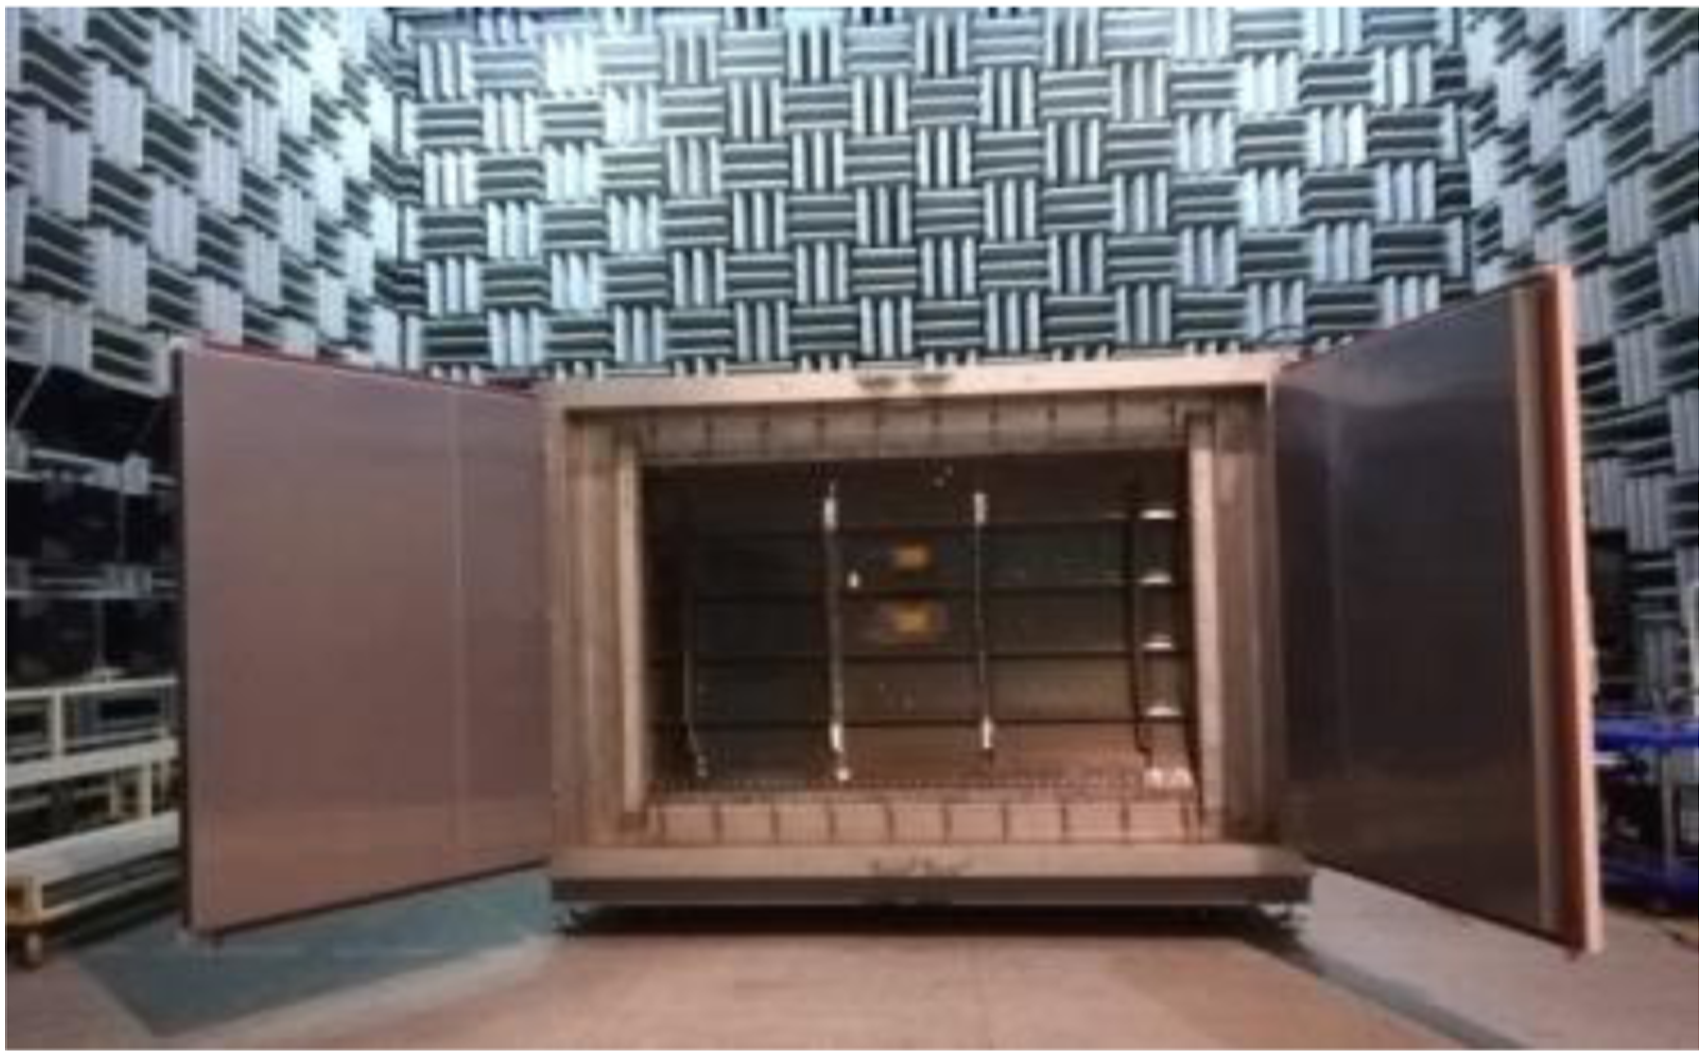
One of the inner walls of the device was designed with a window to install the specimen, and the others were designed with cylindrical reflectors to ensure the diffusion sound field could be generated. The device performed temperature control and humidity adjustment to meet STL experimental requirements under variable temperatures.
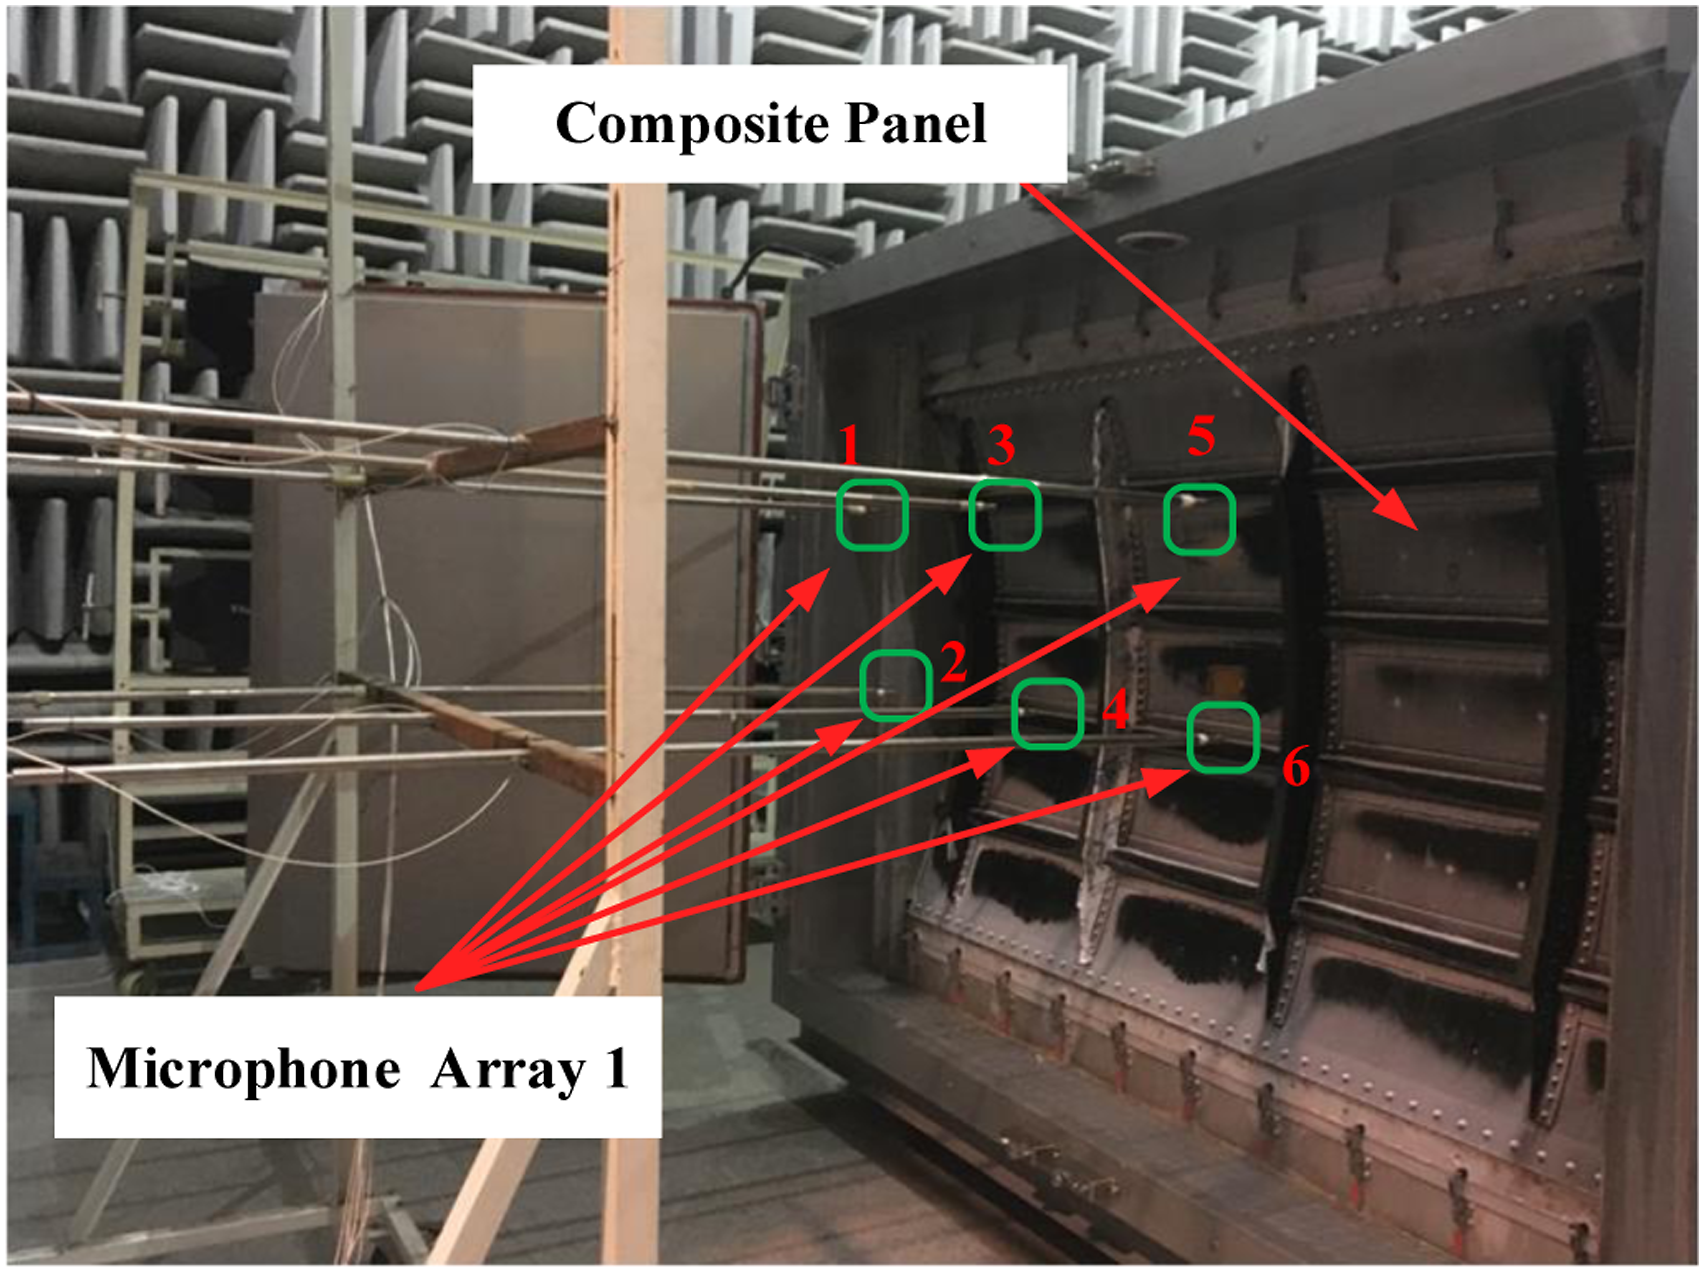
Before measurements, the system shown in Figure 4 was constructed. The device was placed in a semi-anechoic chamber. The panel was installed in the window, and the boundaries were clamped and sealed. The device’s reverberation chamber functioned as a source room, where white noise generated by a loudspeaker was used to excite the diffusion sound field. Figures 7 and 8 show experimental status in the source and receiving rooms. The measurement process is given in Measurement Process. Internal measuring points arrangement and speaker position. Position of external measuring points and installation status of measuring parts.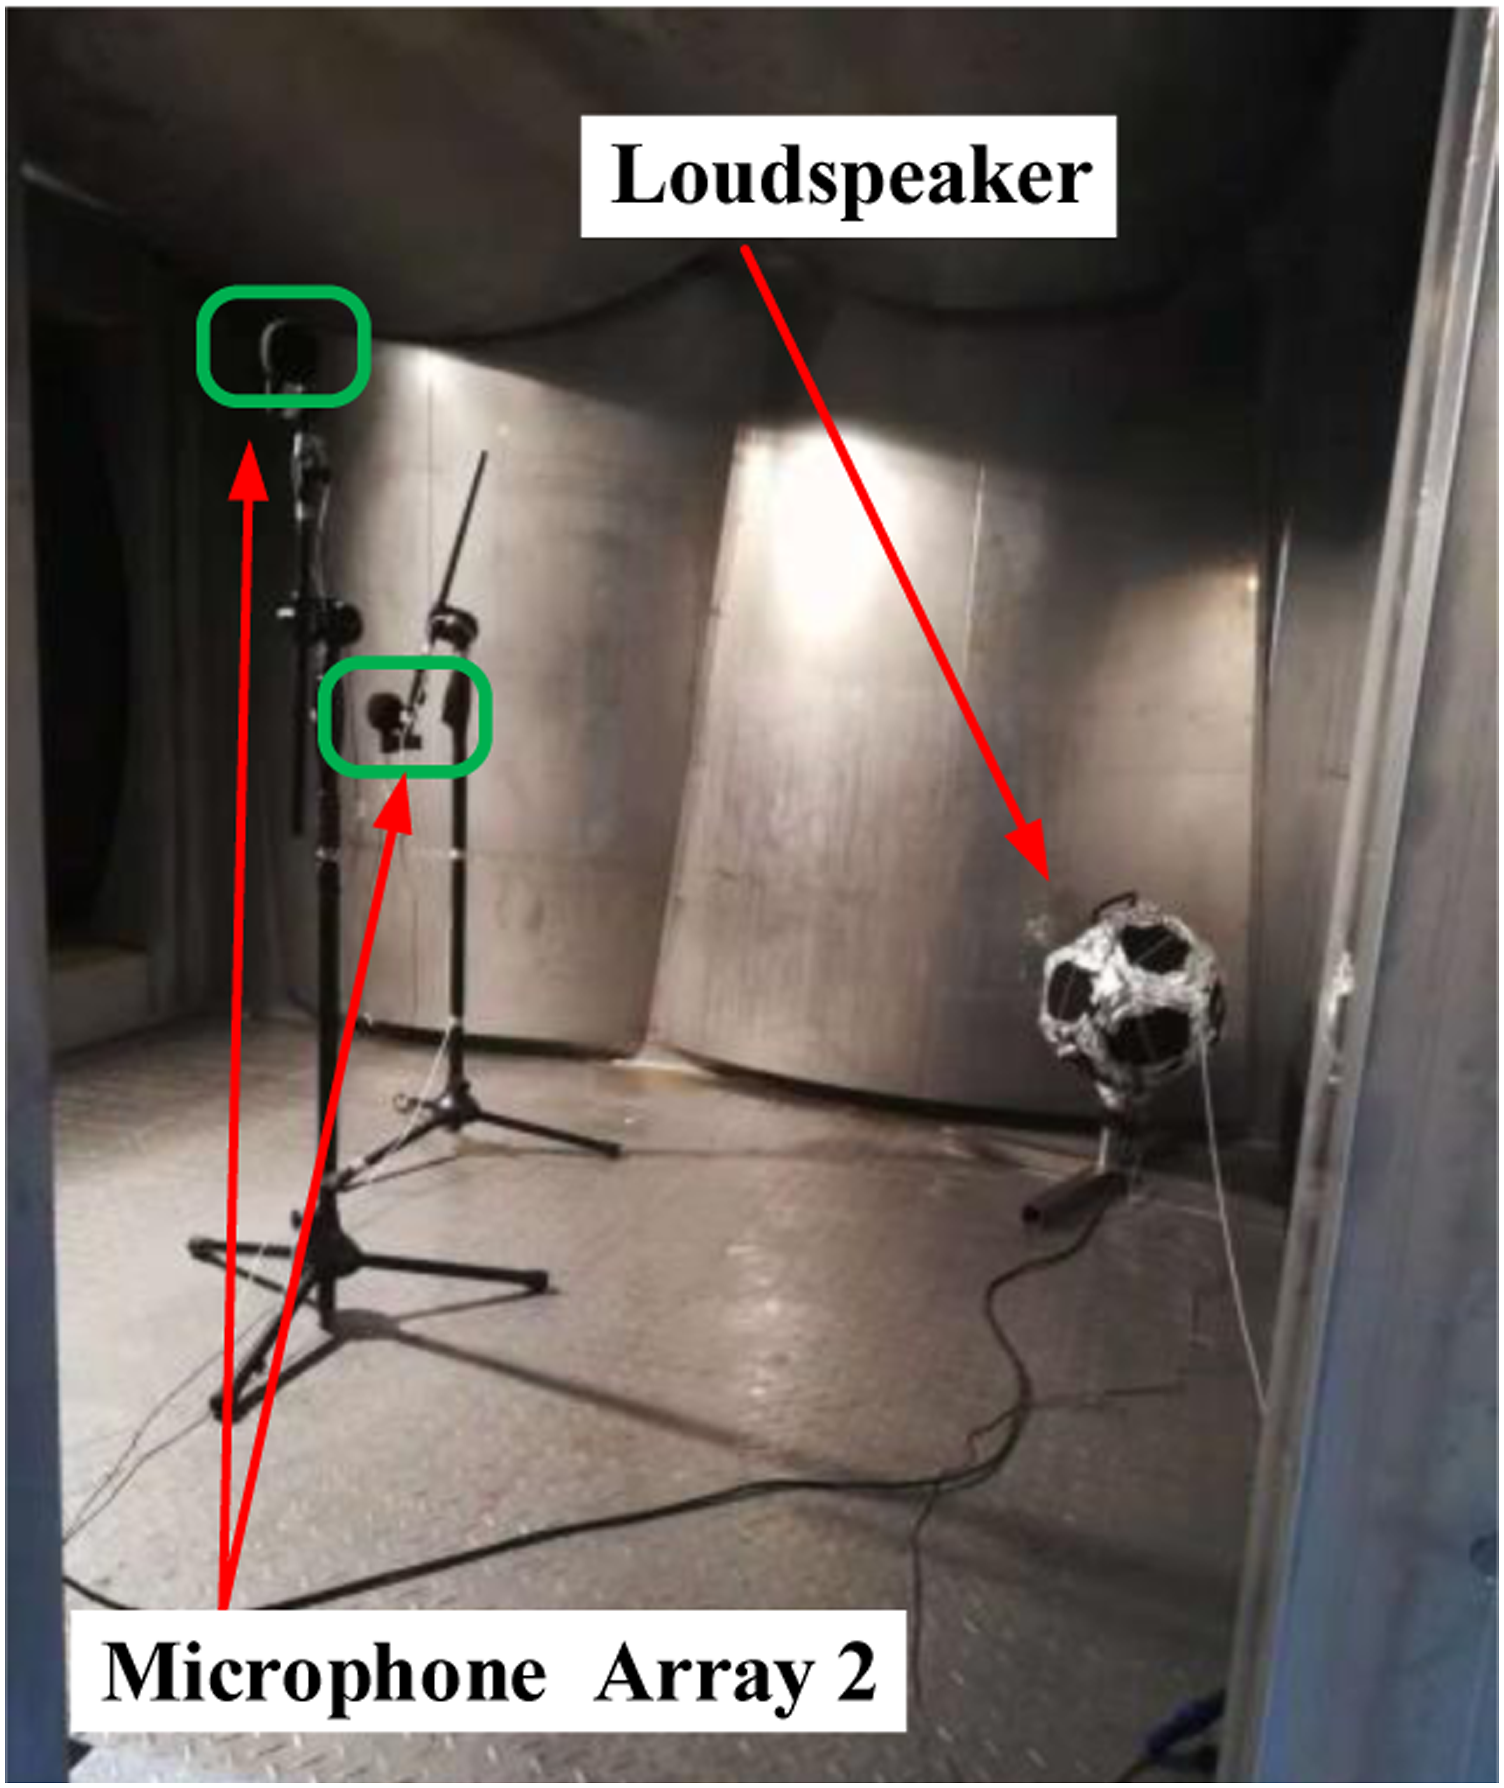
Measurement process
According to Determination of Experimental Methods, Experiment Principle and Measurement Objects and Experimental Devices, the measurement process shown in Figure 9 was designed. During experiments, it was assumed that all equipment operate stably. To avoid pull-in instability,29–32 electronic instruments were protected and maintained regularly. Measurement process.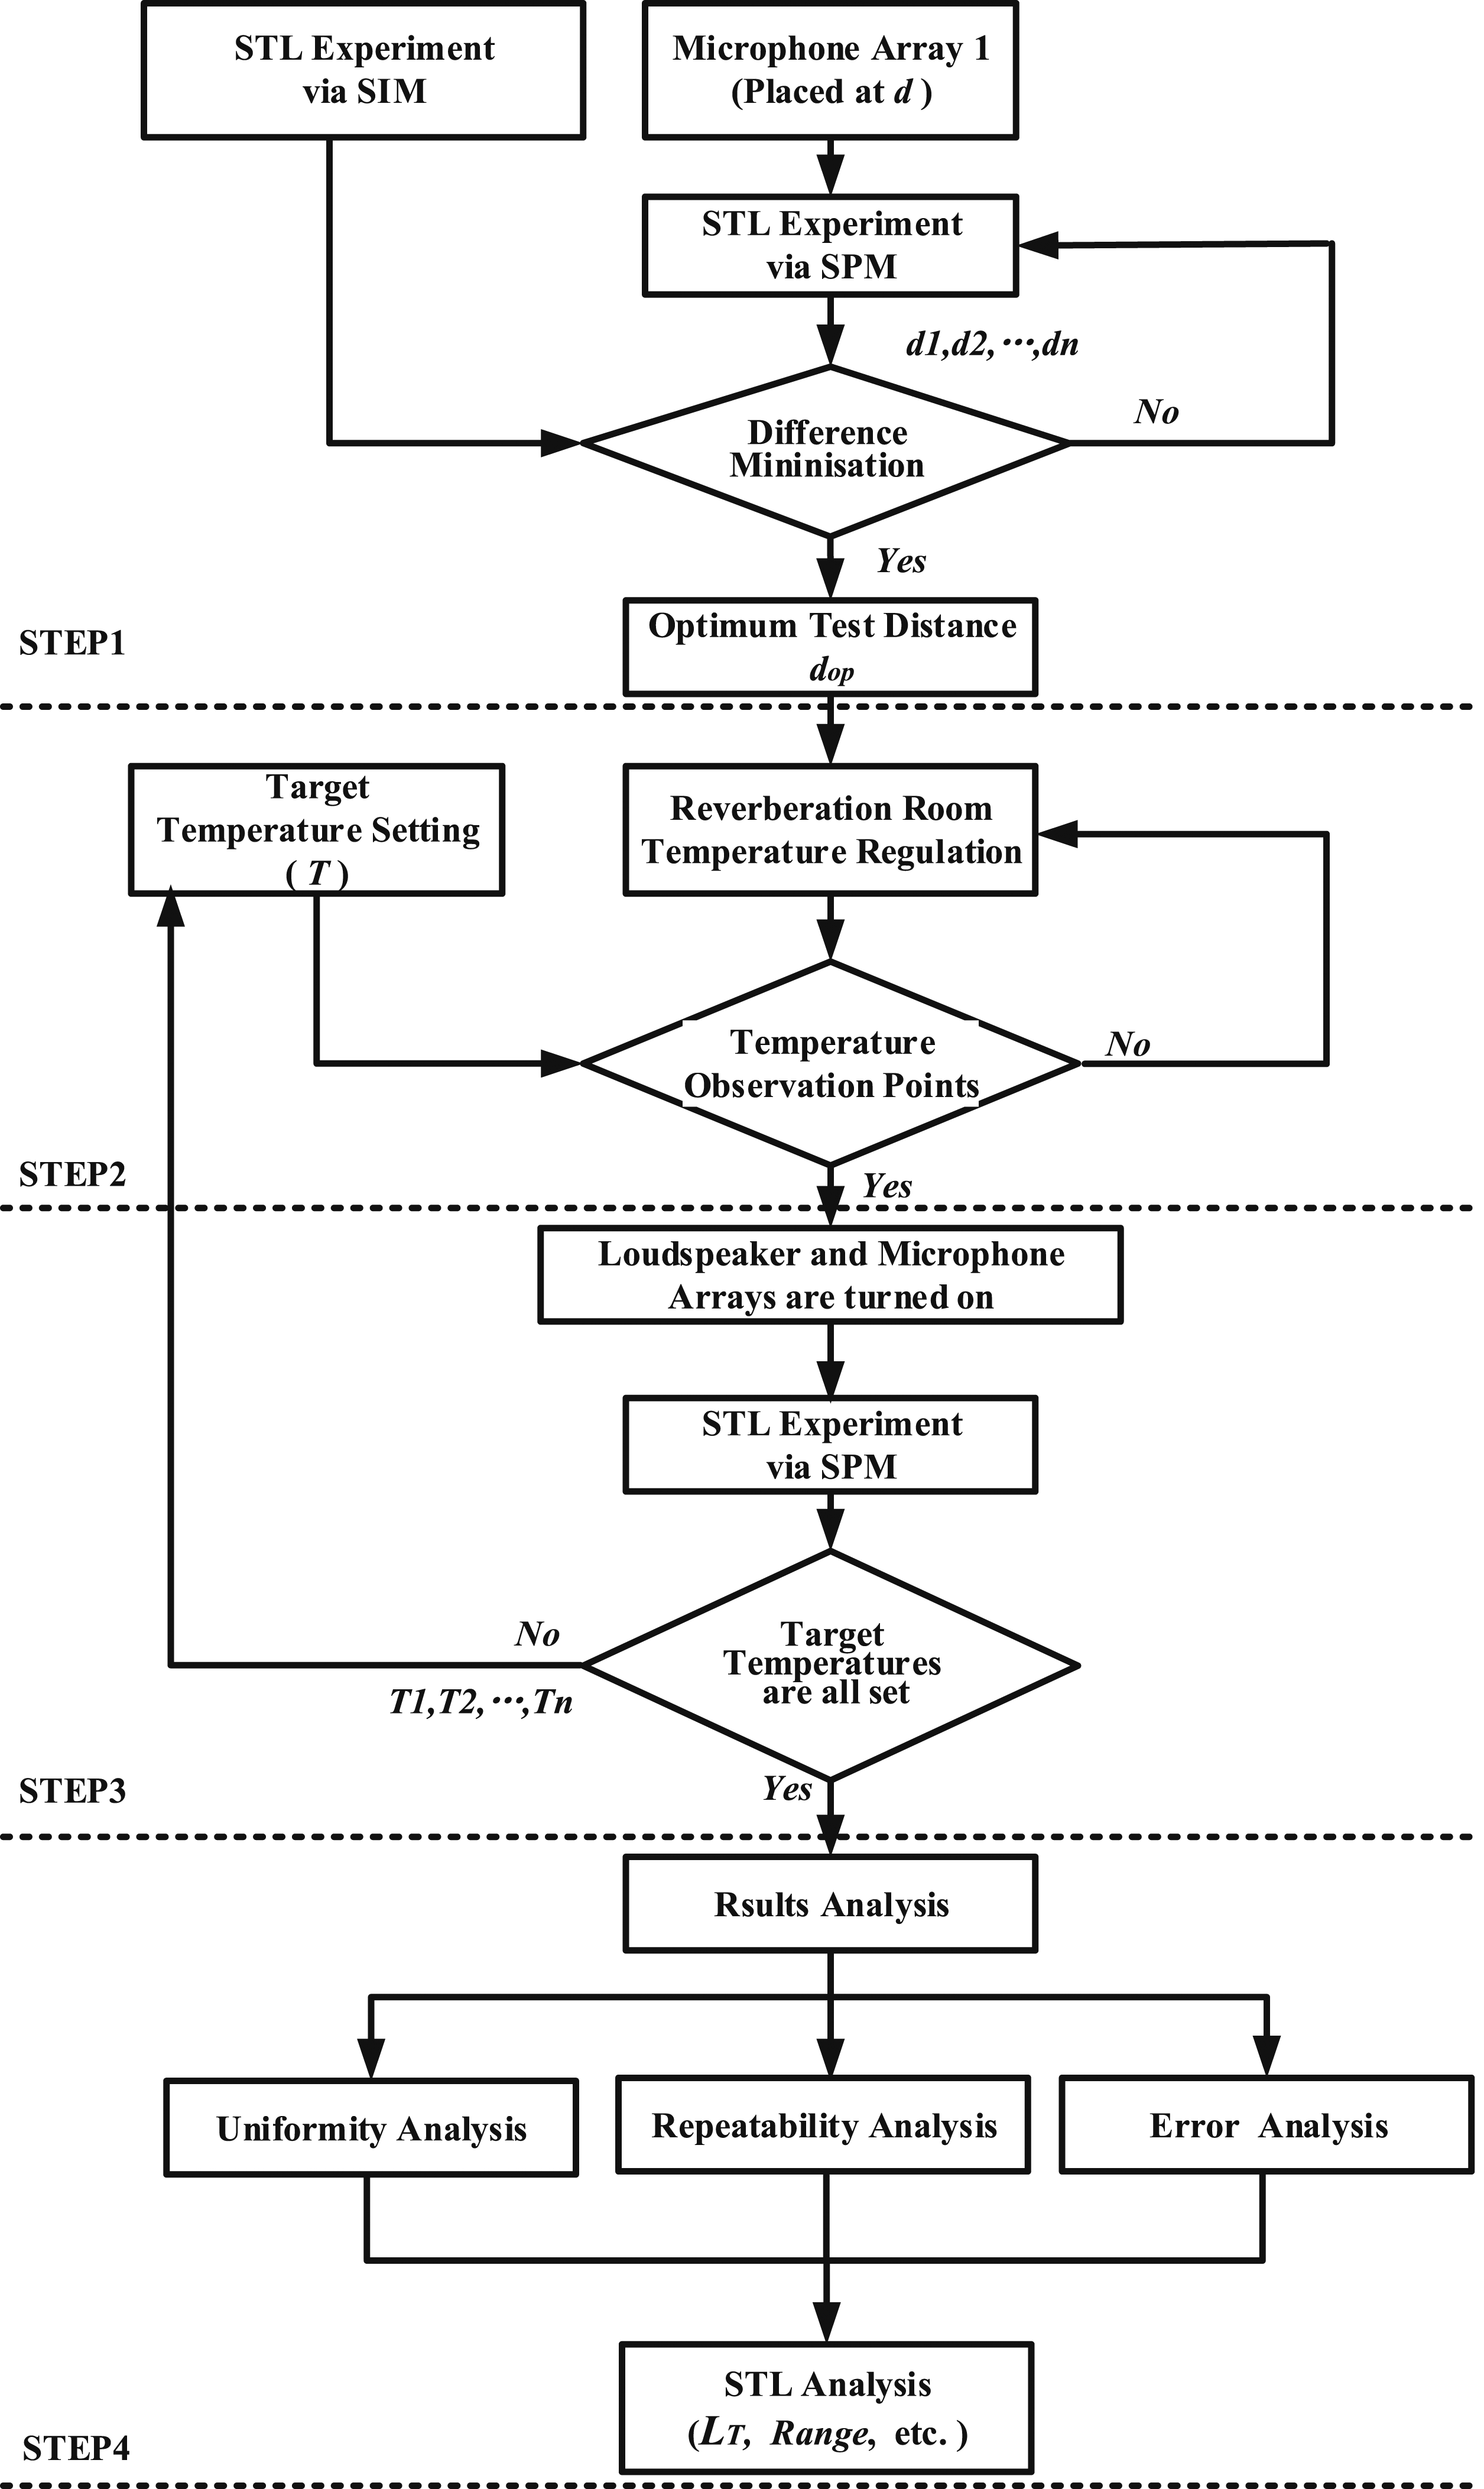
Step 1: Determination of optimal measurement distance d op
First, at room temperature, STL (
Then, in the receiving room, the measurement distance
Next, setting
Finally, all results were plotted in one graph to find out the STL curve which was consistent with STL
0
’s, the calculation method is given as equations (15) and (16).

Step 2: Control of target temperature
Before controlling the temperature, the panel and source room were sealed with adiabatic devices. Then, the temperature control-monitoring system was turned on to heat or cool the reverberation field until the target temperature
Step 3: The measurement of sound pressure level
In the source room, the loudspeaker was turned on to excite the diffusion sound field, which was monitored via Microphone Array 2 (comprising
For each microphone, mark the time series as 
Then, the incident SPL was measured, and the radiated SPL was tested at
Step 4: Analysis of measurement data
Above all, uniformity analysis and repeatability analysis were performed to ensure the reliability of the measured data. The uniformity analysis was used to determine whether the sound field was uniform and it was performed after the sound field was stabilized. The procedure was the same as for the stability analysis. Just convert the time series,
Then, the error analysis was performed to verify the effectiveness of the improved STL experimental method. First, STL was calculated by equation (12). Second, the overall STL 

Verification and analysis of experimental results
After the preparations were all completed, STL measurements of the panel under variable temperatures were performed according to Measurement Process. Considering the potential ambient temperature of the panel being in −25°C–30°C and the temperature simulation capacity of the device, the temperature range of measurement was determined as −40°C–40°C. The temperature interval was set to 5°C, the sampling frequency band was 50 Hz–10,000 Hz, and the recording time was 30 s. The maximum background SPL was 44.6 dB.
Reliability analysis of measurement results
The reliability of the improved STL experimental technique is discussed first. Figure 10 depicts the results of the uniformity analysis; Figures 11 and 12 show the results of the repeatability analysis, while Figure 13 illustrates the difference between the proposed and standard laboratory methods. Reverberation chamber sound pressure level at six uniformly distributed spatial measuring points (25°C). Repeated experiments at −40°C on June 10, 12, and 13, 2018. Repeated experiments at 40°C on June 11, 12, and 13, 2018. STL comparison between the standard and improved STL experiments. STL: sound transmission loss.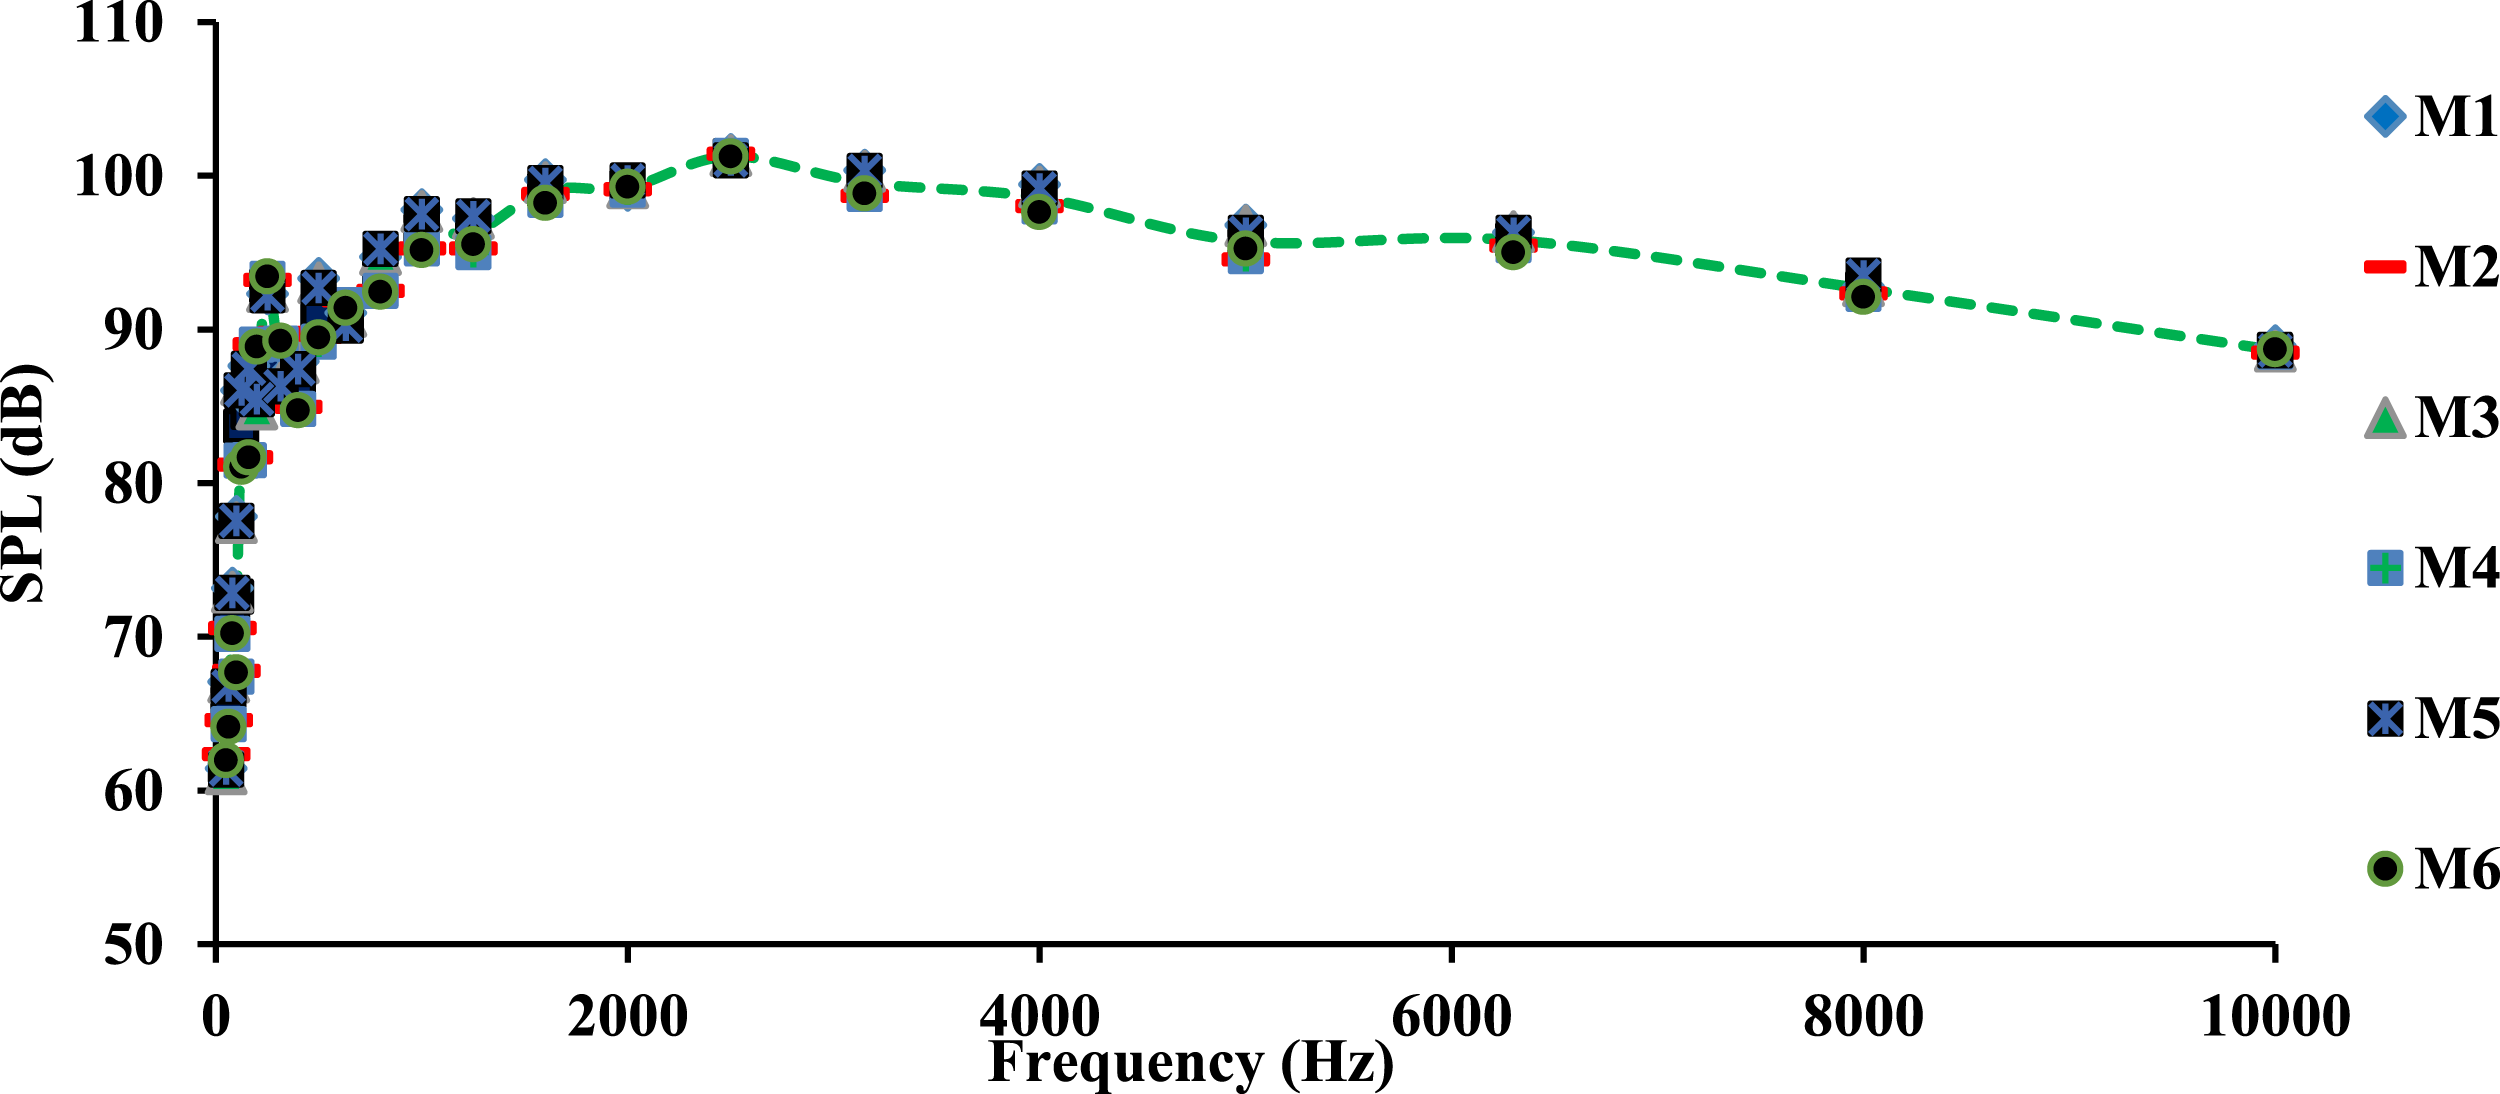
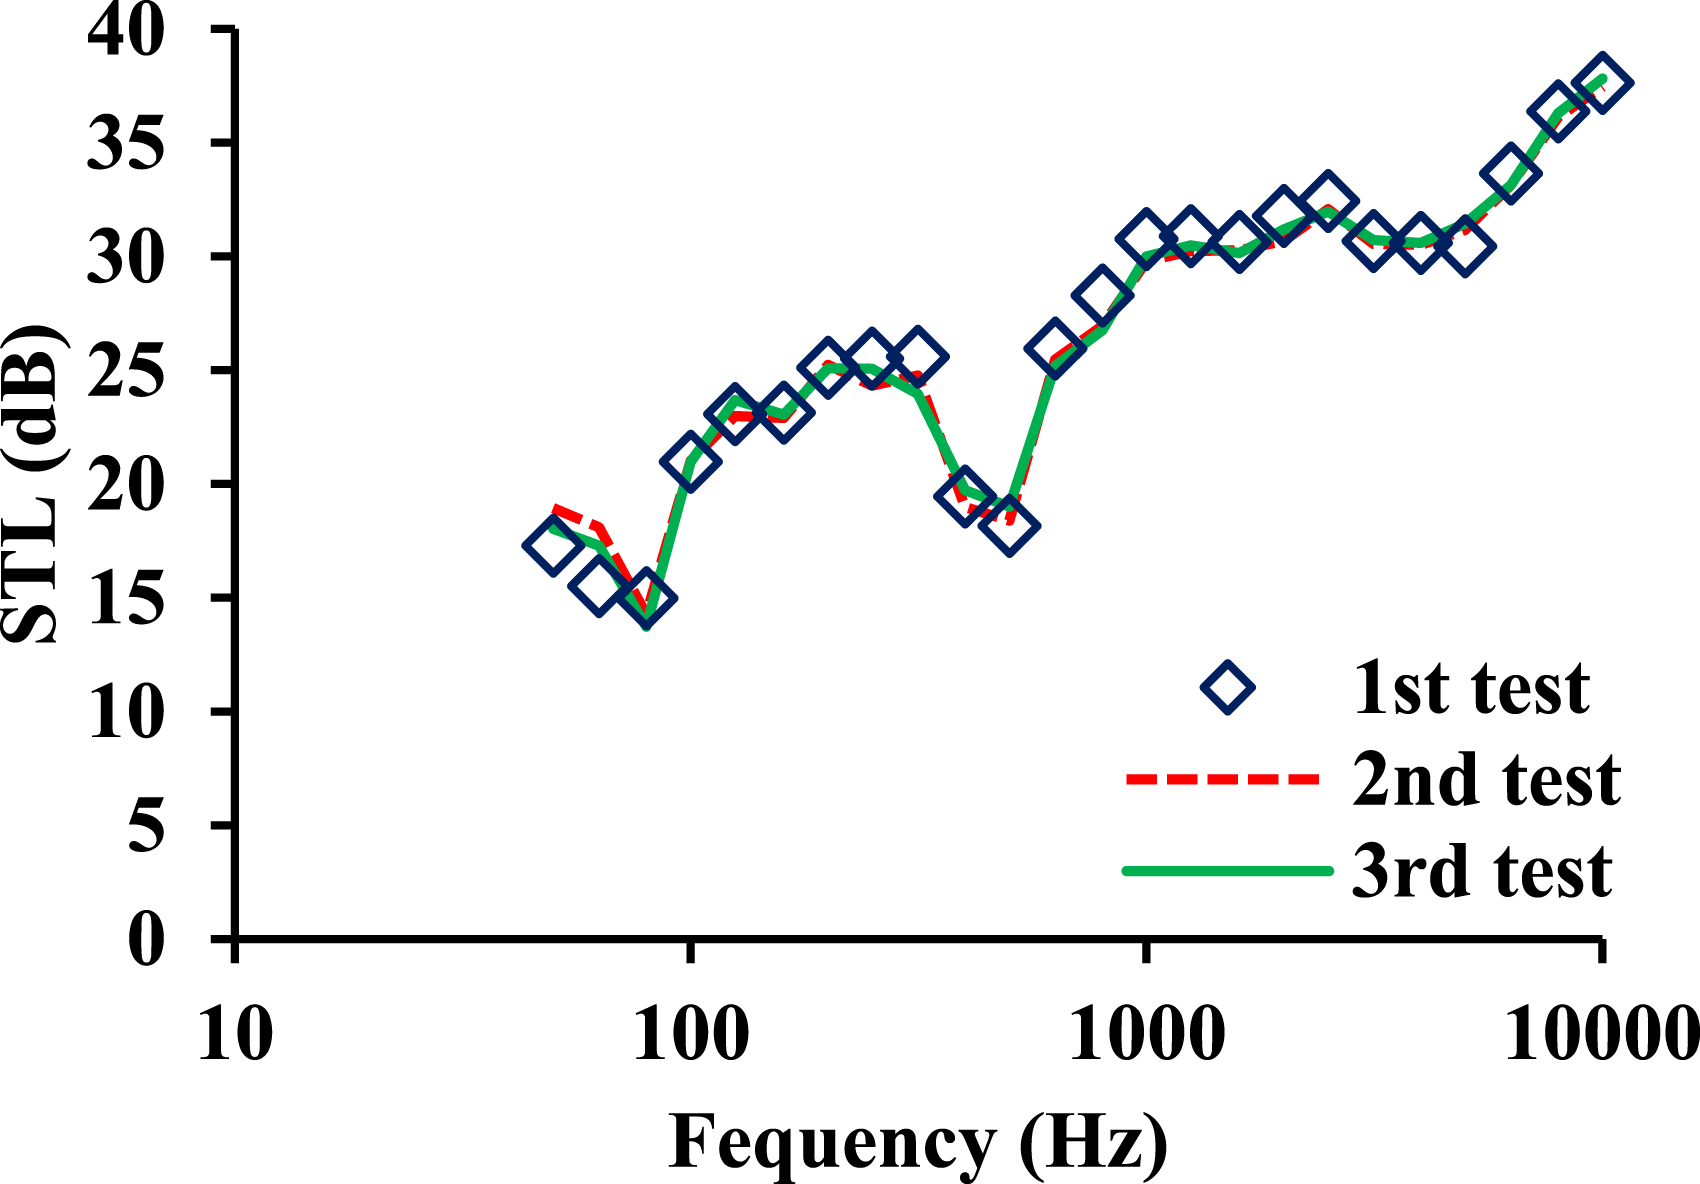
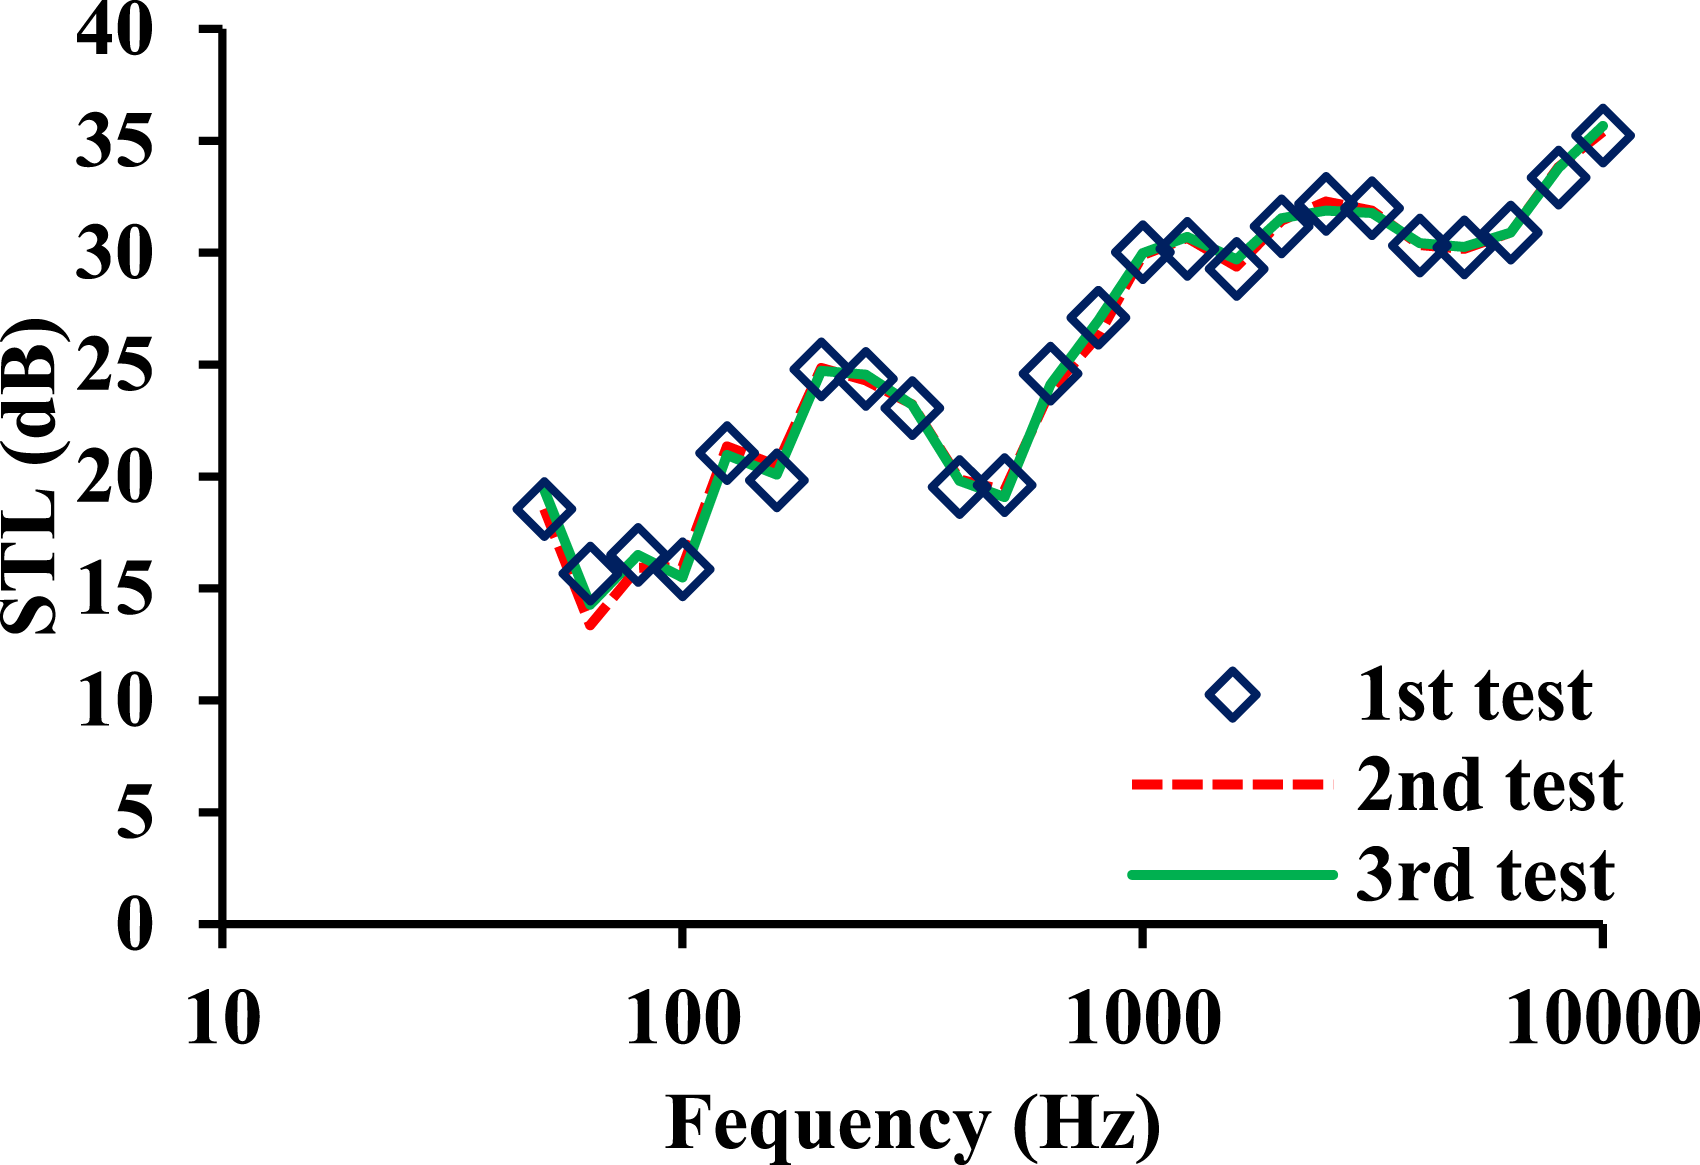
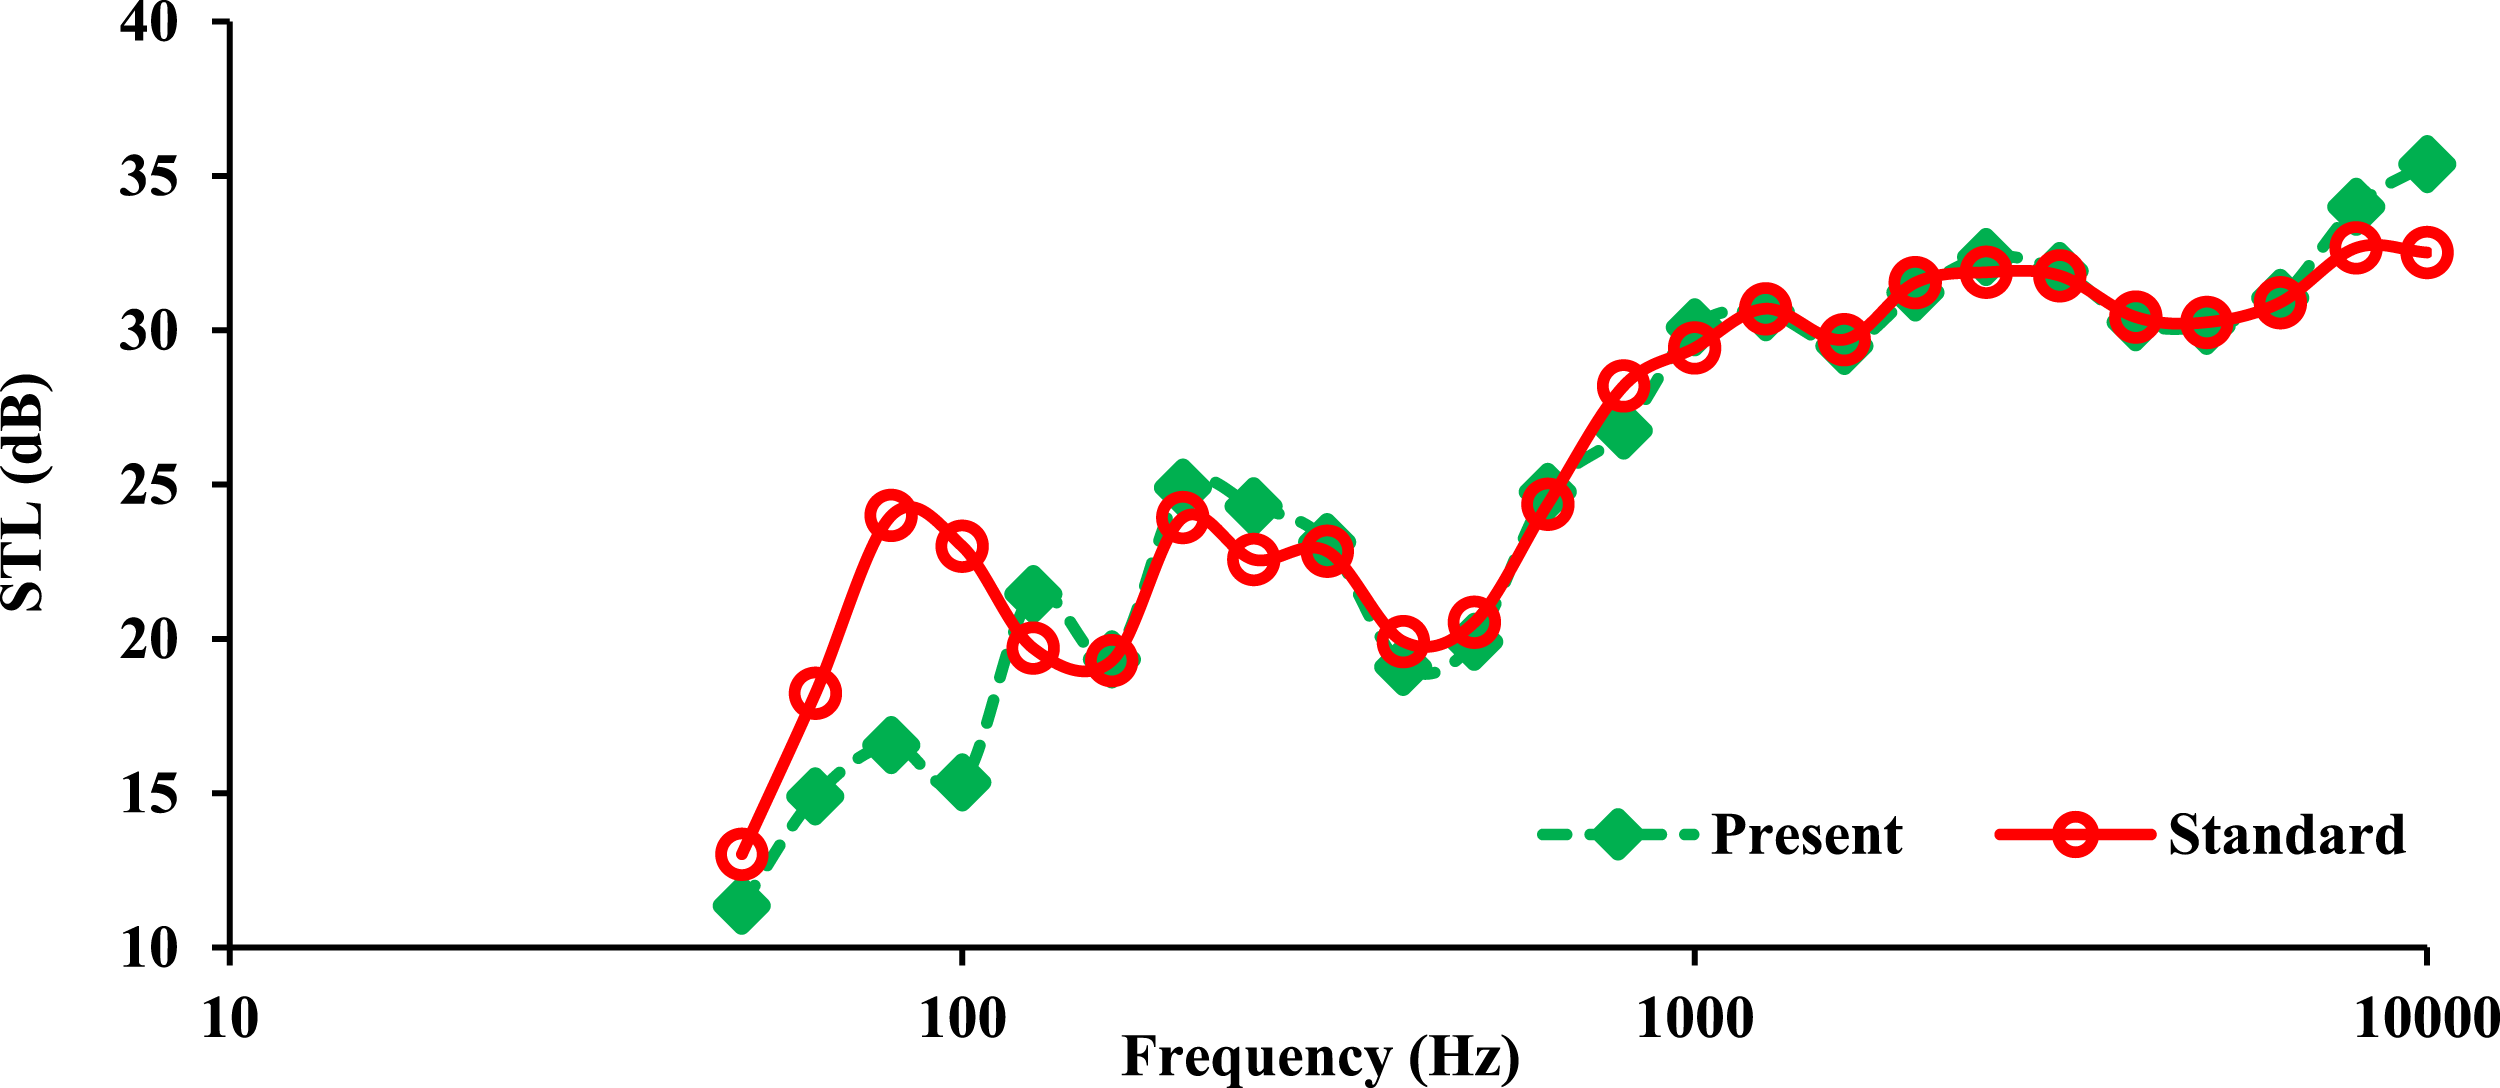
Figure 10 shows that all SPL spectra were consistent with each other, indicating that the diffusion sound field was uniform. SPL ≥ 60 dB within 50 Hz–100 Hz and SPL ≥ 90 dB within 100 Hz–10,000 Hz, proving that the SPL met the measurement standard.24,25,27 The principle can be used to guide the functional identification and modification of equipment.
As shown in Figures 11 and 12, STL results were similar, indicating the good repeatability of experiments at −40°C and 40°C. The same conclusion could be obtained at other temperatures within −40°C–40°C, meaning that the repeatability of the experiment was good. The method can also be used to validate the assumption in Measurement Process. When there is a significant deviation in data, devices must be overhauled.
Figure 13 shows that the error between the standard and improved STL experiments was within 50 Hz–100 Hz, which was caused by the environmental simulator device. The reverberation chamber of the device was too small to reach the ideal state in low frequency. The results should be corrected before use. The deviation was small in 125 Hz–10,000 Hz, demonstrating that the results measured via the improved STL technique were accurate and reliable within these bands. To obtain accurate results, equation (20) was given.

The mentioned methods can be used in the development of acoustic experiments.
The analysis of STL at different temperatures
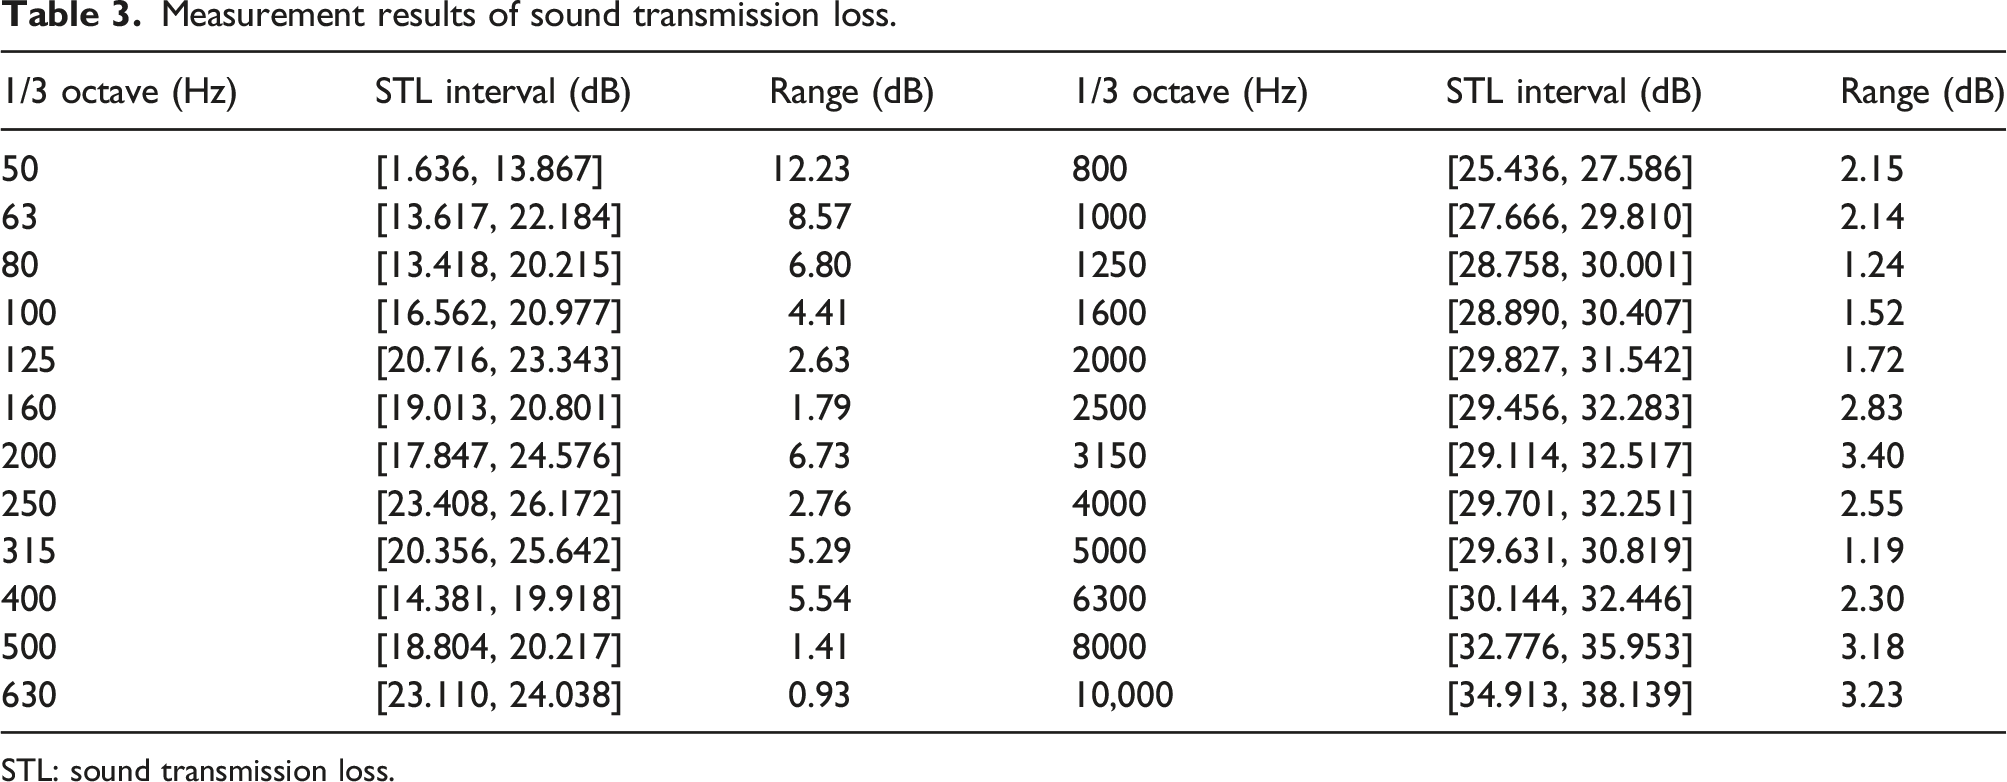
Measurement results of sound transmission loss.
STL: sound transmission loss.
Three conclusions can be drawn from Table 3: I) Temperature significantly affected the STL of the panel. Once the panel was immersed in different temperature environments, the STL changed. II) STL temperature sensitivity was different at each center frequency. The range at 50 Hz, 63 Hz, 80 Hz, 100 Hz, 200 Hz, 315 Hz, 400 Hz, 3150 Hz, 8000 Hz, and 10,000 Hz was >3 dB, and it was 1–2 dB at others. III) Overall, the panel’s STL was most affected by temperature at low/high frequencies and less in middle frequency. Conclusions I)–III) show that STL measurement at room temperature is insufficient for composite structures and it is necessary to study STL at various temperatures. The proposed STL experimental technique is a good choice.
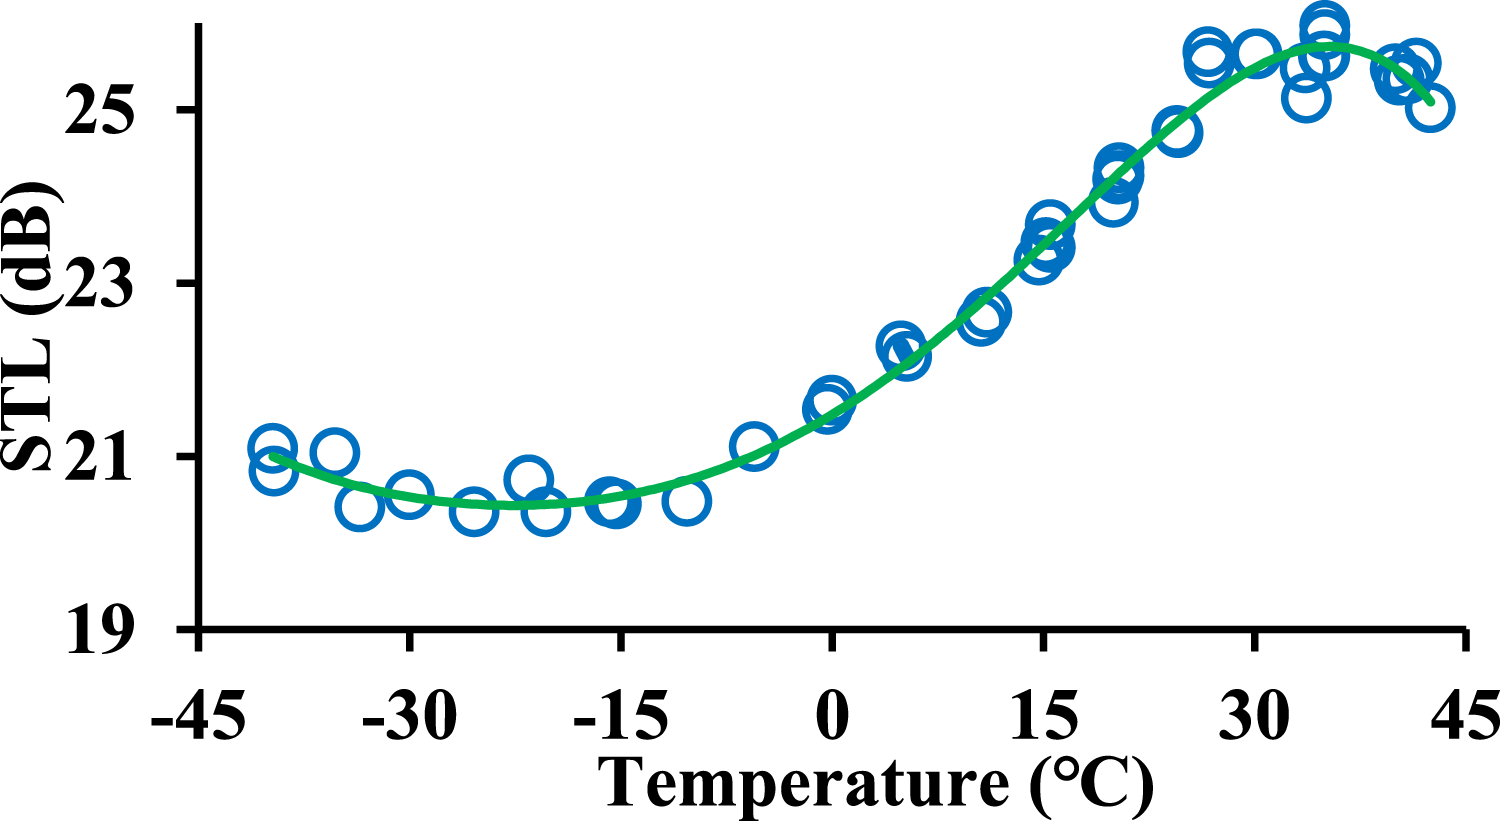
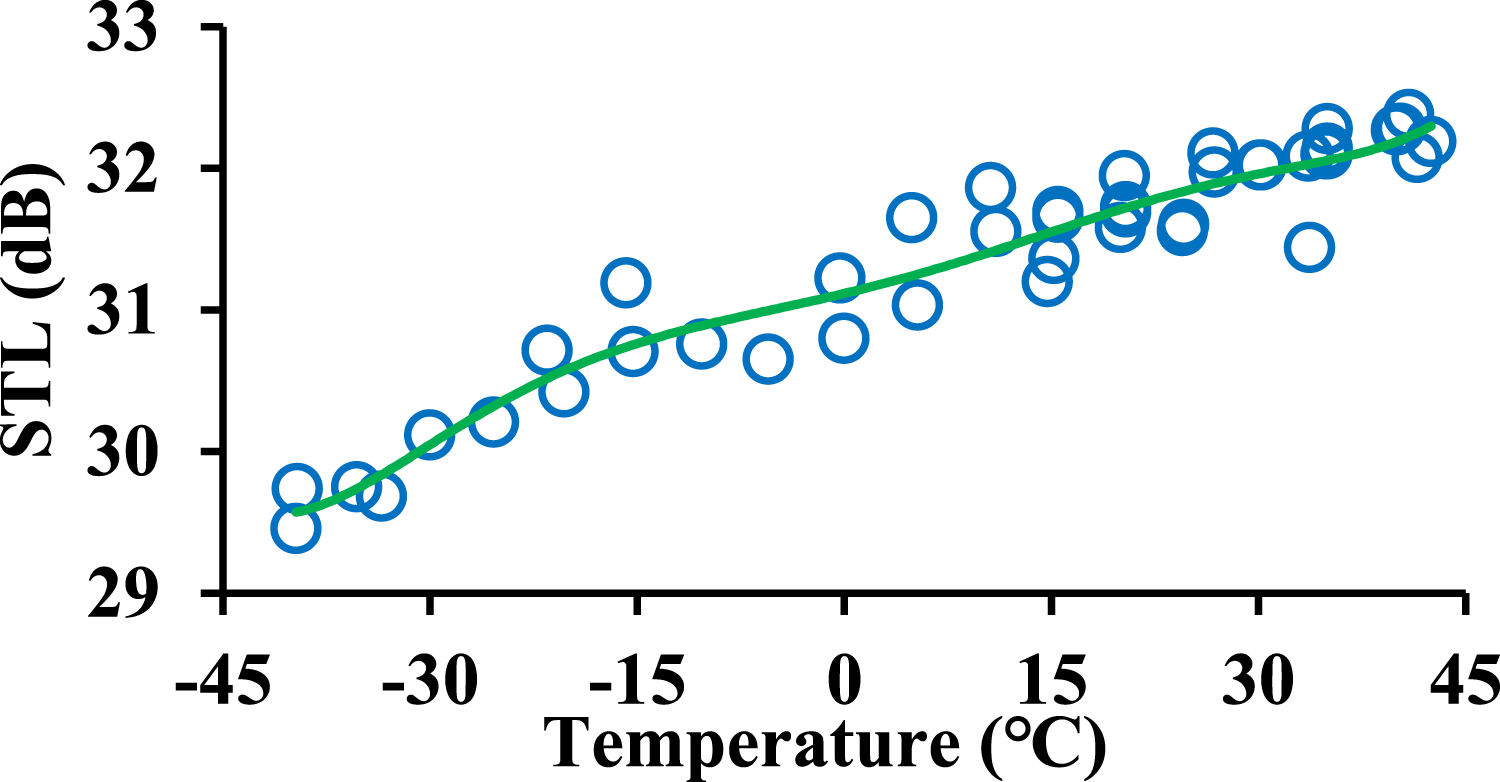
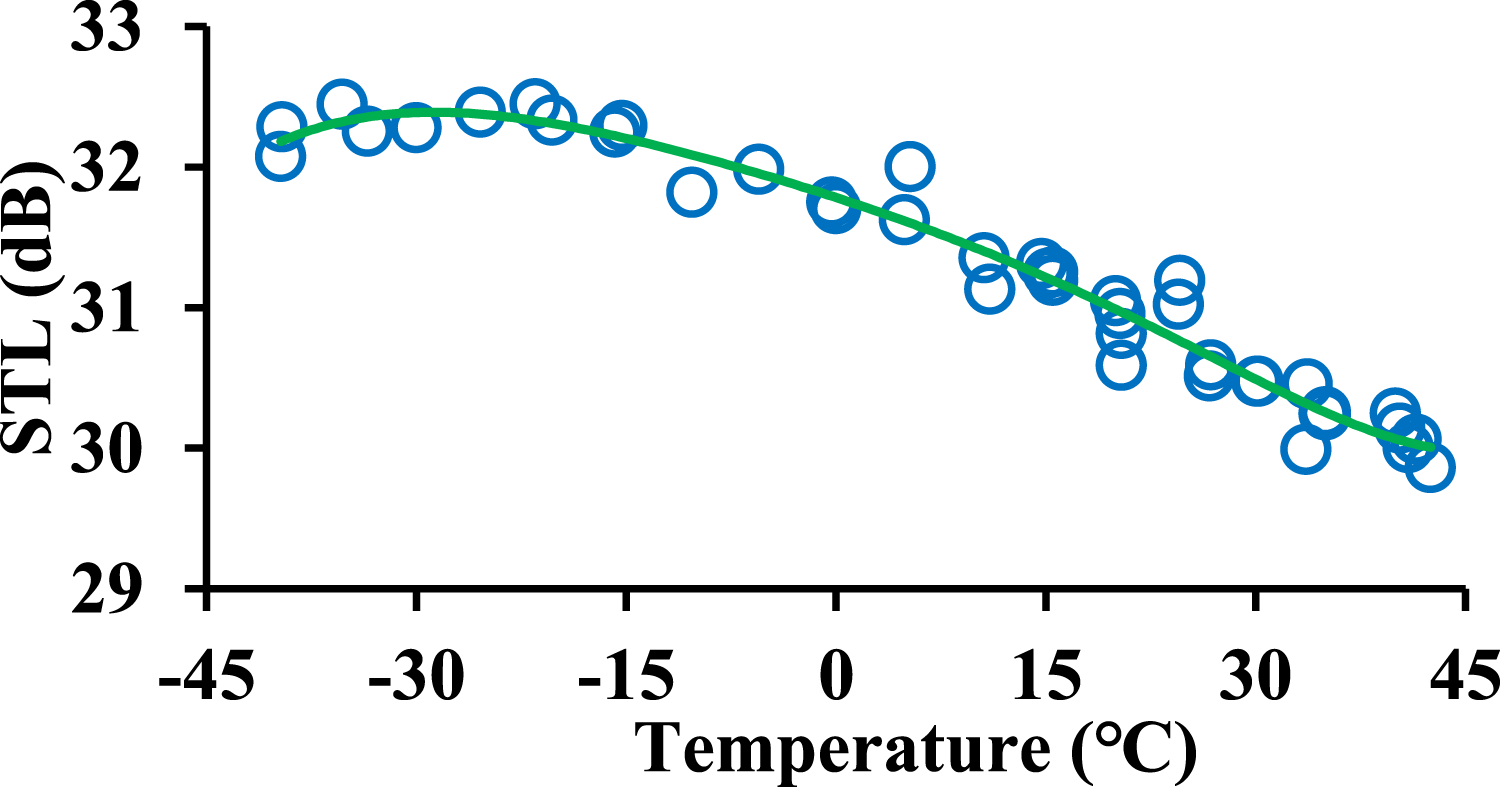
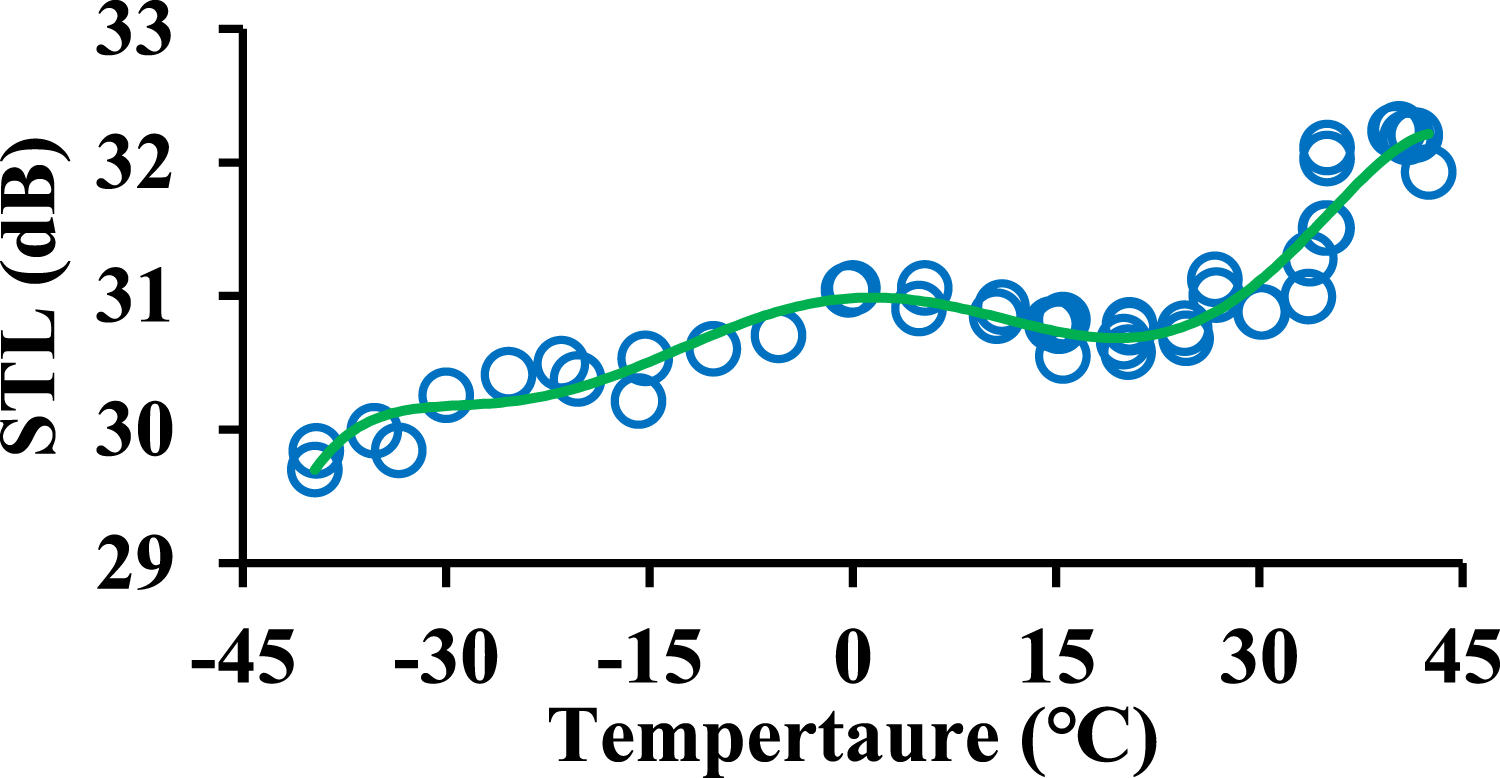
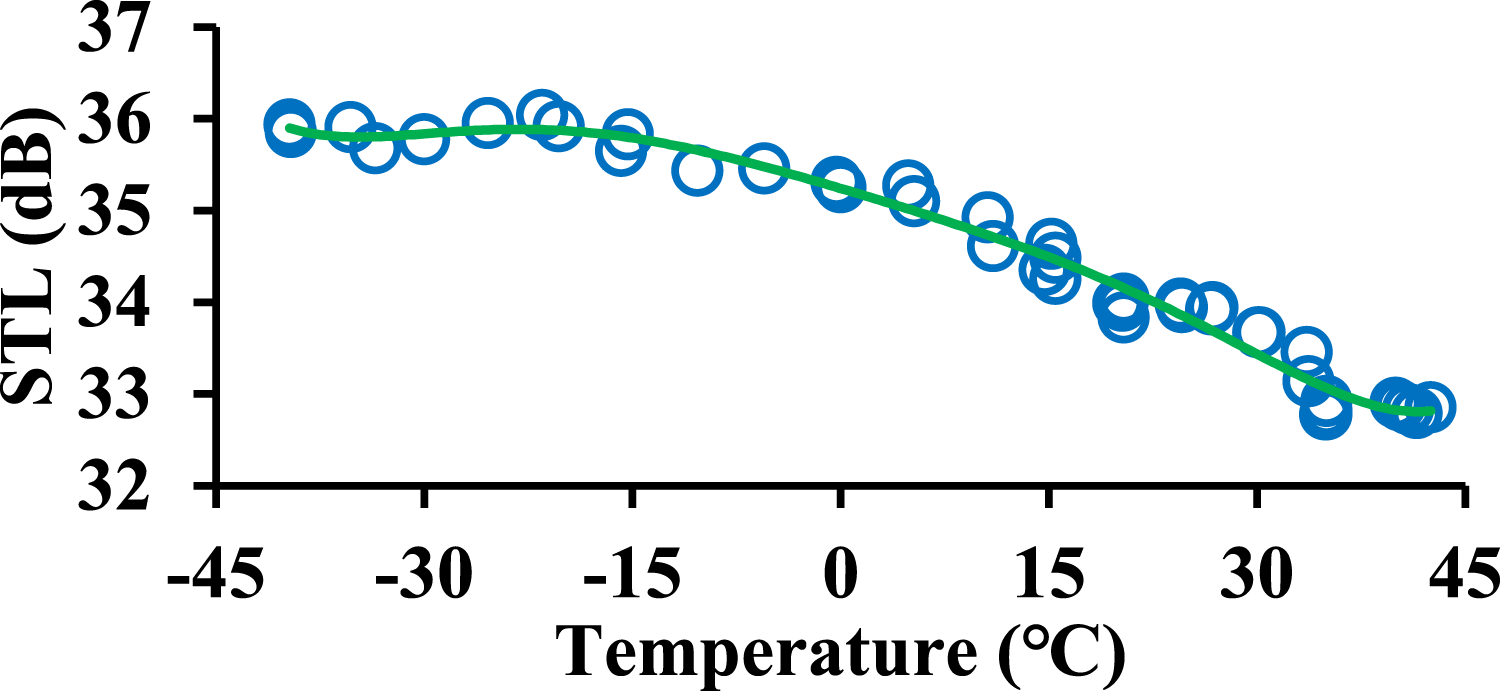
Since Table 3 cannot visually reveal the variation of the panel’s STL with temperature, Figures 14–17 and Appendix A are given. These figures exhibit that temperature had a severe impact on the STL variation trend of the panel, mainly including monotonicity and fluctuation. The monotonically increasing trend appeared at 2500 Hz (Figure 16), 3150 Hz (Figure 27), and 4000 Hz (Figure 28); the monotonically decreasing trend appeared at 6300 Hz (Figure 17), 8000 Hz (Figure 31), and 10,000 Hz (Figure 32); fluctuation trend appeared at other center frequencies. These trends suggest that the acoustic design of CFRP structures at room temperature may fail. A solution is: I) Finding out the temperature The relationship between sound transmission loss and temperature at 125 Hz. The relationship between sound transmission loss and temperature at 315 Hz. The relationship between sound transmission loss and temperature at 2500 Hz. The relationship between sound transmission loss and temperature at 6300 Hz.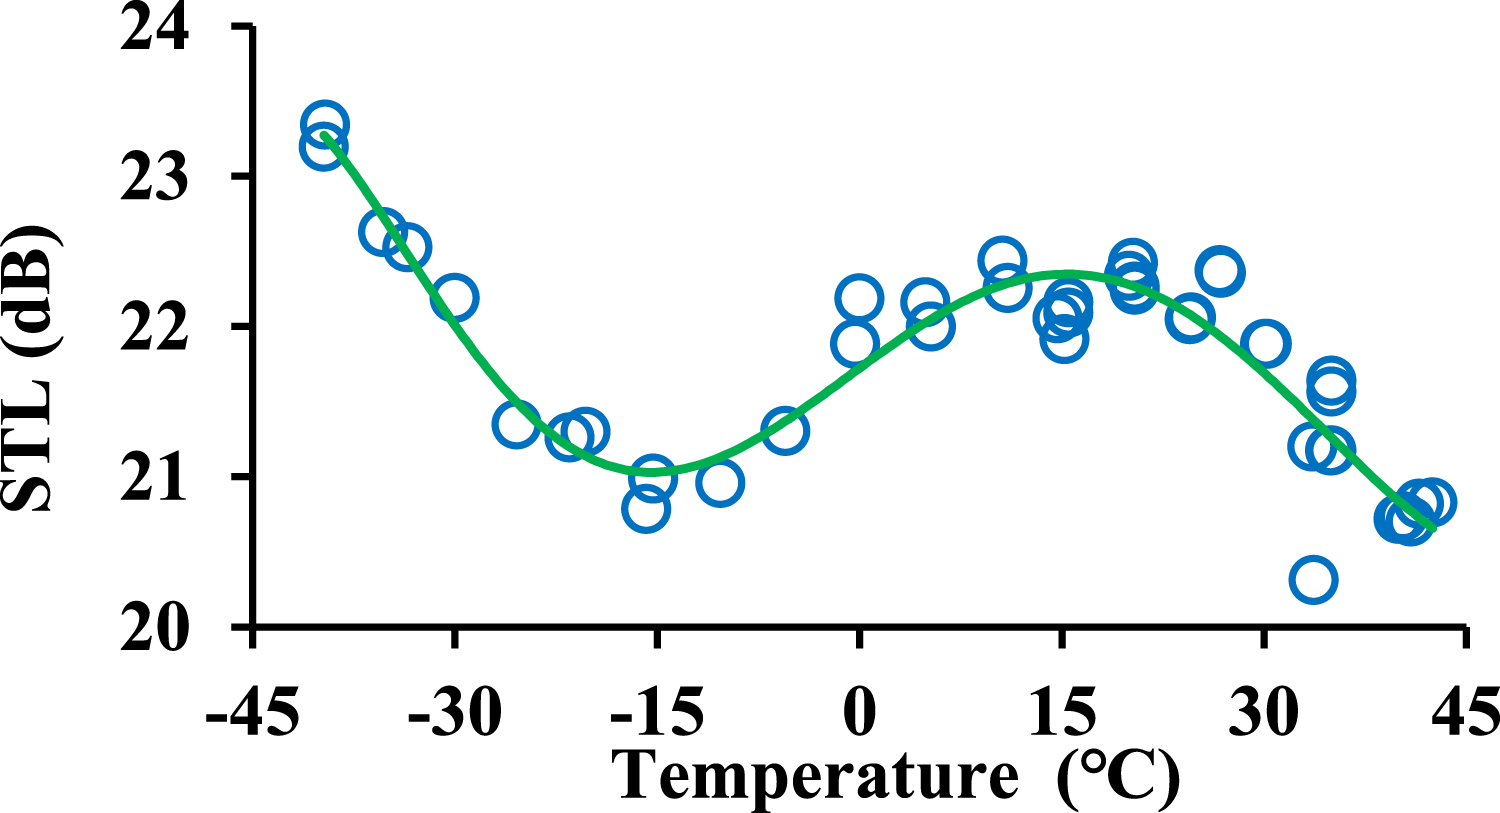
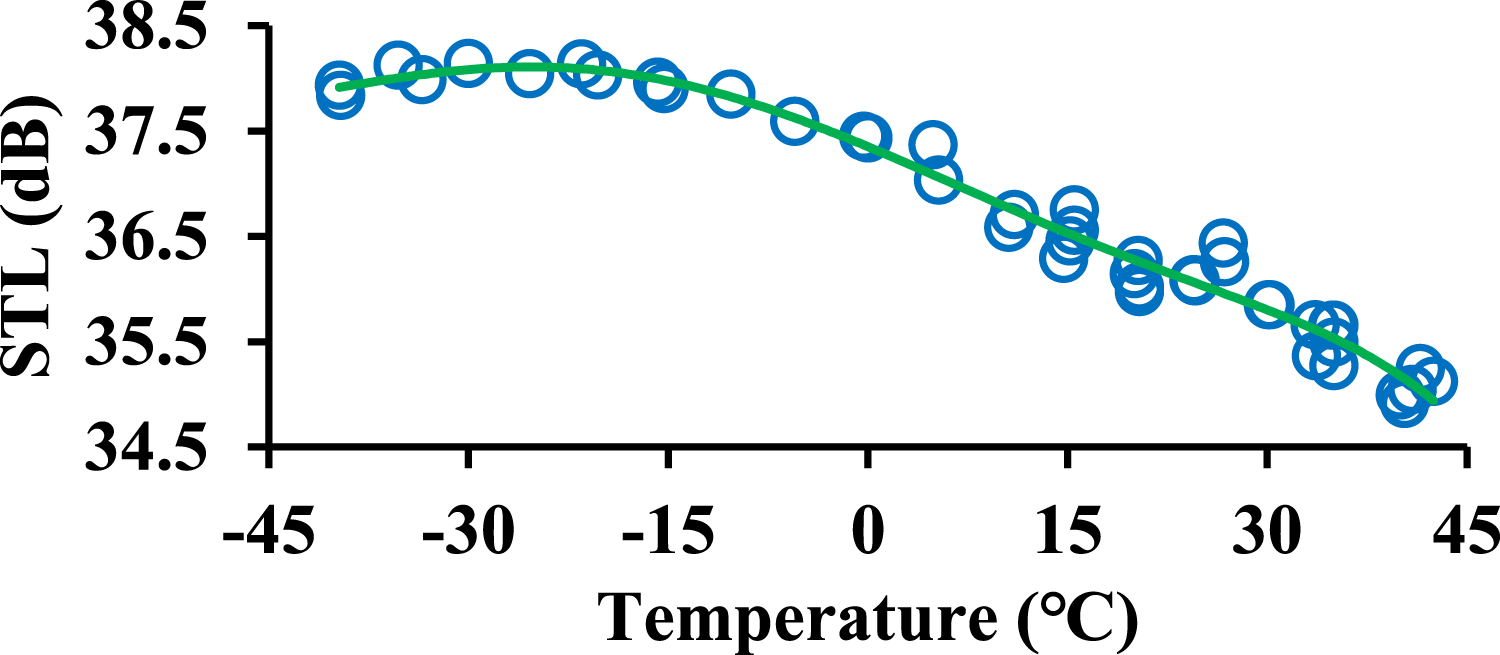
Due to STL variation trends being different at different center frequencies, the overall STL ( L
T
with temperature.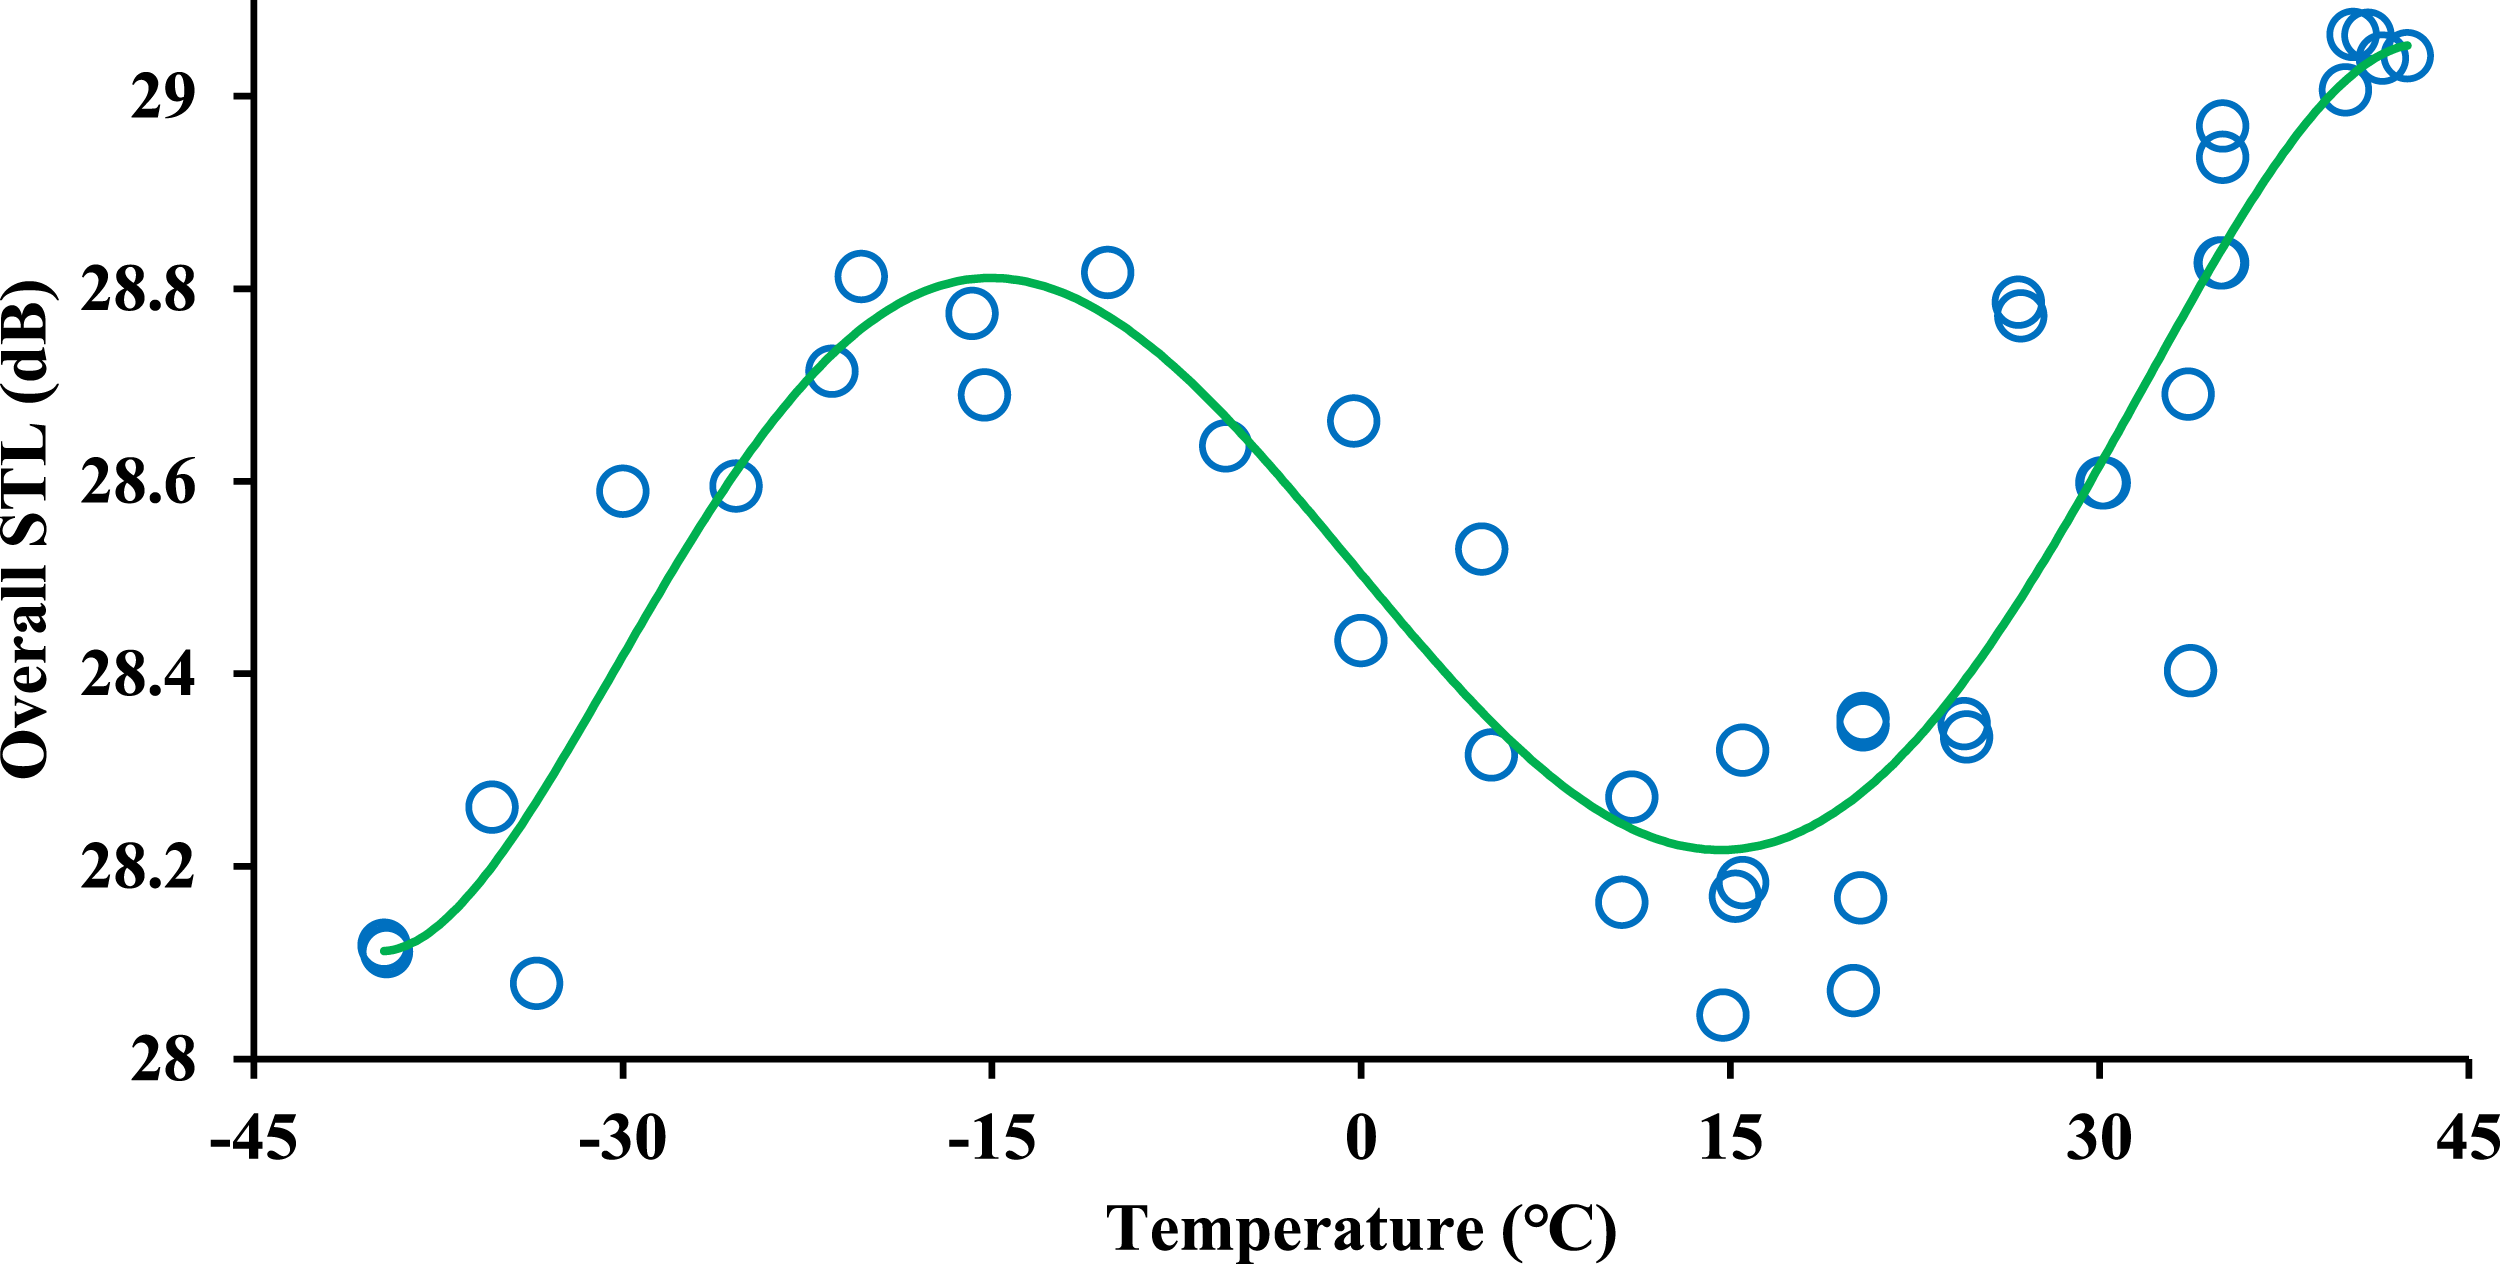
Figure 18 shows that
Discussion of sound transmission loss variation
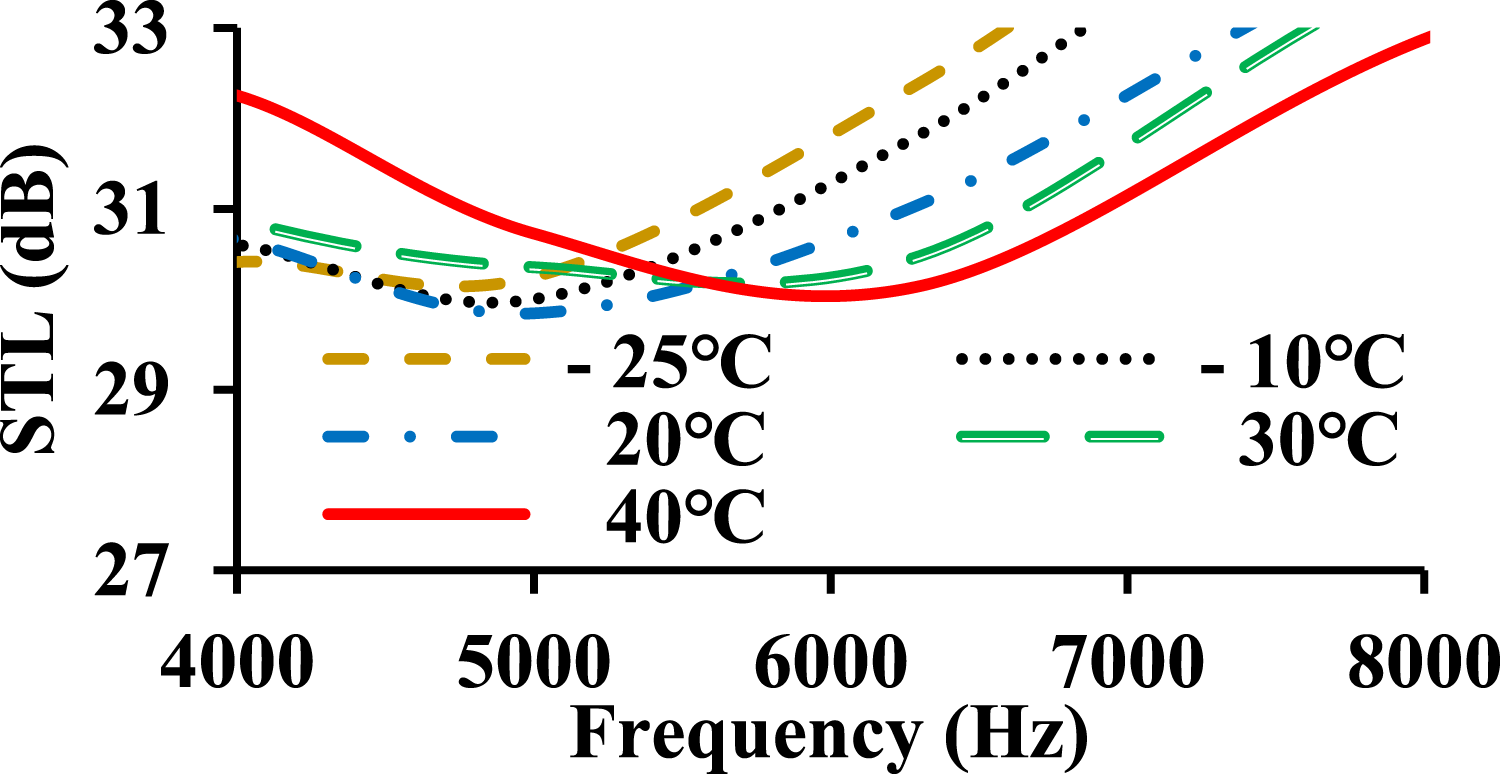
STL variation in The Analysis of STL at Different Temperatures was essentially caused by the change of damping loss factor and elastic modulus, with temperature. To illustrate the mechanism, measurement results at 40°C, 0°C, and −40°C were employed, as shown in Figure 19 and Table 4. Sound transmission loss measured at −40°C, 40°C, and 0°C. Distribution of the controlled regions.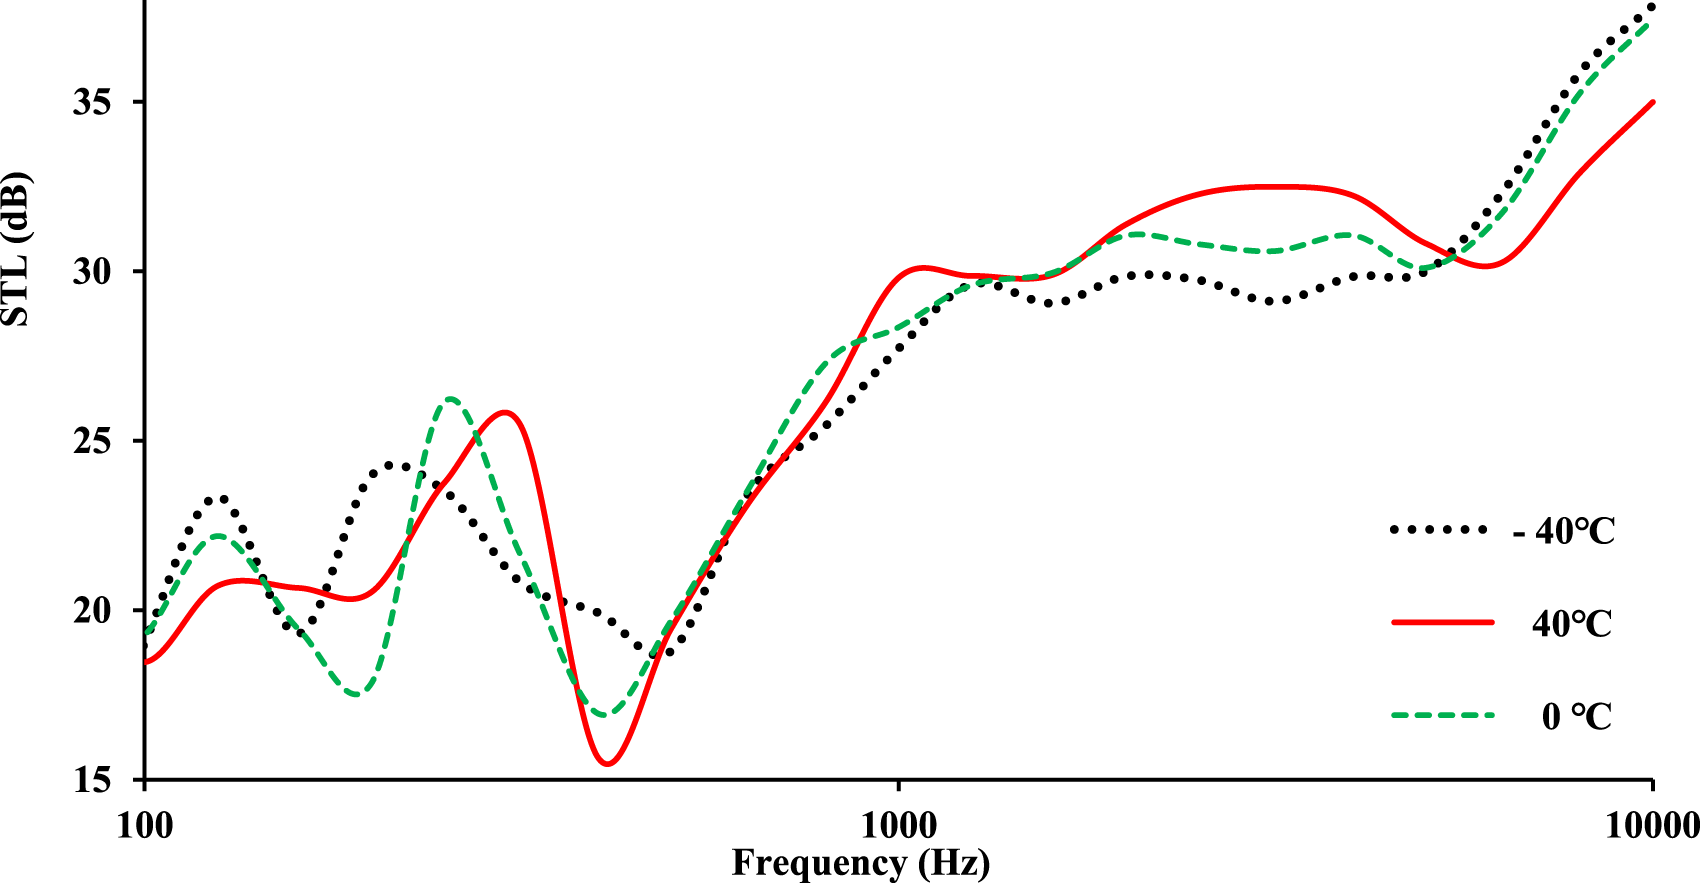
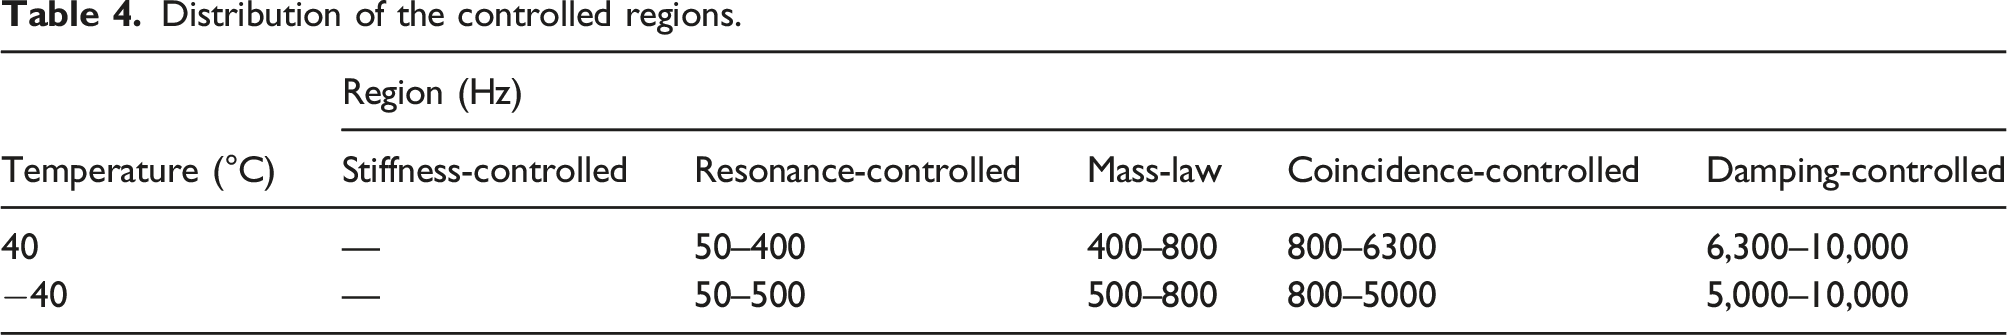
Figure 19 and Table 4 show that temperature change led to the redistribution of controlled regions. When the temperature dropped from 40°C to −40°C, the resonance-controlled region expanded to the high frequency, while the coincidence-controlled and damping-controlled regions had an opposite change. The phenomenon was directly caused by the change of STL peak/dip frequencies with temperature. The basic reason is discussed later.
Figure 19 exhibits, in the resonance-controlled region, the maximum STL dip frequency decreased with temperature. Therefore, when the temperature dropped, the resonance-controlled region expanded to a high frequency. The problem was caused by the change in composite stiffness. In Refs. 20,21 and 37, it has been proved that the increased temperature results in decreased composite stiffness, the decreased stiffness produces reduced resonance frequencies, and the reduced resonance frequencies induce the decreasing of STL peak/dip frequencies. Hereby, the reason is verified via experiments shown in Figure 20. Measurement of elastic modulus. (a)−55°C (b) 23°C and (c) 71°C.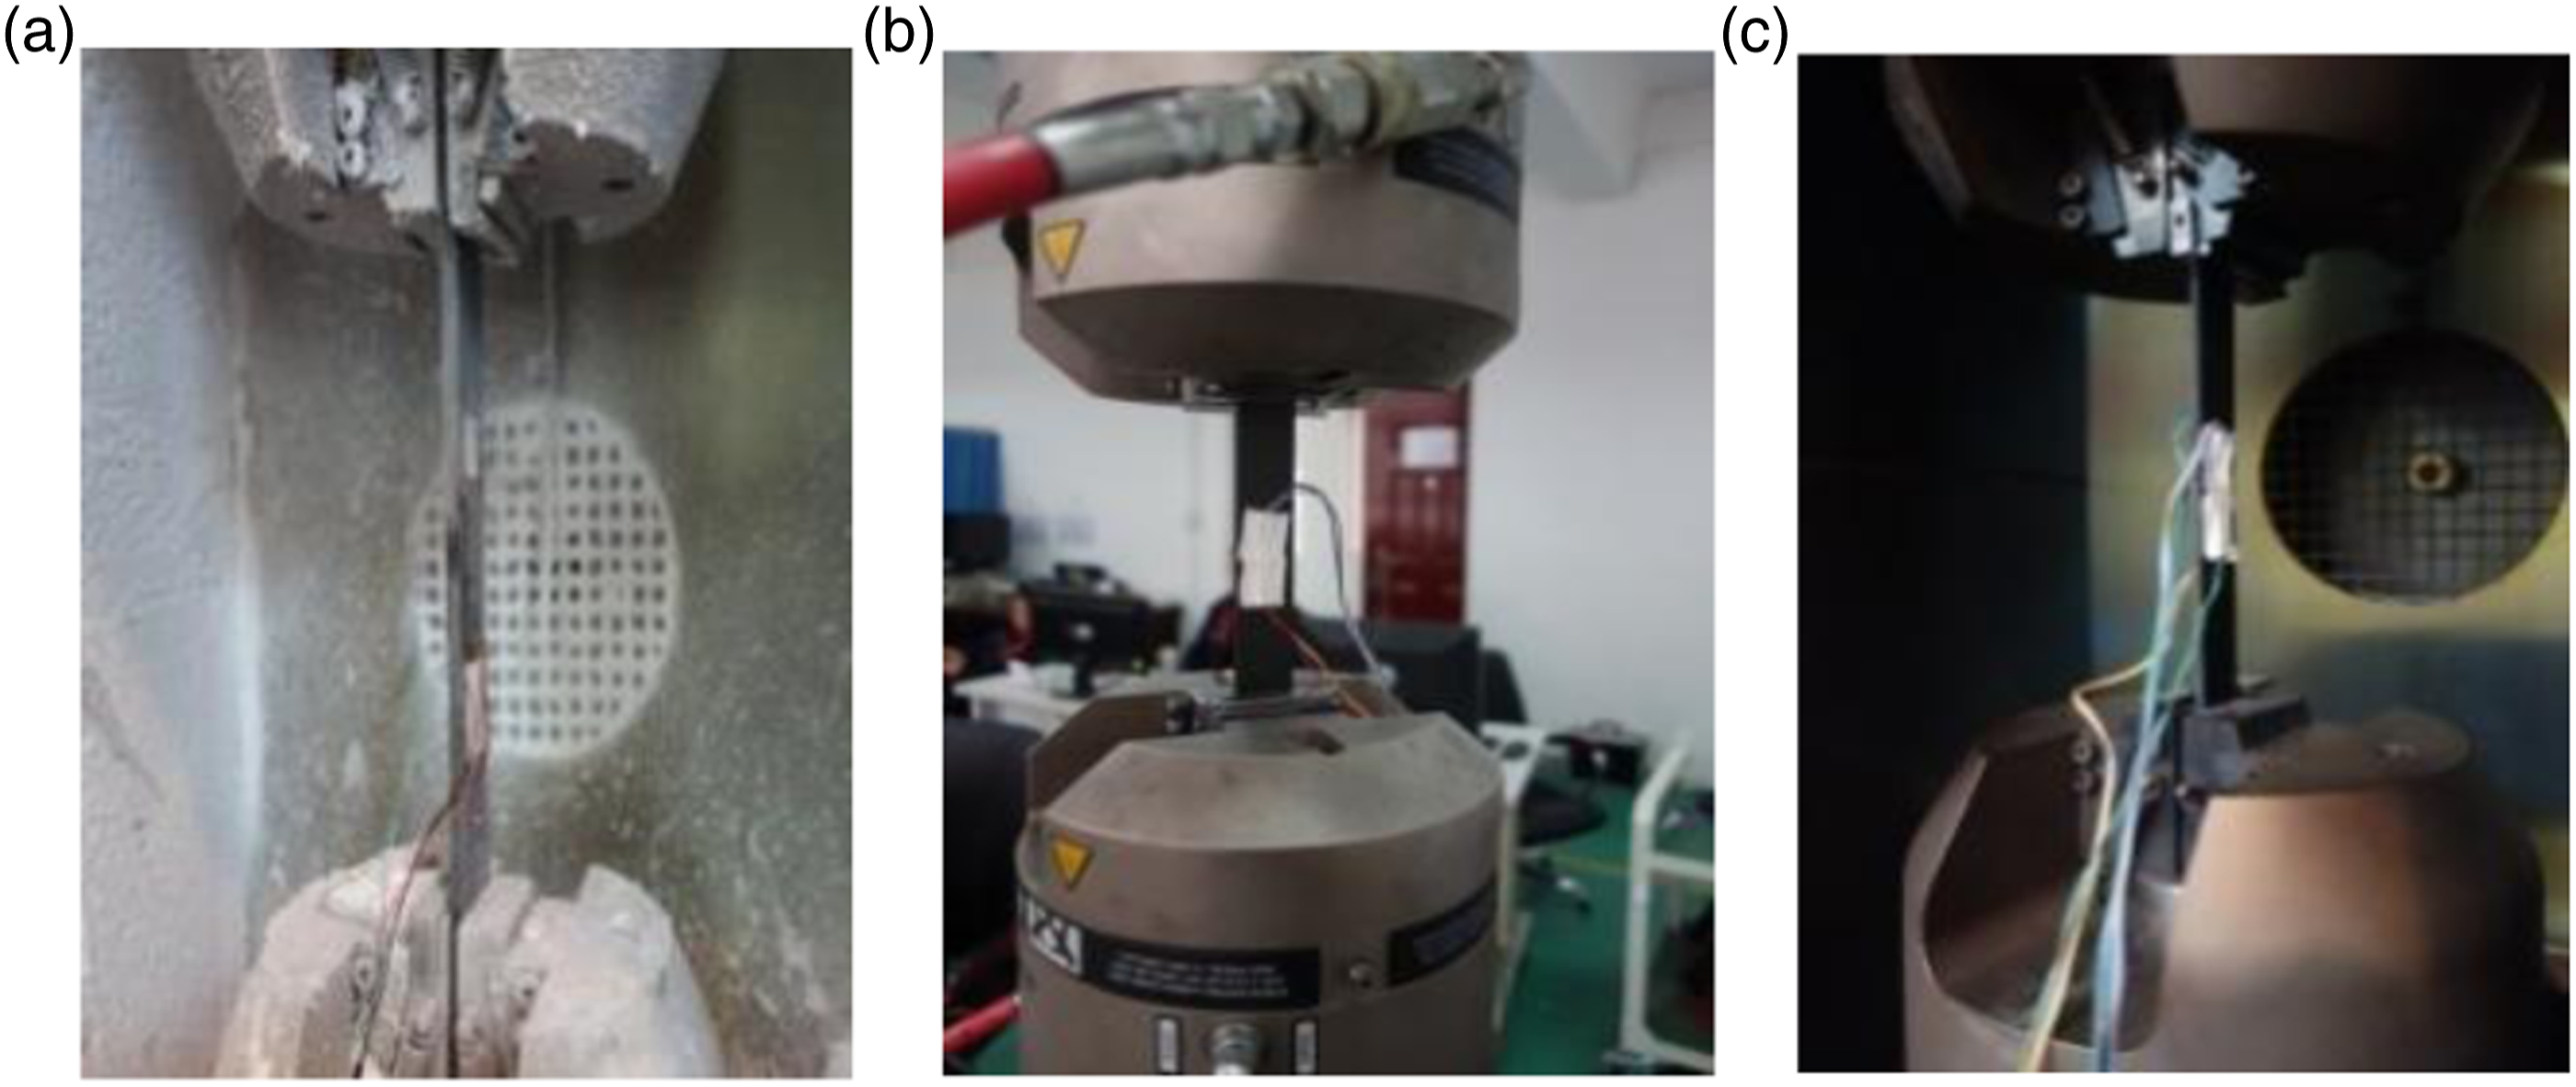
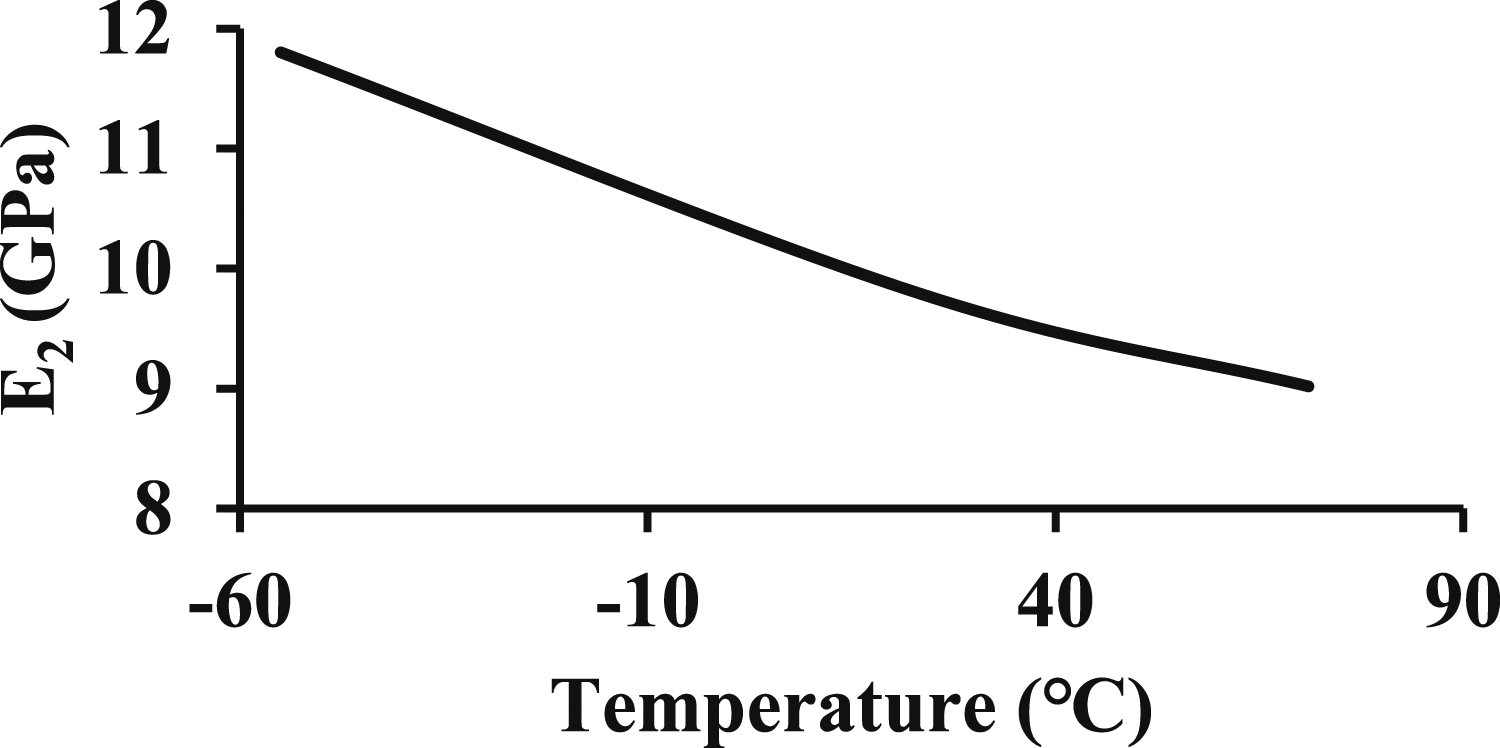
Considering that elastic modulus is the microscopic reflection of stiffness, the problem is to verify that the elastic modulus of composites would change with temperature. Thus, the mechanical properties of the panel’s skin used in this study were measured at −55°C, 23°C, and 71°C. Results are plotted in Figures 21 and 22. Obviously, the elastic modulus decreased with temperature, indicating the correctness of the above analysis. Changes in elastic modulus are detrimental to composite acoustic design and may fail noise reduction schemes. An adiabatic design of composite structures should be developed to overcome the failure, bionics
35
is a potential option. Elastic modulus E1. Elastic modulus E2 (E2 = E3).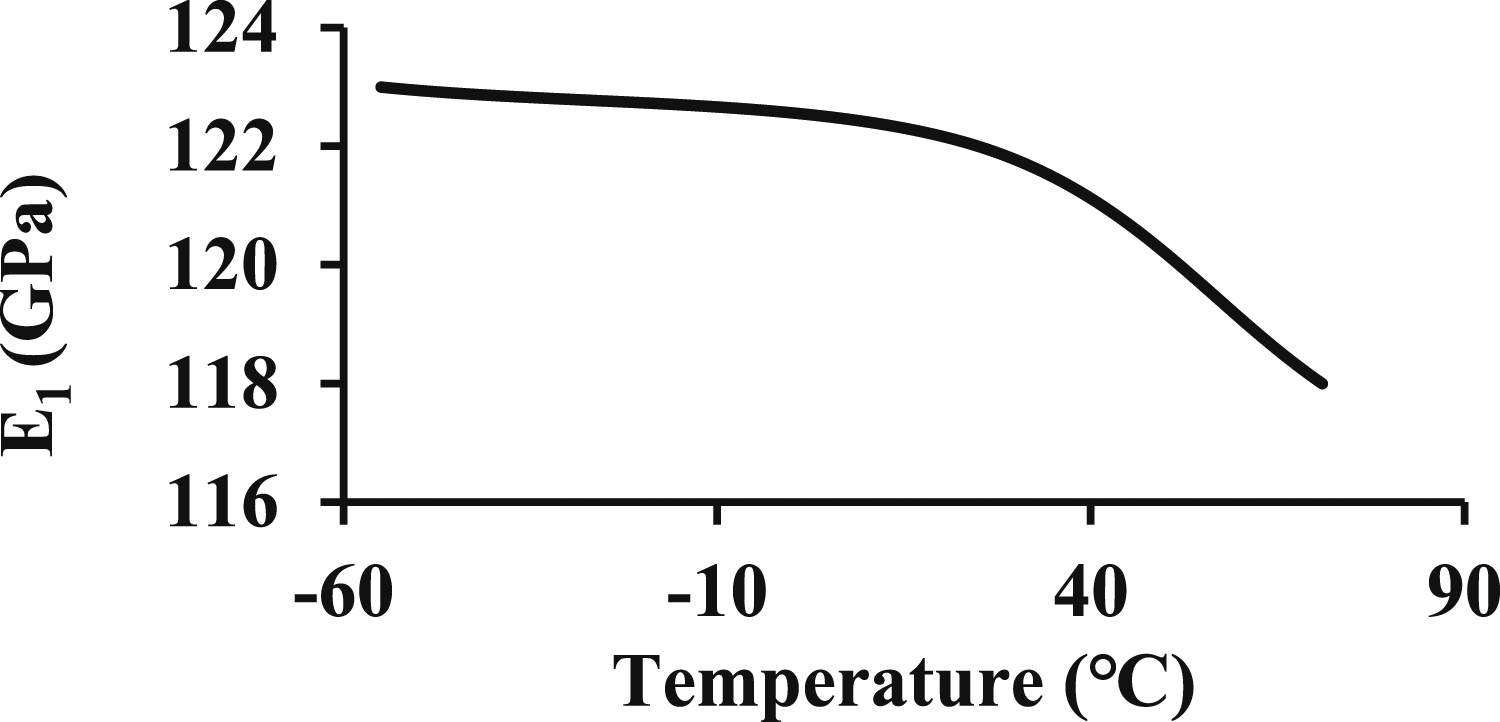
The sound transmission loss peak/dip frequencies in the resonance region.
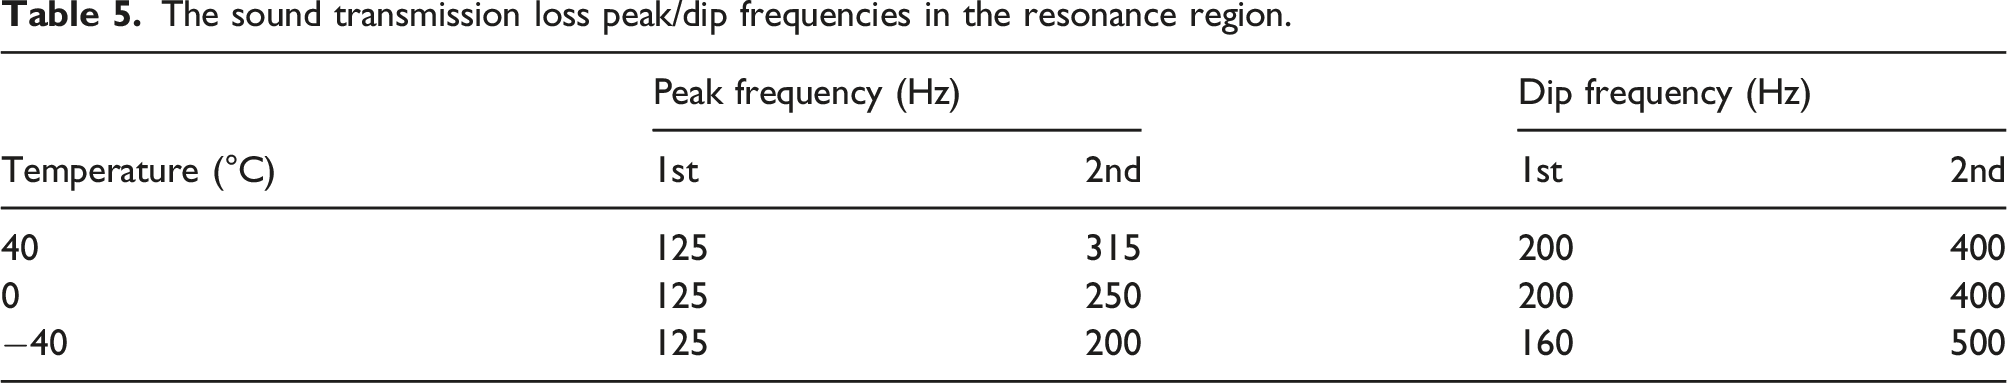
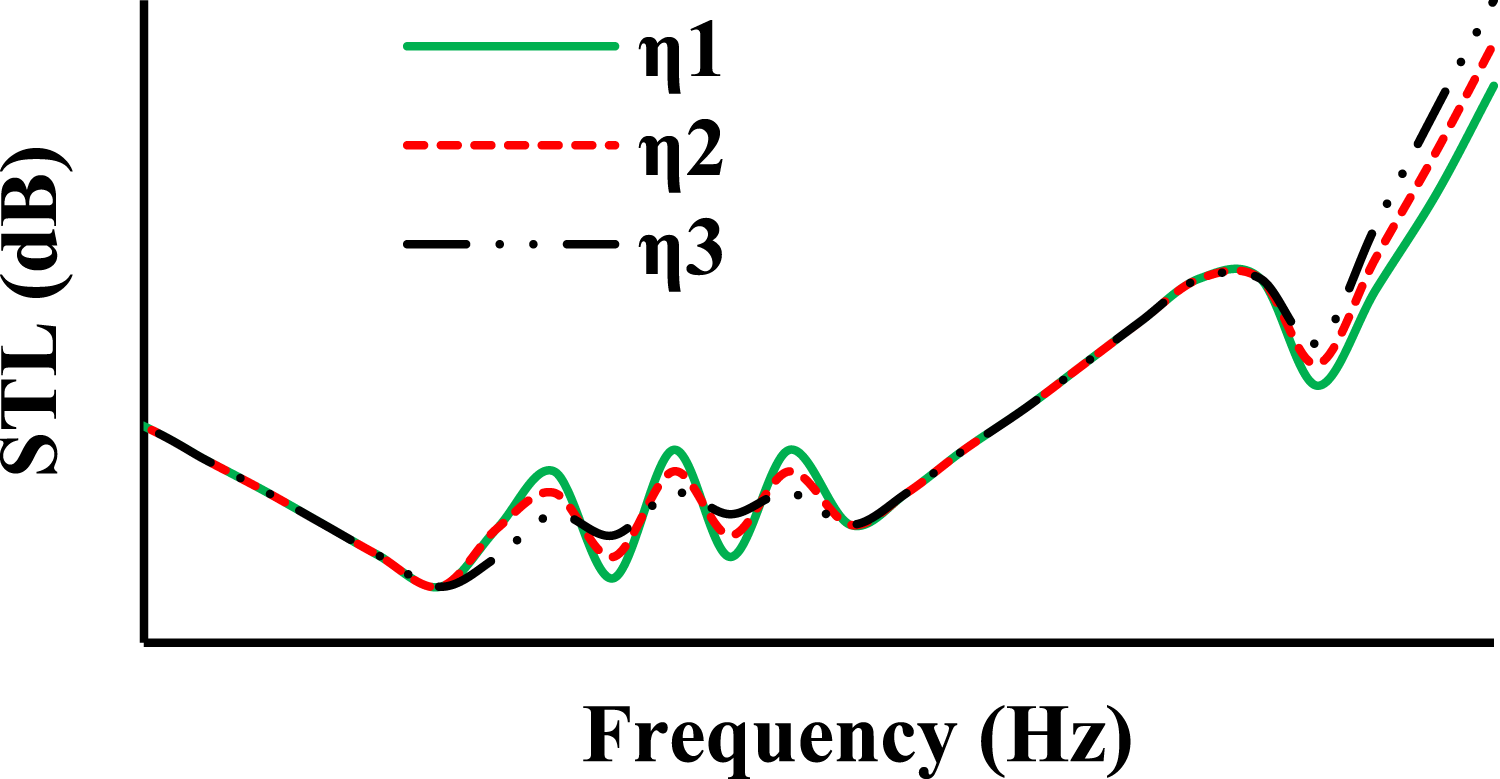
It can also be found that, when STL peak/dip frequencies did not change with temperature, temperature increase caused a decrease in STL peak value and an increase in STL dip value, in Figure 19 and Table 5. To clearly describe this phenomenon, Figure 23 was given. At 125 Hz (a peak frequency), STL value declined with temperature; conversely, STL value rose at 160 Hz (a dip frequency). The phenomenon was caused by Change in the peak/dip value of sound transmission loss.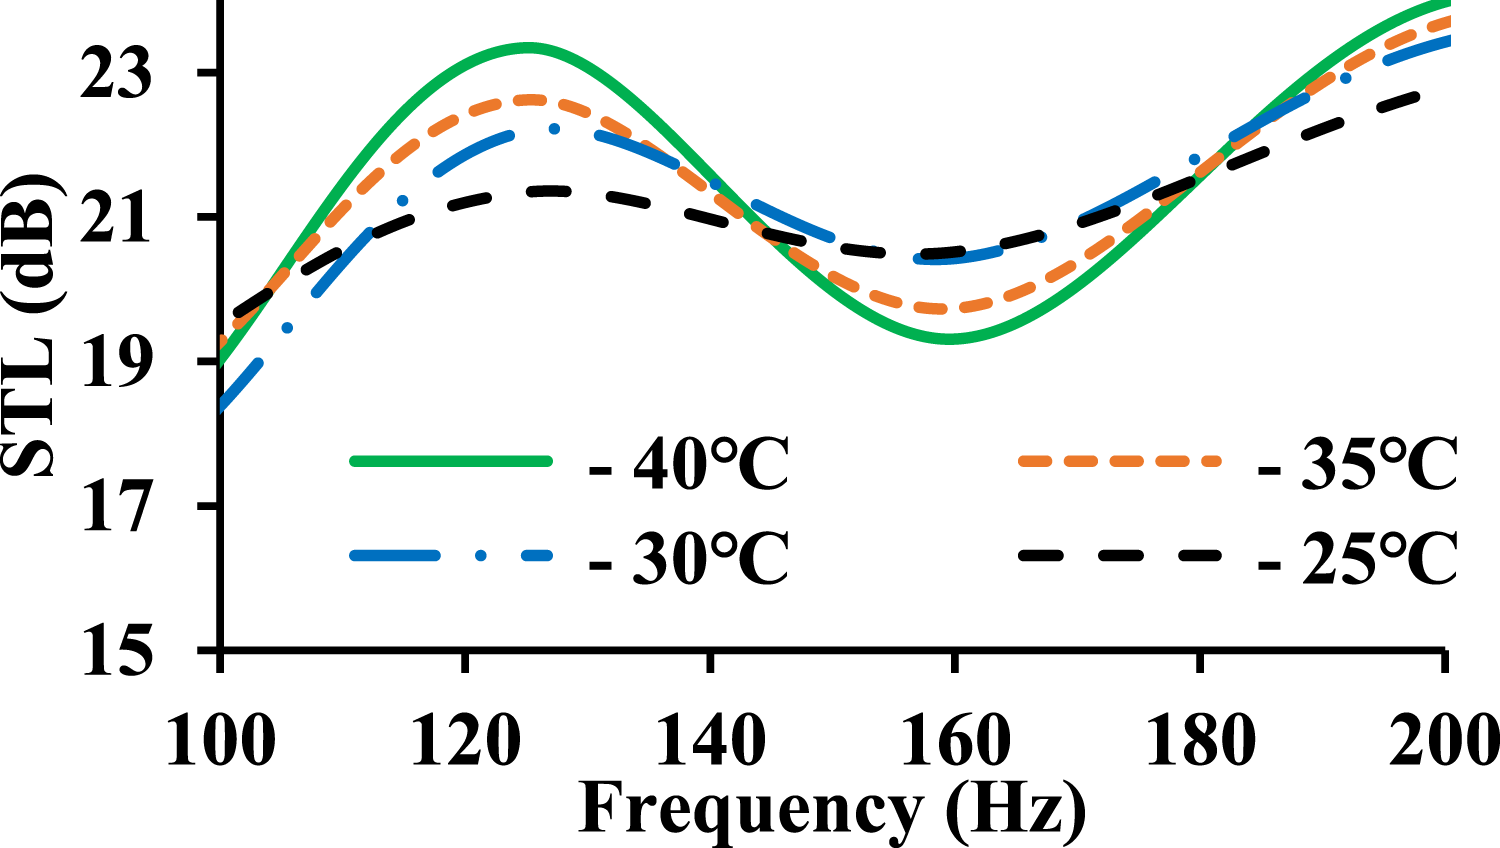
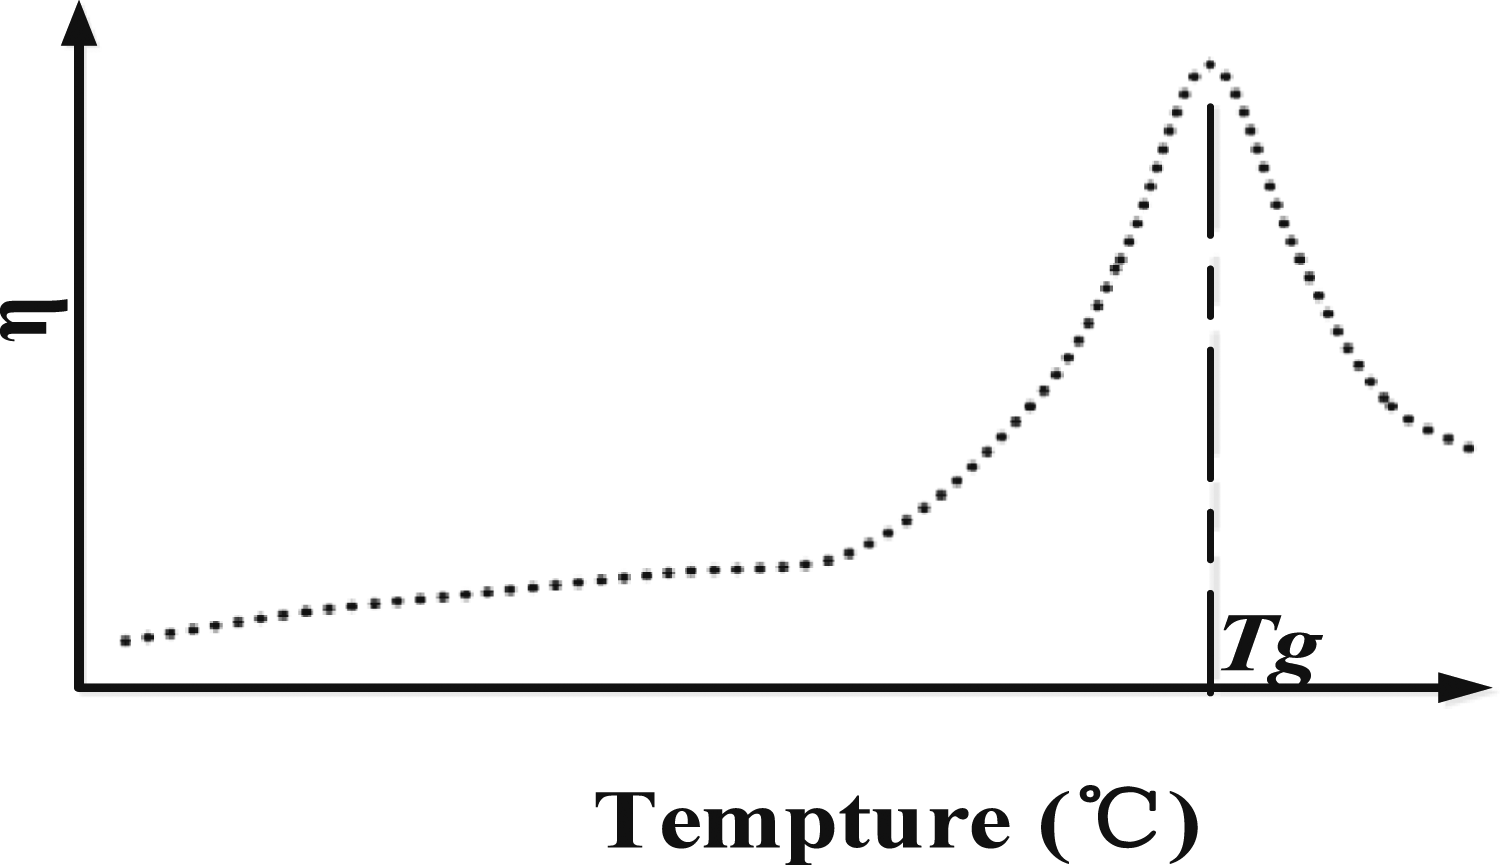
The panel was made from CFRP, so its glass transition temperature The aging curve of carbon fiber reinforced plastics glass transition temperature. The relationship among η, temperature, T
g
. Sound transmission loss variation with η (η1 < η2 < η3).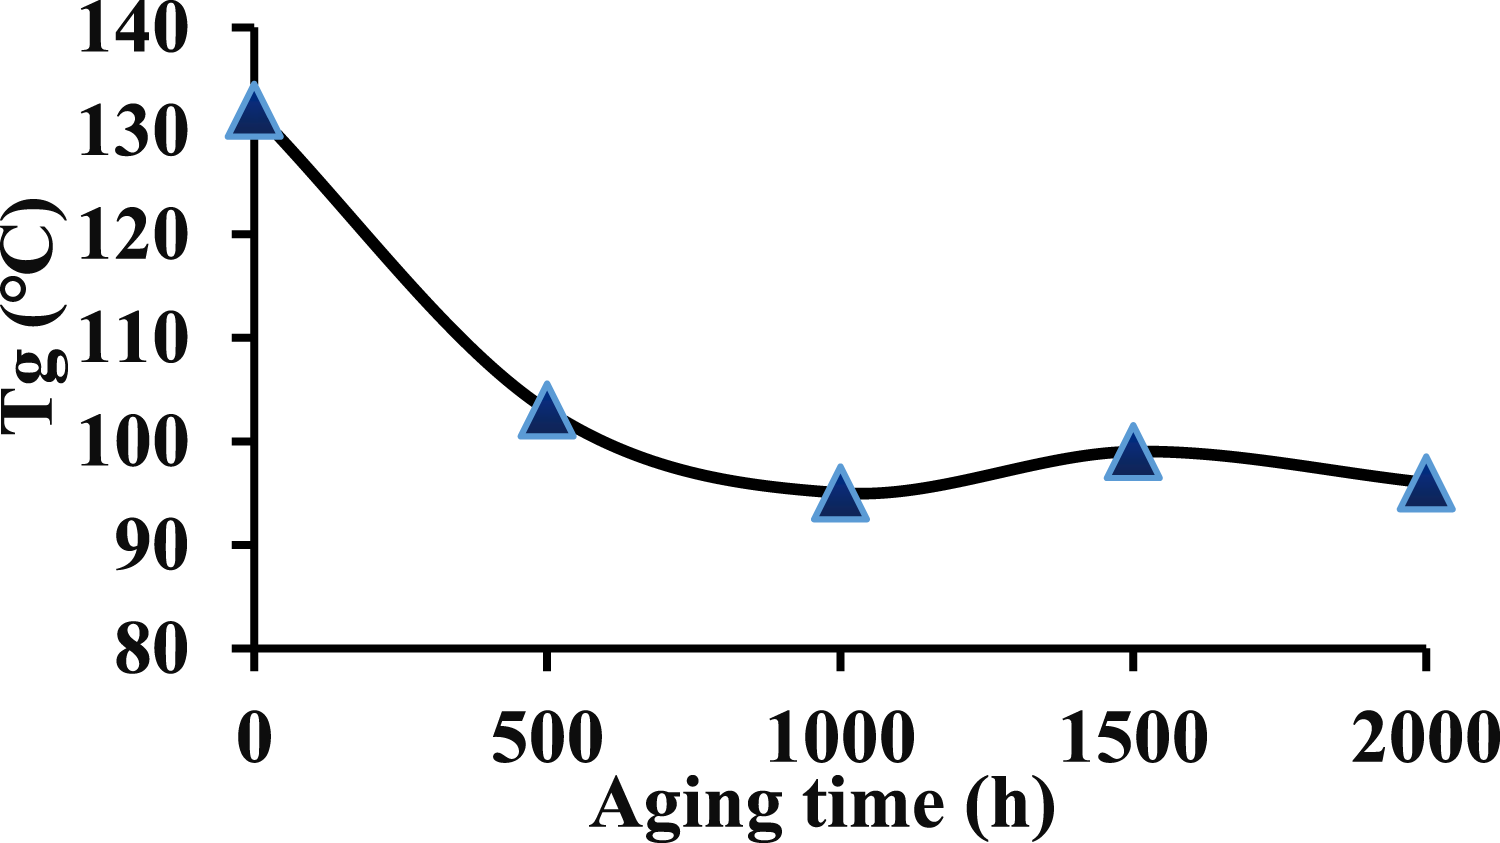
In Figure 14, when the temperature continued to increase, the stiffness reduced, then STL peak/dip frequency changed. While
With further measurements in the coincidence-controlled region, Figures 27 and 28 were plotted. They show that the panel’s STL increased with temperature at 3150 Hz, 4000 Hz, which was caused by Relationship between sound transmission loss and temperature at 3150 Hz. Relationship between sound transmission loss and temperature at 4000 Hz.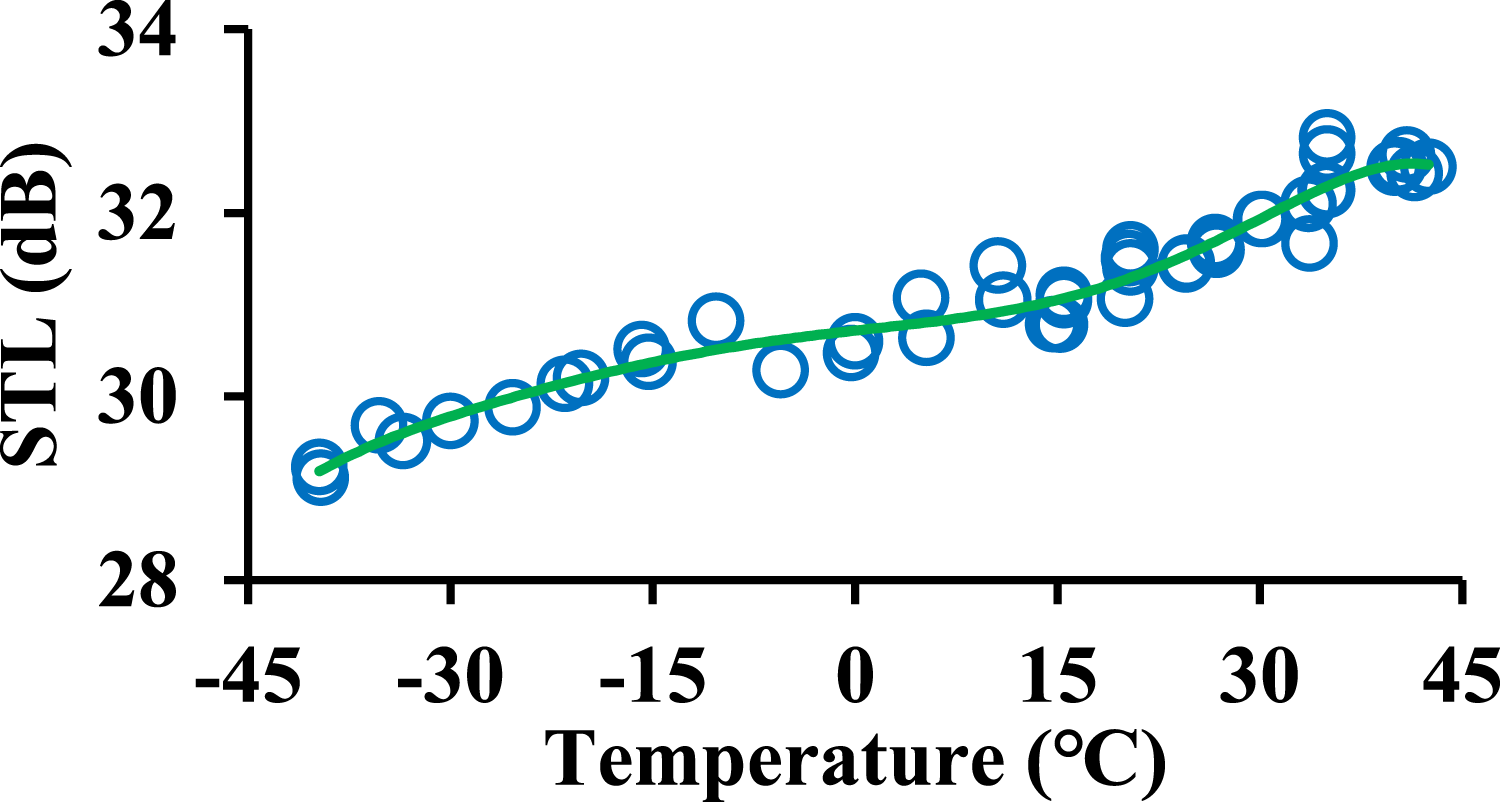
After that, adding data in Figure 19 formed Figure 29. It can be seen that critical frequency Critical frequency variation with temperature.
Considering Poisson’s ratio variation with temperature. Relationship between sound transmission loss and temperature at 8000 Hz. Relationship between sound transmission loss and temperature at 10,000 Hz.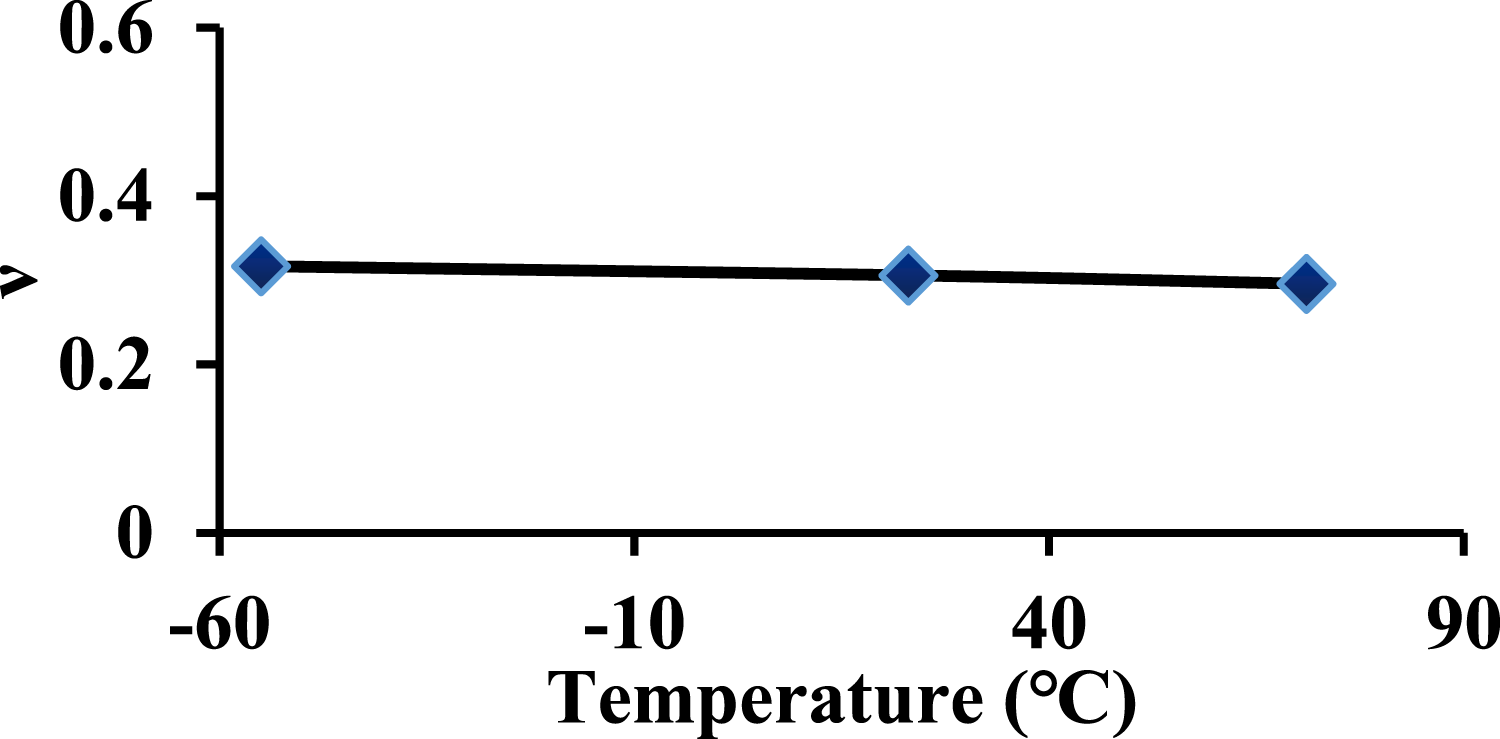
So far, the STL variation mechanism of CFRP structures with temperature has been explained.
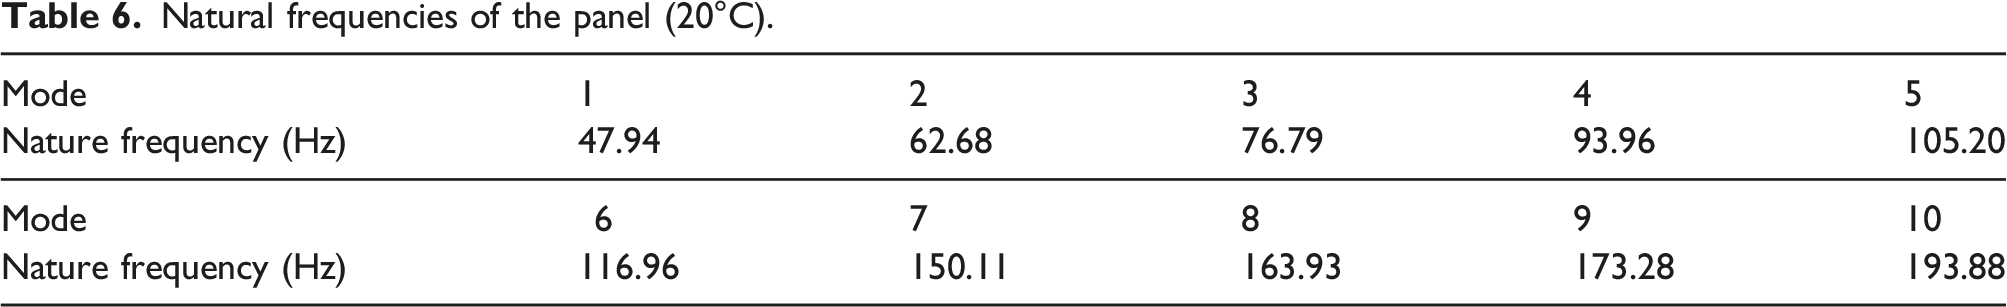
Unfortunately, STL variable characteristics of the panel with temperature in the stiffness-controlled region were not observed. This was caused by the panel’s first-order frequency. To validate the reason, an assumption was made, that the first-order frequency was less than 50 Hz, exceeding the lower frequency bound of STL measurements. Then, a modal test was performed. Figure 33 and Table 6 show the current status of the test and result. The result supports the assumption. We can infer that the panel’s STL in the stiffness-controlled region was decreased with temperature. Because in the stiffness-controlled region, STL increased with stiffness
26
and the panel’s stiffness decreased with temperature according to Figures 21 and 22. Modal test. Natural frequencies of the panel (20°C).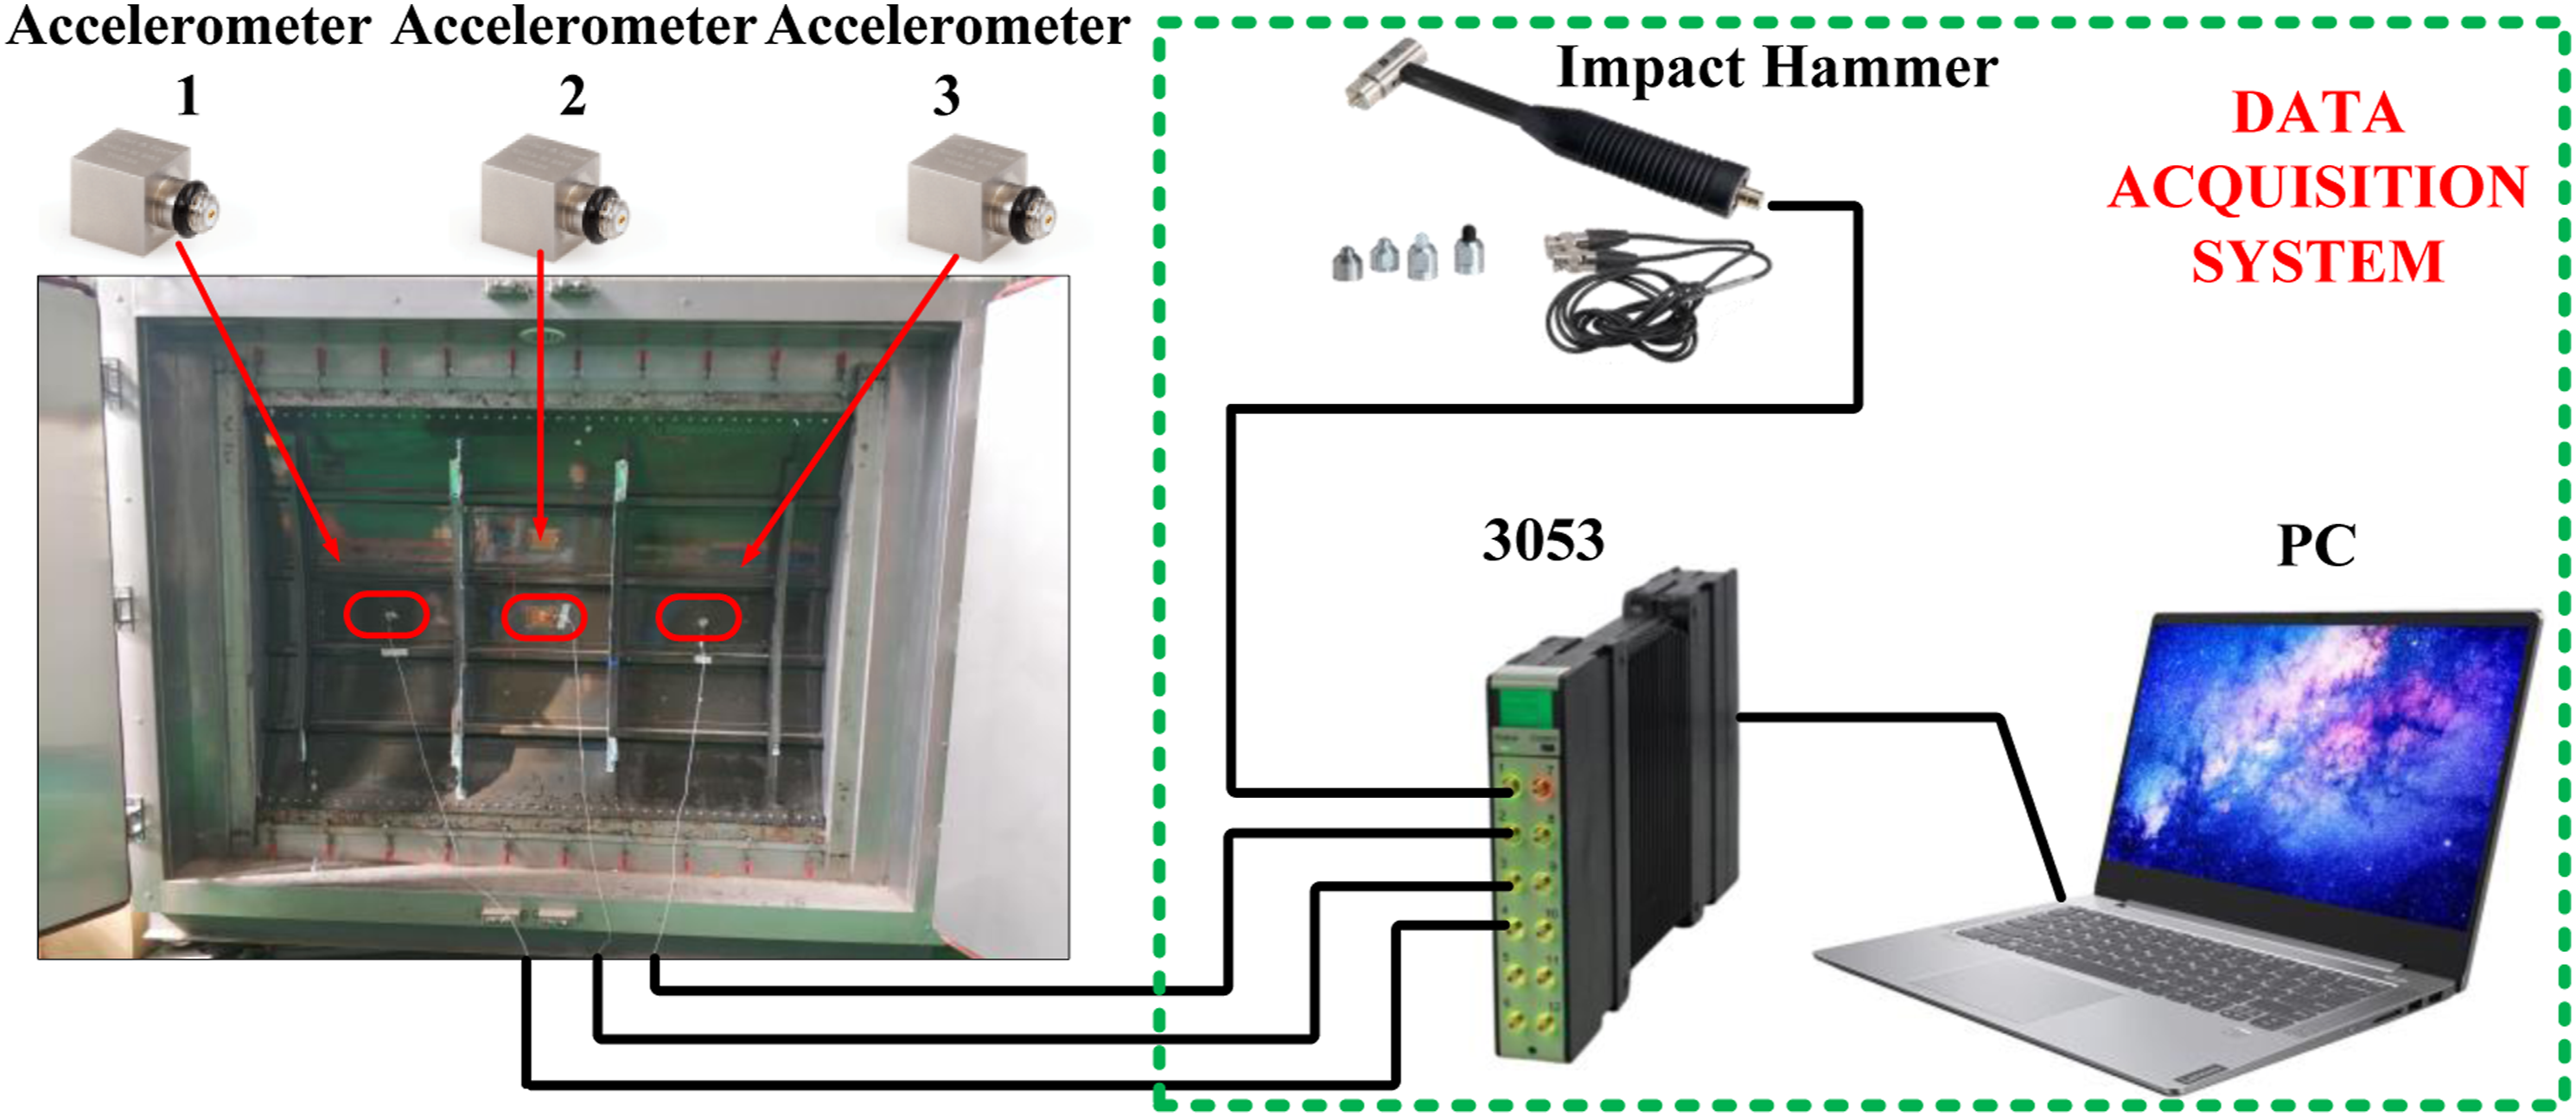
Considering the discussion above, the thermal characteristics of
Conclusion
Herein, a novel STL experimental technique was demonstrated. The effect of temperature on the vibroacoustic performance of composite structures was revealed, and the relationship between temperature, thermomechanical parameters, and STL was elucidated. Accordingly, the following conclusions were obtained: 1. The improved STL experimental technique provided a new way for composite structures’ acoustic analysis and was complementary to theoretical modeling and simulation analysis. 2. Temperature had a significant impact on composite structures’ acoustic behavior. The influence was realized by changing temperature-dependent parameters ( 3. Findings in this paper can be used to guide the acoustic design of composite structures in vehicle manufacturing, shipping industry, environmental protection, etc.
Footnotes
Declaration of conflicting interests
The author(s) declared no potential conflicts of interest with respect to the research, authorship, and/or publication of this article.
Funding
The author(s) received no financial support for the research, authorship, and/or publication of this article.
Data availability
The data used to support the findings of this study are included in the article.
Appendix
STL variations of the panel with the temperature at the other center frequencies are presented as follows:
(a) Relationship between STL and temperature at 50 Hz. (b) Relationship between STL and temperature at 63 Hz. (c) Relationship between STL and temperature at 80 Hz. (d) Relationship between STL and temperature at 100 Hz. (e) Relationship between STL and temperature at 160 Hz. (f) Relationship between STL and temperature at 200 Hz. (g) Relationship between STL and temperature at 250 Hz. (h) Relationship between STL and temperature at 400 Hz. (i) Relationship between STL and temperature at 500 Hz. (j) Relationship between STL and temperature at 630 Hz. (k) Relationship between STL and temperature at 800 Hz. (l) Relationship between STL and temperature at 1000 Hz. (m) Relationship between STL and temperature at 1250 Hz. (n) Relationship between STL and temperature at 1600 Hz (o) Relationship between STL and temperature at 2000 Hz. (p) Relationship between STL and temperature at 5000 Hz.