
Abstract
Low-frequency noise control in substations (converter stations) has received extensive attention. The sound absorption performance of a single material is limited. In the paper, aluminum–polyurethane (Al–PU) foam composite materials were prepared by impregnating method. The microstructure and composition of PU and Al–PU composite foam were characterized by scanning electron microscopy (SEM) and X-ray diffraction (XRD). The results showed that aluminum particles can be well adhered to the skeleton of PU foams, and the sound absorption coefficient of Al–PU foams at 50 Hz–315 Hz was greatly improved. Meanwhile, the resonance structures of Al–PU foams and plexiglass were further constructed. The sound absorption coefficient of different resonance structures was different, and the performance of the resonance structure with 10 mm back cavity and front hole was the best.
Introduction
With the increasing scale of China’s power grid, the construction of ultra-high voltage and ultra-long distance power grids becomes more and more. Electromagnetic energy will produce noise during power grid operation. Thus, the pollution of low-frequency noise has also become more serious, and the control of the low-frequency noise of the substation (converter station) is particularly important. The use of sound-absorbing materials to reduce noise has become one of the important ways to control low-frequency noise. 1 There are many small holes in the internal structure of porous sound-absorbing materials, which are connected with each other and can lead to the material surface. When the sound waves transmit and move in the gaps and pores between holes, the friction and viscous resistance will occur inside the material and between the hole walls. Thus, the sound energy will be attenuated.2,3
Polyurethane (PU) foam was widely used in noise control due to its high sound absorption, light weight, and ease of production. 4 In fact, the existence of flexible polyurethane skeleton and air made polyurethane foam the best medium for damping sound energy. The sound absorption performance of single sound absorbing materials was limited. The flexible PU foams had better sound absorption performance for medium- and high-frequency noise, but the low-frequency sound absorption performance was average. In order to improve its sound absorption performance in the field of low-frequency noise, filling of nano-functional particles can improve its performance. Kim research team 5 used magnesium hydroxide filler to prepare PU composite foams to improve acoustic performance. It not only increased the damping movement of the filler but also increased the number of partial openings. When the porosity was 0.63, the noise reduction coefficient increased by 70% compared with that without filler. Ohadi et al. 6 used PU foams with 30 mm thickness as the substrate and added silica (SiO2) nanoparticles to improve its acoustic damping. The sound absorption properties of PU foams containing 0.05 weight nanoparticles increased greatly (>90%) in the frequency range of 500 Hz–1000 Hz. However, the sound absorption performance in the low-frequency range was little improved. Ancuţa-Elena Tiuc et al. 7 used 0–50 weight percentage (wt%) textile waste to fill rigid PU foams with a thickness of 40 mm. When the filling weight of the textile waste was 40%, the sound absorption coefficient of the composite foams was about 0.1–0.45 in the low-frequency range of 100 Hz–400 Hz.
In addition, Guan et al. 8 conducted a series of experiments to evaluate the noise damping performance of PU foam, ceramic fiber, concrete, and silica gel with different density, thickness, or porous structure. This work clarified how to optimize the acoustic damping performance of porous foams. On the basis of that, in order to further improve the sound absorption performance, the porous material-resonant structure can be studied.9,10 Bucciarelli and Meo 11 proposed a sub-wavelength acoustic resonator unit, which included an elastic silicone plate with a thickness of 1.2 mm and a closed air cavity with a depth of 22 mm. The results showed that it was possible to obtain two high absorption peaks and a broadened absorption peak above 80% at 268 Hz and 369 Hz. Yang et al. 12 studied the influence of the backing cavity on the sound absorption performance of the micro-perforated plate sound absorber, and devoted themselves to understanding the coupling of different types of back-cavity modes with the micro-perforated plate. Abdel-Hakim et al. 13 studied the effect of a 25 mm air cavity on the sound absorption coefficient of styrene butadiene rubber (SBR)—PU foam layered structure. The existence of the air cavity behind the layered structure improved the sound absorption in the range (200 Hz–500 Hz). Arjunan et al.14,15 found that the metal foam combination structure with cavity thickness can improve the sound absorption performance, and increasing the air chamber helped to expand the frequency range of the absorption peak. Zhao et al.8,16 proposed a modified design of a Helmholtz resonator by implementing a rigid baffle in its cavity, and improved the acoustic impedance and sound absorption performances of porous foams with additives in Helmholtz.
In this paper, PU foam was filled with aluminum to increase the viscous resistance and frictional effect of acoustic waves on the inner wall of the materials, resulting in the attenuation of sound energy. The resonance sound-absorbing structures of Al–PU foam combining with plexiglass were carried out with a certain cavity.
Experiment
Raw materials
In this research, the PU foams were soft polyurethane with 20 mm thickness, and the density and porosity were 14.08 kg.m−3 and 0.892, respectively. Aluminum metallic paint was composed of aluminum powder, silicone resin, heat-resistant pigment, and curing agent. The outer diameter of plexiglass pipe with 5 mm wall thickness was 100 mm. The diameter of plexiglass circular plate was 100 mm and the thickness was 5 mm. In addition, epoxy resin and curing agent were used as an adhesive.
Sample preparation
The resonance absorbing structure combinations of Al–PU foam and plexiglass.
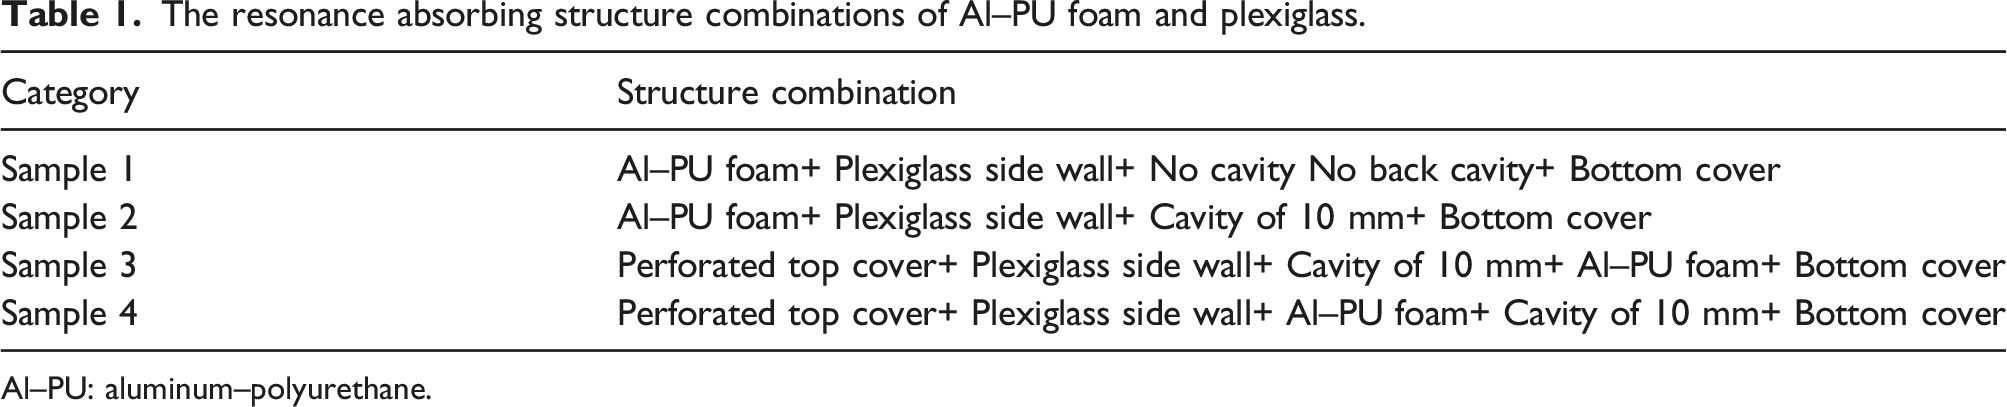
Al–PU: aluminum–polyurethane.
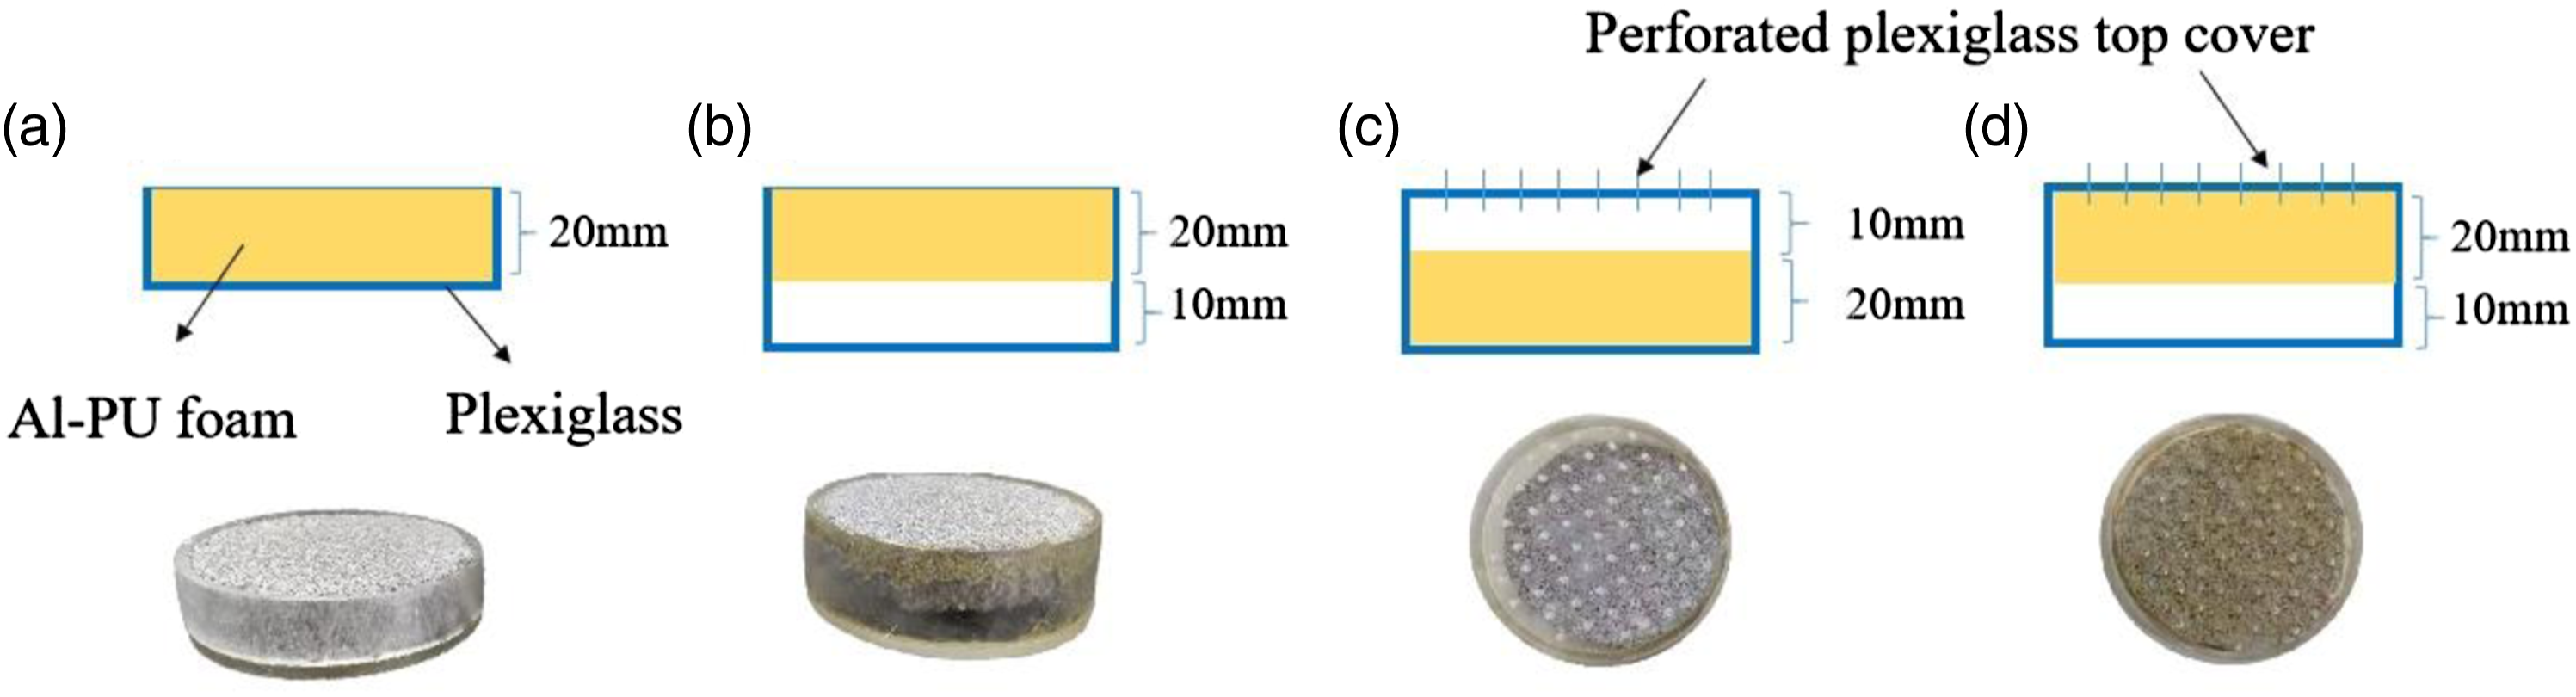
Schematic diagram and real figure of absorption structure of four samples: (a) sample 1, (b) sample 2, (c) sample 3, and (d) sample 4
Test instruments
X-ray diffraction (XRD) patterns were recorded with a Rigaku D/max 2250 V diffractometer operating with Cu Kα radiation. The operation voltage and current were set as 40 kV and 100 mA, respectively. Scanning electron microscope (FESEM) images were acquired using S-4800 operated at an acceleration voltage of 5 kV. Samples were taken from PU and Al–PU composite foam structures with the size for 1 mm × 1 mm × 1 mm. The surface of the sample should be sprayed with gold to enhance the conductivity and obtain a clear image. Sound absorption coefficient was explored by 4206 impedance tube. The tested frequency range was 50 Hz–1250 Hz. In addition, the test and analysis software was commercial software and came from the manufacturer of the impedance tube.
Test setup
The principle of measuring sound absorption performance with impedance tube is based on the transfer function method. The large measuring tube with low frequency is used, and the measurable frequency range is 50 Hz–1600 Hz. The adopted standard is the international standard ISO 10534-2: 1998.
The sound source is emitted by the loudspeaker, and the broadband steady-state random signal is decomposed into incident wave and reflected wave, which are measured by two microphones. The spacing between the two microphones is s, and the distance from the first microphone to the reference plane (the surface of measured material) is x
l
. The sound pressures of incident wave 

The sound pressures at the two microphone positions are shown in formulas (1-3) and (1-4)

The transfer functions of incident waves 

The transfer function of total sound field 
The reflection coefficient (
The sound absorption coefficient (
Results and discussion
Structural analysis of Al–PU composite foam
Figure 2 was the XRD diagram of PU and Al–PU composite foams. It can be seen from the XRD diagram that PU foam had a diffraction peak at about 9.2° and 20°. All the diffraction peaks of Al–PU composite foam can be indexed as amorphous PU and Al. Except for the diffraction peaks of PU foam, the other diffraction peaks corresponded to the (110), (200), (220), and (311) crystal planes of Al (JCPDS No.04-0787). No other impurities peaks were observed, which indicated that the samples were only composed of PU and Al2O3. XRD diagrams of PU and Al–PU composite foams. XRD: X-ray diffraction; Al–PU: aluminum–polyurethane; PU: Polyurethane.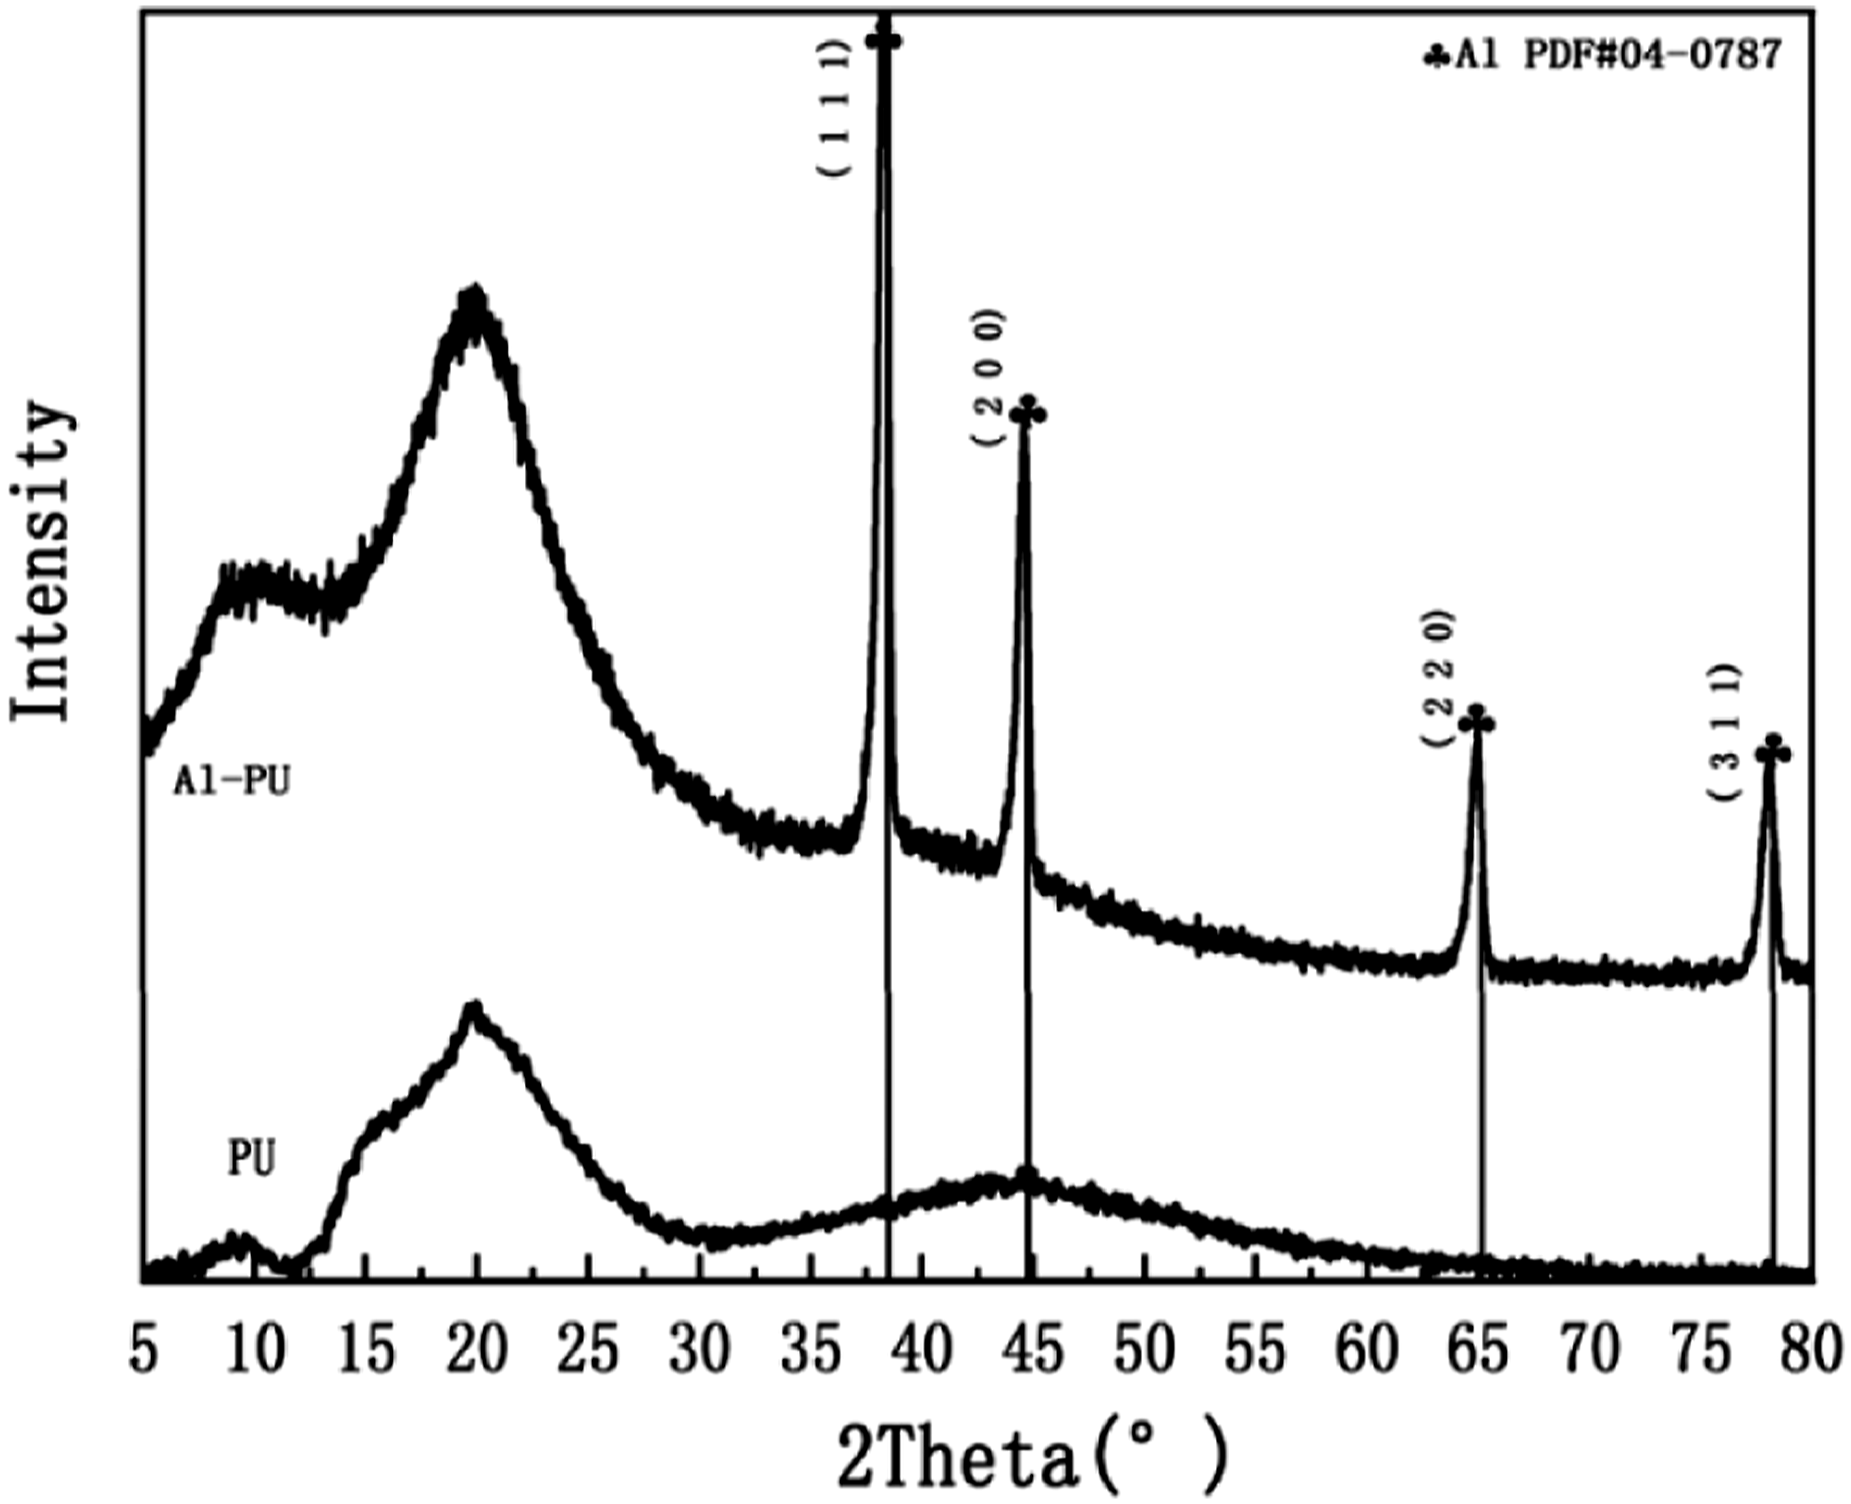
Figure 3 was the photo and SEM images of PU and Al–PU composite foams. From Figure 3(a) and (d), the photo of Al–PU composite foam was obviously metallic. When SEM images were enlarged by 50 times, it can be observed that the structure of two samples was similar. The foam materials were composed of single holes, and single hole can be seen as a regular fourteen face body (consisting of six quadrilateral and eight regular hexagons). The edge length of each single hole had not changed much, which was about 300 μm. The density of Al–PU composite foam was higher than that of PU foam. Further magnifying the scanning magnification (×5000), it can be seen that the Al–PU composite foam had a higher density and smoother skeleton, indicating that the filled aluminum can adhere well to the foam skeleton. The photographs of PU and Al–PU composite foams. Al–PU: aluminum–polyurethane; PU: Polyurethane.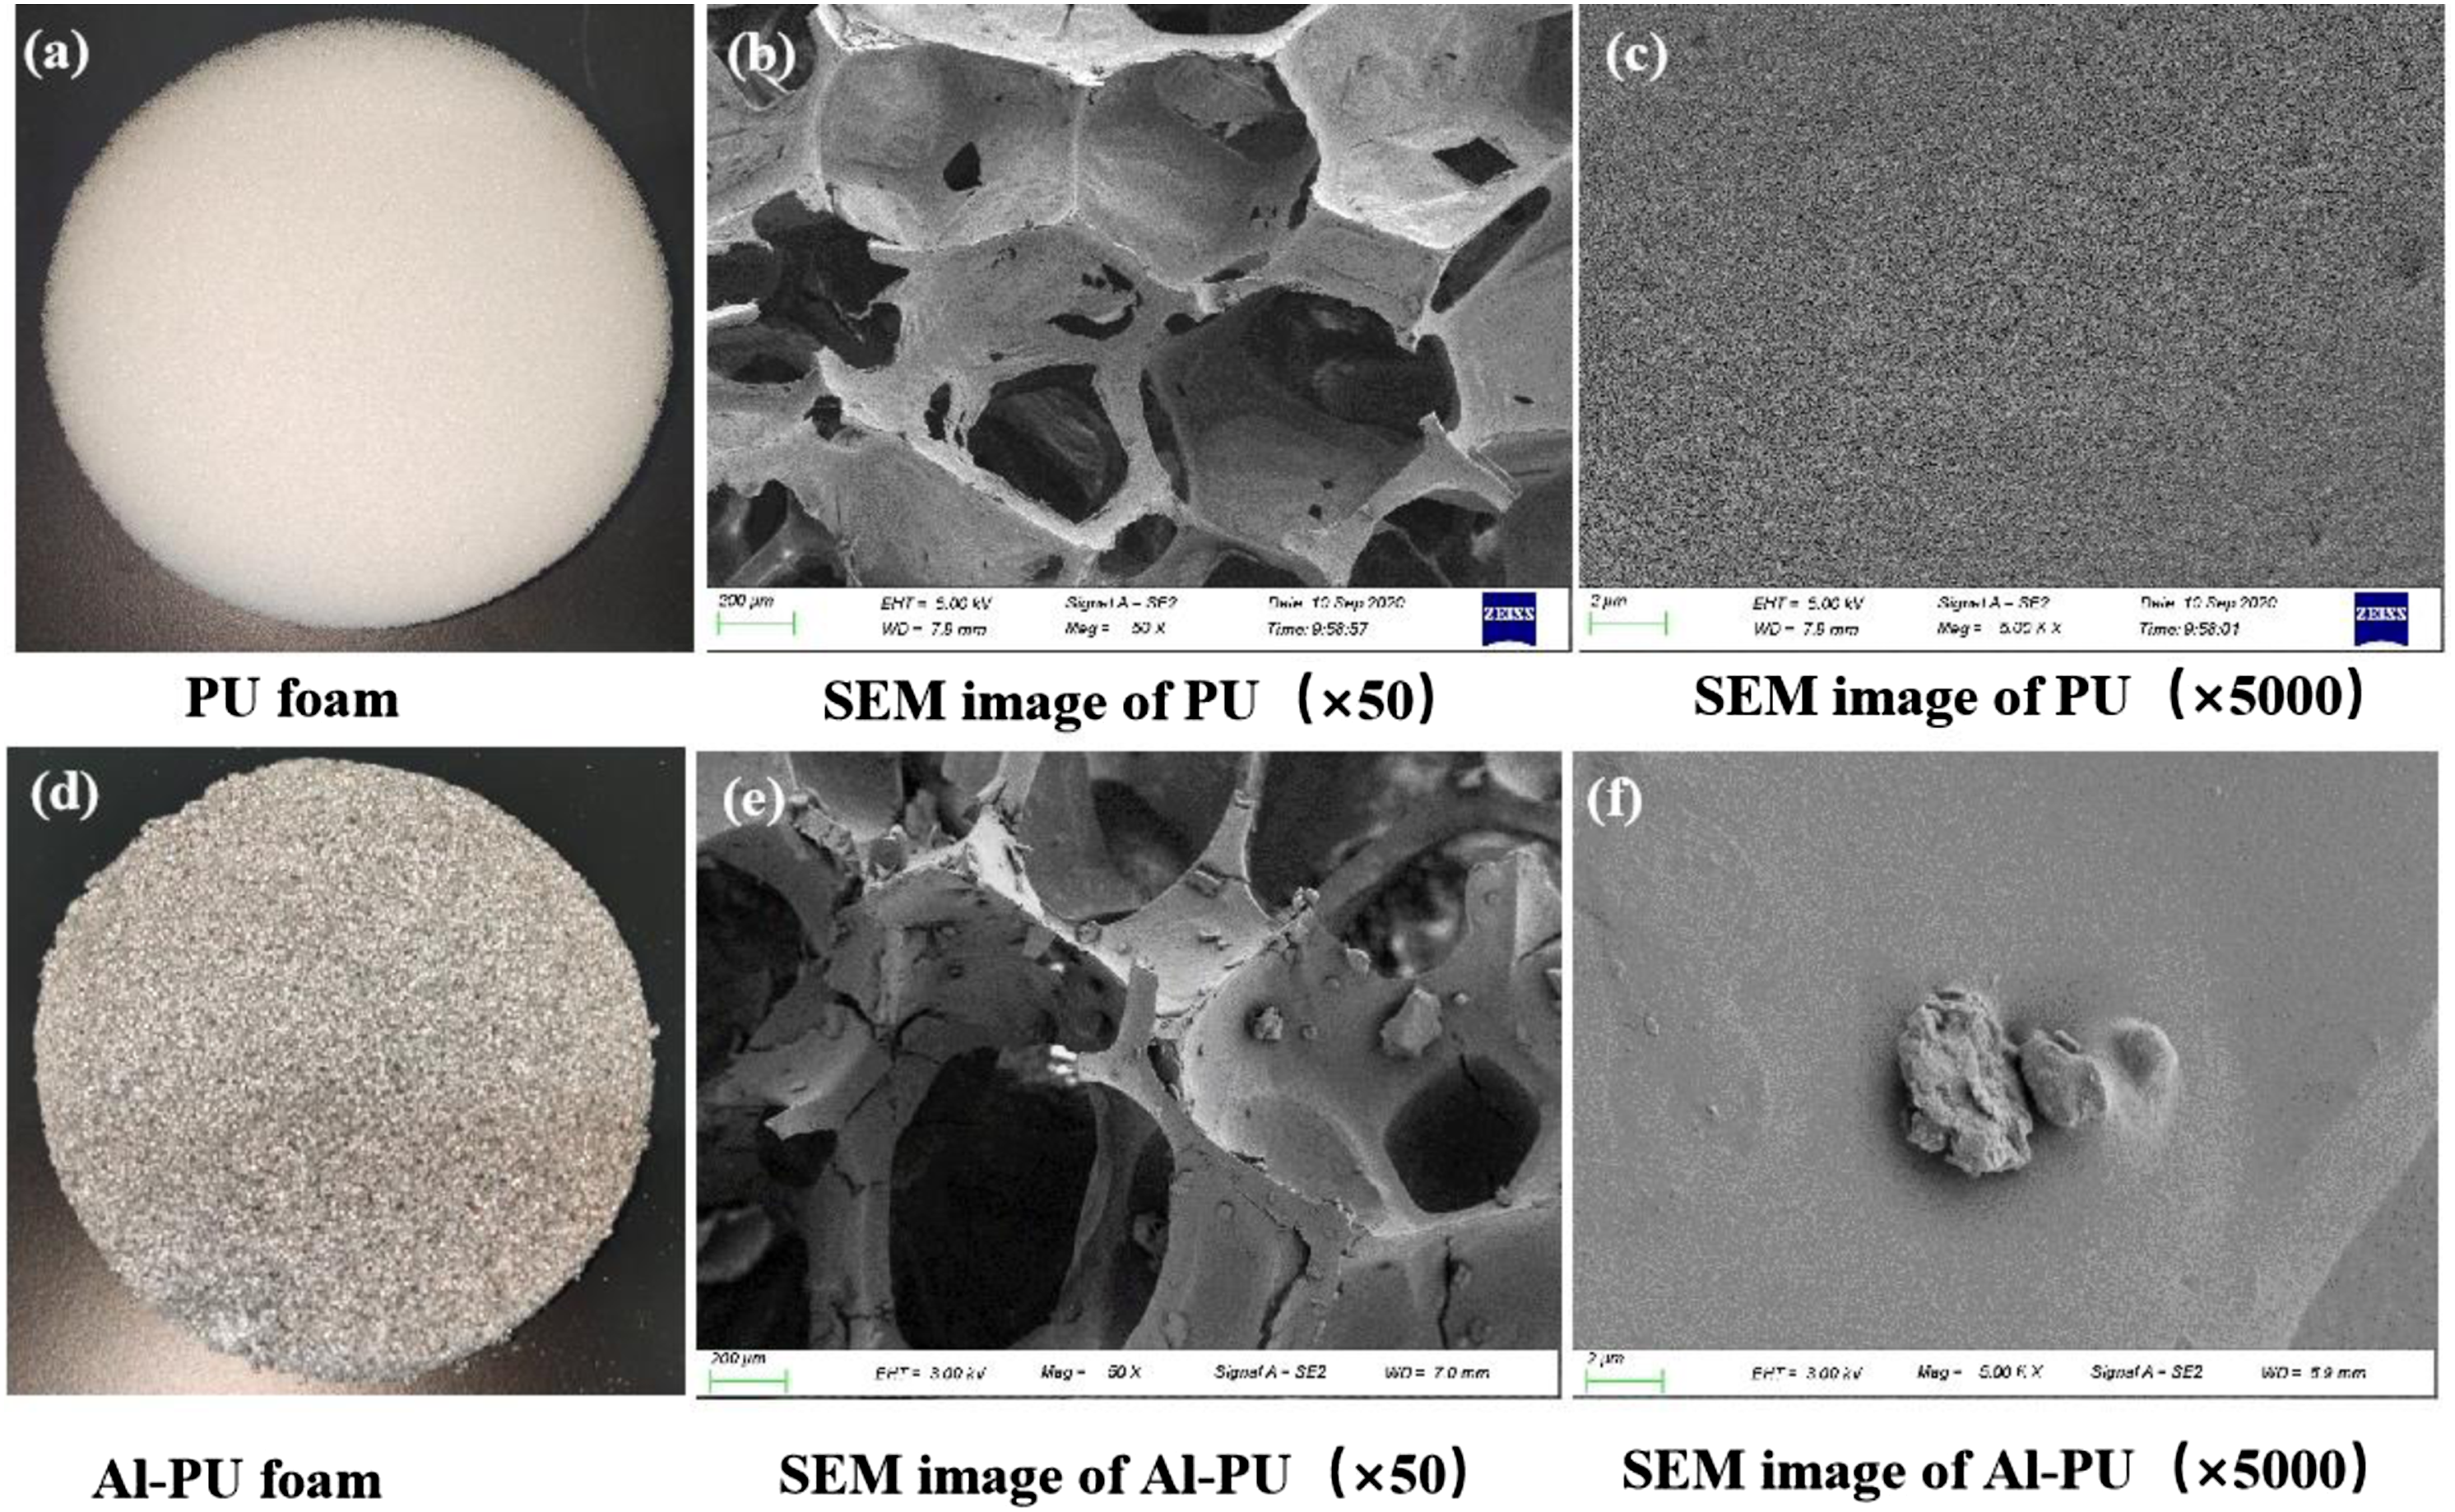
Sound absorption properties of Al–PU composite foam
Figure 4 was a diagram of the sound absorption coefficient of PU foam and Al–PU composite foam. From the diagram, it can be found that the sound absorption coefficient of Al–PU composite foam was larger than that of PU foam in the low-frequency range (50 Hz–315 Hz). In particular, when the frequency was at 50 Hz, the sound absorption coefficient of PU foam was only 0.06, while Al–PU composite foam can reach to 0.17. In the frequency range of 315 Hz–1250 Hz, the sound absorption coefficient of two foams shows an upward trend with frequency change. The overall change trend was the similar. In the range of 315 Hz–850 Hz, the sound absorption coefficient of PU foam and Al–PU composite foams was coincident. The sound absorption coefficient of Al–PU composite foam was better than that of PU foam after 850 Hz. It can be seen that the addition of filler Al can significantly improve the sound absorption performance of PU foam in the low frequency field. The sound absorption coefficient of PU foam and Al–PU composite foam. Al–PU: aluminum–polyurethane; PU: Polyurethane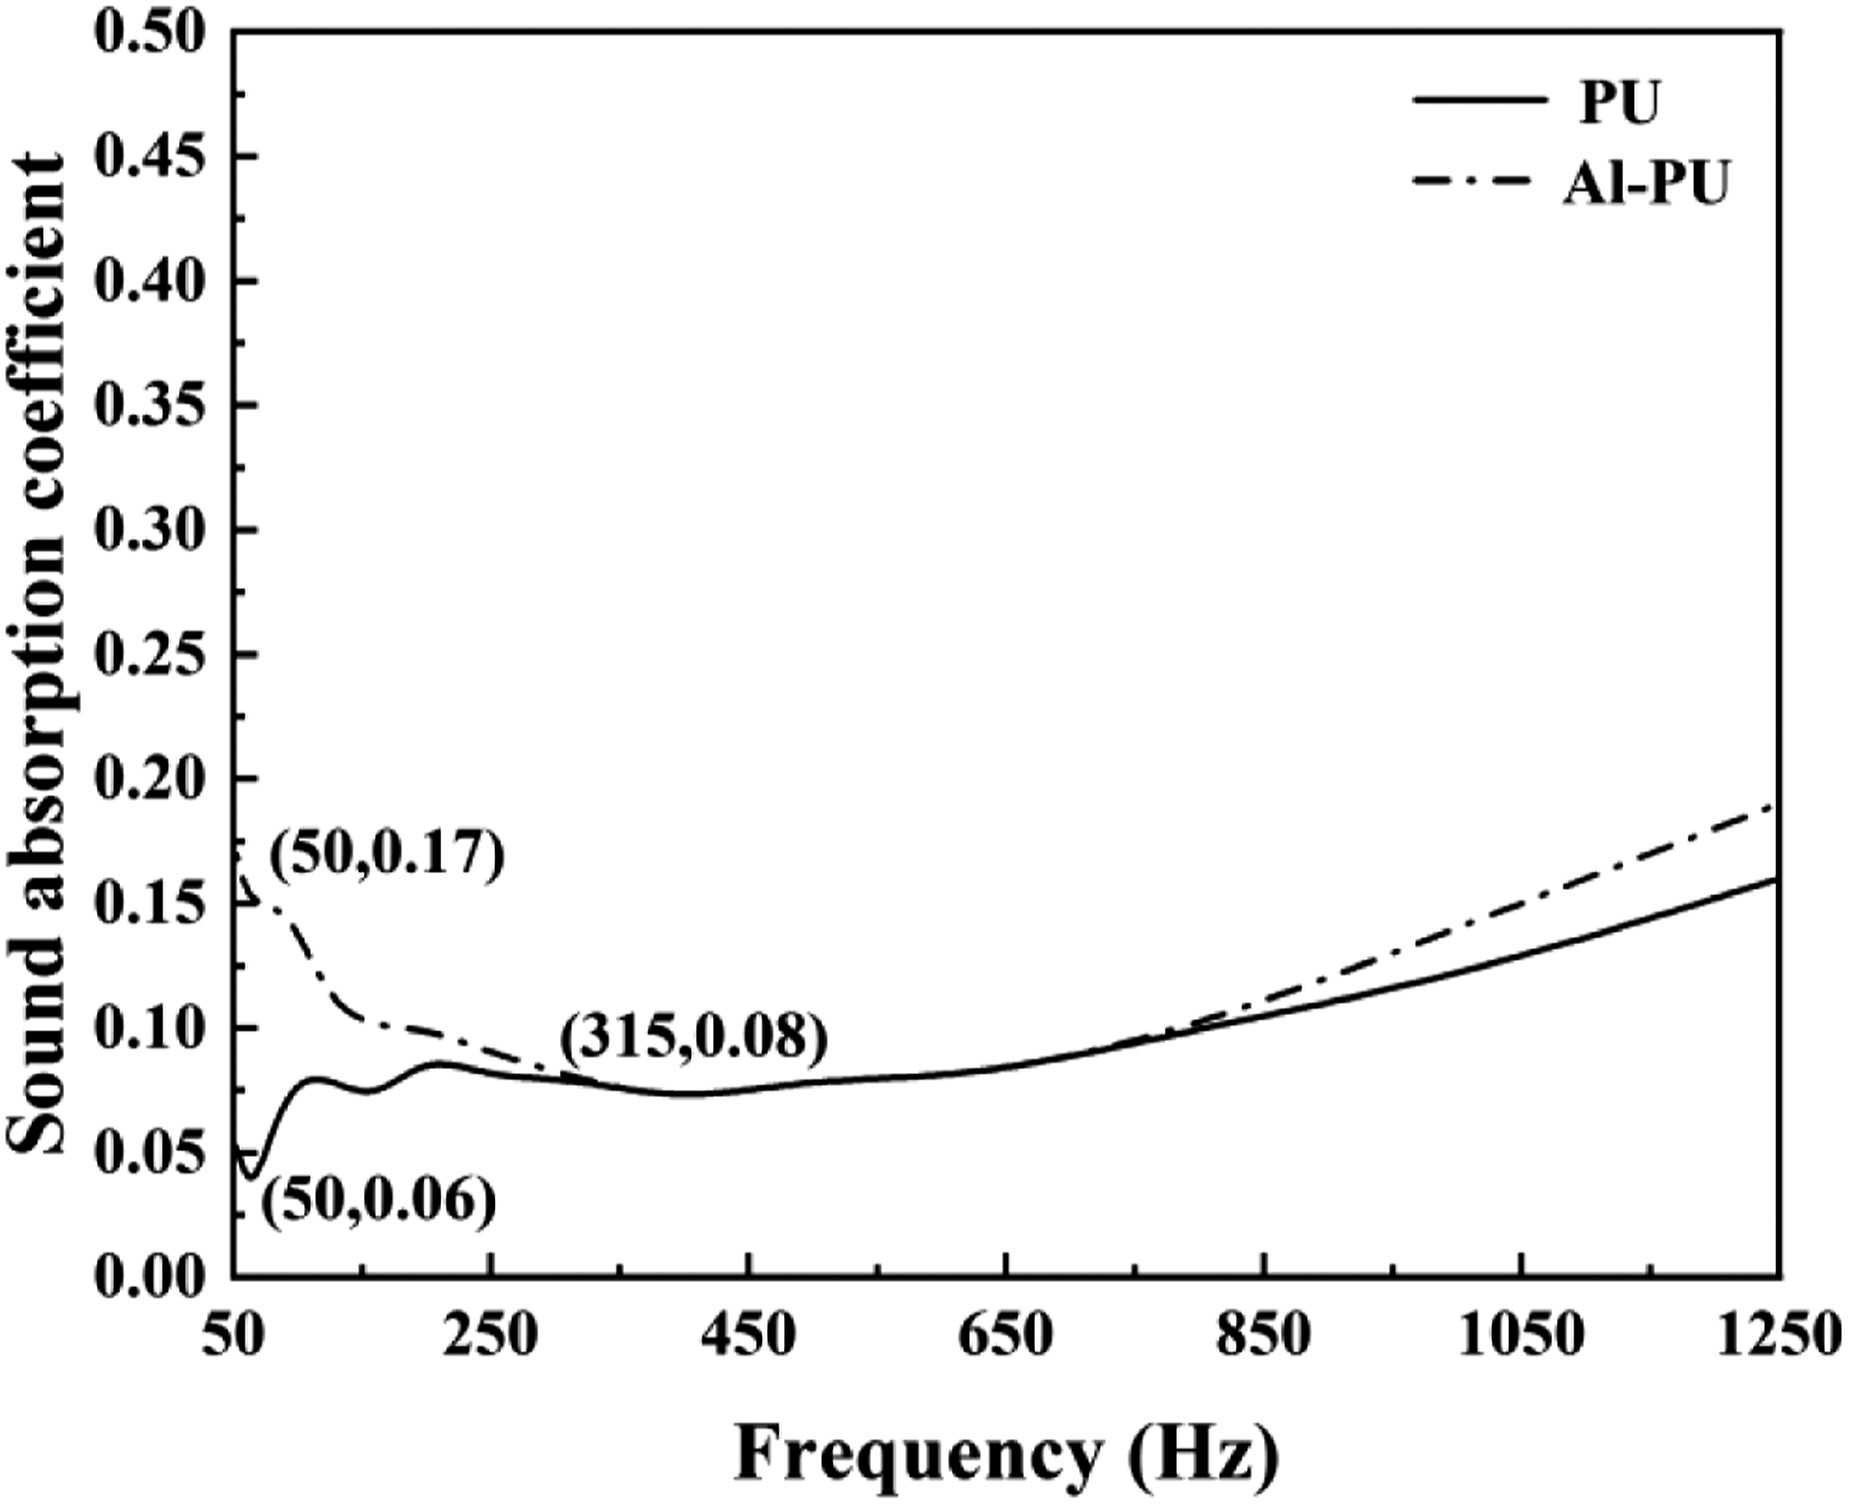
Sound absorption performance of resonance structure
Figure 5 was the sound absorption diagram of Al–PU, sample 1 and sample 2. It can be seen that the change trend of the sound absorption performance of the three samples was the same. In the frequency range of 50 Hz–1250 Hz, the sound absorption coefficient curves of Al–PU composite foam and sample 1 almost coincide. The sample 1 made of plexiglass and foam did not form a resonance structure. Meanwhile, compared with the original 20 mm thickness of PU-Al foam, the sound absorption performance of sample 1 with an increase of 5 mm thickness the plexiglass plate had basically not changed. It can be thought that the sound absorption performance of plexiglass itself was poor. Compared with the Al–PU composite foam and sample 1, the sound absorption performance of sample 2 was improved. At 1250 Hz, the sound absorption coefficient of sample 2 was 0.43, which was twice that of sample 1 and Al–PU. The result showed that when the 10 mm cavity was placed between Al–PU composite foam and bottom cover, a resonance structure can be formed to enhance the sound absorption effect. Sound absorption coefficient of Al–PU composite foam, sample 1, and sample 2.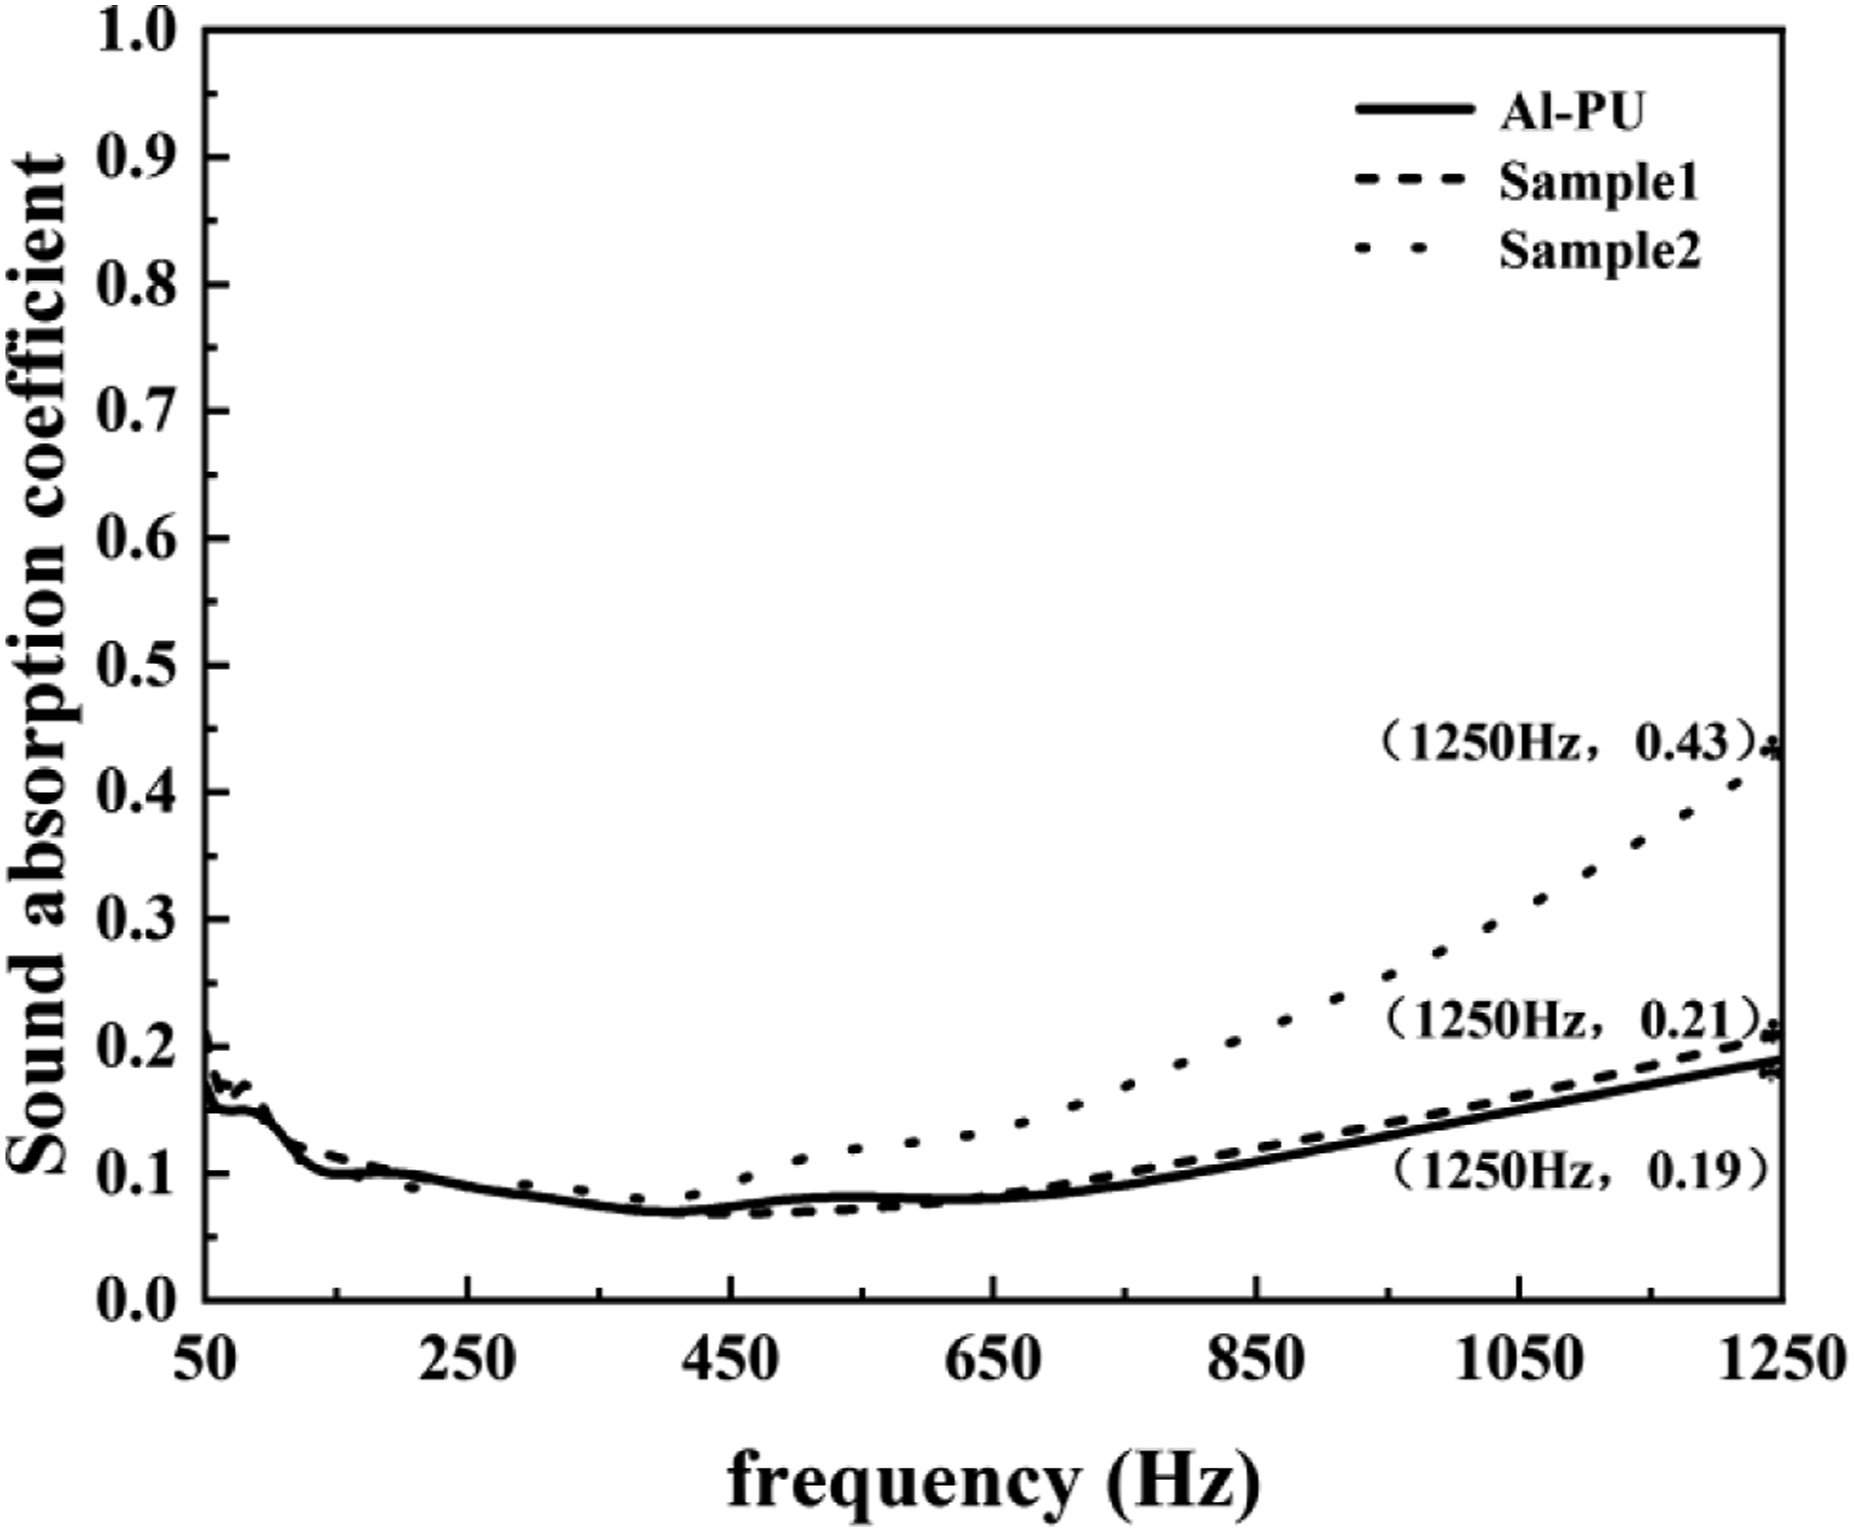
Figure 6 was the sound absorption coefficient curve measured on the front and negative sides of sample 3 and sample 4. The front side referred to the sound source entering from one side of the perforated top cover, and the negative side referred to the sound source entering from one side of bottom cover. For sample 4, whether the sound source enters from the front side or the negative side, the sound absorption coefficient was not much different. Compared with the Al–PU composite foam, the sound absorption effect is not greatly improved, and the difference was that there was a small peak at about 1000 Hz. For sample 3, when the sound source entered from the negative side, it reached a peak value for 0.42 at 186 Hz. Compared with other samples, the sound absorption values in other ranges were reduced, which indicated these samples were suitable for noise control in the range of 150 Hz–250 Hz. When the sound source entered from the front, the peak value can be reached to 0.98 at 800 Hz. The results showed that the overall sound absorption effect of sample 3 was the best in the low-frequency range. The sound absorption coefficient was not low at low frequency. In addition, it reached the highest peak faster and the peak value was very high. Therefore, the overall sound absorption performance of the resonance structure with a 10 mm cavity and holes on the front was the best. Abdel Hakim et al.
13
proposed the combined structure of SBR—PU with cavity. The maximum sound absorption coefficient was increased to 0.25–0.85 and 0.84–0.98 in the 250 Hz–500 Hz and 630 Hz–1600 Hz, respectively. However, the thickness of the PU foam and air chamber was 50 mm and 25 mm, respectively. The thickness of the structure was too thick for engineering application. In this paper, the thickness of Al–PU foam and air chamber was 20 mm and 10 mm, which was more conducive to the practical application of noise elimination in substations. At the frequency of 800 Hz, the maximum sound absorption coefficient was 0.98, which can also achieve better sound absorption effect in a lower frequency range. The sound absorption coefficient curve measured on the front and negative sides of sample 3 and sample 4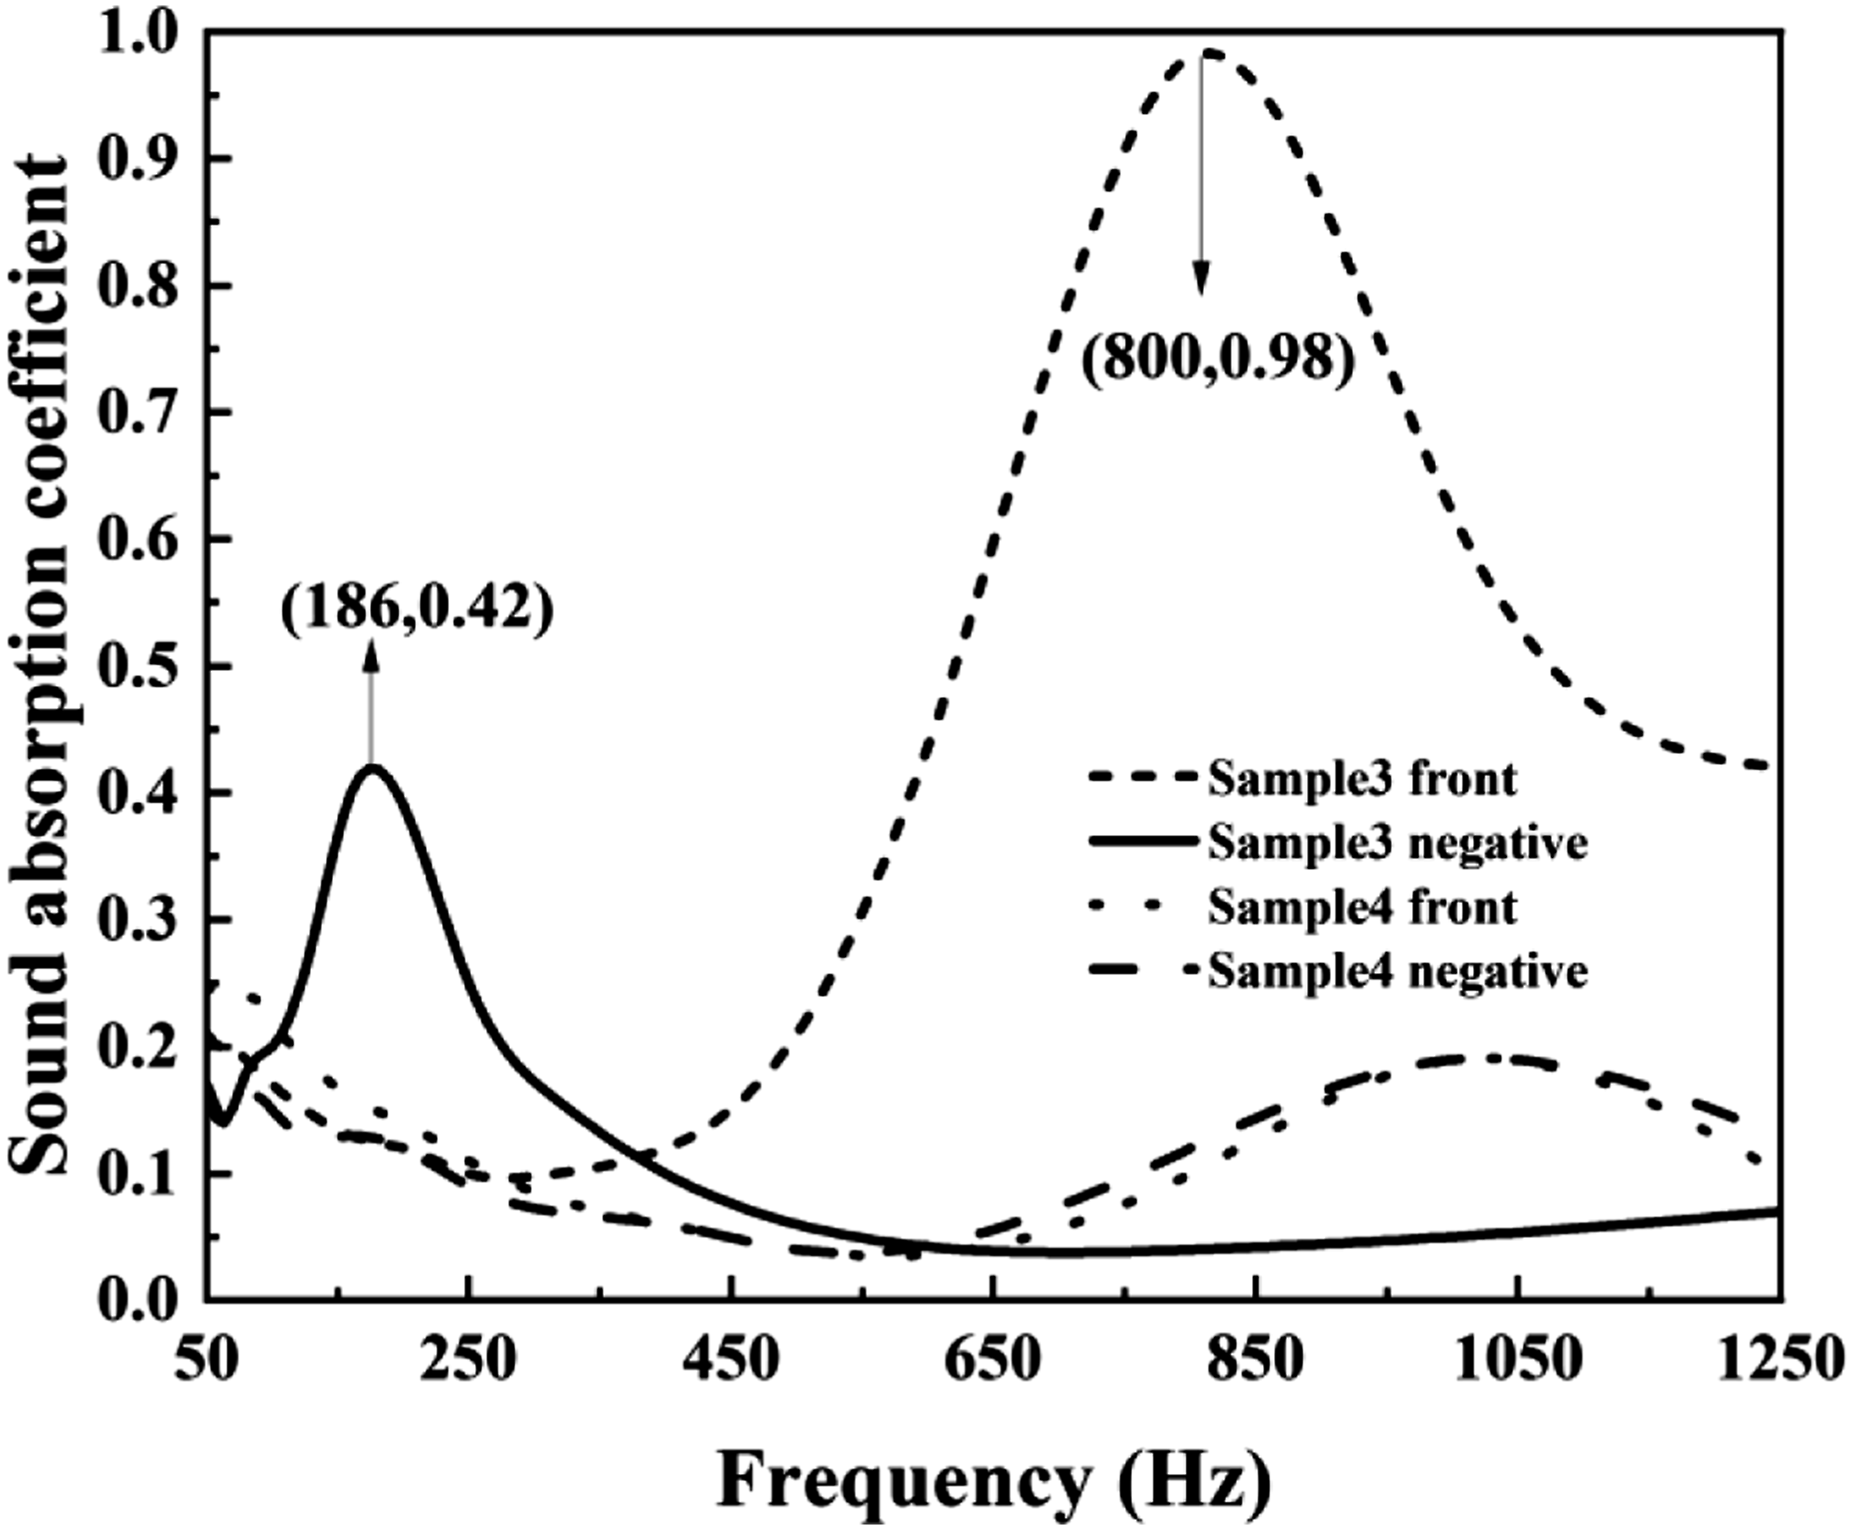
Conclusions and prospect
In this paper, PU foam was used as the main body and Al–PU composite foam was formed through impregnation method. The composite did not change the porous structure of PU body. The single hole can be seen as a regular 14 face body (consisting of six quadrilaterals and eight regular hexagons) with a length of 300 μm, and the filler Al can be attached to the foam skeleton. Meantime, through the sound absorption test of Al–PU composite foam, it was found that the sound absorption performance in the low-frequency range (50 Hz–315 Hz) was significantly improved than that of PU foam. Al–PU composite foam and plexiglass were further constructed into different resonance structures. The results showed that the overall sound absorption performance of resonance structure with a 10 mm cavity and holes on the front was the best. When the sound source entered from the front side, a peak value of sound absorption coefficient at 800 Hz was 0.98. When the sound source entered from the negative side, it reached to a peak value for 0.42 at 186 Hz.
This research can be applied to the field of low-frequency noise such as substation. The resonance structure of Al–PU foam composite and plexiglass described in this paper can play a better role, especially the composite structure of sample 3. Meantime, the adhesion between PU foam and plexiglass is a problem worthy of further discussion.
Footnotes
Declaration of conflicting interests
The author(s) declared no potential conflicts of interest with respect to the research, authorship, and/or publication of this article.
Funding
The author(s) disclosed receipt of the following financial support for the research, authorship, and/or publication of this article: This work was supported by the financial supports from Open Fund of State Key Laboratory of Power Grid Environmental Protection (GYW51202001548).
Data availability statement
All data in the study can be obtained from the corresponding author (Binxia Yuan and Lan Cao).