Abstract
This paper investigates the efficiency of three surrogate model-based dynamic finite element model updating methods, the response surface, the support vector regression, and the radial basis function neural network, using the engineering background of the Tsing Ma Bridge tower. The influences of two different sampling methods (central composite design sampling and Box–Behnken design sampling) on the model updating results are also assessed. It was deduced that the impact of the surrogate model type on the updating results is not significant. More precisely, the models updated using the response surface method and the support vector regression method are similar in terms of reproducing the dynamic characteristics of the physical truth. However, the effects of the employed sampling method on the model updating results are significant as the model updating quality using the central composite design sampling method is higher than that using the Box–Behnken design sampling method in some considered cases.
Keywords
Introduction
Finite element (FE) models are extensively applied in researches and engineering designs in the field of civil engineering. However, the reliability of the results obtained using the FE models largely depends on the fidelity of the established FE models. FE model updating was initially proposed in the fields of the aviation industry and the mechanical engineering circle. It has been then employed to guarantee the accuracy of the FE models in several other fields.1–4 Normally, structural health monitoring (SHM)–oriented civil FE models are meticulously developed to facilitate local damage detections using methods like the minimally invasive modal analysis-based damage detection. 5 However, updating these meticulous FE models leads to a performance problem. That is, when all of the geometric details are embraced, the models grow in complexity, and FE model updating becomes infeasible utilizing the traditional FE model–based methods owing to the high computational cost. Fortunately, the FE model can be replaced by some simple surrogate models in this situation. Currently, three surrogate model–based optimization methods have been applied in the field of civil FE model updating including the response surface (RS) method, the support vector regression (SVR) method, and the radial basis function neural network (RBFNN) method. The efficiency of the RS method have been demonstrated in bridge model updating by Deng and Cai, 6 Ren et al., 7 Ren and Chen, 8 and Zhou et al. 9 According to the literatures,10–13 the SVR method is efficient for FE model updating and system identifications of large civil structures. The RBFNN method is also efficient in the parameter identifications of the bridge bearings. 14
In nature, the RS method is a traditional optimization approach based on nonlinear fitting using quadratic polynomials. However, the SVR method is a machine learning method based on statistical learning theory, and the RBFNN method employs artificial intelligence models. Teng et al. 10 stated that the advantages of the SVR method are the fast convergence speed, the good prediction ability under a small number of samples, and the adaptability to the nonlinear model of complex relationships with higher precision. The RBFNN method has the advantages of the convenient network training, the ability to avoid local minimum, and the capacity to precisely fit any function, provided that neurons are sufficient in the radial basic level. 15 Therefore, the SVR method and the RBFNN method should be technically more advanced than the RS method. However, after an extensive literature review, it was found that the three surrogate model methods were not compared in any study using a same model updating case to directly show their advantages and disadvantages. Therefore, this work of significant theoretical importance is embraced by the present study.
Besides the employed surrogate model, the experimental design technique used for sampling also influences the surrogate model–based model updating results. 1 Deng and Cai 6 and Zhou et al. 9 used the central composite design (CCD) method, while Ren et al. 7 and Teng et al. 10 used the uniform design method. Which experimental design method can provide sufficient information required for establishing the accurate surrogate model for effective model updating with the minimum sampling workload? This important question has not been well answered yet by the engineering community. This paper also tackles the efficiency of several experimental design techniques used for sampling.
Based on a model updating case study of the Tsing Ma Bridge tower, this paper studies the influence of the used surrogate model and the employed sampling technique on the updating results. To the best of our knowledge, such studies rarely exist in the literature. However, their theoretical and practical significances are both noticeable.
Theoretical formulations
RS method
In the RS method, the experimental design technique is integrated with mathematical statistics techniques. The four main steps of the RS method are as follows: (1) Samples are collected based on a widely used experimental design method, including CCD, Box–Behnken design (BBD), orthogonal design, and D-optima design. These experimental design methods ensure the RS models’ accuracy with limited sampling. (2) Parameter screening is conducted based on variance analysis. The main concept of variance analysis consists in dividing the total square error of the sampling characteristics into two parts. Significant parameters can be distinguished by a hypothesis test (the F-test). For parameter A, we assume that

For a given significance level α, if F
A
≥ F1−α(f
A,
f
e
) or the probability (F > F
A
) is small, the parameter is significant. Based on the results of the F-test, significant parameters are selected and the function forms of the RSs are modified correspondingly. (3) RS are fitted employing quadratic polynomials as the response function. Assuming a response of the structure as y and the significant uncertain parameters as x
i
,i = 1, 2,..., k, the form of the response function is given by (4) Parameter optimization is conducted. The optimization can be summarized as


SVR method
The SVR method is a novel machine learning method based on the statistical learning theory. Assuming that

According to the SVR method, in multi-output cases, the structural risk minimization is equal to the following constrained optimization problem


When
According to Teng et al., 10 the main steps of model updating based on the SVR method are as follows: (1) Constructing the samples: More precisely, the samples of the design parameters can be determined based on any experimental design technique, while the responses of the structure can be obtained by FE analysis for each sample. (2) Training the SVR model: The SVR model is trained with the responses and the corresponding design parameters, considered as the inputs and the outputs, respectively. (3) Updating the design parameters: That is, the measured responses are the input to the trained SVR model, while the outputs are the target design parameters.
RBFNN method
An RBFNN comprises three layers: the input layer, the hidden layer, and the output layer. In the hidden layer, the radial basis function is used as the activation function, while in the output layer, the linear function is used as the activation function. Assuming that the input vector is

Assuming that

Training the RBFNN is fundamental to determine the weight vectors as well as the deviations in the radial basic layer and the linear layer using the sample data.
Three steps should be performed to use the RBFNN for precisely fitting a function: (1) Constructing the samples. (2) Training the RBFNN: More precisely, the RBFNN is trained with the responses and the corresponding design parameters considered as the inputs and outputs, respectively. In this paper, the used training is based on the practice that the number of neurons is automatically and gradually increased, in order to reduce the deviation of the network from the targeted function until achieving the targeted model error. (3) Updating the design parameters: That is, the measured responses are used as input to the trained RBFNN, while the outputs are the target design parameters.
Experimental design techniques
CCD
CCD is extensively used to design several experiments in different application domains. It is highly appropriate for fitting a quadratic surface. CCD comprises a two-level factorial design with a 2n number of variants or factorials points, 2n as axial points, and n0 as the center point. A variance in the optimal design for the first-order model is symbolized by factorial points, while the existence of curvature is denoted by the center points. Axial points are added in the system when the curvature exists for the competent evaluation of the pure quadratic model.
BBD
BBD is a popular second-order rotatable design providing three levels (−1, 0, 1) for each factor. It consists of a particular subset of 3k factorial design. It provides good results near the center of the design space and worst results at the corner of the cube.
Engineering backgrounds
Tsing Ma Suspension Bridge has a free main span of 1377 m between two towers, namely, the Ma Wan tower and the Tsing Yi tower.
16
The two towers of height 206 m, measured from the base to tower saddle, consist of two reinforced concrete legs linked by four reinforced concrete cross-beams and supported by massive reinforced concrete slabs found on competent rock (Figure 1). The two towers share almost identical geometric and structural features. The configuration of the Tsing Ma Bridge tower
16
(unit: m).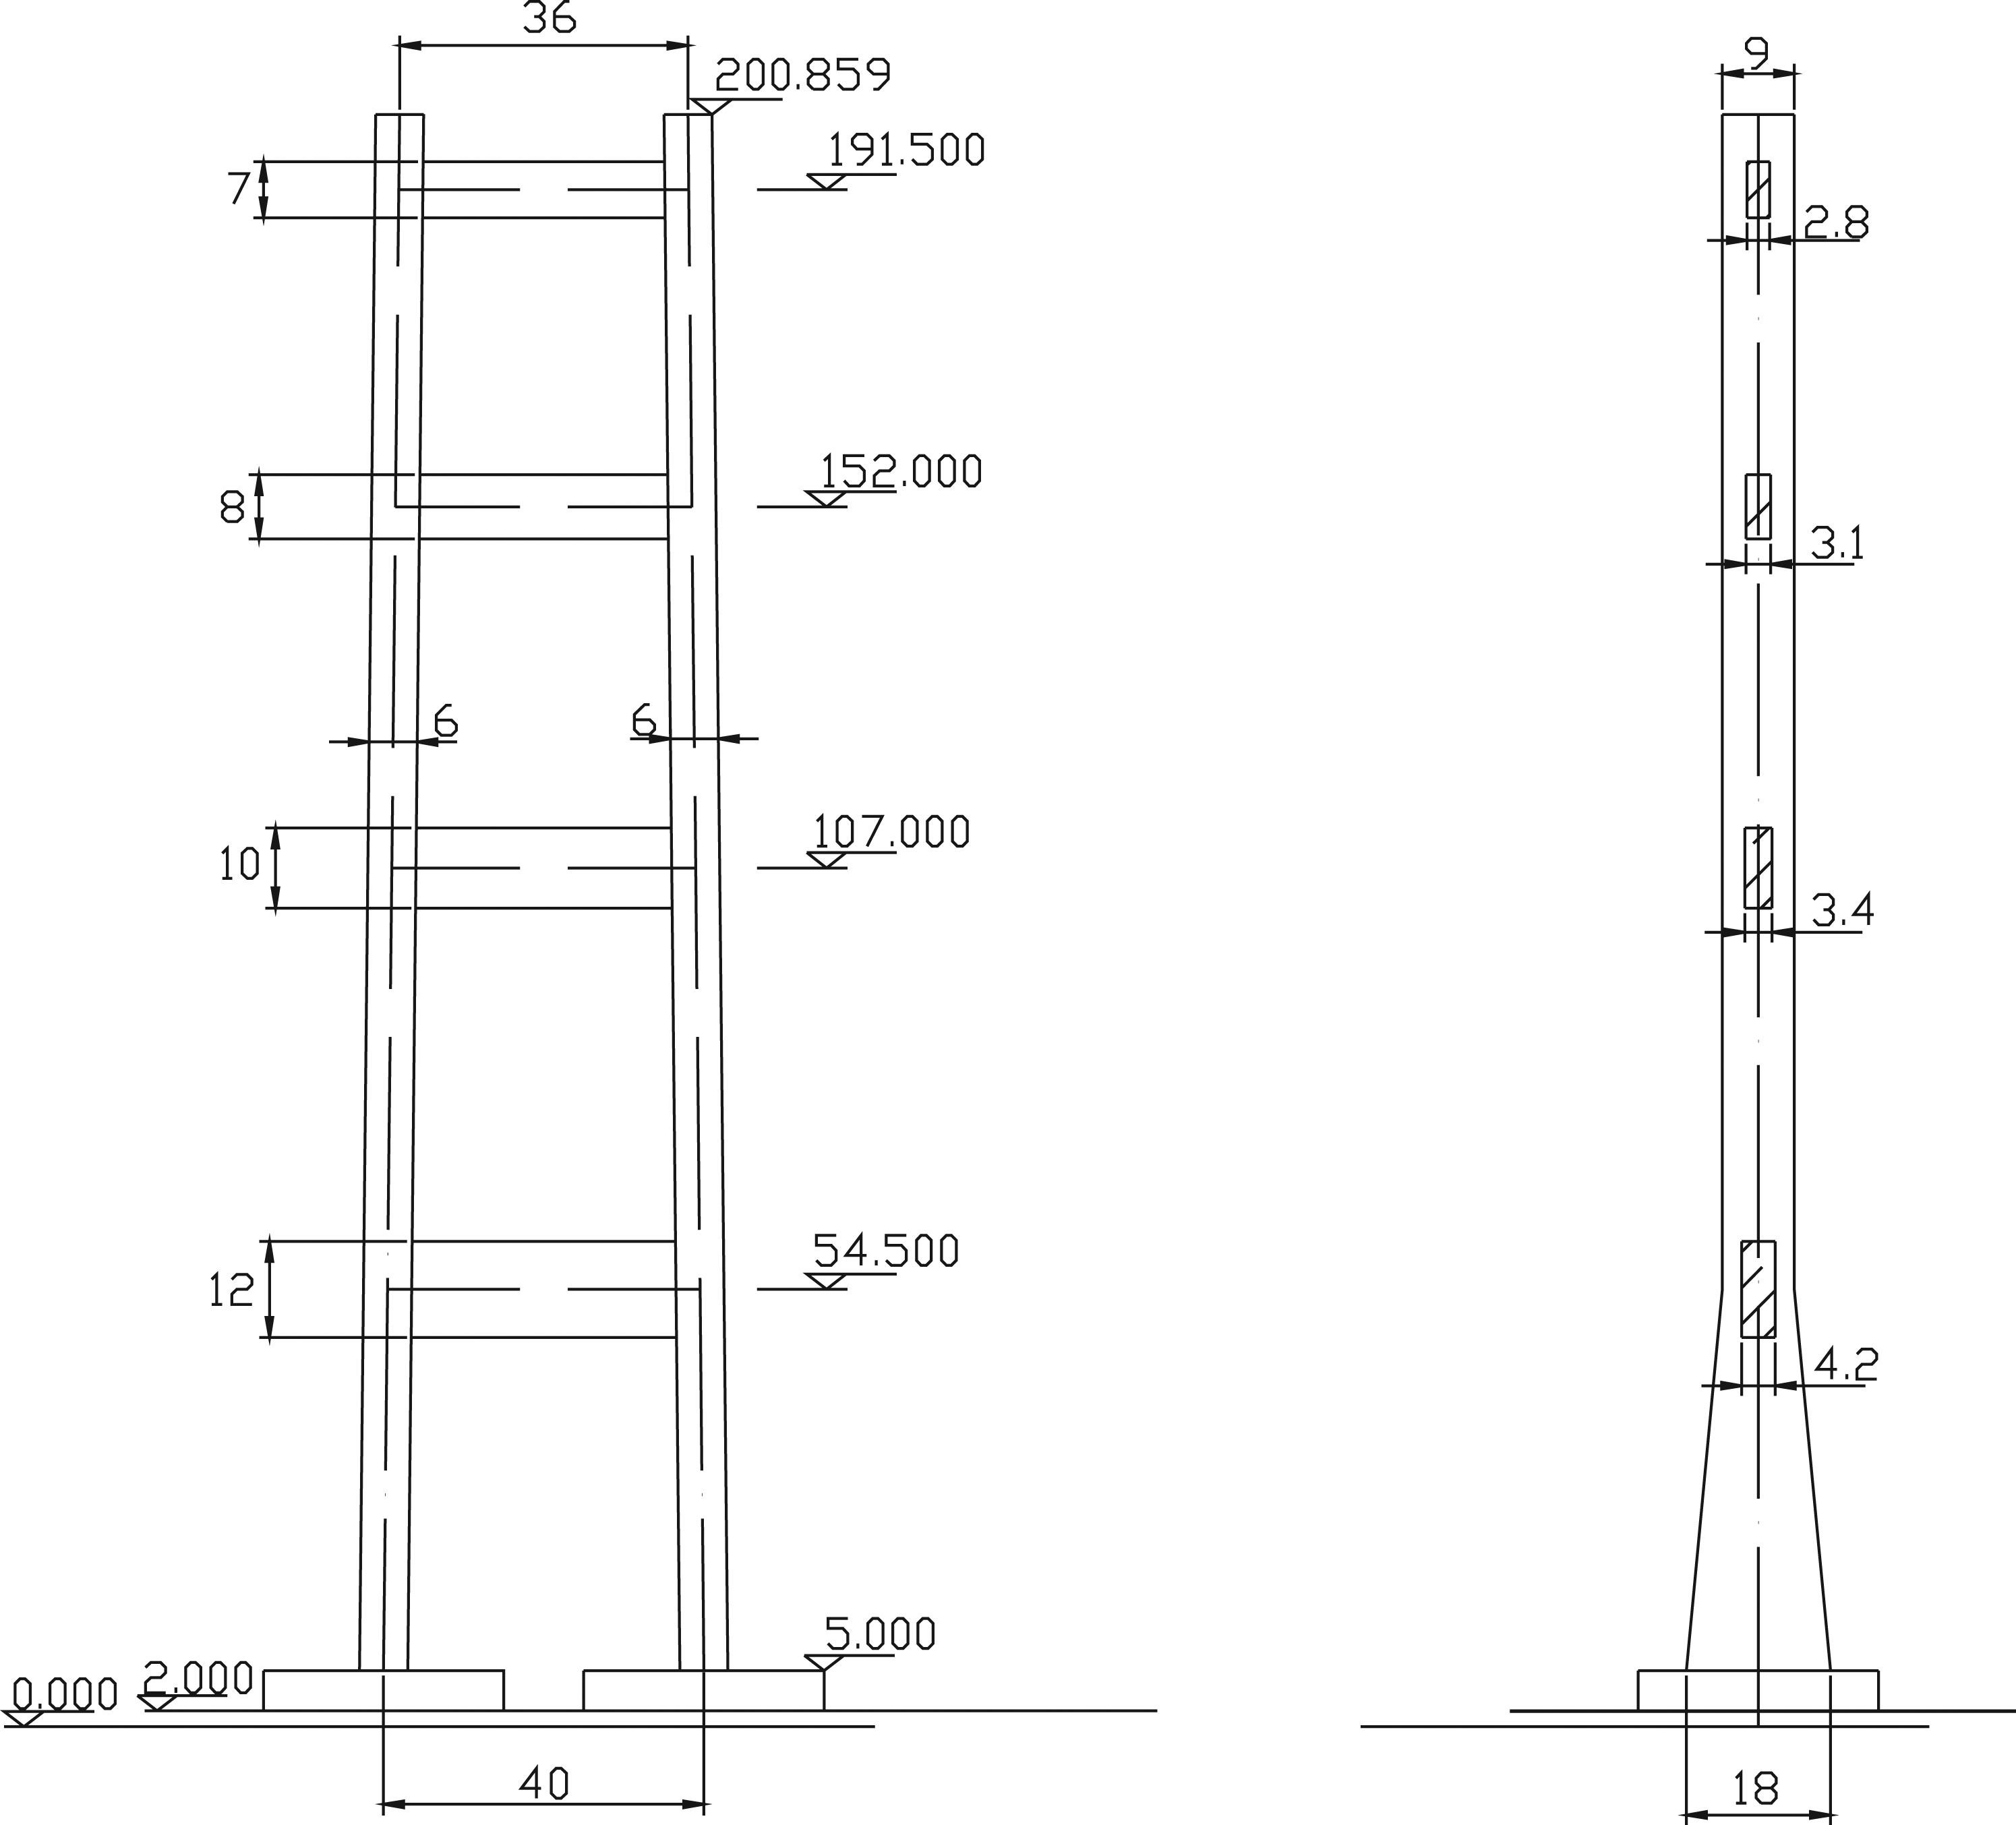
FE modeling and initial modal analysis
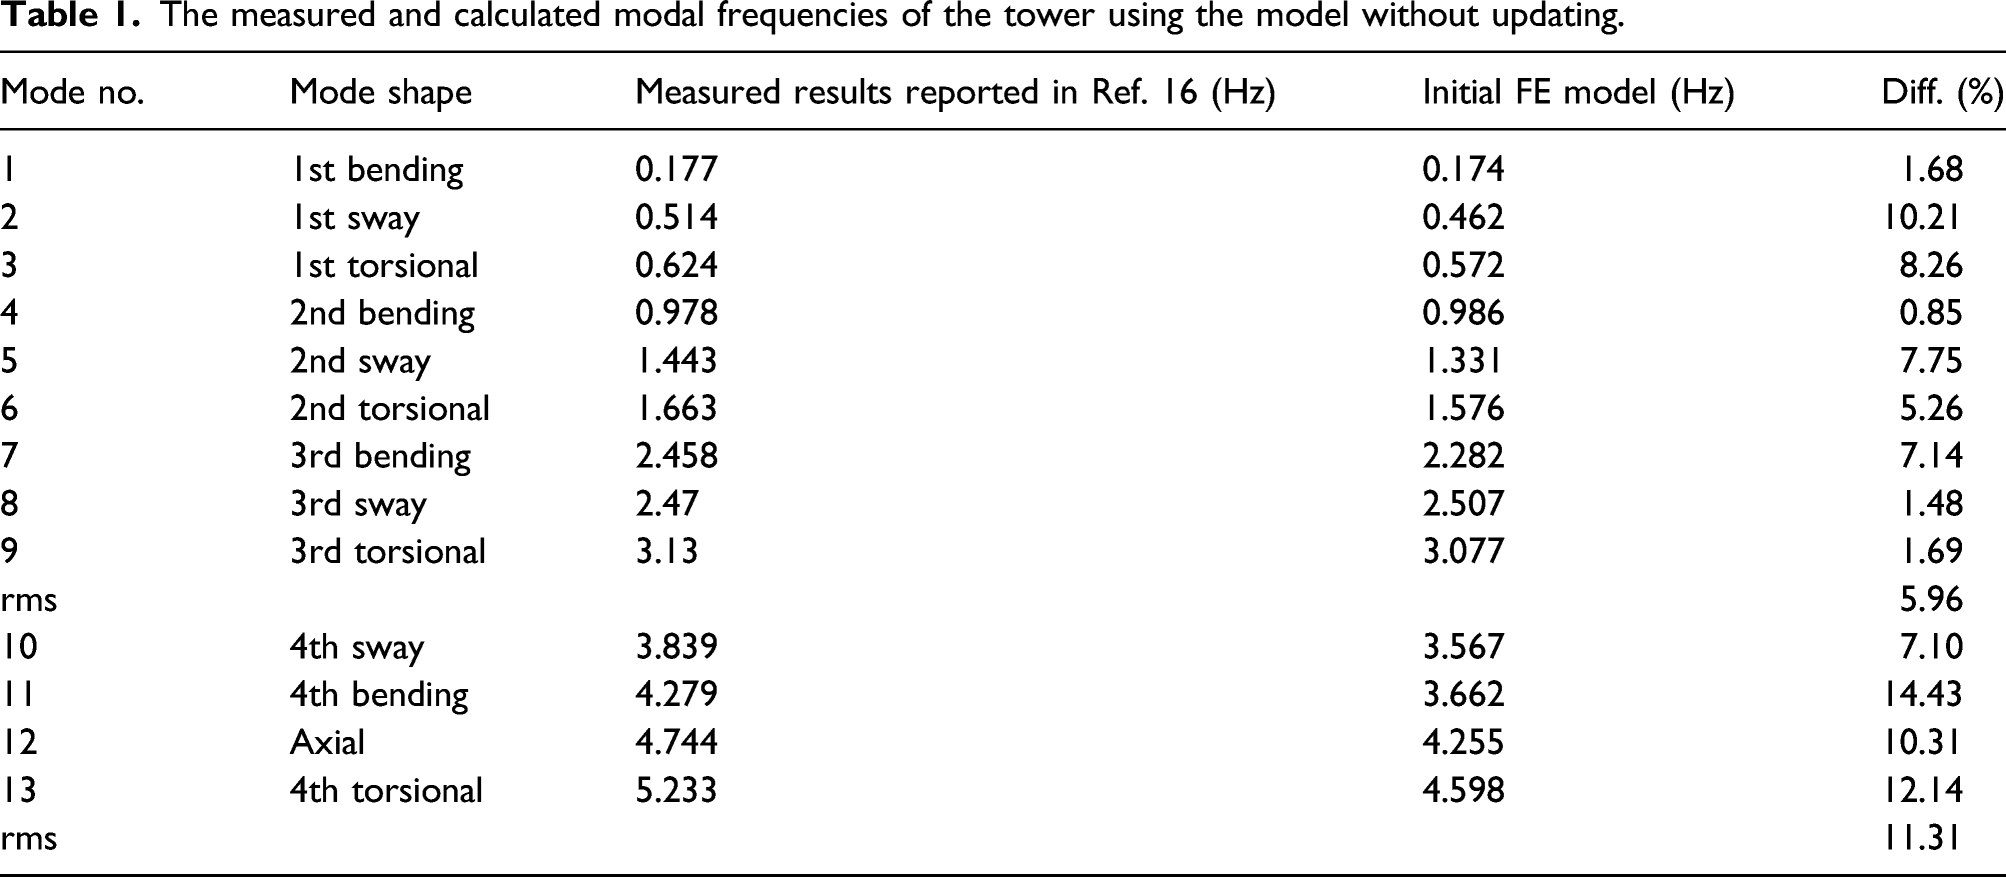
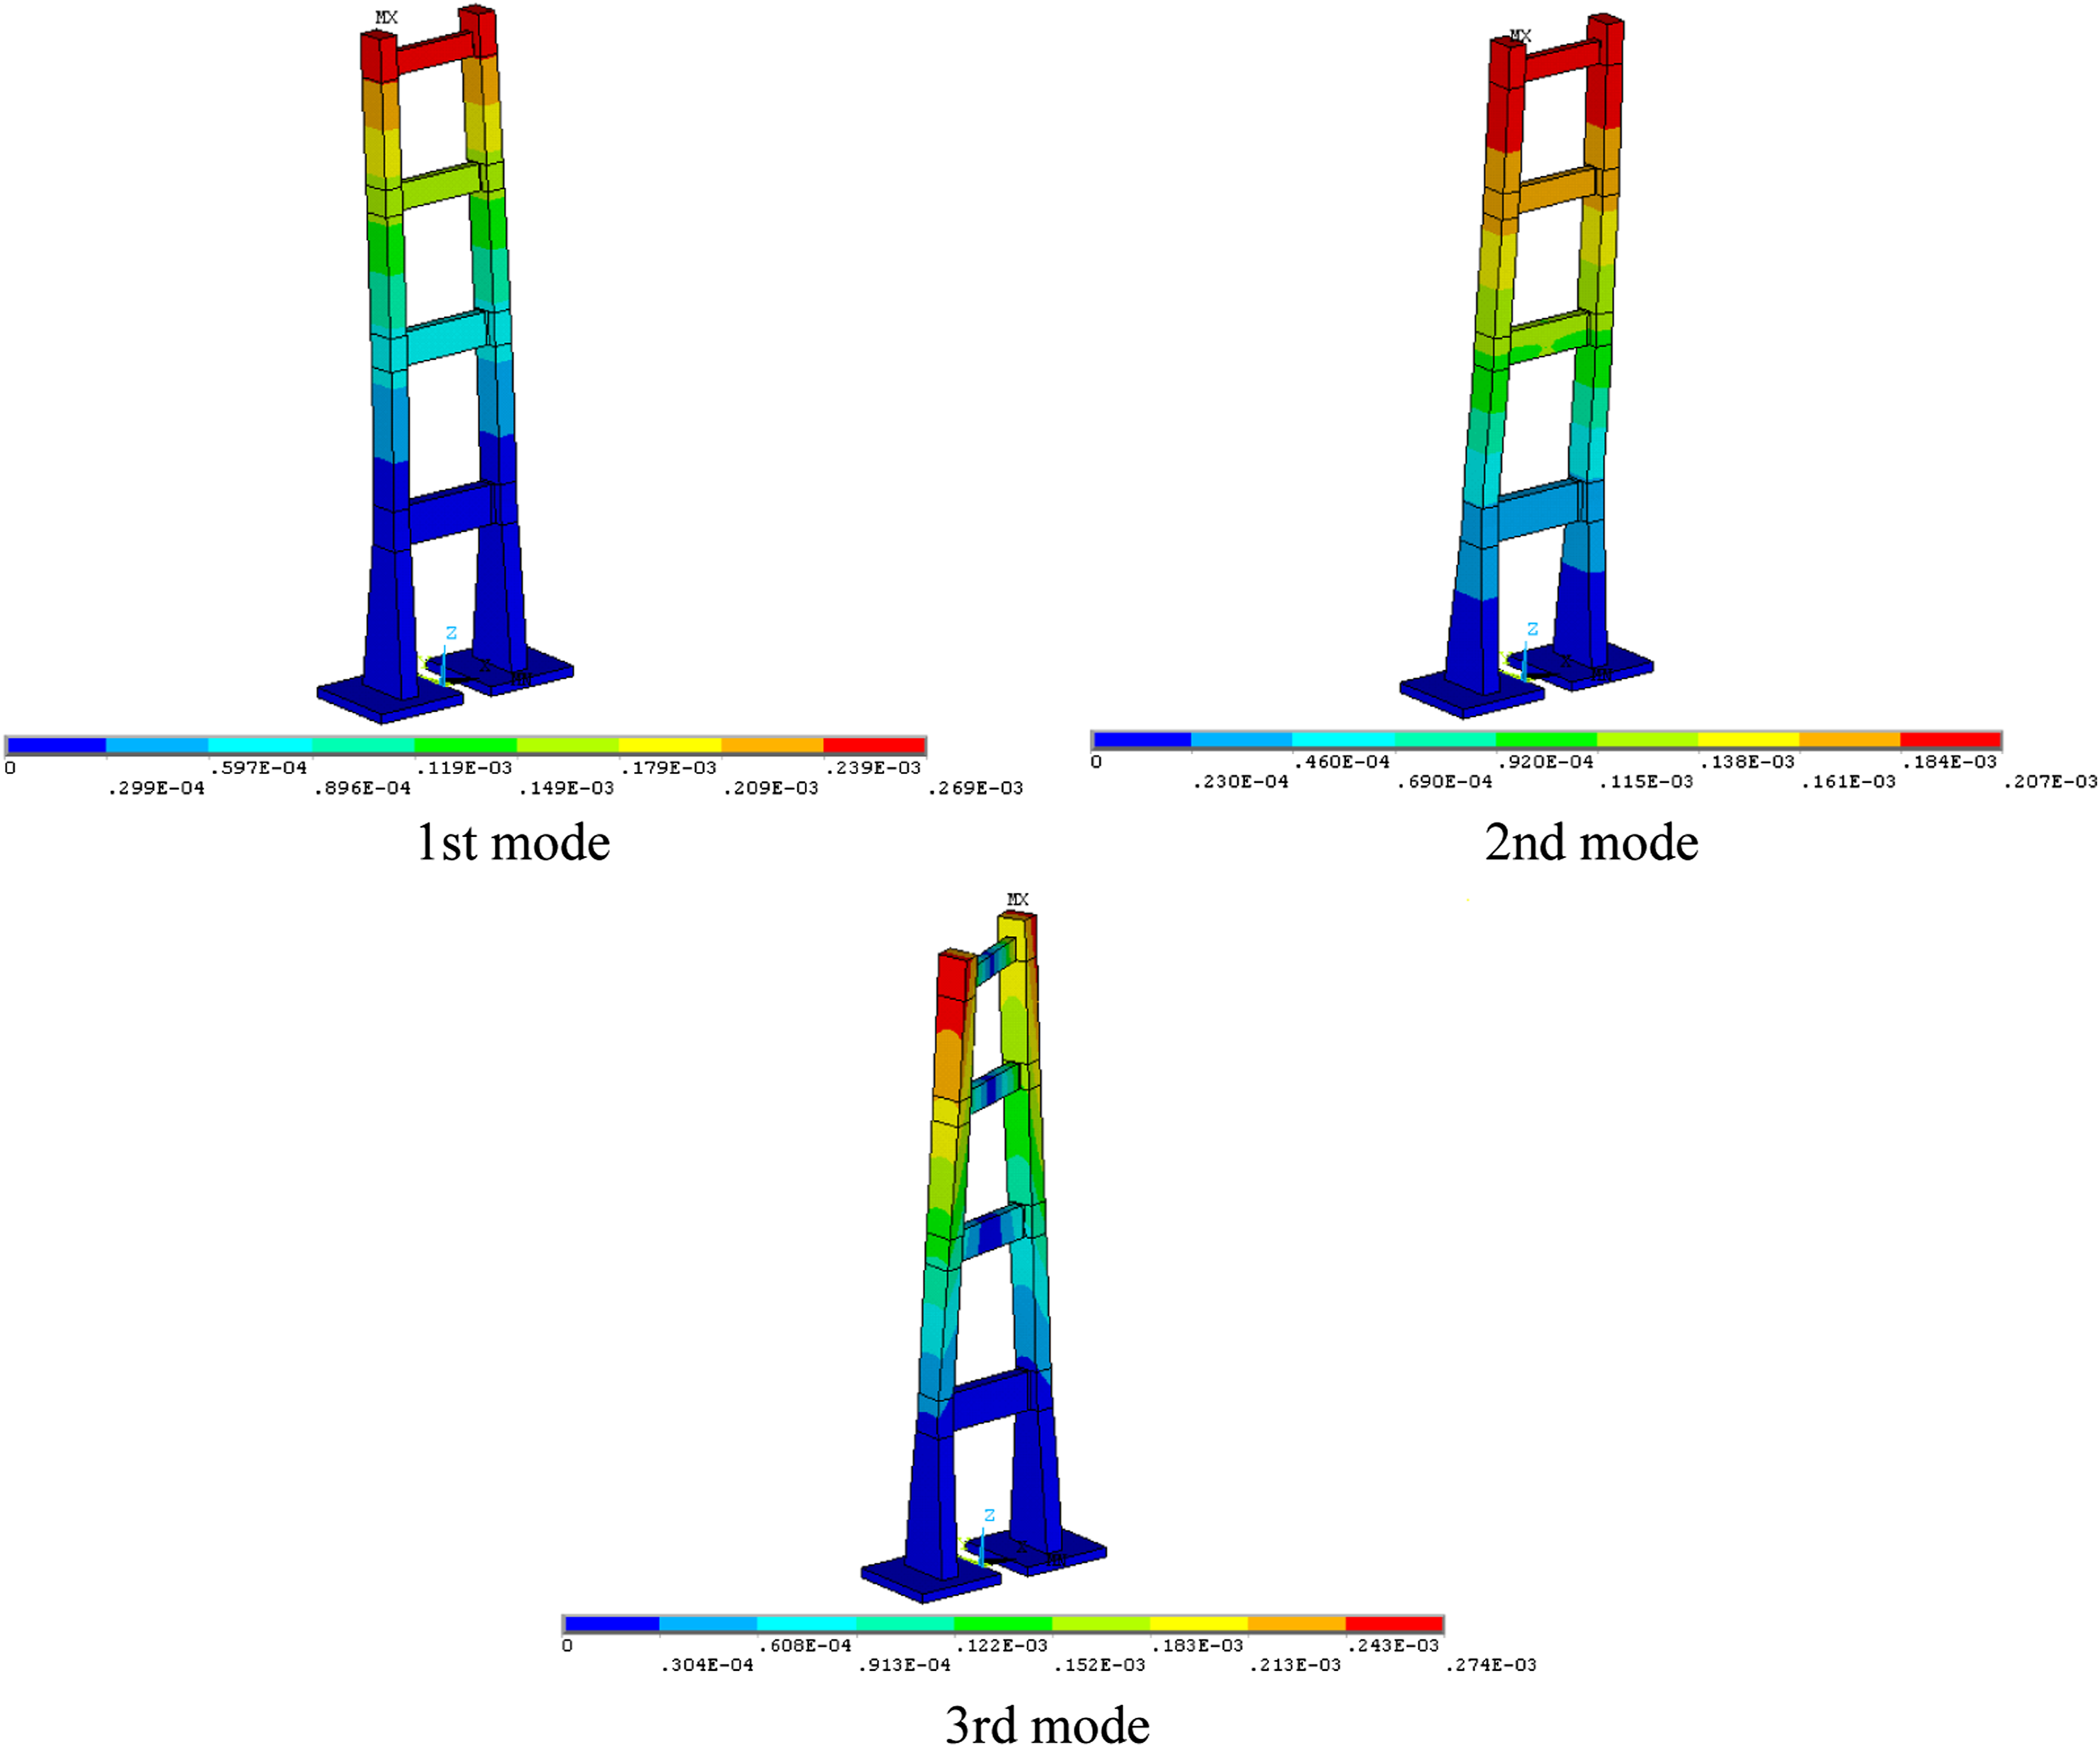
Based on the preliminary study of effects of the element type presented in Appendix 1, the Tsing Ma Bridge tower is meticulously modeled using 11,473 3D tetrahedron solid elements, in order to maximize the computing efficiency on the ANSYS commercial FE platform (Figure 2). All the details are included in the model, while the elements are initially assigned with the design material properties. After establishing the initial model of the Tsing Ma Bridge tower, modal analysis is conducted using the ANSYS platform. Similar to the FE tools developed for accurate and efficient numerical modal analyses,17,18 this study uses the subspace iteration method provided by the ANSYS platform for modal analyses. The calculated modal frequencies and modes are presented in Table 1 and Figure 3, respectively. Table 1 compares the reported measured frequencies for Ma Wan tower,
16
with the calculated results using the initial model. It can be seen that the root-mean-square (rms) error among the first 13 modes reaches 8.00%. The maximum individual relative error is found at the 11th mode, reaching 14.43%. It can also be observed that there are other differences between results predicted by the FE analysis and those identified from the field test. Hence, the initial model should be updated for appropriate SHM of the bridge tower. The FE model of the Tsing Ma Bridge tower. The measured and calculated modal frequencies of the tower using the model without updating. The first∼third modes calculated for the Tsing Ma Bridge tower (m).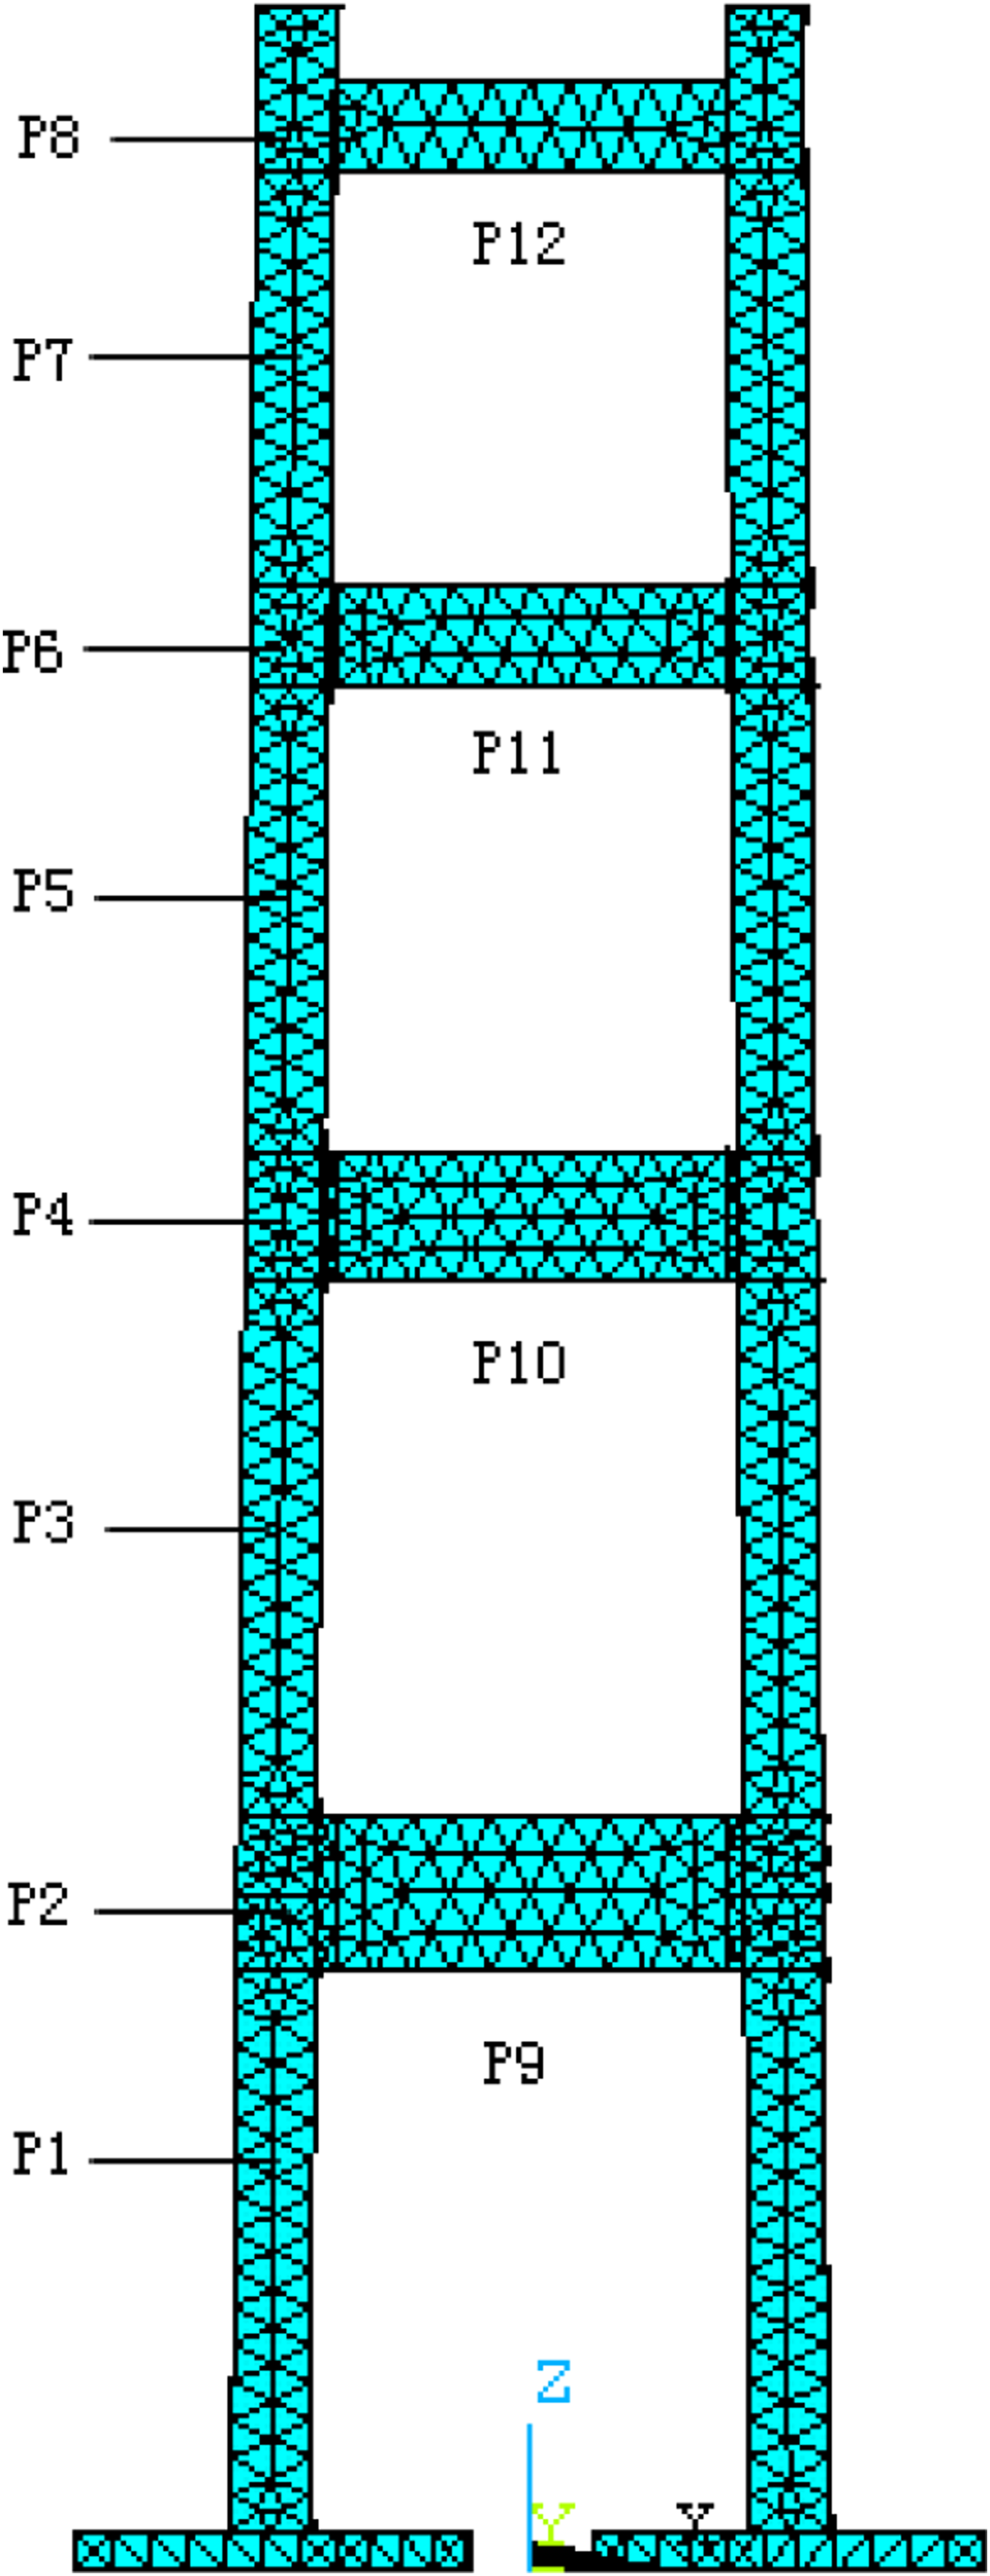
Model updating
Model updating using the RS method
Based on the theories of the RS method previously presented in Subsection ‘RS method’, the elastic modulus of the 12 numbered components (cf. Figure 2) is considered as uncertain parameters (parameters P1∼P12). The reason for considering only stiffness as a parameter of model updating is that the actual bridge tower does not have other types of parameter deviations from its idealized design state (the initial FE model), based on our engineering insight. The bridge tower was newly built by undertaking the modal tests on the physical truth. Therefore, there are no structural damages like aging and cracking of the concrete or corrosion of the reinforcement. The reason for existing differences between the results predicted by the initial FE analysis and those identified from the field test should be that the pure concrete (without reinforcements) is used as material for establishing the initial FE model. As for the mass, the realistic reinforced concrete density is around 2550 kg/m3, while the pure concrete density is 2500 kg/m3. Thus, the parameter deviation of the mass should not be very significant for the initial FE model. However, concerning the structural stiffness, the authors in Ref. 16 indicate that adding reinforcements in concrete results in the noticeable increment of the elastic modulus of the structure, particularly in connection parts. Thus, only stiffness is considered as a parameter of model updating for the current research. Based on the design drawings, the initial value for the 12 parameters to be identified is 3.4e10 N/m2, for which the acceptable bound is ±25%. Using a CCD (
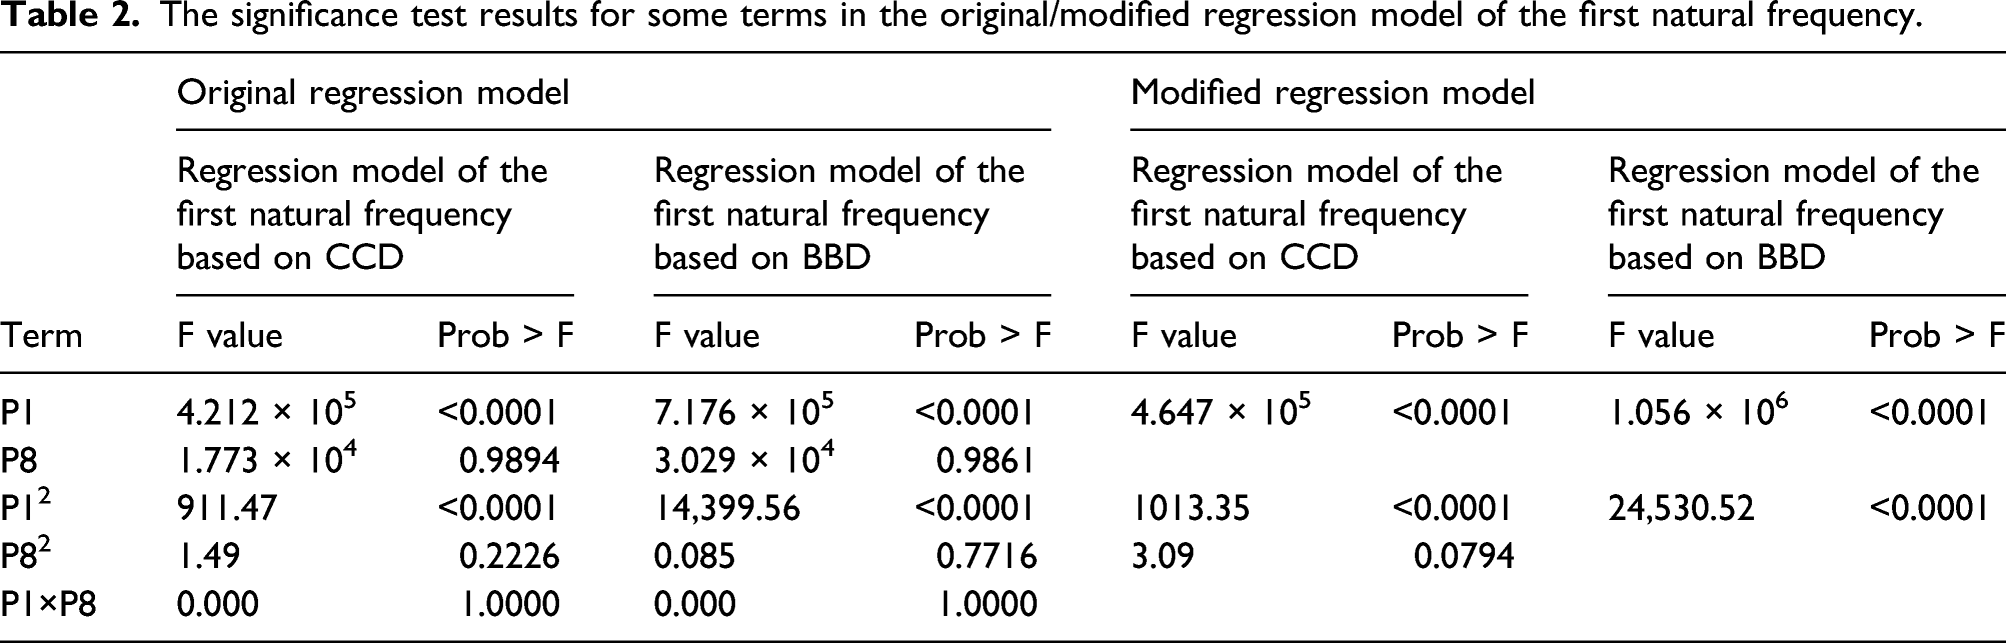
The significance test results for some terms in the original/modified regression model of the first natural frequency.
The significance test results for the modified regression models.
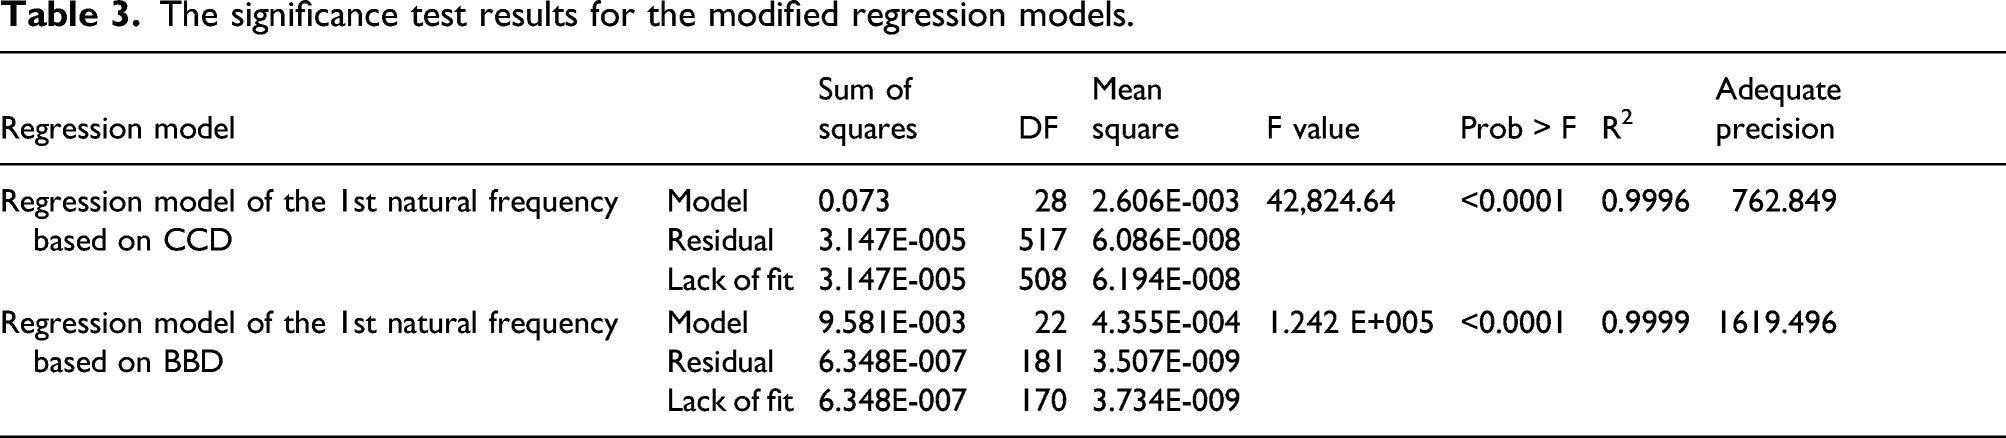
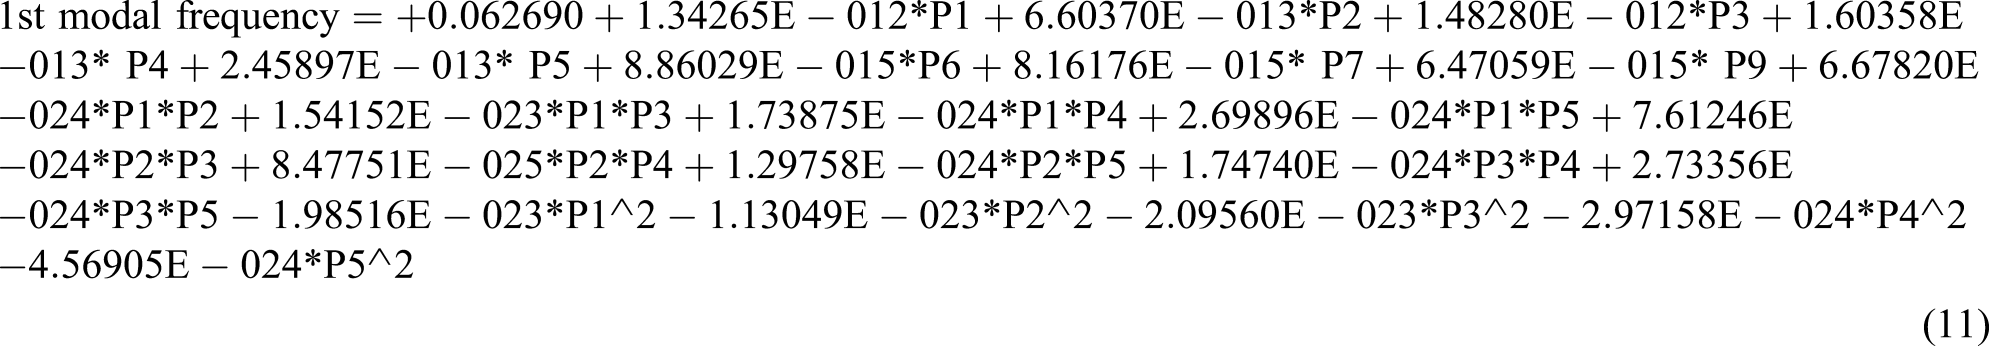
Table 2 presents the significance test results for some terms in the modified regression models. It can be seen that after modification, all of the remaining terms have extremely significant effects on the responses. According to the modified polynomial forms of the two models presented in Table 2, the interaction effect between the two factors can be neglected. However, the relationship between the factors and the responses is not linear. The obtained RS mathematical equations (quadratic polynomials) of the first natural frequency based on CCD and BBD are shown in equations (10) and (11), respectively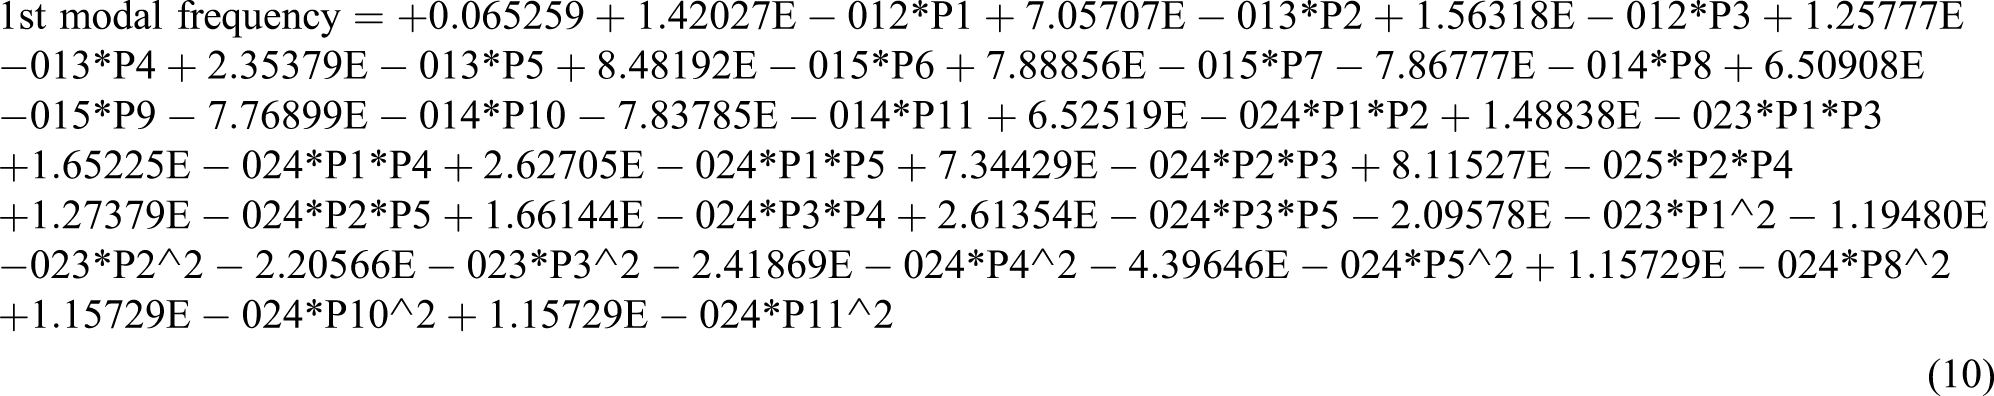
Based on these results, the modified RS models can be utilized for parameter identification. Finally, the optimization is performed on the nine modified RS models regarding the measured modal frequencies (Table 1). Figure 4 presents the convergence analyses of the objective function, more precisely, the rms of the relative differences between the first–ninth-order modal frequencies estimated by the RS model and the measured modal frequencies. It can be seen that during the optimization processes, the objective functions are gradually minimized. They converge after almost 50 iterations for the RS models established with CCD and BBD. The convergence of the objective function.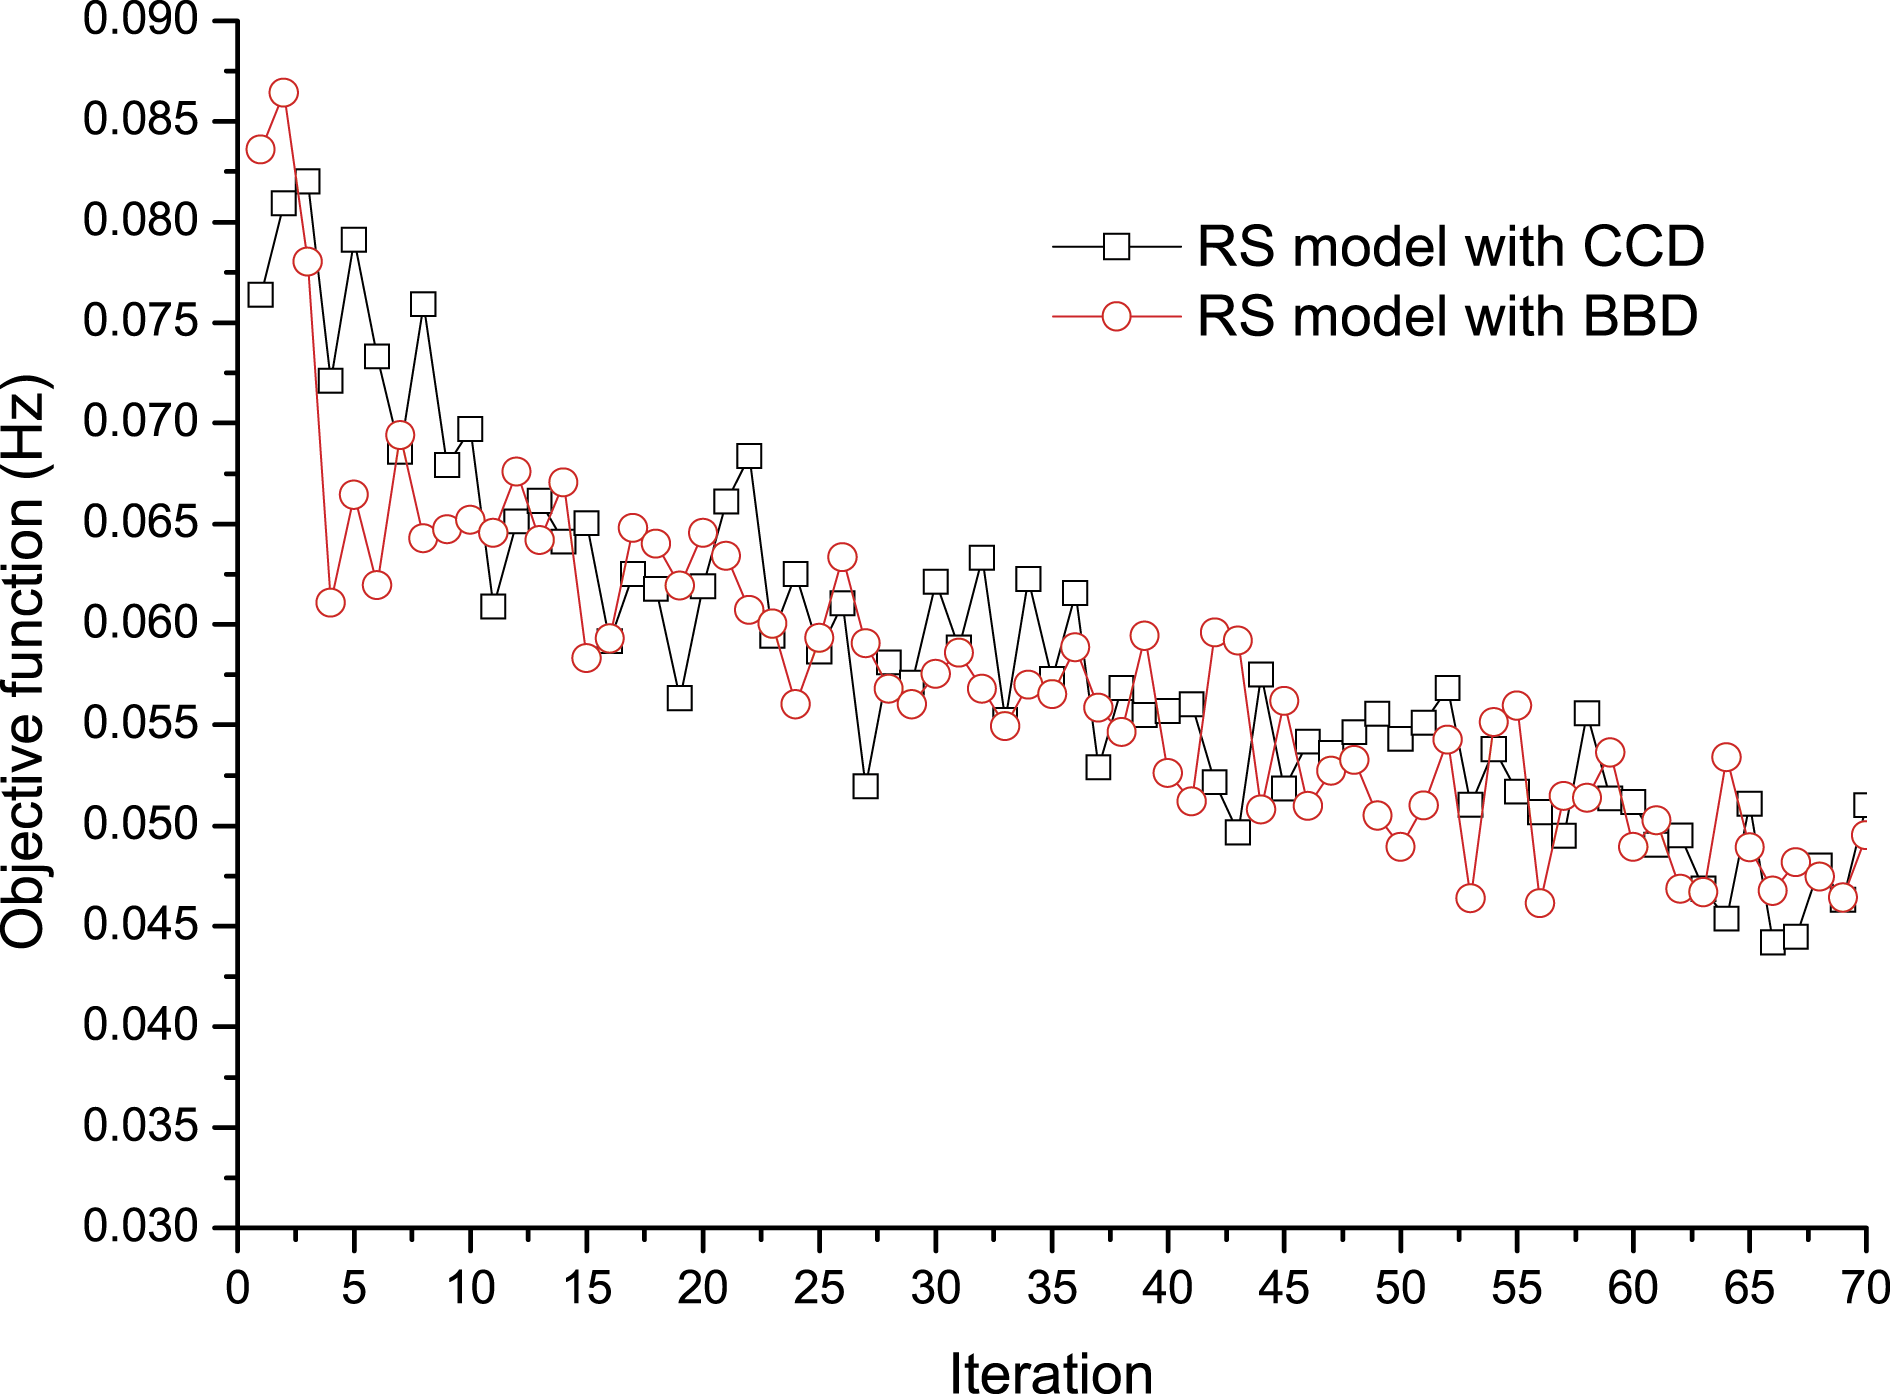
After optimization, the identified parameters are obtained (cf. Figure 5). It can be observed that most of the identified elastic moduli using the RS models are greater than the initial value (design parameter), for both BBD and CCD sampling methods. In addition, after model updating, the elastic modulus of the connecting parts on tower legs (P2, P4, P6, and P8) is incremented by 12%–25% for both CCD and BBD. However, some other parts on tower legs (P3 and P5) need roughly 4%–25% reduction of the elastic modulus for both CCD and BBD sampling methods. After model updating for both CCD and BBD, the elastic modulus of the cross-beams (P9∼P12) is modified by 16%–25%. These observations are coherent with those of Fei et al.,
16
who employed the traditional sensitivity-based parametric identification approach for updating their FE model of the Tsing Ma Bridge tower. The initial and updated parameters using the RS method.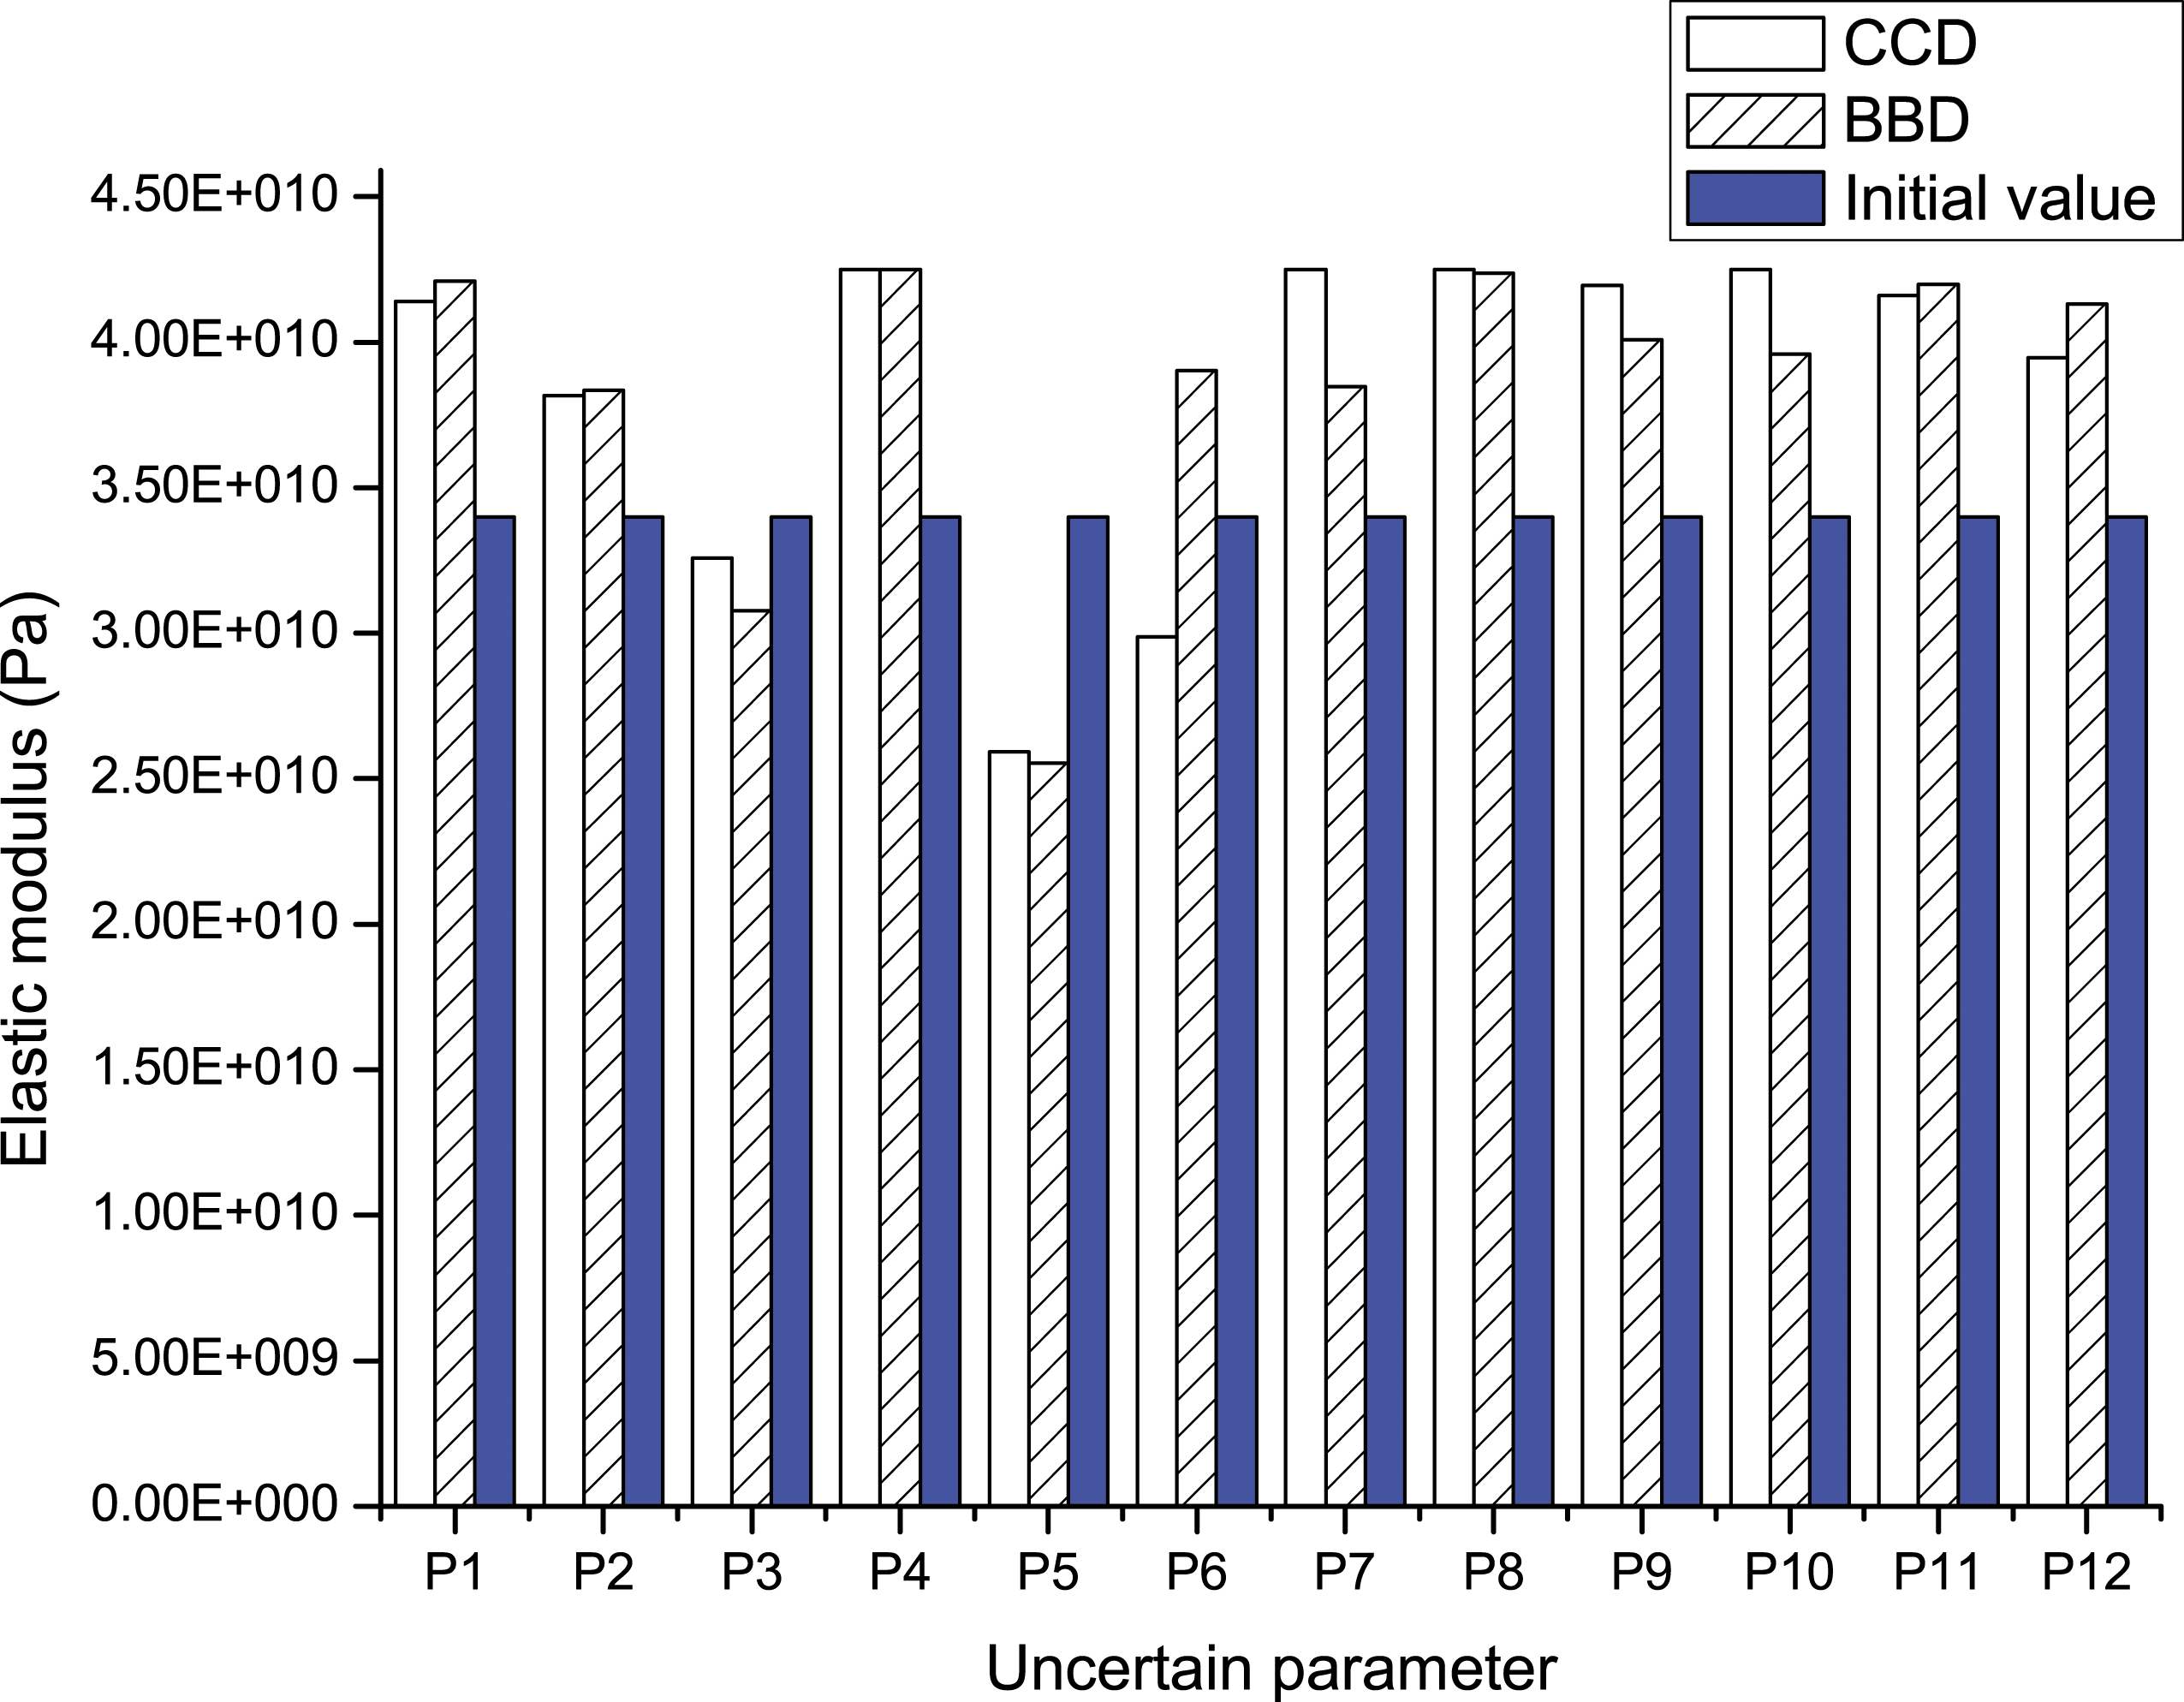
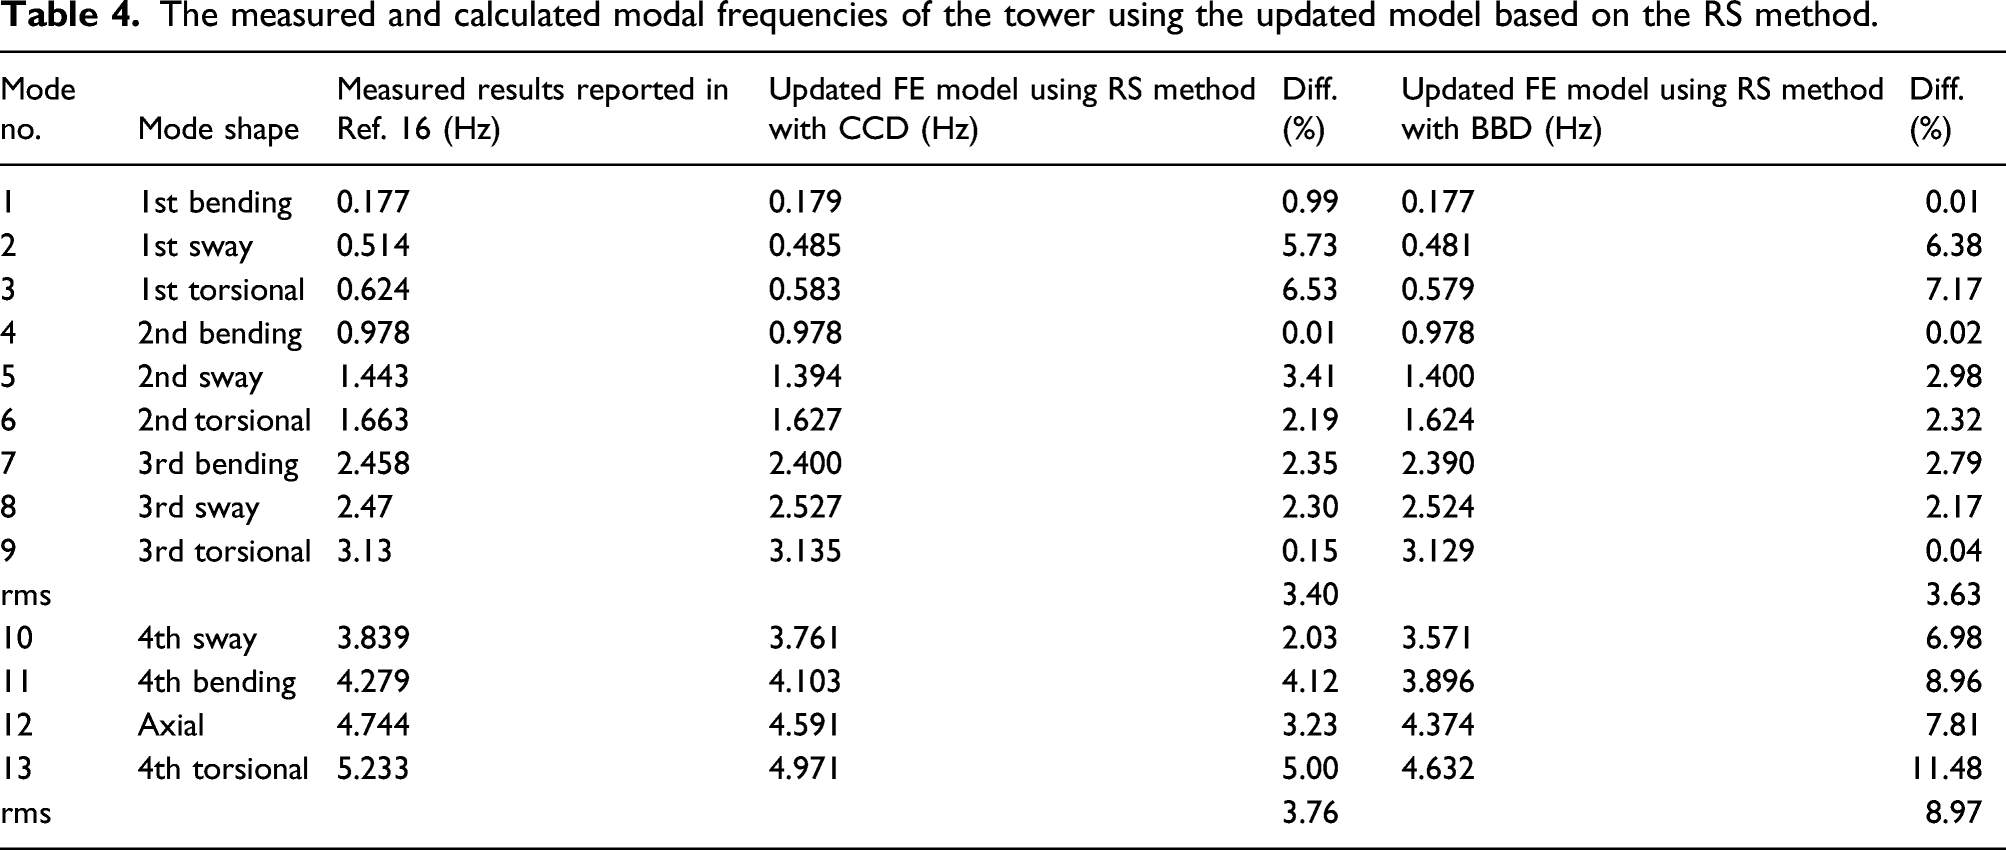
The measured and calculated modal frequencies of the tower using the updated model based on the RS method.
Model updating using the SVR method
In order to update the FE model of the Tsing Ma Bridge tower using the SVR method, the data obtained based on CCD and BBD sampling methods are used to train the SVR models, respectively. The structure’s first nine natural frequencies are taken as the trained SVR model inputs, and the outputs of the SVR models are the elastic modulus of the 12 numbered components shown in Figure 2. After training the SVR models, the measured modal frequencies are provided as inputs to the surrogate models. The identified parameters are shown in Figure 6. It can be seen that the changes of the uncertain parameters through model updating are more noticeable for the CCD sampling method than for the BBD sampling method, compared to the initial design value. The initial and the updated parameters using the SVR method.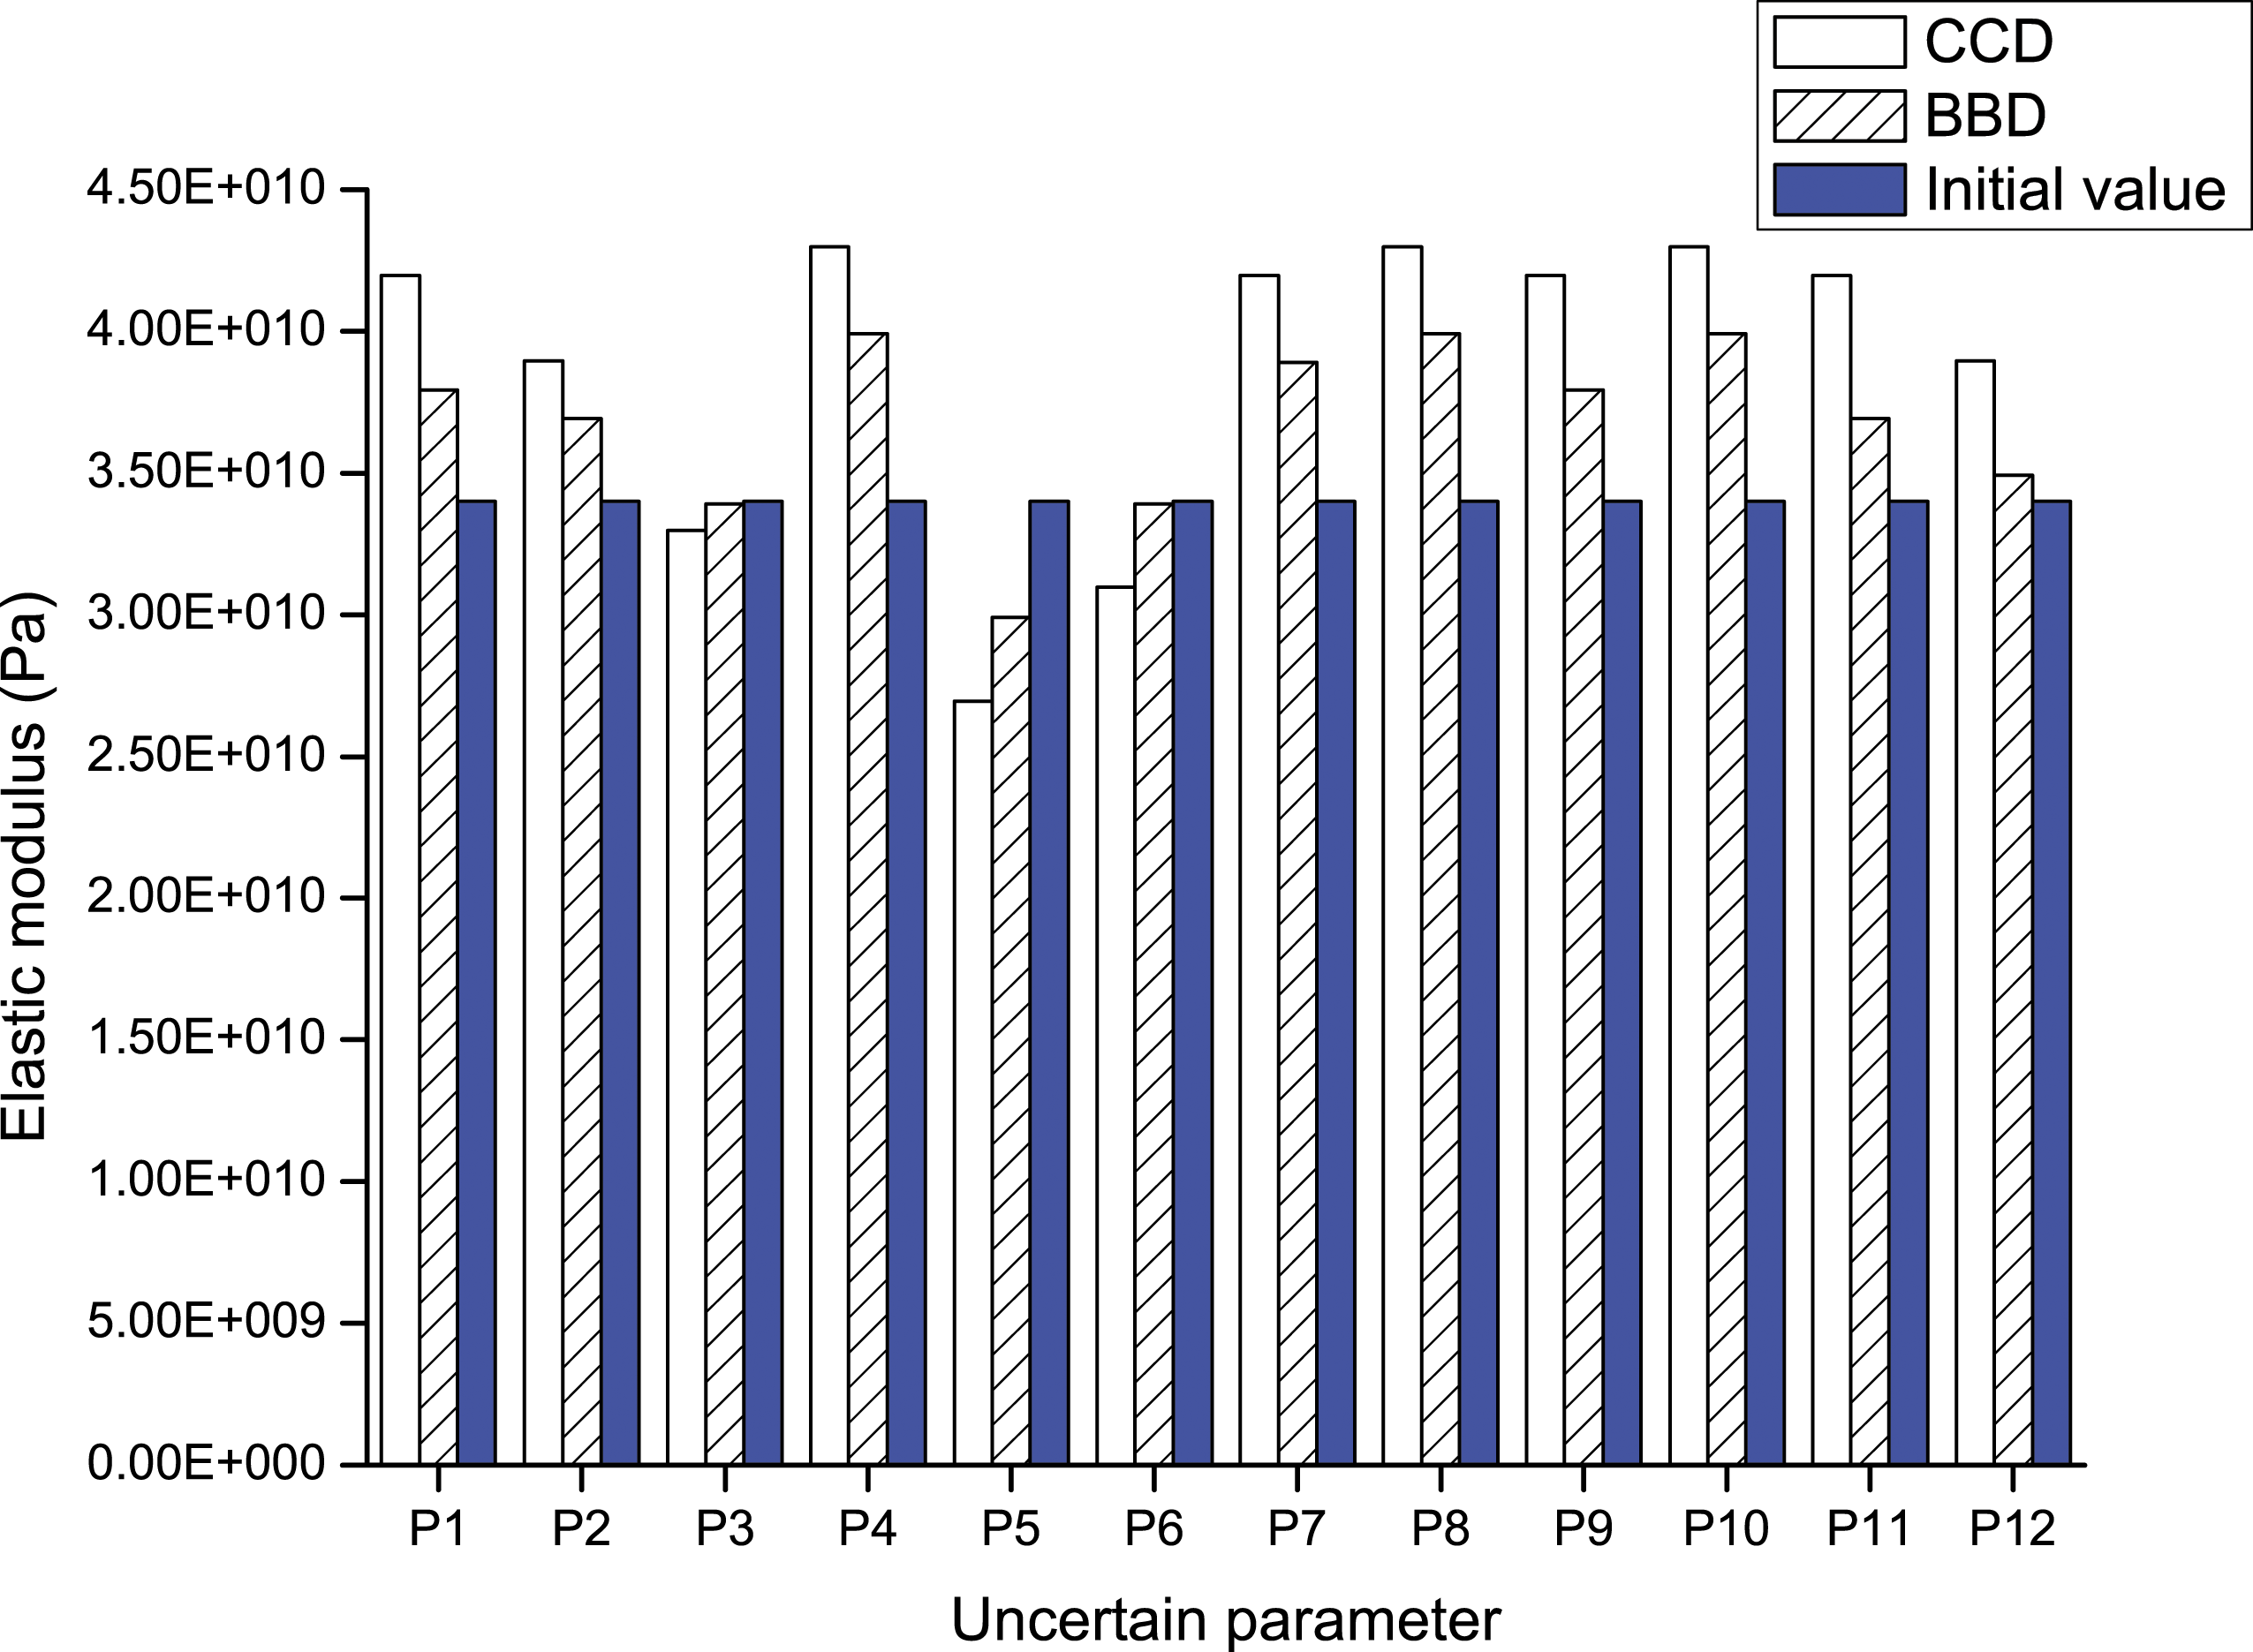
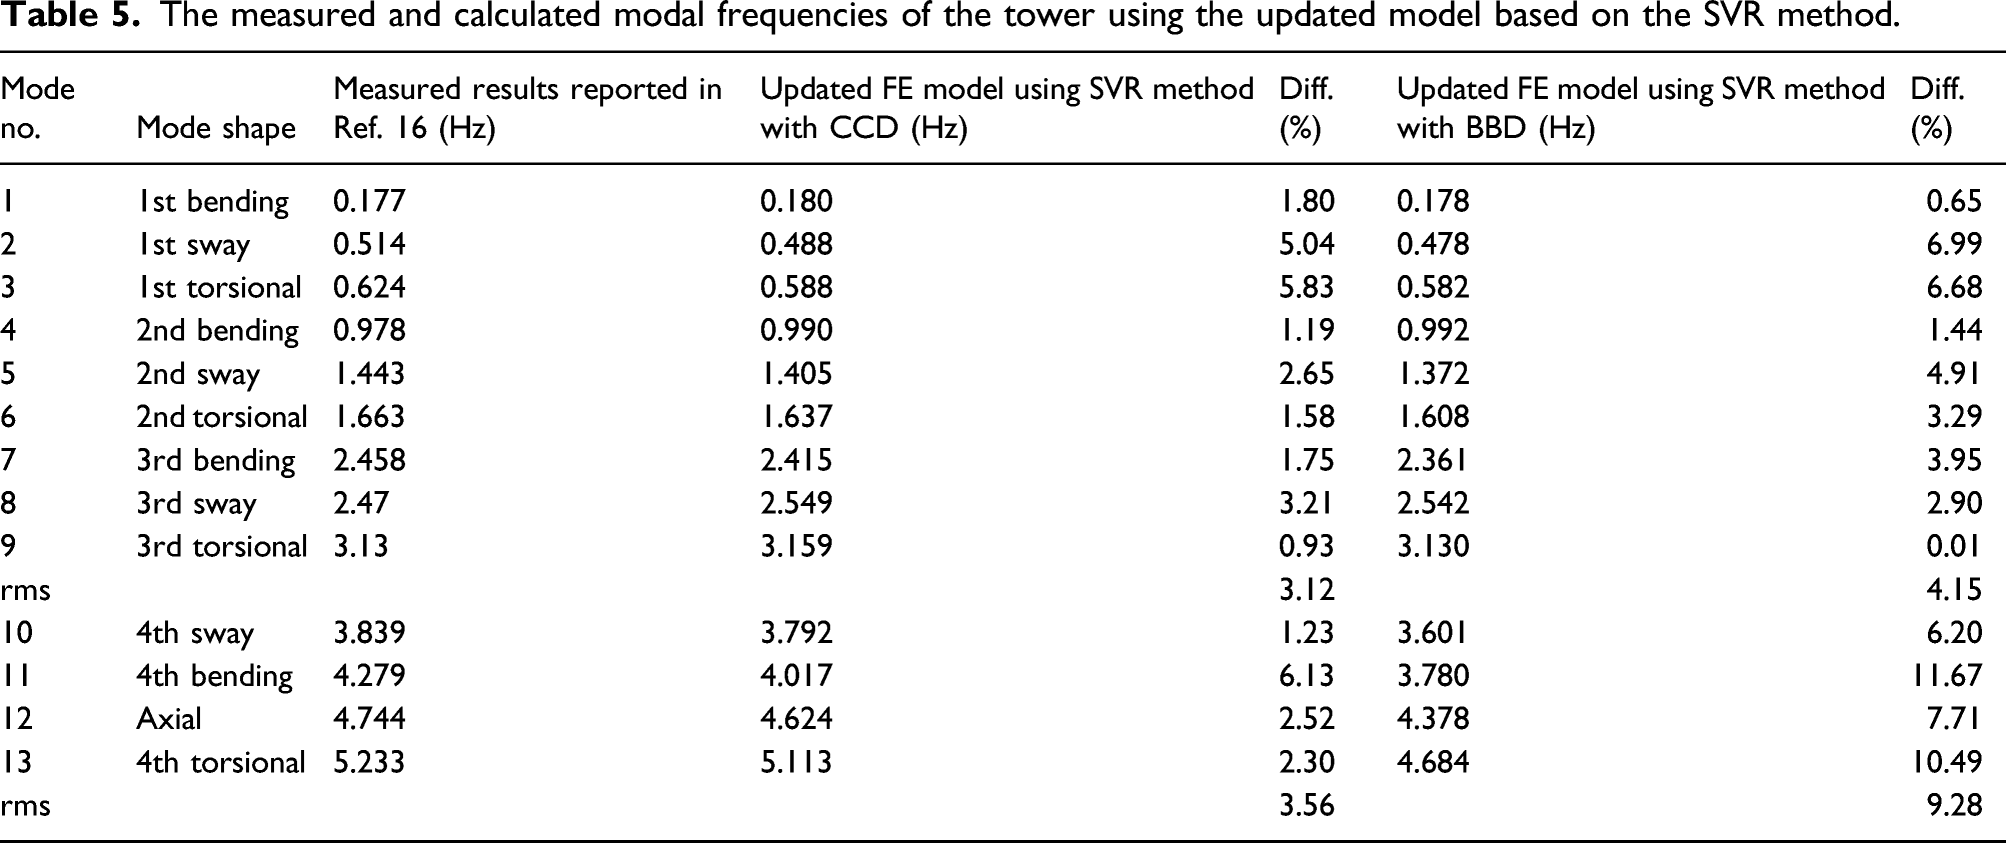
The measured and calculated modal frequencies of the tower using the updated model based on the SVR method.
Model updating using the RBFNN method
Two RBFNNs were trained using the samples obtained by CCD and BBD. The first nine natural frequencies of the structure are taken as inputs of the trained RBFNNs, while the outputs of the RBFNNs are the elastic modulus of the 12 numbered components (cf. Figure 2). After training the RBFNNs, the measured modal frequencies are presented as inputs to the surrogate models. Figure 7 presents the identified parameters. It can be observed that compared with the initial design value, the changes of the uncertain parameters through model updating are unrealistic for both the CCD and BBD sampling methods. The values of the parameters updated using the CCD or the BBD sampling method are occasionally much greater and sometimes much smaller, than their initial value (3.4E10 Pa). The initial and updated parameters using the RBFNN method.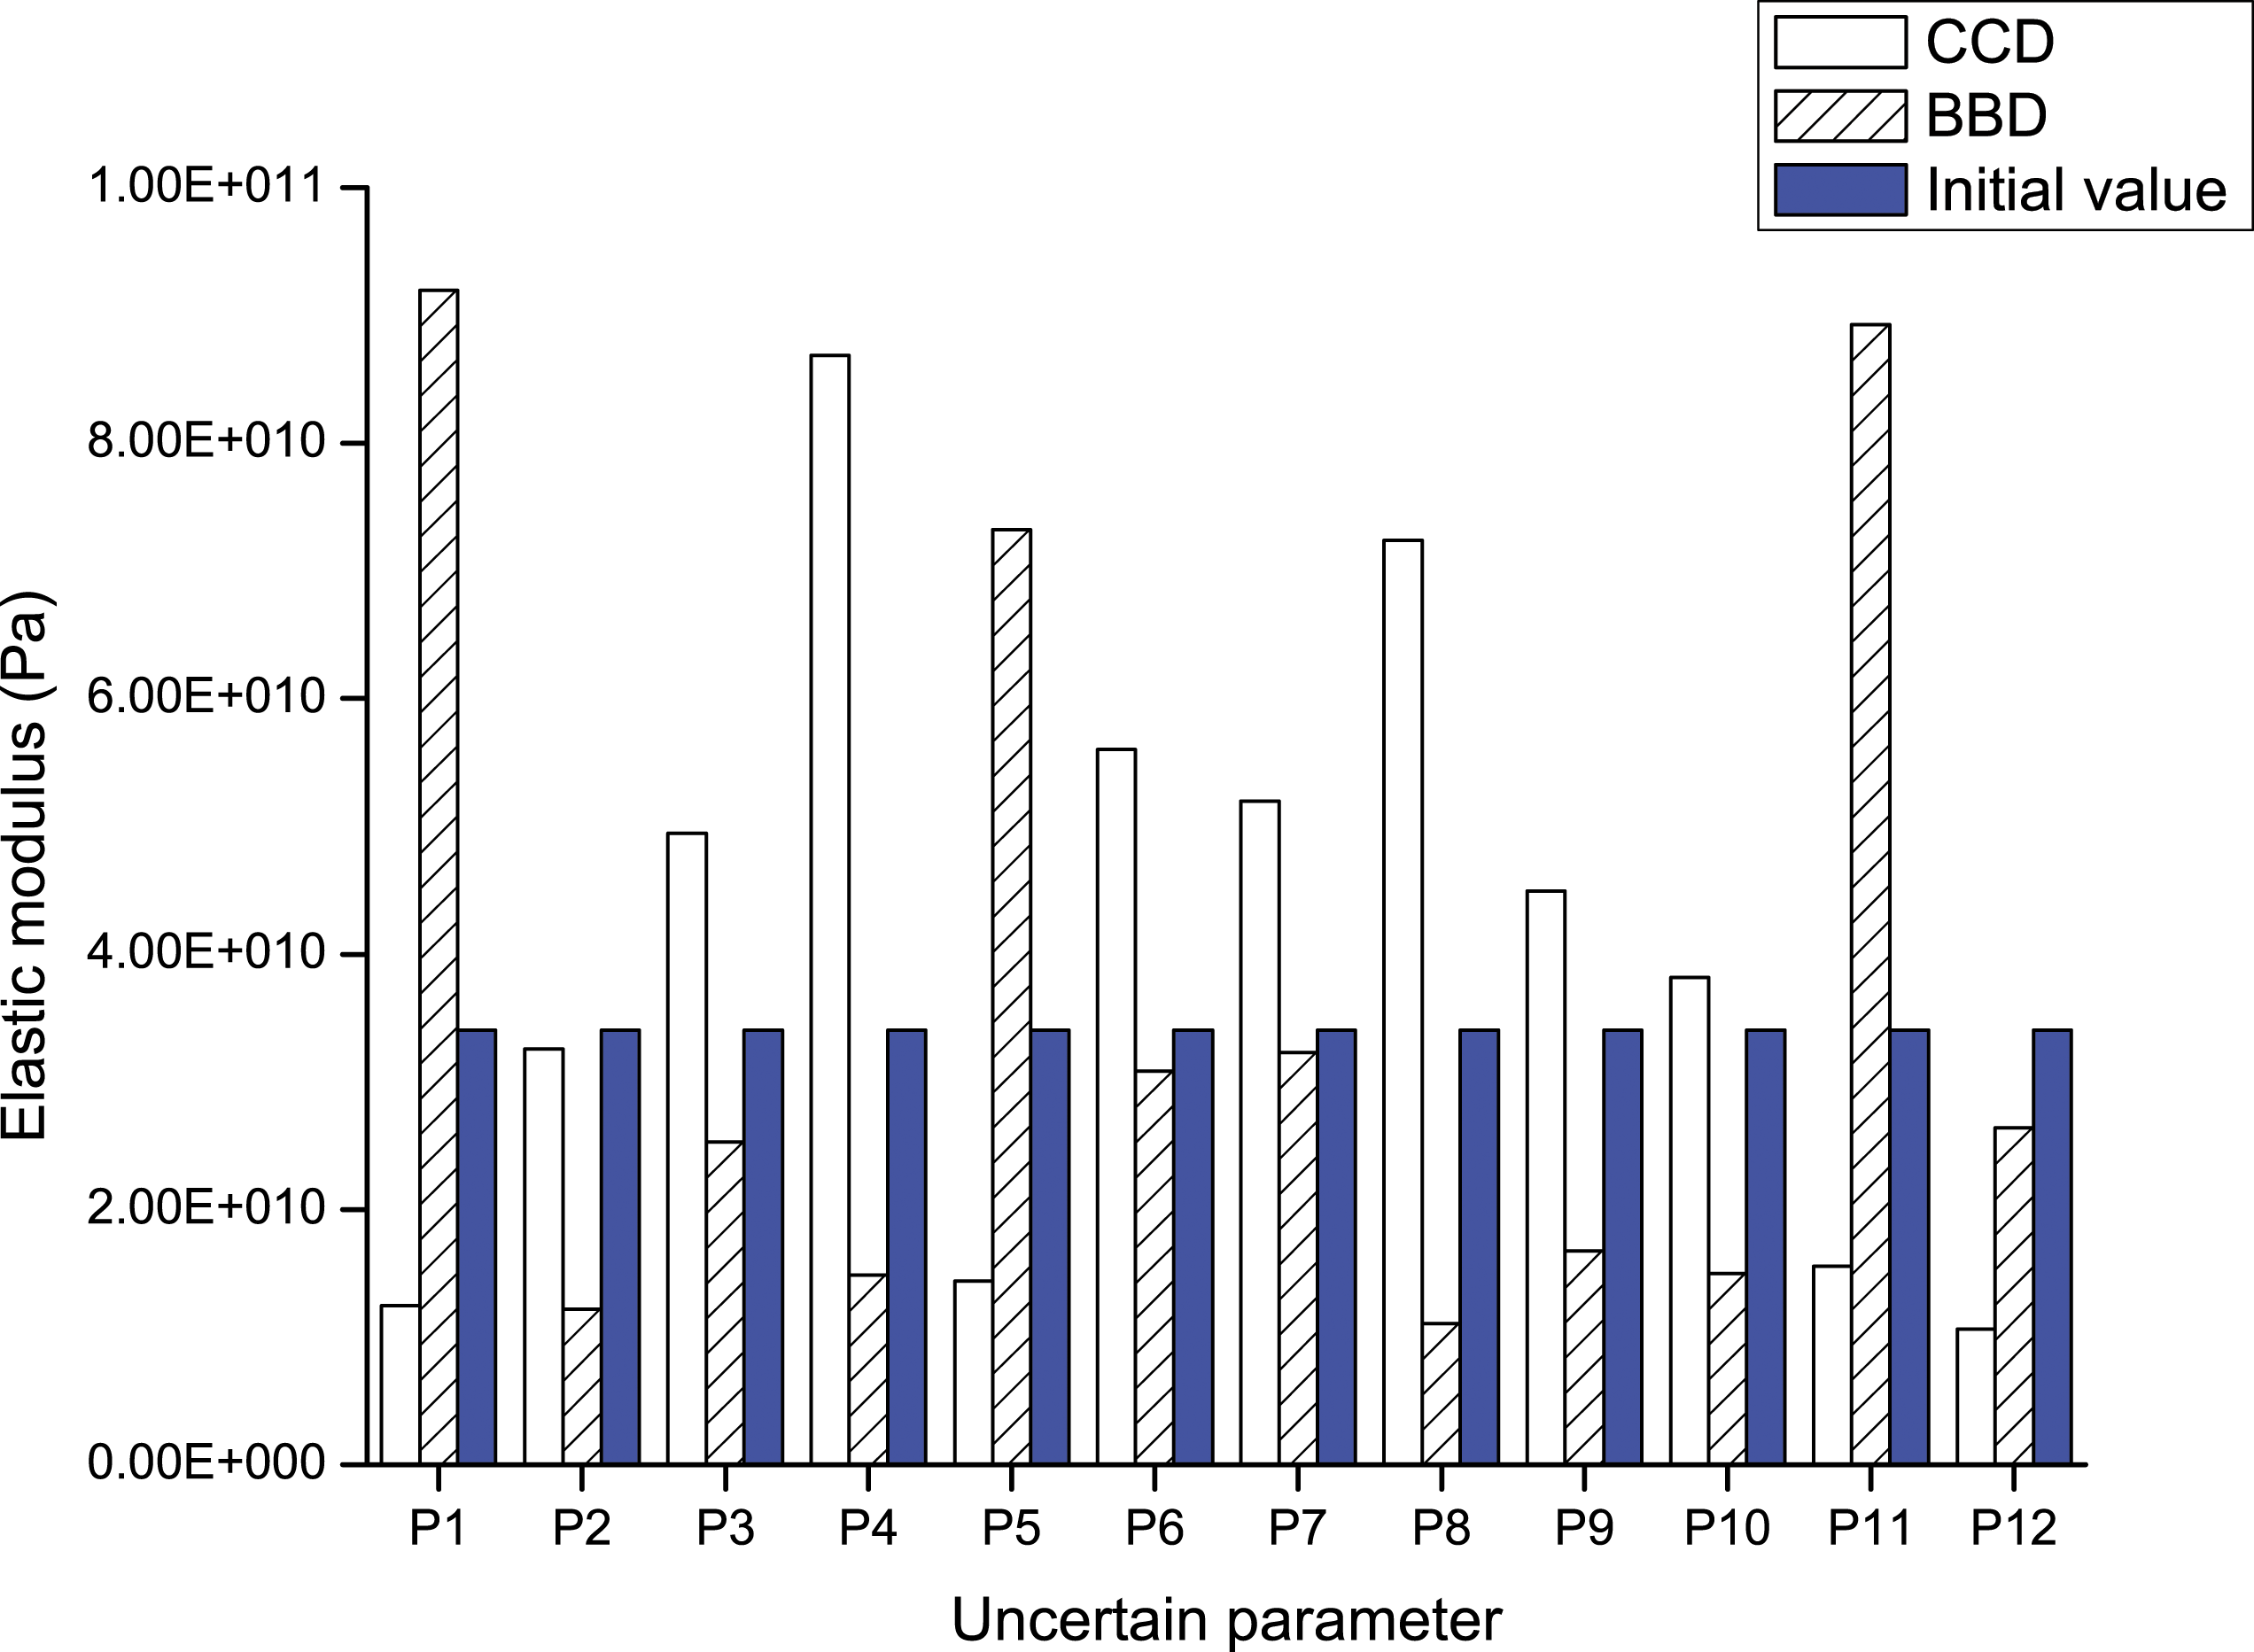
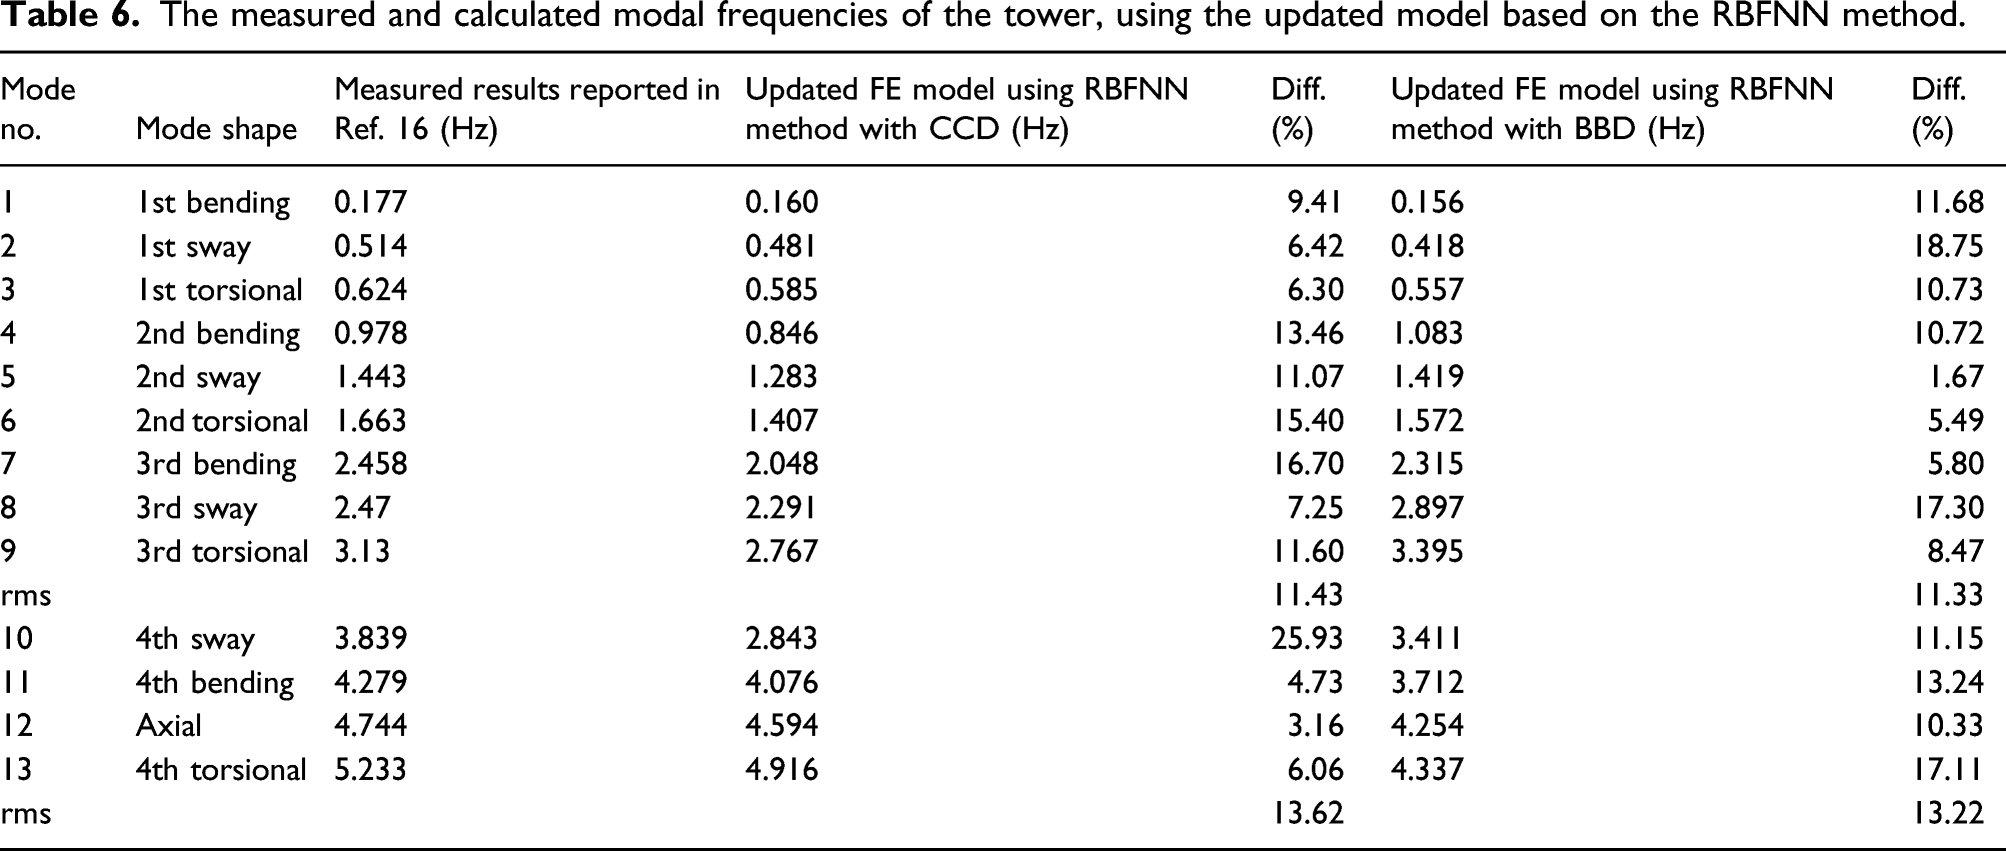
The measured and calculated modal frequencies of the tower, using the updated model based on the RBFNN method.
Structural performances under strong winds
According to Appendix 2, the excitation with the frequency close to the fundamental frequency of the object always leads to a large vibration amplitude. Therefore, strong dynamic responses might be excited for the Tsing Ma Bridge tower by normal atmospheric boundary layer (ABL) winds with energies generally accumulated in the frequency range [0.01–0.1 Hz]. This is due to the fact that the fundamental frequency of the Tsing Ma Bridge tower is around 0.1 Hz (Table 1). This study also investigates the structural performances of the Tsing Ma Bridge tower under strong winds, using the developed FE models with and without model updating.
20-s ABL wind velocity samples are generated at 20 positions using the fourth-order auto-regression model with the ABL wind speed spectrum
19
and the frequency-independent coherence function.
20
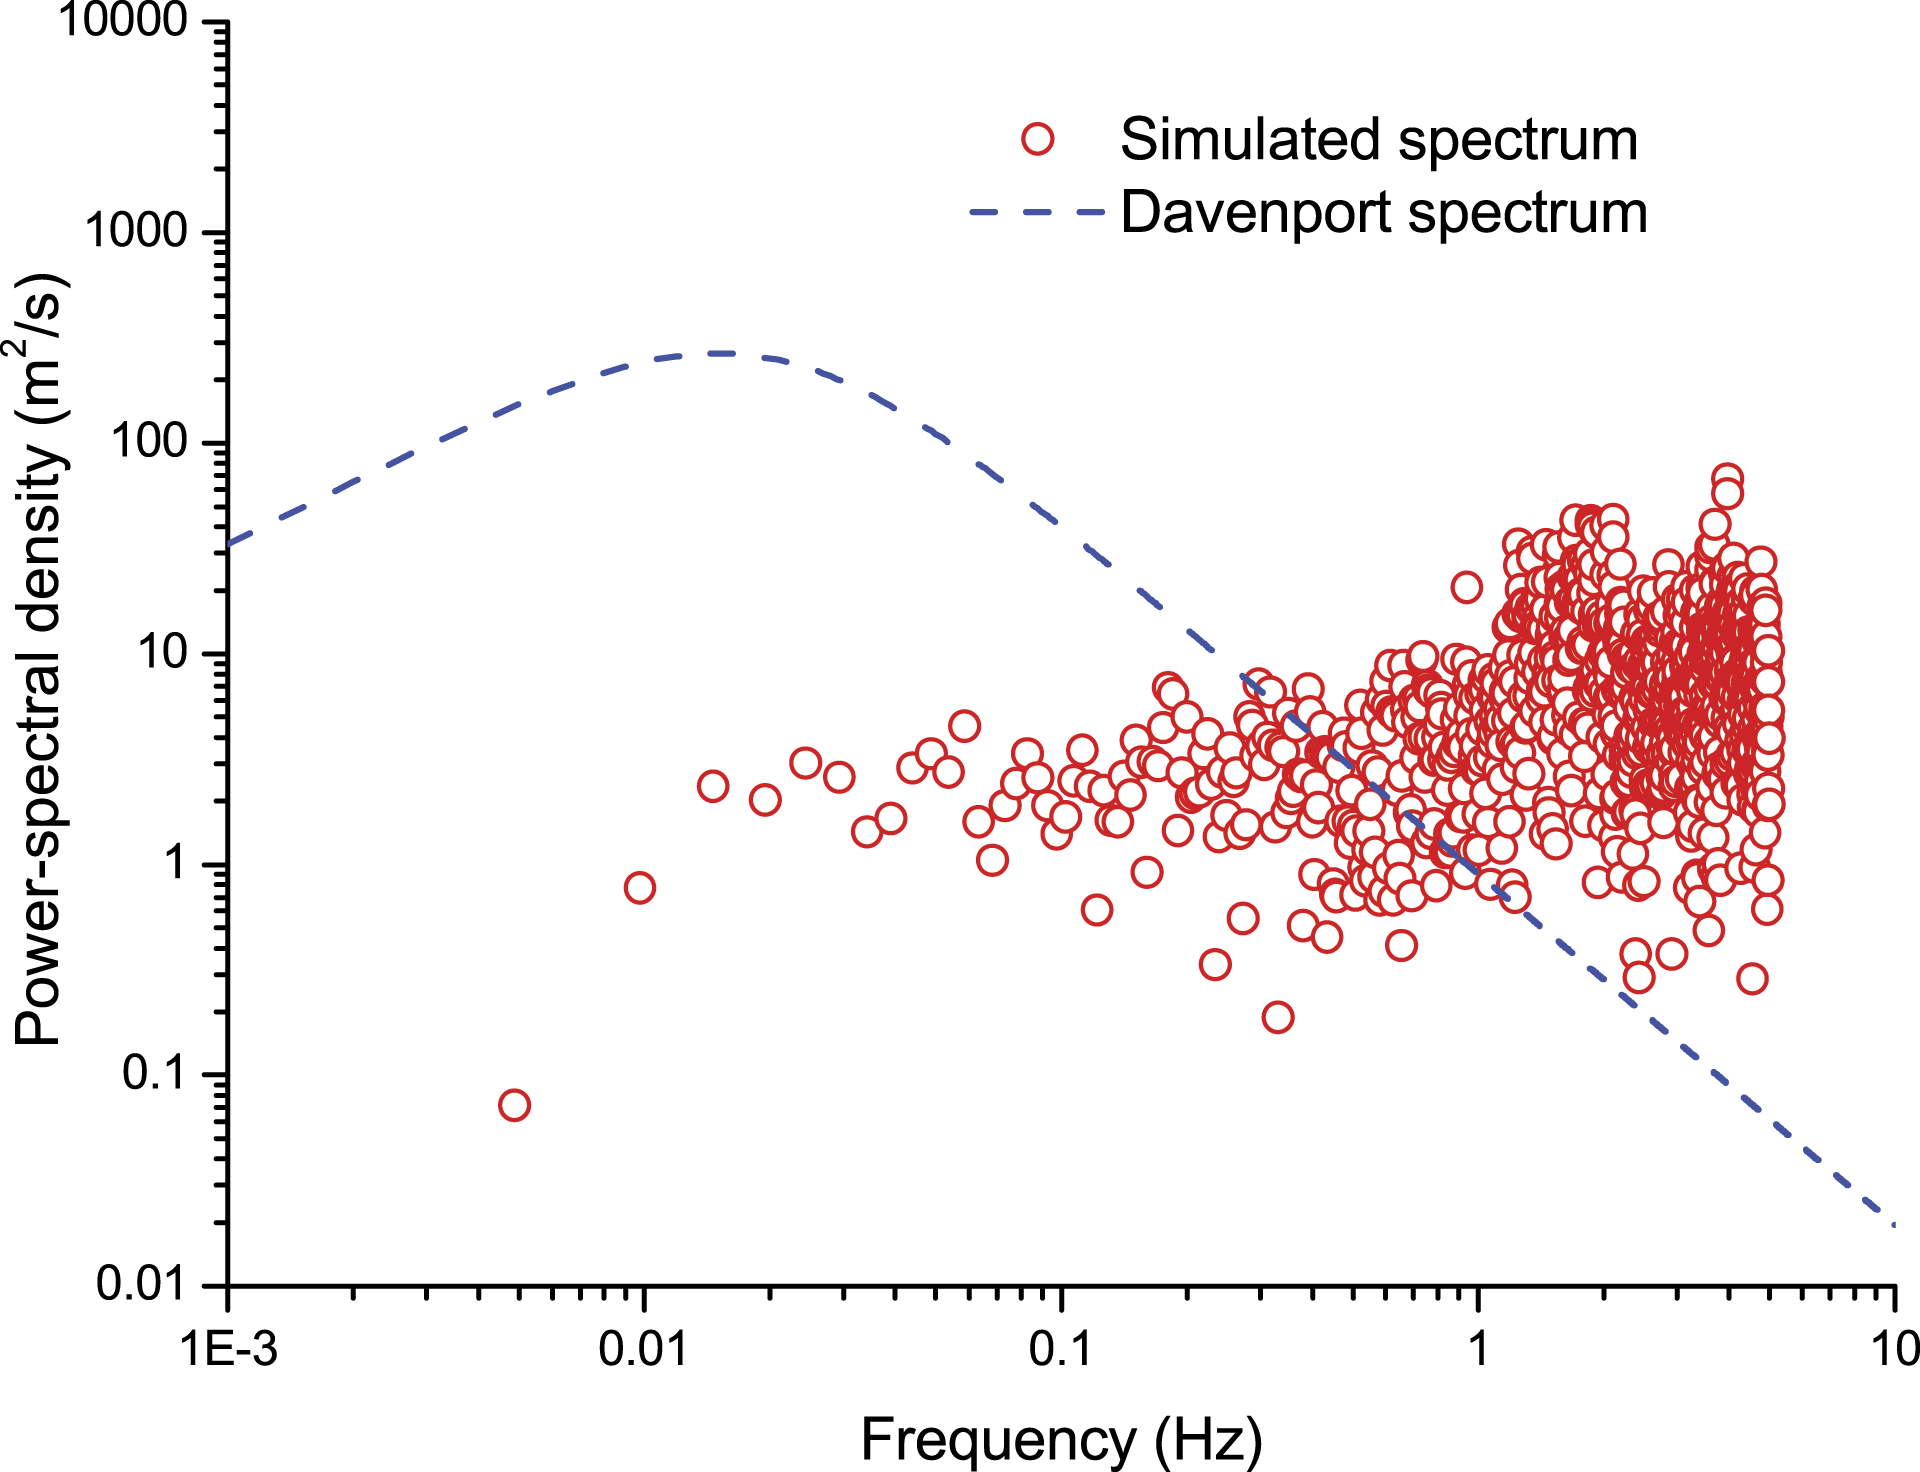
A wind velocity time history simulated at 54.5 m height and a comparison of its wind velocity spectrum with the Davenport spectrum are presented in Figures 8 and 9, respectively. It can be seen from Figure 9 that the simulated wind velocity spectrum is close to the simulation target in the frequency range of interest (0.1 Hz∼1 Hz). Afterward, assuming that the wind blows longitudinally, the 20-s fluctuating wind load samples acting at 20 positions on the Tsing Ma Bridge tower are calculated. Applying the calculated fluctuating wind loads, Tsing Ma Bridge tower’s dynamic performances under strong winds are estimated through the time-domain transient dynamic analyses based on the Newmark-β method. For this purpose, the initial developed FE model is used without model updating (cf. Section ‘FE modeling and initial modal analysis’), and a second FE model is also used. The latter is updated using the RS method with CCD (cf. Subsection ‘Model updating using the RS method’). A wind velocity sample simulated at 54.5 m height. The wind velocity spectrum simulated at the height of 54.5 m and the simulation target.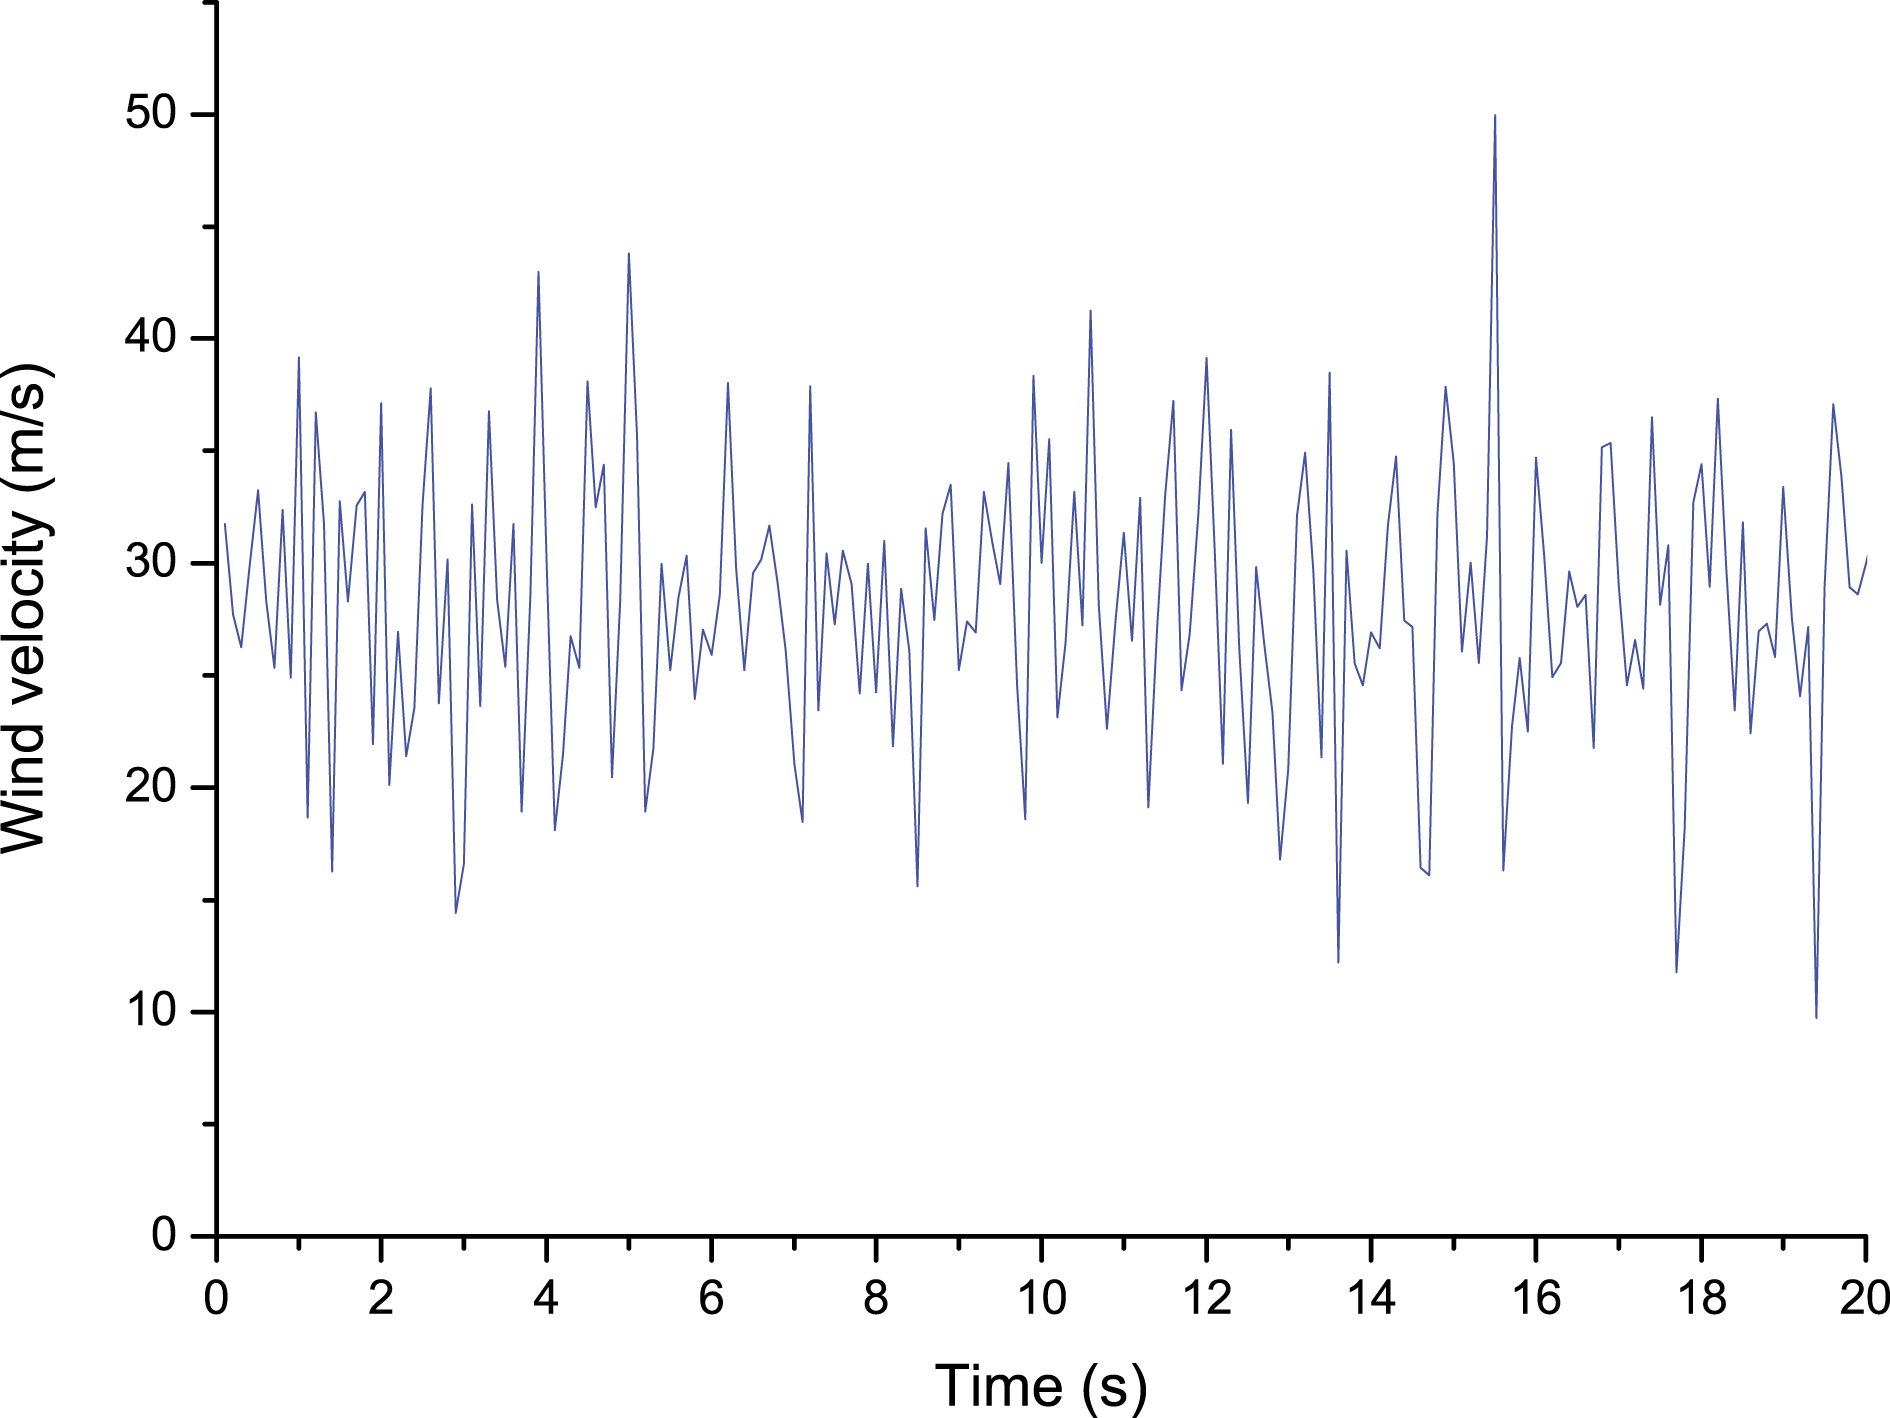
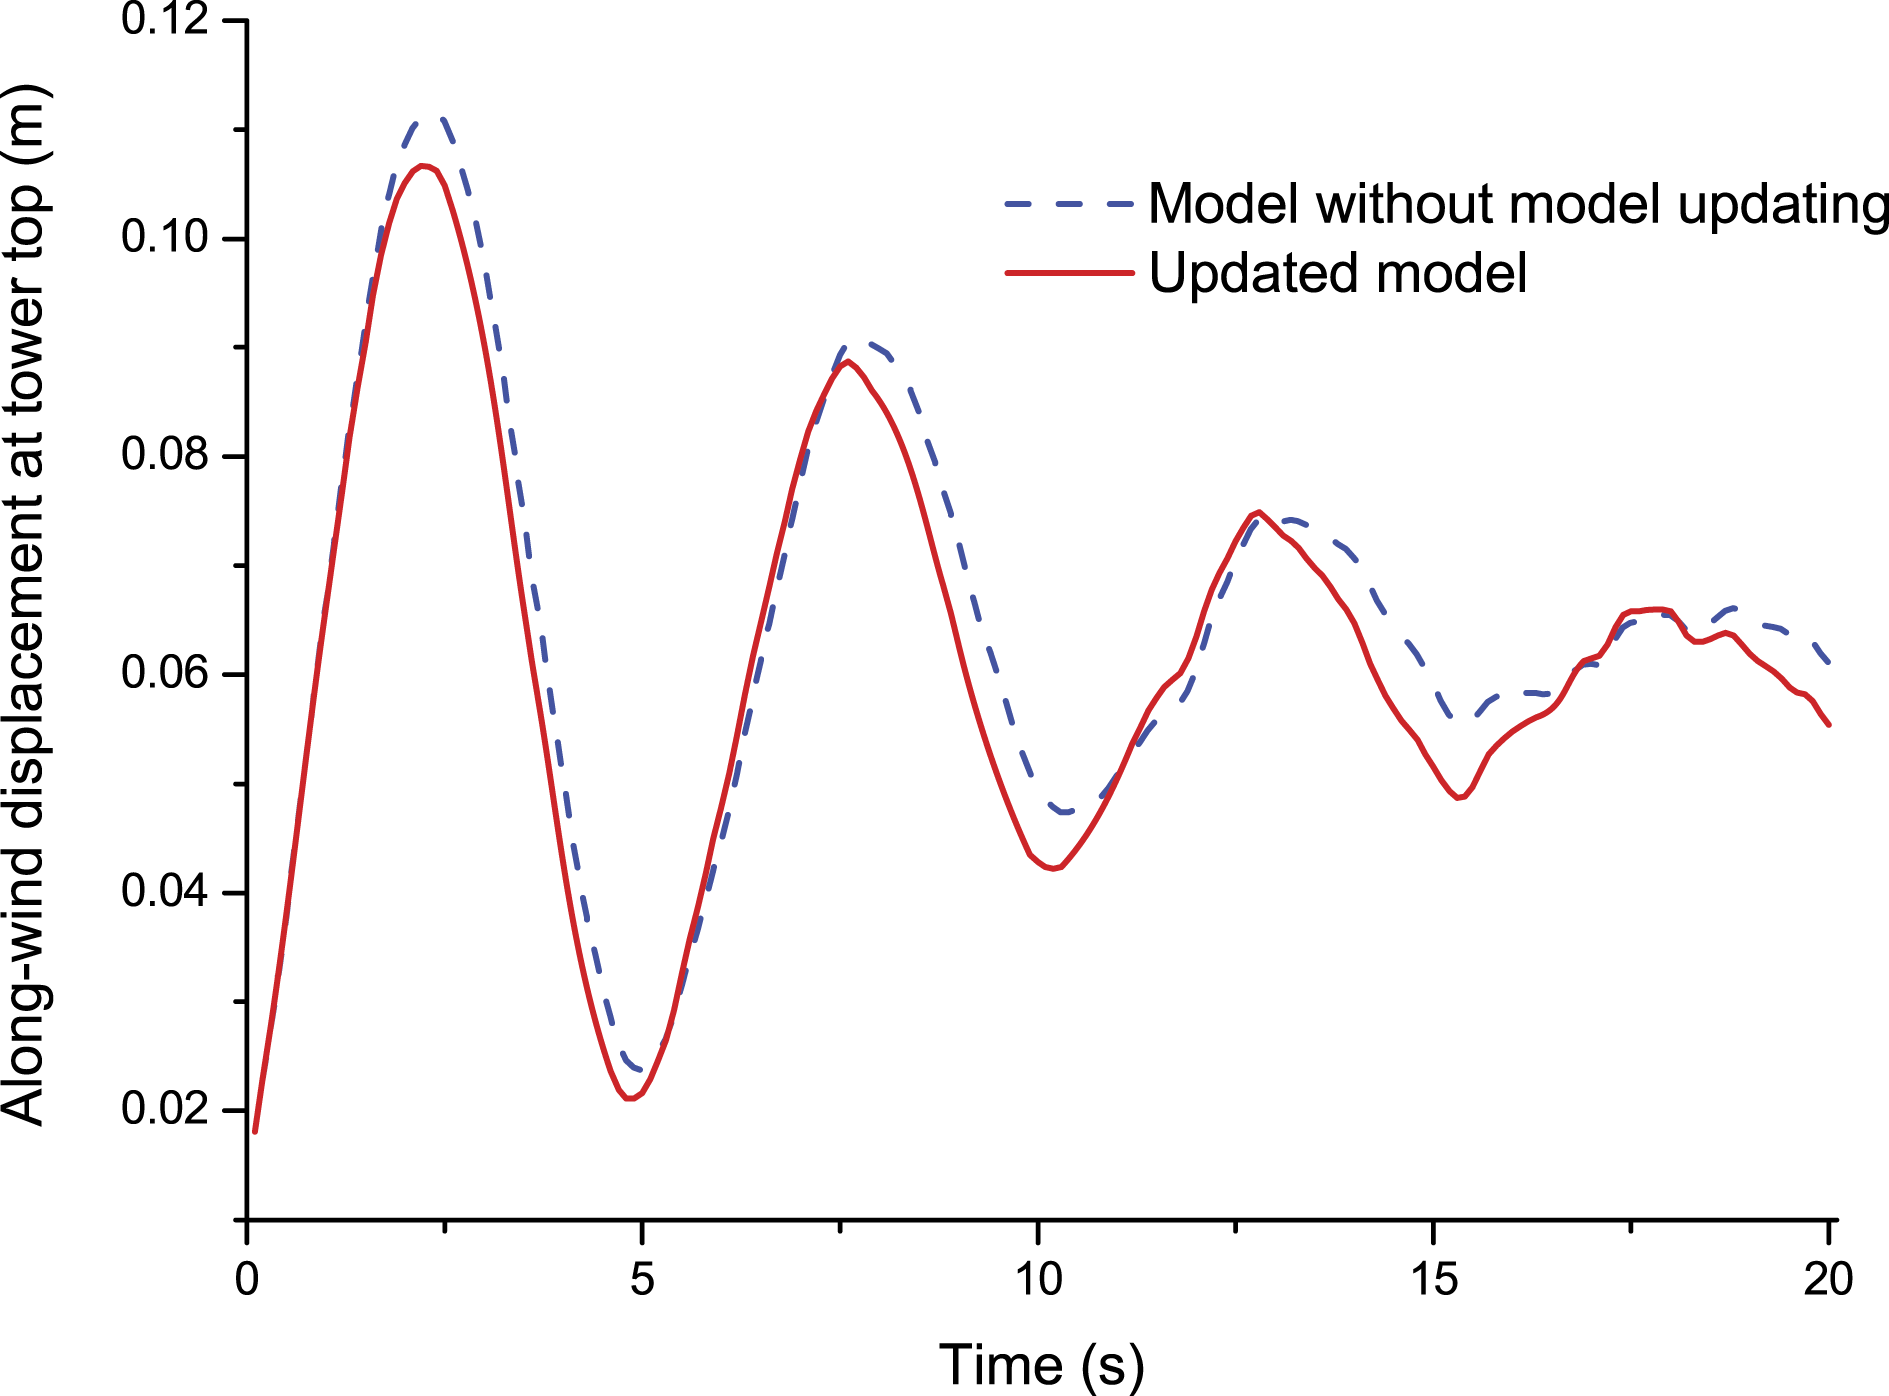
Figures 10 and 11 present some obtained results. It can be observed from Figure 10 that the wind-induced von Mises stress distribution on the Tsing Ma Bridge tower, obtained using the FE model without model updating (Figure 10(a)), is close to that obtained using the updated FE model (Figure 10(b)). However, the maximum wind-induced von Mises stress on the Tsing Ma Bridge tower is greater for the FE model without updating than for the updated FE model. A similar situation holds by comparing the along-wind displacement time histories calculated at the tower top using different models (cf. Figure 11). It can be seen from Figure 11 that the along-wind displacement response calculated using the model without updating is greater than that calculated using the updated model throughout the loading process. Hence, it can be deduced that the influence of model updating on the results of structural safety assessments is significant. Since the structural analysis employing the model without updating always leads to conservative structural safety assessments, it is essential to conduct model updating when establishing SHM-oriented civil structural FE models for proper structural analyses. Von Mises stress distributions calculated at 20 s (Pa). The along-wind displacement responses at the tower top, calculated using different models.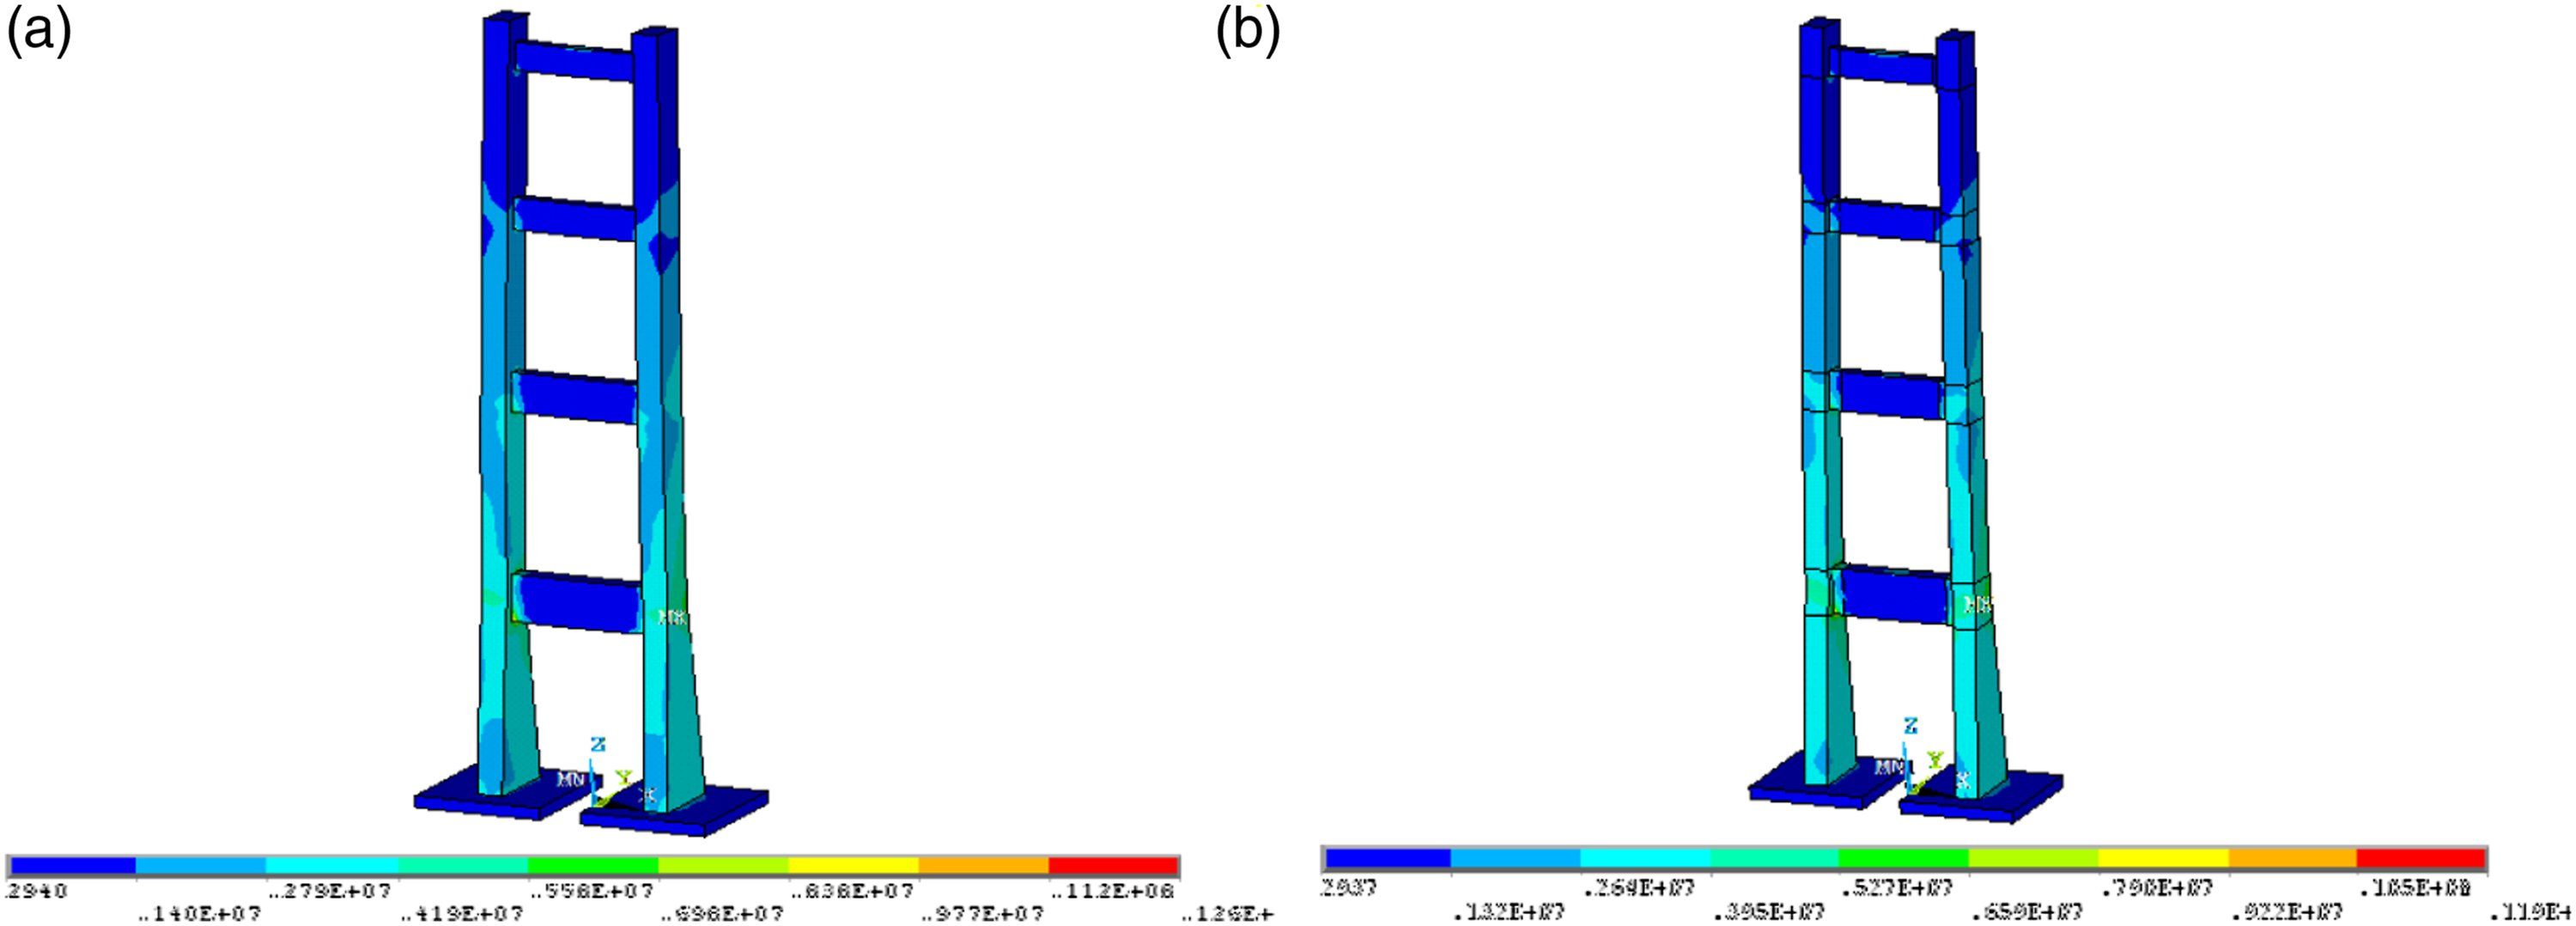
Conclusions
Under the engineering background of the Tsing Ma Bridge tower, this paper assessed the three surrogate model–based optimization algorithms in dynamic civil structural model updating. Accordingly, the following conclusions can be drawn: (1) Based on the considered example, it can be deduced that the effects of the surrogate model type on the model updating results are not noticeable. This is due to the fact that the efficiency of the model updated using the RS method is similar to that using the SVR method to reproduce the dynamic characteristics of the physical truth. This observation disagrees with the normal comprehension that the SVR method is more advanced than the RS method. (2) As for the influence of various sampling methods, it is deduced that the quality of model updated using the CCD sampling method is higher than that obtained with the BBD sampling technique. This observation is applicable to the case of model updating using the RS method (cf. Subsection ‘Model updating using the RS method’) and the case of model updating using the SVR method (cf. Subsection ‘Model updating using the SVR method’). Therefore, it can be concluded that the utilized sampling method is more important than the surrogate model type used in the context of the surrogate model–based dynamic FE model updating. With sufficient information provided by sampling, accurate model updating results can be obtained by the surrogate models established based on multiple model types (advanced or less sophisticated). (3) The experimental results show that the FE models updated using the RBFNN method are not decent for reproducing the dynamic characteristics of the physical truth. Thus, the RBFNN method is not a good selection for the FE model updating of large civil structures. This is due to the fact that the training of an effective RBFNN generally requires a large number of samples (usually more than 1000), greater than that presented by CCD and BBD (546 and 204 samples, respectively). This also indicates the importance of sampling for establishing effective surrogate models.
These conclusions are made based on an example of the Tsing Ma Bridge tower. In future work, more studies are required to evaluate the generalization of those conclusions to other examples.
Footnotes
Acknowledgments
The authors would like to express their gratitude to EditSprings (https://www.editsprings.com/) for the expert linguistic services provided.
Declaration of Conflicting Interests
The authors declare that there are no conflicts of interest regarding the publication of this article.
Funding
The author(s) disclosed receipt of the following financial support for the research, authorship, and/or publication of this article: The authors gratefully acknowledge the financial supports from the National Natural Science Foundation of China (Grant No. 51908124) and the China Postdoctoral Science Foundation (Grant No. 2016M601793).
A comparison between FE models established using various kinds of elements
Tetrahedral elements are known for their ability to model any geometry, as well as for their inaccuracy. Nevertheless, in this paper, tetrahedron elements are used rather than hexahedron elements. In fact, it was deduced that the adverse effects from using tetrahedral elements only exist in static analyses and transient analyses. For modal analyses, when the mass and stiffness distributions are correctly modeled for the structure, the obtained results will be accurate, regardless of the used type of element. To prove this, a comparison between FE models using different types of elements is performed.
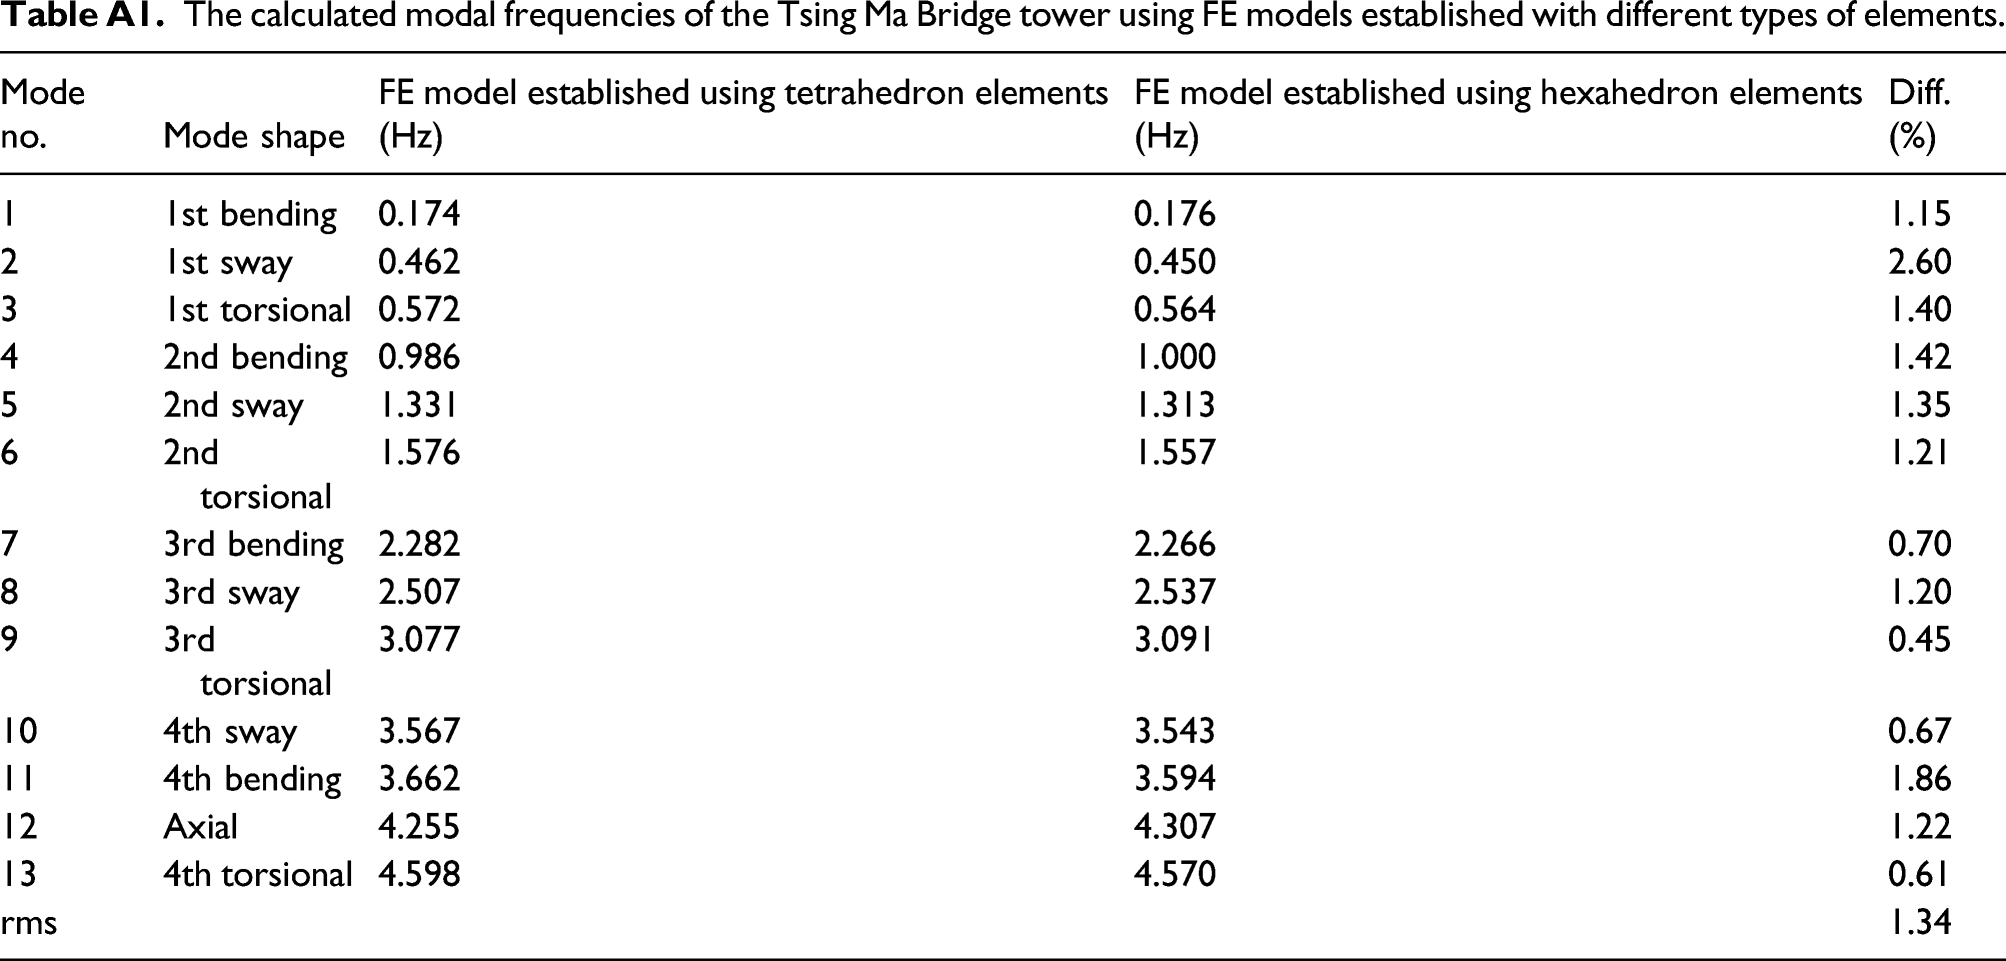
Two FE models of the Tsing Ma Bridge tower were established using different types of elements (tetrahedron elements and hexahedron elements). As shown in Figure A1, the two FE models are established with various types of elements, but with similar element sizes. The modal analysis is performed using the two models. The calculated modal frequencies of the Tsing Ma Bridge tower are shown in Table A1. It can be seen that the results obtained using the different models are close. This is due to the fact that the maximum relative difference between the two sets of modal frequencies is no greater than 3%, and the rms error among the first 13 modes only reaches 1.34%. This demonstrates that the influence of the element type on the modal analysis results is not noticeable for the Tsing Ma Bridge tower. The two FE models of the Tsing Ma Bridge tower established using different types of elements. The calculated modal frequencies of the Tsing Ma Bridge tower using FE models established with different types of elements.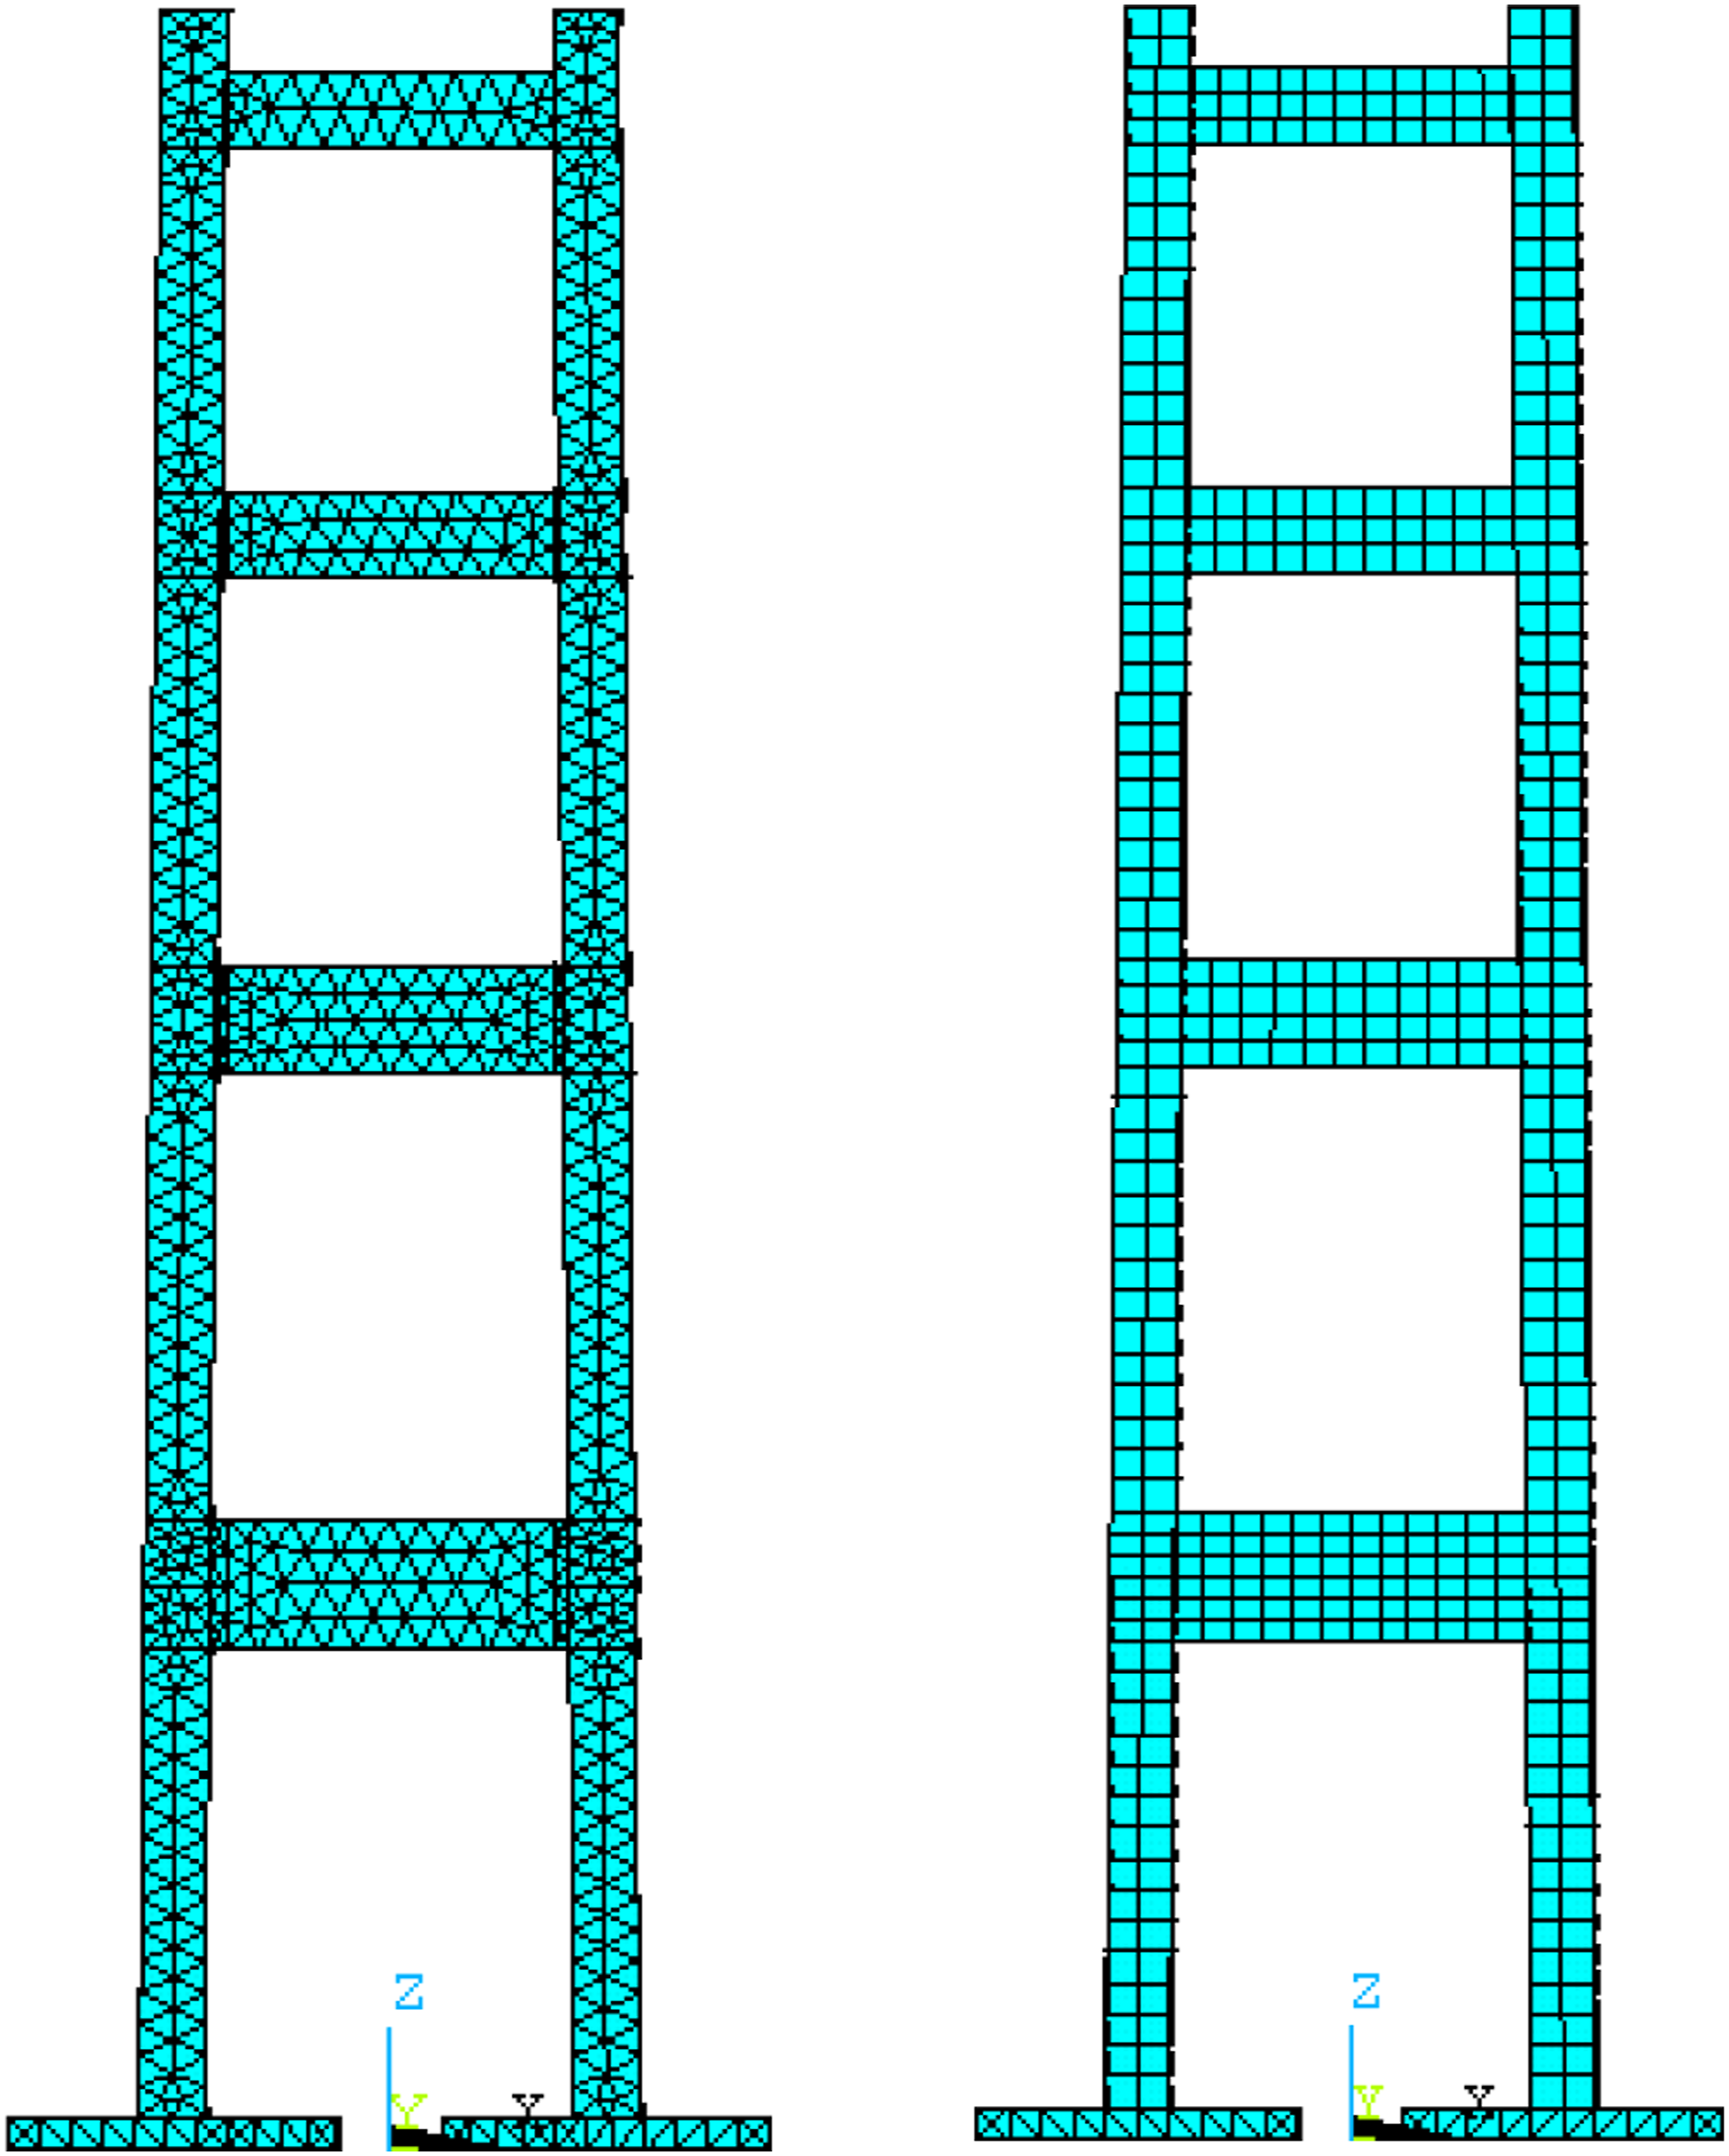
Mode no.
Mode shape
FE model established using tetrahedron elements (Hz)
FE model established using hexahedron elements (Hz)
Diff. (%)
1
1st bending
0.174
0.176
1.15
2
1st sway
0.462
0.450
2.60
3
1st torsional
0.572
0.564
1.40
4
2nd bending
0.986
1.000
1.42
5
2nd sway
1.331
1.313
1.35
6
2nd torsional
1.576
1.557
1.21
7
3rd bending
2.282
2.266
0.70
8
3rd sway
2.507
2.537
1.20
9
3rd torsional
3.077
3.091
0.45
10
4th sway
3.567
3.543
0.67
11
4th bending
3.662
3.594
1.86
12
Axial
4.255
4.307
1.22
13
4th torsional
4.598
4.570
0.61
rms
1.34
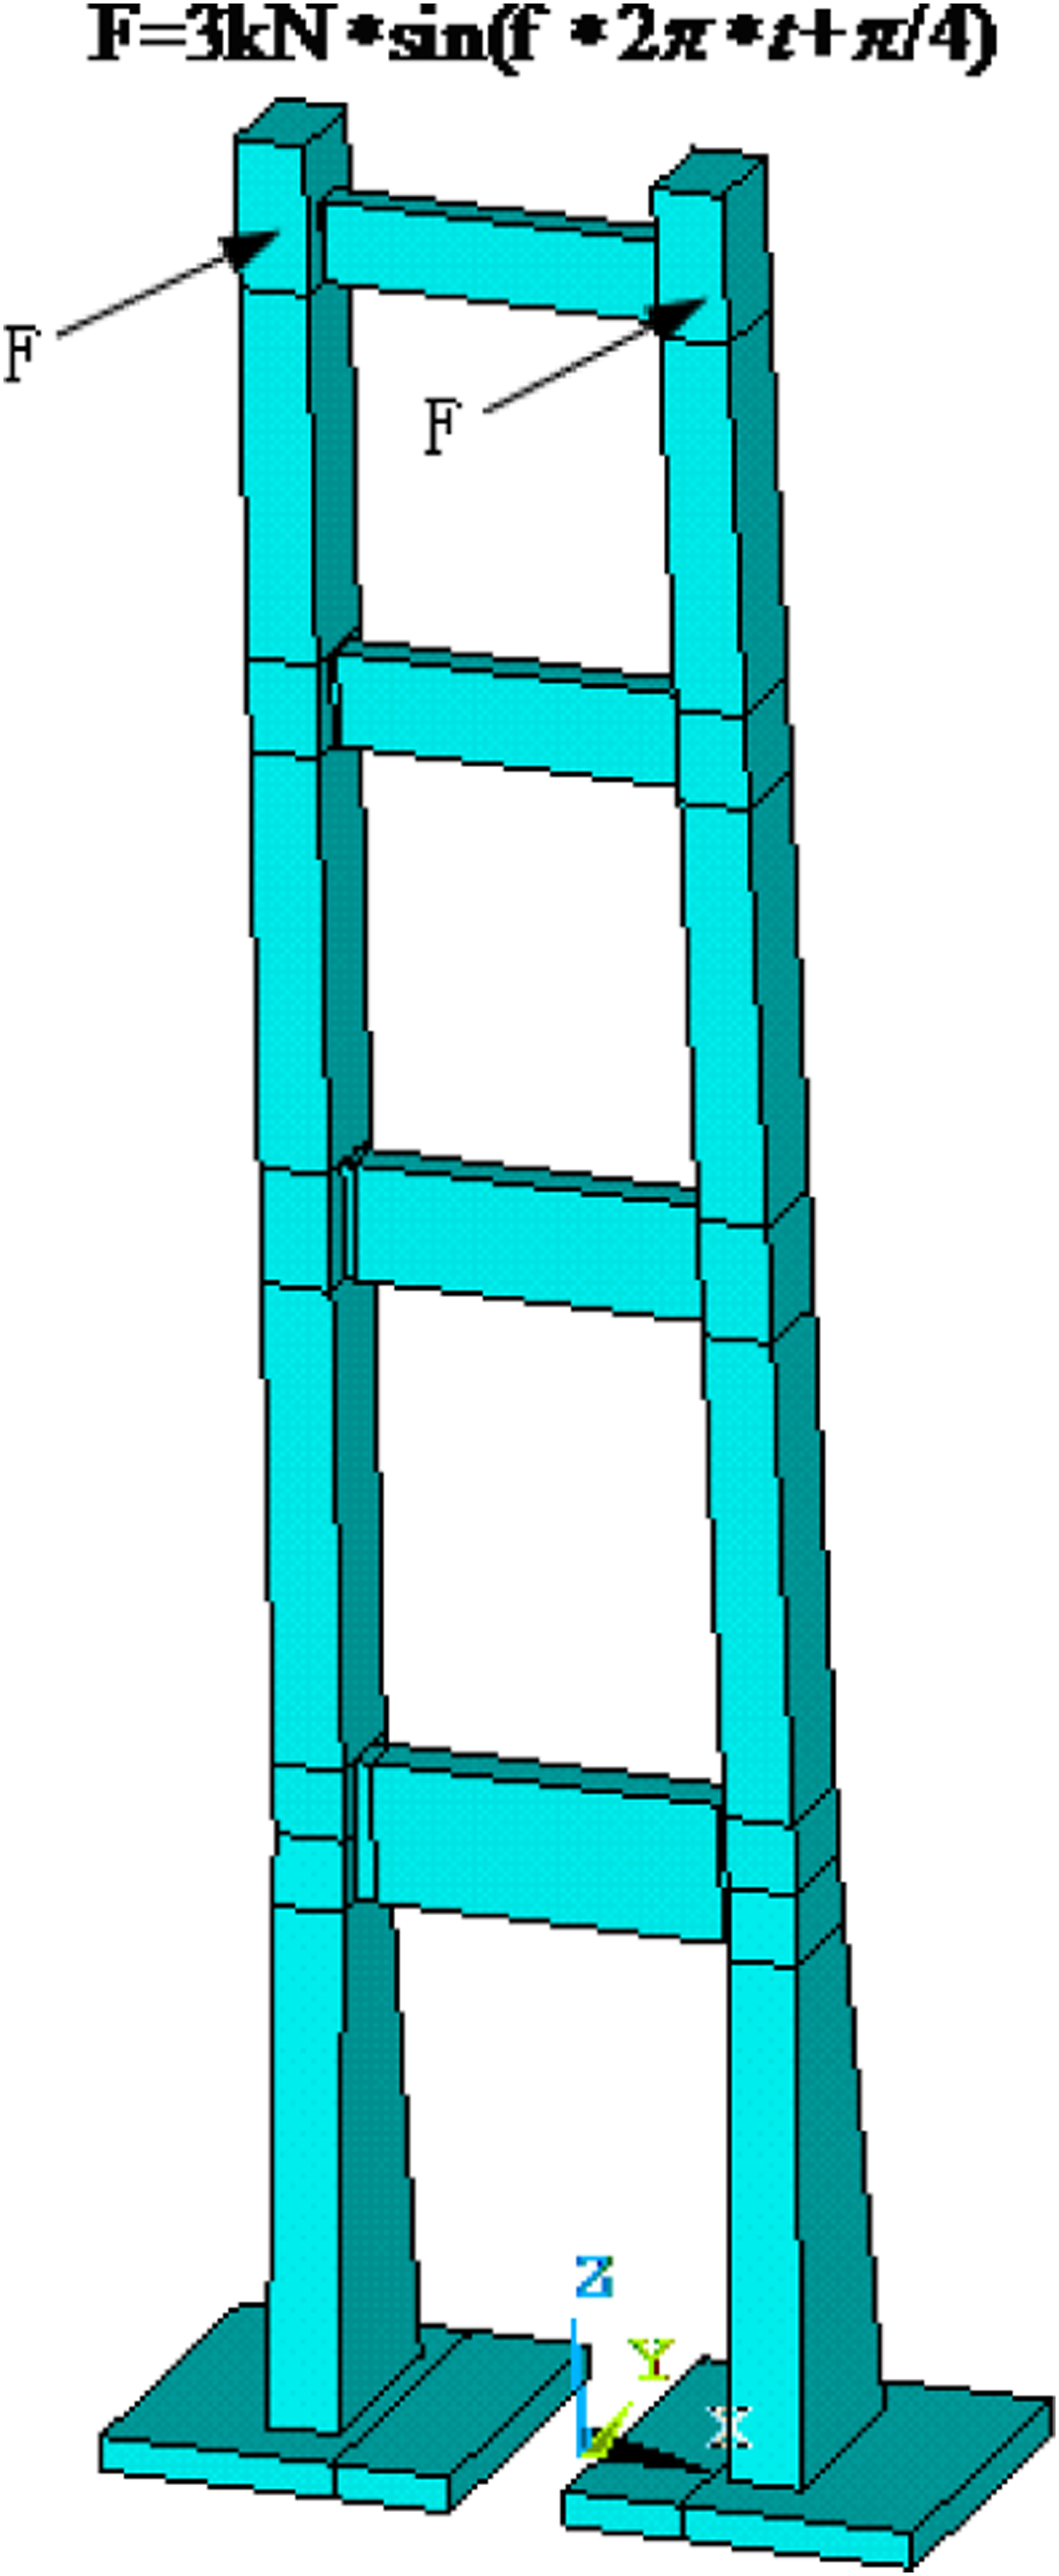
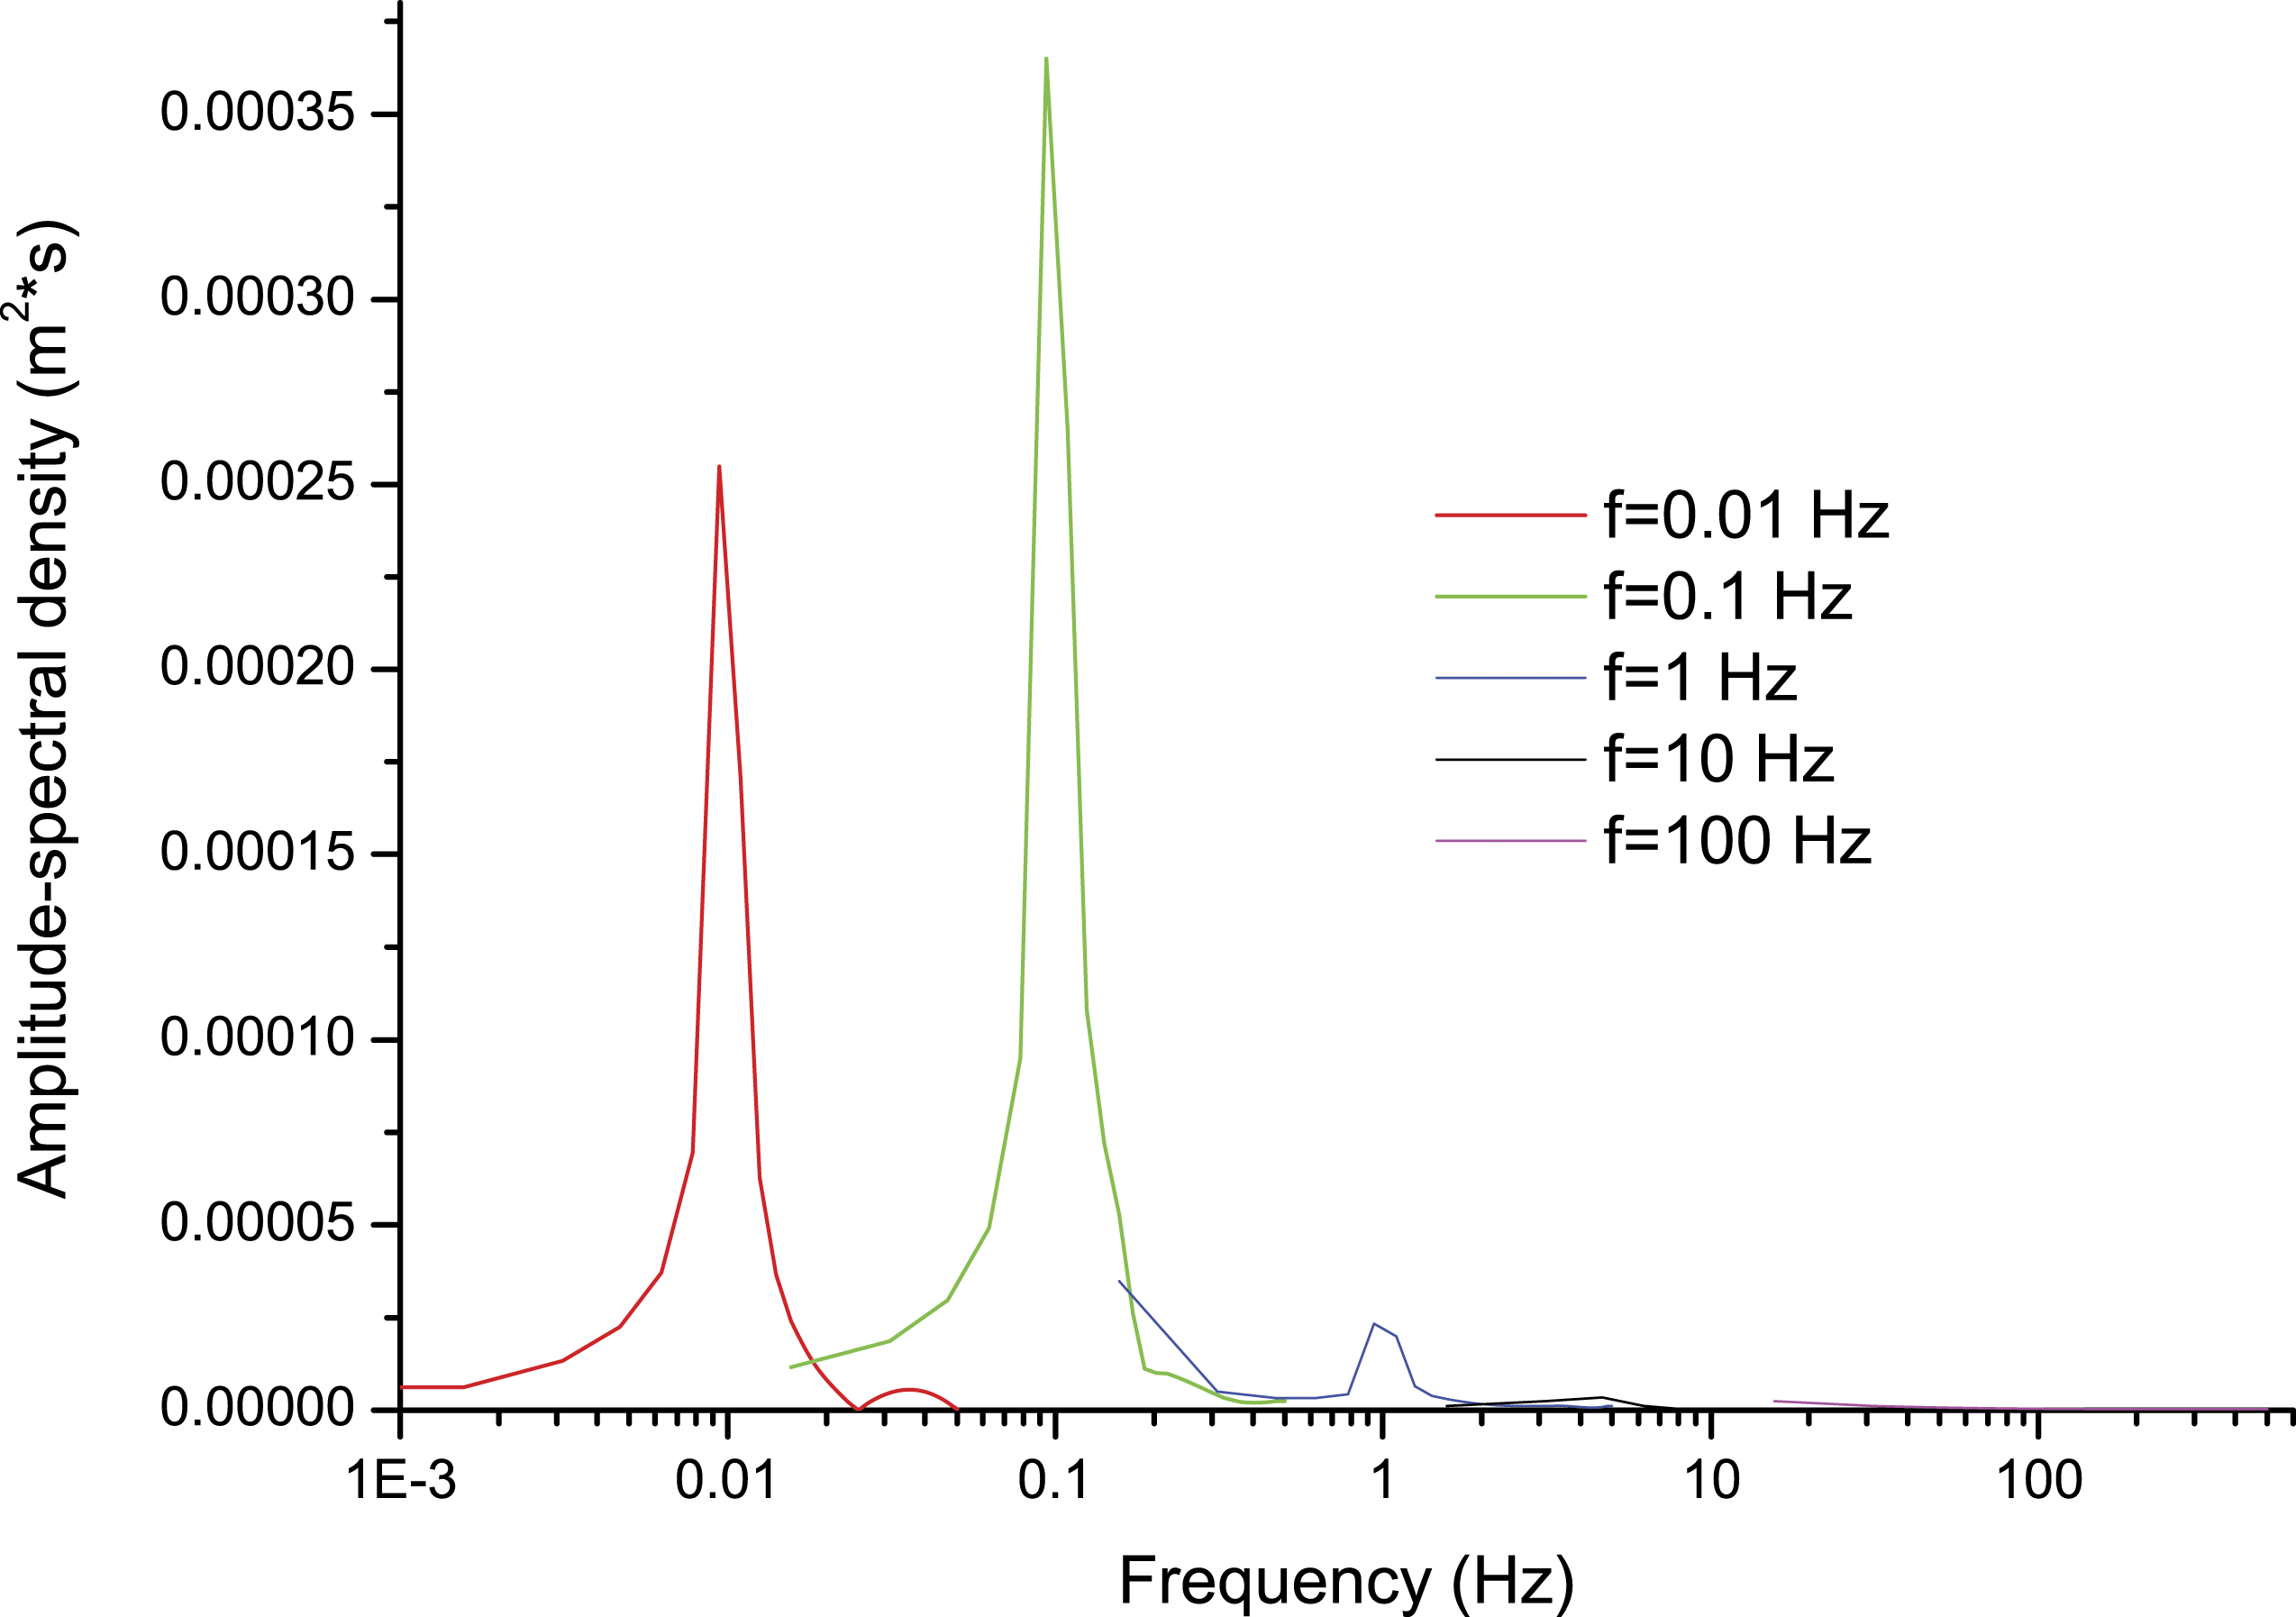
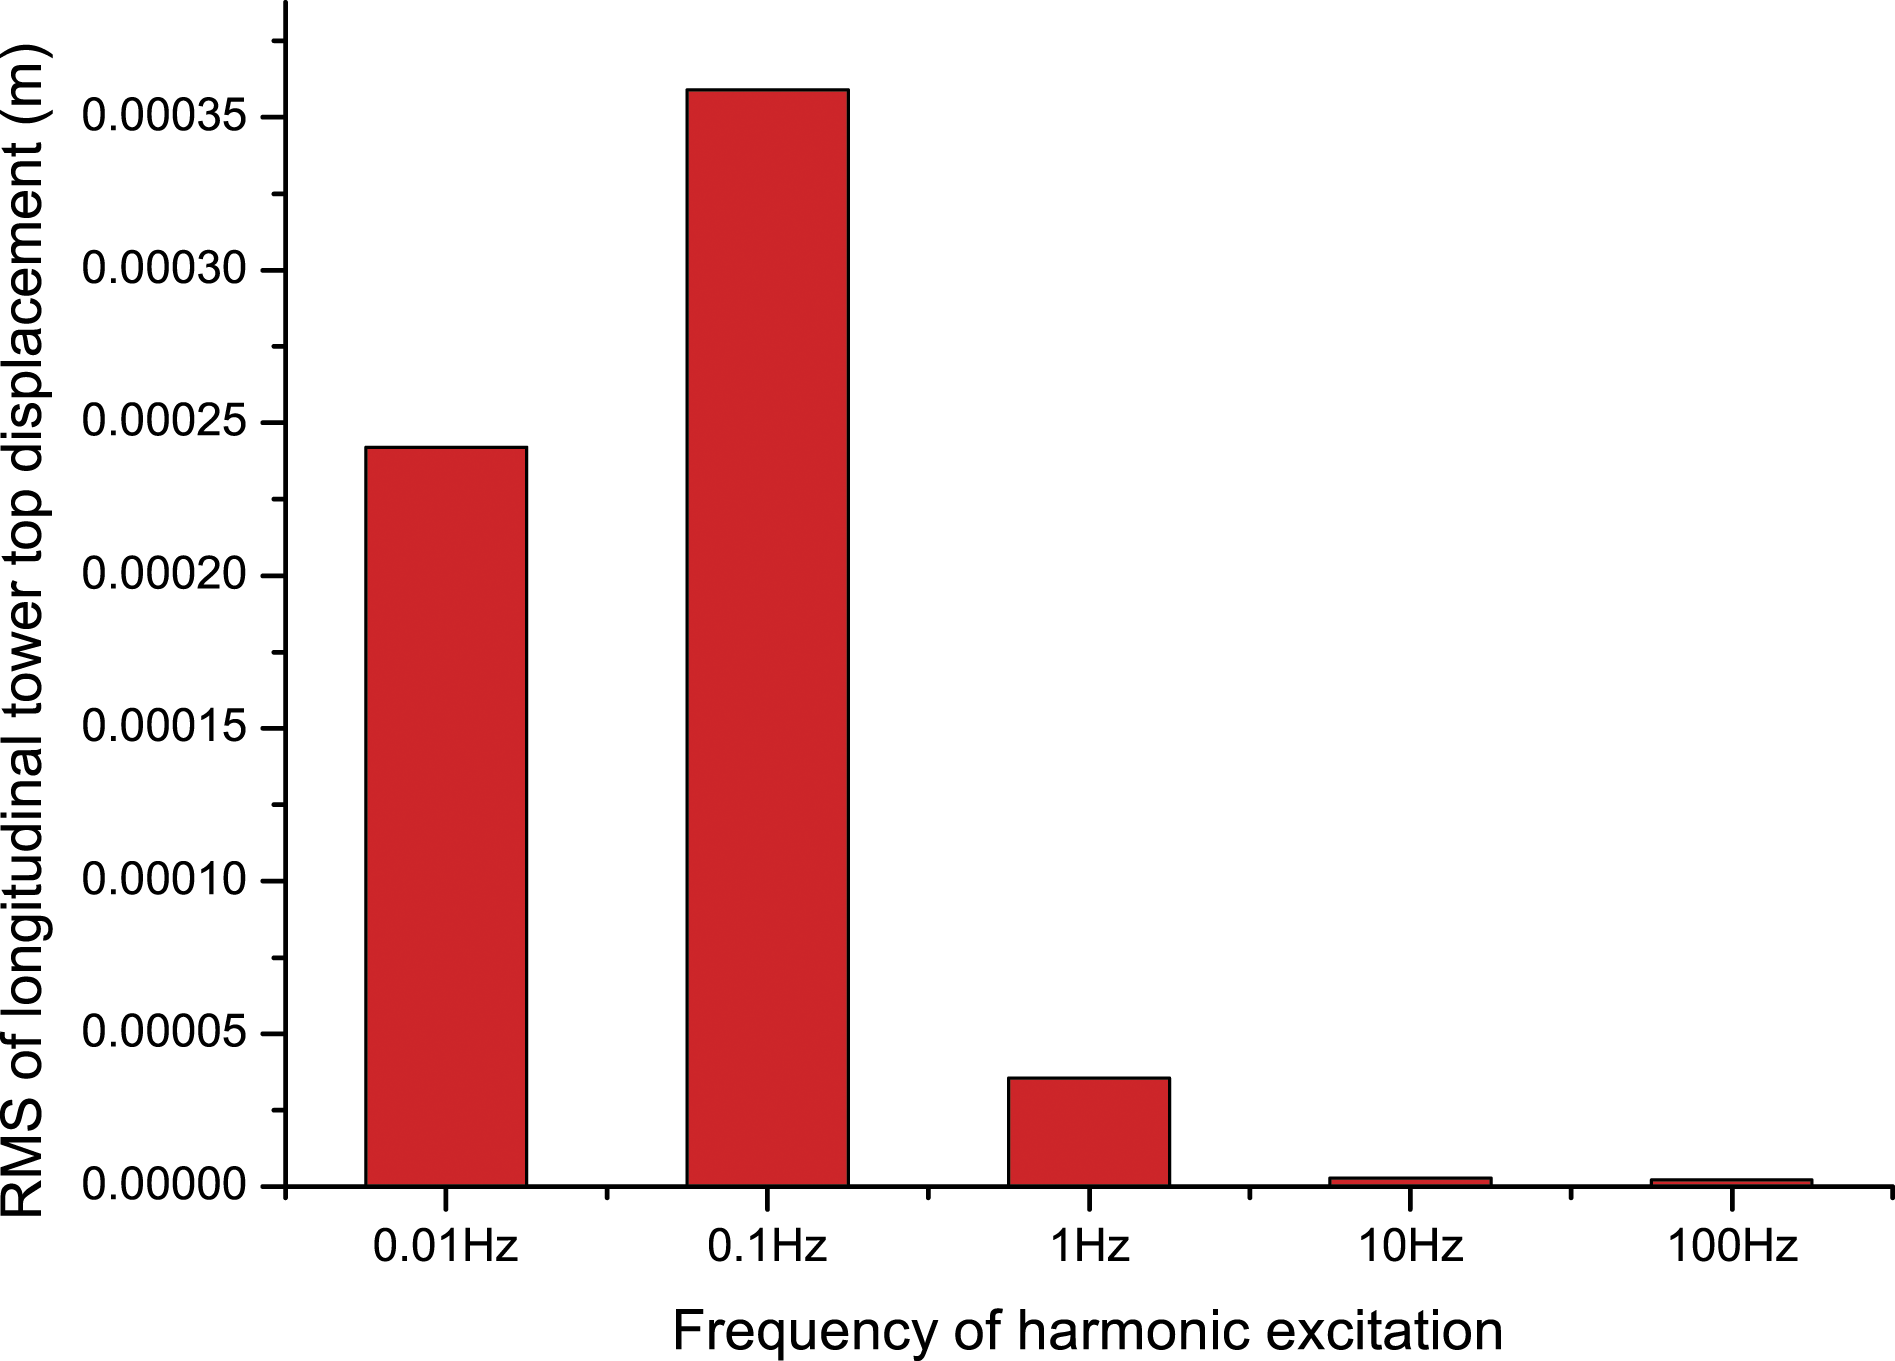
Frequency–amplitude relationship of the tower vibration
Using enhanced amplitude–frequency formulations for nonlinear oscillators,21–23 some researchers found that the low frequency always results in a large vibration amplitude in several cases, such as capillary vibration
24
and Fangzhu oscillator,25,26 for example. Therefore, the frequency–amplitude relationship of the Tsing Ma Bridge tower should be a crucial issue. Hence, this matter of science is investigated in this paper. Using the FE model of the Tsing Ma Bridge tower without model updating, the dynamic behaviors of the structure under harmonic excitations of different frequencies are calculated. As shown in Figure A2, two variable longitudinal forces (which can be formulated by equation (A1)) are exerted on the top of the Tsing Ma Bridge tower model. In equations (A1), F is the variable force, t is the time, and f denotes the frequency of the harmonic excitation. Five harmonic excitations of different frequencies are obtained by setting f to 0.01 Hz, 0.1 Hz, 1 Hz, 10 Hz, and 100 Hz. The dynamic structural responses of the Tsing Ma Bridge tower are calculated by exerting the five harmonic excitations to the FE model. The corresponding results are presented in Figures A3 and A4. It can be seen from Figure A3 that the highest amplitude–spectral density of the longitudinal displacement at the top of the tower exists for the tower excited by the harmonic excitation of 0.1 Hz frequency. By increasing the frequency of the harmonic excitation, the amplitude–spectral density becomes smaller. This indicates that the vibrating energy with the Tsing Ma Bridge tower in motion becomes greater by reducing the frequency of the excitation, in the range [0.1, 100 Hz]. It can be seen from Figure A4 that by decreasing the frequency of the excitation in the frequency range [0.1, 100 Hz], the rms of longitudinal tower top displacements generally becomes larger. Hence, it is deduced that the frequency–amplitude rule found in the literature can be applied to the Tsing Ma Bridge tower. However, a different observation is noticed by comparing 0.01 Hz and 0.1 Hz harmonic excitations (cf. Figures A3 and A4). That is, the low frequency leads to a smaller vibration amplitude. This is due to the fact that the fundamental frequency of the Tsing Ma Bridge tower is close to 0.1 Hz (cf. Table 1), and the stronger resonance can be excited by the harmonic excitation of 0.1 Hz, compared to the harmonic excitation of 0.01 Hz. Therefore, the knowledge hidden behind the frequency–amplitude rule found in literatures is that the stronger resonance might be excited by lower frequency excitations for objects with low fundamental frequencies, such as the Fangzhu oscillator and capillary vibration Tsing Ma Bridge tower undertaking harmonic excitations on the tower top. Amplitude–spectral densities of the longitudinal displacements of the top of the tower, excited by harmonic excitations of different frequencies. rms of longitudinal tower top displacements for harmonic excitations of different frequencies.