
Abstract
This study proposes an algorithm for autonomous modal estimation to automatically eliminate false modes and quantify the uncertainty caused by the clustering algorithm and ambient factors. This algorithm belongs to the stochastic subspace identification (SSI) techniques and is based on the Block-Bootstrap and multi-stage clustering analysis. First, the Block-Bootstrap is introduced to decompose the response signal of the structure into M blocks of data. The covariance-driven stochastic subspace identification (SSI-Cov) method is used to process a random sample of data and obtain the corresponding M stabilization diagrams. In addition, the hierarchical clustering method is adopted to carry out the secondary clustering of the picked stable axis according to the defined distance threshold. Then, false modes are eliminated according to the proposed true and false modal discrimination index (MDI). Finally, the above steps are repeated B times, and MDI is used to modify the initial modal parameters of group B. The mean value of elements in the cluster is taken as the recognition result of modal parameters, and the standard deviation is used to measure the accuracy of the recognition result. The numerical simulation results and the modal parameter identification of the Jing-yuan Yellow River Bridge show that, for identifying true and false modals, the proposed modal discrimination index is more effective than the threshold value of the traditional index. Also, it was found that the proposed method can eliminate the uncertainty introduced in the clustering process. In addition, this method can remove the influence of ambient noises, and it can improve the identification accuracy. It will be shown that this method has better anti-noise performance.
Keywords
Introduction
The dynamic parameters of a structure are deeply related to its mechanical properties. To identify structural problems, such as excessive vibration, or to perform the structural evaluation, the dynamic measurements are continuously monitored in the structural health monitoring system. 1 Stochastic subspace identification (SSI) is a widely used method for time-domain modal identification under ambient excitation. However, in the process of modal identification, both system order determination and false modes elimination need manual intervention because real modes could be missed, and false modes could be introduced. Therefore, the requirement of a real-time modal parameter identification in structural health monitoring systems may not be met. 2 In the application of massive bridge health monitoring, these problems make real-time analysis of data a difficult task, which becomes one of the bottlenecks in developing health monitoring technology. 3
In the past 10 years, automated procedures of output-only modal identifications have attracted extensive attention so that the objective of automatic modal parameters identification has been gradually fulfilled. In most methods, the realization of automatic modal parameters identification mainly relies on the fuzzy clustering technique. 4 Mao et al. 5 set the clustering parameter in advance and used the principal component analysis and the K-means clustering method to realize the automatic modal parameters identification of the Su-Tong cable-stayed bridge. Neu et al. 6 proposed an automatic modal identification technique based on multi-stage clustering. They improved the accuracy and robustness of the automatic modal parameters identification by introducing clustering feature vectors to separate physical and false modes. However, there is no firm conclusion on how to determine the number of clusters. He et al. 7 proposed an automatic identification method of the stabilization diagram to avoid data classification errors caused by setting incorrect clustering numbers. The proposed method in the present study, which is based on the improved two-stage Fuzzy C-means clustering (FCM) algorithm, uses the improved image segmentation algorithm to perform more accurate automation of online recognition of modal parameters.
To avoid the influence of artificially determining the number of clustering on the identification result, the hierarchical clustering can also adaptively select the final number of clustering according to the situation of the stabilization diagram. The hierarchical clustering mainly focuses on how to determine the truncation criterion of layered trees. 4 Sun et al. 8 defined a new threshold value of the hierarchical clustering based on the automatic and robust modal analysis algorithm. Based on the multi-stage clustering, the modal parameters are automatically identified from the vibration data of full-size cable-stayed bridges so that the accuracy of the identification results is improved. Cabboi et al. 9 applied the hierarchical clustering to the automatic recognition of stabilization diagrams and realized the automatic modal parameters identification by introducing adaptive dynamic threshold. De Almeida et al. 10 improved the calculation method of the distance between various modes in the clustering process and solved the problem of setting the distance threshold. Tang et al. 11 used the modal similarity index and modal energy to eliminate false modes. They also introduced the pedigree clustering algorithm to conduct an automatic analysis of modal parameters. However, this algorithm still needs to set calculating weight distance threshold. In the meantime, it should be noted that in the case of a large amount of observed data, the computational workload of the hierarchical clustering method increases exponentially.
Despite advanced methods, estimation of modal parameters is always accompanied by uncertainties, which can be attributed to several factors, including noisy measurements, complexities inherent in a structure, and modeling errors. Remarkably, the common practice is to provide the estimated modal parameters as they are, without providing any means to validate the accuracy of these estimations. 12 Chauhan et al. 13 introduced bootstrap sampling into the process of modal parameter estimation and elaborated the characteristics of bootstrap sampling and its feasible application in the uncertainty quantification of the modal parameter identification.
Therefore, the present paper introduces the Block-Bootstrap sampling and the multi-stage clustering algorithm and proposes a new automatic modal parameters identification method and an uncertainty quantification method based on the covariance-driven stochastic subspace identification (SSI-Cov) method. The stable axis is automatically obtained by the multi-stage clustering and real, and false modal parameters are identified by defining false modal parameters. The Block-Bootstrap re-sampling is used to eliminate the uncertainty introduced in the clustering process and to eliminate ambient noises’ influence. In addition, the standard deviation is used to evaluate the stability of the recognition results. Finally, the numerical simulation and modal parameter identification of the Jing-yuan Yellow River Bridge are used to verify the feasibility and reliability of the proposed method.
Covariance-driven stochastic subspace identification (SSI-Cov)
The SSI algorithm,
14
which is based on the discrete state-space equation, is an efficient method to estimate the state matrix (A) and the discrete output matrix (C) of the structural system from the measured signal response data. Then, the modal frequency, modal damping, and modal shape are extracted from the state-space matrices. There are various types of SSI algorithm such as data-driven, covariance-driven types, and others that are based on the reference stochastic subspace algorithm. In the present paper, the SSI-Cov method, as described in detail in Overschee and Moor,
15
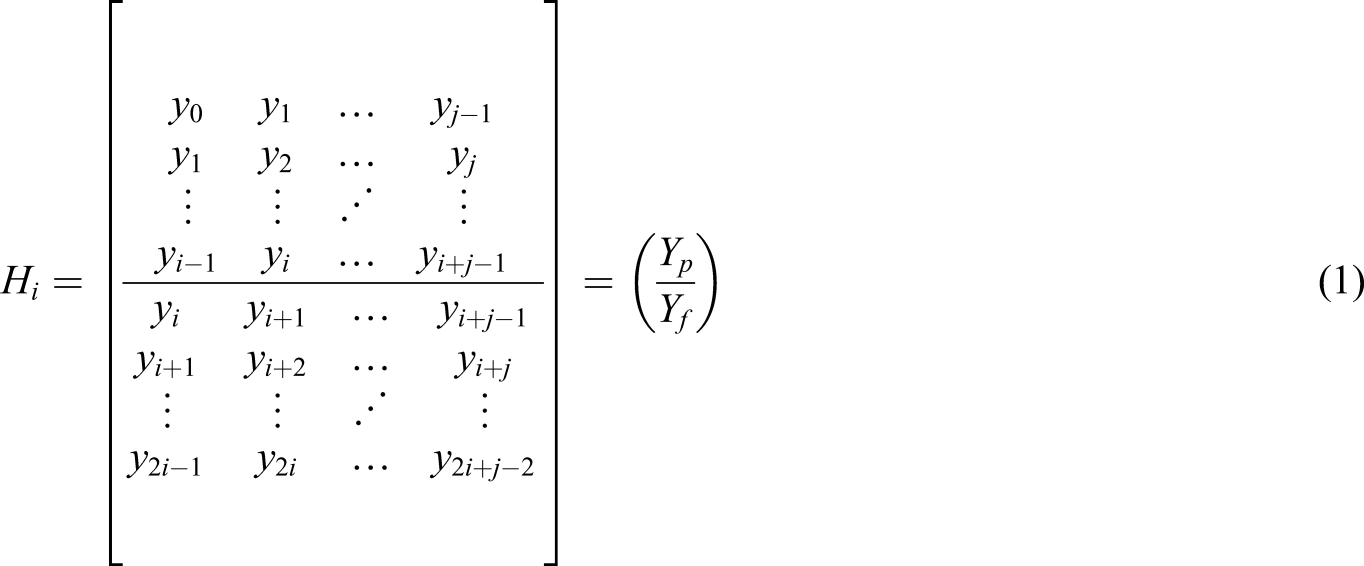
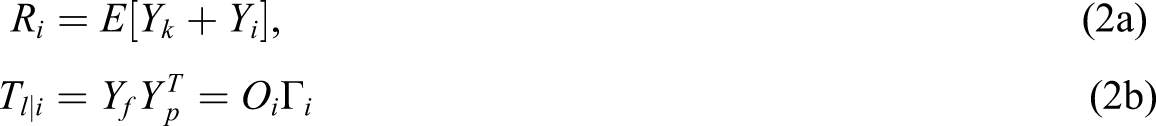
is used. The SSI-Cov algorithm consists of the following steps: (1) organization of the output response of the structure, (2) computation of the output covariance and construction of the block Toeplitz matrix, (3) decomposition of the Toeplitz matrix, (4) estimation of the controllability and observability matrices, and (5) extraction of modal parameters. These steps are elaborately explained in the following section. First, the block Hankel matrix is defined as
Then, the singular value decomposition of the Toeplitz matrix can be obtained, as shown in equation (3), which implicitly implies choosing the order of the system (n). Theoretically, the number of nonzero singular values is equal to n

Finally, the main results of the SSI-Cov method are yielded by the eigenvalue decomposition of the system state matrix as

Automatic modal parameters identification and uncertainty quantification
To automatically eliminate a false mode and quantify the uncertainty caused by the clustering algorithm and ambient factors, this study proposes an autonomous modal estimation algorithm, which belongs to the SSI methods and is based on the re-sampling technique and multi-stage clustering analysis. The detailed calculation process is as follows:
Data partitioning and modal parameters identification based on SSI
Since the structural response signal collected in the vibration test is continuous time series, the data of a certain sampling time are taken as the input of the modal analysis, in which the data are correlated. As the data need to meet the relevant requirements of the signal analysis and processing, during re-sampling, it is necessary to ensure that all data blocks are extracted in the same cell or region. Thus, in this section, a Block-Bootstrap sampling algorithm 16 is adopted to ensure that all data blocks are extracted in the same unit.
First, the Block-Bootstrap method splits the acceleration data in one measurement point (Y1, …, Y
t
), in which t is the length of signal, into non-overlapping blocks of size b, Yi = (Y
i
, …, Y
i+b-1
). These data constitute a set of
The SSI-Cov method is used to process the data An example of the principle of the non-overlapping Block-Bootstrap.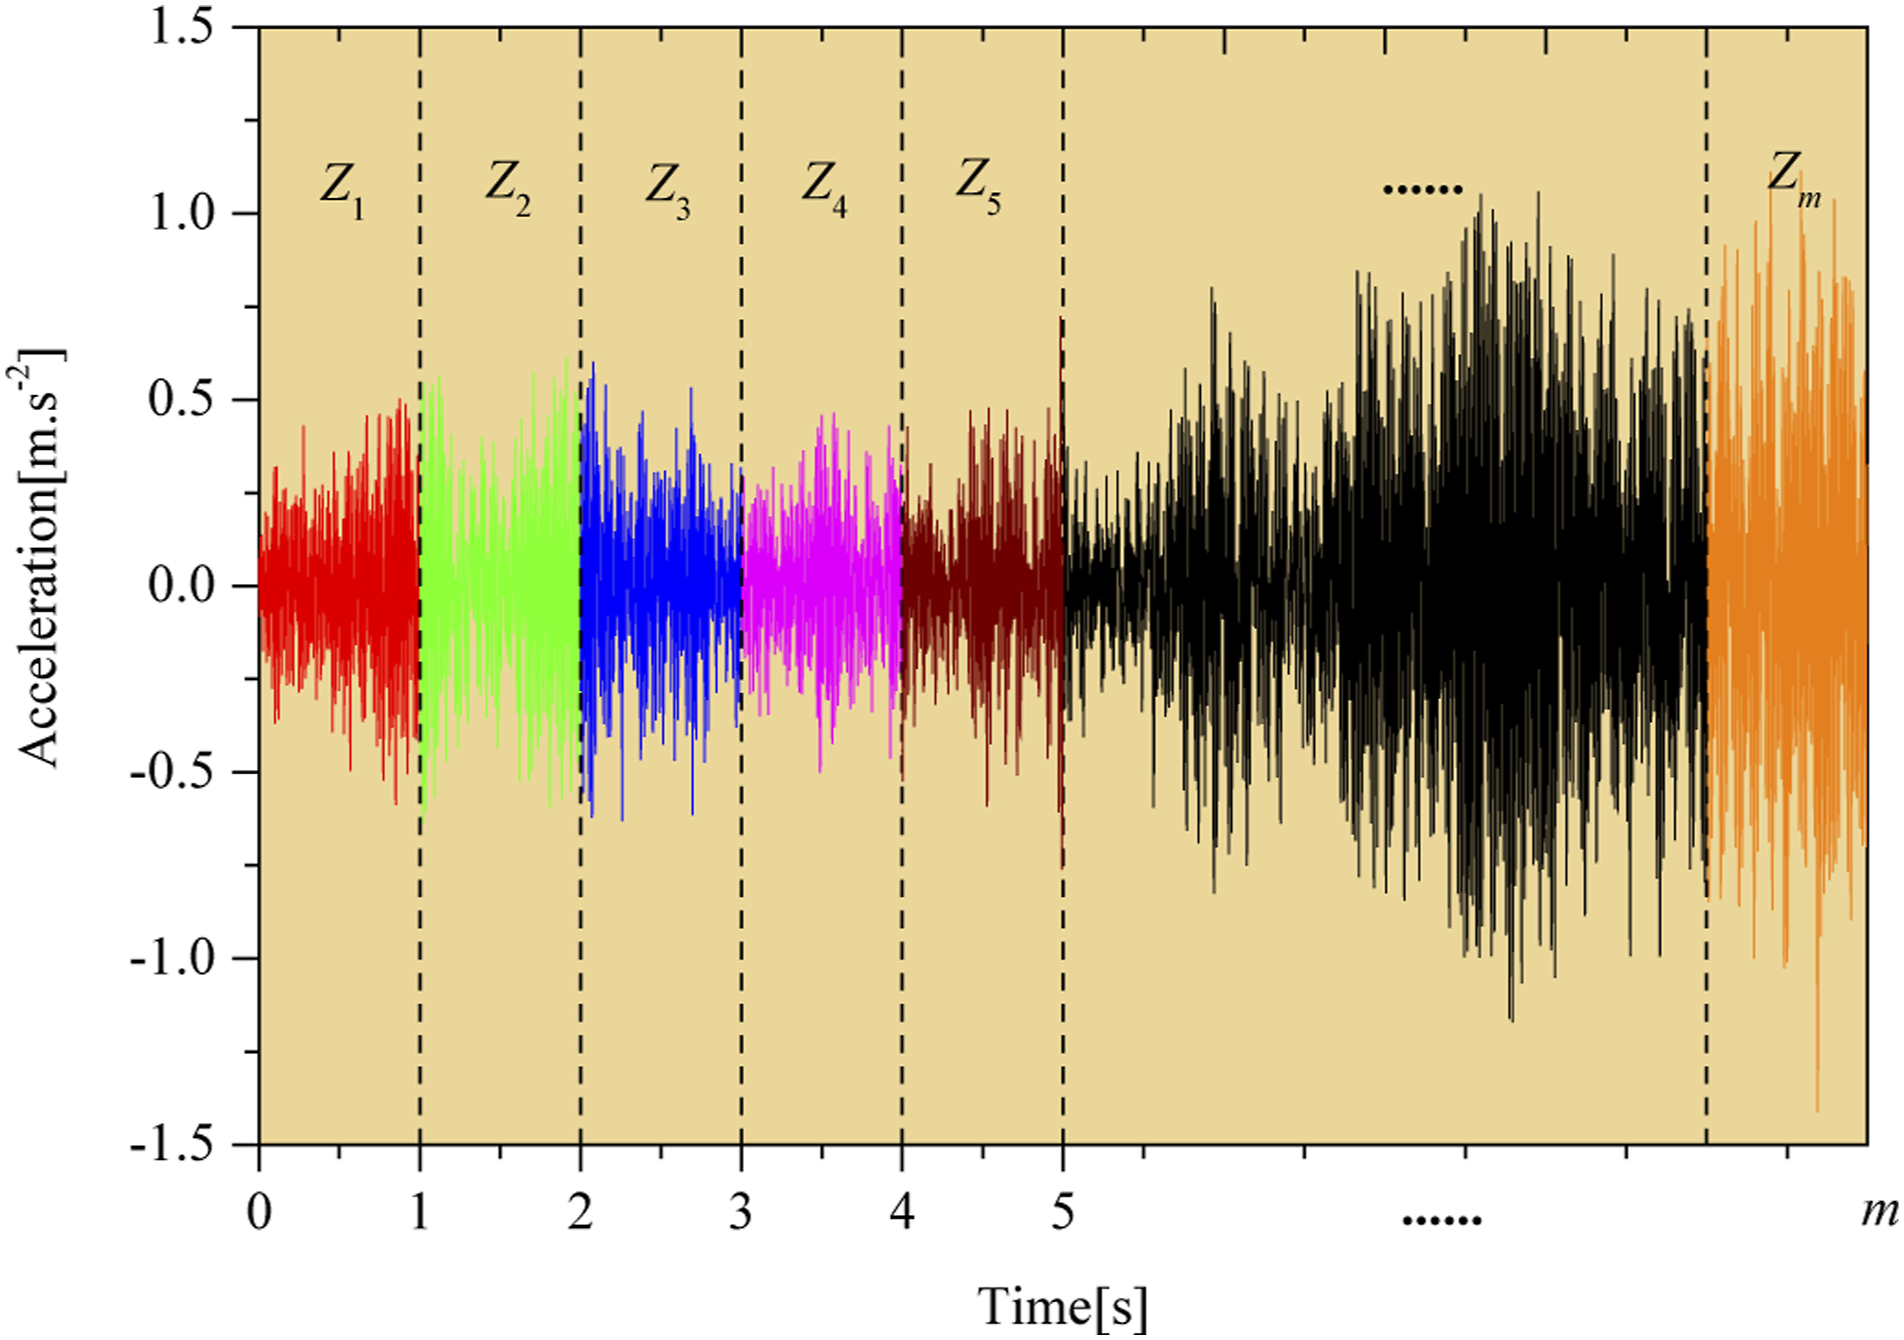
The key to the Block-Bootstrap method is how to divide the sample interval. Generally, appropriate interval length can be selected according to a specific problem. For example, this paper involves signal analysis and processing; thus, the block length is suggested to be periodic or integral multiple of periodic. In addition, several different interval lengths can be set in advance to select the optimal result by comparing re-sampling results and using appropriate statistical test indicators. 16
Automatically extracting the stable shaft based on FCM
The FCM method is used to automatically extract the stable axis of the m-amplitude stabilization diagram. Also, in the stabilization diagram, the cluster center is taken as the representative mode of the stable axis to reduce the estimated number of poles and the subsequent hierarchical clustering workload. The implementation process is as follows. First, the modal parameters obtained from the identification of a measurement point are assumed as

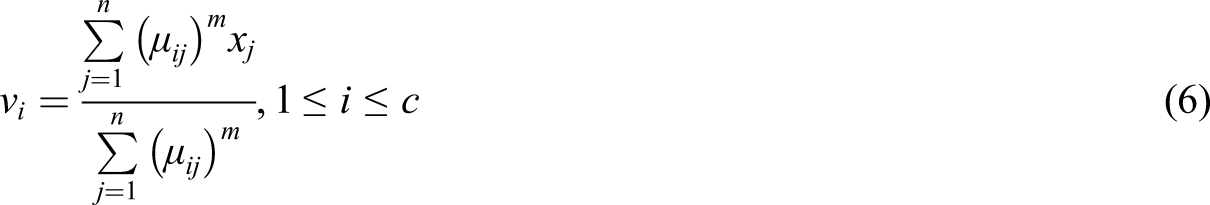
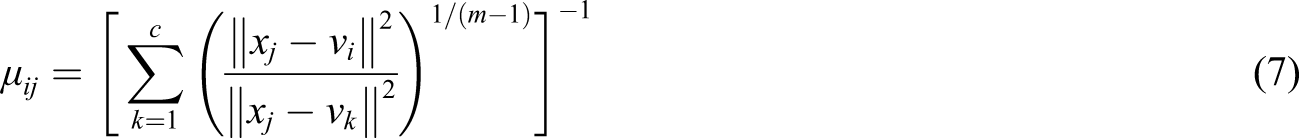

The FCM algorithm, which is based on the clustering center and the membership degree matrix, is iteratively updated until the target function achieves a convergence condition and completes the clustering figure on the pole. Note that to identify the M block of data for the stabilization diagram of a preset cluster number C, the matrix clustering center becomes C × M, in which C is the output clustering center (stable) axis.
Automatic modal parameters identification based on the hierarchical clustering
The hierarchical clustering method is used to carry out the quadratic clustering of the C × M cluster center matrix. Based on the natural frequency and MAC, Magalhaes et al.
17
used the pole distance calculation criterion


Automatic modal parameters identification results and uncertainty quantification
In the clustering process and SSI algorithm, to quantify and reduce the influence of uncertainty factors on the identification results, steps (1) to (3) are iterated B times to obtain B configuration modal parameter identifications.
The hierarchical clustering method and MDI are used to screen the initial modal parameters. Also, the mean value of elements in the cluster, in which the real modes are located, is taken as the final identification result, for which the standard deviation is used to measure the uncertainty. In conclusion, the flowchart of the proposed method is shown in Figure 2.
Test cases
To verify that the proposed automatic estimation method of modal parameters and uncertainty quantification algorithm is effective, two case studies are analyzed. The first case is the simulation data of a numerical experiment of 6 degrees of freedom (6-DOF) system, for which the solution is known. In the second case, realistic test data collected from the Jing-yuan Yellow River Bridge under the ambient excitation are used to give plausible evidence that the proposed method works appropriately. The flow chart of automatic modal parameters identification and uncertainty quantification.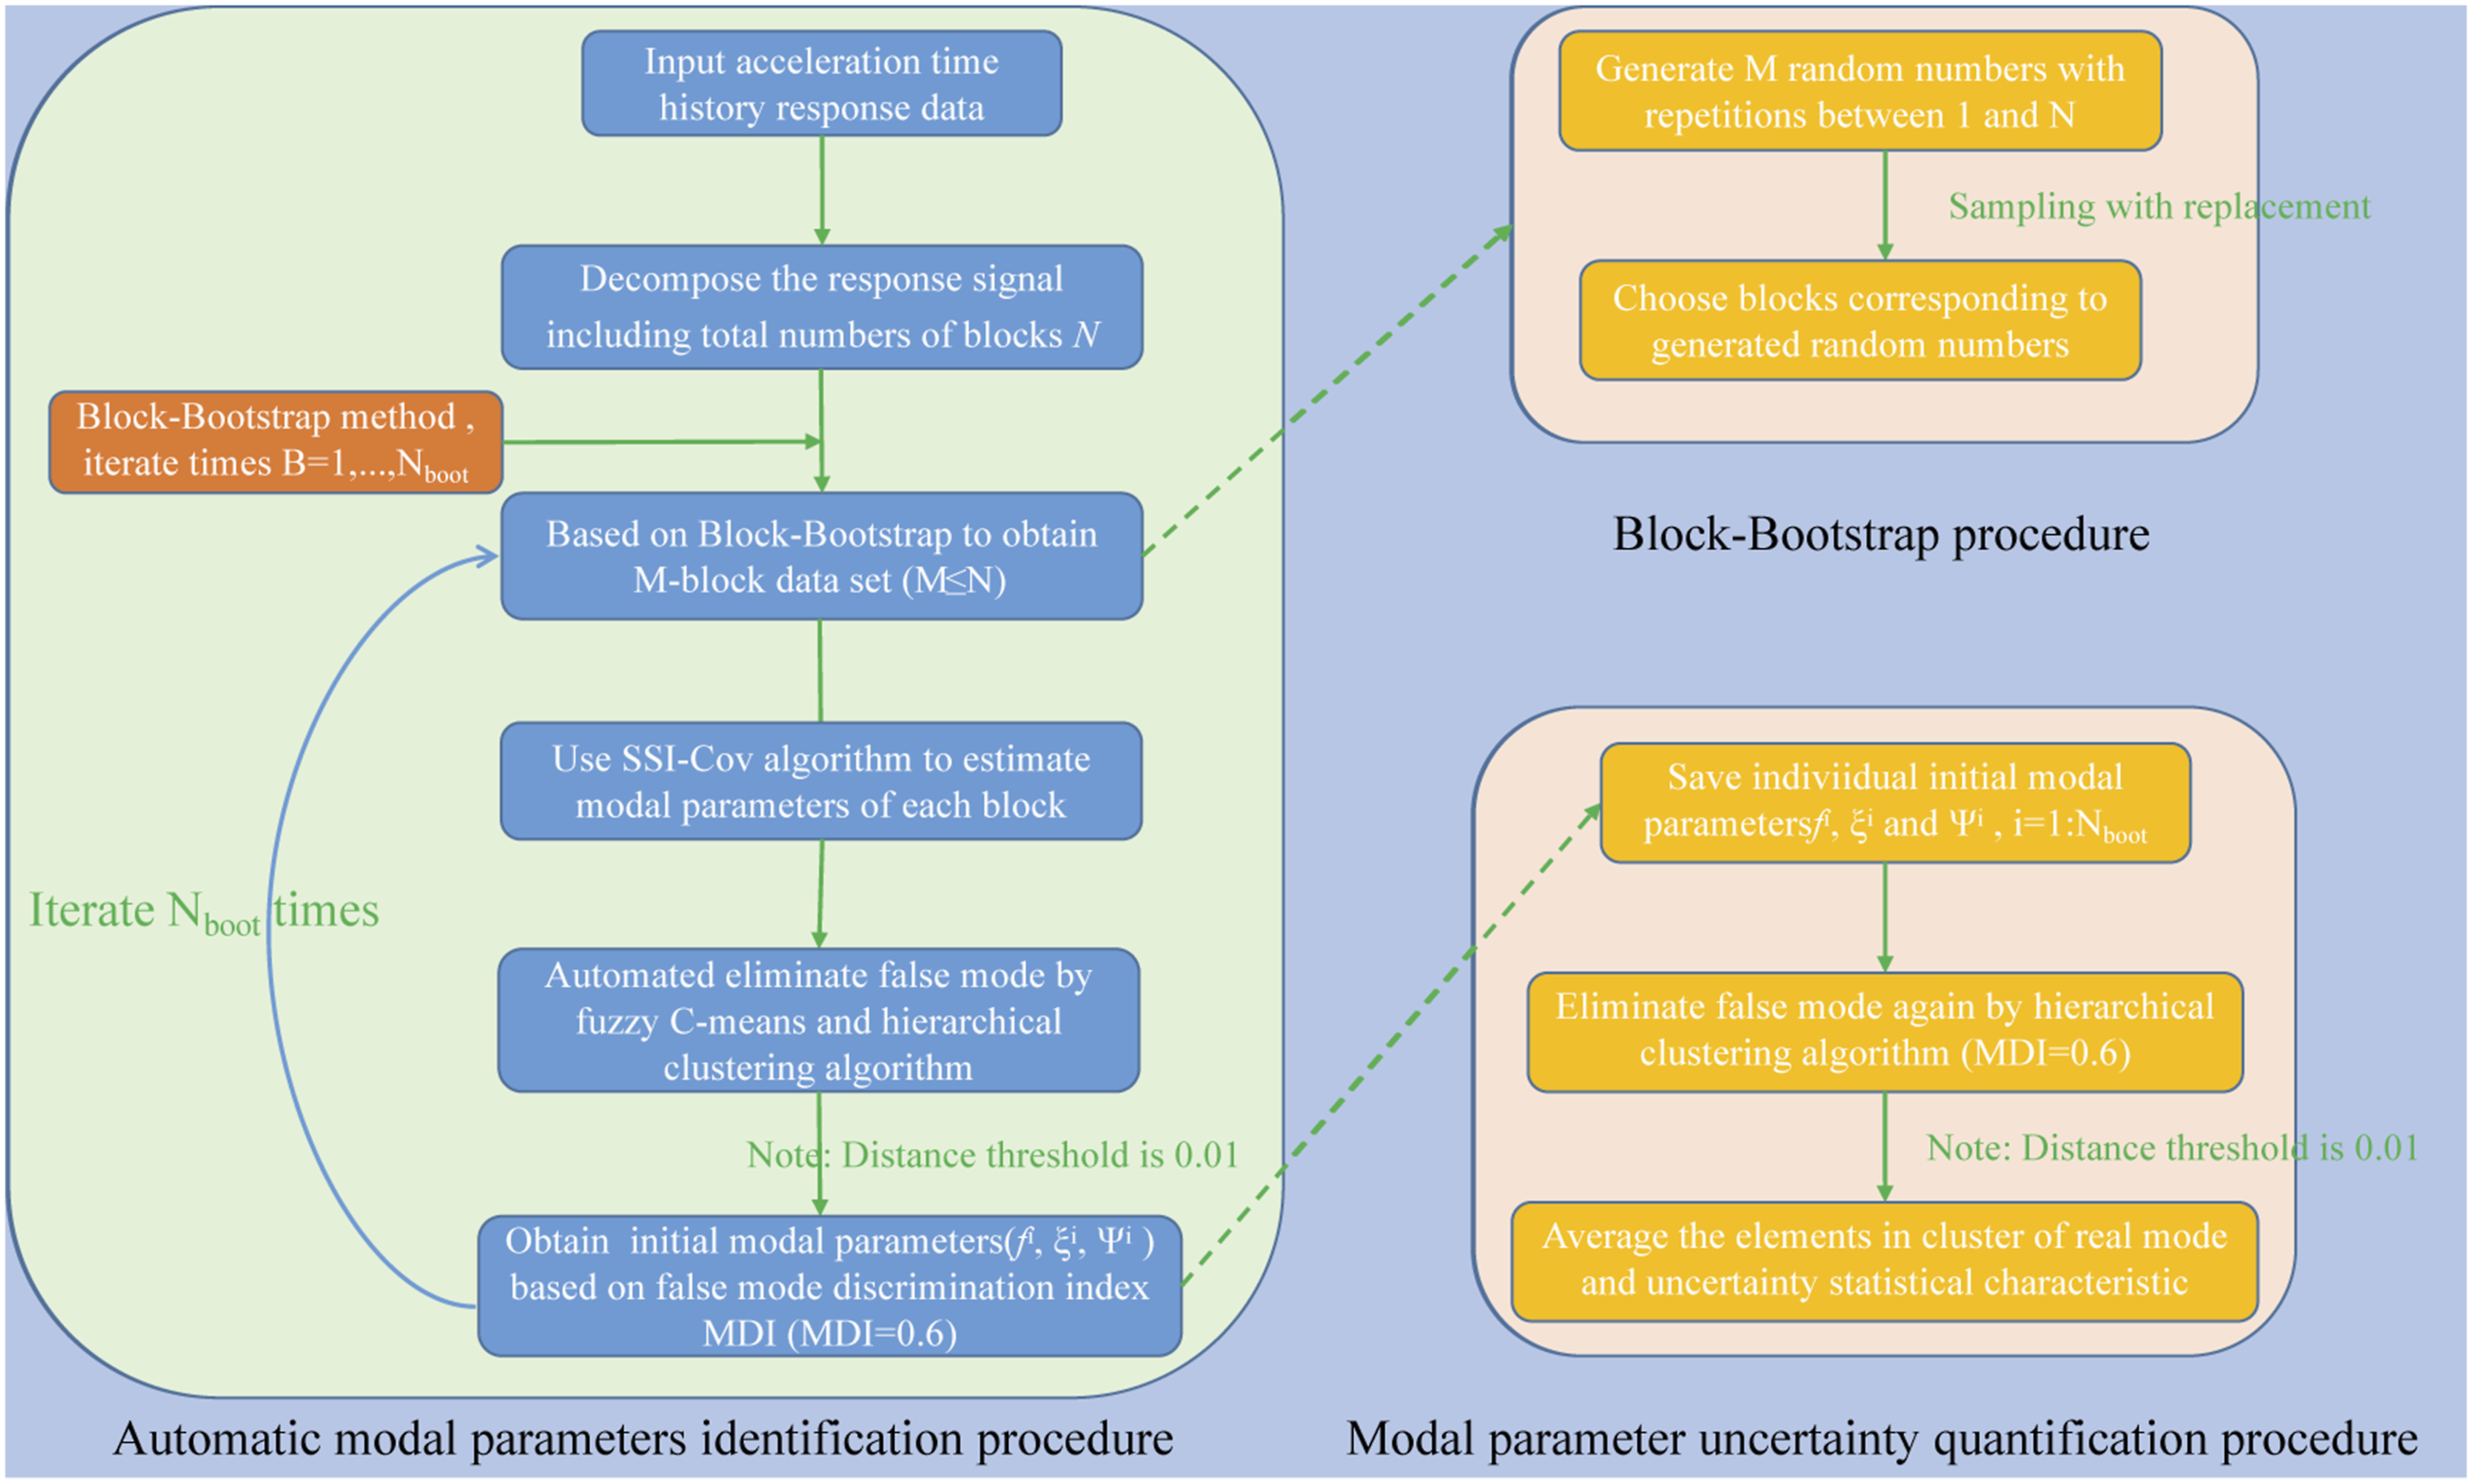
Case study I: 6-DOF system
In this section, the proposed method’s abilities are verified with a 6-DOF system. The 6-DOF system (Figure 3) has the mass matrix M, stiffness matrix K, and damping matrix C as follows: The 6-DOF system.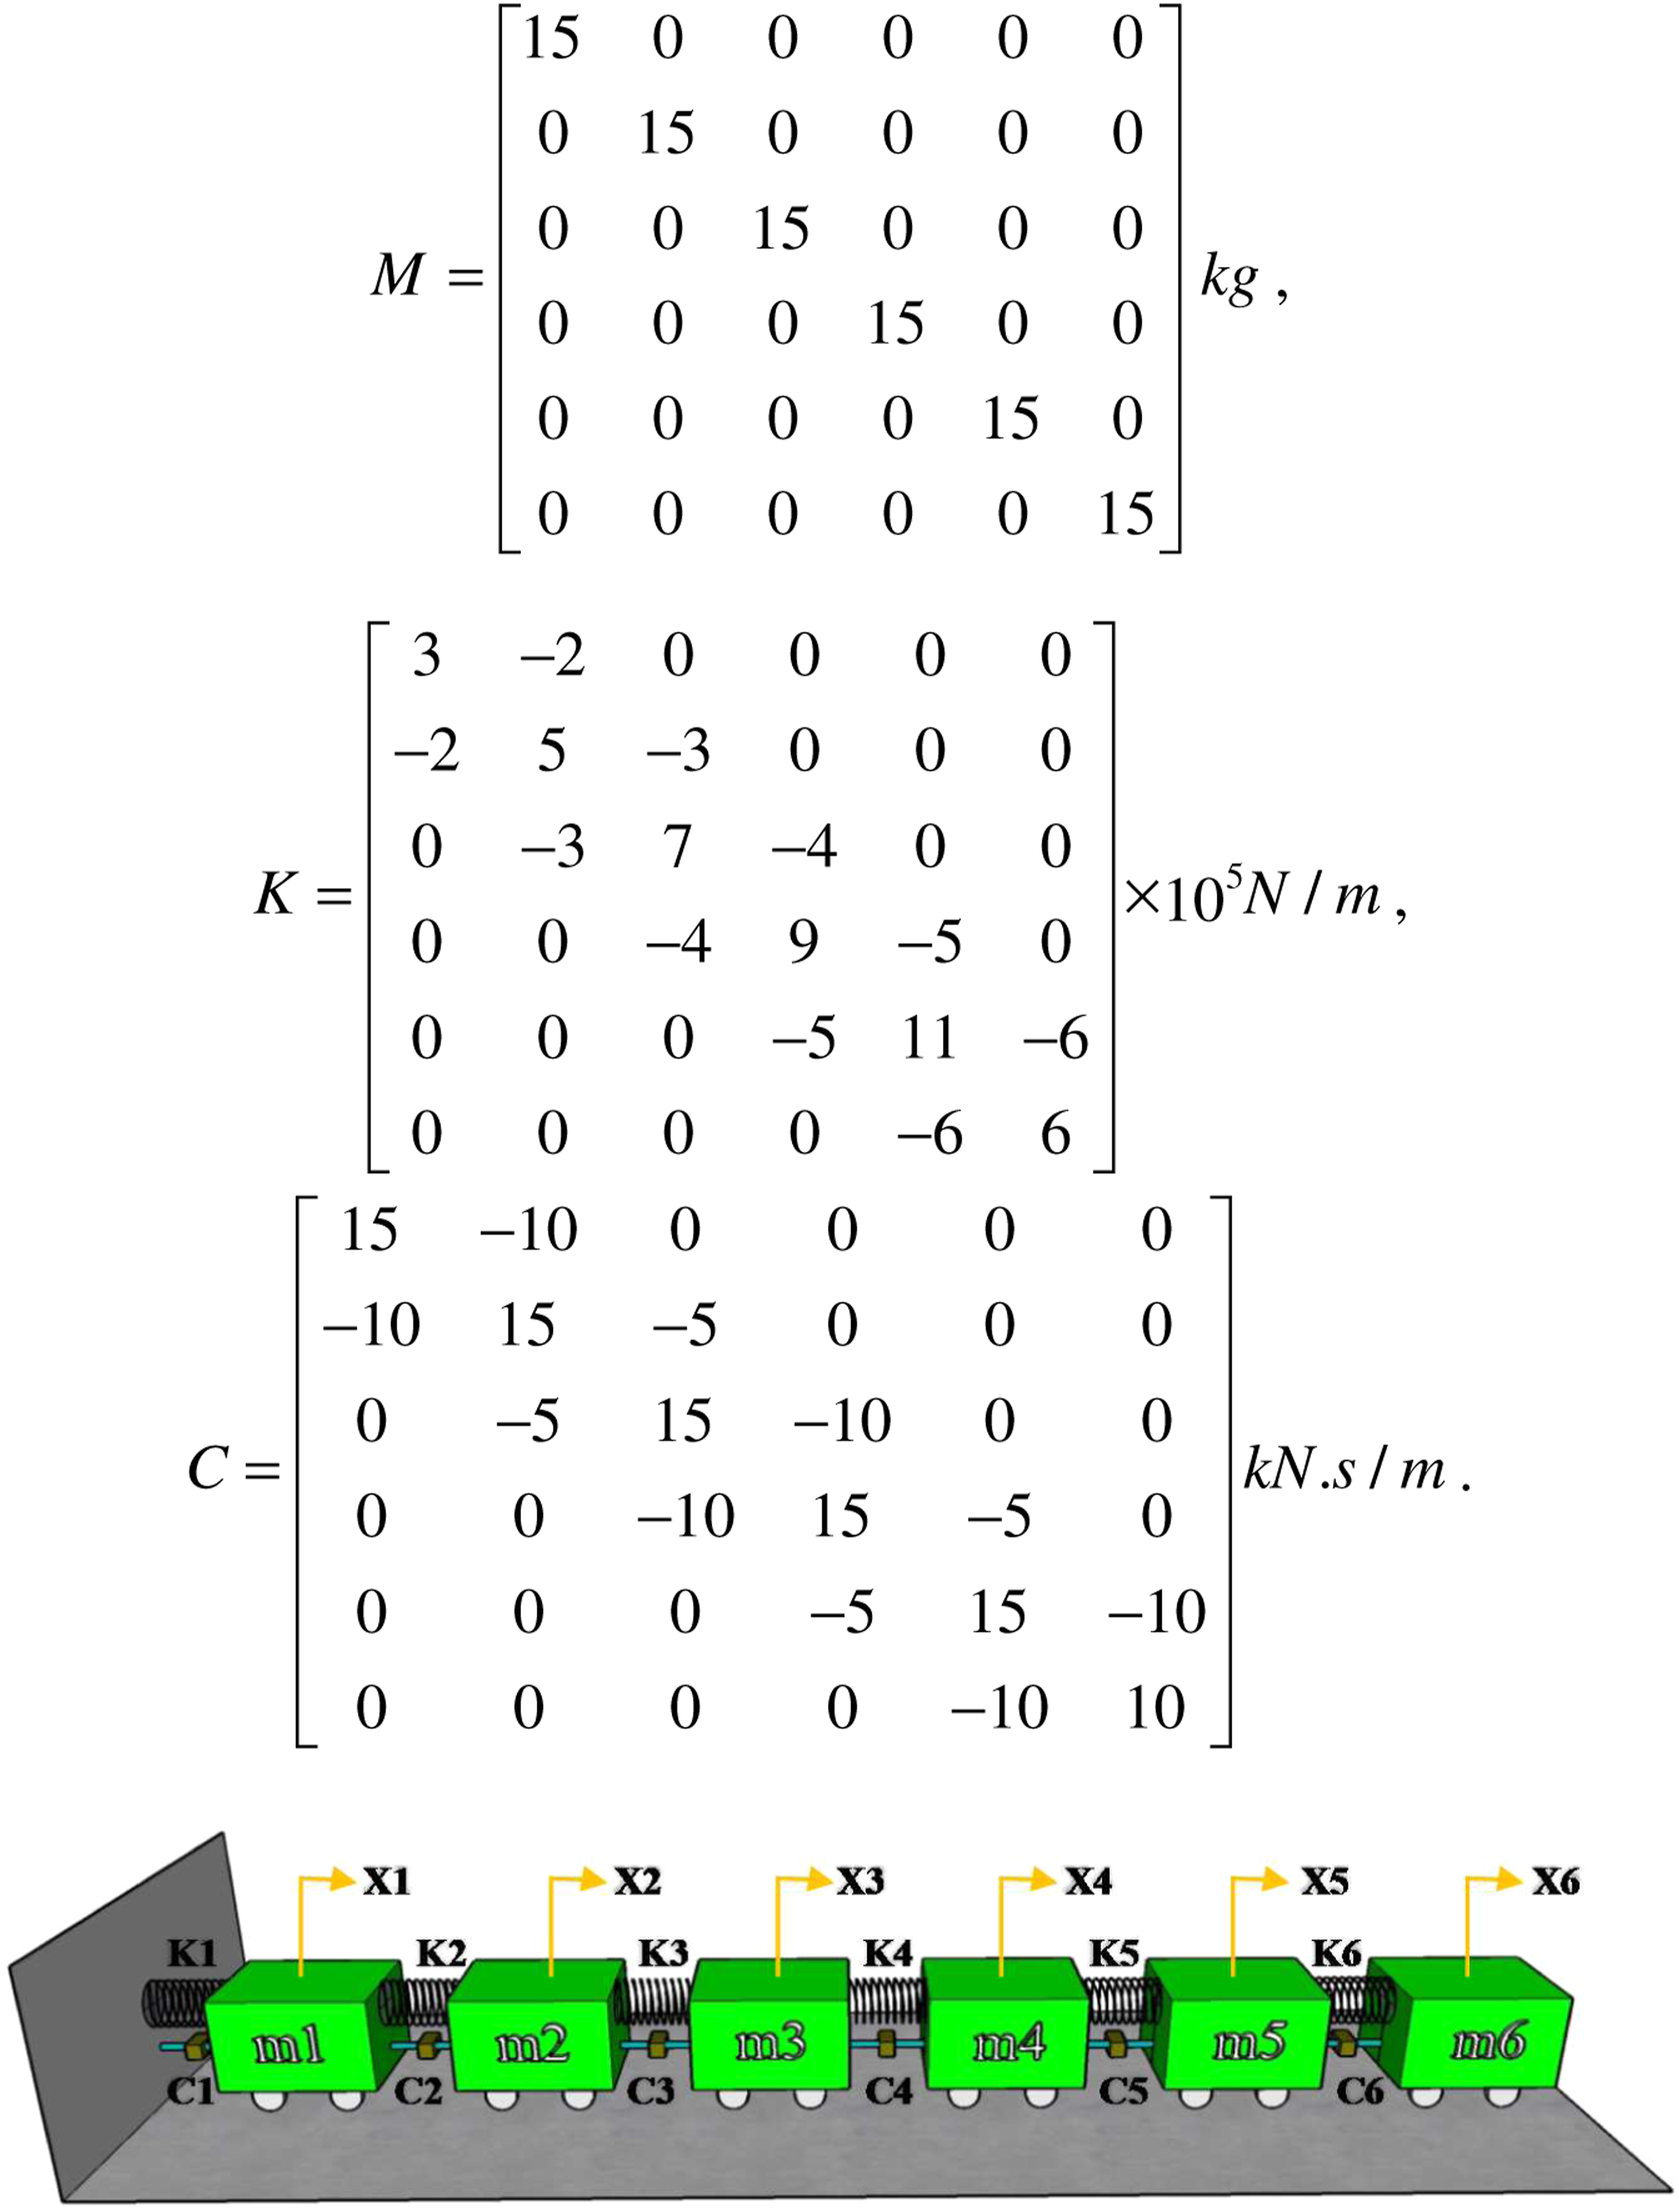
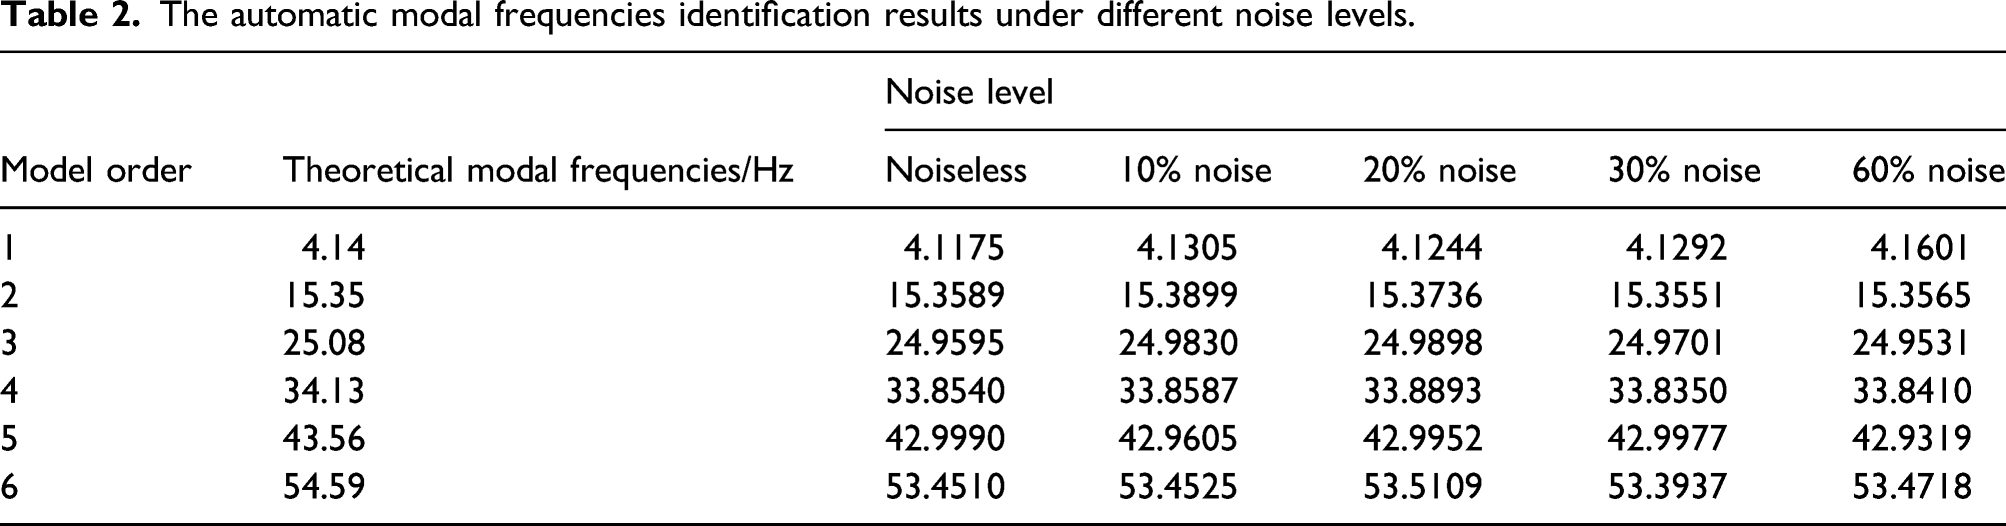
The simulation process mainly includes three steps, including exerting excitation modeled by the uncorrelated white noise, recording accelerations of the six points, and extracting modal parameters by the proposed method. Note that for each data set, the time interval is 0.001 s and the duration time is 20 s. To ensure that the response data are close to the real situation, 10, 20, 30, and 60% white noise are added to the accelerations, respectively. Note that y
i
, defined as the acceleration response data based on different noise levels, is calculated as below

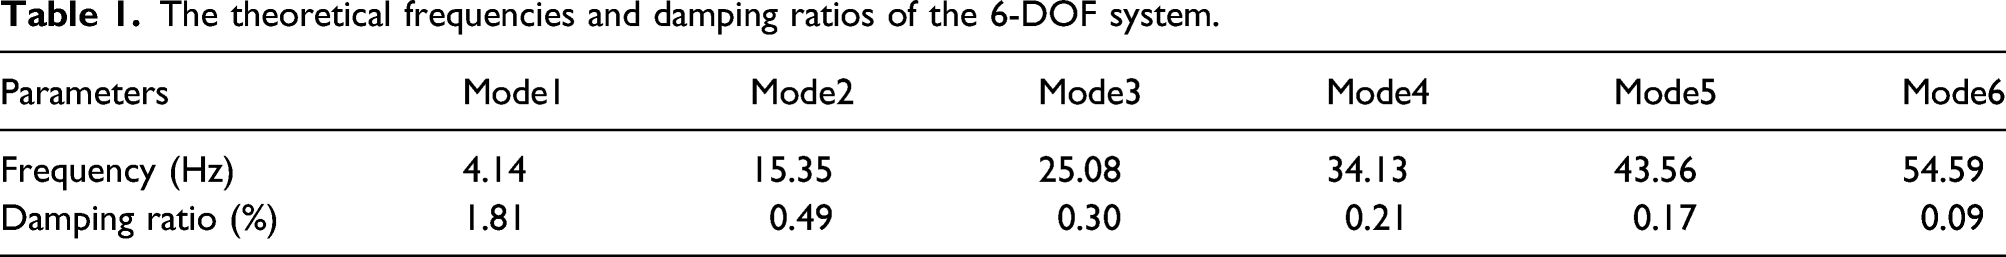
The theoretical frequencies and damping ratios of the 6-DOF system.
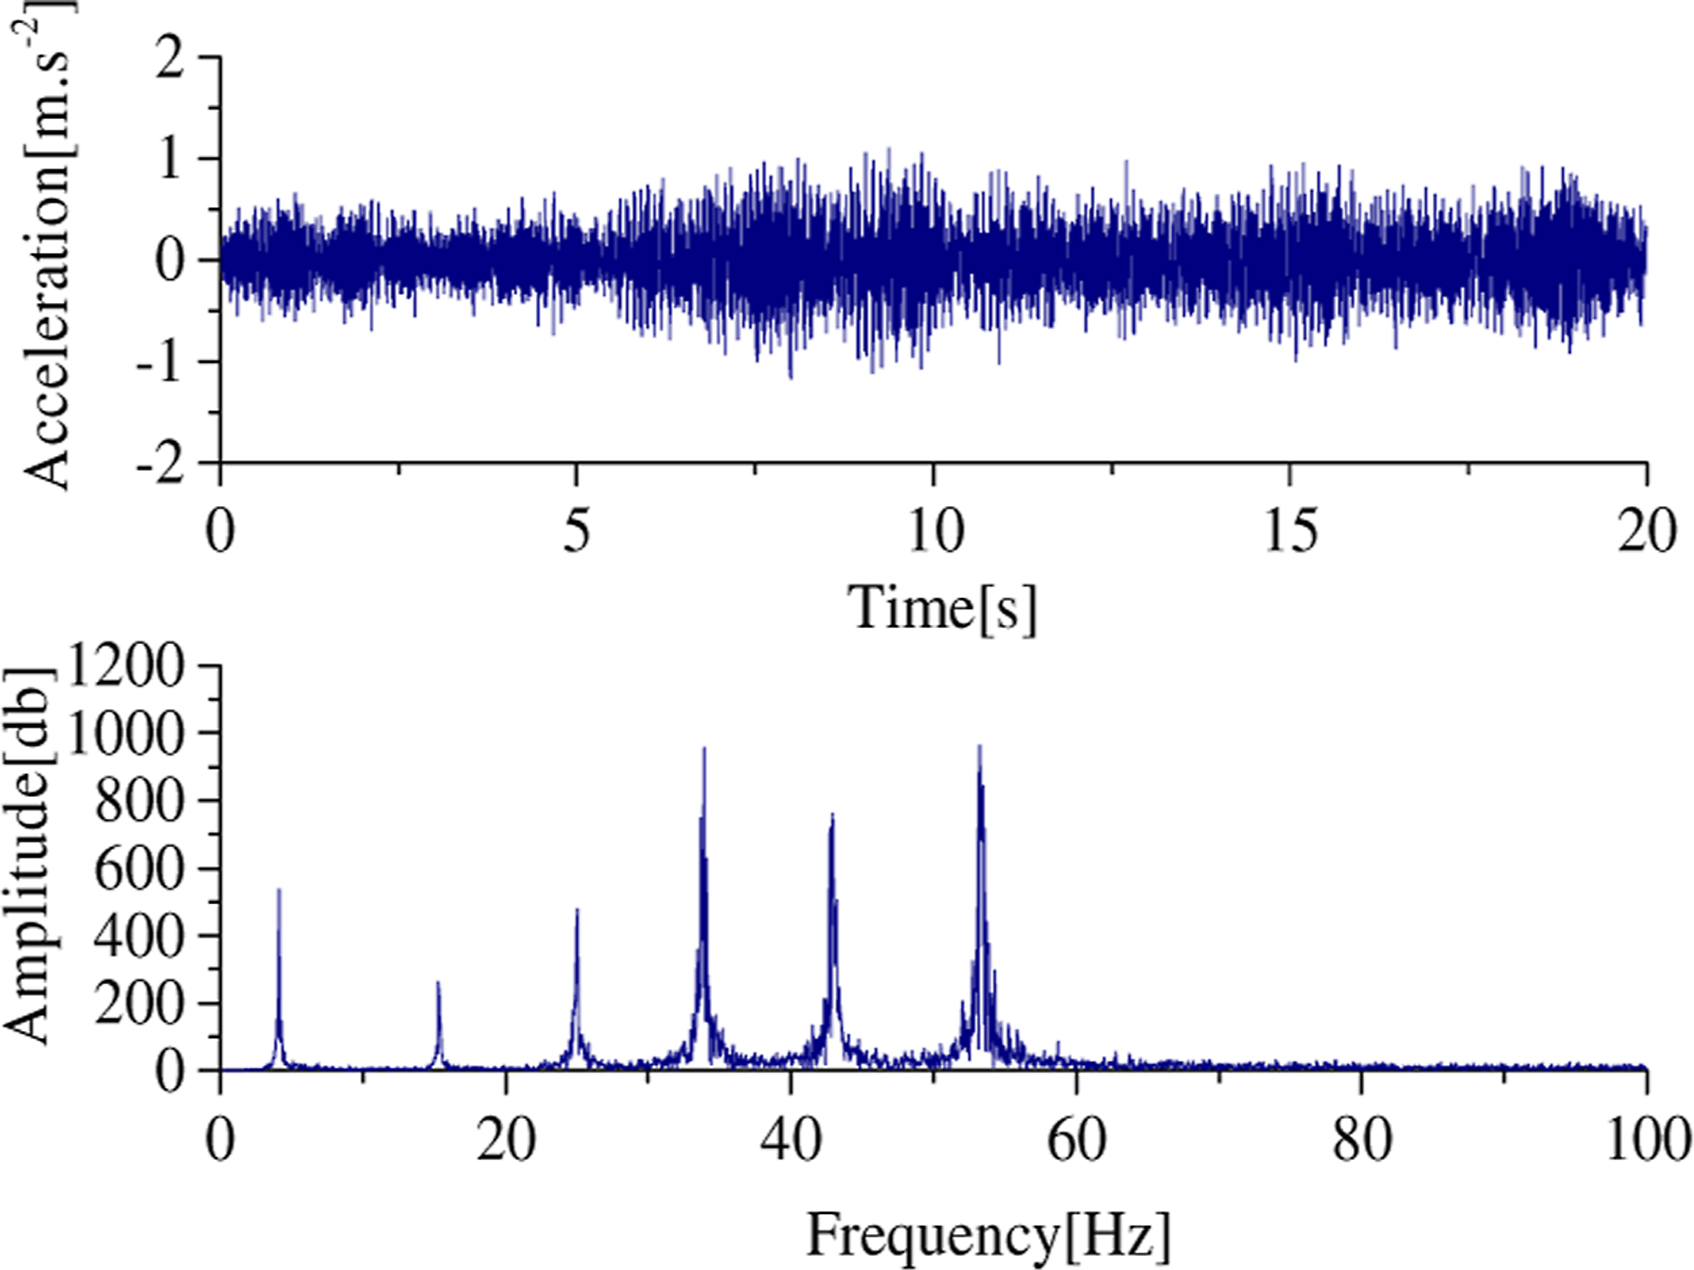
The time-history curve of acceleration and its Fourier spectrum at the measurement point 1.
Automatic identification and uncertainty quantification of the same set parameters
The stabilization diagram generated by the SSI algorithm is shown in Figure 5, in which many false poles still exist. The key to automatic modal parameters identification is how to distinguish true and false modals. First, the clustering algorithm is applied to extract the stable axis. It is generally difficult to identify the first 15 modes of the bridge structure by operating environment.
7
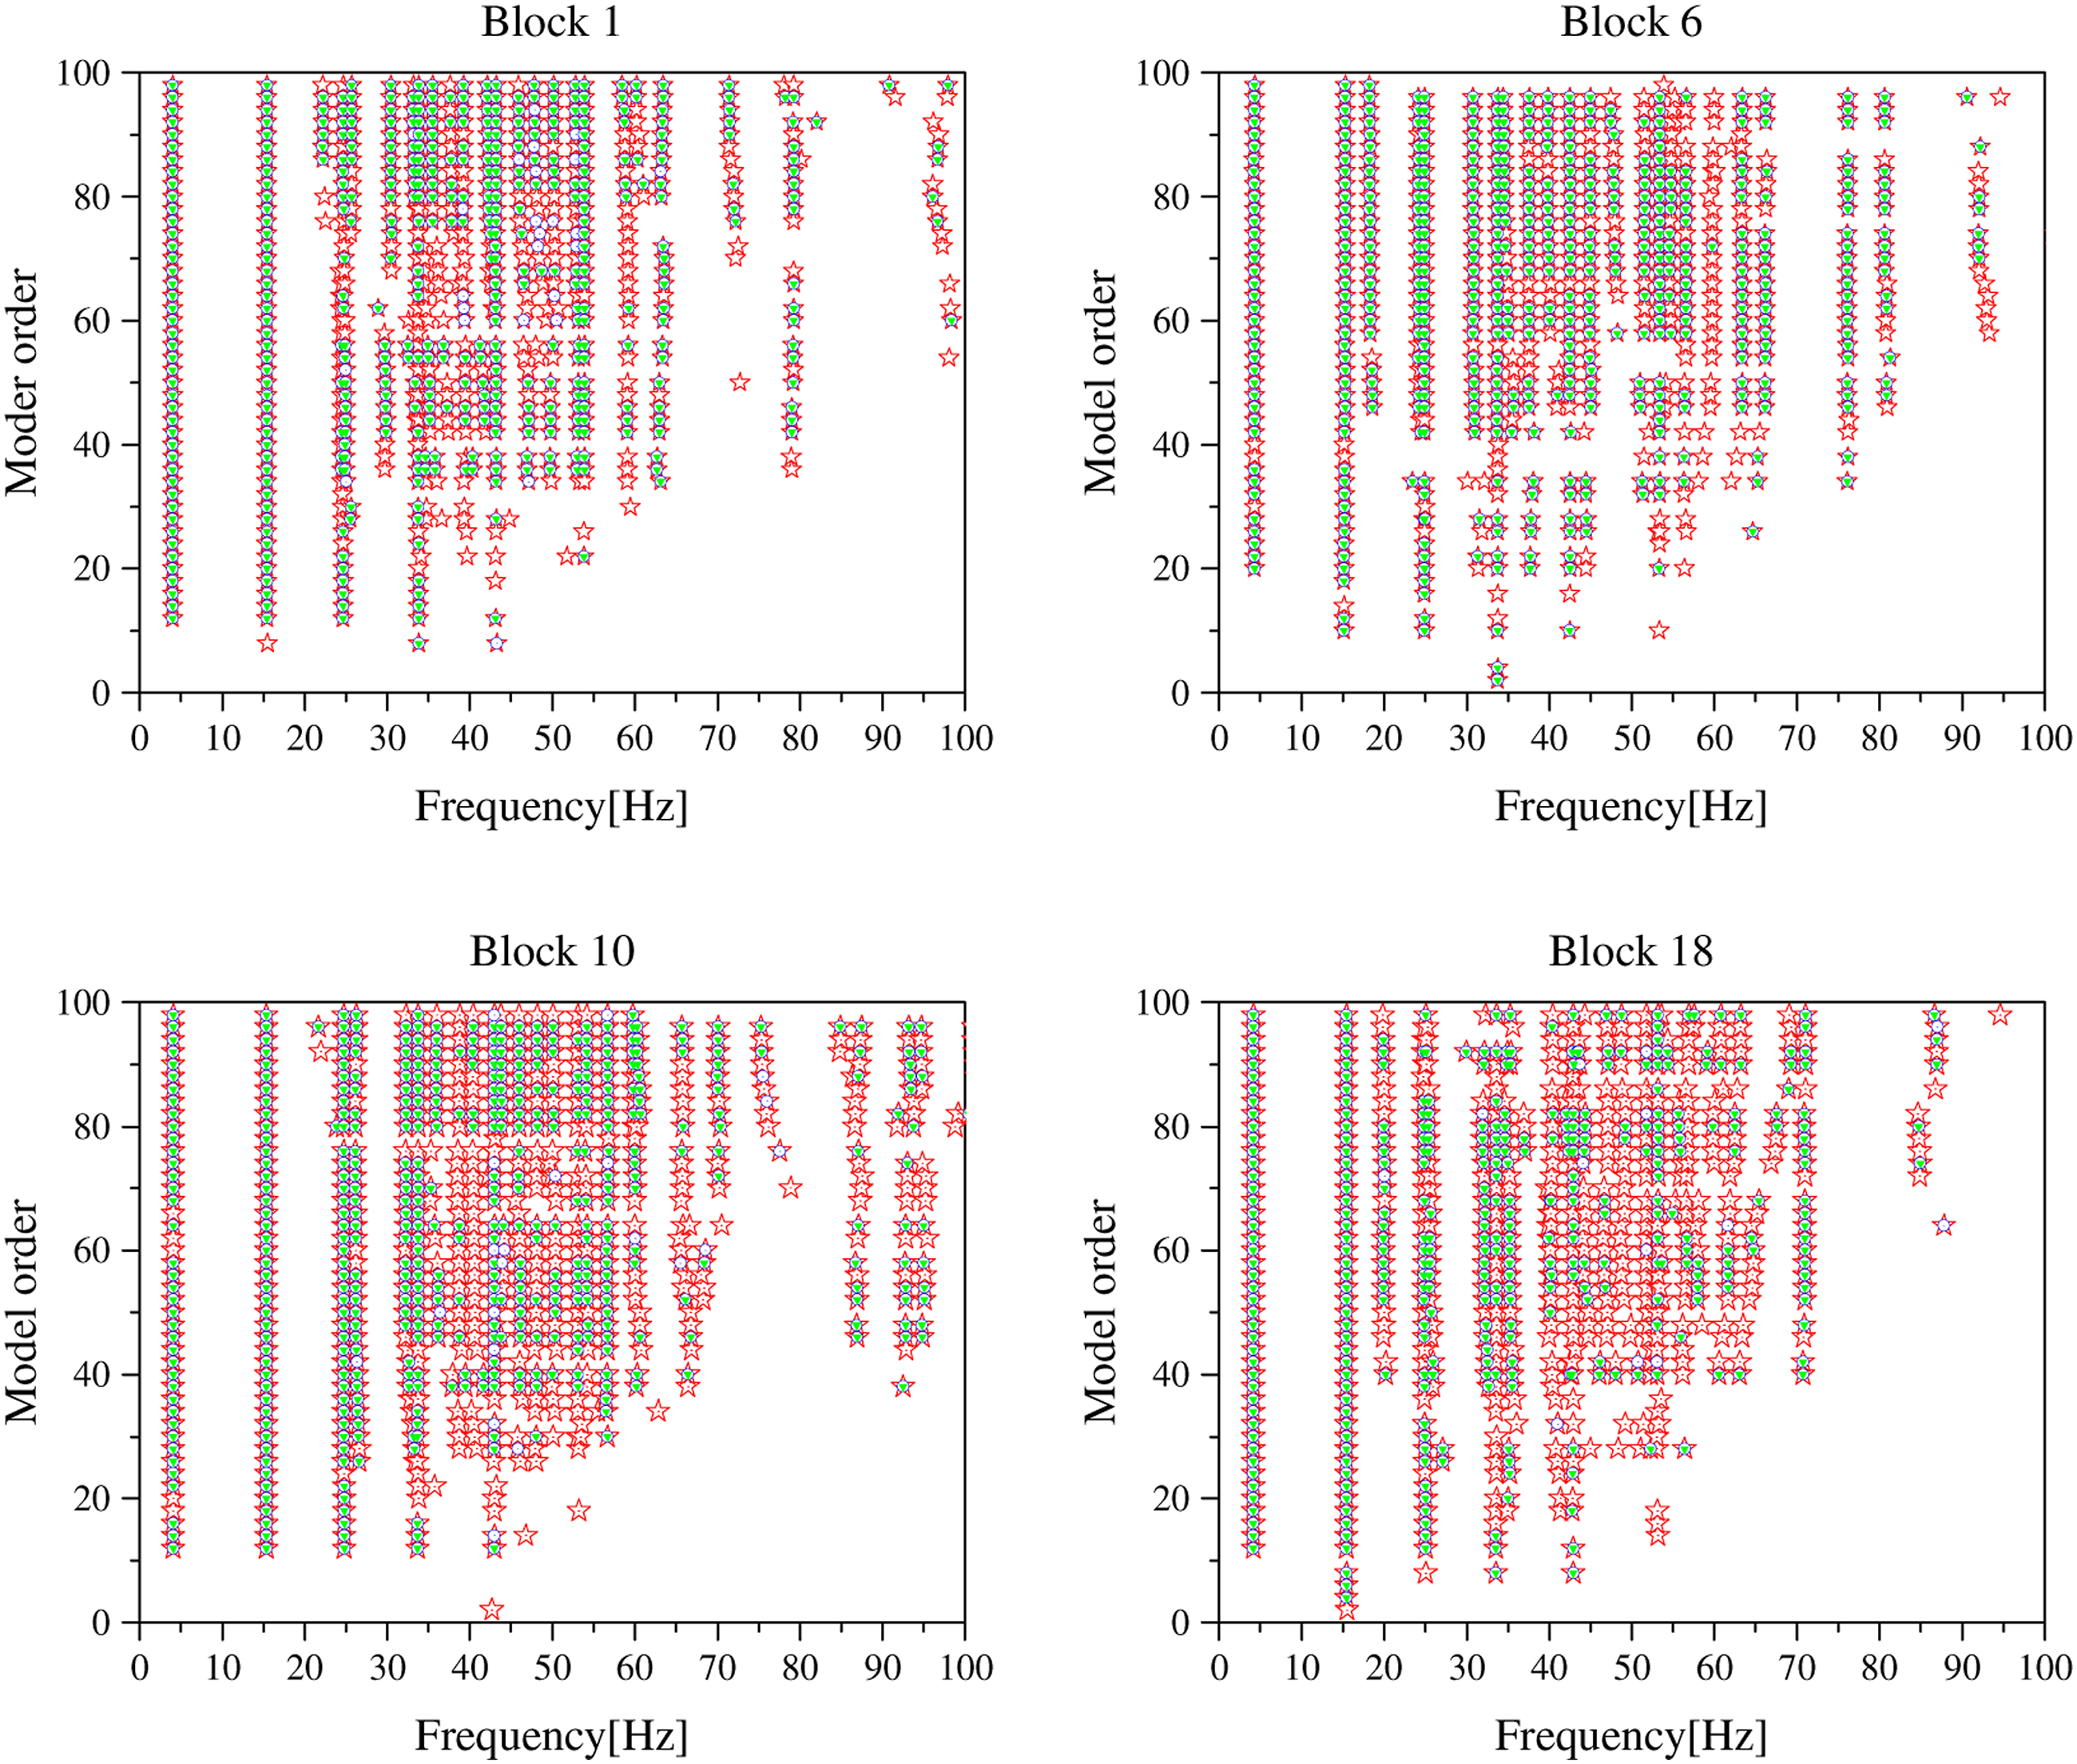
Thus, the clustering number is set to 20, and the acceleration time-history curve is divided into 20 blocks, for which the lengths are 1000. The stabilization diagrams of blocks 1, 6, 10, and 18 are shown in Figure 6, in which the influencing degree of the noise is different in different time periods so that it causes the stable axis to change. In addition, the stable axis of the real mode does not change with the noise, while the stable axis of the false mode changes noticeably with the noise.
19
Accordingly, false modes can be eliminated. The stabilization diagram generated by SSI. The stabilization diagram generated by the SSI algorithm based on different block data.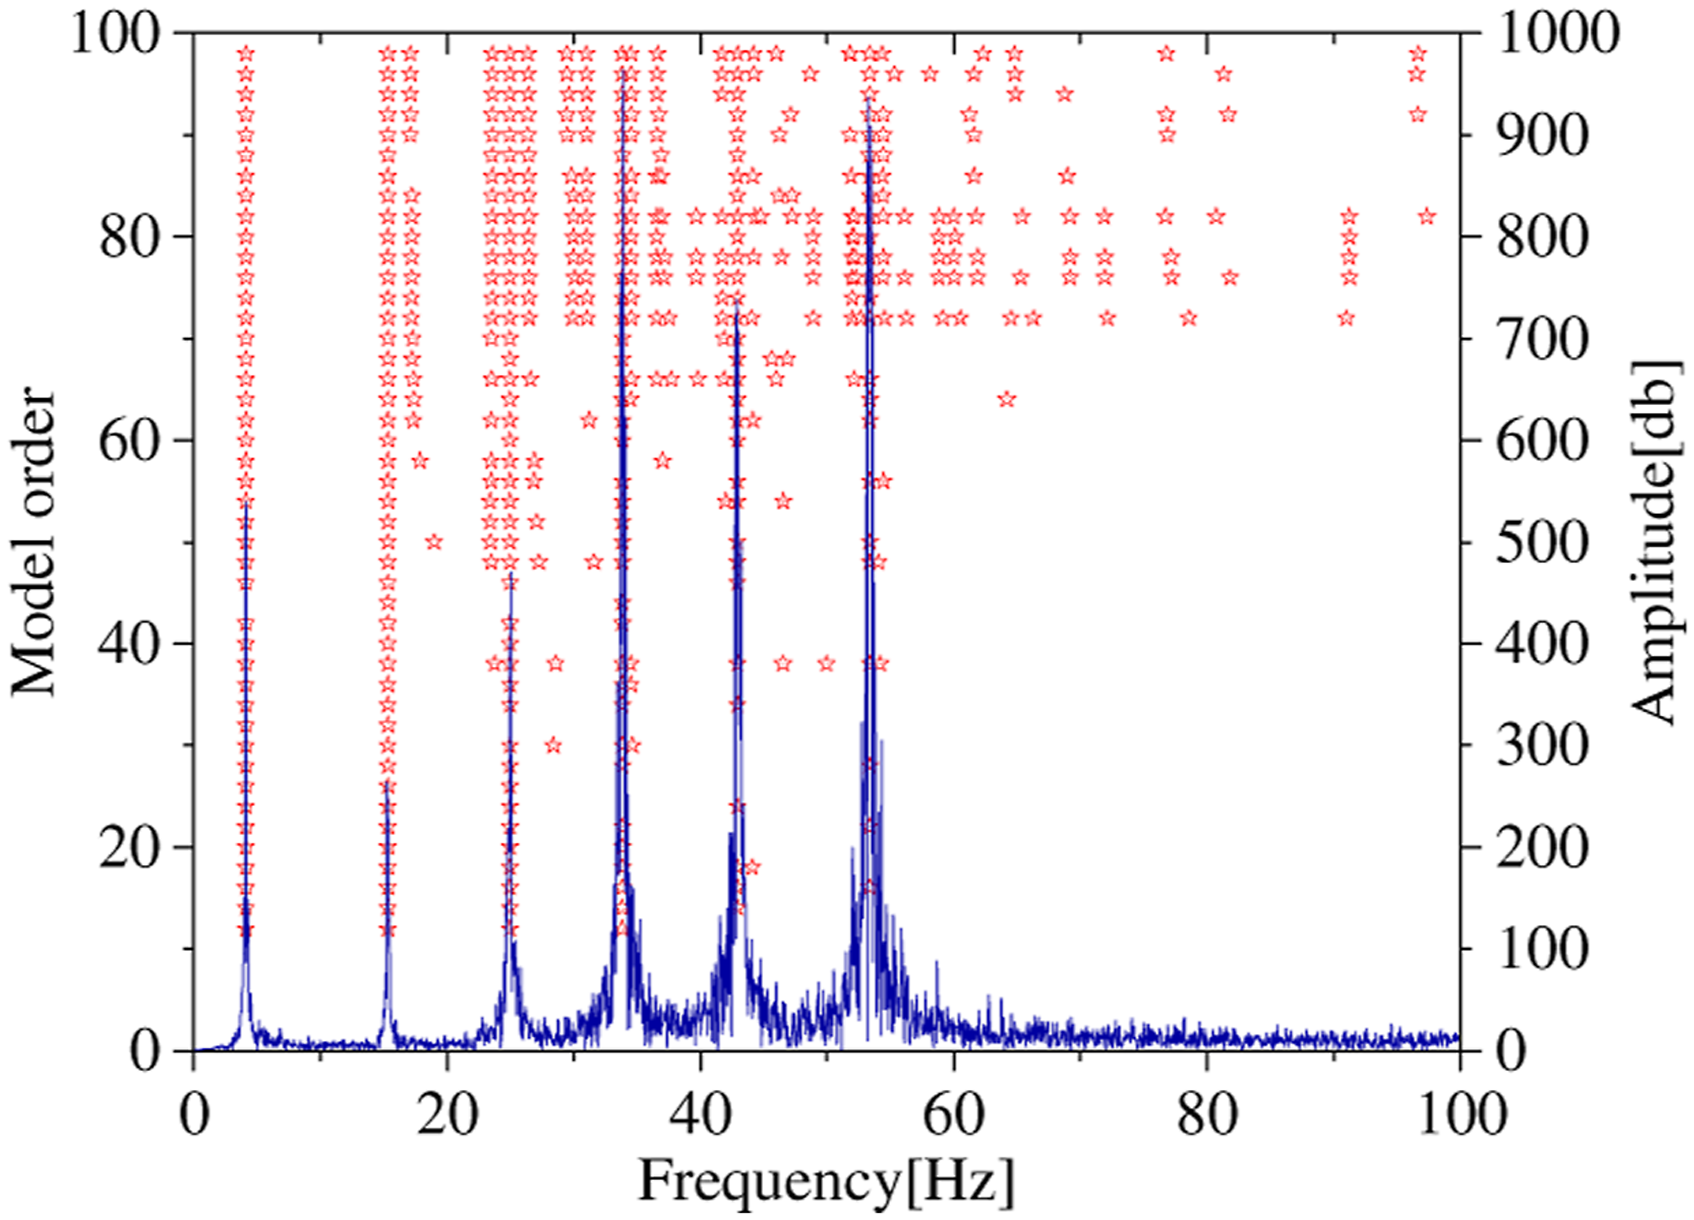
In this study, the FCM algorithm is used to automatically pick up the stable axis in 20 stabilization diagrams and 20 groups of initial modal parameters are obtained. The 20 groups of initial modal parameters are clustered by the hierarchical clustering algorithm, and the false modal parameters are eliminated by combining the true and false modal discrimination indices to obtain the initial modal parameter values. As the initial clustering center will affect the accuracy of identification results, the number of block-bootstrap sampling is set to 100, and 100 groups of data are repeatedly identified. The hierarchical clustering method and MDI are used to screen 100 groups of initial modal parameters, and the final modal parameter identification results are obtained.
The MDI calculation results under different noise levels are shown in Figure 7. It can be seen that even at the noise level of 60%, the stable axis, which represents the real mode in the stabilization diagram, basically coincides with when the clustering meets the MDI index. The MDI index in Figure 7 is larger than the set threshold value of 0.6 and is close to one. Thus, the MDI index can distinguish the true and false modals effectively, and the false modal parameters outside the stable axis can be eliminated. The stabilization diagram under different noise levels.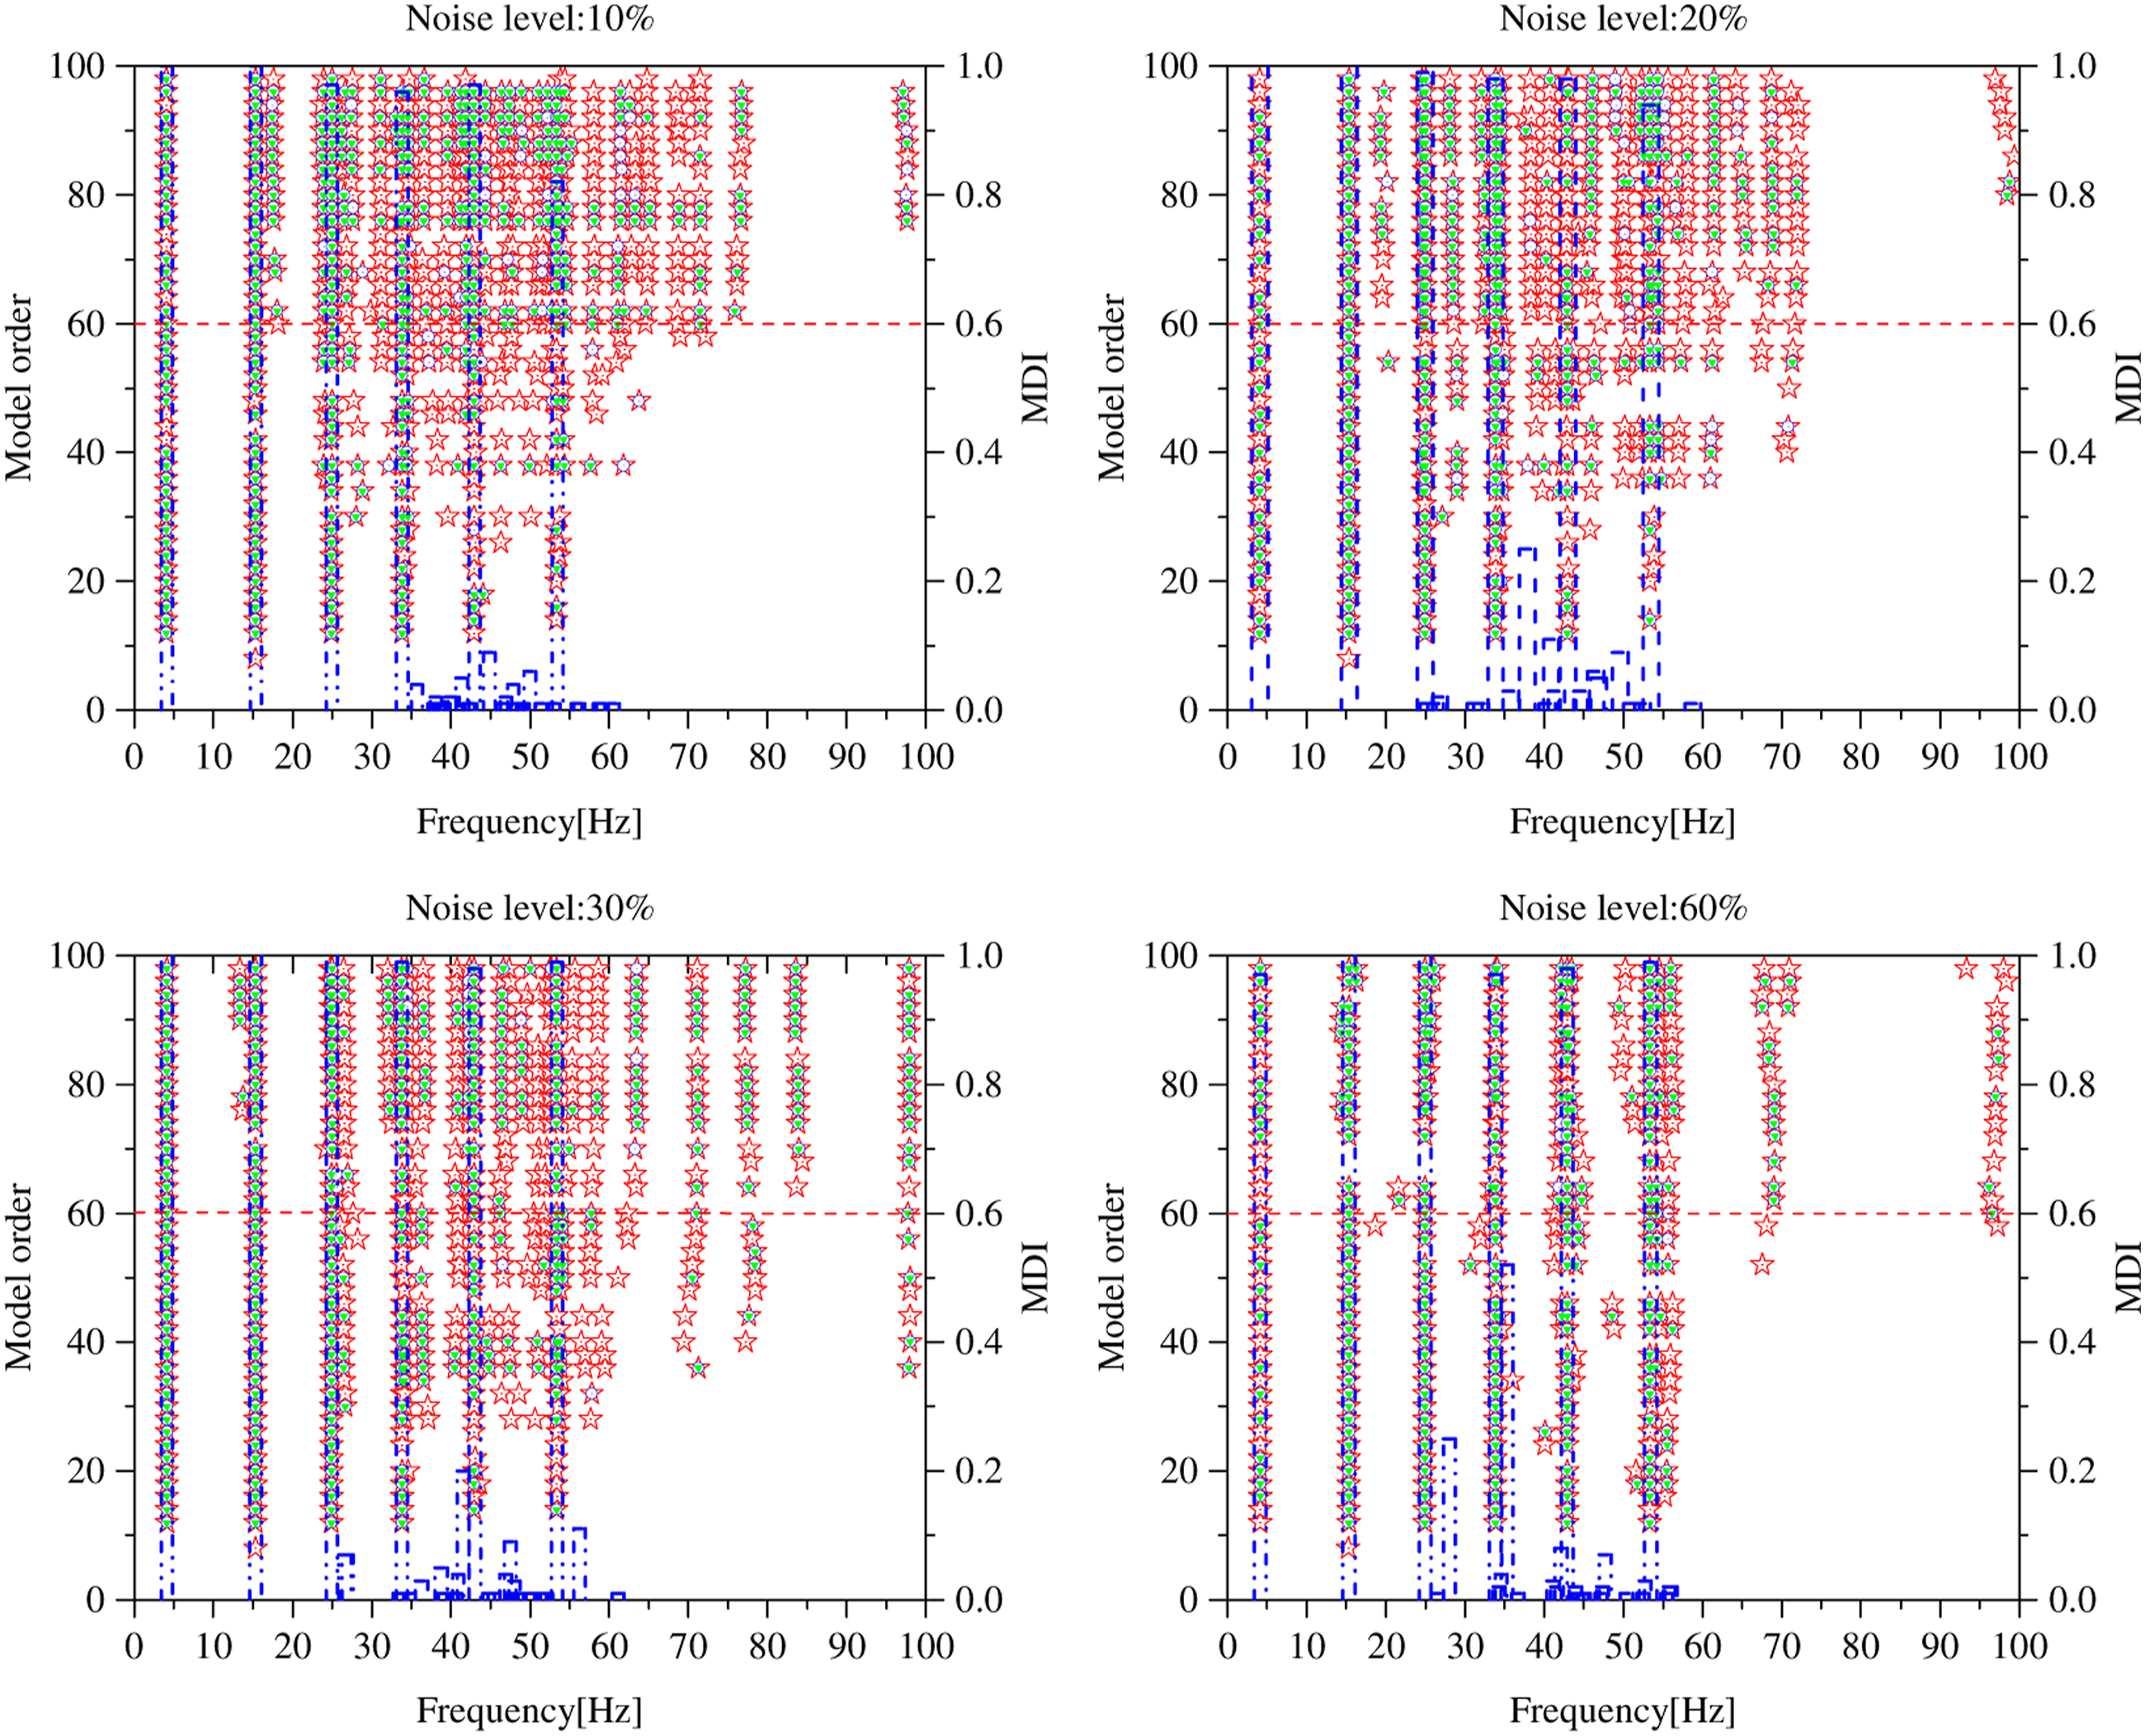
The automatic modal frequencies identification results under different noise levels.
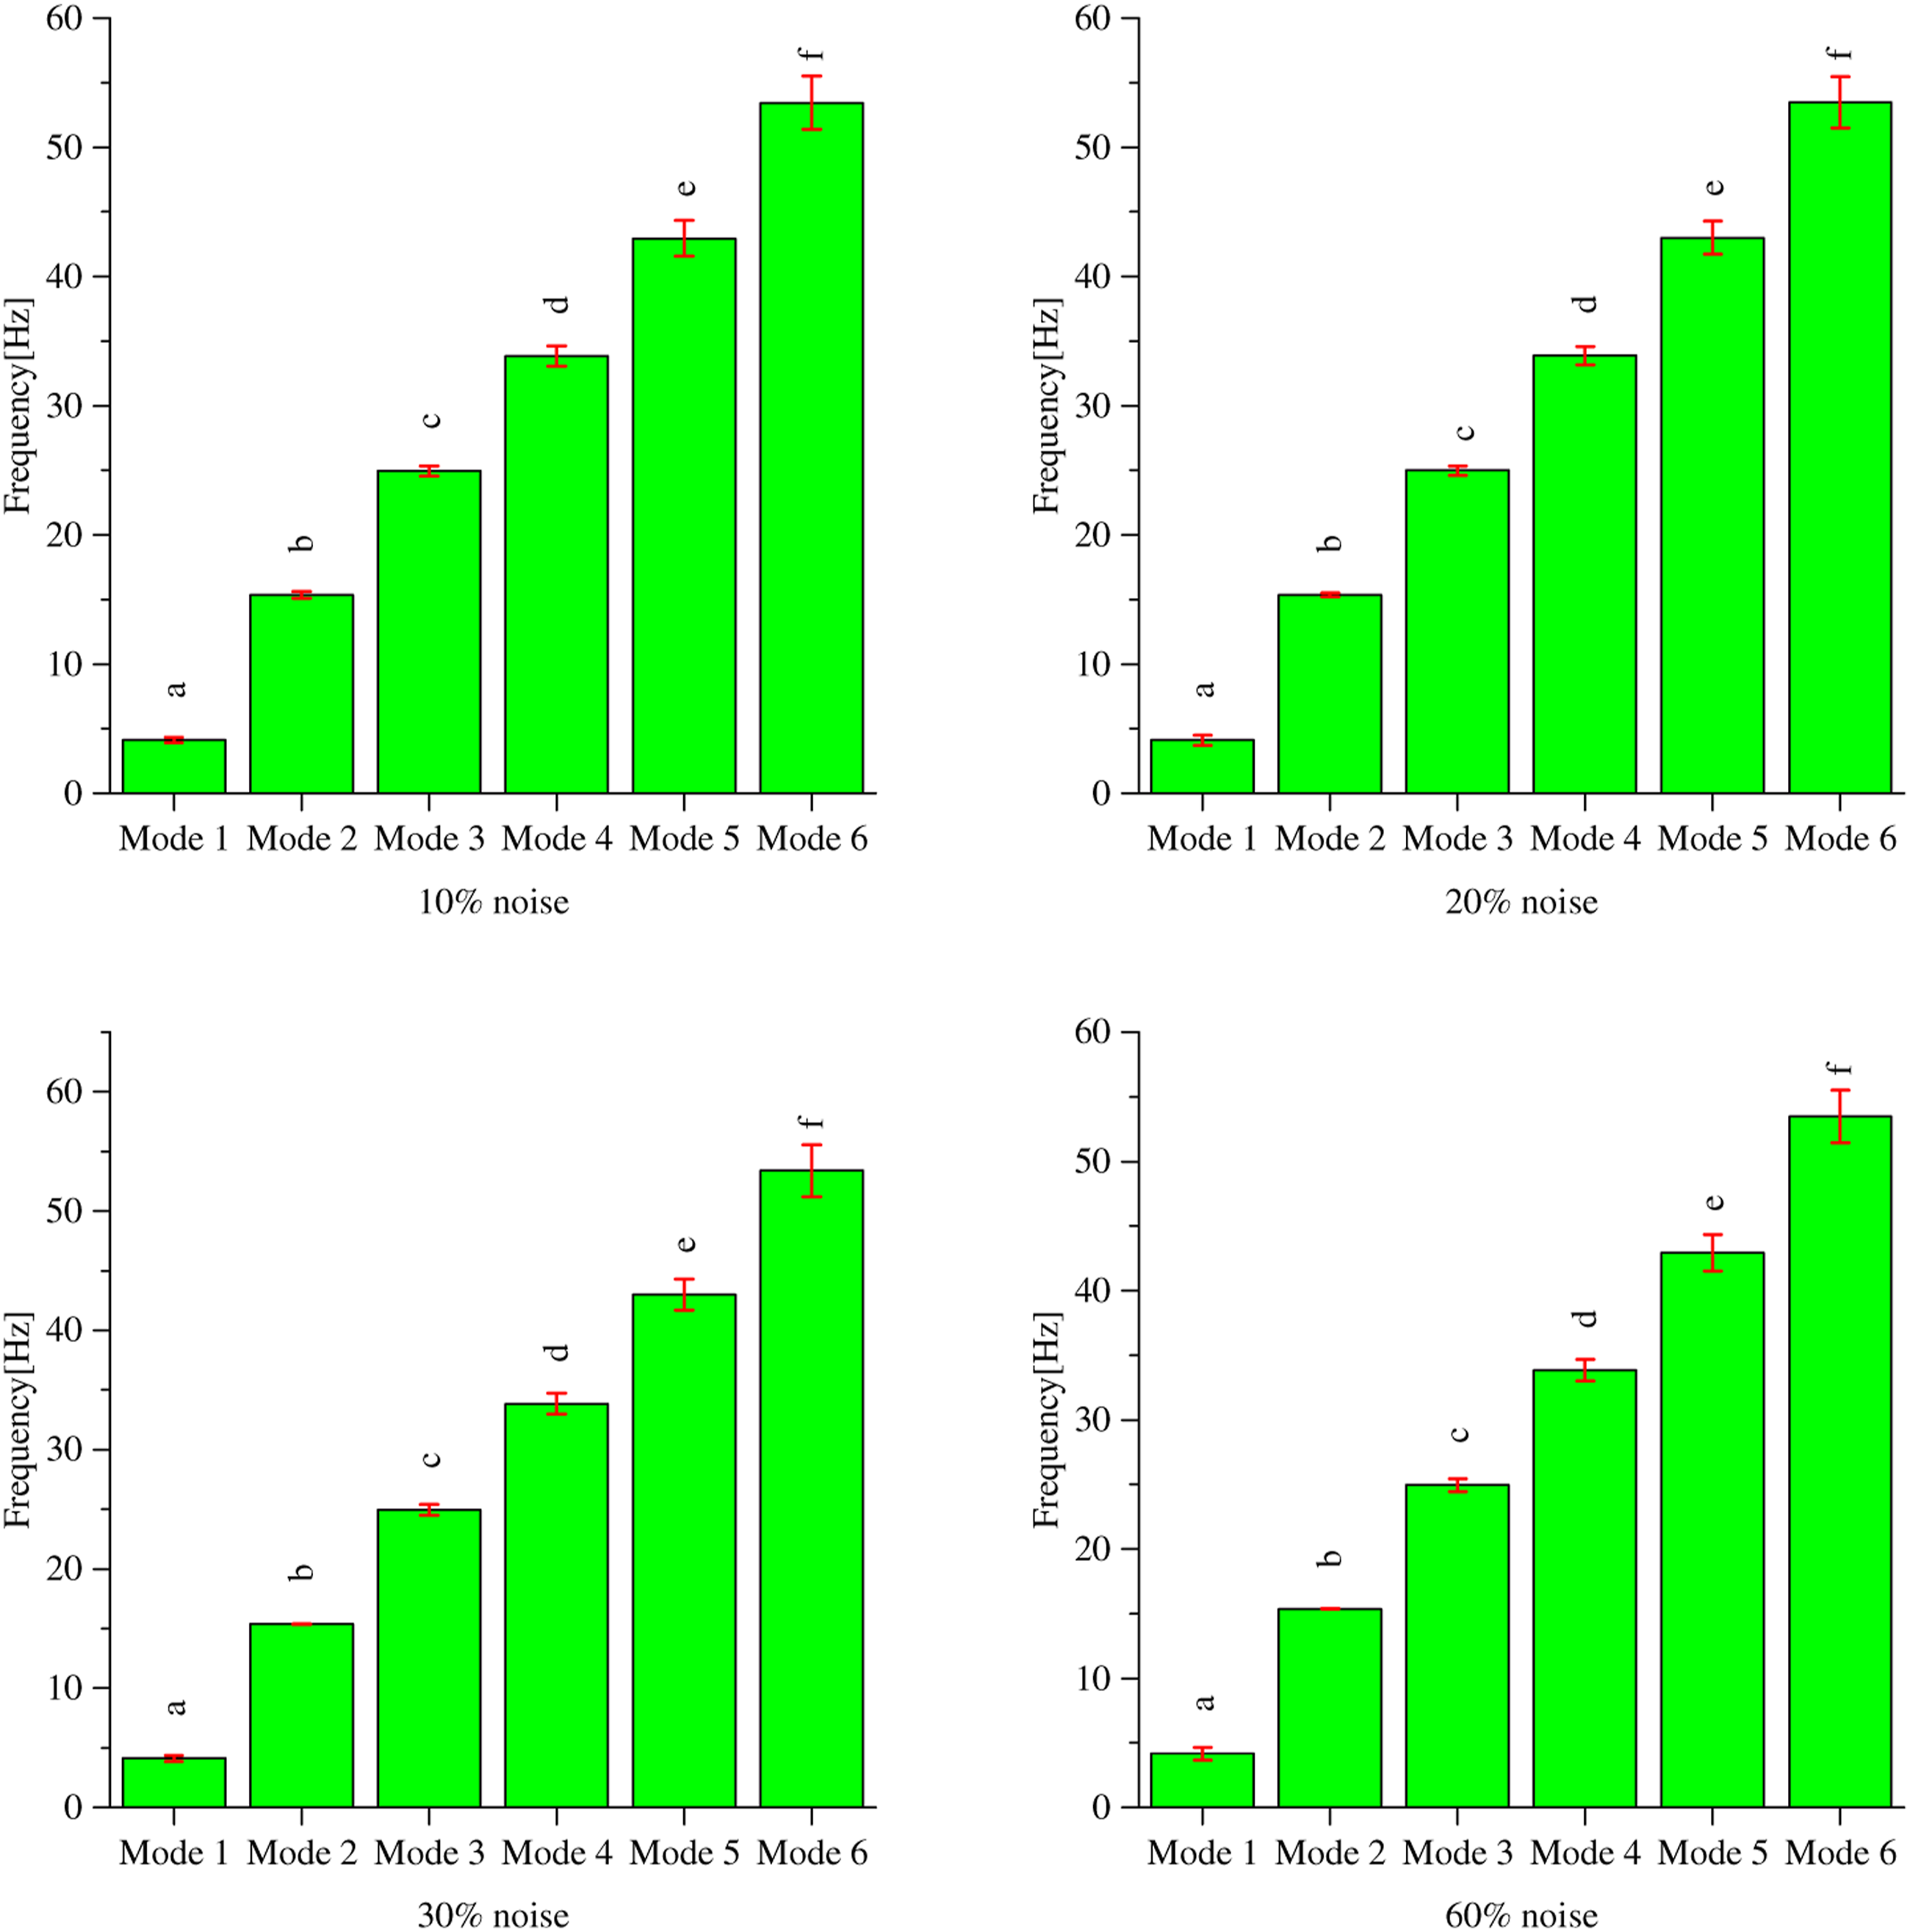
The error of automatic modal frequencies identification under different noise levels.
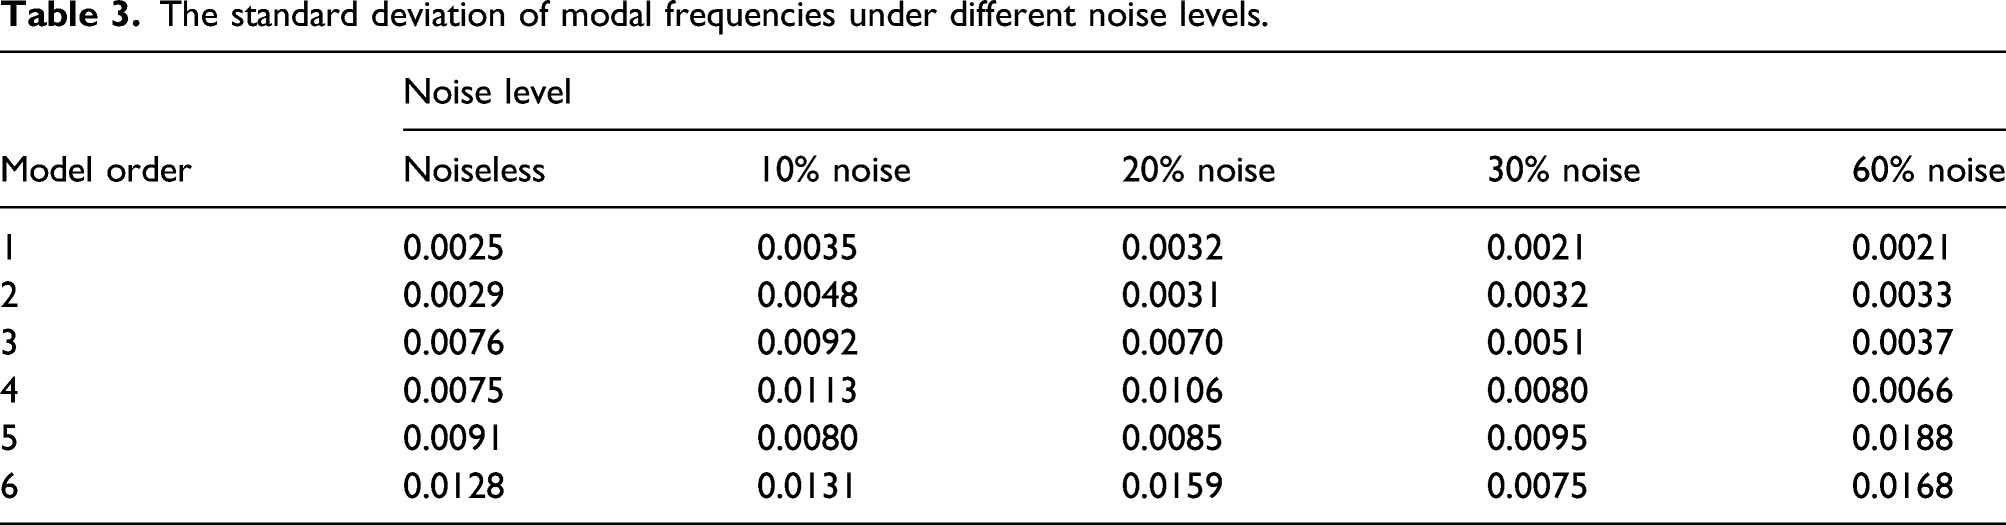
The standard deviation of modal frequencies under different noise levels.
Automatic identification and uncertainty quantification of different test groups
The statistical characteristics of modal frequency uncertainty based on Bootstrap.
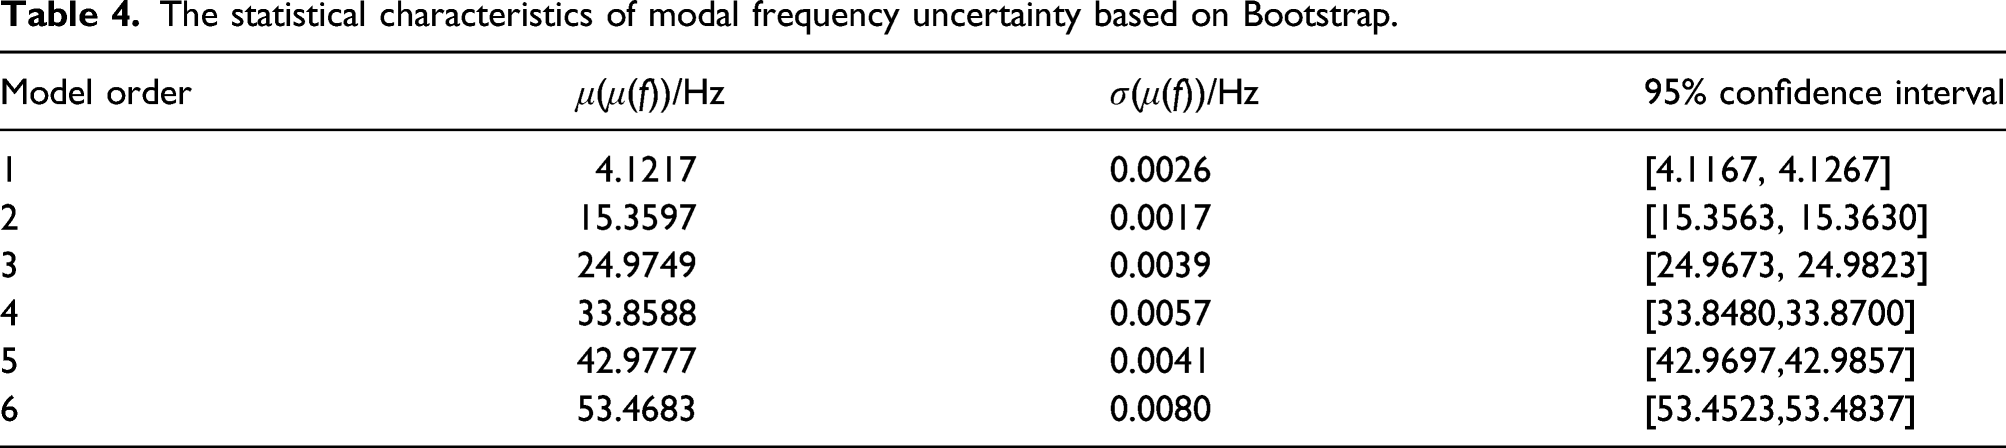
It is well understood that bootstrapping mimics the shape and spread of the original sampling distribution. However, bootstrapping is centered around the single sample statistic. Hence, its center might not coincide with that of the sampling distribution, which, in the absence of bias, is most likely to be centered around the population mean. It implies that the bootstrapping distribution obeys the normal distribution. Figure 9 shows that the modal frequency statistical histograms and probability have a certain normal distribution, as marked in the graph. For example, the bootstrap samples based on re-sampling first modal frequency obey the normal distribution of N (4.1219,0.00252). Also, the occurrence frequency of real modes is within the 95% confidence interval, which is relatively high. The first six modal frequency statistical histograms and probability distribution of the numerical result.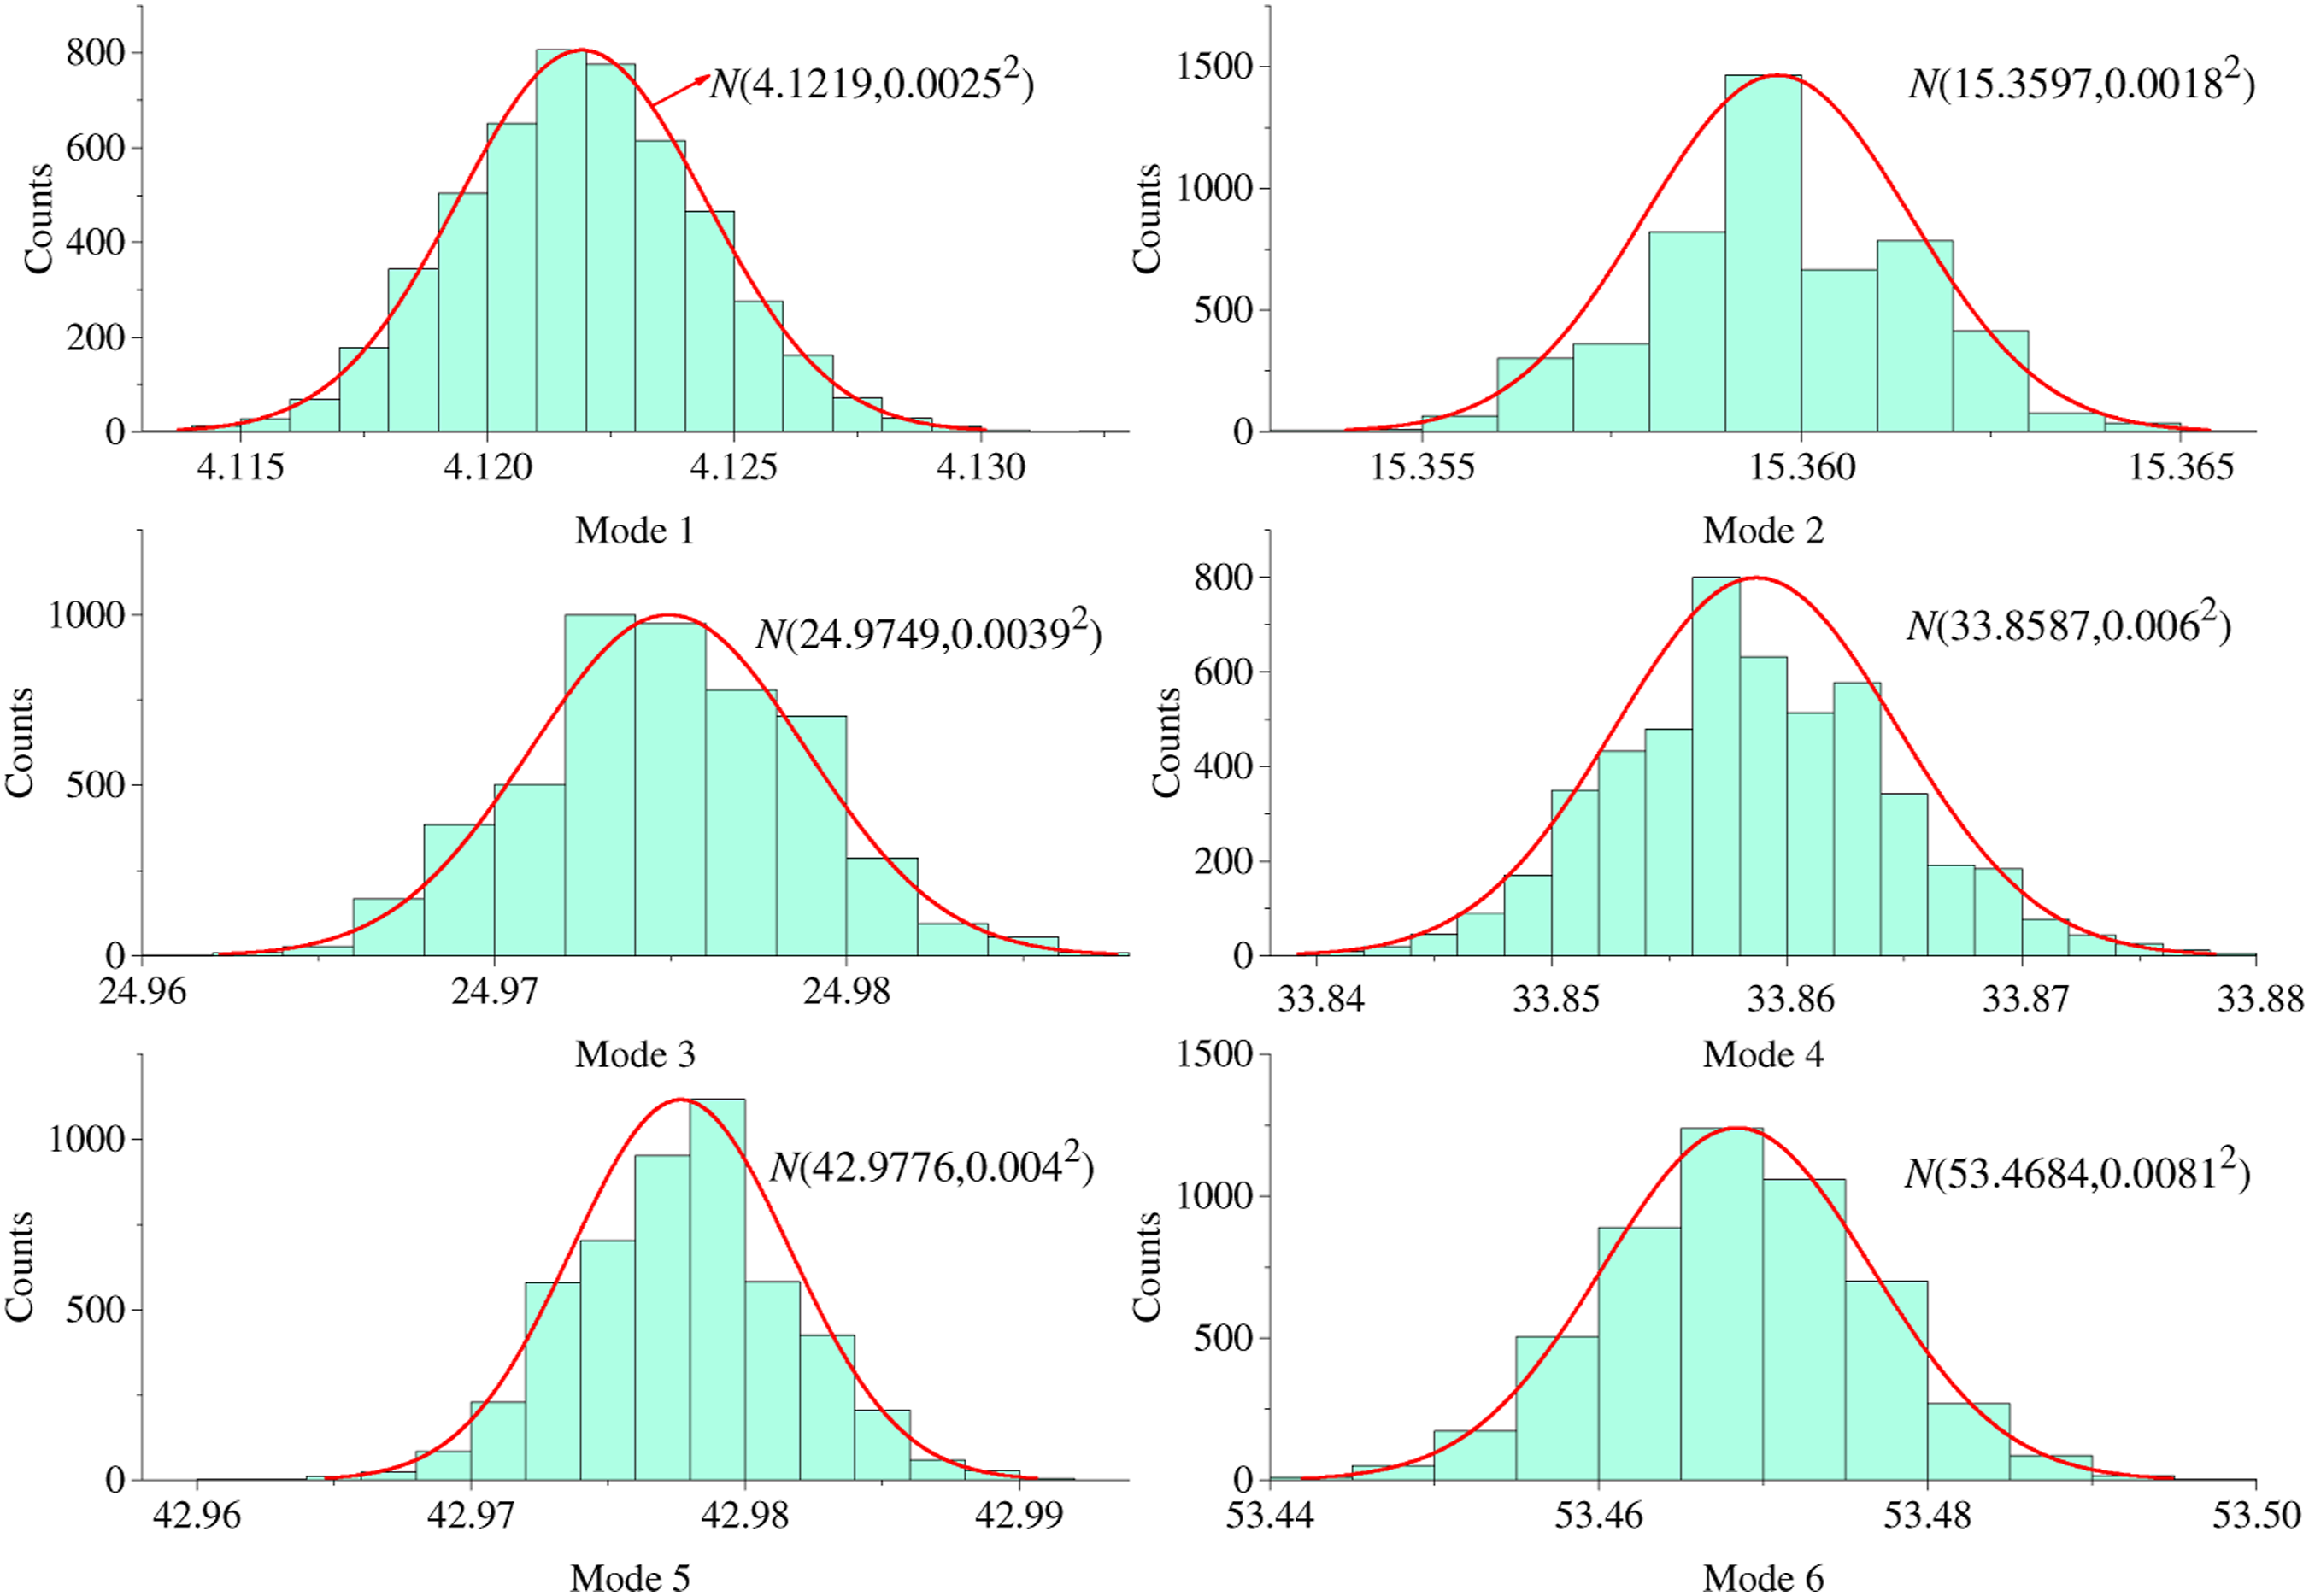
Case study II: Jing-yuan Yellow River Bridge
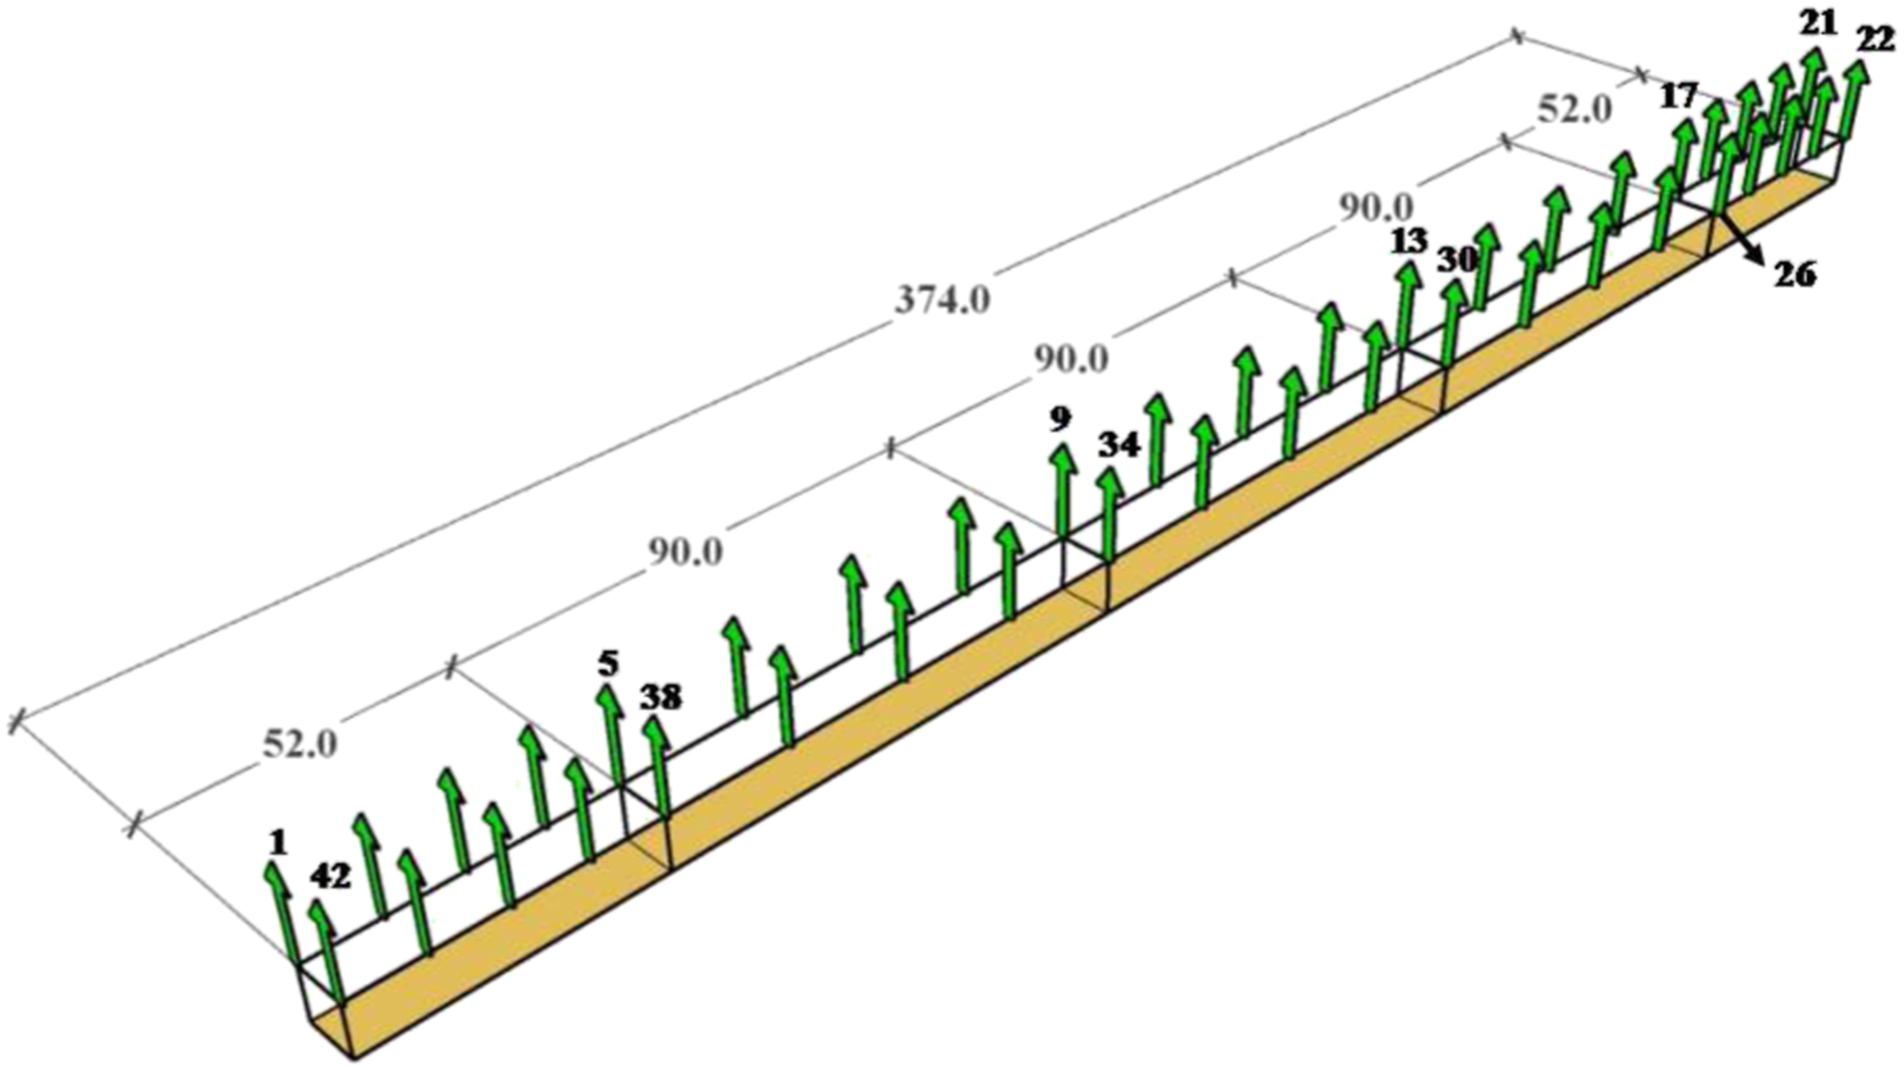
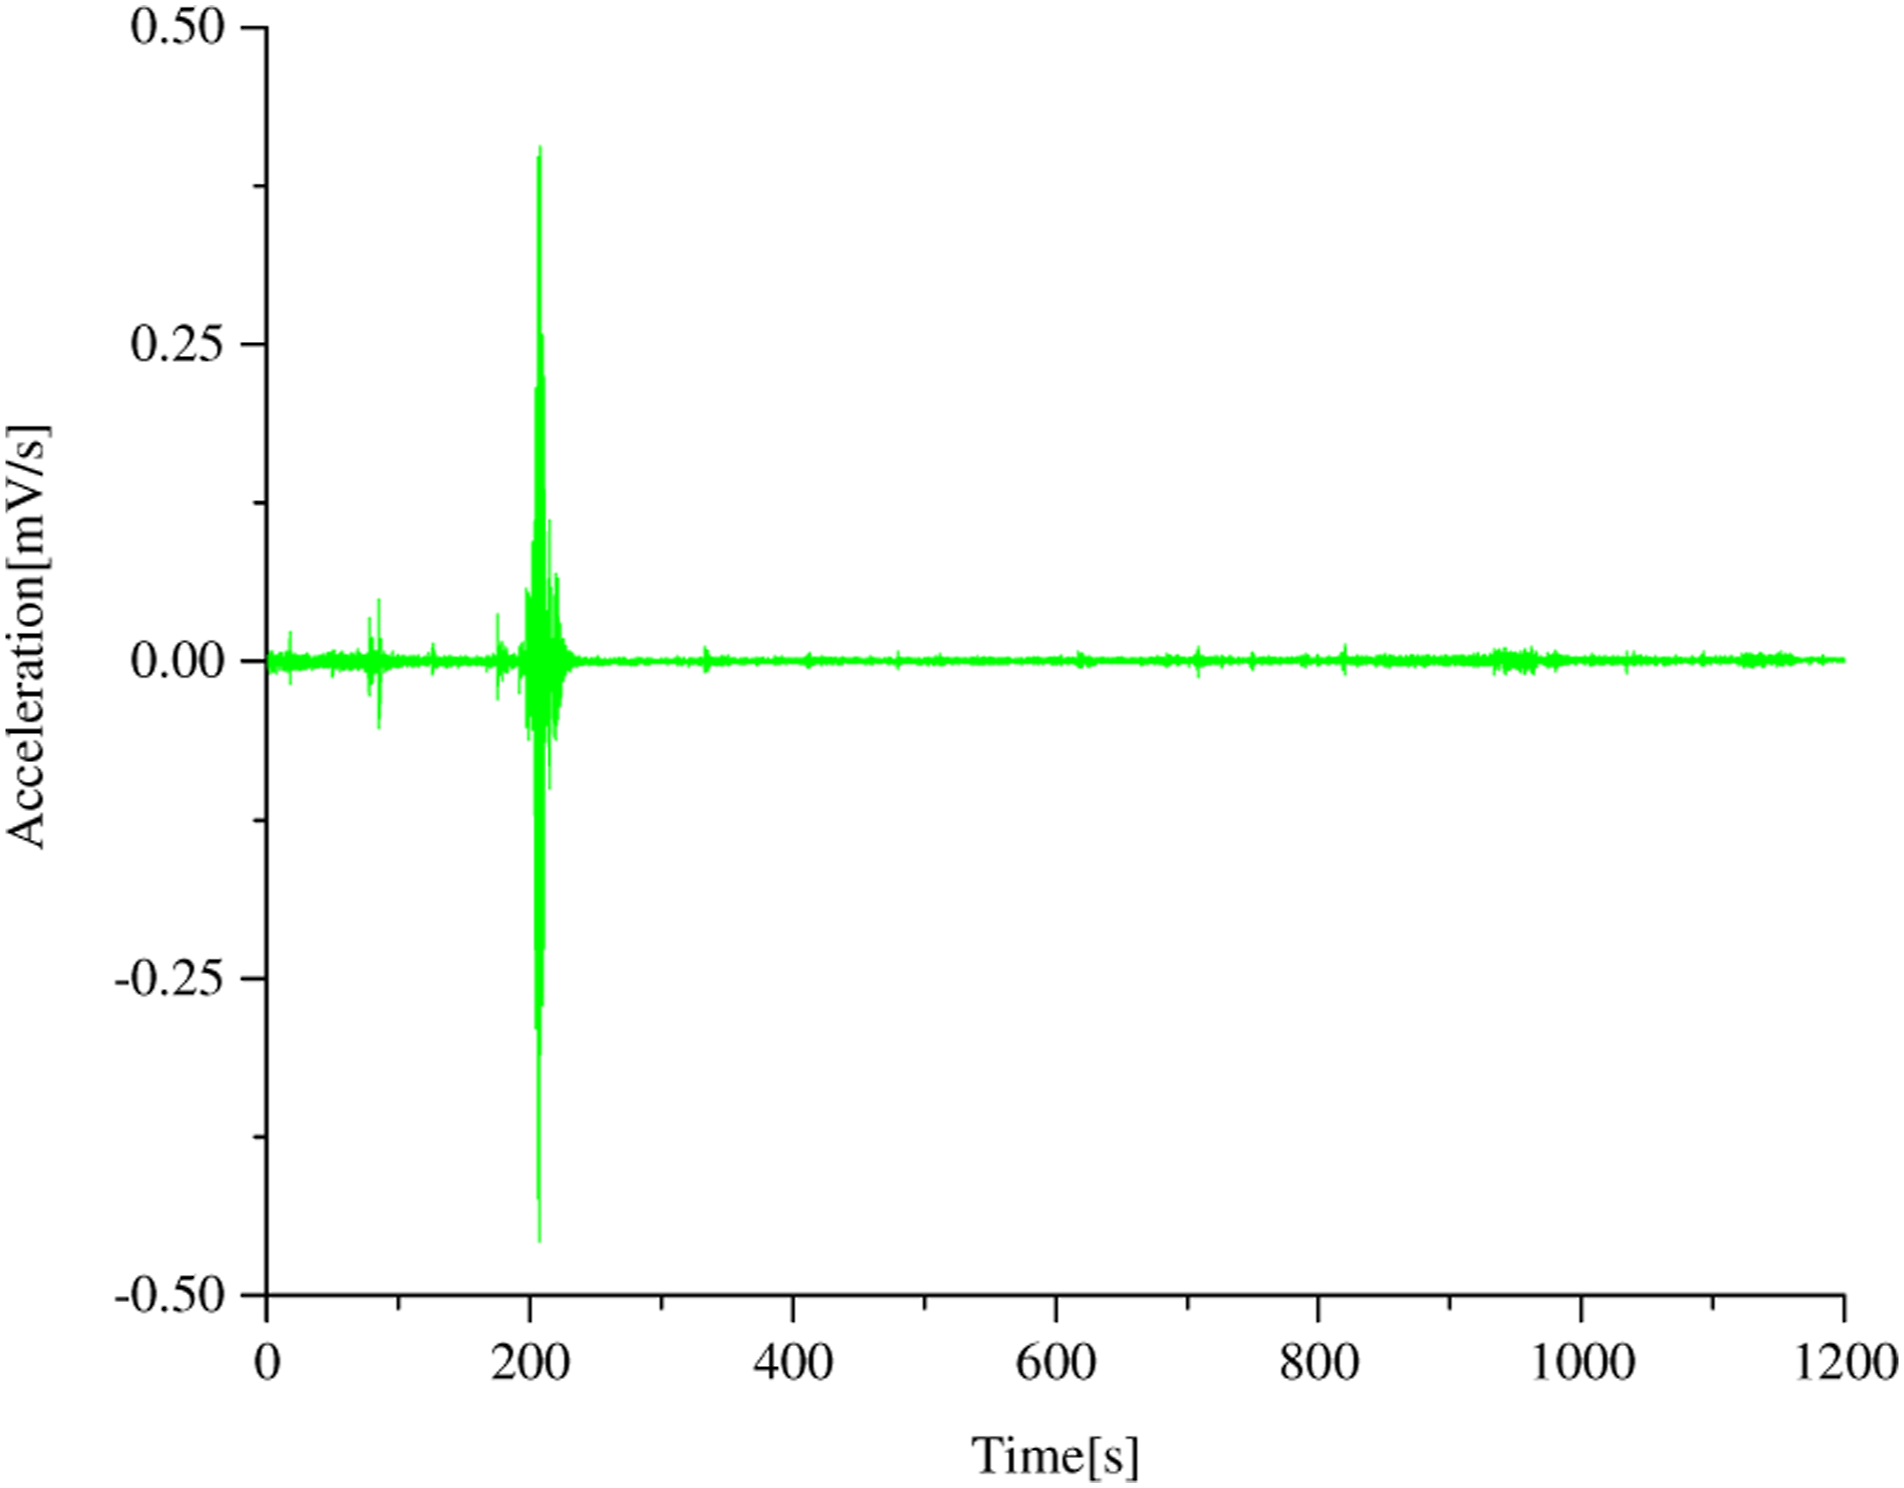
Jing-yuan Yellow River Bridge (Figure 10) is a five-span continuous rigid-frame bridge, with the main span of 52 + 3 × 90 + 52 m. The measuring points of the bridge vibration test are arranged as shown in Figure 11. Totally, 42 vertical measuring points are set up on both the upper and lower sides of the bridge. The vertical testing adopts vertical acceleration sensors, which are divided into seven groups of measurement. Figure 12 shows the time-history curve of the acceleration at the vertical measuring point 1. The sampling frequency of this vibration test is 102.405 Hz, and the sampling time is 20 min.
20
The rigid frame-continuous girder bridge. The layout of vertical measuring points. The acceleration curve at the vertical measuring point 1.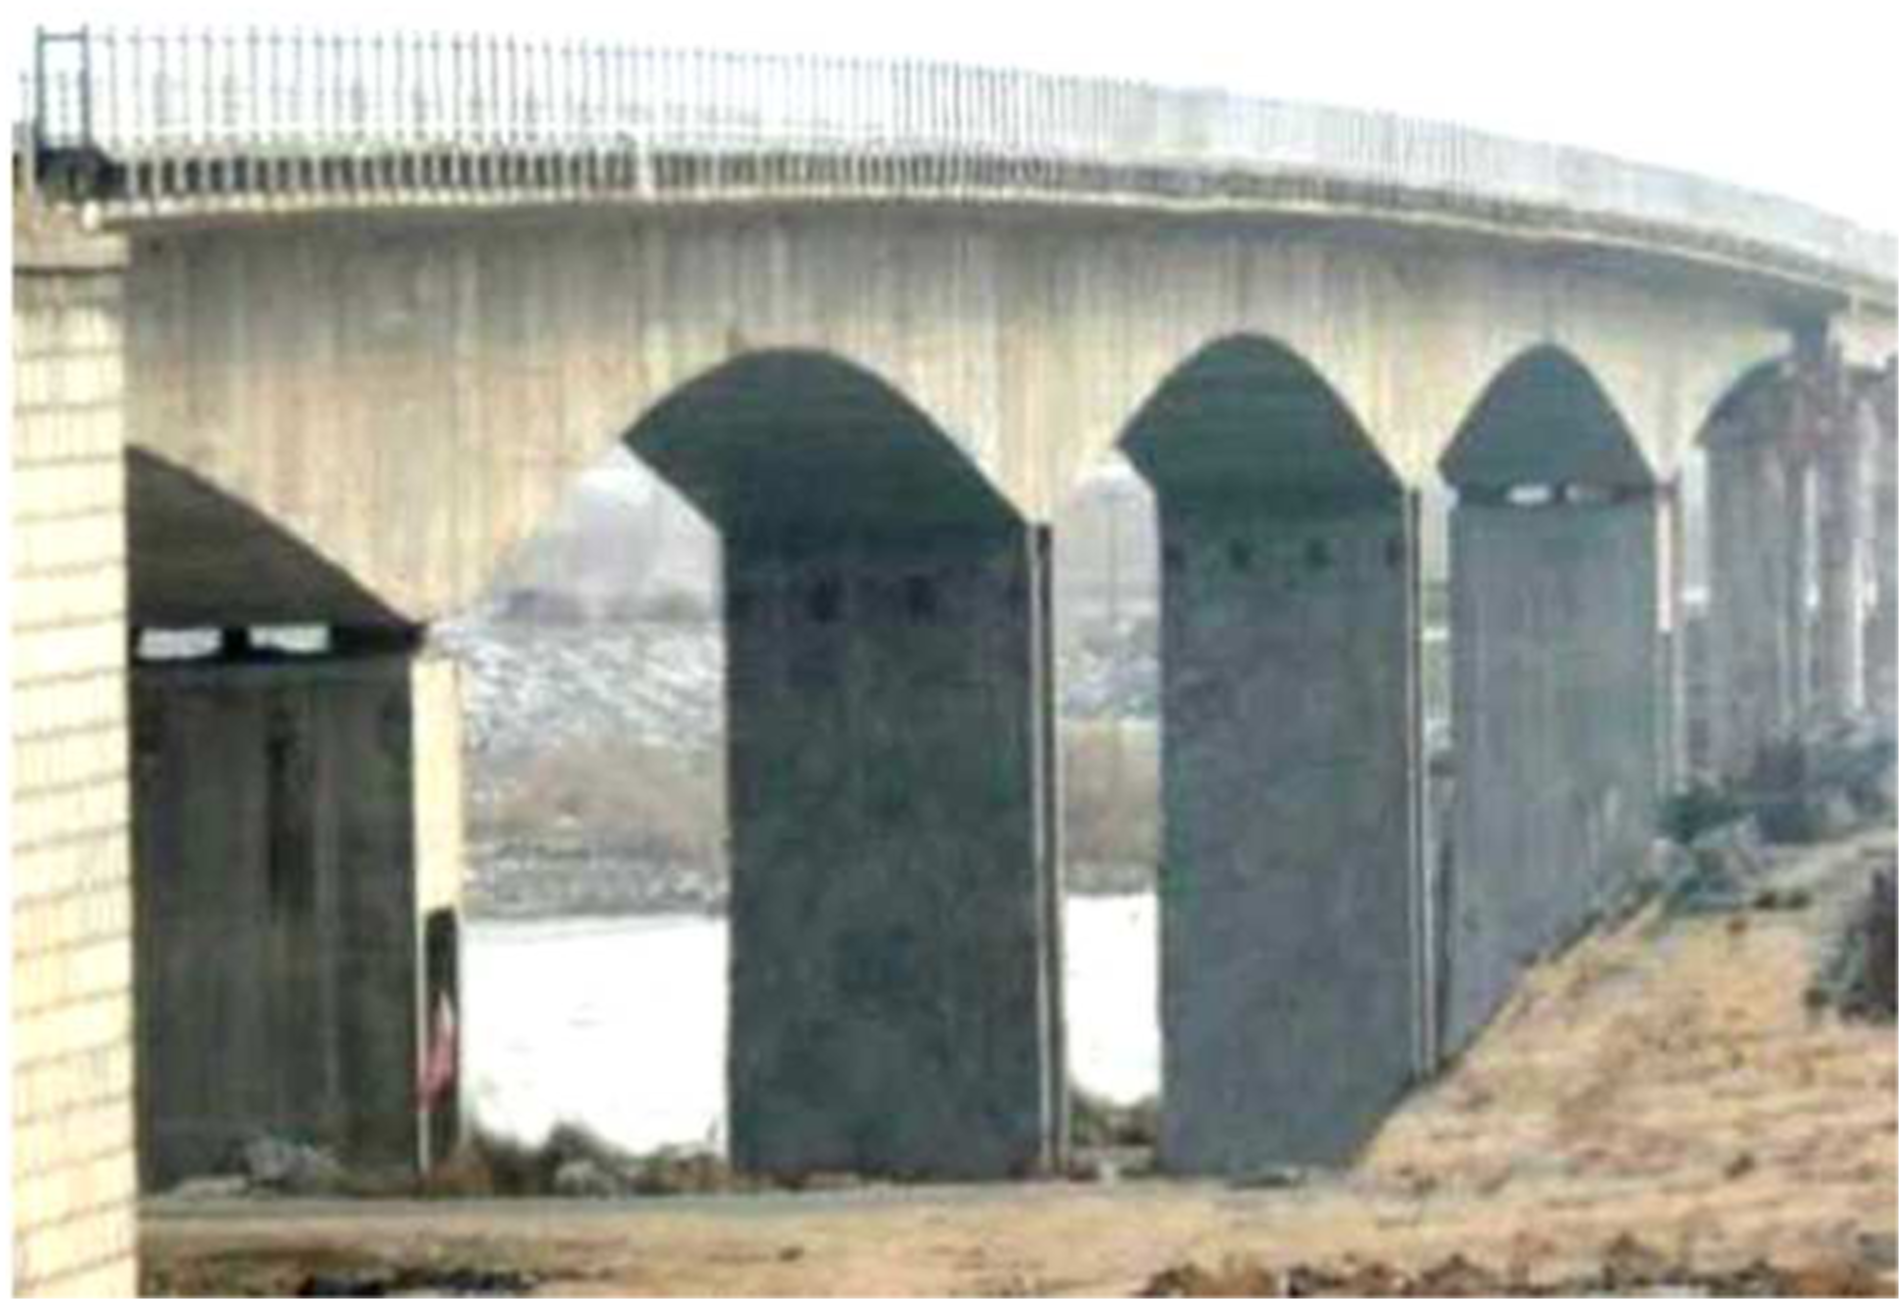
Automatic identification and uncertainty quantification of a setup
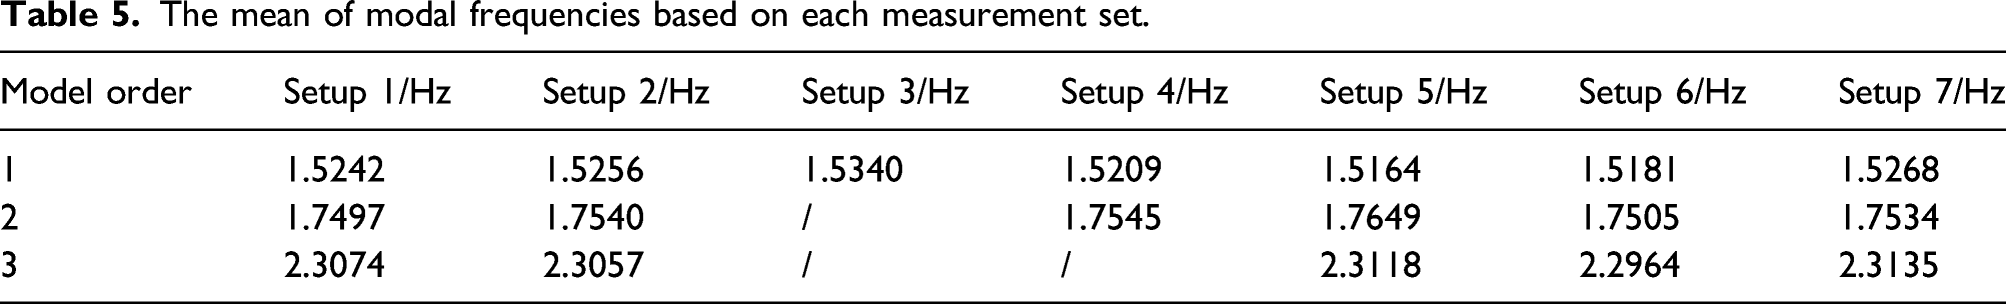
The proposed algorithm is used to identify the Jing-yuan Yellow River Bridge in the first three modal parameters in the vertical direction. According to Figure 13, the clustering of the real modal MDI value is more than a false modal, implying that the elements in clustering of a real mode are more than of a false mode, and the real mode can be obtained accurately by the true and false MDI. The vertical stabilization diagram based on the MDI index.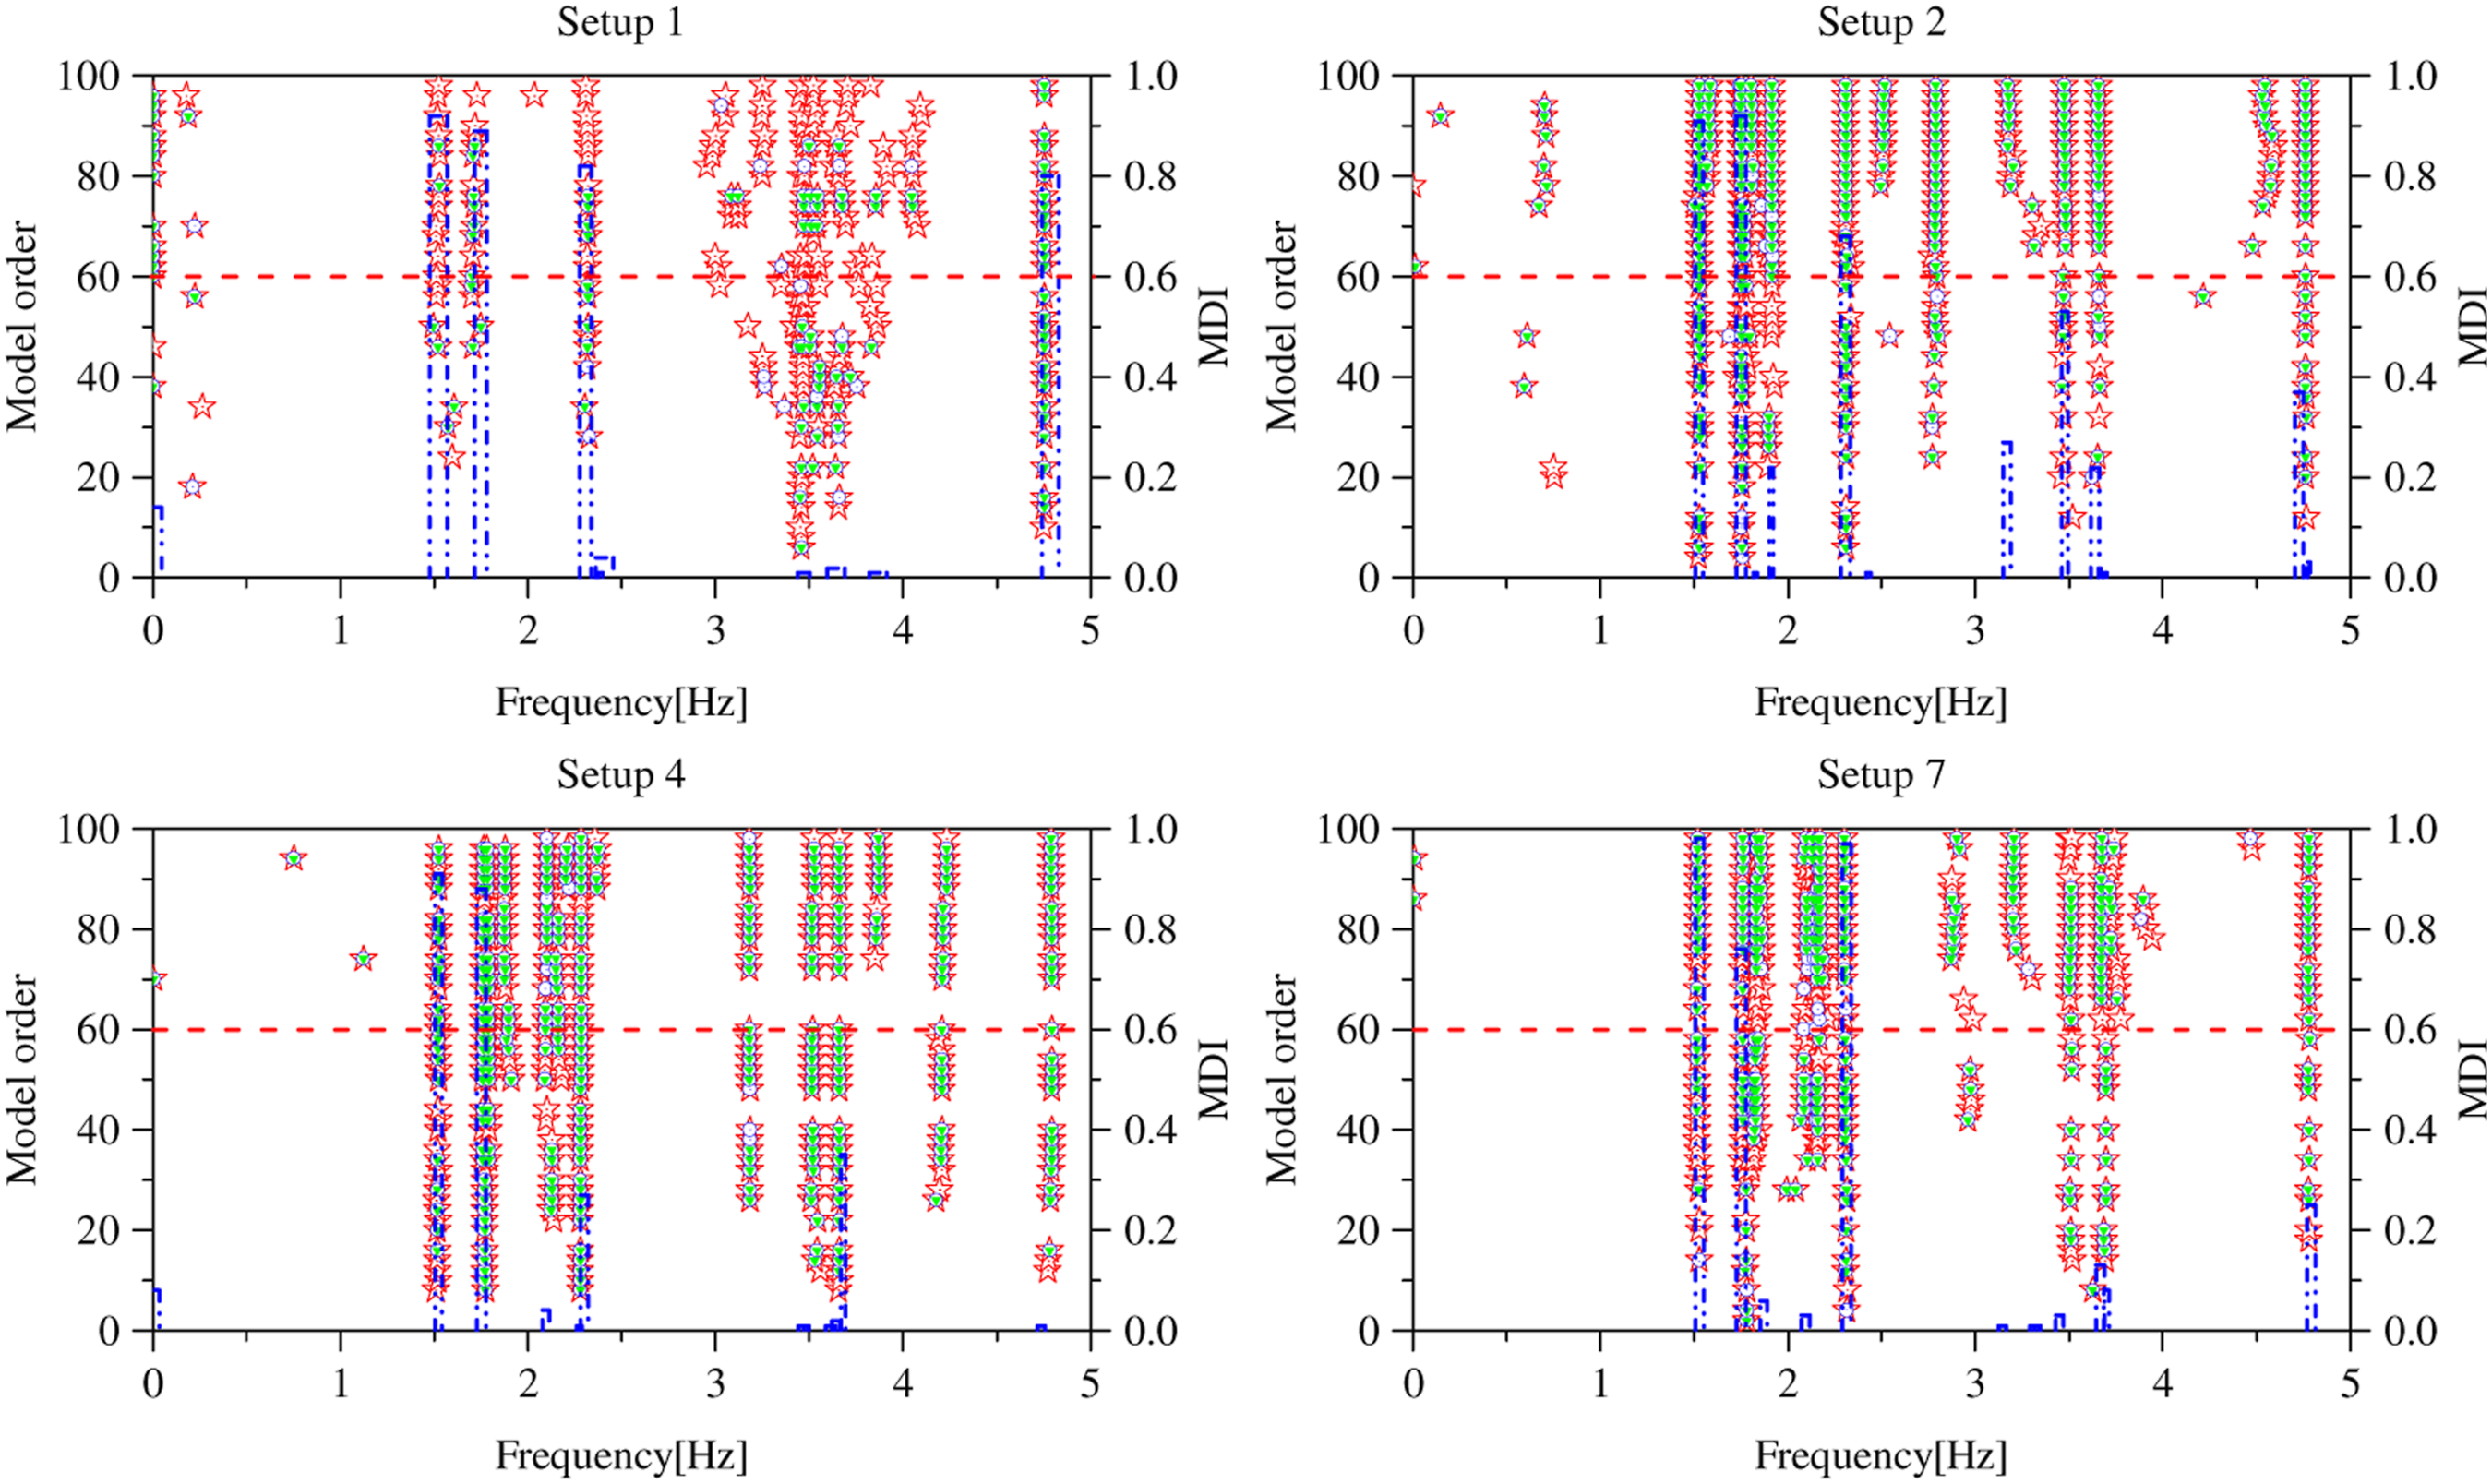
The mean of modal frequencies based on each measurement set.
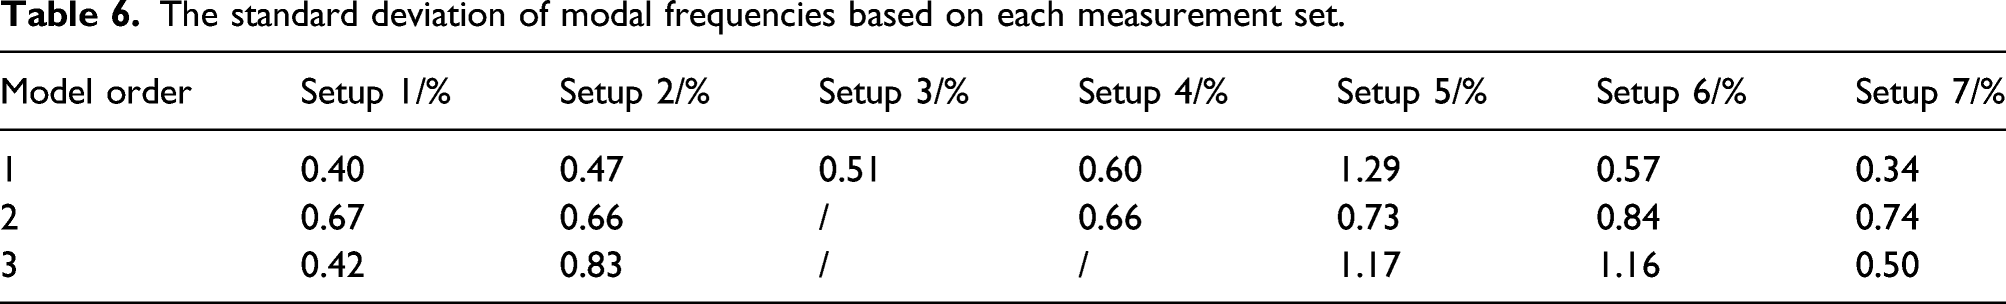
The standard deviation of modal frequencies based on each measurement set.
Automatic identification and uncertainty quantification of different test groups
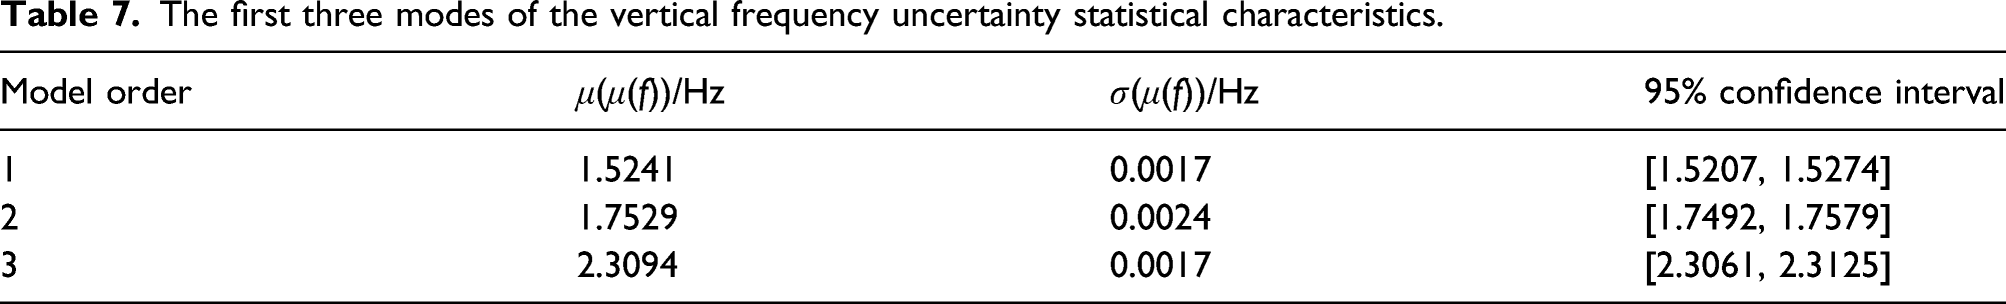
The first three modes of the vertical frequency uncertainty statistical characteristics.
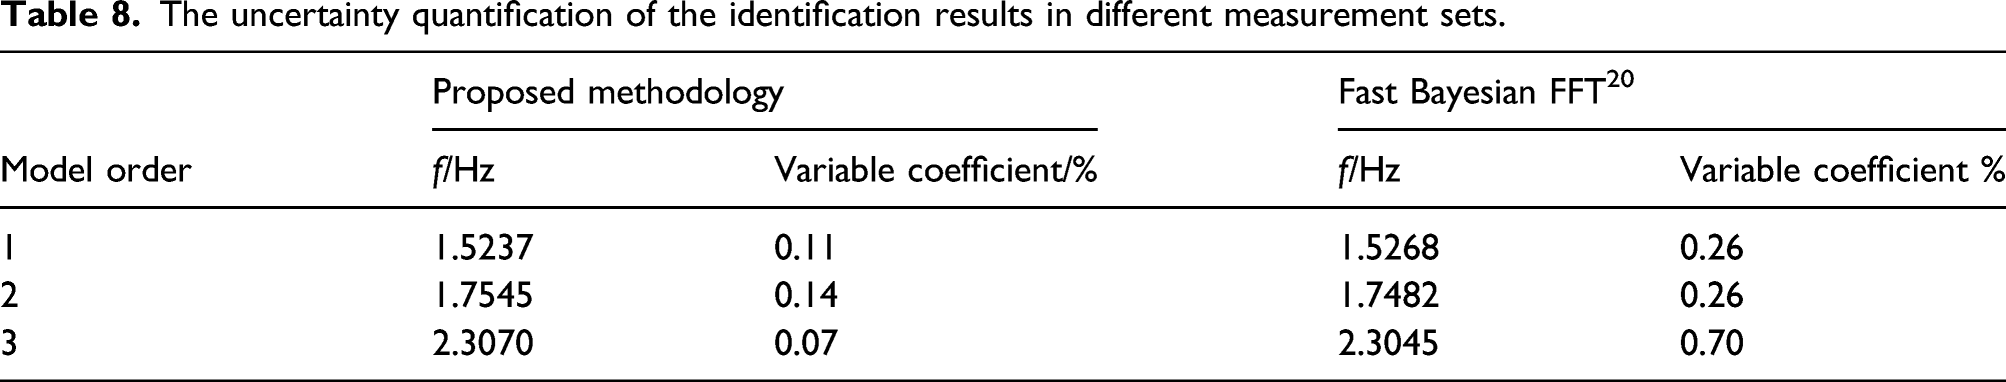
The uncertainty quantification of the identification results in different measurement sets.
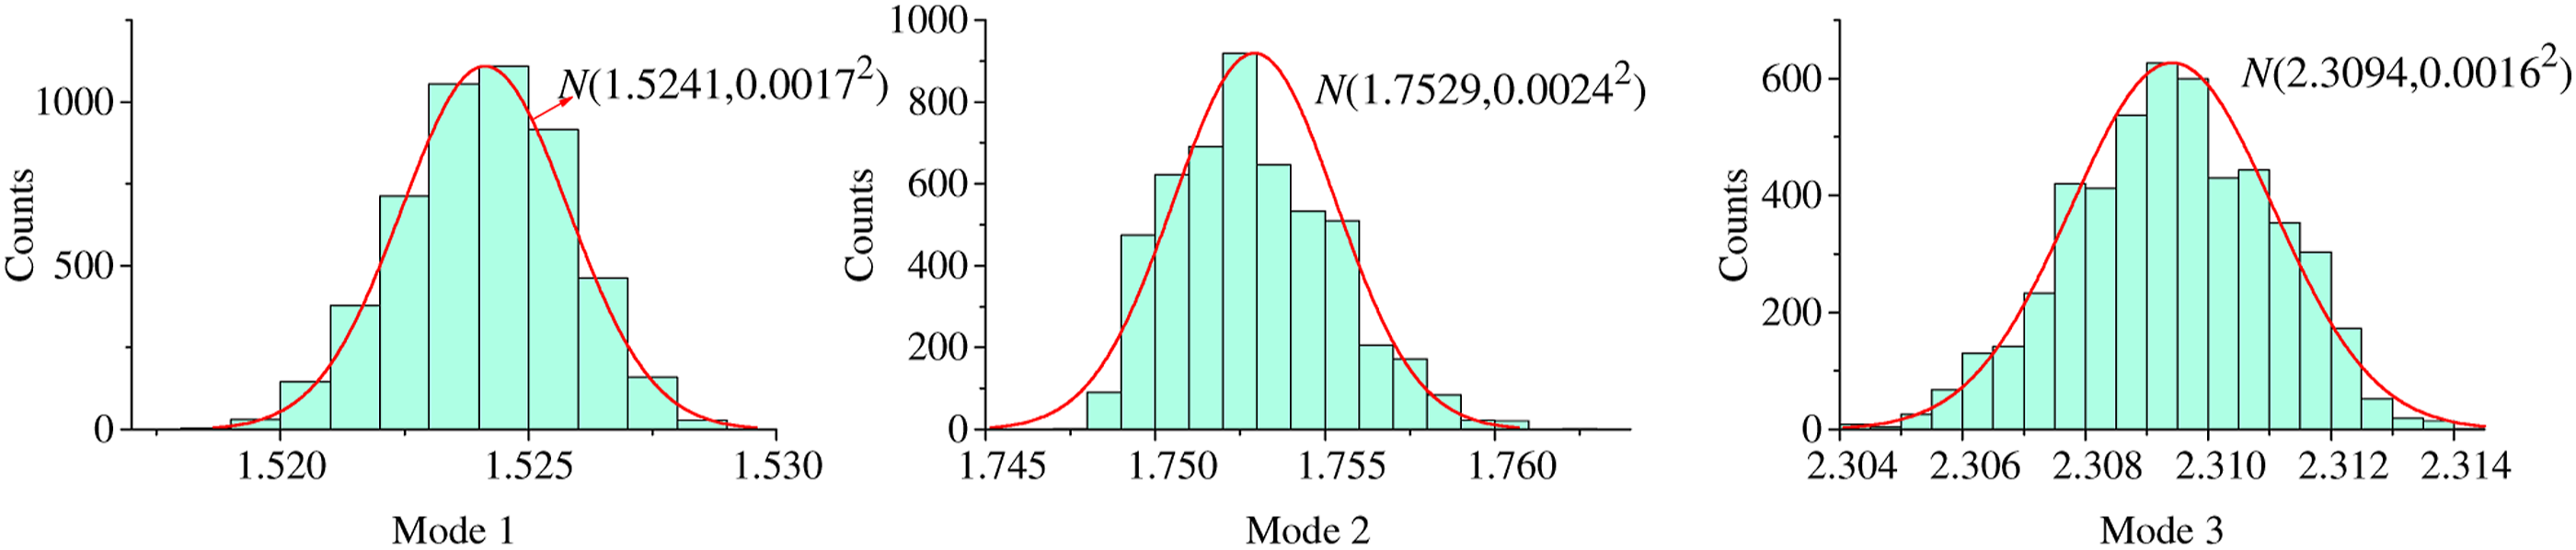
The statistical histogram and probability distribution of first three modal frequencies.
Conclusions
Automatic identification and uncertainty quantification method of modal parameters based on the Block-Bootstrap and multi-stage clustering under ambient excitation are proposed. The covariance-driven stochastic subspace identification method is also used to process a random sample of data. In addition, the hierarchical clustering method is applied to perform the secondary clustering of the picked stable axis, and the false modes are eliminated according to the proposed true and false modal discrimination index. Note that the numerical simulation and real bridge modal parameter identification are used for verification, and the errors and standard deviations are within the permissible range, the results show that proposed methodology is feasible. The following conclusions can be derived from this study: The true and false MDI has better performance in identifying true and false modals, and it can eliminate more false modal parameters, which the error of the identification frequency and the calculation frequency under various noises is less than 2.19% in the 6-DOF system. It is considerable that the standard deviation of modal frequencies uncertainty based on Bootstrap in the 6-DOF system and real bridge is less than 0.8%, 0.24%, respectively. Therefore, it can be said that by the Block-Bootstrap re-sampling, the influence of the uncertainty of the clustering algorithm on the identification results can be reduced and quantified, and the robustness of the algorithm can be improved. Based on the FCM method and the hierarchical clustering algorithm, the stable axis in the stabilization diagram is automatically picked up, and the automatic identification of modal parameters is realized. The identification results are basically consistent with those of the fast Bayesian FFT algorithm, with high precision and computational efficiency. The proposed method can also be used for automatic identification of modal parameters of structural health monitoring and automatic batch analysis of off-line acceleration data.
Footnotes
Declaration of conflicting interests
The author(s) declared no potential conflicts of interest with respect to the research, authorship, and/or publication of this article.
Funding
The author(s) disclosed receipt of the following financial support for the research, authorship, and/or publication of this article: This research is financially supported by the National Natural Science Foundation of China (Grant No. 51808122), Natural Science Foundation of Fujian Province (Grants No. 2020J01580), and Key Laboratory for Structural Engineering and Disaster Prevention of Fujian Province (Huaqiao University) (Grant No. SEDPFJ-2018-01). The authors express their sincerest gratitude for the support.