
Abstract
Vibration and noise parameters have a significant influence on the performance of permanent magnet motor (PMM). A new method of reducing vibration and noise of PMM was proposed in this study by optimizing the stator teeth profile. The optimal offset distance was determined by finite element method, and the results indicate that the vibration and noise amplitude become larger when the frequency is an even multiple of the fundamental frequency. The maximum and average vibration acceleration of the optimized PMM is reduced by 22.27% and 11.11%, respectively, and the total sound pressure level (SPL) is decreased by 3.67%. Finally, the correctness of the theoretical parameters was verified by the vibration and noise measuring experiment. The experimental data suggest that the average acceleration error is 7.07%, and the average SPL error is 2.28%. The research methods and conclusions of this study may be extended to the vibration and noise optimization of other PMM.
Keywords
Introduction
Permanent magnet motor (PMM) has a series of advantages, such as high efficiency, high power density, good speed regulation characteristics, and so on .1–4 The excitation field of PMM is built up by the permanent magnet rather than the excitation winding .5–6 In this way, the copper consumption and resistance loss of PMM can be greatly reduced .7–8
Vibration and noise parameters have become key indicators to measure the performance of PMM .9–10 In general, the vibration and noise generated by PMM will be directly or indirectly transmitted to the human ear .11–12 Vibration not only accelerates fatigue damage and energy consumption but also causes subjective discomfort. Noise spreads in solids, liquids, and gases, seriously affecting people’s life and work and even harming their health .13–15 For PMM, the mechanical vibration and noise mainly come from the eccentric movement , 16 and the main source of aerodynamic noise of PMM is caused by the cooling fan . 17 There are already some effective approaches to reduce vibration and noise caused by mechanical and aerodynamic sources. Electromagnetic vibration and noise of PMM caused by the electromagnetic force should not be ignored . 18 It is of great significance to effectively reduce electromagnetic vibration and noise for improving the PMM performance.
In the past two decades, a number of researchers have sought to reduce the electromagnetic vibration and noise of PMM. Surveys such as that conducted by Rick et al. (2016) have put forward a new surface-mounted magnetic pole structure composed of magnetic conducting metal and permanent magnet which can restrain cogging torque and torque ripple effectively . 19 One significant study by Scuiller et al. (2014) found that the vibration and noise of PMM can be reduced by slotting the rotor. In this way, the harmonic waves of the magnetic induction intensity (MII) of the air gap can be effectively suppressed . 20 A method to reduce the noise of surface-mounted PMM by asymmetric magnetic barrier was proposed by Howard (2015). The total sound pressure level (SPL) under the rated working condition of PMM is reduced by 2.71 dB . 21 Xiaohua Li et al. (2020) studied the 8-pole and 48-slot embedded PMM with rated power of 5 kW, and the vibration and noise parameters of PMM were reduced by optimizing the rotor chamfer. Maximum vibration acceleration was decreased by 8.42% . 22 In a comprehensive study of stator modal, Xiaoyuan Wang et al. (2019) reported that when the aspect ratio of the stator is less than 0.3, the error of modal parameters calculated by the analytical method is larger. When the aspect ratio is in the range of 0.4–1, the error is less than 10% . 23 Chai et al. (2016) analyzed the influence of permanent magnet parameters on cogging torque and the no-load cogging torque, rated output torque and torque ripple were also analyzed by finite element method. The results advice that the aspect ratio of permanent magnet has a significant effect on cogging torque and torque ripple . 24 Previous studies have demonstrated that the vibration and noise of PMM can be optimized in a variety of ways. At present, the most commonly used methods for PMM vibration and noise reduction are to optimize the permanent magnet and the stator modal parameters. Practice has proved that these methods are effective.
So far, however, there are some limitations of previous research. First, most studies can effectively reduce the vibration and noise of PMM, but the output torque is greatly weakened. The output torque under rated operating condition may often be reduced by more than 5% by slotting on the rotor, optimizing permanent magnet shape, and setting asymmetric magnetic barriers. Second, the manufacturing cost and processing difficulty will be increased if the previous optimized methods are adopted. The above problems can be solved effectively in this study.
A new method of reducing the vibration and noise of PMM is proposed in this study. The remaining parts of the study are organized as follows. The radial electromagnetic force (REF) is analyzed and the excitation frequencies of REF are calculated in the section REF Calculation and Analysis. The process of optimizing stator teeth profile is described in detail in the section Vibration and Noise Reduction Method. The analysis of modal parameters is conducted in the section Modal Analysis. The correctness of the optimization method is verified by finite element simulation in the section Simulation and Analysis of Vibration and Noise. The vibration and noise parameters of the optimized PMM are measured in the section Vibration and Noise Measuring Experiment to further support theoretical analysis. The innovative points of this study are expounded in the section Discussion. Finally, the research methods and conclusions of this study are analyzed and summarized in the section Conclusions. The detailed block diagram is displayed in Figure 1. The block diagram.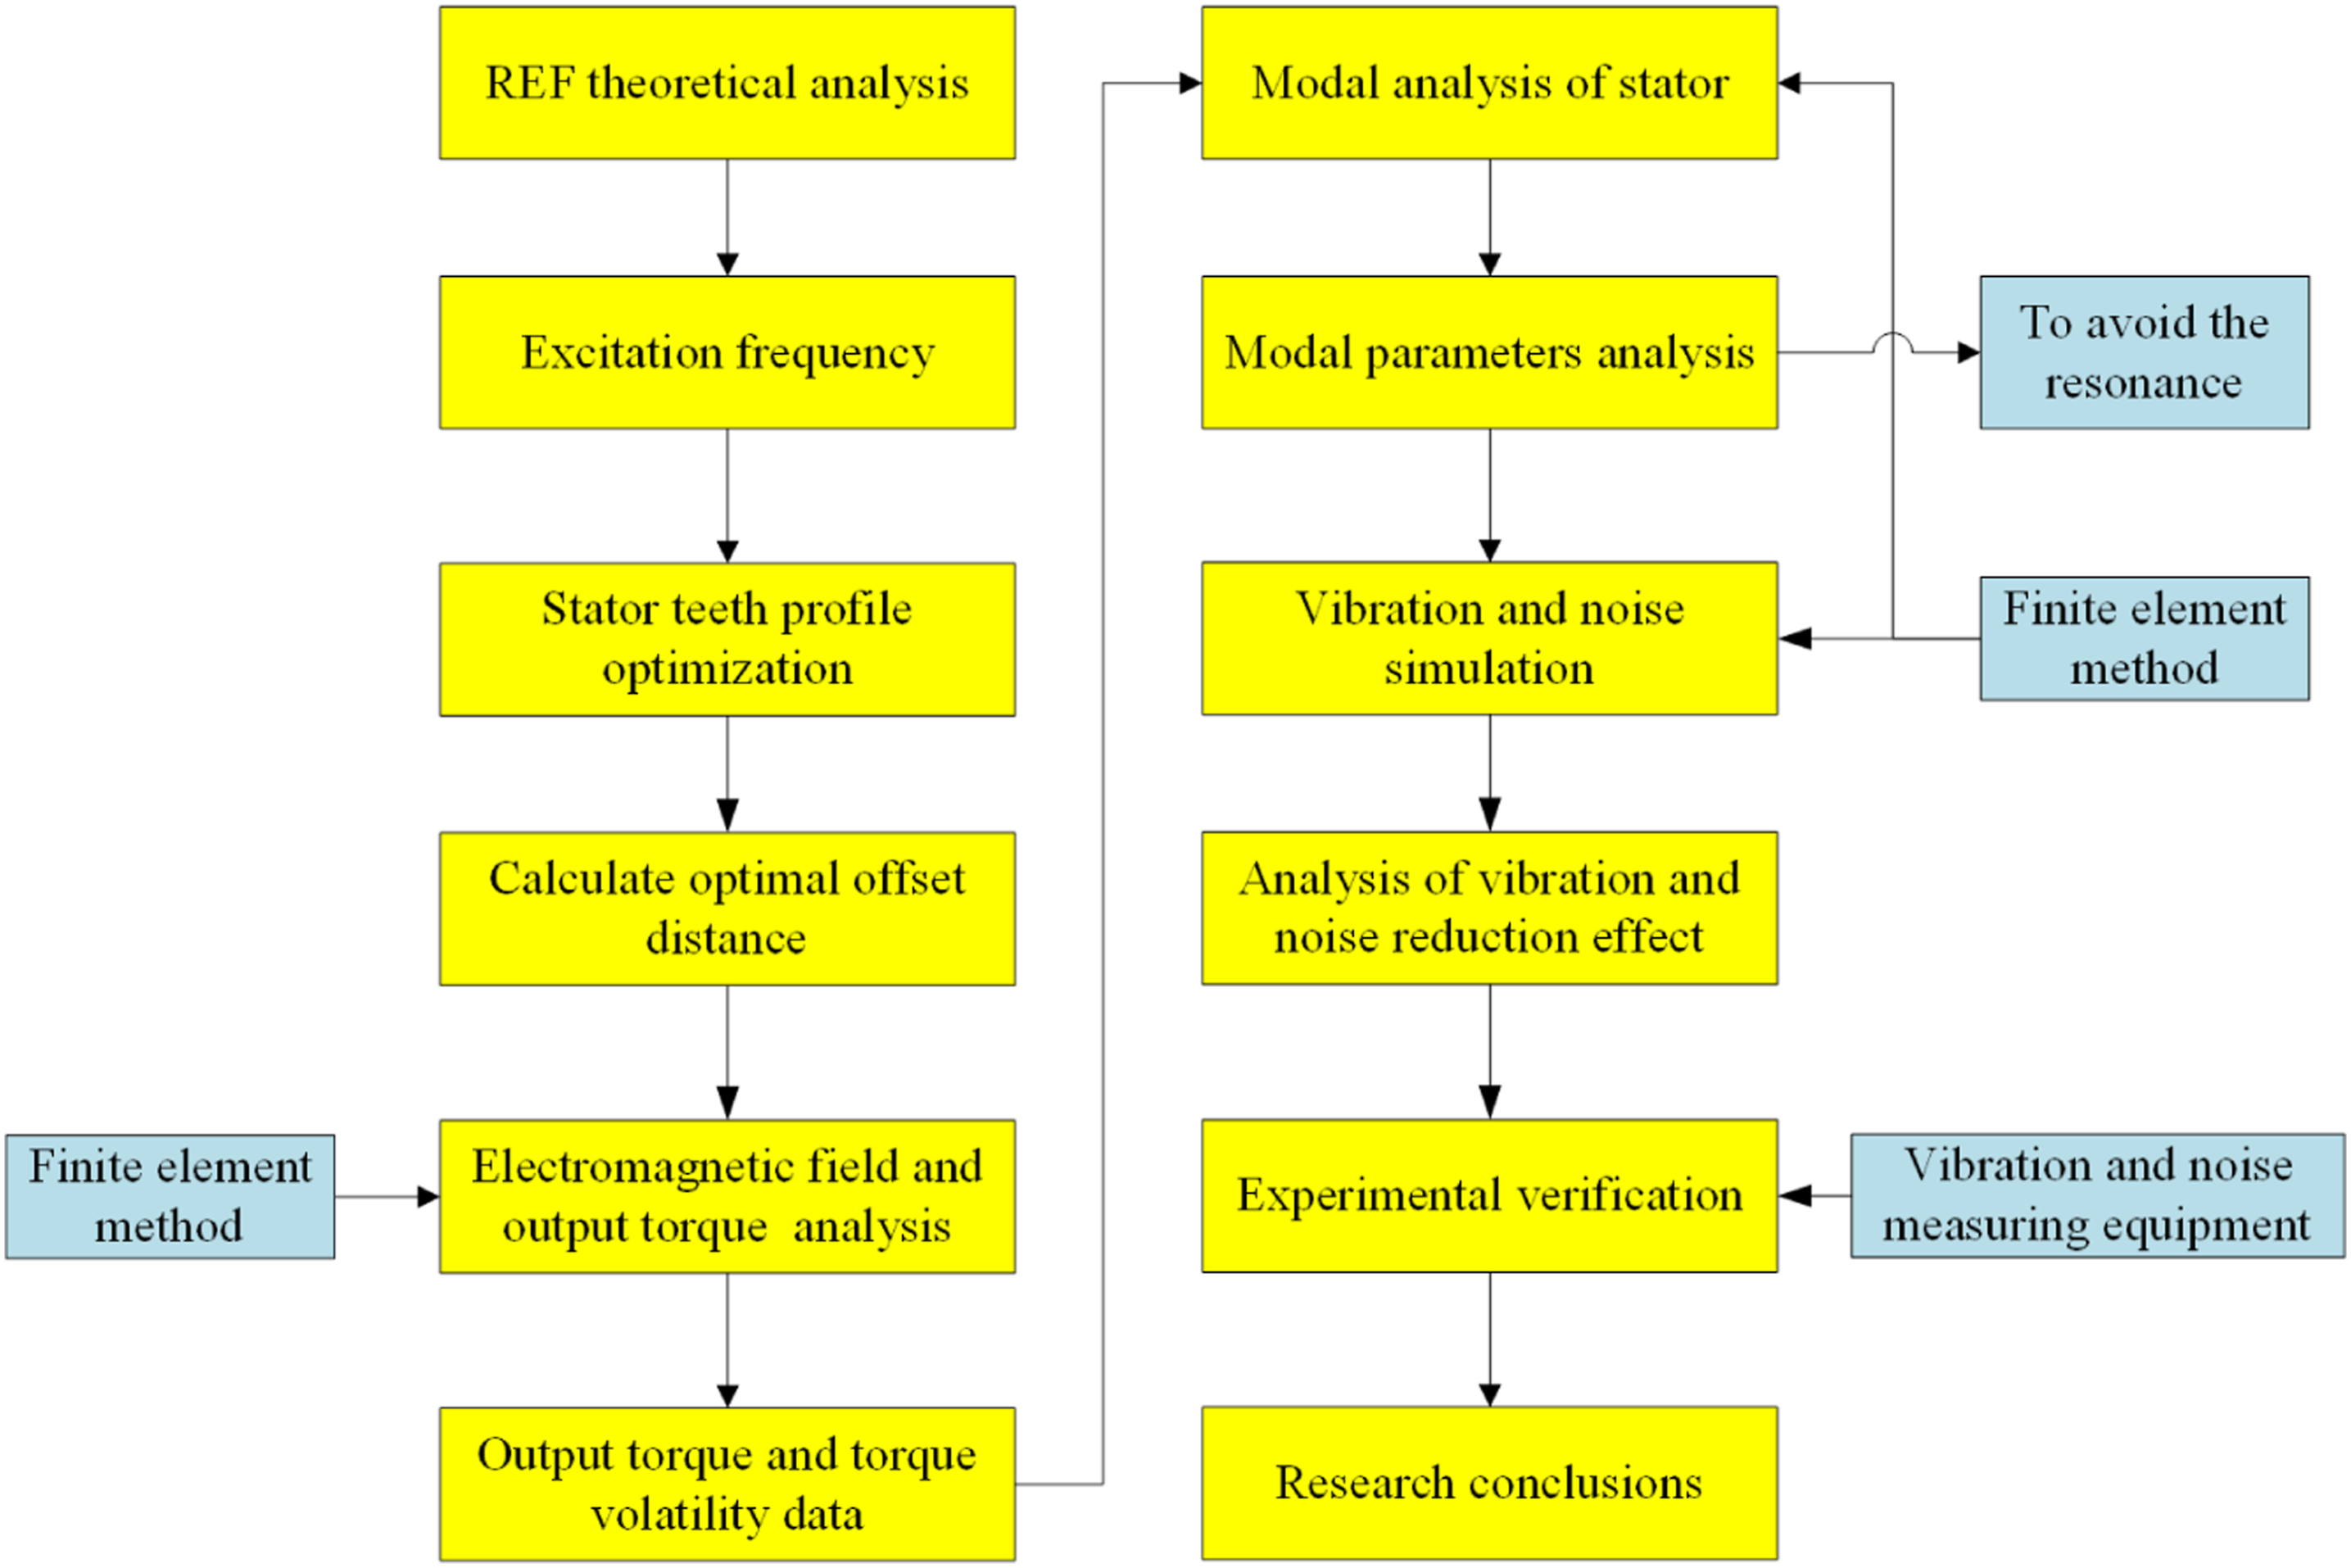
There are three innovative points in this study. First, the study presented here is one of the first investigations to explore reduce method of the electromagnetic vibration and noise of PMM by optimizing the stator tooth profile. Compared with other optimizing methods, it is easier to achieve. More significantly, the output characteristics are not markedly degraded. Second, the proposed optimizing method has good universality. It can be used to reduce vibration and noise in both surface-mounted and embedded PMM. Last, the electromagnetic and dynamic coupling simulation is applied in this study. It can effectively improve the calculation accuracy and shorten the research time. The research methods and conclusions adopted in this study can be extended to the vibration and noise analysis and optimization of other PMM.
REF calculation and analysis
Electromagnetic vibration and noise of PMM are mainly caused by REF. The analysis and calculation of REF is the basis for obtaining accurate vibration and noise parameters. REF density can be calculated by Formula (1) based on Maxwell tensor method

The magnetic field lines are essentially perpendicular to the surface as they pass through the air gap into the stator core. This is mainly because the permeability of ferromagnetic materials is much larger than that of air. As a result, the air gap MII of tangential component is much smaller than that of the radial component. The former is often ignored in the calculation process. Formula (2) can also be used for calculating REF density

The MII of the air gap can be divided into two parts for PMM. One is the MII produced by the permanent magnet in the air gap, and the other is the MII produced by the induced magnetomotive force of the stator armature. REF density is calculated by Formula (3)

In this formula,


In Formulas (6) and (7),


The order and excitation frequency of REF can be calculated according to Formulas (10) and (11)


The orders and excitation frequencies of the low-order REF.
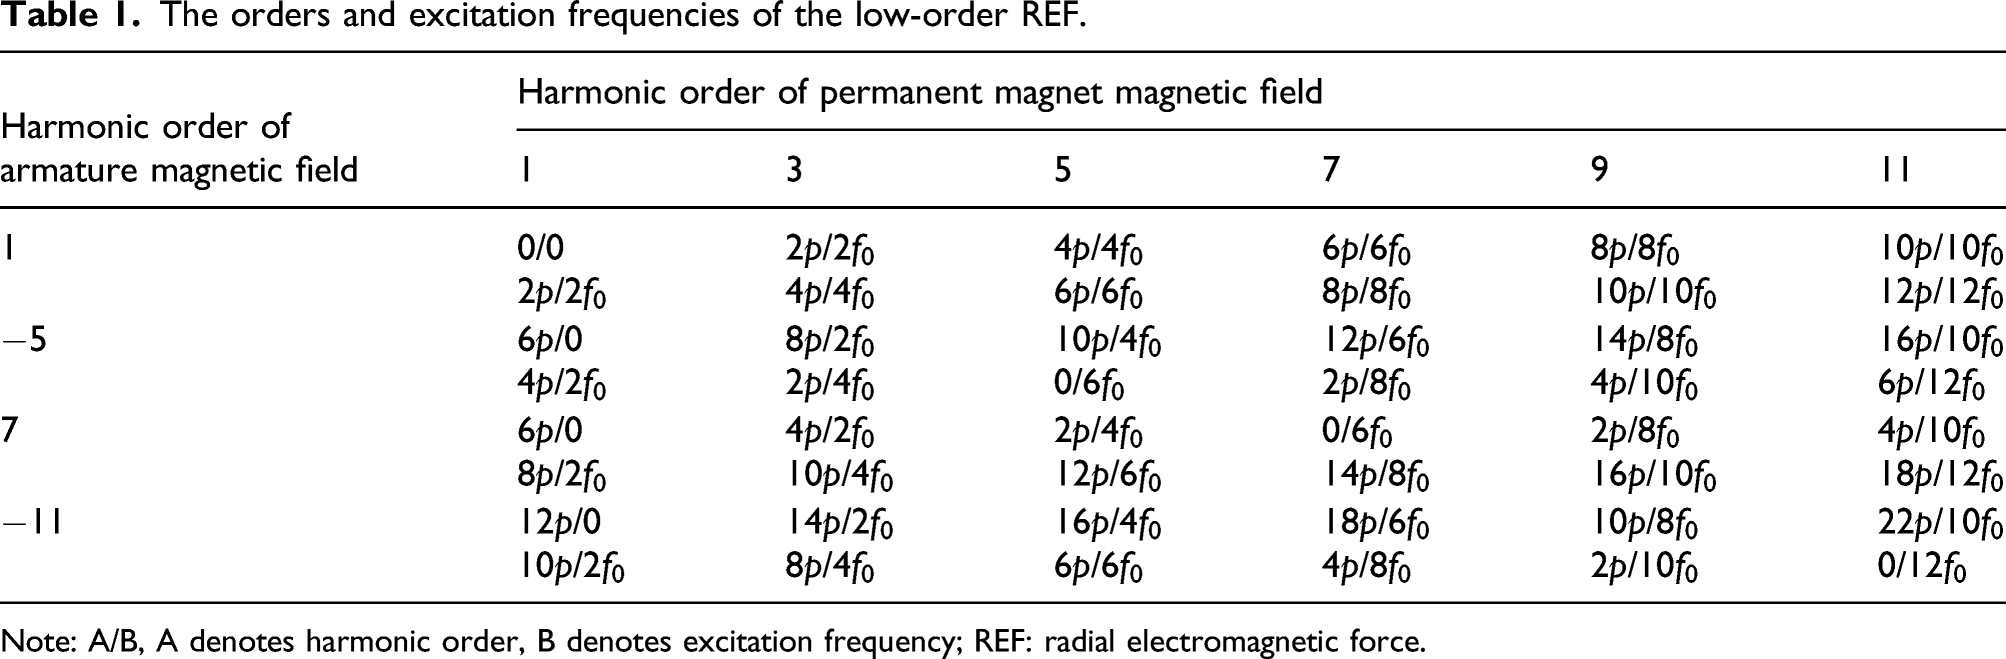
Note: A/B, A denotes harmonic order, B denotes excitation frequency; REF: radial electromagnetic force.
The results suggest that it is a necessary way to reduce the electromagnetic vibration and noise of PMM by changing the distribution of REF. The REF size depends on the air gap MII which may be affected by the direction of the magnetic field lines.
Vibration and noise reduction method
Stator teeth profile optimization
In the proposed optimizing scheme, the original arc of the stator tooth is displaced along the radius to change the magnetoresistance coefficient. In this way, the REF of a single stator tooth may become uniform. The schematic diagram of optimization parameters of one stator tooth is displayed in Figure 2. Schematic diagram of optimization parameters of one stator tooth.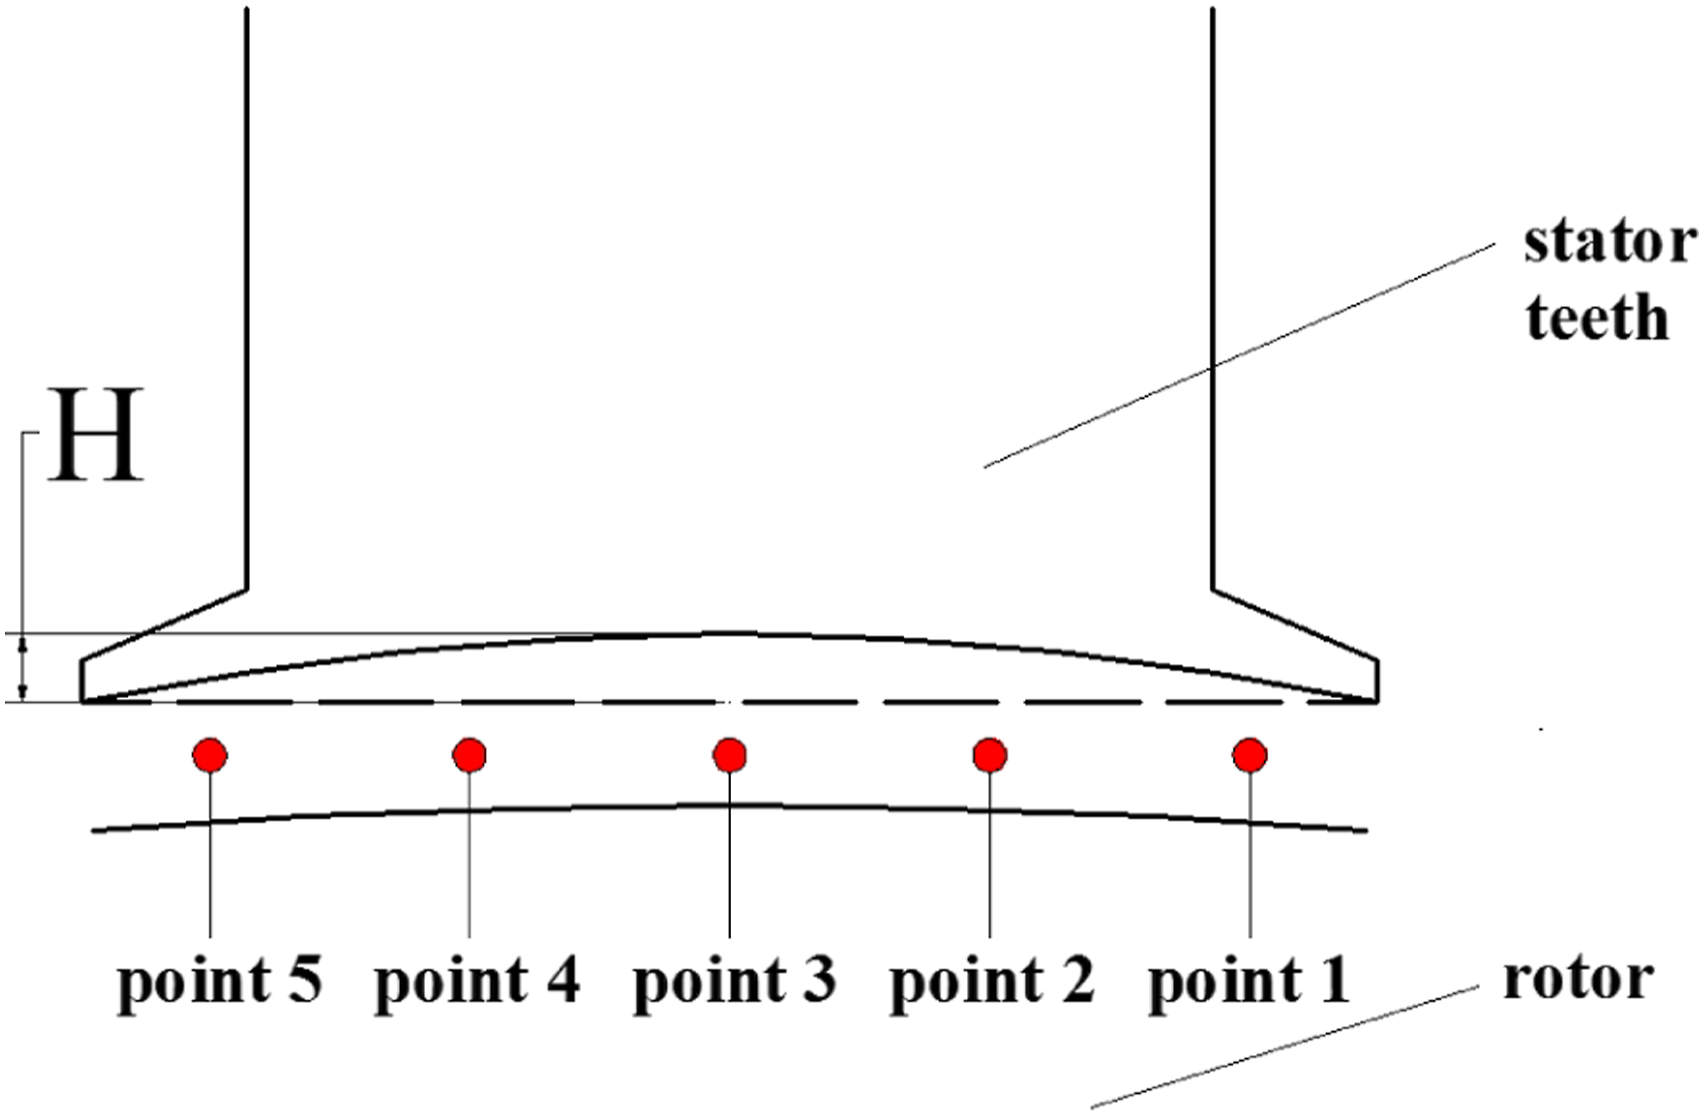
The offset distance of the stator tooth arc is selected as the optimization parameter. In Figure 2, H represents the offset distance. Taking the embedded V-shaped magnetic steel PMM as an example, the REF density at five points (Figure 1) under different offset distances was obtained by the finite element method. The rated power and rated speed of the designed PMM are 30 kW and 6000 rpm, respectively. Its number of poles is 4. First, the structure drawing of the motor was drawn, and then the vector-potential boundary condition which was imposed on the edge of the solution domain was employed. Second, the motor model was meshed. According to the simulation requirements, the mesh size of rotating parts is set to 0.5 mm, and the mesh size of stator is set to 2 mm. In this way, the higher calculation accuracy and smooth MII curves may be obtained.
The REF density of five selected points at the time of 0.5 ms, 1.0 ms, 1.5 ms, and 2.0 ms is shown in Figure 3. Point 3 is on the center line of the stator. Points 1 and 2 are evenly distributed on the right side of the center line, and Points 4 and 5 are evenly distributed on the left side of the center line. The distance between two adjacent points is equal. The standard deviation (SD) is used to measure the discretization degree. If the REF density of the five points is more uniform, the vibration and noise parameters can be optimized. The radial electromagnetic force density of five points at different times. (a) 0.5 ms (b) 1.0 ms (c) 1.5 ms (d) 2.0 ms.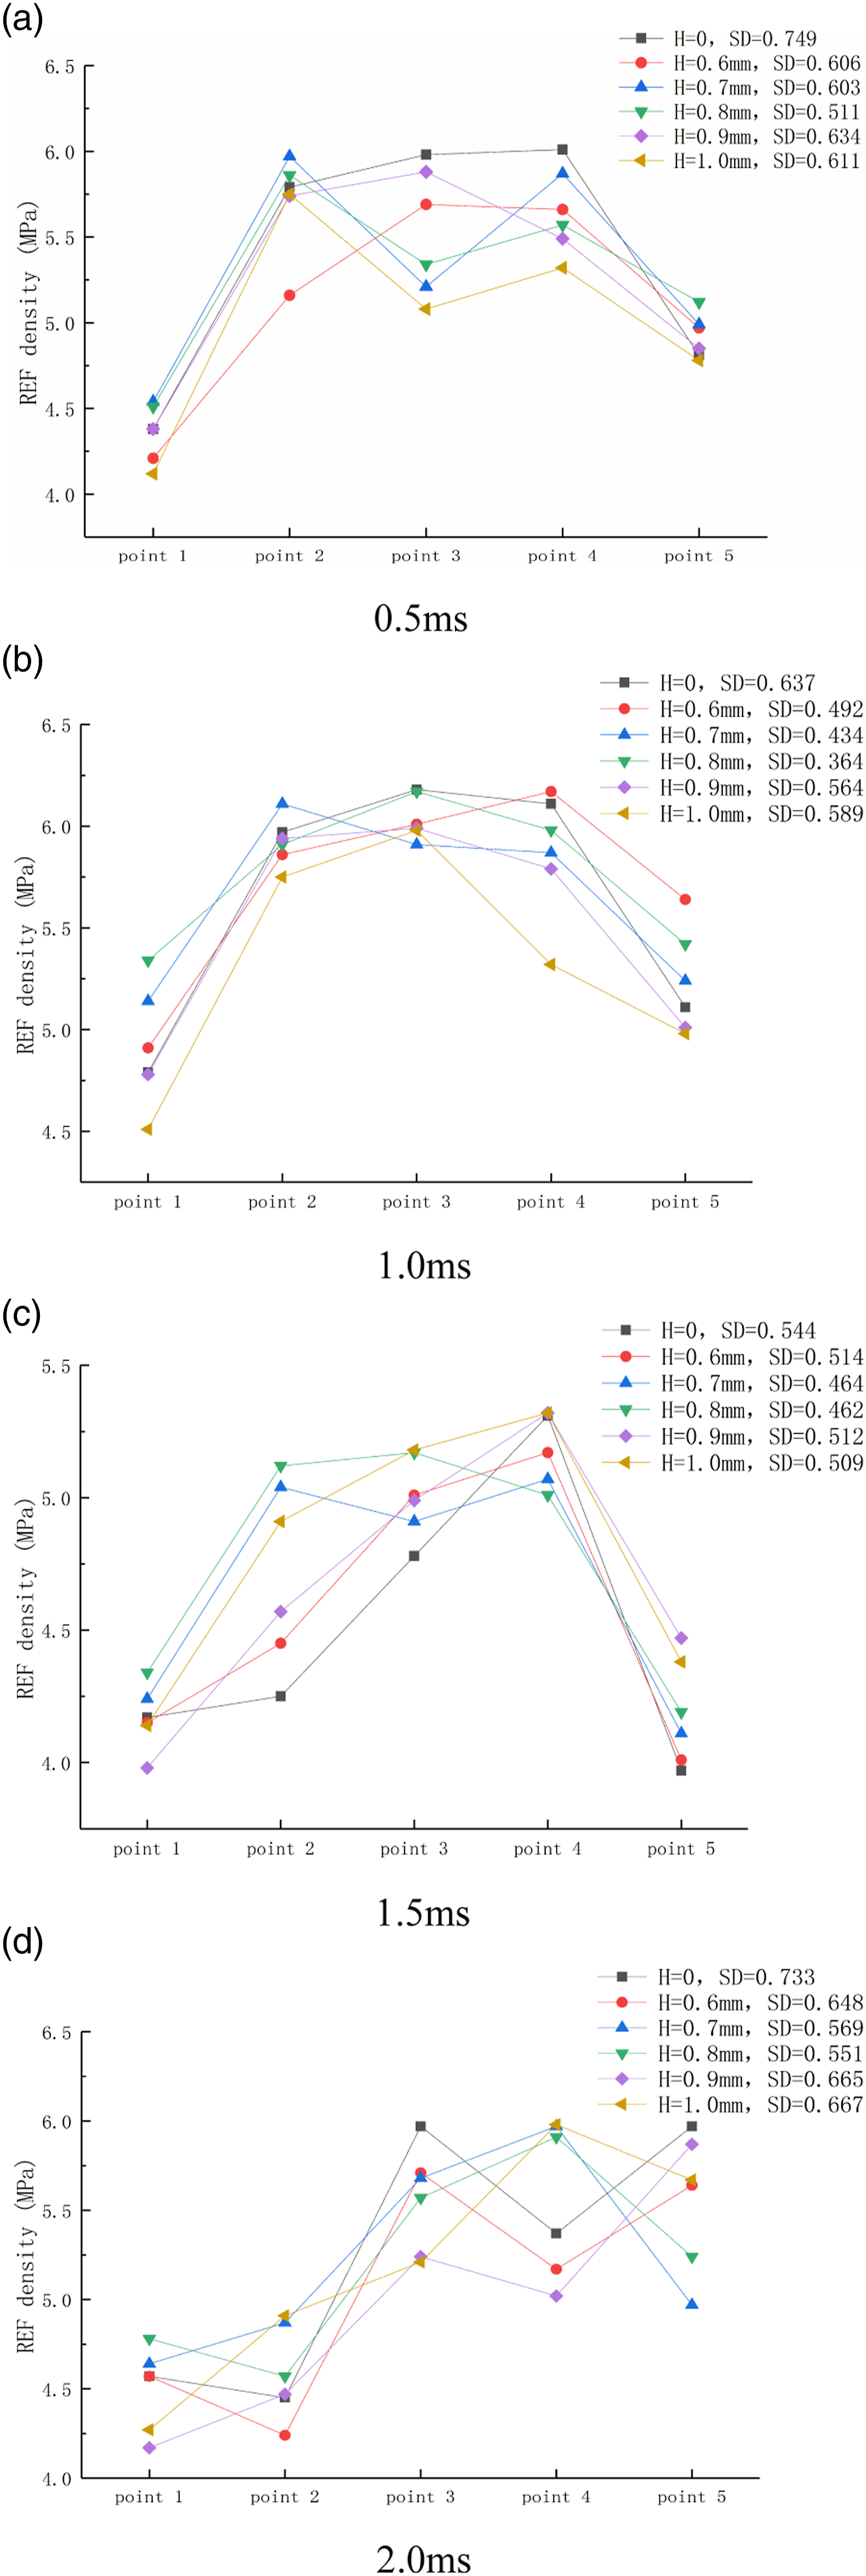
In Figure 3, the SD of the REF density of the five points is decreased when the stator teeth arc is offset, which indicates that the REF density becomes uniform through this method. When the offset distance is 0.8 mm, the SD of REF density is smallest. Therefore, the best choice of offset distance is 0.8 mm. The proposed scheme is effective to reduce the electromagnetic vibration and noise of PMM.
Electromagnetic field analysis of optimized PMM
The MII distribution maps of the optimized PMM at the time of 1.0 ms and 2.0 ms are shown in Figure 4. The MII distribution of each part is reasonable. The MII at the end of the permanent magnet and the stator teeth is larger, and the MII at the outer circle of the stator yoke is smaller. The maximum MII is about 2.0 T, which is less than the saturated MII of the selected silicon steel sheet. The MII distribution can be divided into four closed regions because the motor has two pairs of poles. MII map of optimized PMM. (a) Time=1.0 ms (b) time=2.0 ms. Notes: PMM: permanent magnet motor; MII: magnetic induction intensity.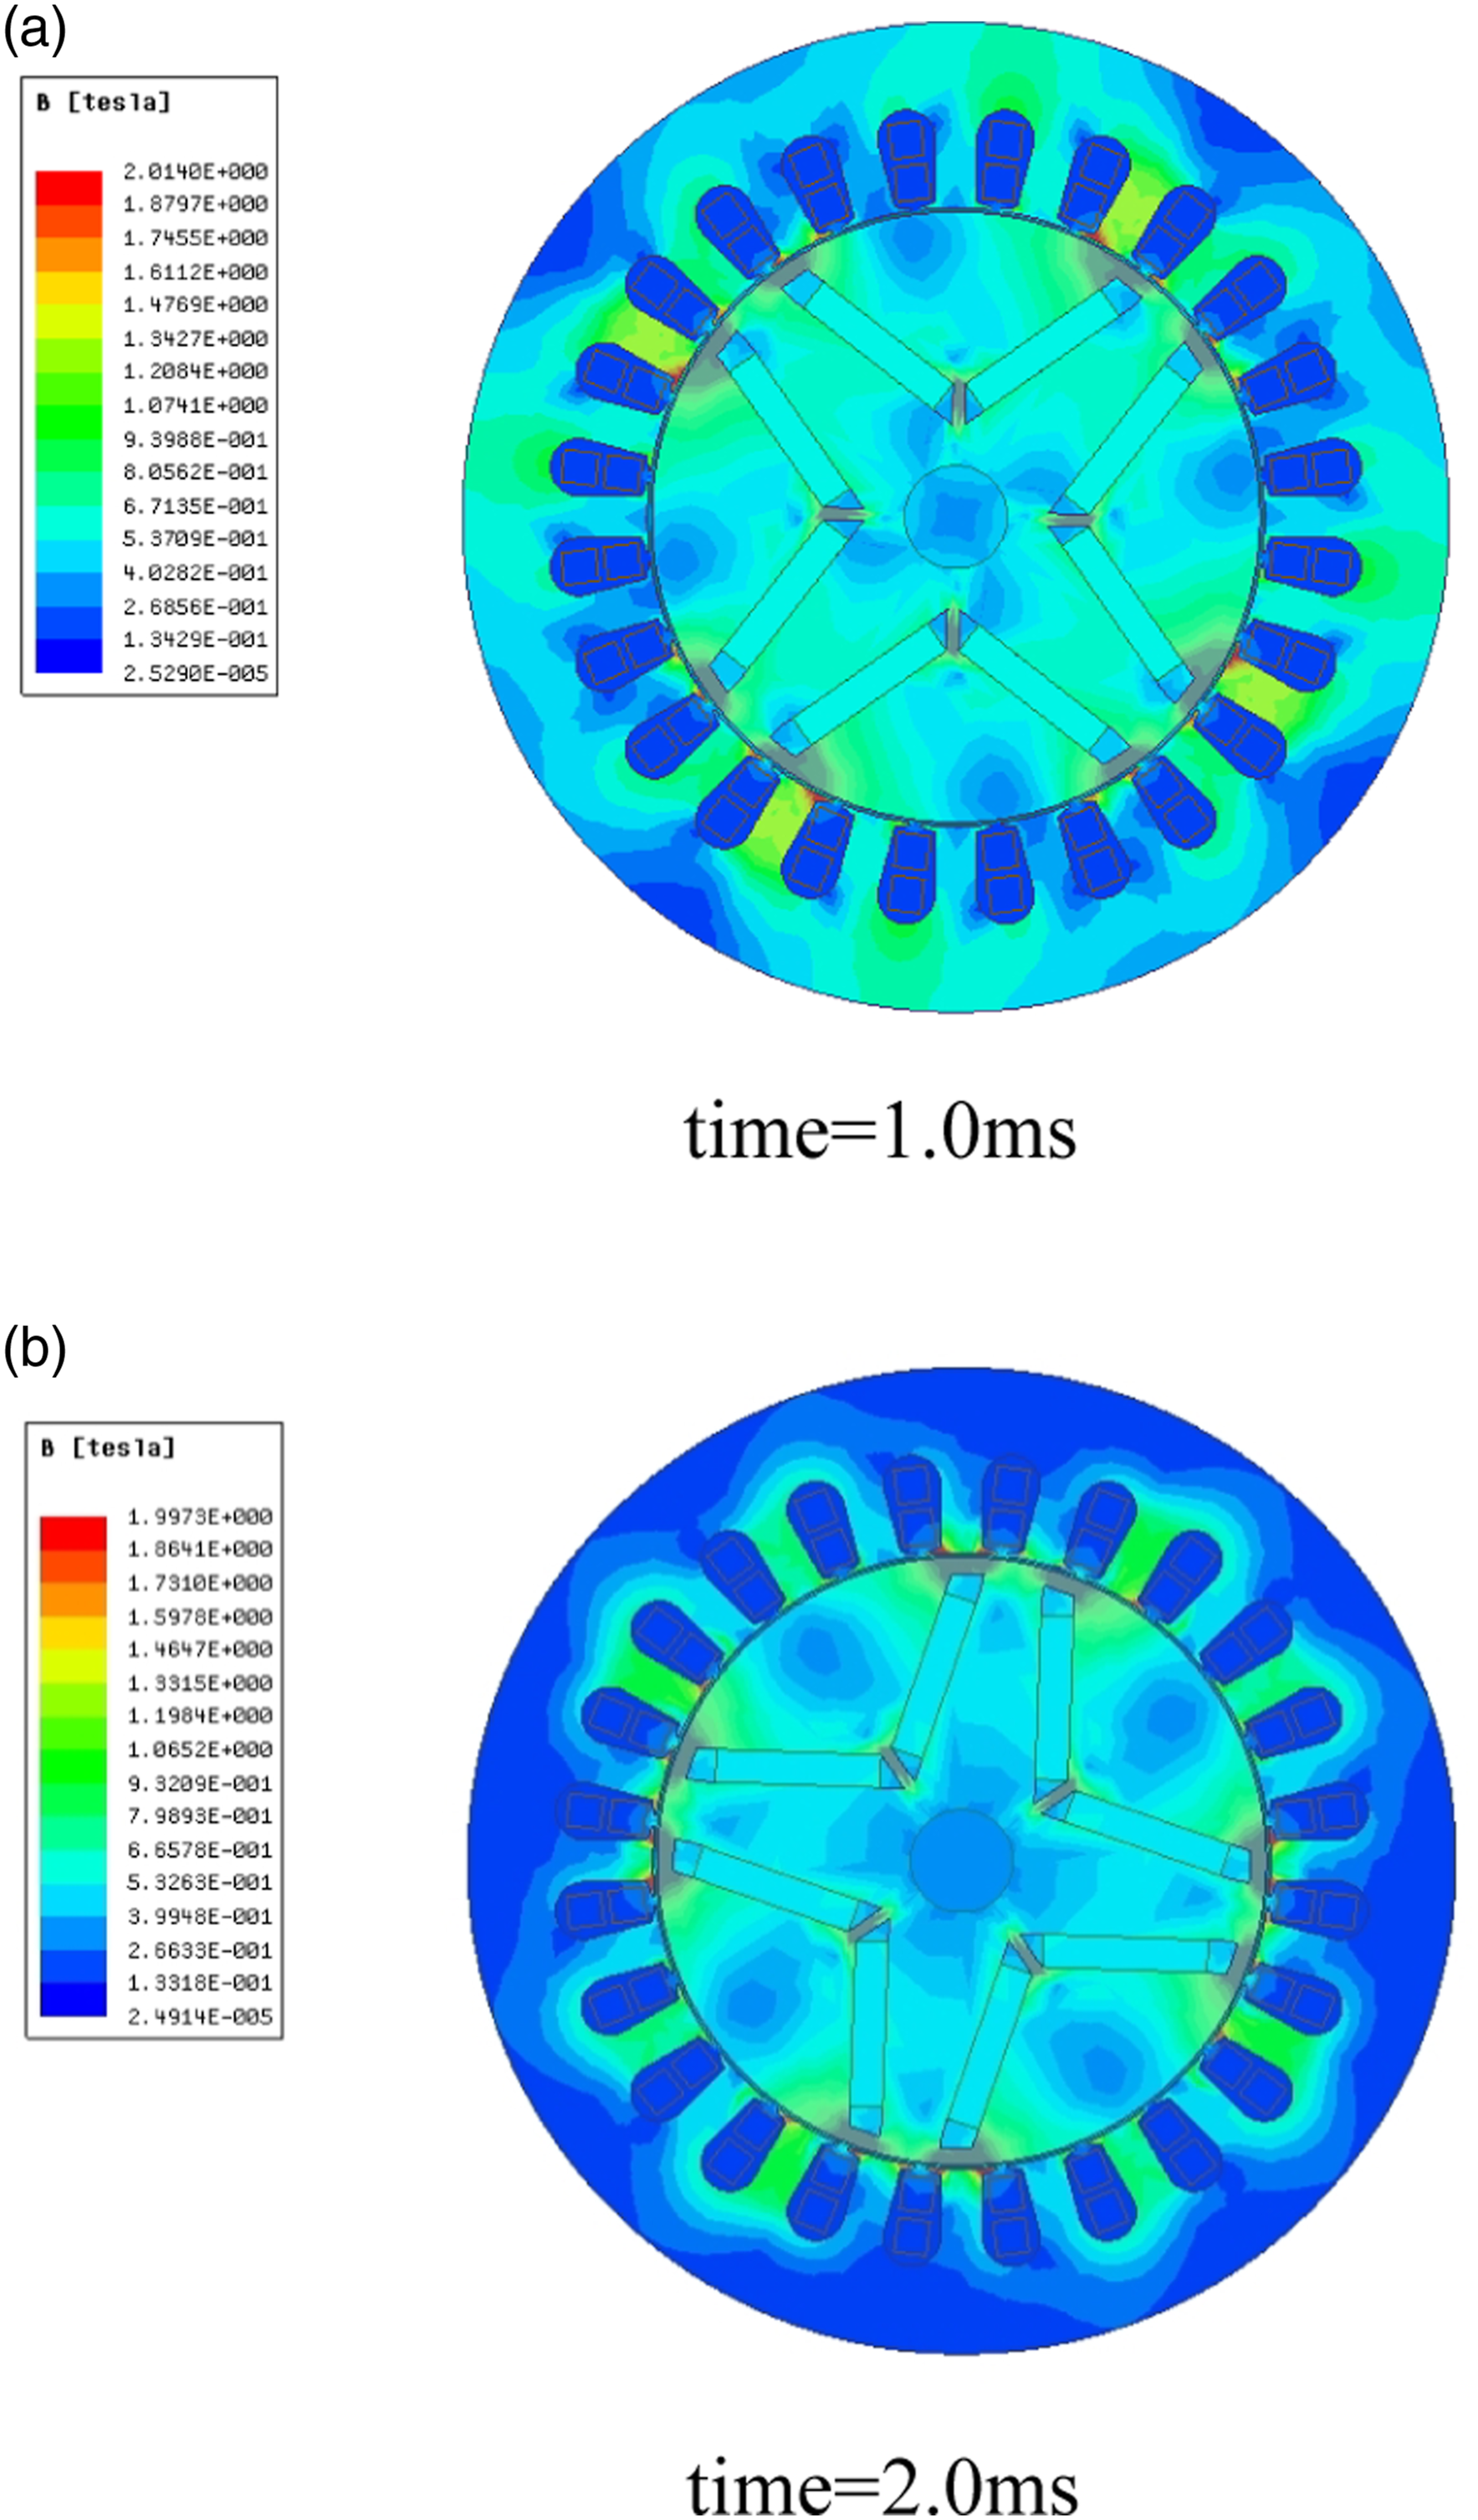
The output torque may be affected by optimizing the stator teeth profile. The output torque curves of the original PMM and the optimized PMM were calculated and presented in Figure 5. Output torque of original PMM and optimized PMM. Notes: PMM: permanent magnet motor.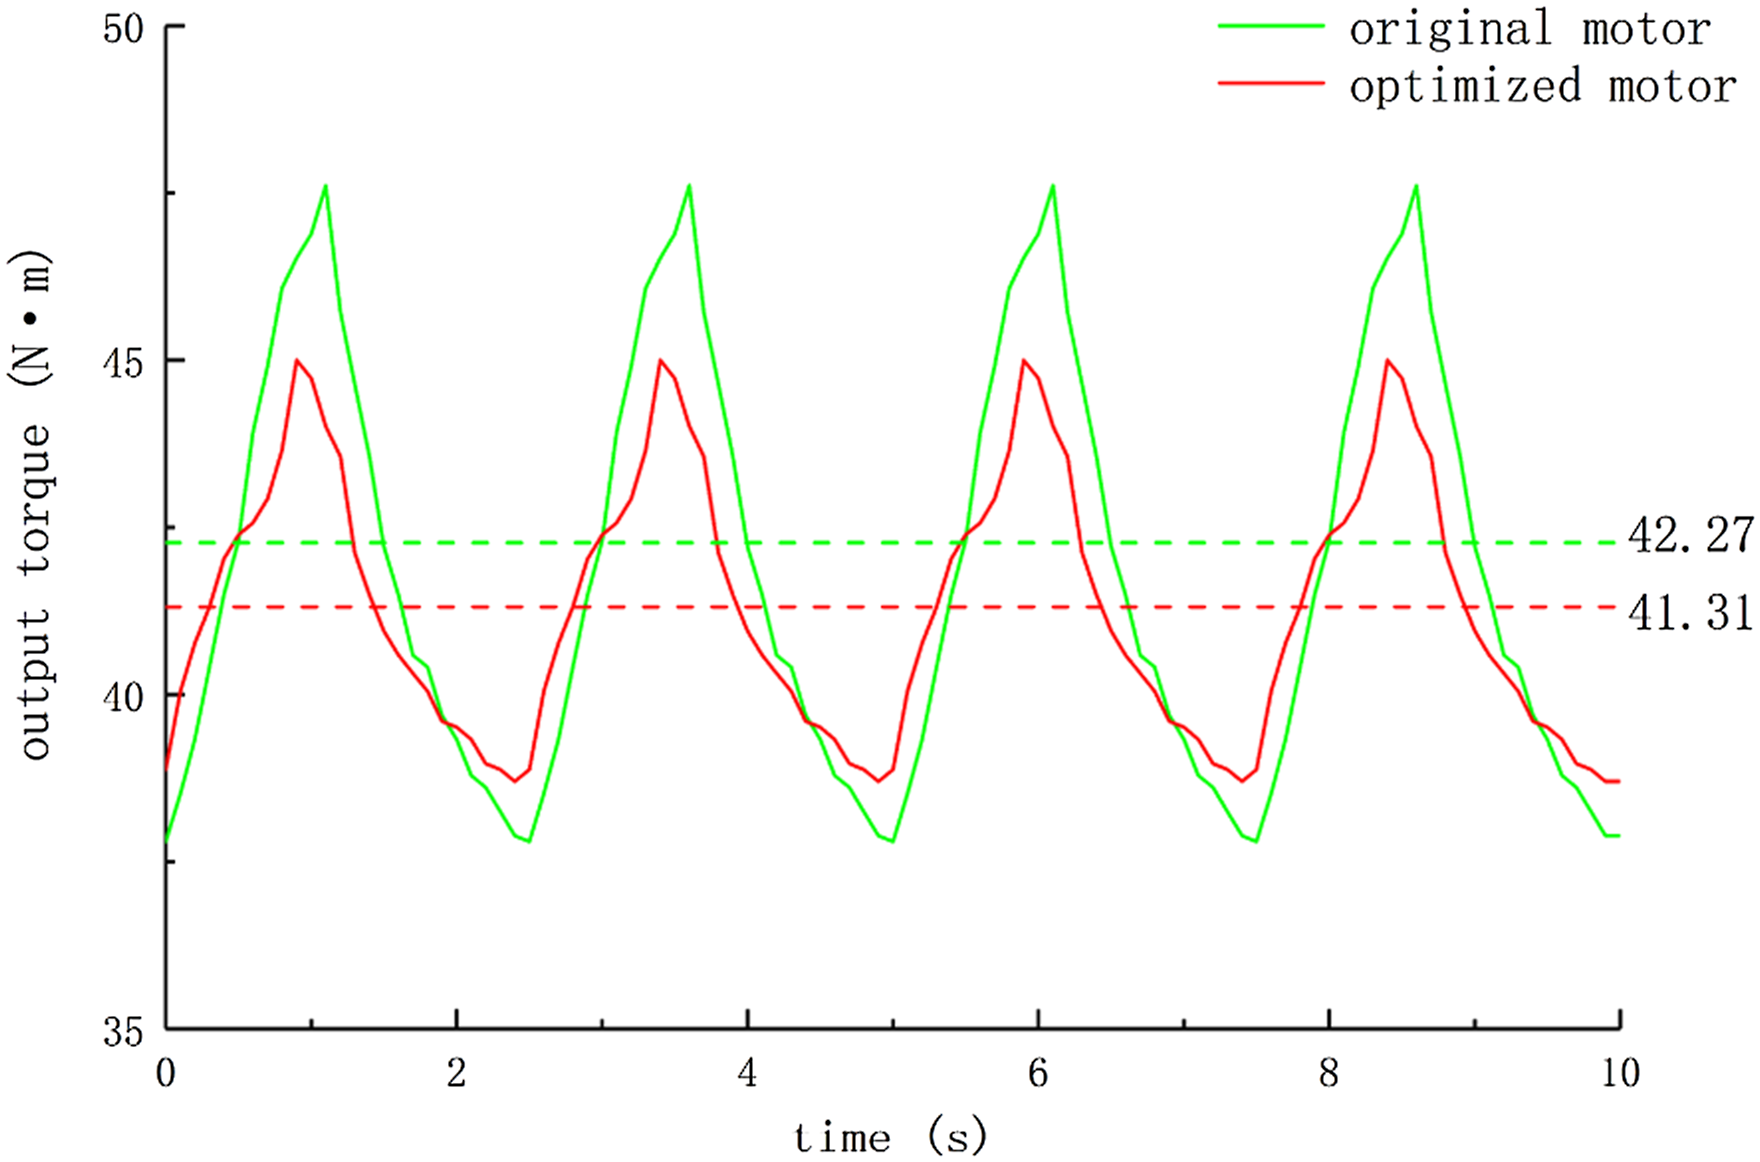
It is apparent from this figure that the output torque fluctuation of the optimized PMM is obviously decreased. The difference between the maximum torque and the minimum torque of the original PMM and the optimized PMM is 9.81 Nm and 6.03 Nm, respectively. Torque volatility is reduced by 38.53%. The dotted line in Figure 3 represents the average output torque. The average output torque of the original PMM and the optimized PMM is 42.27 Nm and 41.31 Nm, respectively, which means that there is a certain loss of output torque with the decrease of torque fluctuation. Although the reduction rate of output torque is 2.27%, the reduction of torque volatility is more obvious.
REF spectrum analysis
Each pole has six stators for a 24-slot and 4-pole PMM. The REF spectrum of the six adjacent stator teeth is shown in Figure 6. The REF of each stator tooth is different in amplitude, but the variation trend is similar. The REF is largest at fundamental frequency. With the increase in frequency order, the amplitude of REF decreases. The amplitude of REF is larger when the frequency is an even multiple of the fundamental frequency of the PMM. The fundamental frequency is 200 Hz. This conclusion also verifies the correctness of the data in Table 1. Radial electromagnetic force spectrum of six stator teeth.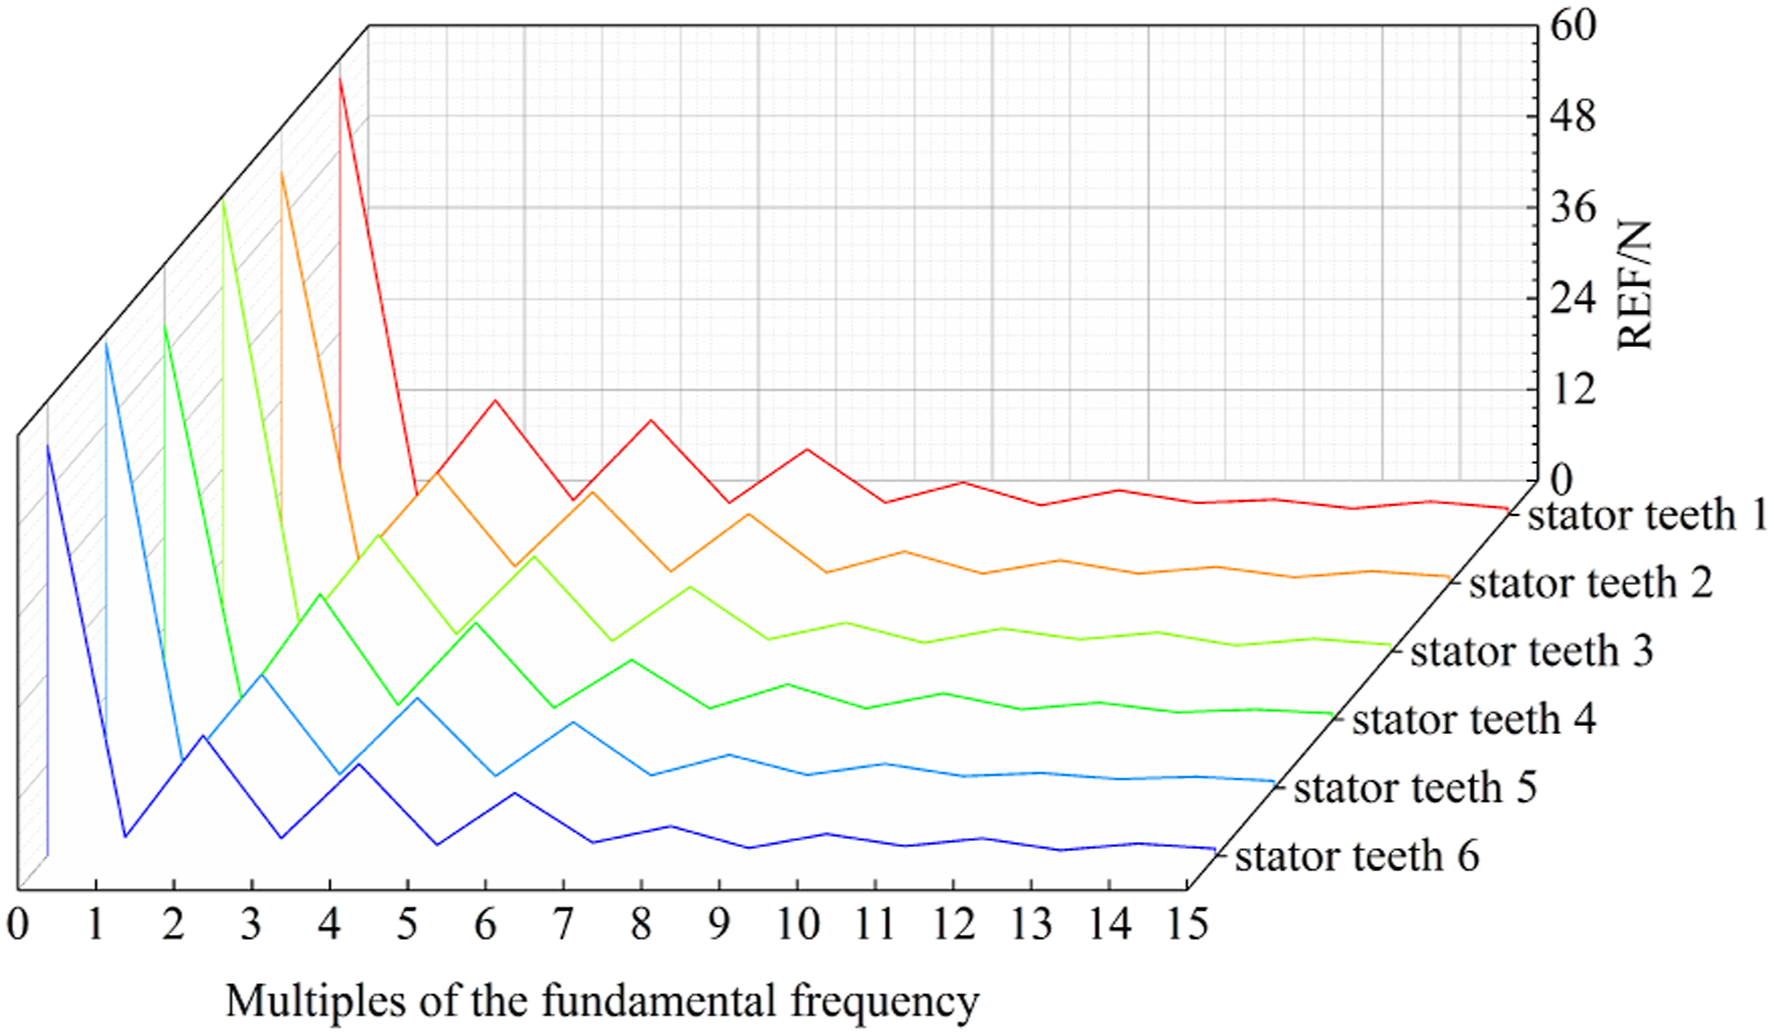
Modal analysis
When the REF excitation frequency is equal to or close to the natural frequency of the stator, the motor will resonate which may bring violent vibration and even damage. According to the above analysis, the amplitude of the REF is larger when the frequency is an even multiple of the fundamental frequency. Therefore, the natural frequency of the PMM stator should avoid the even multiples of 200 Hz. The modal analysis of the stator was solved by finite element method, and its first four modal vibration shapes are displayed in Figure 7. The modal parameters are listed in Table 2. Modal vibration shape. (a) First-order (b) second-order (c) third-order (d) fourth-order. Modal frequency and direction.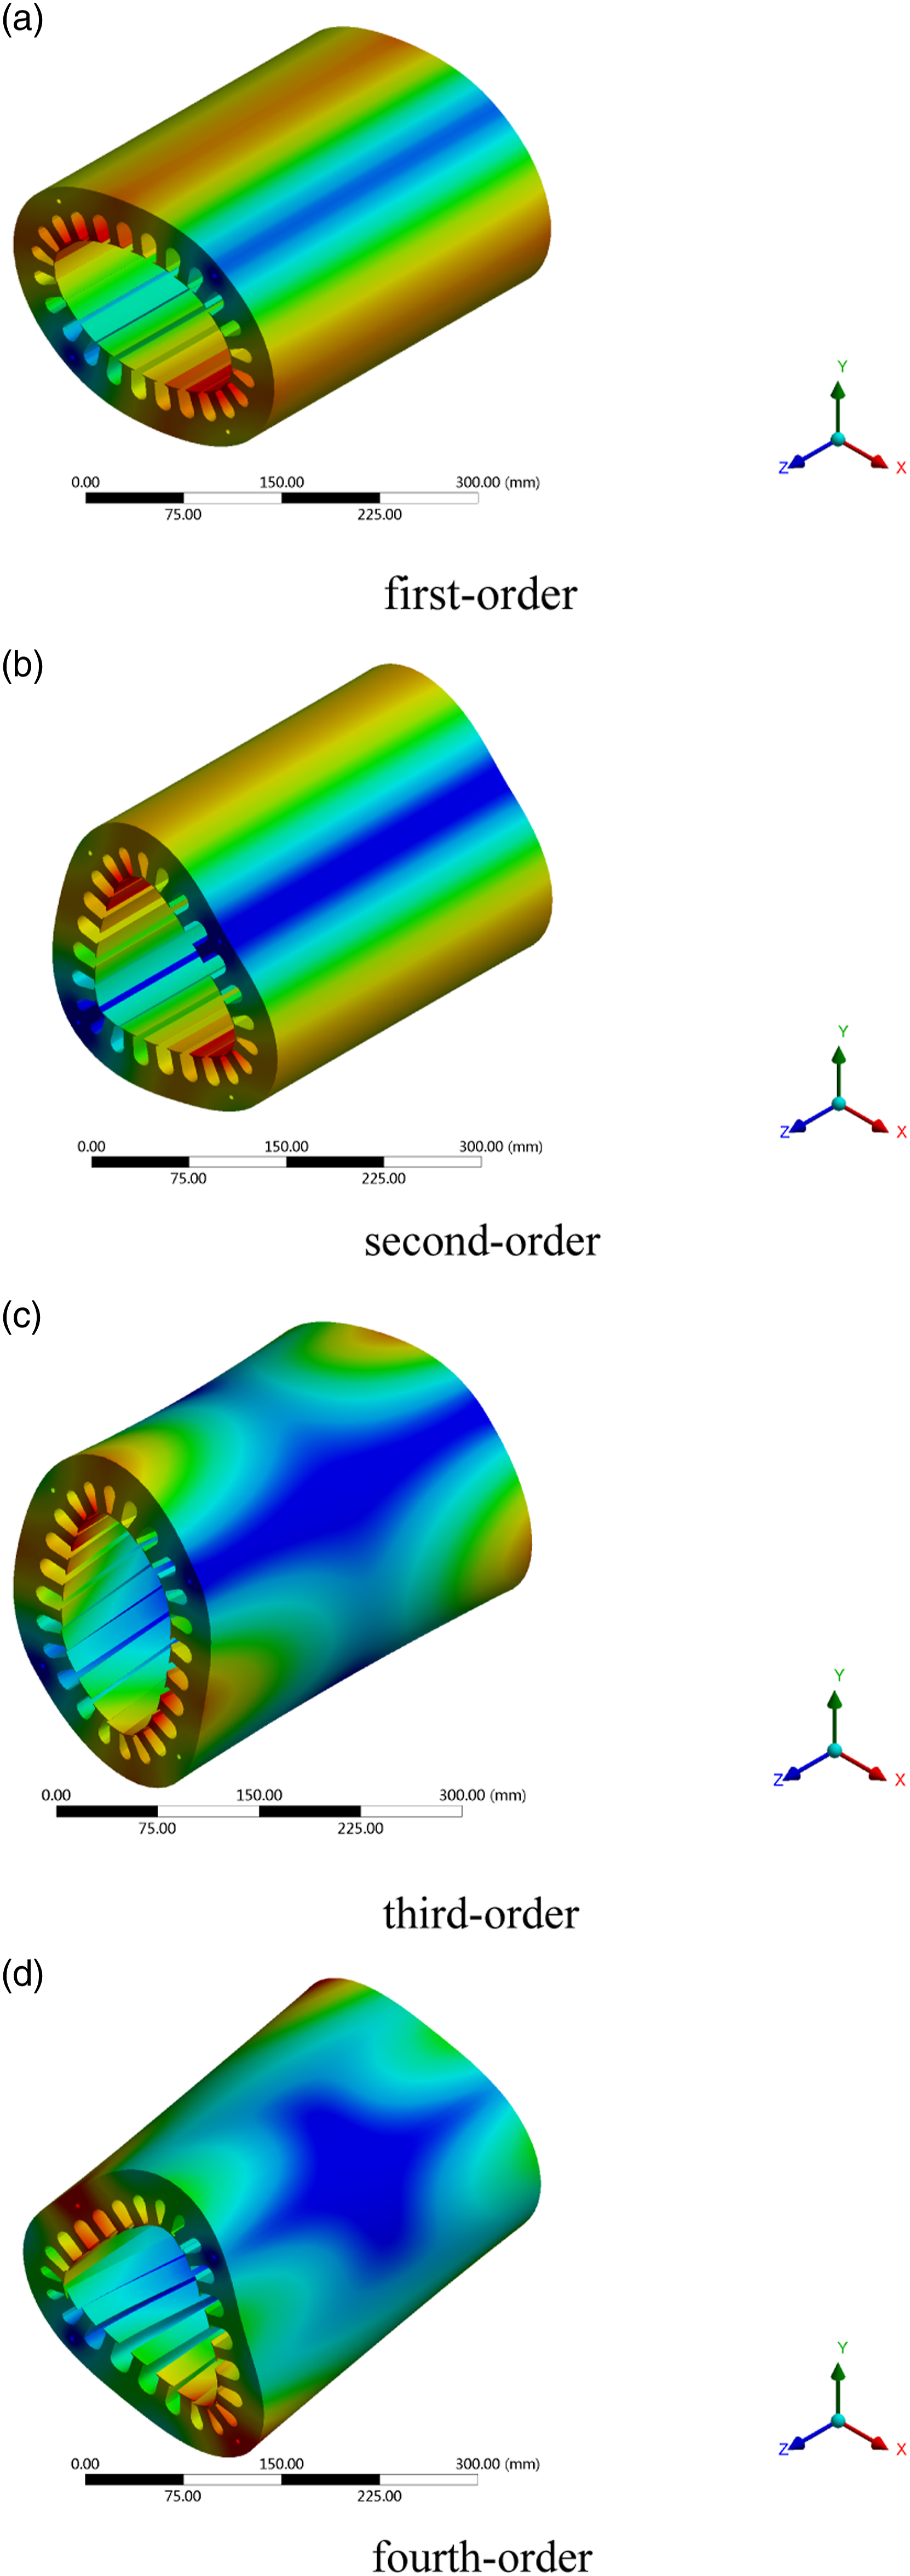
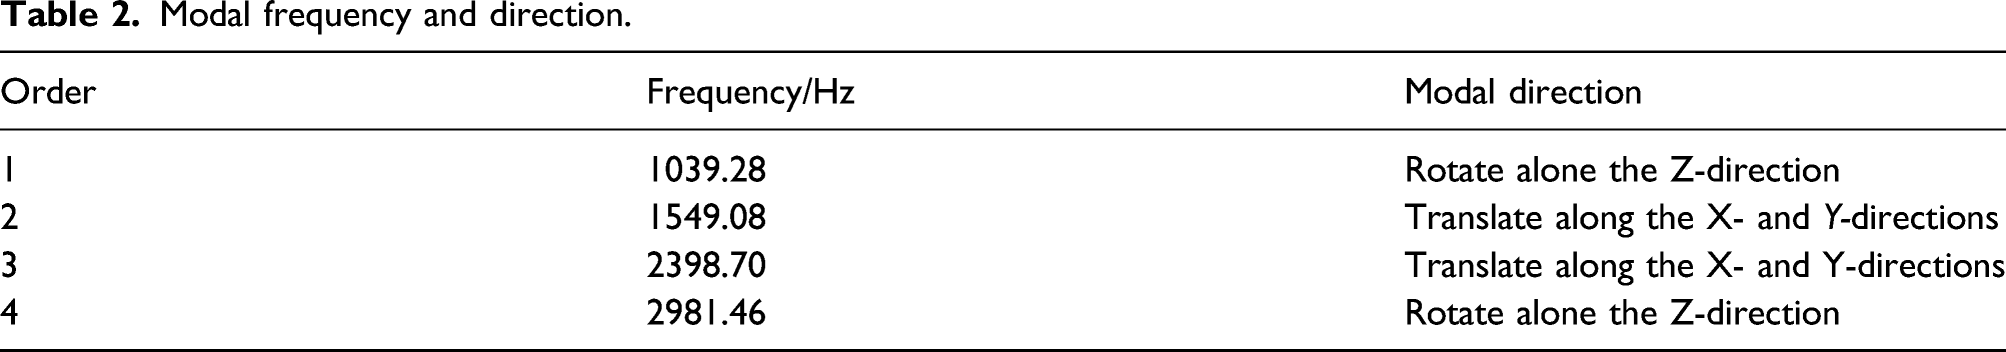
Previous study advices that when the difference between the modal frequency and the excitation frequency is greater than ±3 Hz, the resonance can be effectively avoided. When the difference is greater than ±10 Hz, resonance is completely impossible. It can be seen from Table 2 that the first four modal frequencies are quite different from the excitation frequencies. The fifth-order natural frequency is greater than 3000 Hz, and the REF amplitude above 3000 Hz can be ignored. In addition, REF only acts on the stator along the X- or Y-direction, but the modal directions of the first-order and fourth-order are rotated around the Z-direction. In consequence, resonance will not be occurred, even if the excitation frequency of the REF is close to the modal frequencies of the first-order and fourth-order.
Simulation and analysis of vibration and noise
The electromagnetic vibration and noise parameters of the original PMM and the optimized PMM were simulated. In this process, the REF was coupled to the stator teeth as an excitation source. The damping coefficient was measured by using free attenuation method, and its value is 0.0103. The vibration data of Point 1 in Figure 8 were obtained, and the SPL data within the 1.0 m radius around the motor were also calculated. Schematic diagram of extraction location of vibration data.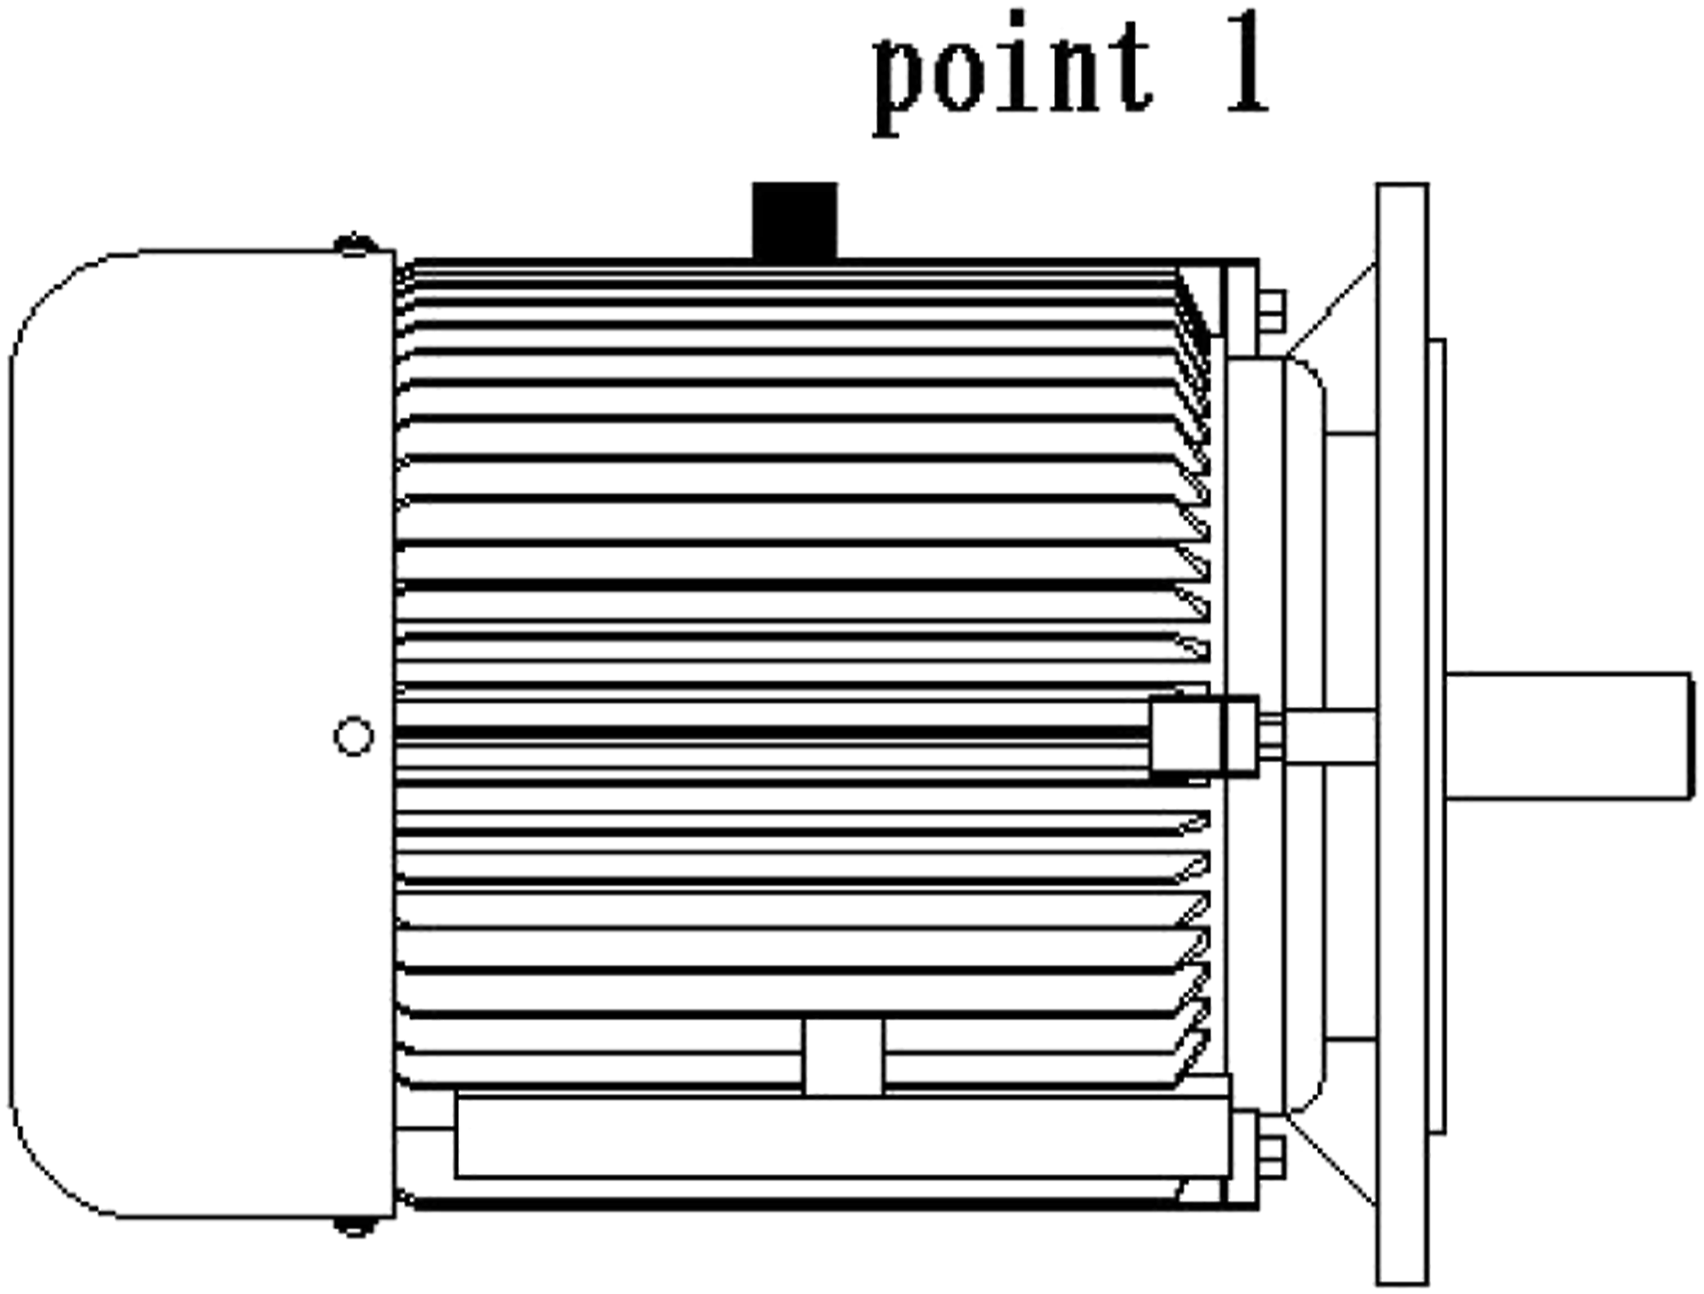
Vibration parameter analysis
The acceleration spectrum of the original PMM and the optimized PMM at Point 1 is shown in Figure 9. What stands out in the figure is that the peak values of vibration acceleration appear at the frequencies of 400 Hz, 800 Hz, 1200 Hz, 1600 Hz, 2000 Hz, 2400 Hz, and 2800 Hz. These frequencies are even multiples of the fundamental frequency (200 Hz). In addition, the vibration acceleration of the optimized PMM decreases obviously at these frequency points. The decreasing rates at 400 Hz, 800 Hz, and 1200 Hz are 22.27%, 19.40%, and 20.20%, respectively. On the whole, the decreasing rate of vibration acceleration decreases gradually with the increase of frequency. The most striking result to emerge from data is that the maximum vibration acceleration of the original PMM and the optimized PMM is 0.678 m/s2 and 0.527 m/s2, respectively. The maximum vibration acceleration is reduced by 22.27%. In addition, the average vibration acceleration of the original PMM and the optimized PMM is 0.207 m/s2 and 0.184 m/s2, respectively, and the average vibration acceleration is reduced by 11.11%. In the areas with higher frequency, the vibration contribution rate of REF is lower. Vibration acceleration spectrum.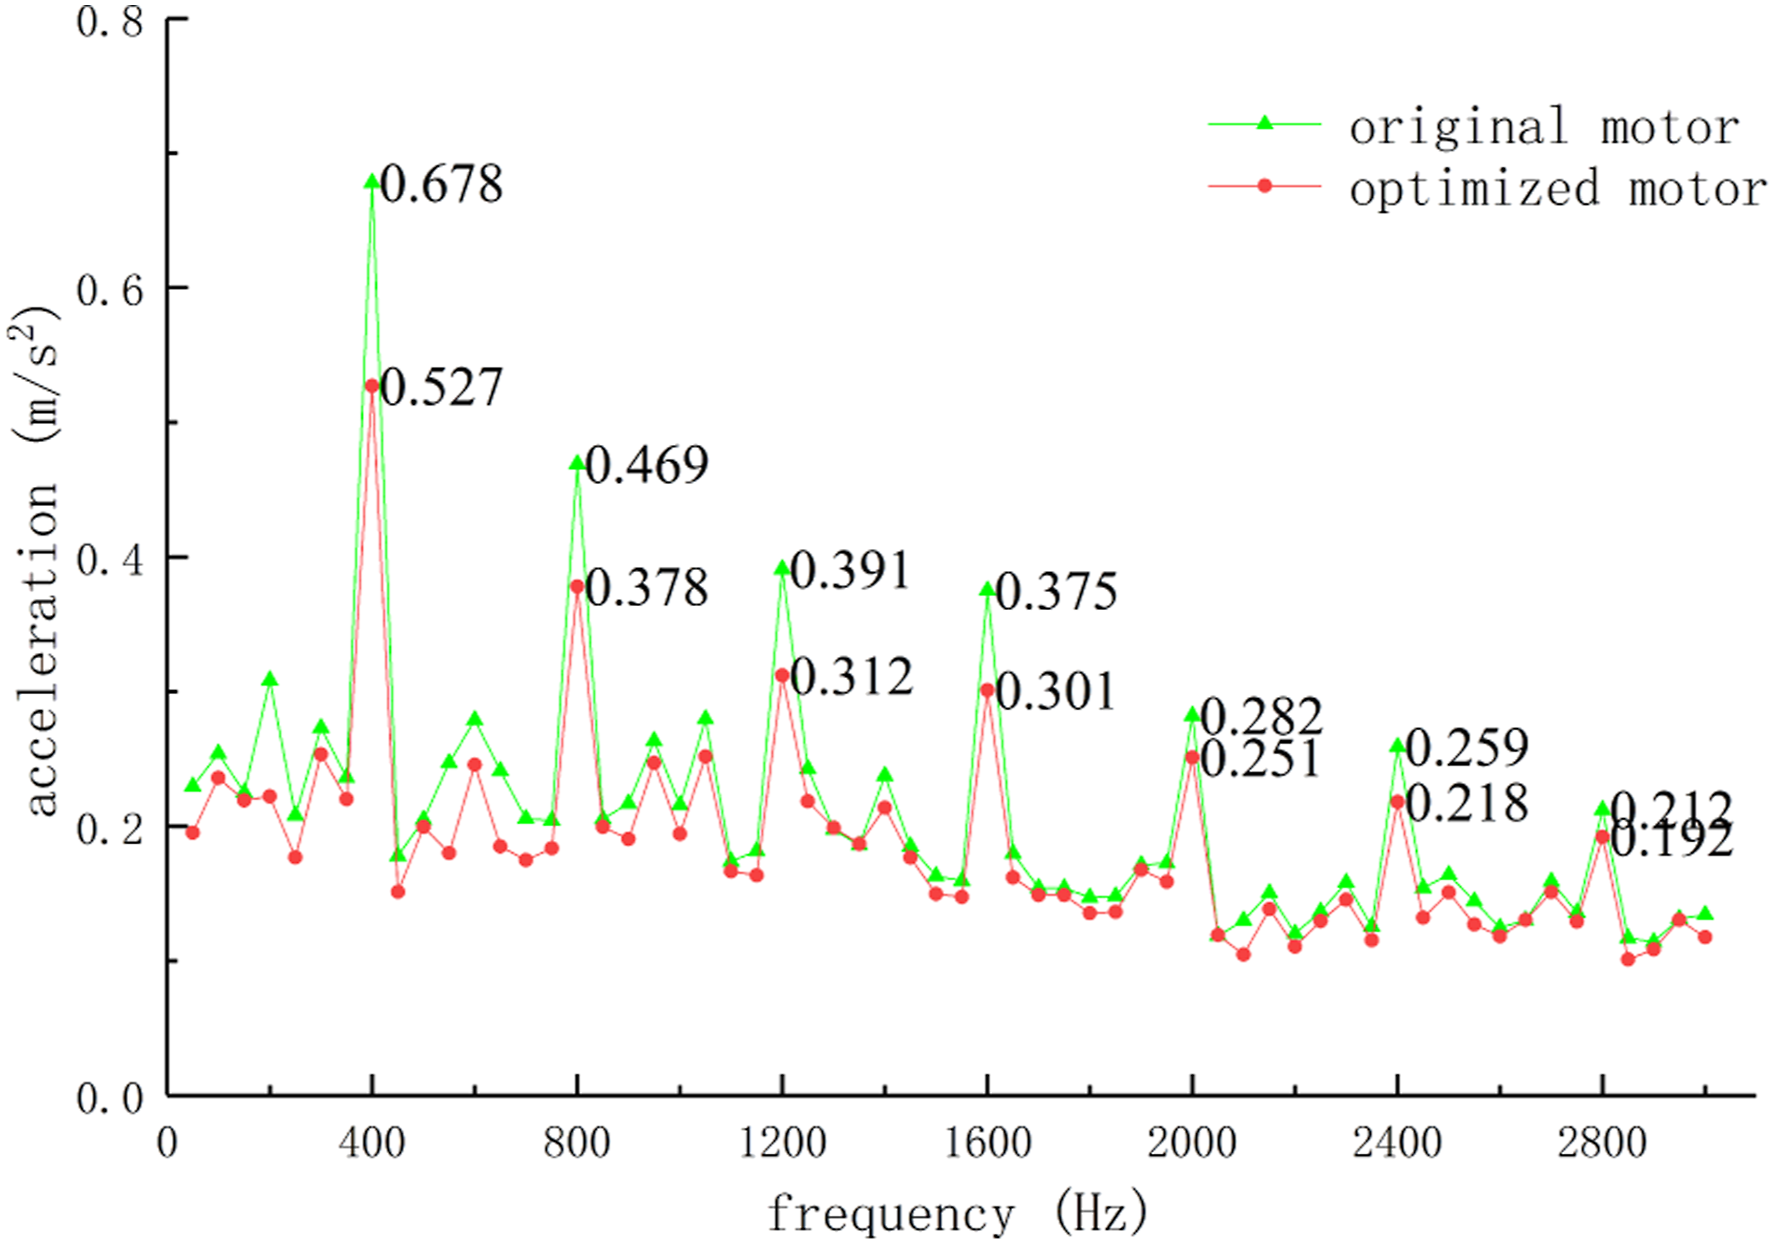
Noise parameter analysis
A volume domain and two surface domains were established according to the acoustic simulation requirements. Noise generated by the PMM propagates within the volume domain. The inner surface region was used to load the excitation of REF, and the outer surface region was used to set boundary conditions. The SPL results in the range of 1.0 m diameter of the original and optimized PMMs are shown in Figure 10. It is obvious that the maximum SPL of original and optimized PMMs is 67.162 dB and 64.694 dB, respectively. Maximum SPL is reduced by 3.67%. The noise spectrum at the position of 0.5 m on the right side of the two motors is shown in Figure 11. SPL distribution map. (a) Original PMM (b) optimized PMM. Notes: PMM: permanent magnet motor; SPL: sound pressure level. Sound pressure level spectrum.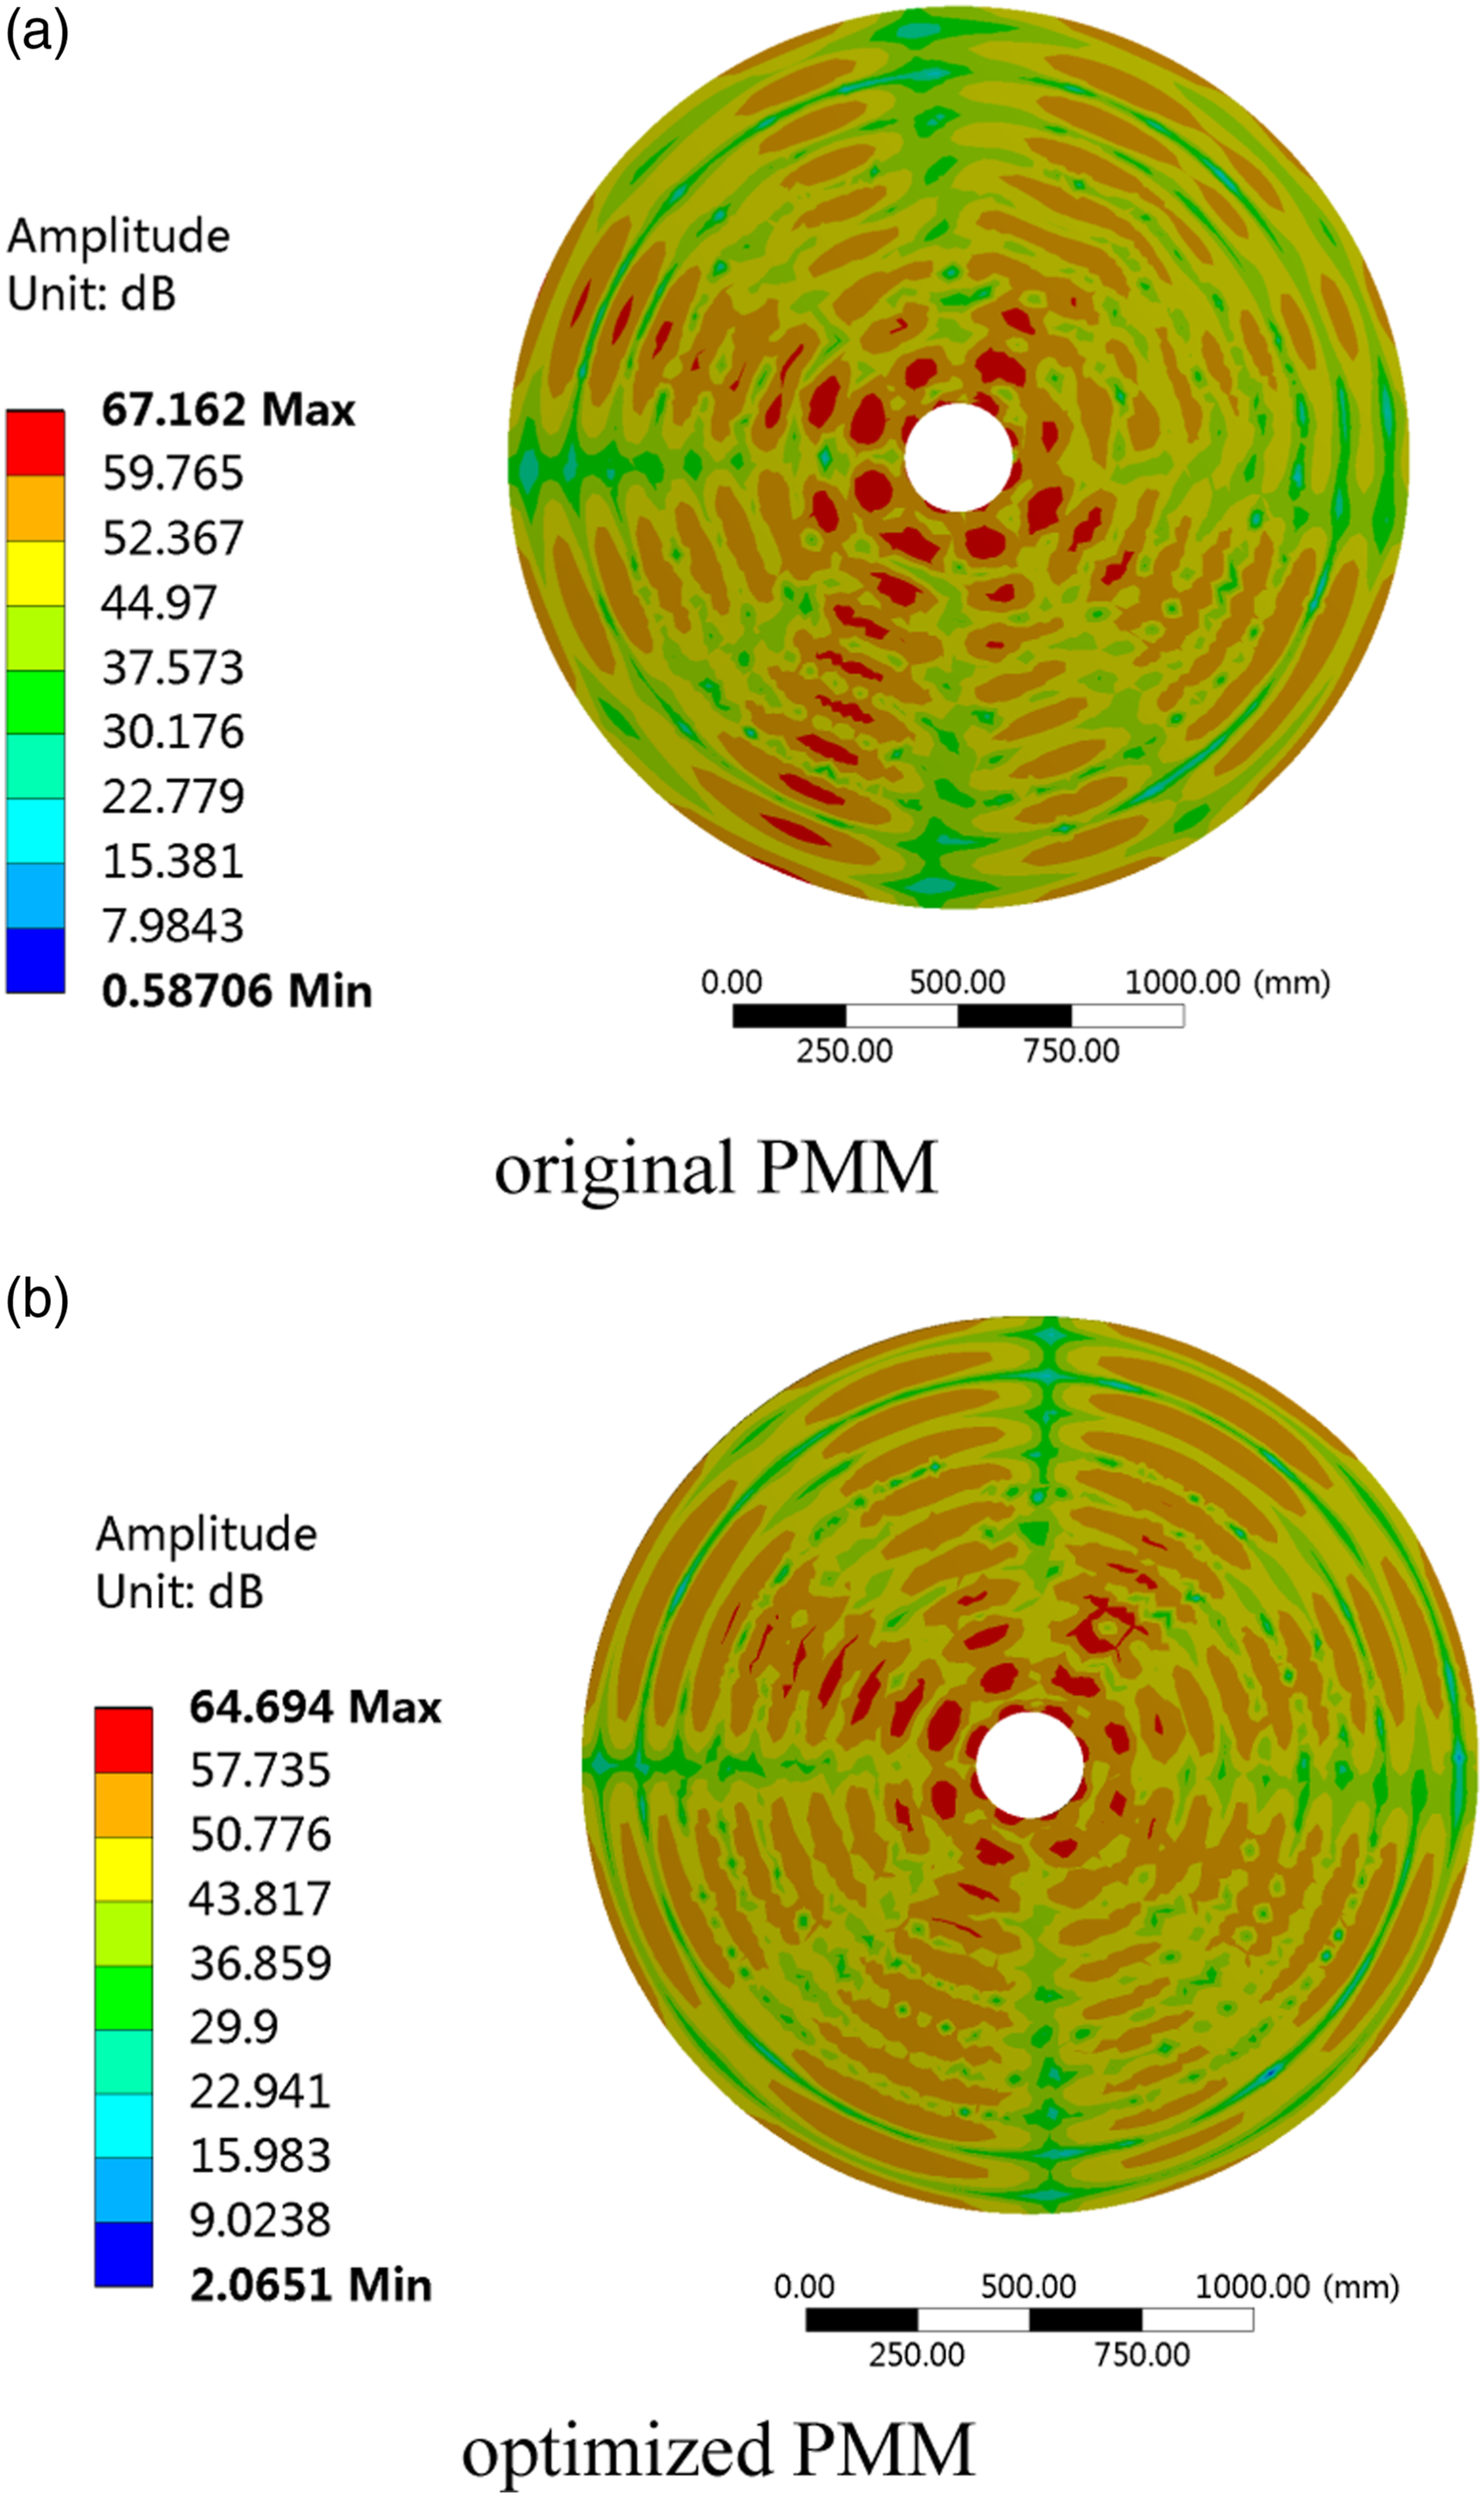
This figure is quite revealing in several ways. First, the peak values of SPL occur at even multiples of 200 Hz. Second, the SPL of the optimized PMM decreased by 4.55%, 4.01%, 5.86%, 5.78%, and 4.12% at 400 Hz, 800 Hz, 1200 Hz, 1600 Hz, and 2000 Hz, respectively, but the SPL decreases slightly at 2400 Hz and 2800 Hz. The simulation results suggest that the SPL of optimized PMM can be effectively reduced.
Vibration and noise measuring experiment
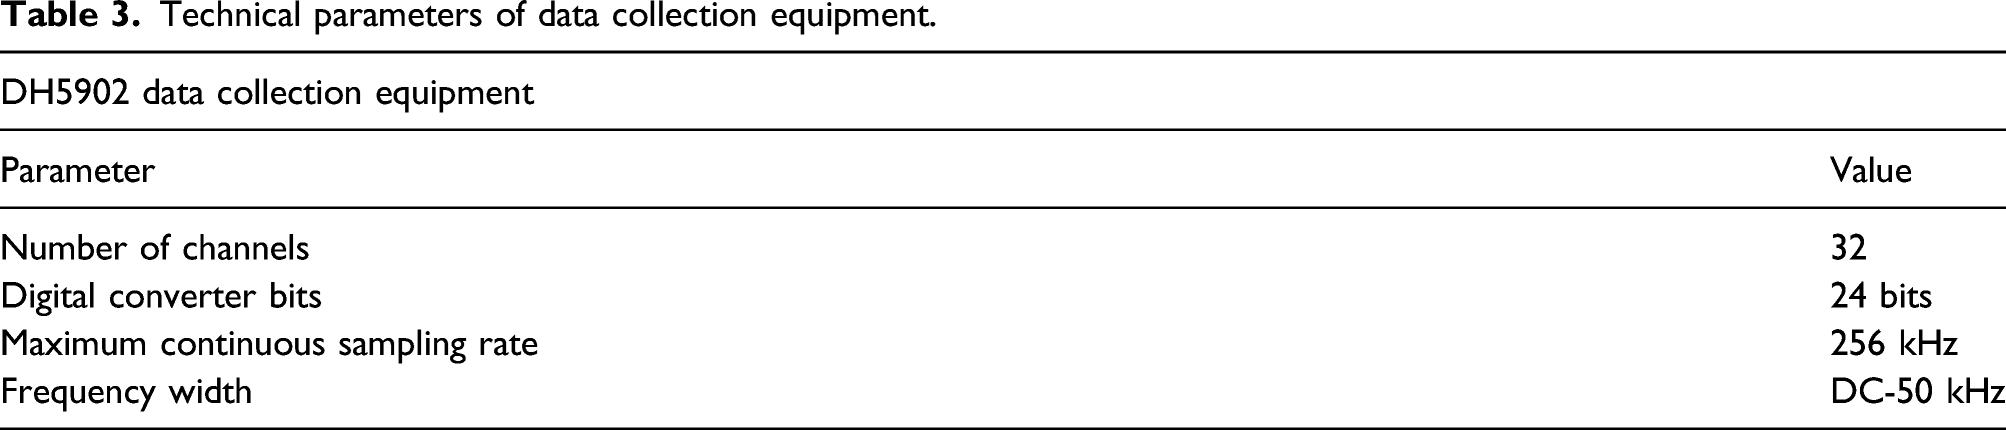
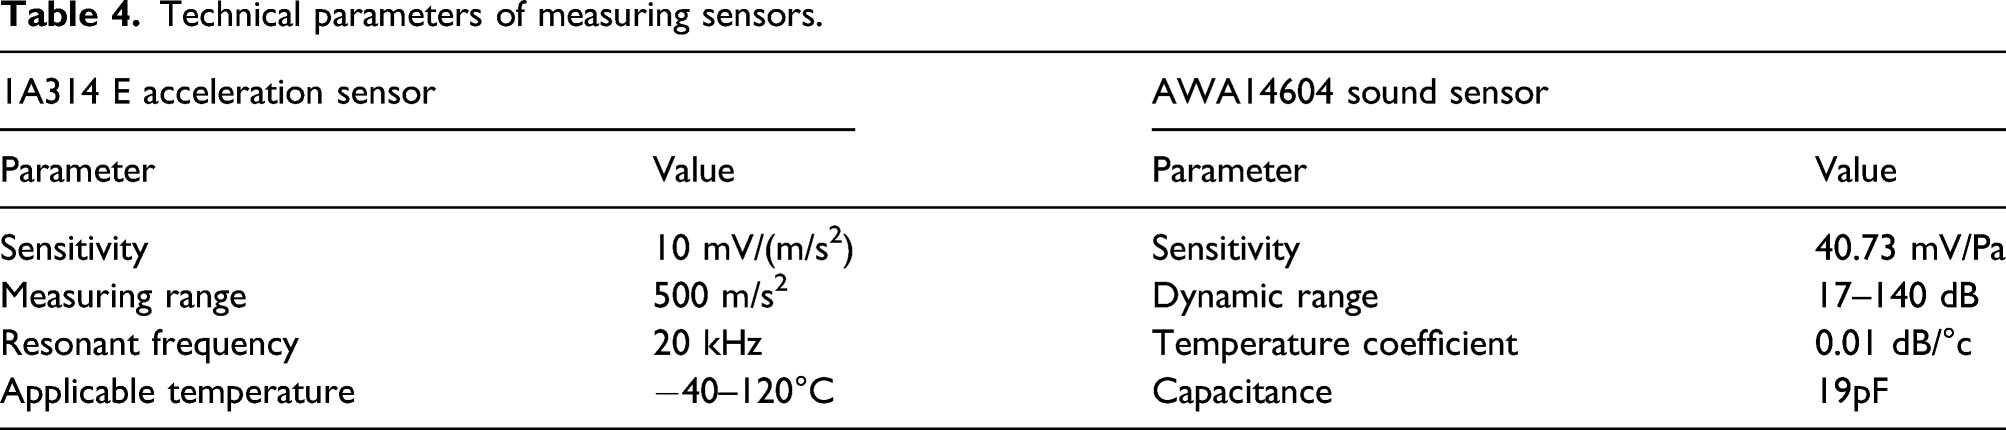
The vibration and noise experiment of the optimized PMM was carried out to verify the accuracy and effectiveness of the above research. The vibration and acoustic sensors were employed to obtain original data. The accelerometer was installed in the middle of the PMM, and the acoustic sensor was installed 0.5 m from the right side of the PMM. The schematic diagram of measuring experiment is displayed in Figure 12. The technical parameters of data collection equipment and measuring sensors are listed in Table 3 and Table 4, respectively. In the experiment, the optimized PMM operates at rated speed in the measuring experiment. At first, the time domain data were acquired. Each sample duration is not less than 30s. Then, the frequency domain data of vibration and noise were calculated by Fourier transformation. Schematic diagram of measuring experiment. Technical parameters of data collection equipment. Technical parameters of measuring sensors.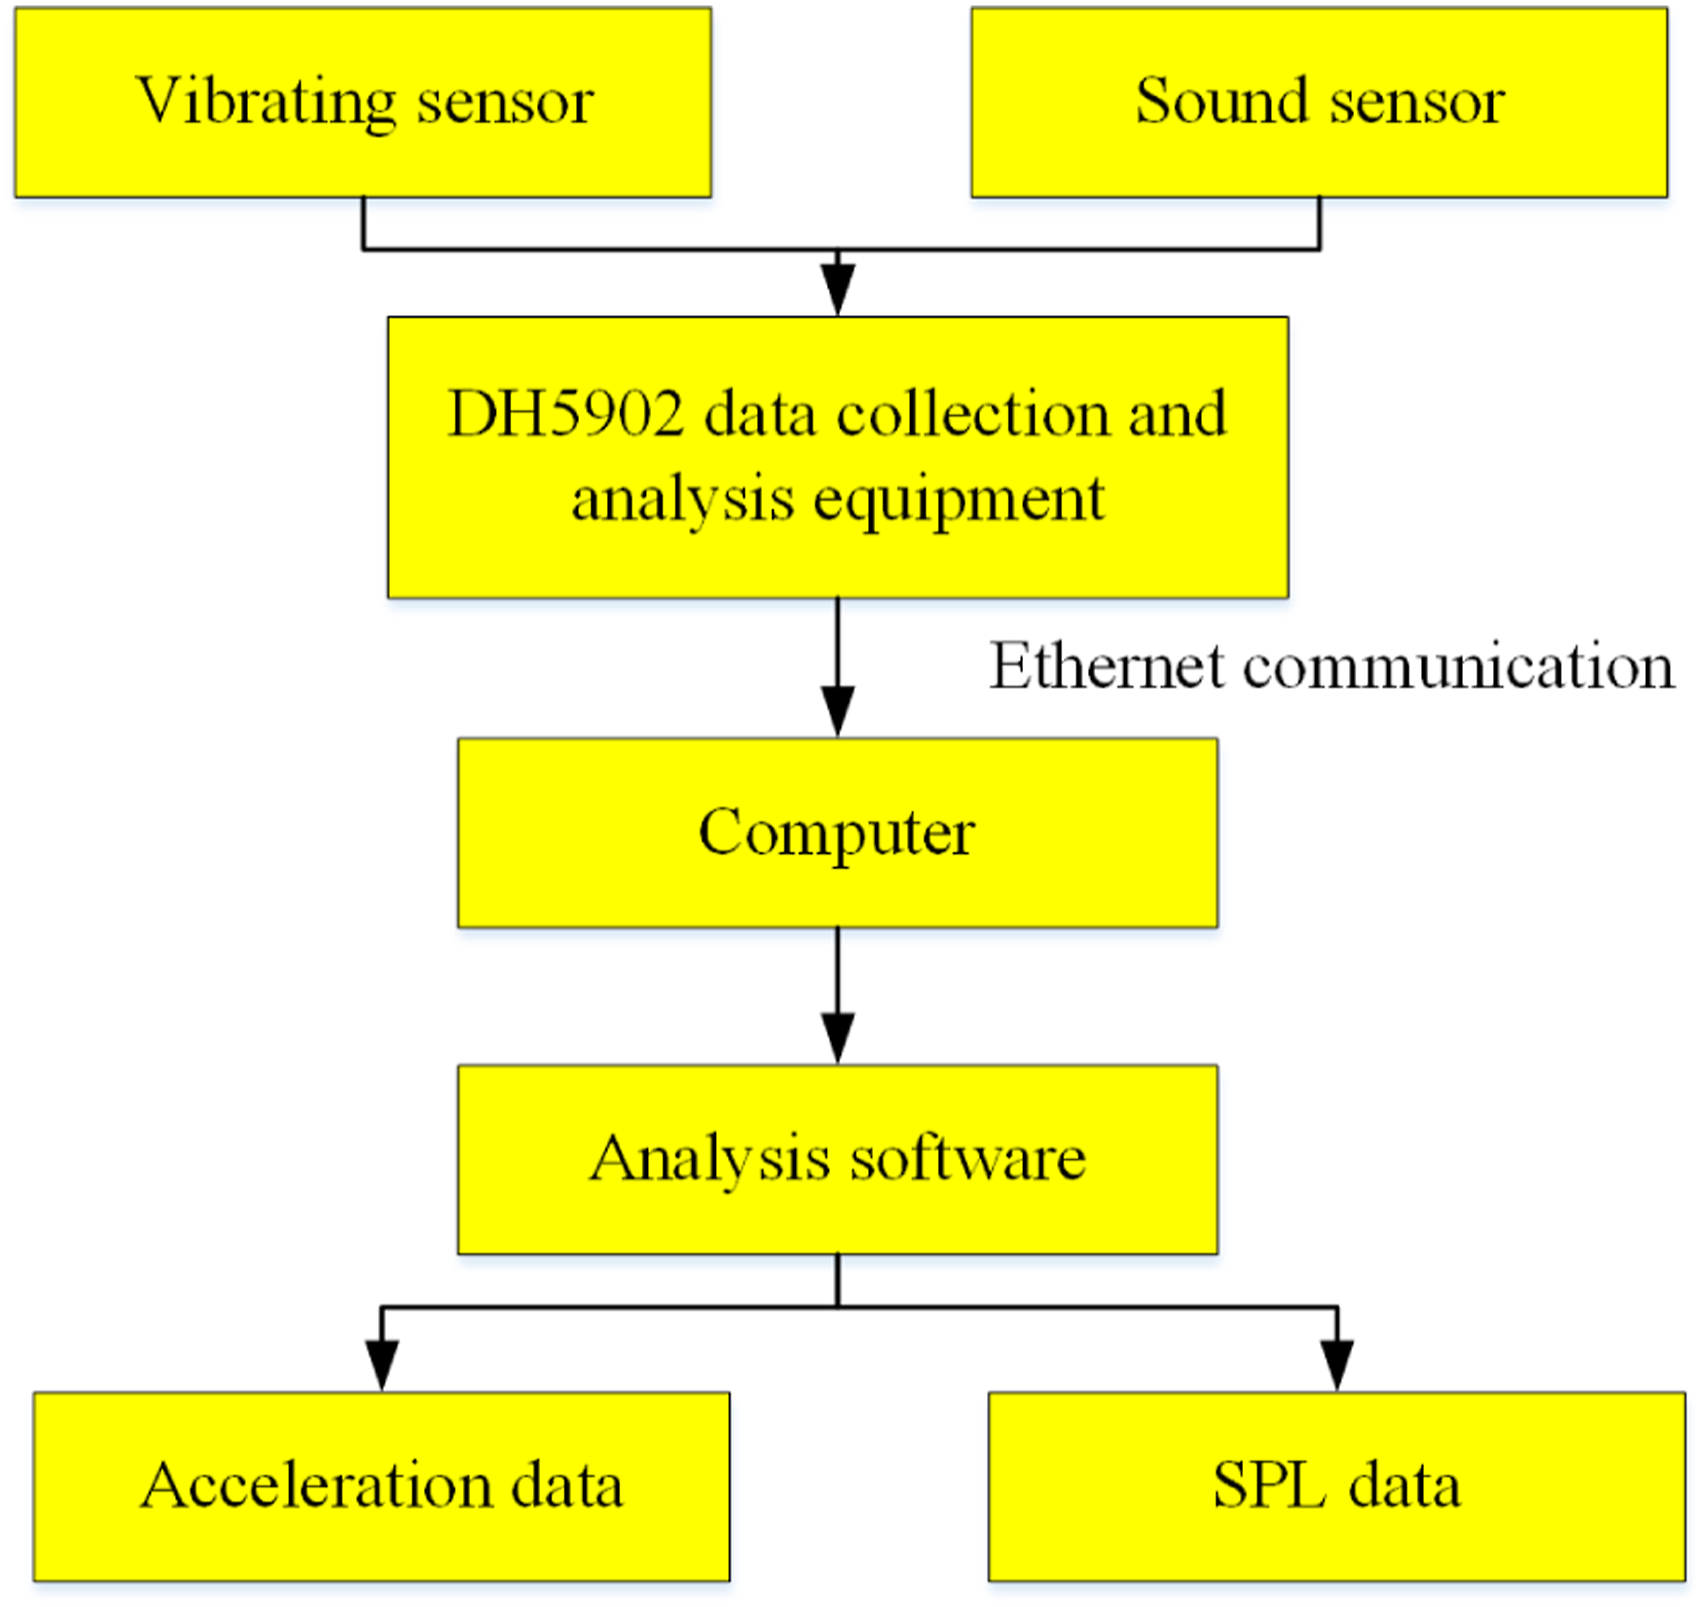
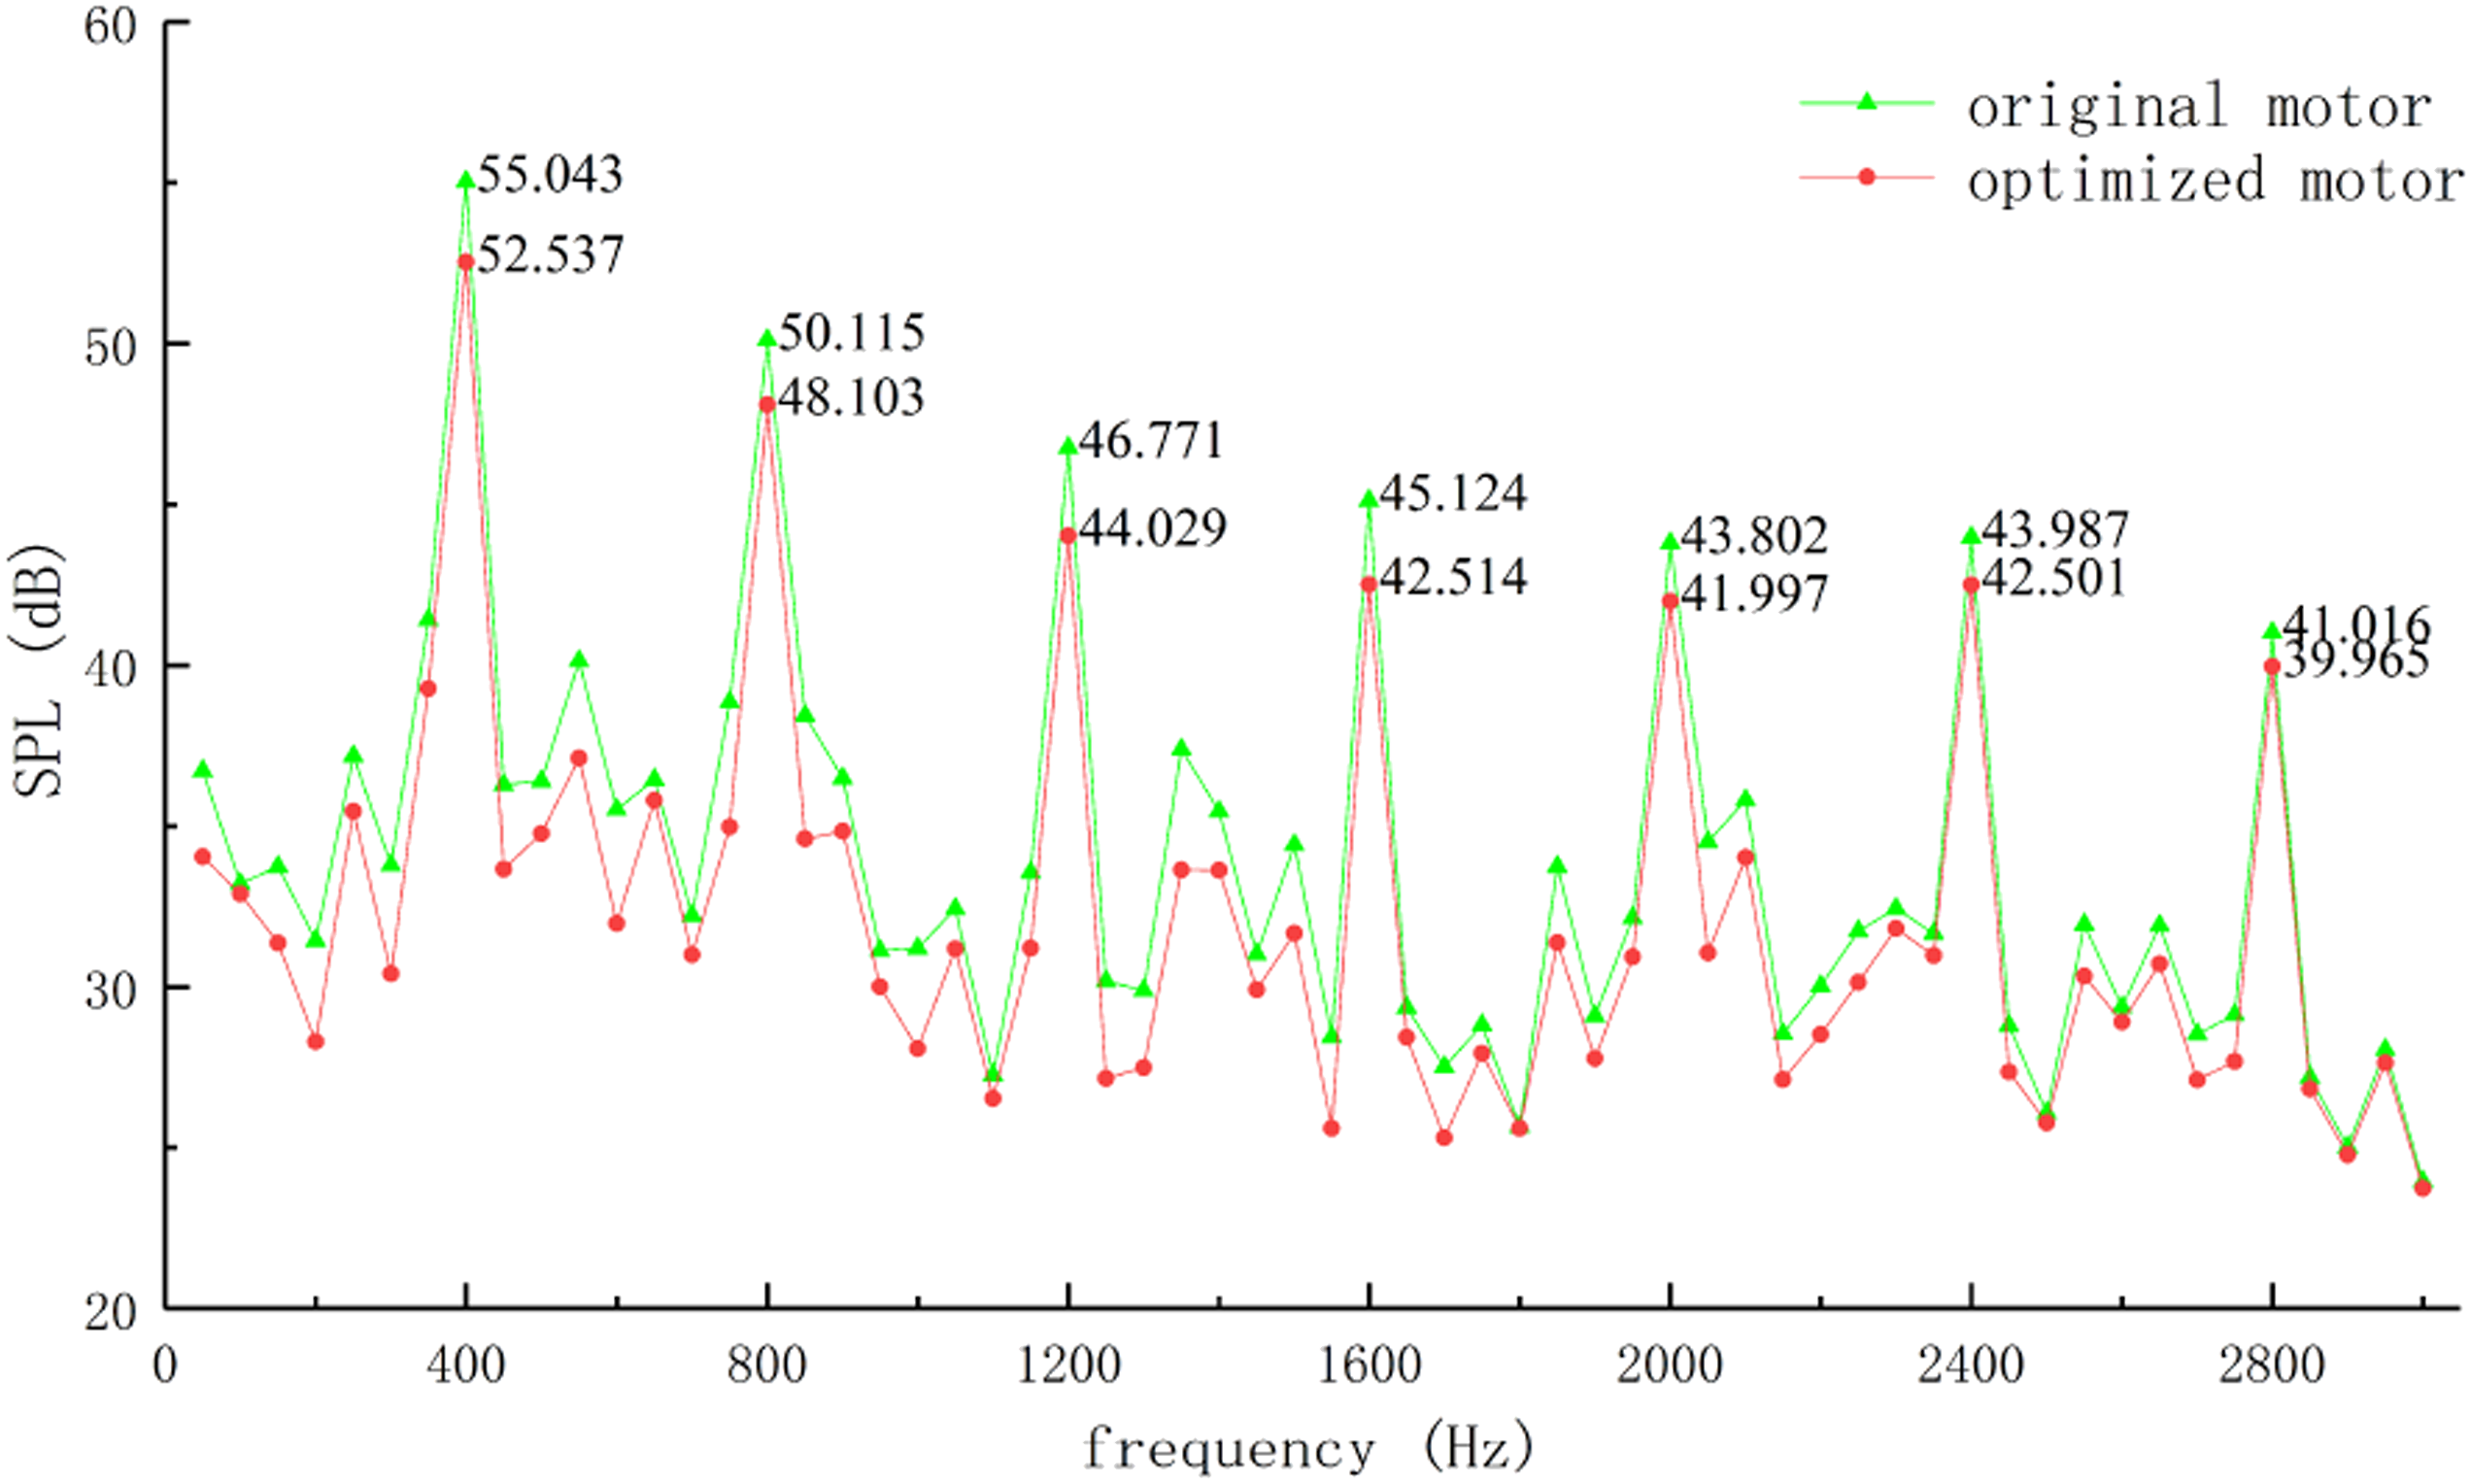
It should be pointed out that the magnetic bearing was adopted and no cooling fan was installed on the PMM. In this way, the vibration and noise caused by aerodynamic and mechanical reasons can be ignored. The measuring site is shown in Figure 13. The simulation and experimental data of vibration and noise are shown in Figures 14 and 15, respectively. Vibration and noise experiment site. Simulation and experimental data of vibration acceleration. Simulation and experimental data of sound pressure level.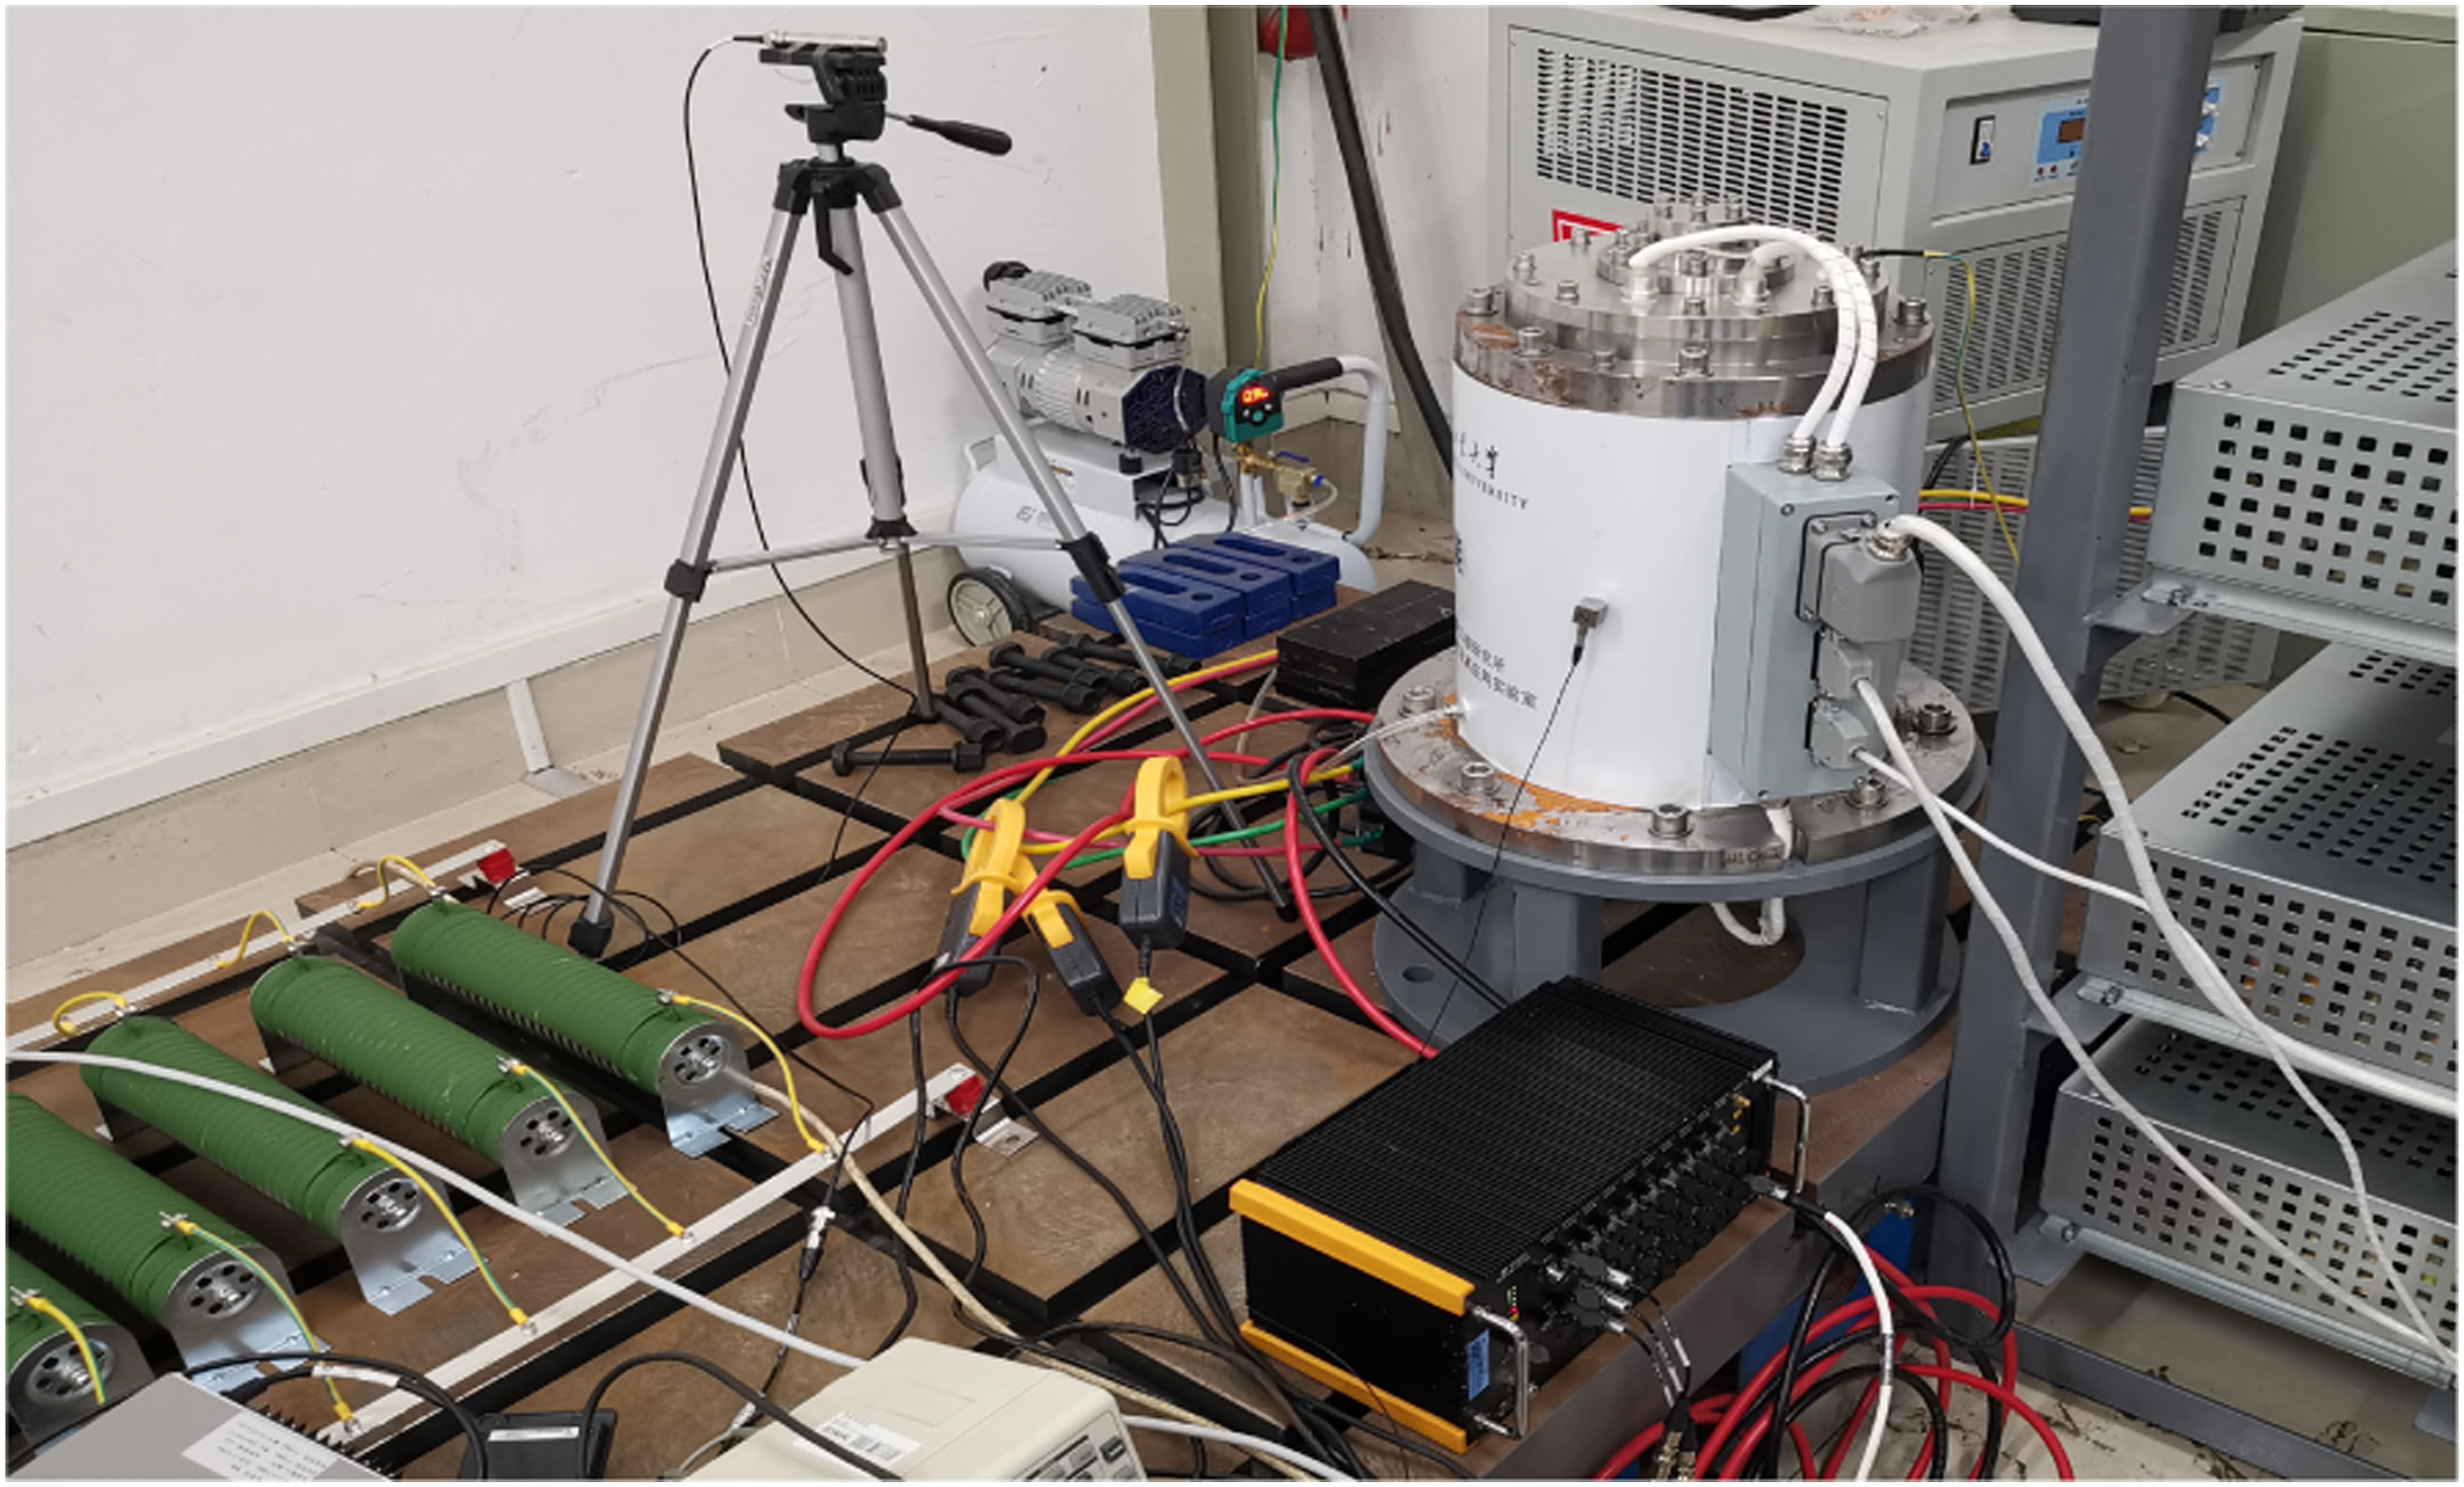
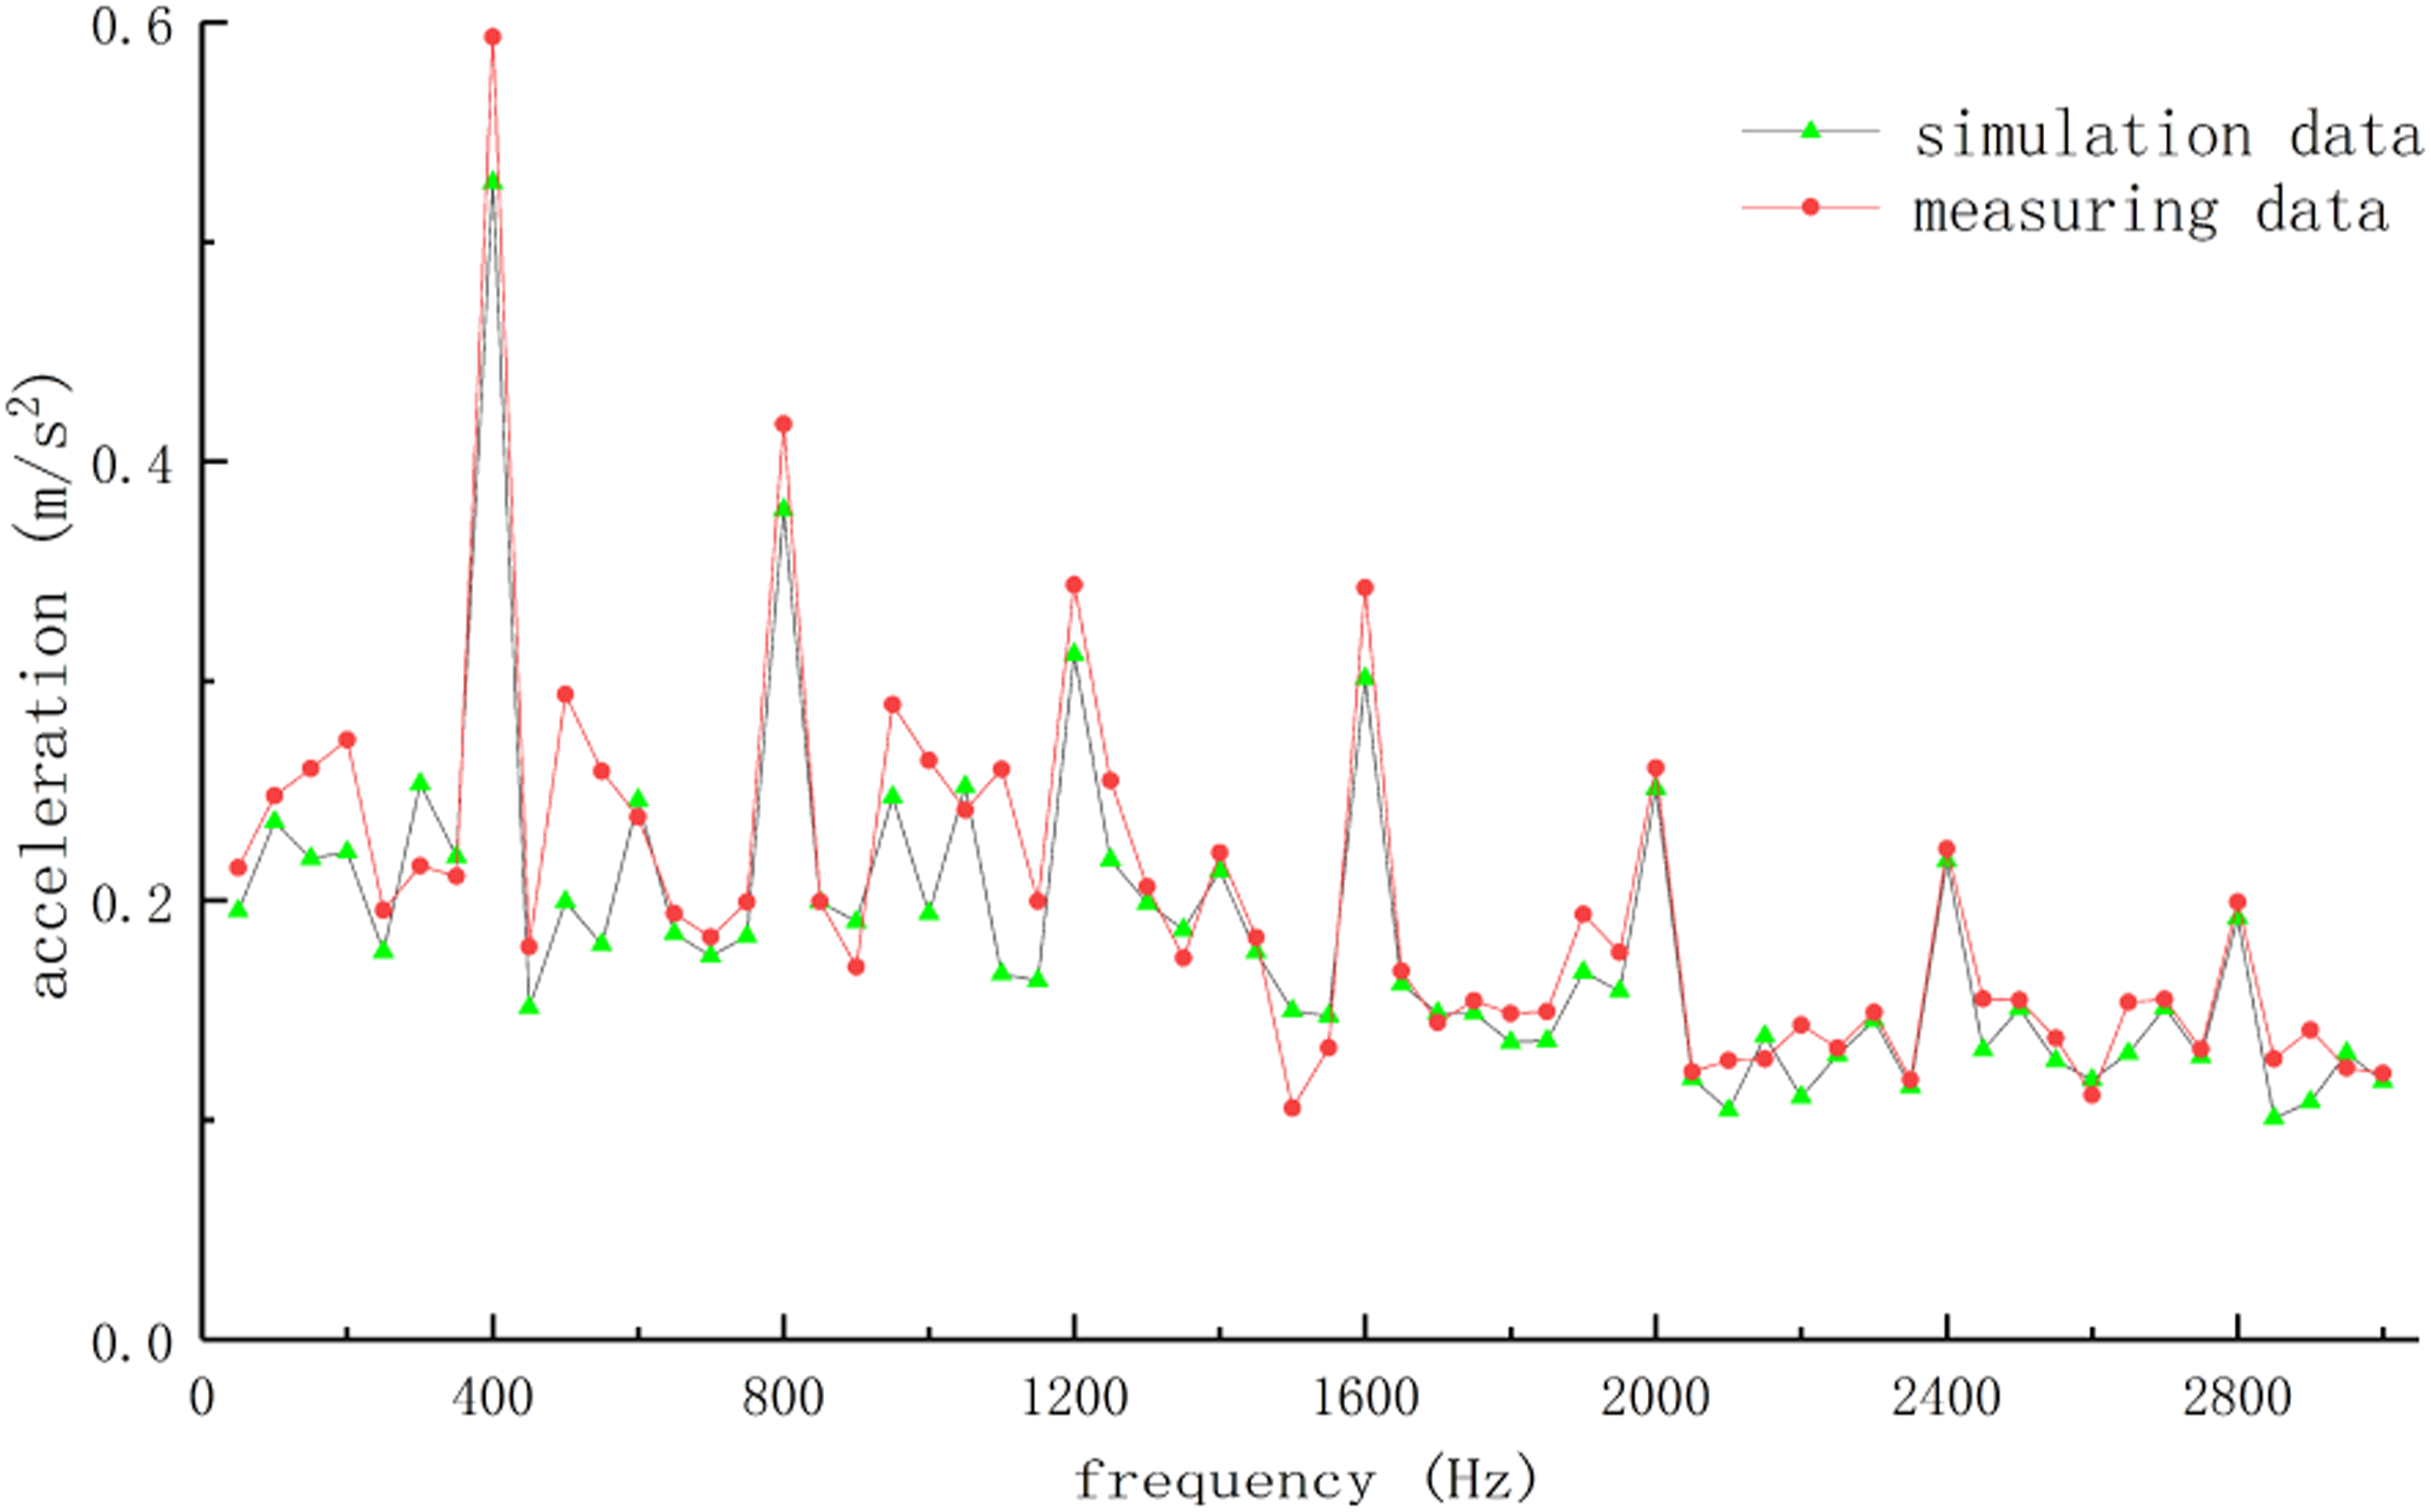
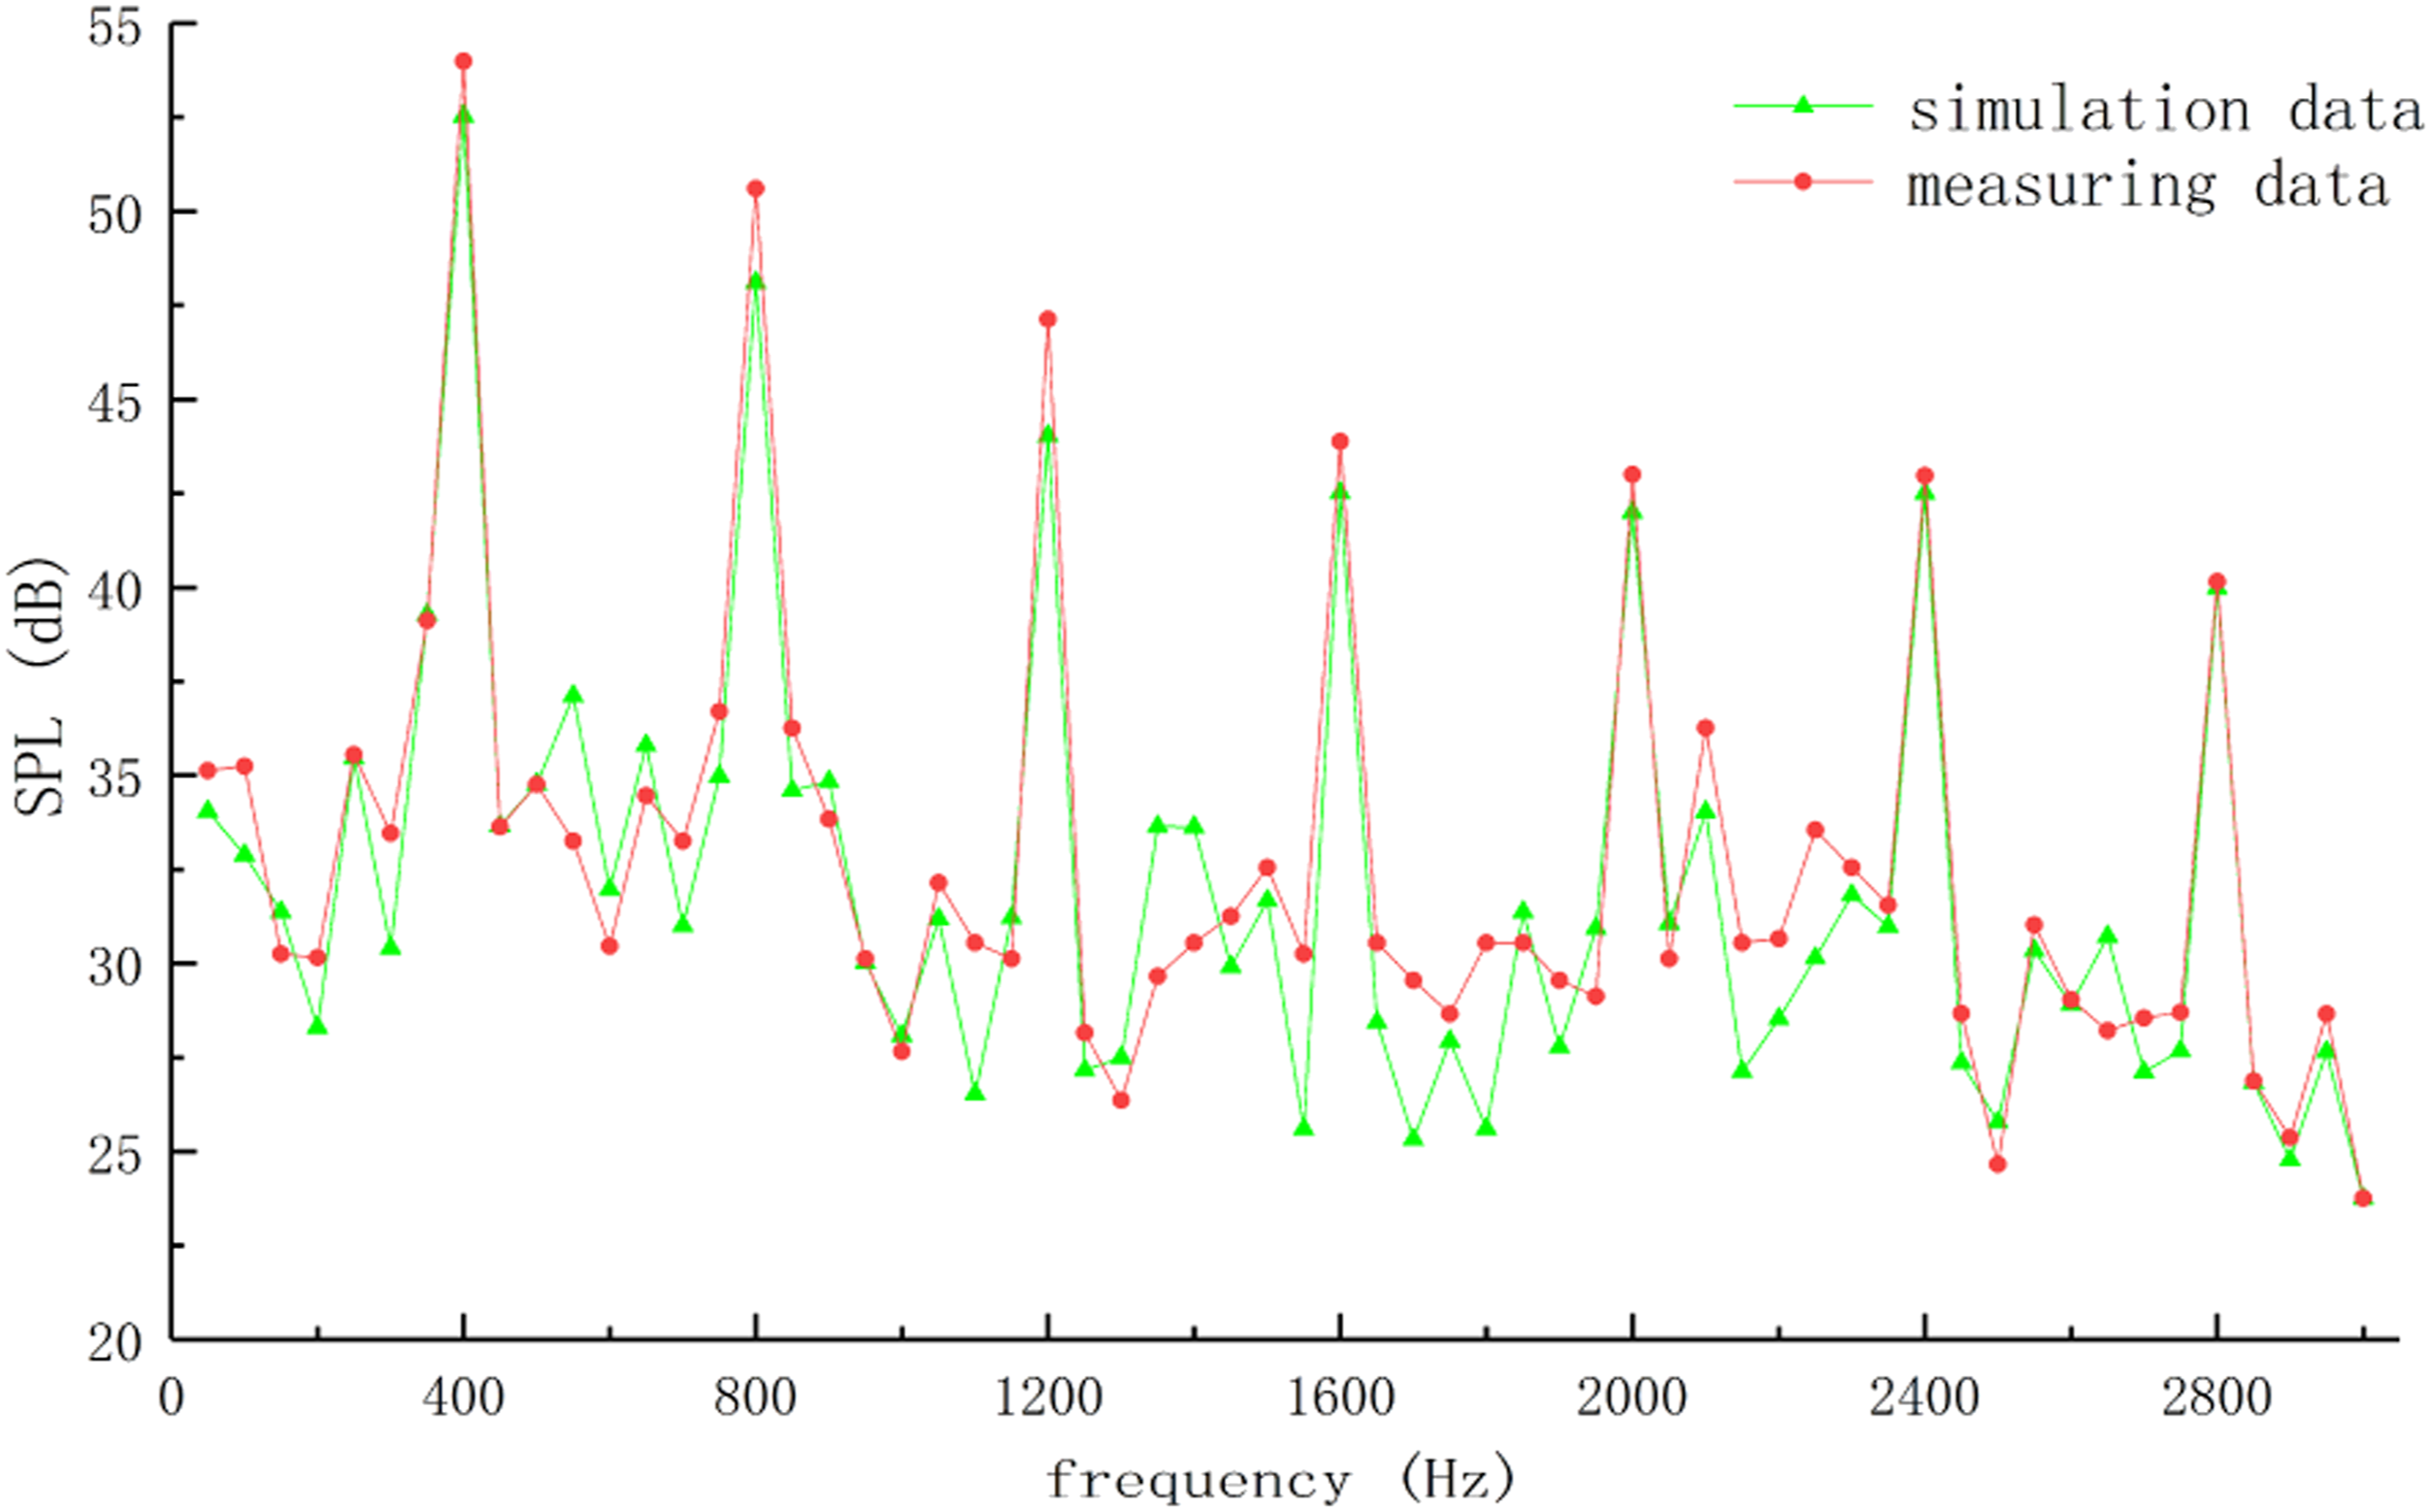
Figure 14 reveals that the variation trend and amplitude of the simulated and measured acceleration spectrum are basically similar. The peak values of vibration acceleration appear at even multiples of 200 Hz. The average values of simulated and measured acceleration are 0.184 m/s2 and 0.197 m/s2, respectively. The error rate is 7.07%. It can be seen from Figure 15 that the simulation results of SPL spectrum are also satisfactory. Interestingly, the average values of simulated and measured SPL are 32.00 dB and 32.73 dB, respectively, and the error rate is only 2.28%. The measured acceleration and SPL are slightly larger than those of the simulation. This may be due to the fact that only REF excitation is considered in the simulation. However, in the actual PMM, the certain mechanical vibration and noise may be caused by machining accuracy and installation errors. The accuracy of the theoretical analysis is verified by the experimental results.
Discussion
This study was carried out by the combination of theoretical analysis, simulation optimization, and experimental verification. There are three main contributions. First, the output torque under rated operating condition will be reduced by more than 5% if the optimizing methods in Ref. 6, 7, and 21 are adopted. The output torque loss is only 2.27% in this study. More significantly, the maximum and average vibration acceleration of the optimized PMM is decreased by 22.27% and 11.11%, respectively, and the total SPL is reduced by 3.67%. This means that this proposed method achieves better optimization results with less performance loss. Second, the vibration and noise are suppressed by slotting the rotor, setting an asymmetric magnetic barrier, or changing modal parameters in Ref. 3, 20, 21, and 23. These methods may increase the manufacturing cost and the processing difficulty. The proposed optimizing method is easier to implement. Third, the optimized methods proposed in Ref. 1, 4, and 19 are only suitable for surface-mounted PMM whose electromagnetic performance is not good. The surface-mounted PMM is difficult to meet the development requirements of high-performance motor. But, the optimization method in this study is applicable to both surface-mounted PMM and embedded PMM. In summary, it is feasible to reduce the electromagnetic vibration and noise by optimizing the stator tooth profile in engineering application. This method does not require high precision machining equipment and technology. It is easy to change the shape of the silicon steel sheet. The optimization method proposed in this study is economical and operable. In addition, the optimization method has better universality and can be used to reduce the vibration and noise of other types of PMM.
Conclusions
This study set out to find a new effective method of reducing the electromagnetic vibration and noise of PMM. The theoretical analysis results reveal that the amplitude of REF is larger when the frequency is an even multiple of the fundamental frequency. Then, the stator teeth profile was optimized to make the REF of the stator teeth more uniform. The optimal offset distance of stator teeth is 0.8 mm, and the torque volatility of the optimized PMM is decreased by 38.53%. The modal analysis demonstrates that the first four modal frequencies of the stator are quite different from the REF excitation frequency, so resonance can be avoided. The simulation results further support the theoretical analysis. For the optimized PMM, the maximum and average vibration acceleration is reduced by 22.27% and 11.11%, respectively, and the total SPL is reduced by 3.67%. The experimental data demonstrate that the error rates of average acceleration and average SPL are 7.07% and 2.28%, respectively, which means that the accuracy of the theoretical analysis is satisfactory. The research methods and conclusions of this study are credible and effective and may be extended to vibration and noise optimization of other PMM.
Footnotes
Declaration of conflicting interests
The author(s) declared no potential conflicts of interest with respect to the research, authorship, and/or publication of this article.
Funding
The author(s) disclosed receipt of the following financial support for the research, authorship, and/or publication of this article: This work has been supported by the Research and Development Program of Chinese Academy of Agricultural Sciences (Grant no. CAAS-NRAM-SJ-201,903). And, partly supported by the National Research and Development Plan (Grant no. 2017YFD0700704).