
Abstract
The objective of this study is to characterize the vibration responses of a handheld workpiece and the hand–arm system, which is an important step toward identifying and developing effective methods and technologies for controlling the vibration exposures to workers performing the grinding of handheld workpieces. This study established a method for measuring the vibration responses of the entire workpiece–hand–arm system; the vibration exposure of a worker holding and pressing a typical workpiece against a sanding belt or grinding wheel in order to shape the workpiece was simulated. This method was applied to measure the apparent mass and vibration transmissibility of the system under two different feed forces (15 N and 30 N) and six simulated grinding interfaces with different stiffness values. A major resonance was observed in each transmissibility spectrum of the workpiece, which was correlated with the major resonance of the impedance of the entire system. This resonant frequency depended primarily on the workpiece mass and the grinding interface stiffness, but the hand–arm system could substantially affect the resonance magnitude. The feed force also significantly affected the resonance frequency and magnitude. While increasing the feed force increased the overall vibration transmissibility on the hand–arm system, the transmissibility with respect to the workpiece was not significantly affected by the interface conditions. The implications of the results are discussed.
Introduction
The manufacture of some machine parts, tools, sports equipment, furniture, and dentures involves grinding of handheld workpiece.1–3 Such processes may cause significant vibration of the workpieces. The workpieces are firmly held by the fingers or hands in the grinding process and the vibration may be effectively transmitted to the fingers or hands of the workers, which may induce some health effects. For example, a recent study reported that a significant prevalence (>12%) of vibration-induced white finger (VWF) was found in workers performing the fine grinding of golf club heads. 3
According to the standard method for the measurement and assessment of hand-transmitted vibration exposure, 4 an effective approach to control this occupational disease is to reduce vibration exposure. To help identify and/or develop effective methods for reducing the vibration exposure of the workers performing the grinding of handheld workpieces, the vibrations of some handheld workpieces during their grinding processes at workplaces have been measured.1,5,6 These studies improved the understanding of some characteristics of the workpiece vibration and proposed vibration exposure control methods. However, it is difficult to sufficiently characterize and clearly understand the responses of the workpiece and hand–arm system using vibration data measured at workplaces. For example, it is difficult to clearly identify the critical resonance frequencies of the system from field experimental data, as it is very difficult to reliably measure the input vibration on the grinding machine drive wheel to determine the vibration transmissibility on the workpiece–hand–arm system. It is also difficult and expensive to investigate the influencing factors of the system responses at workplaces.
We hypothesize that the workpiece vibrations can be significantly affected by the hand–arm system, similar to the effects of the hand–arm system on the vibrations of tool handles.7,8 In fact, the influences on workpiece vibration may be larger than those on tool handle vibration in many cases, because the mass values of many workpieces are less than those of tool handles, especially if the handles are rigidly connected on the tool body. Therefore, it is important to consider the vibration response characteristics of the entire workpiece–hand–arm system in the design, modeling simulation, testing, and evaluation of engineering methods and technologies for controlling vibration exposures in the grinding of handheld workpieces. The response characteristics of the system may also be useful to help understand the health effects of such vibration exposures and to help improve risk assessments of these exposures.
The vibration responses of the system can be characterized through the measurement of driving-point response functions such as apparent mass, mechanical impedance, and the vibration transfer functions on the system. Although many studies have measured the driving-point response functions of the hand–arm system,9–13 a method for measuring the response functions of the entire workpiece–hand–arm system has not been reported. Because the hand and arm postures, hand actions (e.g., finger pinches or grasps with both hands), and hand coupling forces used in the grinding of handheld workpieces are likely to be very different from those used in the operations of powered hand tools (e.g., power grip), the reported response functions may not be applicable to study handheld workpiece vibrations. Although many studies have also reported the vibration transfer functions on the hand–arm system,14–20 such transfer functions for the workpiece-hand-arm system have been far from sufficiently reported. It remains unclear whether the vibration responses of the hand–arm system in the grinding of handheld workpieces are substantially different from those in the operations of powered hand tools.
Based on this background, the specific aims of this study are as follows: (1) to establish an experimental method and apply it to measure the frequency response functions of the grinding interface–workpiece–hand–arm system and (2) to investigate the effects of the effective stiffness of the interface and grinding feed force on the response functions. While preliminary experimental data of the study were reported in a conference and used to develop a model of the system for some specific working conditions, 21 the detailed experimental method, full test results, and related discussions and conclusions are presented in this paper.
Methods
Figure 1(a) shows an example of the handheld workpiece grinding task. The grinding may be conducted on various grinding machines. While some of the machines have a hard grinding interface (e.g., grinding stone), others have a soft grinding interface (e.g., grinding belt on a drive wheel with a thick rubber tread). The basic operation can be generally represented using the model shown in Figure 1(b), which was used as a basis for the design of the study method.
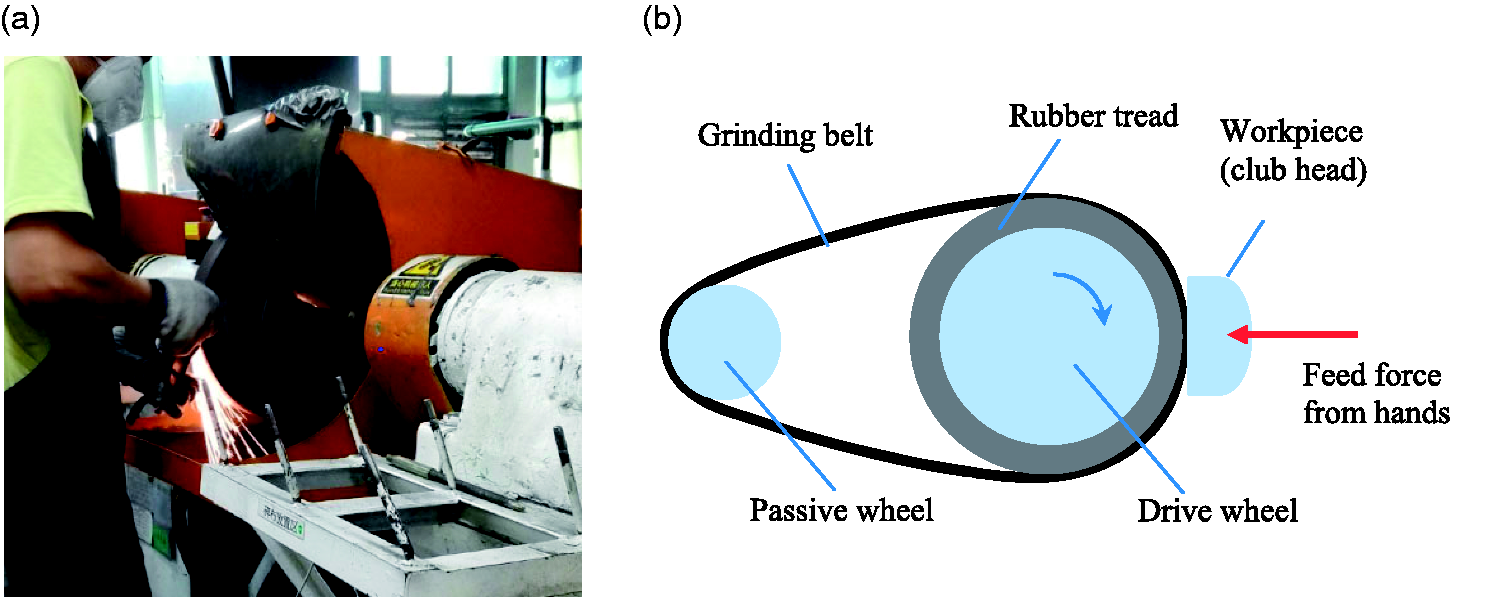
The fine grinding of a handheld workpiece (golf club head) on a belt grinding machine. (a) A worker in the grinding process (b) The operating mechanism
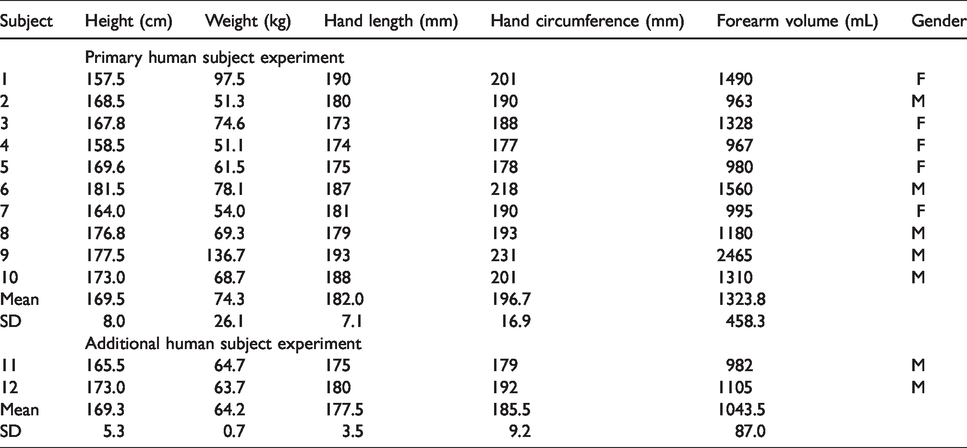
Three series of experiments were conducted to achieve the specific aims of this study. The first experiment, which did not involve any human subjects, was designed to calibrate and evaluate the measurement method proposed in this study. The second experiment was the primary human subject experiment of this study. The vibration responses of the workpiece–hand–arm system in the major frequency range of concern (6.3–1600 Hz in the one-third octave bands) for the hand–arm vibration exposure were measured. Ten subjects (five male/five female) participated in this experiment, in which three high-stiffness grinding interfaces were simulated. The third experiment was designed primarily to verify the effects of the hand–arm system on the resonant responses of the workpiece for interfaces with low contact stiffness. For this purpose, two male subjects participated in the third experiment. The major anthropometries of the 12 subjects are listed in Table 1. The same study protocol was used in both human subject experiments, which was reviewed and approved by the NIOSH Human Subjects Review Board. The detailed designs of the measurement method and experiments are described in the following subsections.
Anthropometry data of the subjects in the experiment (hand length = tip of middle finger to crease at wrist; hand circumference measured at the metacarpals; forearm volume was measured using a water–displacement method).
The method for measuring the vibration responses of a workpiece–hand–arm system
The general experimental setup for the measurement of the system responses is illustrated in Figure 2. The handheld workpieces may vary in a large range in terms of their structures, masses, and dimensions. As an initial investigation, this study used a typical golf club head (201 g, stainless steel, from a workplace 5 ) to represent the workpiece for identifying the basic characteristics of the system responses. To simulate the effect of the hand–arm on the workpiece response, the club head was held and controlled by both hands of each test subject with body and hand–arm postures as shown in Figure 2(a), similar to those shown in Figure 1(a) observed in the grinding of the workpiece at a workplace. 5
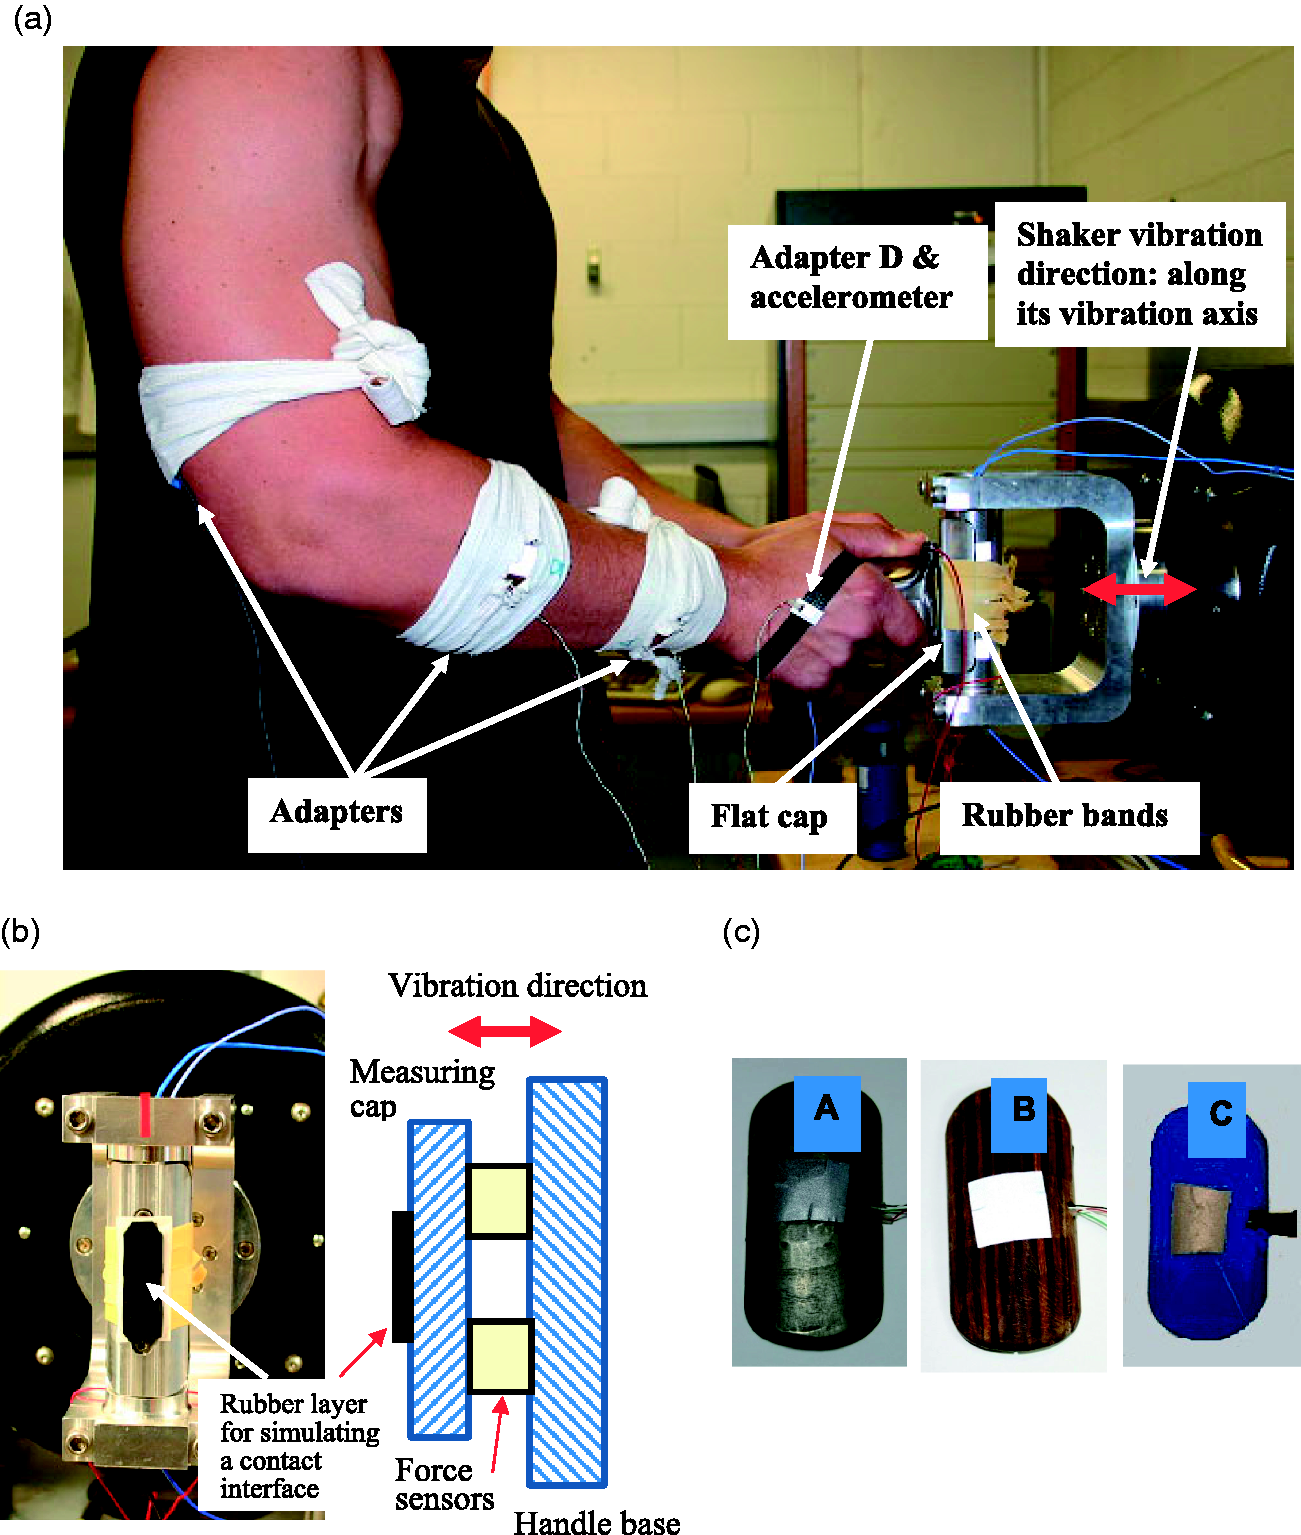
Pictorial views of the instrumentation setup on the 1-D vibration test system. (a) A test subject with prescribed arm postures and measurement locations (b) Instrumented handle with a contact interface (c) Three adapters used in the experiment.
The results of our previous study confirm that the handheld workpiece vibration has substantial components in all three axes. 5 However, the vibration spectra measured in the three orthogonal directions are highly correlated to each other. This indicates that the basic characteristics of the workpiece vibrations in each direction are similar, which suggests that their excitation sources are similar and that the basic response mechanisms of the system in the three directions are similar. Therefore, it is not essential to simulate the coupled multiaxial vibrations to understand the basic mechanisms and characteristics of the system responses and the influencing factors. To simplify this laboratory study, the system responses were simulated on a single-axis test system, as shown in Figure 2(a). The simulated vibration direction is indicated in Figure 2(a) and 2(b).
According to contact mechanics theory, 22 the dynamic properties of grinding interfaces depend on the geometries of the workpiece and drive wheel tread contact surfaces, their material properties, the grinding belt, and the pressure applied on the drive wheel. While it is very difficult to replicate these characteristics on the vibration test system, the grinding interface was simulated using a layer of rubber, shown in Figure 2(b). Rubber samples exhibiting different levels of effective stiffness were selected to simulate the interfaces; these rubber samples are described in Experiment II—Primary human subject experiment and Experiment III—Additional human subject experiment sections.
As shown in Figure 2(a), the vibration input to a handheld workpiece via a simulated grinding interface was provided by a shaker (Unholtz-Dickie, TA250-S032-PB); the vibration stimulus was delivered to the workpiece through an instrumented handle equipped with a triaxial accelerometer (Endevco, 65–100) and two force sensors (Kistler 9212). The instrumented handle was also used to measure the input vibration accelerations, the interface feed force, and the apparent mass of the workpiece–hand–arm system. Unlike the conventional instrumented handle that has a cylindrical shape for the measurement of the biodynamic responses of the hand–arm system, the current handle has a flat interface. This assured a stable directional interaction between the workpiece and the handle during the vibration exposure. A force plate (Kistler, 9286AA) was used to verify the feed force that was simultaneously measured using the instrumented handle. A custom program was created using LabVIEW software (National Instruments) to display the feed force on a computer monitor positioned in front of the test subject.
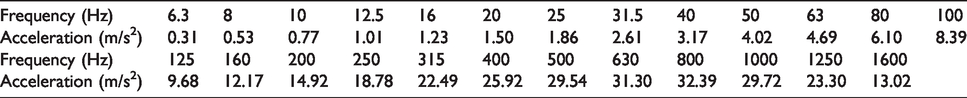
A broadband random vibration spectrum was used as the excitation in all three experiments, which was an extension of that defined in the current anti-vibration glove test standard. 23 Because the spectrum defined in the standard ranges from 25 to 1600 Hz, the lower frequency limit was reduced from 25 to 6.3 Hz by adding a section of spectrum to the standard spectrum so that the excitation spectrum covered the entire frequency range of concern in this study. To assure a smooth extension, the added spectrum features the same constant velocity as that in the original spectrum from 25 to 250 Hz. The actual vibration accelerations (m/s2) in the one-third octave bands generated on the vibration test system used in this study are listed in Table 2. The vibration test system’s closed-loop control was used to assure the consistency of the input vibration in each test trial.
The accelerations of the random excitation spectrum used in this study, which were measured on the instrumented handle and expressed in the one-third octave bands from 6.3 to 1600 Hz.
Three adapters (A, B, and C) shown in Figure 2(c) were used to measure the vibrations transmitted to the wrist, forearm, and upper arm of the subject, respectively. Each adapter was equipped with a triaxial accelerometer (Endevco, 35A) and secured in place using a cloth wrap, as shown in Figure 2(a). This method was validated for the measurement of the vibrations transmitted to the arm in a previous study. 18 Also shown in Figure 2(a), a small adapter (D) equipped with a triaxial accelerometer (Endevco, M35) was firmly attached to the back of the hand using a hook and loop wrap to measure the vibration transmitted to the hand dorsum.
The workpiece vibration was measured using another triaxial accelerometer (PCB 356A11) firmly installed on the workpiece using a screw, as shown in Figure 3(c) and 3(d). The measured vibration and force signals were input to data acquisition and analysis system (B&K 3050/3053). The vibration accelerations and apparent mass were simultaneously measured and expressed in the one-third octave bands with center frequencies from 6.3 to 1600 Hz.

Calibration and evaluation of the measurement system with a calibration bar and a workpiece (club head). (a) A calibration bar on the handle (b) A model of the calibration principle (c) The golf club head on the handle (d) The side view of the golf club head on the handle.
Experiment I—Calibration and evaluation of the measurement system
To assure the accuracy and reliability of the instrumented handle, a laser vibrometer (Polytec, PSV-300-H) was used to conduct an in-situ check of the accelerometer installed in the handle. The results were used to adjust its calibration factor. Then, a calibration bar (mCal = 114 g) was attached to the handle using a 30 N force provided by two rubber bands, as shown in Figure 3(a); the calibration bar’s apparent mass was measured using three high-stiffness interfaces (R1, R2, and R3) shown in Figure 4(a). The vibration transmissibility of the calibration bar was measured using the laser vibrometer.
Because the calibration bar is very rigid, its response can be modeled as a one-degree-of-freedom (1-dof) system supported on the measuring cap of the handle, as also shown in Figure 3(b). According to the theorem derived by Dong et al.,
24
the relationship between the apparent mass (MCal) and transmissibility of the calibration bar (TCal) can be expressed as follows
Where 
This relationship was used to evaluate the validation of the measurement system.
Another series of tests were conducted to verify the vibration measurement on the workpiece. As shown in Figure 3(c) and 3(d), the workpiece was secured to the instrumented handle using a 30 N force provided by two sets of rubber bands. While the triaxial accelerometer installed on the workpiece was used to measure the vibration in the three orthogonal directions in the local coordinate system of the workpiece, two laser vibrometers (Polytec, PSV-300-H; and Polytec PDV-100) were used to measure the vibration on the workpiece in the orthogonal directions in the global coordinate system. The verification criterion requires that the total vibration or vector sum of the three axial accelerations measured using both methods must be consistent. The apparent mass of the workpiece on each of the interfaces was also measured simultaneously with the measurement of the vibration accelerations on the workpiece.
Experiment II—Primary human subject experiment
Simulations of high-stiffness grinding contact interfaces
The highest possible observed grinding interface stiffness occurs when a metal workpiece contacts a stone grinding wheel; this condition can be simulated by pressing the workpiece against a flat metal surface. This scenario was explored, and the vibration test system automatically shut down within a few seconds for its protection because a high-frequency (>1000 Hz) impact resonance with a very large and sharp peak occurred in the interaction. Under this extreme condition, the test could not last for more than 20 s without first placing a thin layer of rubber bands on the interface of the instrumented handle installed on the shaker, as shown in the left picture of Figure 4(a). This minimal rubber band interface (thickness: 0.85 mm) was identified via the exploratory tests and was considered as the high stiffness interface (R1) in the primary experiment.
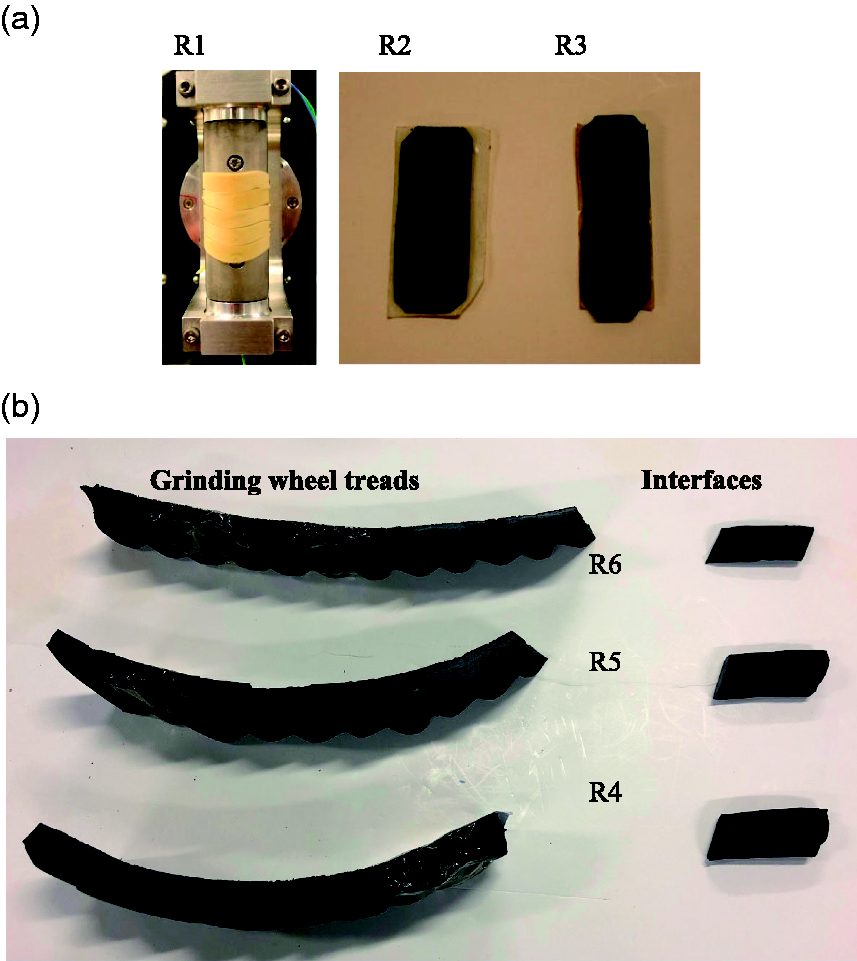
Simulated grinding interfaces: (a) R1, R2, and R3 were cut from laboratory rubber materials and (b) R4, R5, and R6 were cut from factory grinding wheel treads obtained from a workplace. 5
The exploratory tests also found that the use of a low-stiffness interface like those described in Experiment III—Additional human subject experiment section could effectively isolate the vibration transmitted to the workpiece in the high-frequency range (>500 Hz). Although this reflects the nature of the vibration transmission from the grinding machine to the workpiece with the low-stiffness interface, the low vibration on the workpiece in the high-frequency range makes it impossible to reliably measure the response functions of the system in this frequency range. The workpiece vibration usually includes substantial components in the high-frequency range, 5 which results primarily from the excitations at the grinding interface. While it is difficult and unnecessary to exactly simulate the excitations at the interface for the purposes of this study, it is necessary to maintain a certain level of vibration on the workpiece in the high-frequency range so that the measured data can be used to characterize the system responses in the entire frequency range of concern (6.3–1600 Hz). This was achieved by attaching a section of sorbothane elastomer with a thickness of 3.85 mm to the R1 interface; this configuration formed the third interface (R3) used in the primary experiment. With this interface, more than 15% of the machine vibration at each frequency below 1600 Hz can be transmitted to the workpiece. The second interface (R2) was also simulated using a section of sorbothane elastomer (thickness: 1.70 mm), which had a stiffness between those of R1 and R3.
Simulation of hand forces
The hand forces, especially the feed force, applied on the workpiece may play an important role in determining the system vibration responses. Based on the finger contact force measured in our previous study, 5 we estimated that the feed force applied in the grinding of the club head was likely to be generally less than 30 N. Therefore, it is reasonable to use 15 N and 30 N feed force levels to identify the basic trends of the hand force effect on the system responses. Because it is very difficult to measure and control the total grip force on the workpiece with an irregular shape, we only directly measured and controlled the feed force in this experiment. The grip force was essentially indirectly controlled in the experiment through the feed force control because each subject had to tightly hold the workpiece during vibration to keep it at the contact location and to maintain the required feed force.
Human subject test procedures
Before the human subject experiment, each subject was provided with the basic information of the study and experimental protocol. After signing a consent form, he/she was instrumented with the adapters, and a training session (about 10 minutes) was conducted to practice the test procedures and skills. The primary task was to press the workpiece (golf club head) against the instrumented handle at the target force during vibration while ensuring a flat surface contact.
Three trials were sequentially performed for each of the six test treatments (3 interfaces × 2 feed forces), but the test sequence for each treatment was independently randomized among the subjects. For each test trial, whenever the subject reached and maintained the predefined feed force under the vibration condition, the measurement started and lasted for 20 s. The vibration on the workpiece, hand dorsum, wrist, forearm, and upper arm, as well as the apparent mass of the entire workpiece–hand–arm system were simultaneously measured, and they were expressed in the one-third octave bands from 6.3 to 1600 Hz. The apparent mass was used to calculate the mechanical impedance of the system.
Experiment III—Additional human subject experiment
While the basic characteristics and influencing factors of the system responses were identified in the primary experiment, an additional experiment was conducted to test an important hypothesis of this study: the effects of the hand-arm system on the workpiece resonant responses generally increase with the reduction of the fundamental resonant frequency of the workpiece. This is because the apparent mass of the hand–arm system generally increases with the decrease in frequency.10–13 Because the workpiece applied to a high-stiffness interface has a high resonant frequency, and the apparent mass of the hand–arm system at such a frequency is small, the effect of the hand–arm system on the workpiece resonance may not be substantial. According to the hypothesis, the effect with a low-stiffness interface should become larger. To test this hypothesis, three low-stiffness interfaces (R4-R6) were considered in this additional experiment. As shown in Figure 4(b), they were simulated using three rubber pads cut from three grinding wheel treads obtained from a workplace where a previous investigation on workpiece vibration was conducted. 5 The pad for R4 was taken from a new wheel tread and, R5 and R6 were cut from used wheel tread rubbers.
The nonsubject test shown in Figure 3(c) and 3(d) was performed to measure the workpiece responses. Then, the additional human subject experiment was conducted to measure the responses of the entire workpiece–hand–arm system. The measurement method, feed forces, and experimental procedures were the same as those used in the primary experiment, except that the vibration on the forearm and upper arm was not measured. The vibration on the hand dorsum and wrist of both hands was measured.
Transmissibility calculation
Although it is unclear whether the vibration direction could influence the health effects, it is desirable to quantify the directional vibration transmissibility on the hand–arm system. This requires aligning an axis of each triaxial accelerometer attached to the surface on the hand–arm system with the shaker vibration direction. This is very difficult to achieve with the hand and arm postures shown in Figure 2. Therefore, only total vibration (vector sum of the triaxial accelerations) was considered to evaluate the vibration transmissibility in this study. This method is consistent with the total vibration method recommended in the current standard for the measurement and assessment of vibration exposures. 4
First, the total vibration spectrum for the instrumented handle (AHandle) and that for each location (AL) was calculated by taking the vector sum of the measured triaxial acceleration at each of the one-third octave band center frequencies. Then, the total vibration transmissibility relative to the handle (TL_Handle) for each frequency at each location (L) was calculated from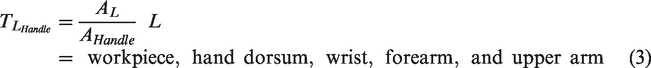
The vibration transmissibility relative to workpiece (TL_Workpiece) was also calculated
Statistical analyses
Whenever applicable, a general linear model for the analysis of variance (ANOVA) was used to determine the significance of the variable factors (interface and feed force) on the dependent variables (transmissibility, apparent mass, or mechanical impedance). Whenever necessary, stratified ANOVAs were also performed to determine the significance of the variable factors on the dependent variables in a specific frequency range. Whenever necessary, each set of the raw data for a response function (FRaw-Frequency) in a frequency range of interest was normalized before it was used in the ANOVAs using the following formula
Results
Results of measurement system evaluation (Experiment I)
The magnitudes of the vibration transmissibility and apparent mass measured in the calibration test shown in Figure 3(a) on each of the three interfaces (R1, R2, and R3) are plotted in Figure 5, together with the modeling results and the apparent mass estimated using equation (2). The model parameters identified from the response function simulation for each test treatment are listed in Table 3, together with the R2-value for assessing the goodness-of-fit for each comparison. These comparisons demonstrate that the 1-dof linear model fits well to the calibration test results for each interface. The directly measured apparent mass values were also consistent with those estimated using the mass of the calibration bar and the measured vibration transmissibility on each interface. This validates the criterion defined in equation (2), confirming that the instrumented handle provides a reliable measurement of the apparent mass.
Left column: comparisons of the measured and modeled transmissibility spectra of the calibration bar on the three high-stiffness interfaces (R1, R2, and R3); right column: comparisons of the measured apparent mass with that estimated from the measured transmissibility spectrum and that simulated using the 1-dof model. (a) Interface R1 (b) Interface R2 (c) Interface R3.
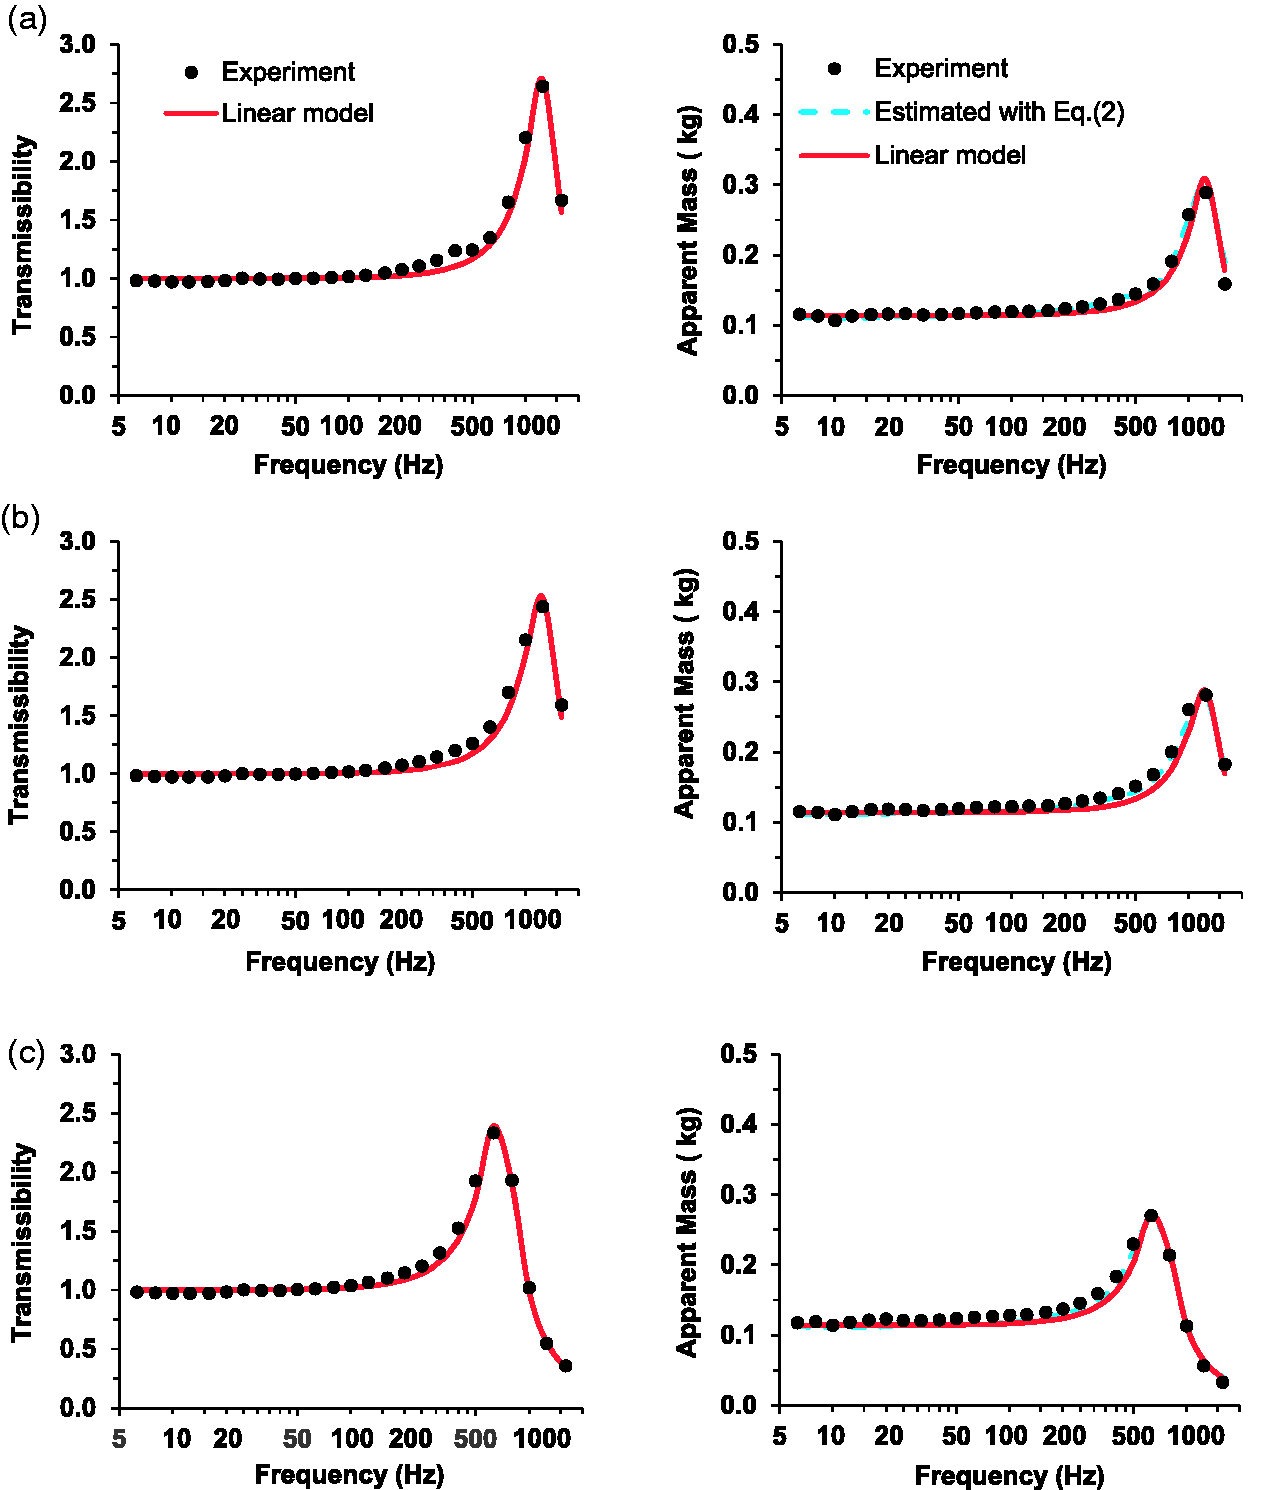
The parameters of the 1-dof model (m-mass; k-stiffness; c-damping; and f—undamped natural frequency) for the calibration bar and club head on each of the six interfaces (R1, R2, R3, R4, R5, R6); and the correlation of the comparisons (R2-value calculated using the data from 10 to 1000 Hz): TModel—modeling transmissibility vs. measured transmissibility; TLaser—laser-measured transmissibility vs. that measured with a triaxial accelerometer installed on the club head; MET—apparent mass estimated from the measured transmissibility using equation (2) vs. measured apparent mass; MModel—modeling apparent mass vs. measured apparent mass.
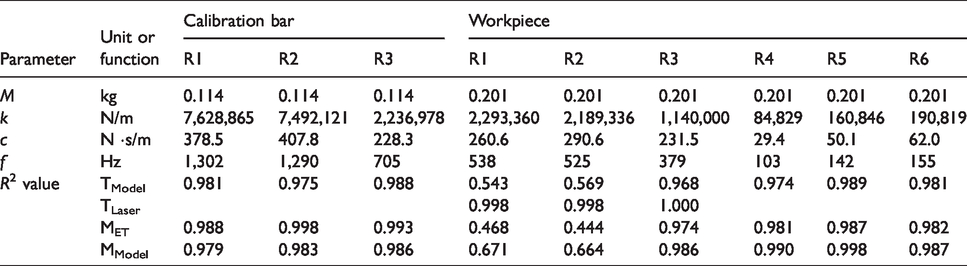
Similarly, Figure 6 shows the comparisons of the modeling results and the experimental data measured in the workpiece test on each of the three interfaces using the method shown in Figure 3(c) and 3(d). The 1-d linear model parameters identified from the measured response functions and the comparison indexes for the interfaces are also listed in Table 3. As shown in Figure 6(a), 6(b), and 6(c), the total vibration transmissibility measured using a triaxial accelerometer installed on the workpiece for each of the high-stiffness interfaces agreed well with that measured using the laser vibrometers. This confirms that the accelerometer method can provide a reliable measurement of the total vibration transmitted to the workpiece. As shown in Figure 6(c), the shape of workpiece vibration transmissibility spectrum on R3 is very similar to that of the apparent mass. As a result, the apparent mass can be estimated from the transmissibility using equation (2). This was also confirmed from their high R2-values (MET) listed in Table 2. The comparisons shown in Figure 6(a) and 6(b), however, indicate that the linear model had a poor fit to the response functions measured with the R1 and R2 interfaces. The apparent mass spectra estimated using equation (2) with the transmissibility spectra measured with these two interfaces were also substantially different from the directly-measured apparent mass in a large frequency range.
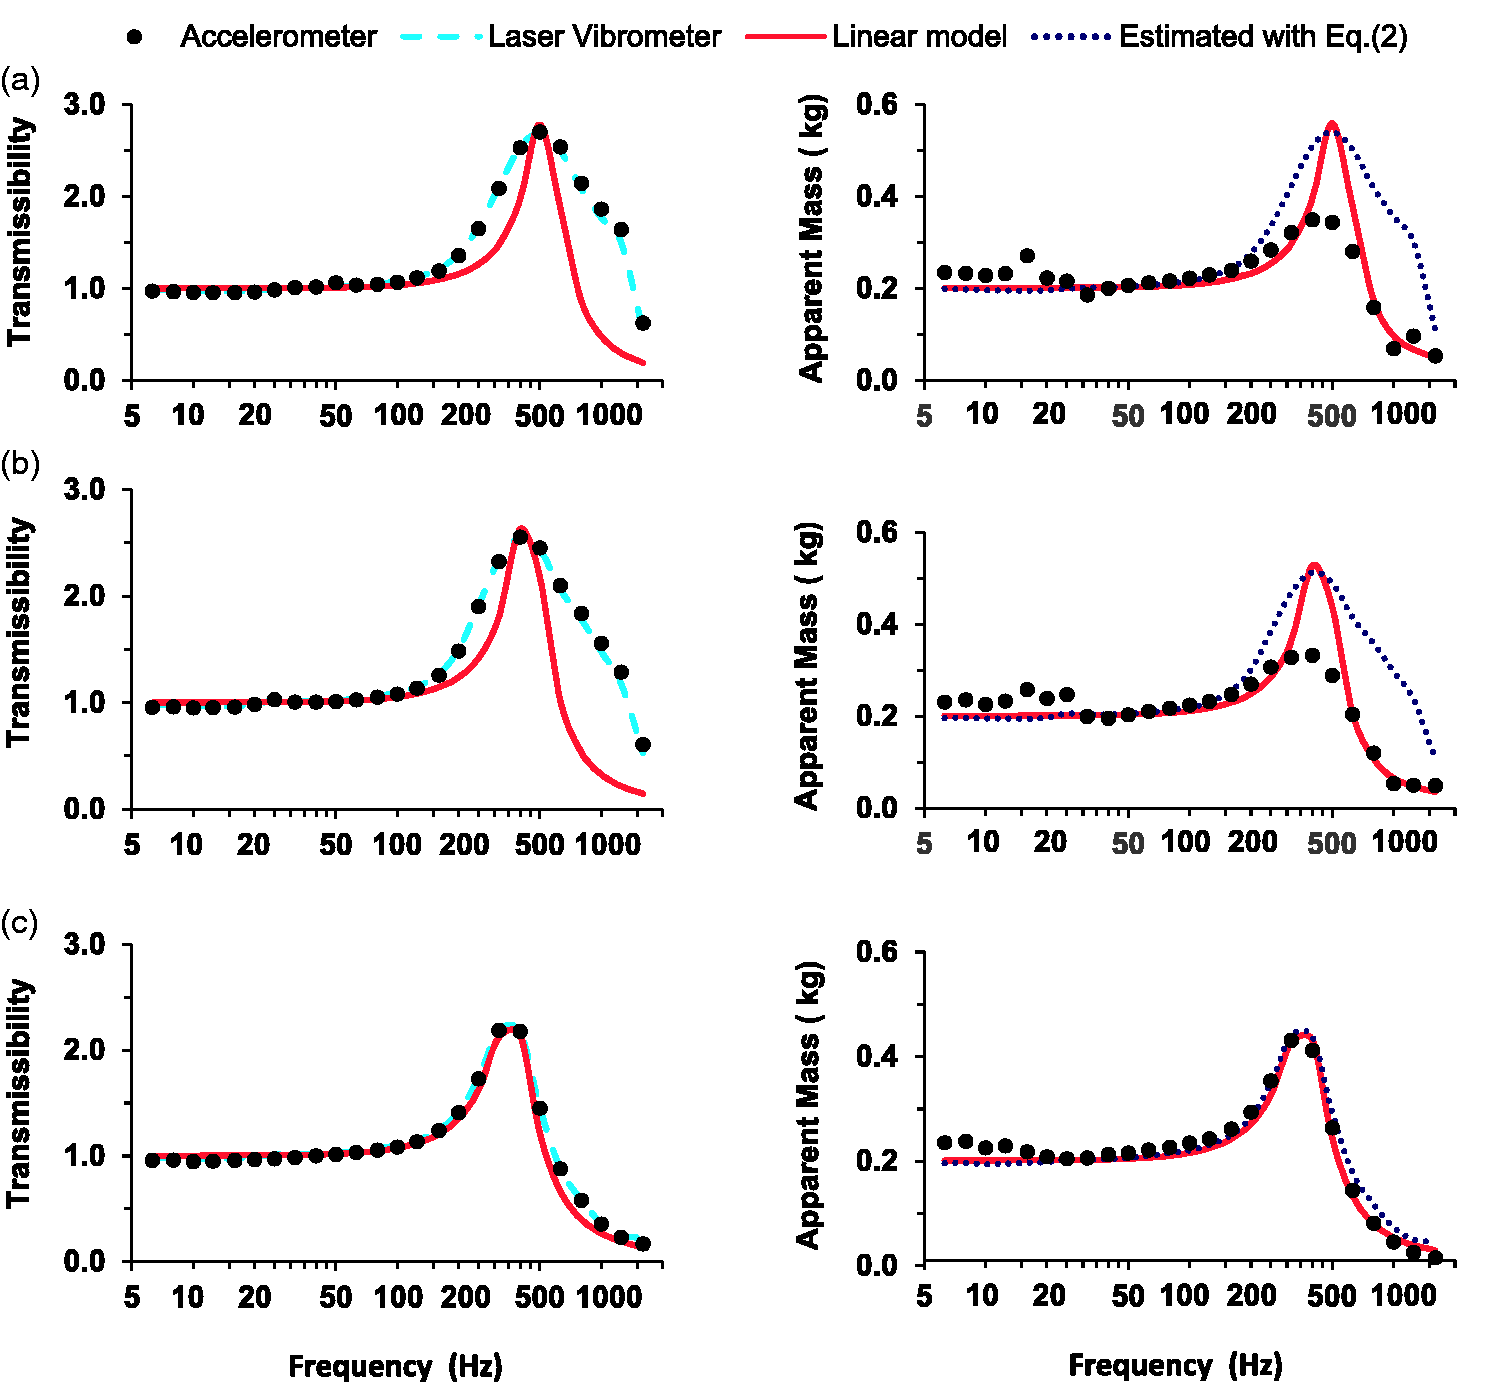
Left column: comparisons of the tri-axial accelerometer-measured, laser-measured, and model-simulated transmissibility spectra of the workpiece on the three high-stiffness interfaces (R1, R2, and R3); right column: comparisons of the measured apparent mass with that estimated from the measured transmissibility spectrum and that simulated using the 1-dof linear model. (a) Interface R1 (b) Interface R2 (c) Interface R3.
Results measured from the primary human subject experiment (Experiment II)
The differences between the mean and median spectra of each response function measured in the primary human subject experiment were generally <5%, with the maximum difference (<15%) at a very low frequency (≤ 8 Hz) or a very high frequency (≥1000 Hz). Figure 7 illustrates the median spectra of apparent mass and mechanical impedance of the workpiece–hand–arm system and the median spectra of the workpiece vibration transmissibility. For direct comparison, the apparent mass measured with the workpiece alone on the R3 interface in Experiment I was also plotted in the right column of Figure 7. At frequencies below 50 Hz, the apparent mass of the entire system was substantially higher than that measured with the workpiece alone (p < 0.001). At higher frequencies, their differences remained statistically significant at most frequencies (p < 0.05), but their absolute differences were small, except in the workpiece resonant frequency range (315–630 Hz). While it is difficult to visually identify the differences between the resonances in the apparent mass spectra illustrated in Figure 7(b), they can be clearly observed in the impedance and transmissibility spectra shown in Figure 7(d) and 7(f). The resonant frequencies identified from the workpiece transmissibility spectra shown in Figure 7(f) were as follows: between 500 and 630 Hz for R1; between 400 and 500 Hz for R2; and between 315 and 400 Hz for R3. These resonant frequencies were the same as those identified from the apparent mass spectrum. These frequency ranges were also similar to those identified from the workpiece-alone tests listed in Table 3. The resonant frequency ranges were generally lower than those identified from the impedance spectra because the impedance is equal to the apparent mass multiplied by the angular frequency. There were two major differences between the resonances of the workpiece with and without being held by the hands: (1) the shapes of the transmissibility spectra in the resonant frequency range measured in the nonsubject tests for R1 and R2 shown in Figure 6(a) and 6(b) were substantially different from those measured in the subject experiment shown in Figure 7(f) and (2) the resonant peak magnitude of the workpiece for each interface was reduced in the subject test: from 2.70 to 2.46 for R1; from 2.50 to 2.00 for R2; and from 2.18 to 1.74 for R3. Each of these differences was statistically significant (p < 0.002).
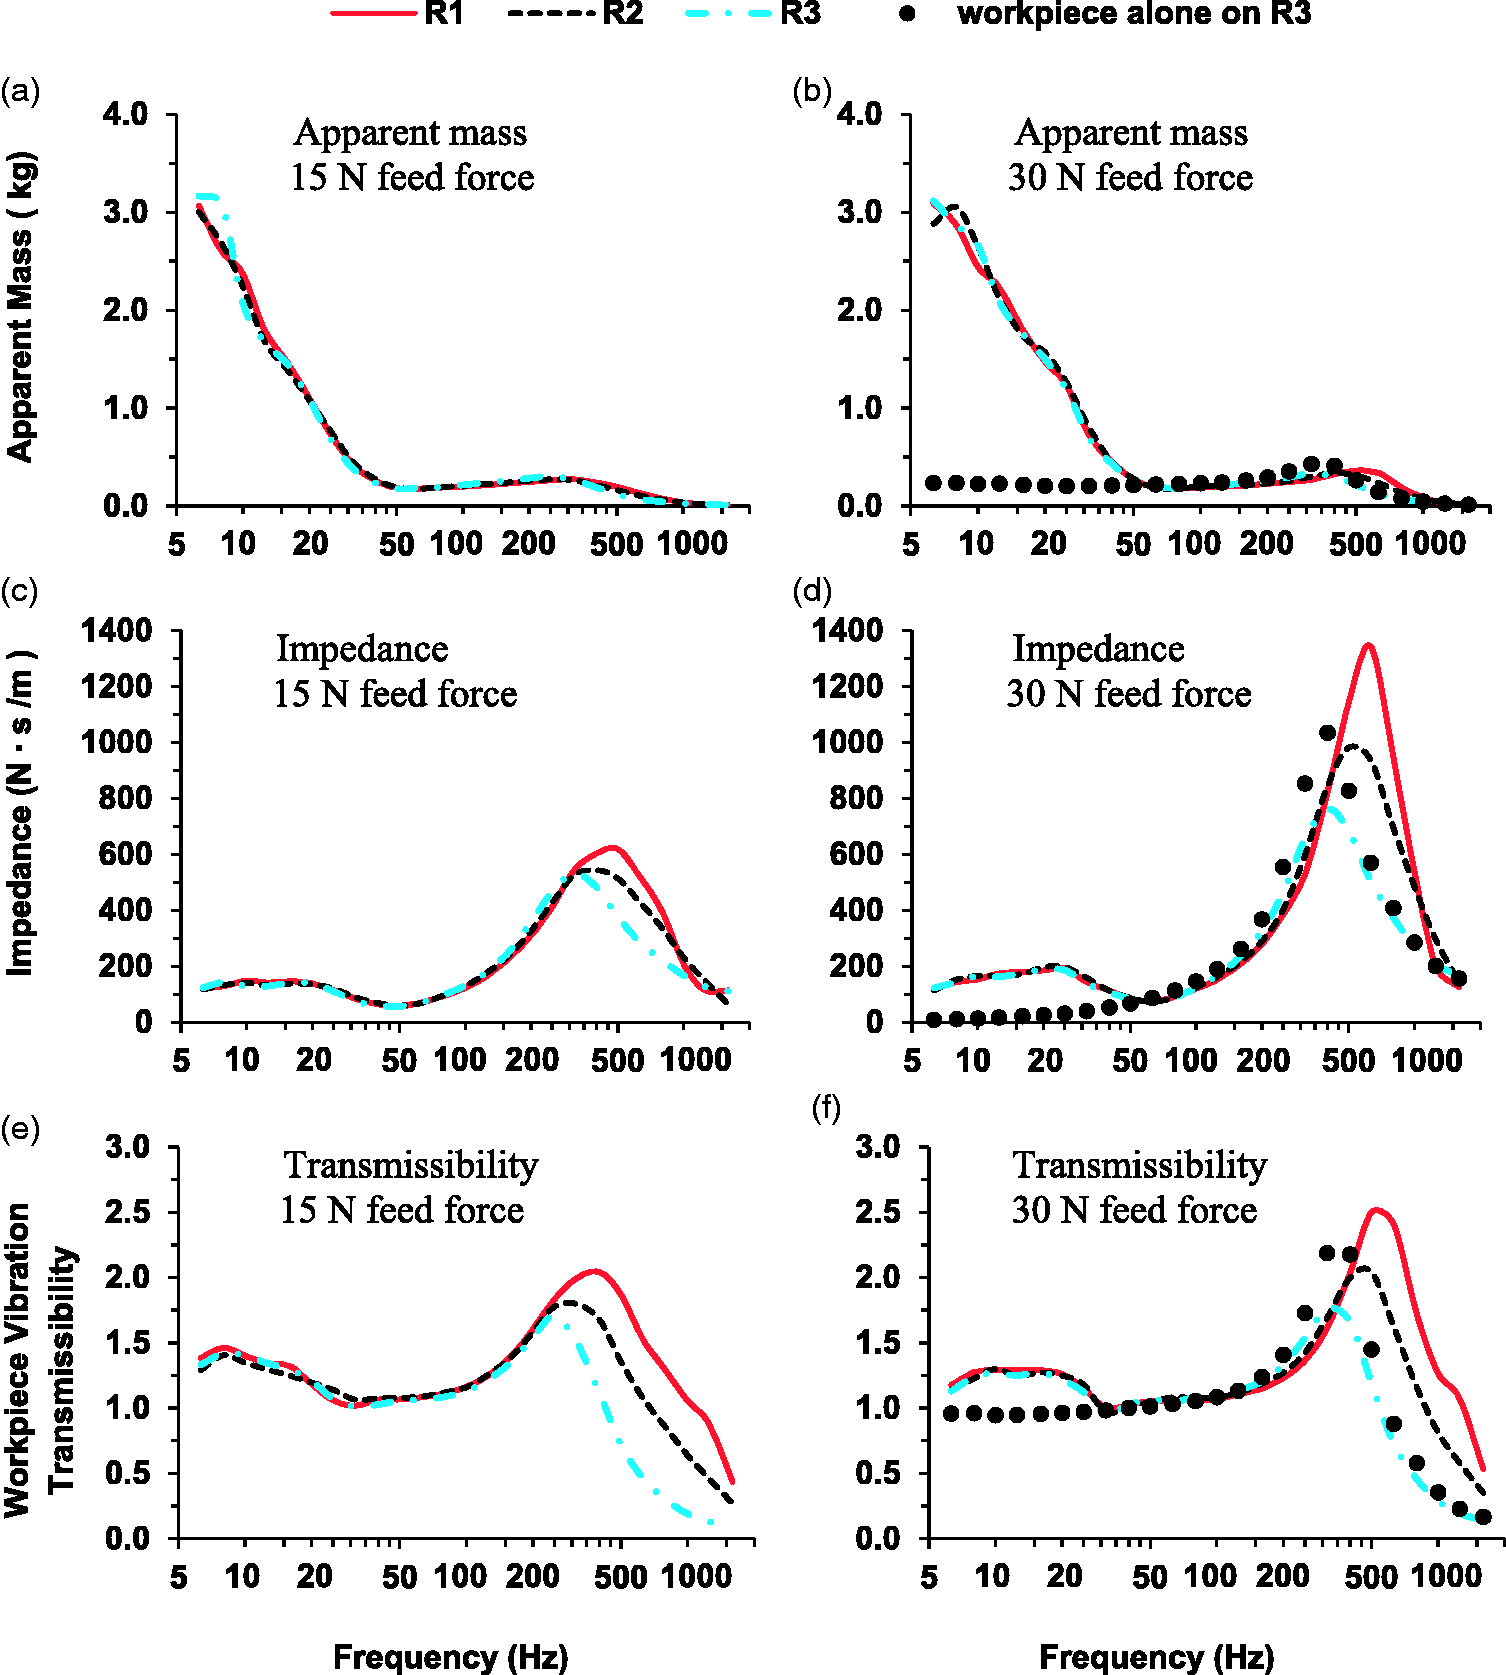
The median driving-point response functions of the workpiece–hand–arm system and the vibration transmissibility of the workpiece (club head), which were measured in the primary experiment under different combinations of feed force (15 N or 30 N) and interface (R1, R2, or R3).
As shown in Figure 7(c) and 7(d), increasing interface stiffness increased both the resonant frequency and peak magnitude of the impedance under each feed force (p < 0.001). This also held true for the workpiece transmissibility (p < 0.001), as shown in Figure 7(e) and 7(f). However, the interface conditions only slightly affected the impedance between 100 and 315 Hz, as shown in Figure 7(c) and 7(d), although the effects were statistically significant at some of the frequencies. Below 100 Hz, the interface effects on the system impedance were not statistically significant (p > 0.10). The vibration transmissibility spectra of the workpiece measured for each of the three interface conditions under the same feed force in the low- and middle-frequency range (6.3–250 Hz) were similar to each other, as shown in Figure 7(e) and 7(f). The differences among the three spectra below 250 Hz under the 15 N feed force and below 125 Hz under the 30 N feed force were not statistically significant (p > 0.12).
Comparisons of the spectra illustrated in Figure 7(c) with those illustrated in Figure 7(d) revealed that increasing the feed force from 15 to 30 N increased the system impedance and apparent mass at frequencies below 63 Hz (except at 6.3 Hz) and also at frequencies above 250 Hz (p < 0.05). In the frequency range of 63–250 Hz, the impedance under the two feed forces for each interface was similar to each other, although their differences were statistically significant at some frequencies (p < 0.05). Increasing the feed force also increased the impedance resonant frequency (p < 0.001). The effects of feed force on the workpiece transmissibility in its resonant frequency range were similar to those on the system impedance. However, the feed force effects on the workpiece vibration transmissibility were generally not statistically significant in the frequency range of 12.5–80 Hz (p > 0.05).
Figure 8 illustrates the median vibration transmissibility spectra of the 10 subjects measured in the primary experiment at the four locations on the hand–arm system relative to the handle. A peak was observed at about 8 Hz in the spectra measured with the 30 N feed force at every location. The second peak occurred around 20 Hz, which can be identified from the spectra measured on the hand dorsum and wrist. Some signs of the workpiece resonance in the frequency range of 315–630 Hz were observed in the vibration transmissibility spectra measured on the hand dorsum, as shown in Figure 8(a) and 8(b). The vibration transmission generally decreased with increased distance from the workpiece and the increase in vibration frequency (p < 0.001). Less than 30% of the vibration was transmitted to hand dorsum for frequencies higher than 160 Hz. Less than 5% of the vibration was transmitted to the wrist, forearm, and upper arm for frequencies higher than 100 Hz, 63 Hz, and 40 Hz, respectively. Increasing feed force generally increased the vibration transmissibility on the hand–arm system (p < 0.001), except at some low frequencies (<12.5 Hz) (p > 0.05). The interface condition did not statistically significantly affect the vibration transmissibility on the hand–arm system (p > 0.64). As a result, the spectra measured under the same feed force for different contact conditions were similar, as shown in Figure 8.
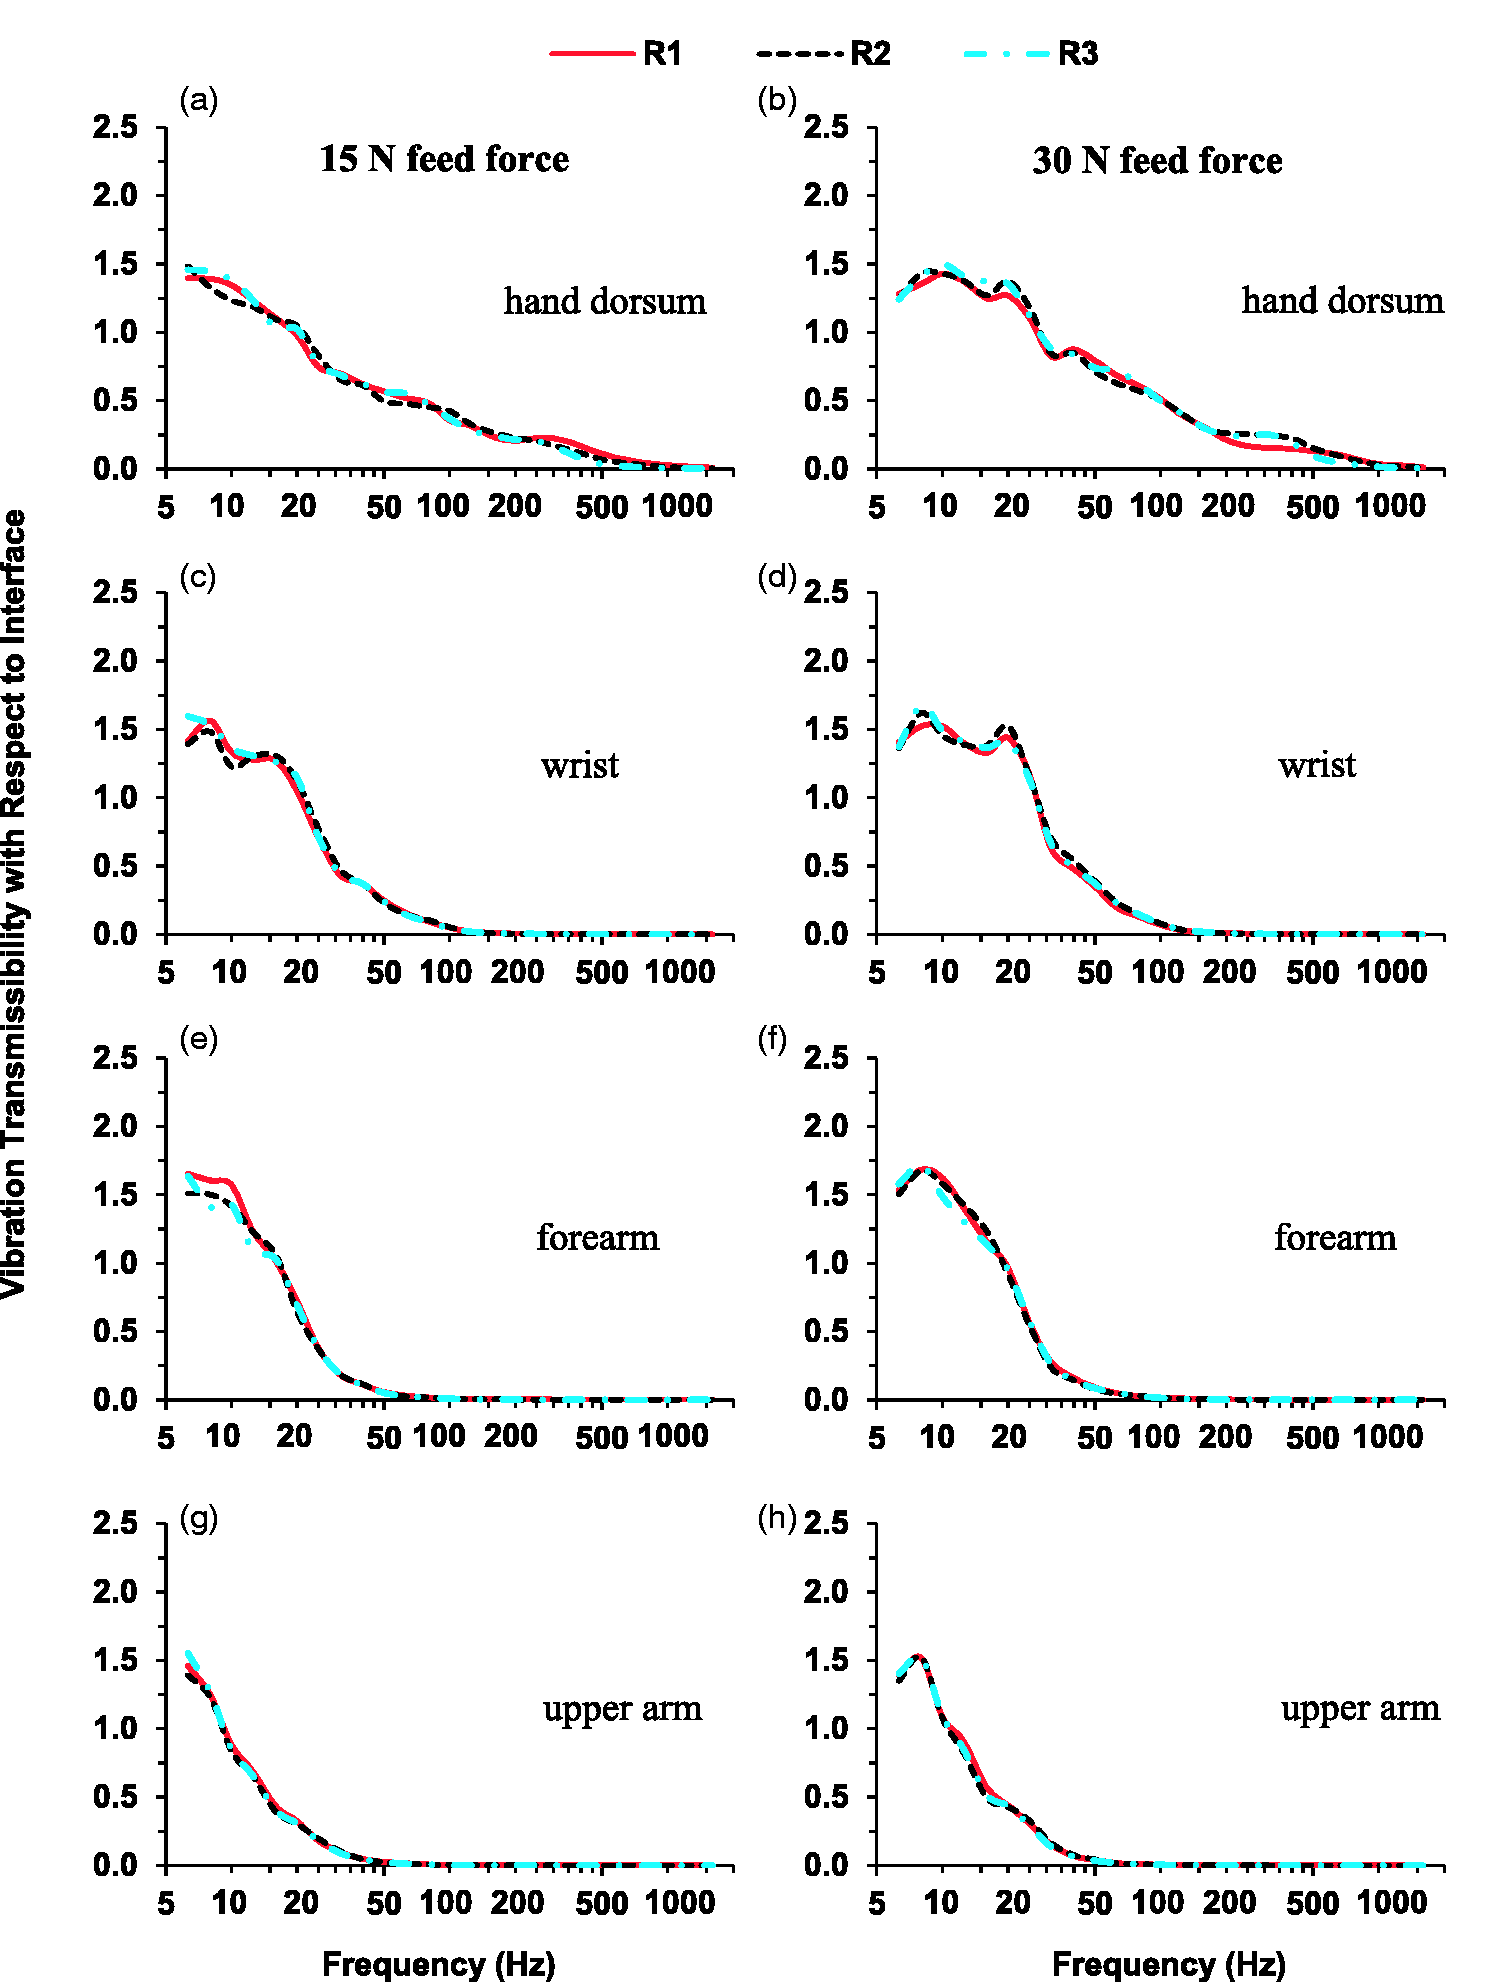
The median vibration transmissibility spectra of the hand-arm system with respect to the instrumented handle, which were measured in the primary experiment at four locations: hand dorsum, wrist, forearm, and upper arm under different combinations of feed force (15 N or 30 N) and interface (R1, R2, or R3).
While the spectra shown in Figure 8 represent the vibration transmissibility from the shaker handle through the workpiece to the hand–arm system, the spectra displayed in Figure 9 represent the direct transmissibility from the workpiece to the hand–arm system, which were calculated using Eq. (4). The basic characteristics of the direct transmissibility spectra were similar to the through-workpiece transmissibility spectra, but at low frequencies, the direct transmissibility on the hand-arm system for all test conditions was close to 1.0. No sign of the workpiece resonance could be observed for these direct transmissibility spectra. Similar to that observed in the results illustrated in Figure 8, increasing the feed force generally increased the direct vibration transmissibility at each measuring location (p < 0.001). The interface conditions have little effect on the direct transmissibility (p > 0.70).
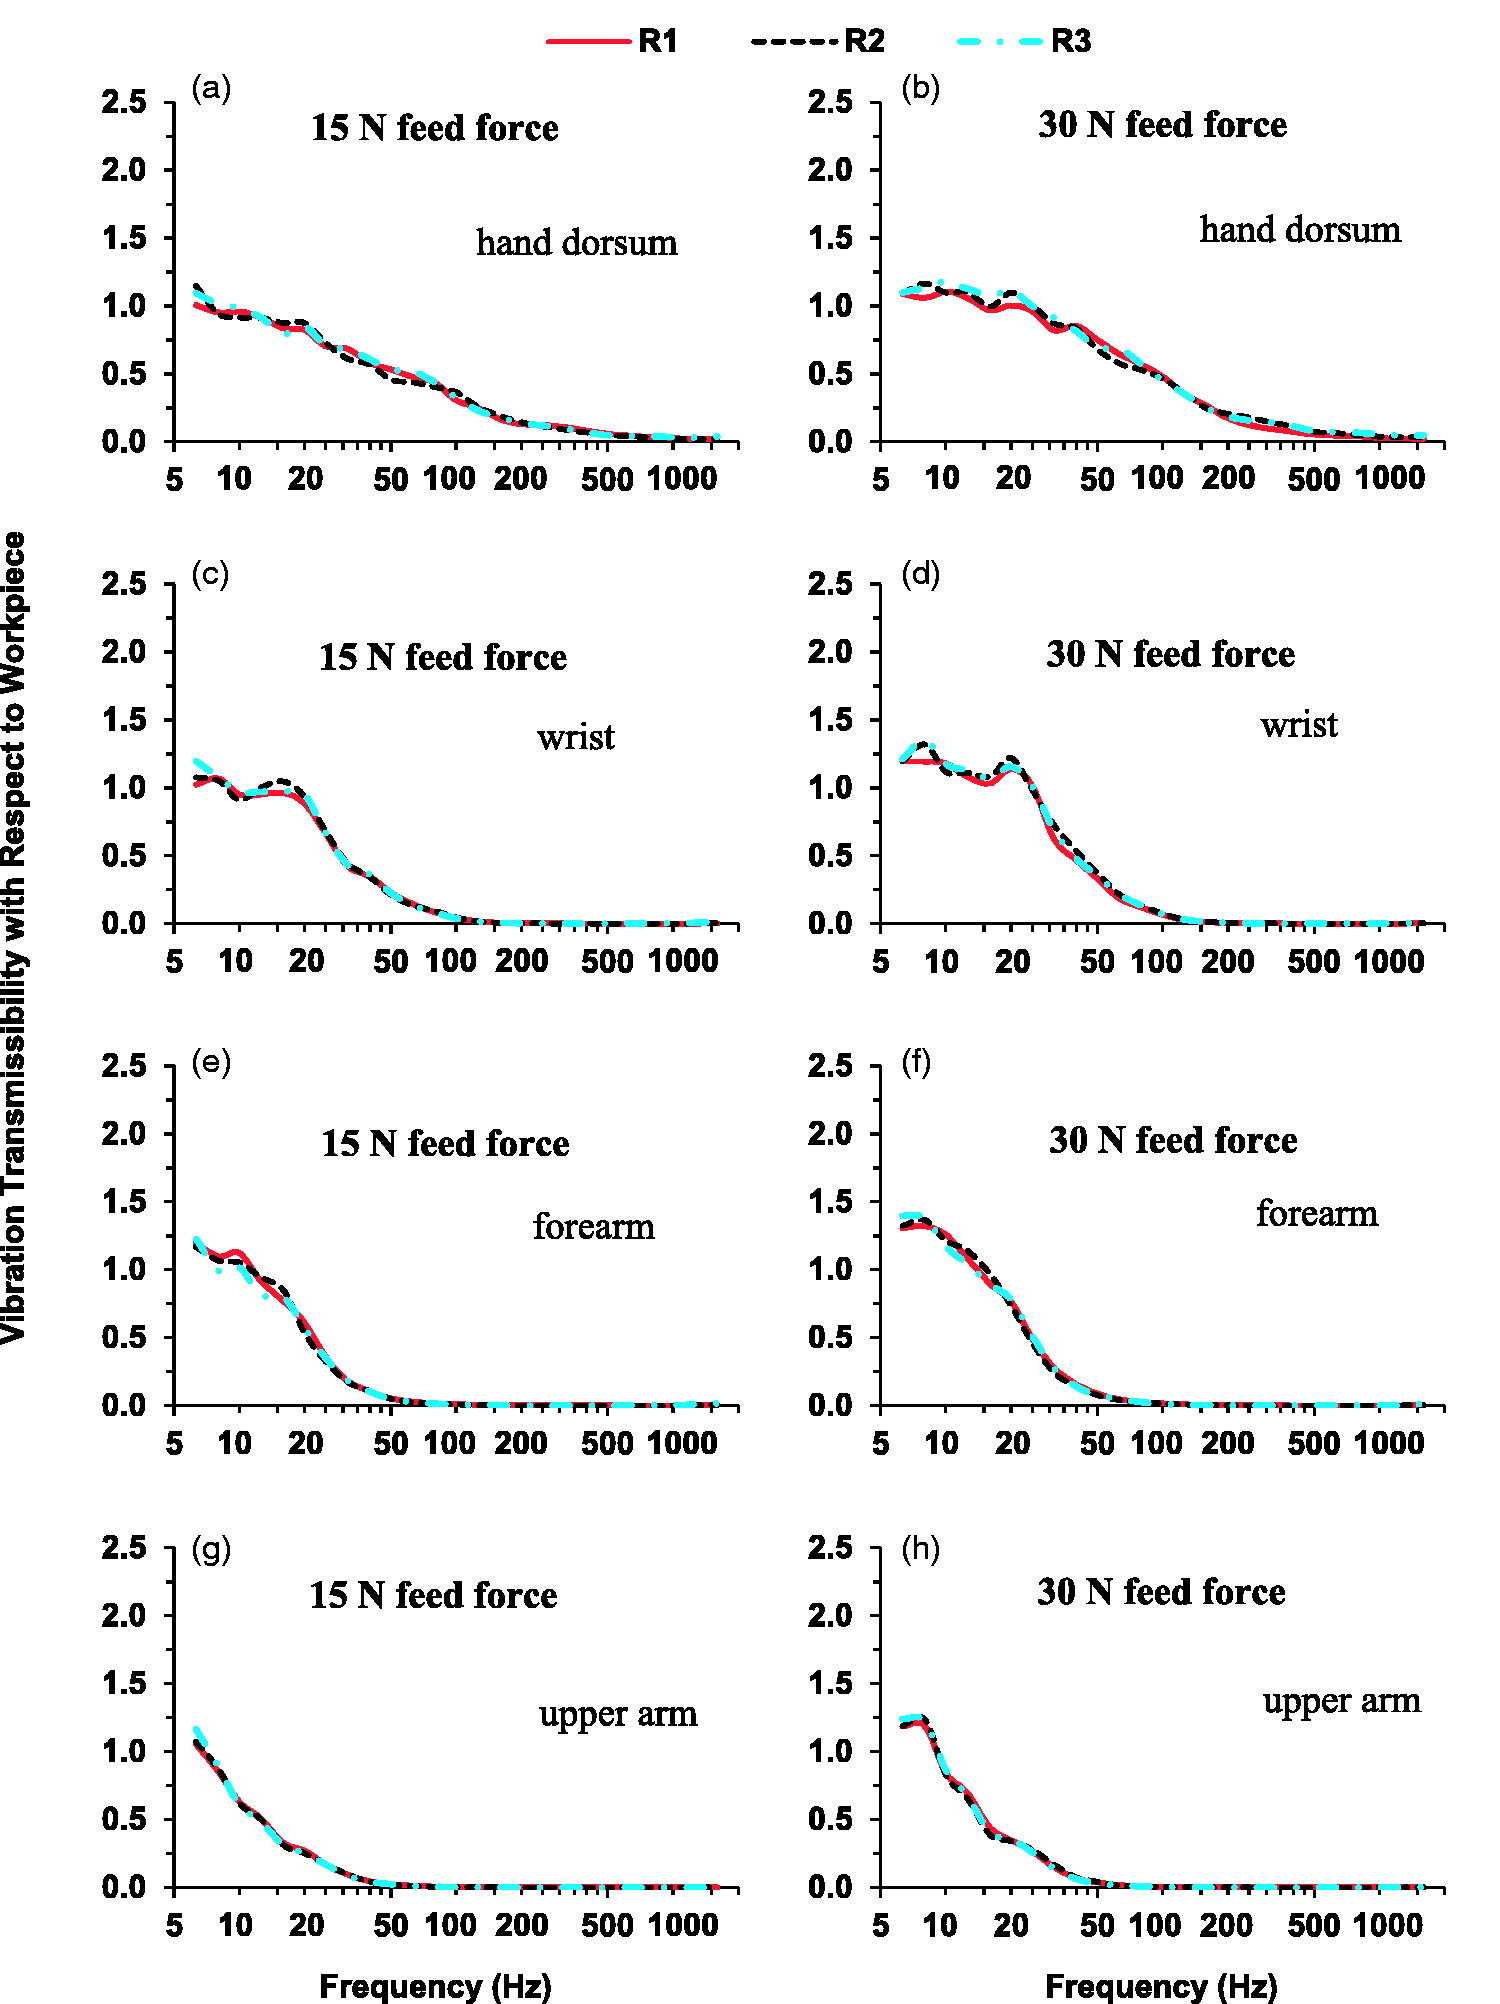
The median vibration transmissibility spectra of the hand-arm system with respect to the workpiece (club head) derived using equation (4) from the spectra illustrated in Figure 8.
Results measured from the additional human subject experiment (Experiment III)
Figure 10(a) illustrates the apparent mass and vibration transmissibility spectra of the workpiece measured in the non-subject test with the three low-stiffness interfaces (R4, R5, and R6) using the method shown in Figure 3(c) and 3(d). To make these figures less crowded, the data for R5 were not plotted. However, the R5 data exhibited features similar to those for R4 and R6, except that the R5 resonance was between the R4 and R6 resonances. As also shown in the figures, the 1-dof linear model (L.Model) fitted well with the experimental data for each interface. The effective contact stiffness, damping value, and undamped natural frequency for each interface identified from the modeling analysis are listed in Table 3. As expected, the natural frequencies for the low-stiffness interfaces were much lower than those for the high-stiffness interfaces.
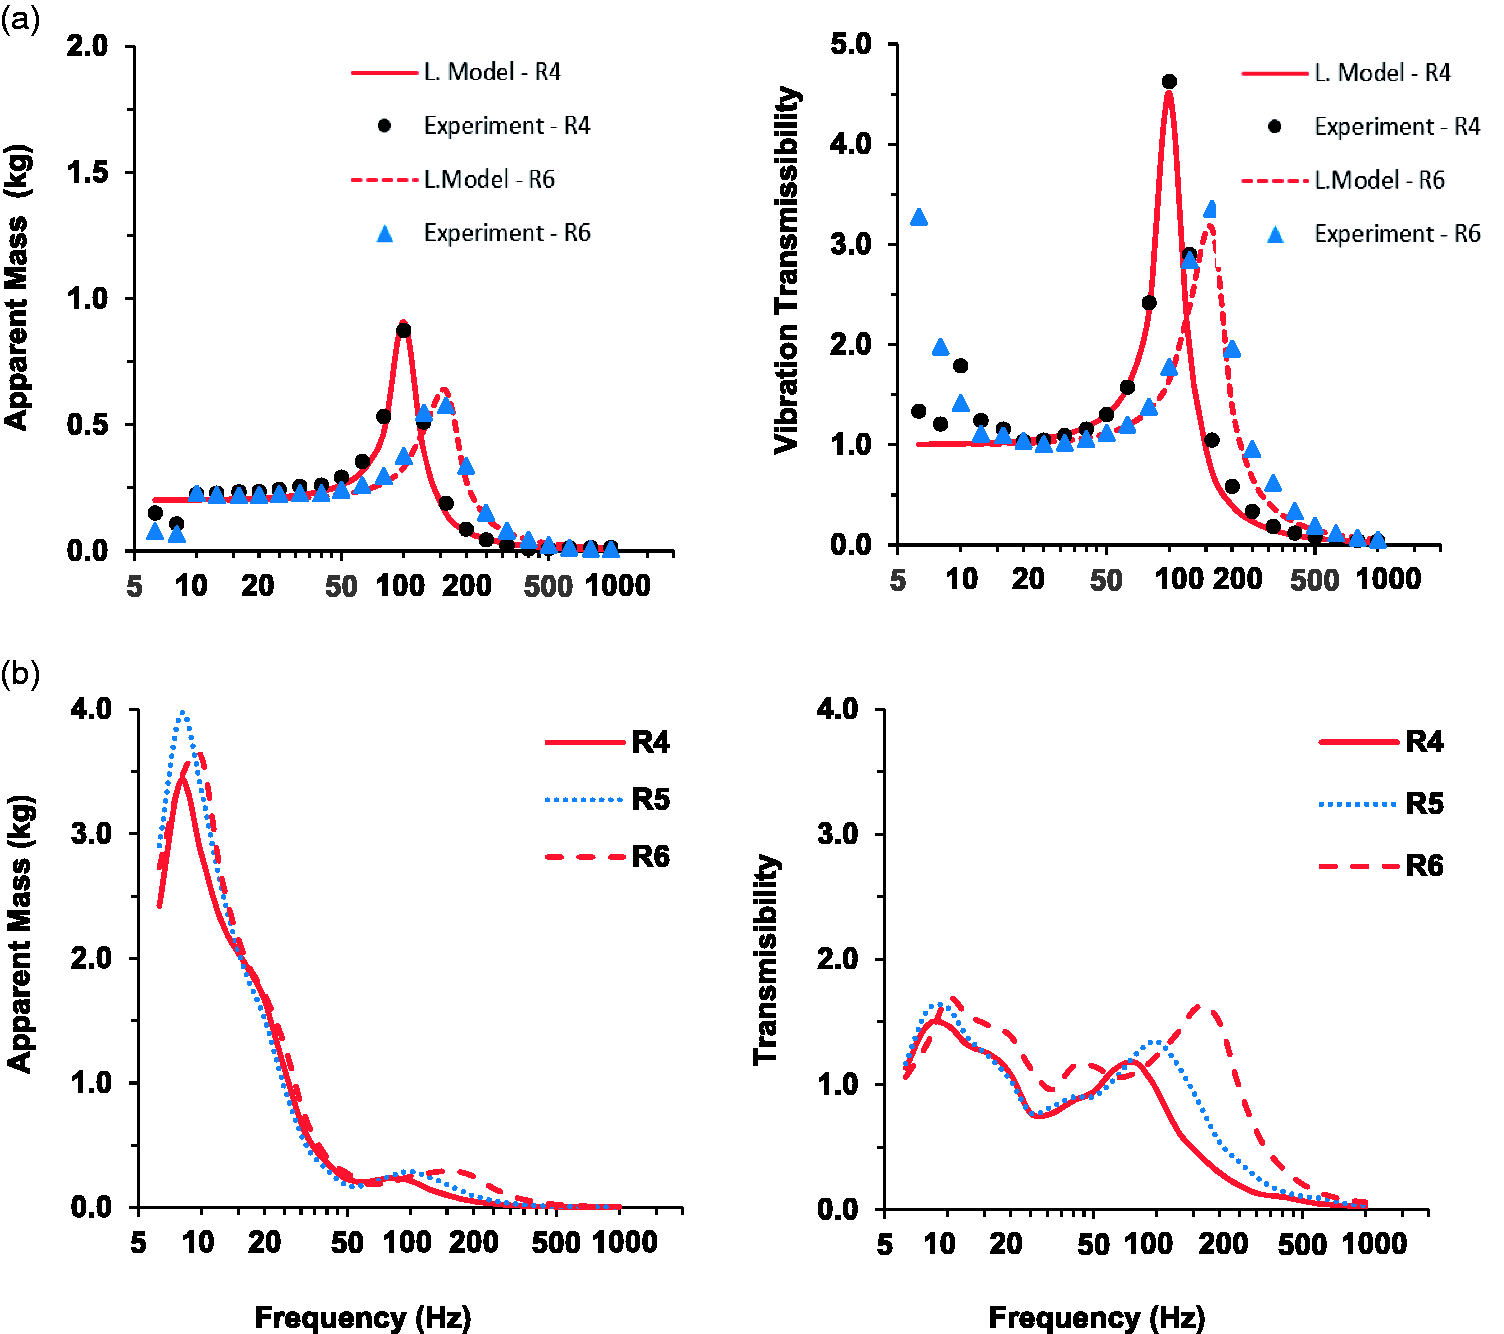
The apparent mass and vibration transmissibility measured on three low-stiffness interfaces (R4, R5, and R6) under a 30 N feed force: (a) the response functions measured in the workpiece tests without human subjects using the method shown in Figure 3(c,d); and (b) the mean response functions measured in the additional human subject experiment.
Figure 10(b) illustrates the mean apparent mass and vibration transmissibility spectra measured with the two subjects in the additional human subject experiment. Similar to those observed with the high-stiffness interfaces, the undamped natural frequencies of the workpiece for the low-stiffness interfaces (103 Hz for R4; 142 Hz for R5; and 155 Hz for R6) were similar to their corresponding resonant frequencies identified from the workpiece responses measured in the non-subject test (100 Hz for R4; between 125 and 160 Hz for R5; and 160 Hz for R6). The resonant frequencies observed in the human subject experiment were lower or close to those identified from the nonsubject tests. As shown in Figure 10(a) and 10(b), the effect of the hand–arm system on the resonant peaks of the workpiece transmissibility was profound: from 4.63 to 1.17 for R4, from 3.41 to 1.34 for R5, and from 3.36 to 1.63 for R6; the differences were more than 10 times the standard deviations of the transmissibility in the resonant frequency range. The results of their statistical analyses also confirmed that the differences were significant (p < 0.001).
Figure 11 illustrates the mean vibration transmissibility spectra on the hand–arm system measured in Experiment III. Because each subject was advised to maintain the same postures and hand forces for both hands, the basic trends and features of the responses measured on the two hands were similar. Their basic features were also like those measured with the three high-stiffness interfaces shown in Figure 8. However, because the workpiece resonances for the low-stiffness interfaces were between 80 and 160 Hz, higher values were observed in this frequency range in the spectra measured on the hand dorsum, as shown in Figure 11(a), 11(b), 11(c), and 11(d).
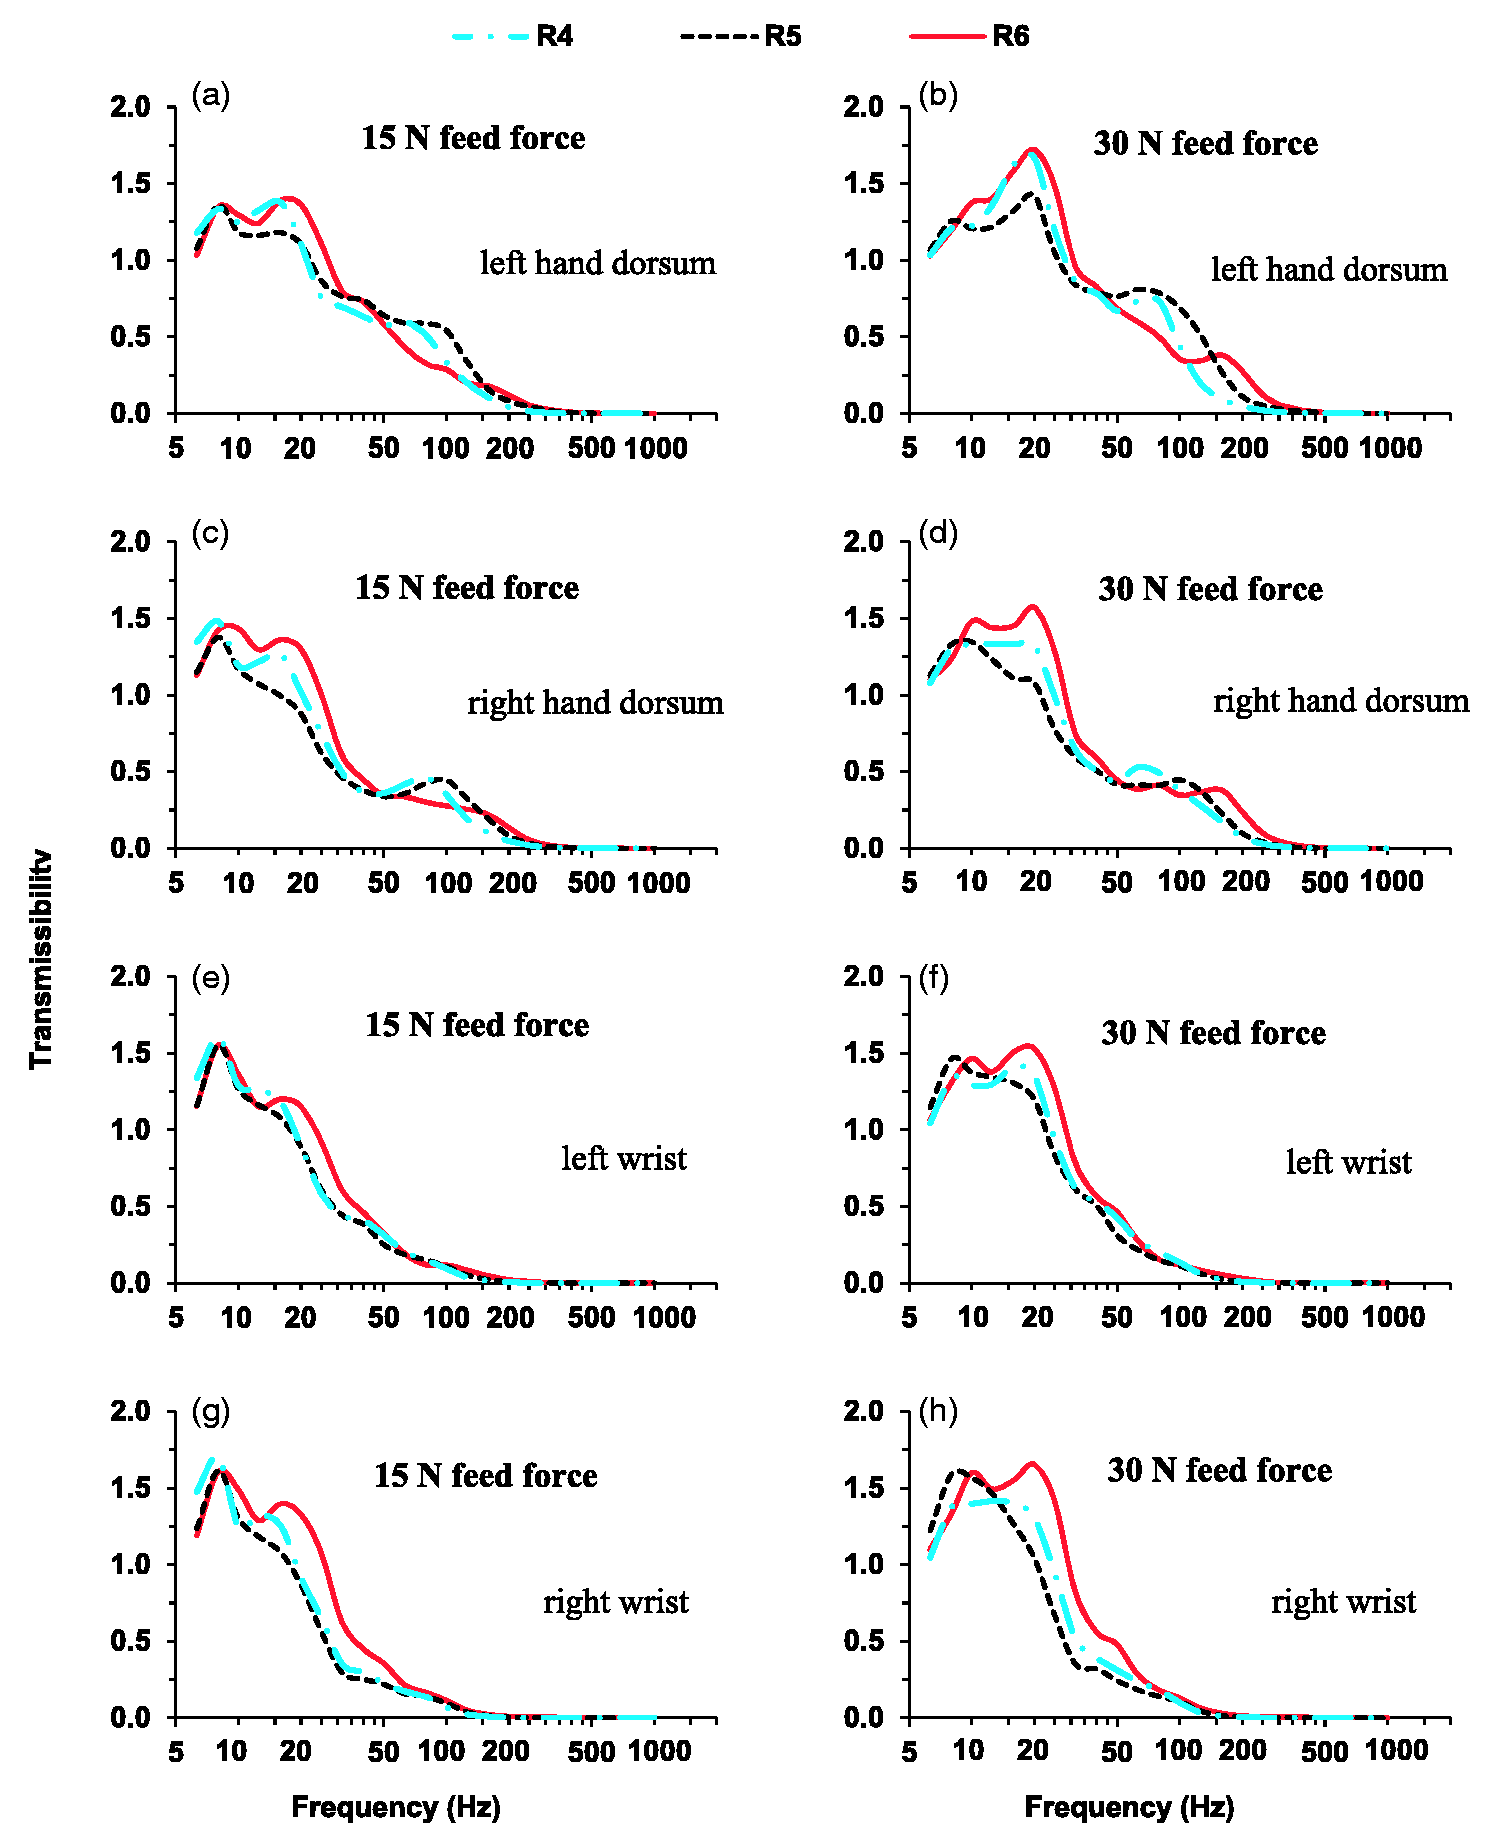
The mean vibration transmissibility spectra measured in the additional subject experiment at two locations (hand dorsum and wrist) on both left and right hands: Left column—Data measured with a 15 N feed force under different combinations of contact stiffness (R4, R5, and R6); right column—Data measured with a 30 N feed force.
Discussion
The measured frequency response functions provide useful information for characterizing and understanding the vibration responses of the workpiece–hand–arm system. The results can help develop and evaluate methods for controlling hand-transmitted vibration exposures during the grinding of handheld workpieces. These findings are elaborated and discussed in this section.
Understanding of the response characteristics and their general implications
Similar to that reported from many previous studies,14–20 the vibration transmissibility on the hand–arm system generally decreased with the increase in the distance from the vibration source, as shown in Figure 9. This is due to the damping or energy dissipation effect on the vibration along its pathway from the source to the sequentially connected substructures of the system. Even though the hand and arm postures and hand forces used in the current study were largely different from those used in the reported studies, the first major resonant frequency (8 Hz) on the hand–arm system was the same as those reported before,19,20 regardless of the interface conditions, as also shown in Figures 9 and 11. These observations support the following hypothesis: 20 this low-frequency resonance is associated primarily with the natural frequency of the upper arm, shoulder, and other upper body substructures. The second resonant frequency observed in the current study was in the range of 16–25 Hz with a mean or median of 20 Hz, which is in the lower part of the reported range (16–40 Hz) for this resonant frequency.19,20 This is because such a resonant frequency is primarily associated with the effective mass of hand and forearm substructures and the hand contact stiffness that depends on the hand coupling forces (push or feed force + grip force); 25 the hand coupling forces used in the current study were at the low end of those used in the reported studies.10–20
This study found that the workpiece resonance could increase the vibration transmissibility measured on the hand dorsum, as shown in Figures 8(a), 8(b) and 11(a), 11(b), 11(c), 11(d). This is because the resonance increased the workpiece vibration, and more vibration was transmitted to the hands. This suggests that reducing the workpiece resonance magnitude can certainly reduce hand vibration exposures. Conversely, the results of this study also demonstrate that the hand–arm system can suppress the resonance magnitude of the workpiece, and this suppression effect generally increases with the reduction of the workpiece resonant frequency, as shown in Figures 6, 7, and 10. This is because the hand–arm system provides the workpiece with constraints and additional mass and damping.
The results of this study indicate that the grinding interface stiffness plays a critical role not only in determining the most important resonant frequency of the system but also in determining whether the interface exhibits large nonlinear behavior. Specifically, increasing the interface stiffness increases the resonant frequency, as shown in Figure 6 and Table 3. When the stiffness reaches a certain value, the predicted transmissibility and apparent mass using the linear model could not reasonably match with the measured data, as shown in Figure 6(a) and 6(b) for R1 and R2 interfaces. This indicates that these interfaces behaved nonlinearly. In such cases, the measured apparent mass was substantially less than that estimated from the measured workpiece transmissibility using equation (2) in the resonant and high-frequency ranges, as shown in the right column of Figure 6(a) and 6(b). This suggests that a linear model may not provide an accurate simulation of the vibration response of a handheld workpiece in its grinding on a hard interface such as a stone grinder. However, the results also suggest that the linear approximation becomes acceptable when the interface stiffness is reduced to a certain value. The results shown in Figures 6(d) and 10(a) and listed in Table 3 suggest that the linear model is acceptable when the interface effective stiffness is close to or less than that of R3 (1140 kN/m) for the workpiece used in this study.
The results shown in Figures 7(b) and 10(b) suggest that the apparent mass of the entire workpiece–hand–arm system is the combined response of the workpiece and the two hand–arm systems. Because the vibration transmission in the hand–arm system generally decreases with an increase in frequency, as shown in Figure 8, the contribution of the hand–arm system in the overall system response is also generally reduced with increasing frequency. In the low-frequency range (≤25 Hz), the total apparent mass was more than 550 g, as shown in Figure 7(a) and 7(b), where the hand–arm system generally contributed more than 300 g (=550 g − 201 g) to the system response. The hand–arm system played a dominant role in determining the system response in the low-frequency range, because of its larger contribution to the participating mass. This explains why the basic trends of the driving-point response functions of the system in the low-frequency range were similar to those of the hand–arm system.10–12,25 However, it is also interesting to note that the magnitude of the first impedance peak at about 20 Hz shown in Figure 7(c) and 7(d) was below that (31.5 Hz) measured with a single hand-arm system along the forearm direction.10–12,25 This can be explained from the following observations: (i) only the two sets of fingers were effectively involved in holding the workpiece, which substantially reduced the involvement of the remaining hand and arm substructures in the response; (ii) the total coupling forces (grip force + 30 N push force) used in this study were generally less than those (about 30 N grip + 50 N push) used in the reported studies; and (iii) the vibration exposure with the hand–arm postures shown in Figure 2 was not primarily along the forearm direction, and the impedance in the other direction was generally less than that along the forearm direction.12,13 At frequencies above 50 Hz, the apparent mass spectra measured without hand coupling were higher than or comparable with those measured with hand coupling, as shown in Figure 7(b). This suggests that the workpiece played a dominant role in determining the system response at frequencies above 50 Hz for the 201 g club head. It is anticipated that this frequency threshold may change with the variation of the workpiece mass.
Increasing the feed force increases not only the interface contact stiffness but also the hand coupling with the workpiece and the stiffness of the hand–arm system. These factors led to the increase in the vibration transmission to the hand–arm system, as shown in Figure 8. Interestingly, the change of the contact stiffness at the grinding interface did not statistically significantly affect the vibration transmissibility of the hand–arm system with respect to the workpiece under the same feed force, as shown in Figure 9. This is because such a change only significantly affects the vibration transmissibility on the workpiece, but it does not change the dynamic properties of the workpiece–hand coupling or the biodynamic properties of the hand–arm system; the biodynamic response functions of the hand–arm system are not sensitive to variations in the excitation type or magnitude within a certain range, as was observed in a few reported studies.10,16 This supports the use of the transfer function method for estimating the vibration on the hand–arm system using the vibration transmissibility spectra measured in the laboratory and the vibration spectra of workpieces measured at workplaces.
Reduction of the handheld workpiece vibration by designing optimized grinding interface stiffness
Besides reducing the vibration of the grinding machine as much as possible, the vibration of the handheld workpiece can be reduced by appropriately designing the grinding wheel interface. As above-explained and observed in this study, a stiff interface is likely to cause nonlinear impacts on the interface during the grinding process, which may result in an unstable grinding process. To stabilize the grinding on such an interface, one may have to increase the hand forces, especially the feed force, which may not only substantially increase the burden of the hands and fingers, but the increased feed force may also lead to overgrinding or damage to the workpiece. This suggests that fine grinding should not be conducted on a stiff interface such as that on a stone grinder.
According to the effect of interface stiffness on the workpiece response shown in Figure 6, all the major machine vibrations can be effectively isolated by sufficiently reducing the interface stiffness. This may be one of the reasons that some belt grinding machines are designed to perform the grinding on the belt between the drive and passive wheels. Such an approach, however, may not be applicable to many cases. For example, the major machine vibrations are at or above 20 Hz; 5 to effectively isolate the vibrations at frequencies above 20 Hz, the interface stiffness should be very low (<8 kN/m), because the apparent mass of the workpiece with the hand–arm system at 20 Hz is only about 1 kg, as shown in Figures 7(a), 7(b) and 10(a), 10(b); it may be difficult to conduct effective grinding on such a soft interface. Besides the grinding efficiency, it may also be difficult to meet the requirement of the grinding curvature on the grinding belt with a large flexibility.
If the grinding must be performed at the drive wheel, the drive wheel interface should be designed to avoid the resonance of the workpiece on the grinding interface. The design should consider the following factors: the peak frequencies of the machine vibration and grinding vibration, grinding interface stiffness, workpiece mass, drive wheel speed, and applied feed force. The geometric irregularities due to the inclined rubber ridges on the drive wheel are likely to be major contributors to the grinding vibration. 26 The fundamental frequency of this vibration is equal to the number of rubber treads multiplied by the drive wheel speed, which is usually in the high-frequency range (>250 Hz). The tread stiffness can be designed such that the contact resonant frequency is significantly less than the frequencies of the major high-frequency excitations. However, there is another important constraint in the design of the interface stiffness: the major finger resonant frequencies are usually in the range of 80–250 Hz, depending primarily on the vibration directions and finger contact forces.27,28 The resonant frequencies of the workpiece for the three low-stiffness interfaces (80–160 Hz) identified in this study fall in this frequency range. This could be one of the biodynamic factors influencing the development of vibration-induced whiter finger among the grinding workers. 3 Further studies are required to identify the specific resonant frequencies of the fingers and the in situ resonant frequencies of workpieces at workplaces to help avoid the overlap of these two types of resonances.
Reduction of the workpiece vibration by increasing its mass, damping, and constraints
According to the 1-dof linear model, increasing the mass and damping of the workpiece can reduce the resonant frequency and peak magnitude. This may be achieved by attaching high damping material to the workpiece. However, increasing the effective mass of the workpiece may increase the burden to the workers and reduce productivity. There may be optimal mass and damping values. The optimization may be conducted together with the design of the drive wheel and its speed.
Alternatively, the workpiece can be connected to a mechanical arm or a suspension system, similar to one designed to hold a powered tool. 29 The addition of such constraints to the workpiece is equivalent to increasing its effective mass and damping. Support seats or tables are usually provided on many grinding machines. Whenever feasible, a handheld workpiece should be seated on an appropriately designed seat or shelf during the grinding process, which can not only increase the stability of the workpiece but also reduce its vibration, 6 because the seat increases the effective mass of the workpiece and its constraints.
Limitations of the study and potential topics for further research
Many factors may affect the vibration responses of the workpiece–hand–arm system. This study confirmed the effects of the most important variables or factors: grinding interface stiffness, feed force, workpiece mass, and apparent mass of the hand–arm system. However, many other factors were not considered in this study, which include but are not limited to the following: tangential forces acting on a grinding interface, vibration direction and magnitudes, hand and arm postures, grip or pinch force, workpiece geometries and material properties, and vibration magnitudes. These limitations, however, should not affect the validity of the measurement method established in this study or the basic characteristics of the system vibration responses identified in this study.
Besides further investigating the effects of influencing factors that were not examined in this initial study, further studies may include the measurement of vibration responses of the fingers. While some of the data presented in this paper have been used to develop a linear model of the machine–workpiece–hand–arm system for identifying and/or developing effective engineering strategies or general methods for controlling workers’ vibration exposures, 21 these findings may also be used to develop nonlinear models of the system to perform optimizations of specific devices or technologies for controlling vibration exposures. Also importantly, the experiment methods established in this study can be used to test and evaluate these technologies.
As shown in Figures 7(f) and 10(b), the resonant frequencies of the workpiece identified from the human subject experiments with the simulated interfaces were close to those estimated using the data measured in the nonsubject tests. This suggests that the major resonant frequency of a handheld workpiece on a grinding interface can be crudely estimated without involving human subjects. Further research is required to identify or develop a convenient and reliable nonsubject experimental method to estimate the in situ resonant frequency of a workpiece at workplaces.
The results of previous study suggest that the grinding machine vibration is primarily associated with the unbalanced rotating components of the machine. 5 As a result, the major machine vibration components are correlated with the operation speed of the machine, which is usually at or above 1200 r/min or 20 Hz. 5 Therefore, besides controlling the unbalance of the rotating parts, the vibration exposure can be partially controlled by choosing appropriate operation speeds. Because the hand–arm system exhibits a major resonance in the range of 16–25 Hz, as shown in Figures 8 and 11, it may be useful to avoid the machine operation speeds near 20 Hz. Increasing the machine operation speed may also increase grinding efficiency. However, increasing the operation speed generally increases the unbalanced inertial force and machine vibration. There may be an optimized operation speed at which the vibrations on the hand-arm system can be minimized. This also requires further research.
Conclusions
This study established a method and applied it to measure and characterize the vibration responses of the workpiece–hand–arm system. While the general characteristics of the vibration responses distributed on the hand–arm system were similar to those reported before, the responses of the workpiece–hand–arm system exhibit some special features. The most important characteristic is that the workpiece resonance is clearly evident in the system responses. The resonant frequency depends primarily on the workpiece mass and the grinding interface stiffness. The hand–arm system also plays an important role in determining the magnitude of the workpiece resonance; the effect generally increases with the reduction in the resonant frequency, because the apparent mass of the hand–arm system increases with the reduction in frequency. On the other hand, the workpiece resonance also increases the vibrations transmitted to the hand–arm system. Increasing feed force significantly increases the resonance frequency and magnitude; higher forces increase not only the interface stiffness but also the coupling stiffness between hands and workpiece. For these reasons, increasing the feed force increases the vibration transmissibility of the hand–arm system. However, the grinding interface conditions do not significantly affect the vibration transmissibility of the hand–arm system with respect to the workpiece. This suggests that the vibration transmissibility of the hand–arm system is not sensitive to the limited variations in the workpiece vibration considered in the current study. This study also found that the workpiece responses can be approximately modeled using a linear model when the interface stiffness is below a certain value, which may be useful for further modeling studies. While the experimental data and information generated in this study can be used to help identify or develop effective intervention methods and technologies for controlling vibration exposures among grinding workers, the experimental method established in this study may be used to test and evaluate those methods and technologies.
Disclaimers
The findings and conclusions in this manuscript are those of the authors and do not necessarily represent the views of the National Institute for Occupational Safety and Health, Centers for Disease Control and Prevention.
Footnotes
Declaration of conflicting interests
The author(s) declared no potential conflicts of interest with respect to the research, authorship, and/or publication of this article.
Funding
The author(s) received no financial support for the research, authorship, and/or publication of this article.