
Abstract
This paper presents and evaluates in detail a conjugate-pair decomposition method for tracking the instantaneous frequency of a vibration signal by processing only three (or more) most recent data points, and Probability Box theory was employed to obtain the uncertain probability distribution of instantaneous frequency. A composite cable-stayed bridge with large span, named as Guanhe Bridge, was selected as the engineering background; the proposed conjugate-pair decomposition method is verified and compared with Hilbert–Huang transform method using the measured dynamical data of structural health monitoring system. Moreover, the uncertain probability distribution of instantaneous frequency was discussed; the Probability Box also can be obtained. Results show that the identify results are close to each other using conjugate-pair decomposition and Hilbert–Huang transform, respectively; but the variance of conjugate-pair decomposition is less than Hilbert–Huang transform, and conjugate-pair decomposition requires only a few data points for sliding-window fitting to extract the instantaneous frequency, and the Probability Box of instantaneous frequency will be useful to evaluate safety and potential fatigue problems in the bridge cables.
Keywords
Introduction
Cable structures have gained increasing popularity in recent decades while managing economic construction costs.1–3 As the critical component of cable structures, in-service cables are vulnerable to fatigue-induced damage. Thus, the time-varying cable frequency is regarded as a useful indicator to monitor the health condition of cable structures during their service life, because the time-varying frequency is closely related to cable stress, which is widely used to assess the fatigue damage of cables.4–8
Many signal processing methods have been proposed to track the natural frequency of structures. The frequency domain decomposition (FDD) technique (e.g., the peak pick (PP) technique)9–11 is very straight forward; it has been frequently adopted to extract the modal parameters of bridge structures. Yang and Nagarajaiah, 12 Caicedo and Marulanda, 13 Abazarsa et al., 14 Bayraktar et al., 15 and Zhang et al. 16 have studied the FDD technique. However, the accuracy of the extracted frequency relies highly on the frequency resolution, and its inability to handle nonstationary signals has proven problematic, because it decomposes a signal into trigonometric functions; in addition, the extracted frequencies are mean values over the signal duration. 17
Compared with the FDD technique, the time domain decomposition (TDD) method has been pursued more successfully, because it requires only one repetition of SVD procedures for the same specific inspection frequency band, the spectral resolution offered in the analysis of complex systems and their modal uncoupling capability.18,19 STFT20,21 is a time–frequency analysis method that can simultaneously extract the frequency components at different time intervals using a fixed window. However, because STFT assumes that the time series data within the fixed window are piecewise stationary, it suffers from limited frequency resolution; hence STFT is not suitable for extracted nonstationary signals. Furthermore, the application of the STFT method is restricted by Heisenberg’s uncertainty principle. 22 WT uses scaled and shifted wavelets and functions orthogonality to simultaneously extract time-localized components; WT can adjust the window functions so that the window size will widen and narrow according to low and high frequencies.8,23,24 However, the successfully extracted instantaneous frequency (IF) of WT greatly depends on the selection of the wavelet basis function and the discretization of scales; WT suffers from limitations posed by the uncertainty principle.
Empirical mode decomposition (EMD) is classical mode decomposition technique, but it suffered from some drawbacks. 25 A combination of time-varying filtering (TVF) for EMD was proposed to ensure that the vibration signal is decomposed into multiple meaningful empirical modes precisely, and it is verified more robust to noise.25,26 Wavelet packet, VMD can multi-decompose the measured signal into the different frequencies to obtain the localized impulse signals.27–31 HHT is a combination of EMD and Hilbert Transform (HT). Huang et al.32,33 introduced EMD, which is employed to decompose a nonstationary or nonlinear signal to intrinsic mode functions (IMFs), and the IF can be extracted by post-processing each IMF. Predetermined basis functions and function orthogonality are not used for component extraction, so HHT can provide more accurate instantaneous frequencies of extracted IMFs. Moreover, Mahato et al., 34 Barbosh et al., 35 Shi et al., 36 and Feldman 37 discussed a revised EMD and HHT method and its application in signal processing. However, HHT seriously suffers from the edge effect. The edge effect, or the Gibbs phenomenon, is caused by Fourier transform and the sampled length of the signal not being an integer multiple of the period of each component contained in the signal. Furthermore, these methods require the time series data to cover more than three periods of the lowest frequency signal component, and the extracted frequencies are the averaged values (not instantaneous) of all the sampled sections.38–43 Therefore, a new real-time frequency identification method is necessary.
Based on the classical time–frequency analysis method, the Structural Mechanics and Controls Laboratory (SMC) completed several works on IF identification. 44 In 2004, the IF was defined by Nayfeh and Pai. 45 In 2008, based on HHT and the original four-point Teager–Kaiser algorithm, Pai et al. 17 presented a post-processing method to extract the dynamical parametric of nonlinear structures. Moreover, Pai and Palazotto 46 and Pai 47 proposed a time–frequency processing method to improve the accuracy of the HHT method, which can simultaneously decompose a signal into harmonics, and the extracted IF of the harmonics can reveal system nonlinearities. In recent years, Zhong and Pai7,48,49 discussed a sliding-window tracking method, which can be employed to the IF identification of periodic signals.
Based on preliminary results obtained by the authors in literatures,2–4,15,22 we derive a conjugate-pair decomposition (CPD) method that can accurately track a signal’s frequency by processing only three (or more) recent data points, and P-Box theory was employed to obtain the uncertain probability distribution of IF in this paper. In Instantaneous frequency analysis of tensioned cable section, the IF of Guanhe Bridge cable was calculated based on CPD method, to evaluate the accuracy of CPD, Hilbert–Huang transform (HHT) is used to extract the time-varying frequency of bridge cable, and the uncertain probability distribution of Guanhe Bridge cable was discussed, the P-box of IF also can be obtained, it will be useful to evaluate safety and potential fatigue problems in the cables. Finally, Conclusions section ends with our main conclusions.
Basic methodology
Instantaneous frequency
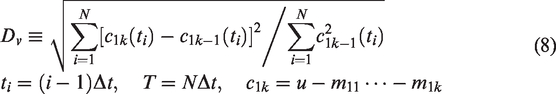
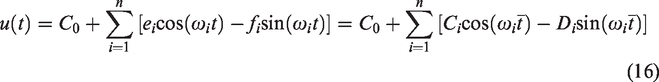
To calculate IF of an arbitrary signal,
2
we consider a time function
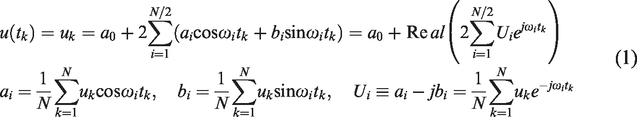
If v(t) denotes the HT of
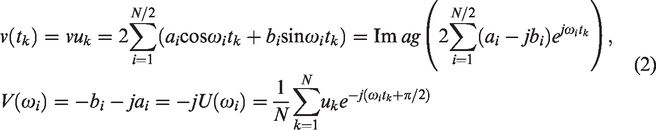
Hence,
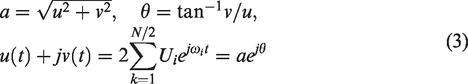
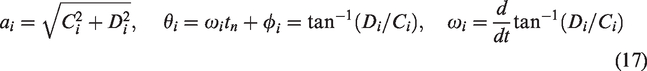
Moreover, the instantaneous velocity and acceleration can be obtained by using the inverse DFT (IDFT) as

These equations (2)–(4) can also be used to compute the IF

However, this method cannot work for a signal with a moving average, as indicated by equations (1) and (2). More seriously, the discontinuity-induced Gibbs’ effect at the two ends of v and u makes the extracted
Conjugate-pair decomposition
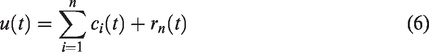
In this section we derive a CPD method, it combines EMD and post-processing of IMFs for signal decomposition of an arbitrary signal and time-frequency analysis of the decomposed components, EMD is a data-driven signal decomposition technique that sequentially extracts zero-mean regular/distorted harmonics from a signal, starting from high- to low-frequency components, and it can be used to sequentially decompose a signal

This sifting process eliminates low-frequency riding waves, makes the wave profile symmetric, and separates the highest-frequency IMF from the current residuary signal. During the sifting process for each IMF, a deviation
After the first IMF (

The whole sifting process can be stopped when the residual
In the past 20 years, Hilbert transfer (HT) always be used to compute the time-varying frequency

To well capture the signal’s behavior, one can pick up the central point

The time-varying amplitude and phase can be estimated using

The three unknowns
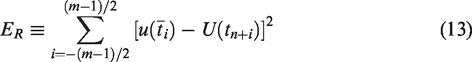
Because the initial guess of
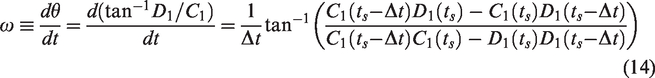
This CPD method shown in equations (11)–(14) can also be used for further decomposition of an IMF distorted by nonlinearities by assuming
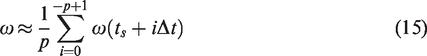
Then similar derivations can be obtained by following the same procedure, and one can use EMD to decompose the signal into nIMFs, and then use CPD to perform accurate time–frequency analysis on each IMF. Hence, the time-varying amplitude and phase and frequency in equations (14)–(15) can be estimated using
Since EMD often introduces the end effect into each IMF, one can assume the form in equation (11) for each IMF and then
P-Box
A P-Box is an imprecise probability that is embraced by a lower and an upper bound. It can be viewed as a set-valued probability. With P-Box representation, a set of real values corresponds to a probability mass, compared with a precise point in classic probability expression. A P-Box can also be viewed as a continuous form of random sets.
Assuming X is a variable, it can be represented by a lower

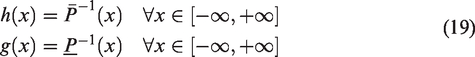
Using equation (19), for any cumulative probability
A P-Box is interpreted as a lower
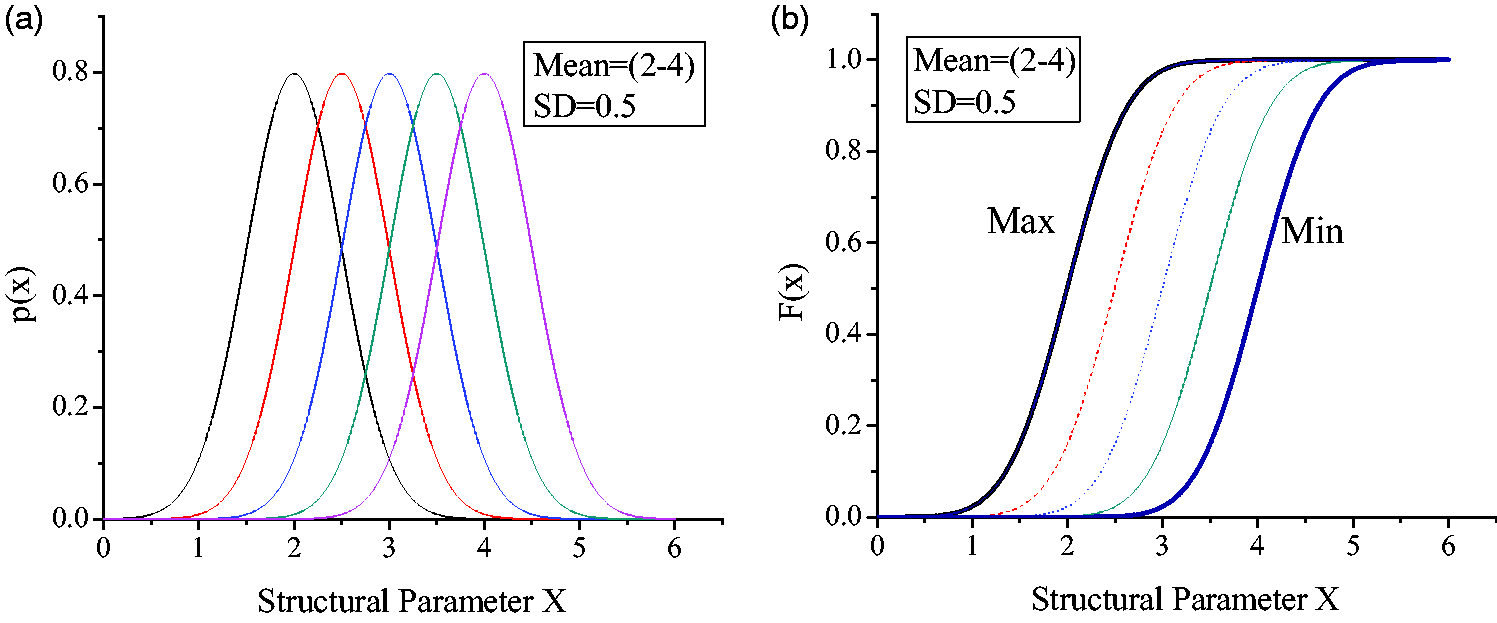
P-Box of structural response. (a) Probability density function and (b) cumulative distribution function.
Framework of IF analysis of stay cable
Firstly, with a static initial deformed geometry, numbers of the stay cable’s free transient vibration samples were measured based on SHM system. Secondly, CPD was employed to accurate time-frequency analysis for a signal having a narrow frequency band. Because CPD requires only a few data points for sliding-window fitting to extract the IF. But, because CPD can treat only monocomponent signals, a multicomponent signal needs to be decomposed based on EMD method; in addition, CPD needs an initial guess of frequency using Fast Fourier Transform (FFT) or Teager–Kaiser algorithm (TKA) method, and it also will be updated and improved during iterations. Finally, the uncertain probability distribution of IF was discussed, the P-box of IF also can be obtained, the P-box will be refreshed constantly as the SHM system continues to collect new samples; moreover, it will be useful to calculate cable force, evaluate safety and potential fatigue problems in the cables. The procedure of IF analysis of stay cable is shown in Figure 2.
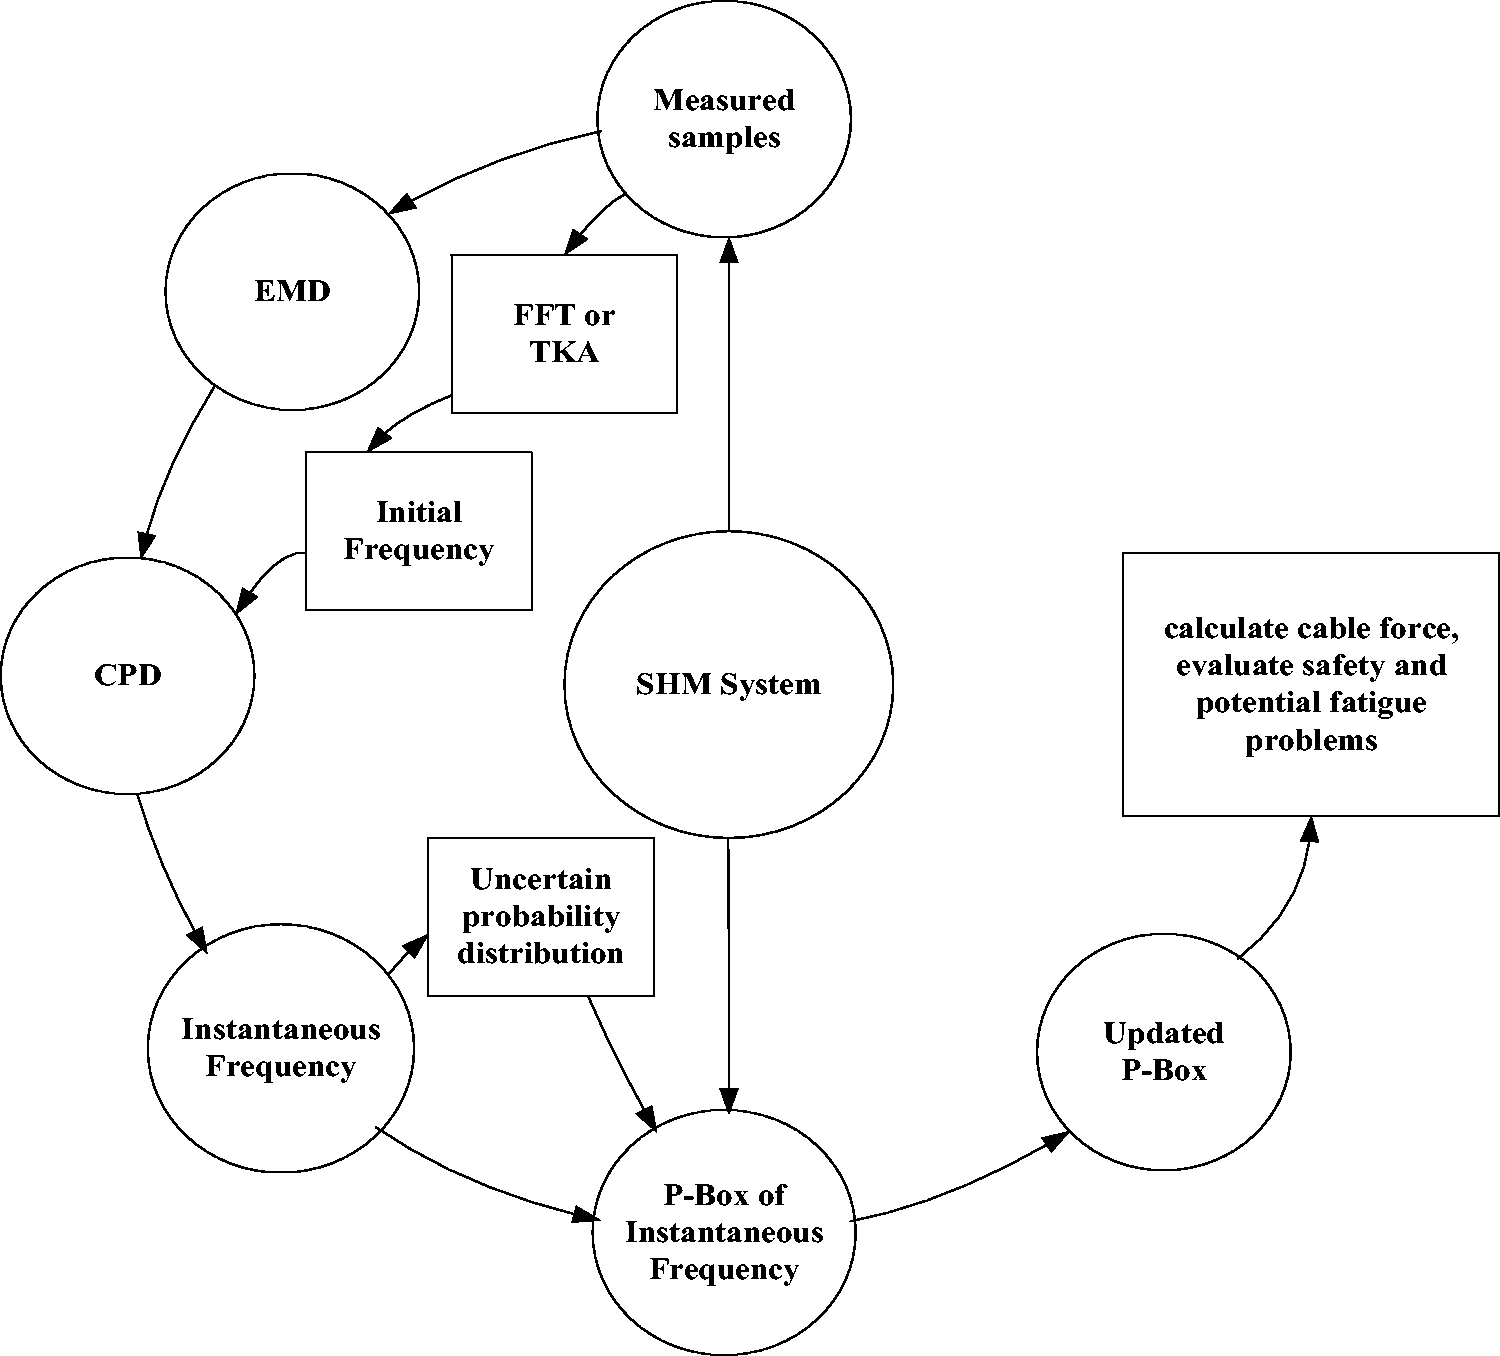
The procedure of instantaneous frequency analysis of stay cable.
IF analysis of tensioned cable
Structural health monitoring system
The Guanhe Bridge is a composite cable-stayed bridge in the National highway No. G15 in China, with an overall length of 640 m and a main span of 340 m (as shown in Figure 3). The concrete bridge tower, consisting of one transverse beam, is 121 m high and was constructed using sliding formwork technology. The main girder was assembled from 166 steel I-beam segments; the bridge deck is a prestressed concrete with 34 m wide and 3.08 m high. The construction of the bridge began in 2002, and was open to traffic in May, 2006.
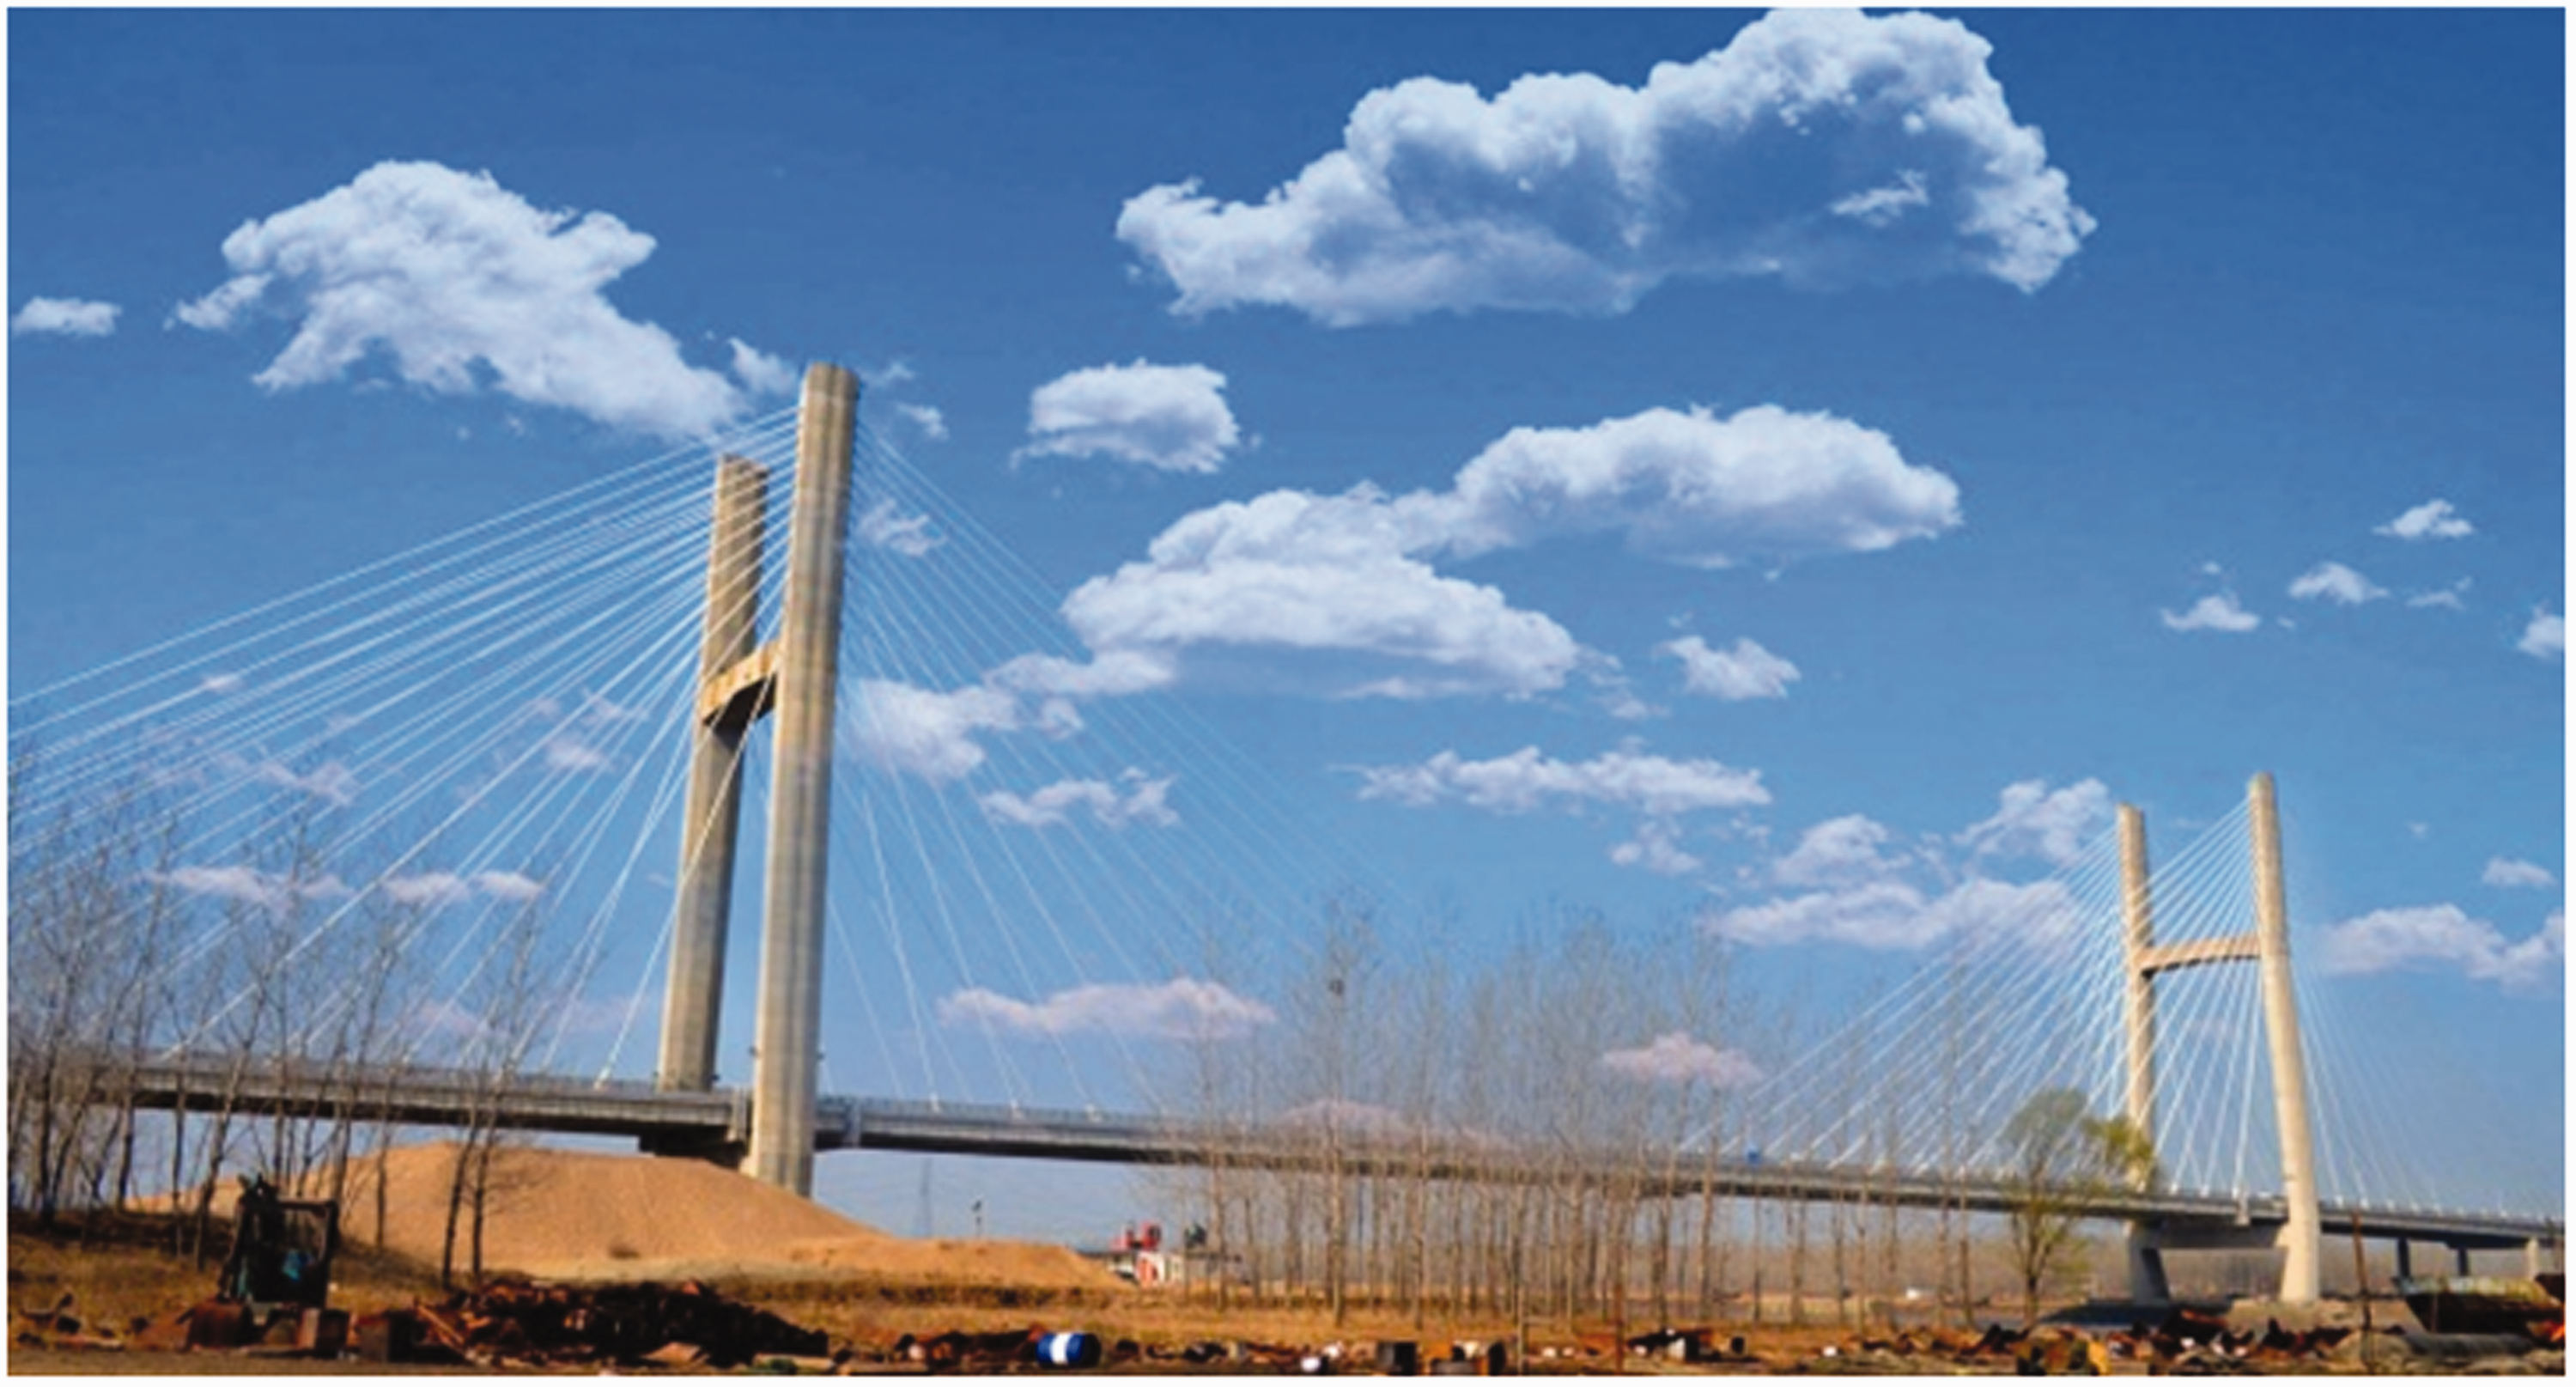
Guanhe Bridge panorama photo.
A comprehensive structural monitoring system (Figure 4) has been implemented on the Guanhe Bridge, 22 and it comprises 280 sensors of different types, including temperature, anemometers, accelerometers, weigh-in-motion sensors, global positioning systems (GPS), displacement transducers, strain gauges and CCTV video cameras. Such structural monitoring system has been continuously monitoring the environment conditions (e.g., wind, temperature, and traffic loads) and bridge response since 2013. In this paper, the cable tension sensors are used to obtain natural frequencies, and the cable NO. 1 (as shown in Figure 4) was selected to analysis here, others also can be analysis as follow.
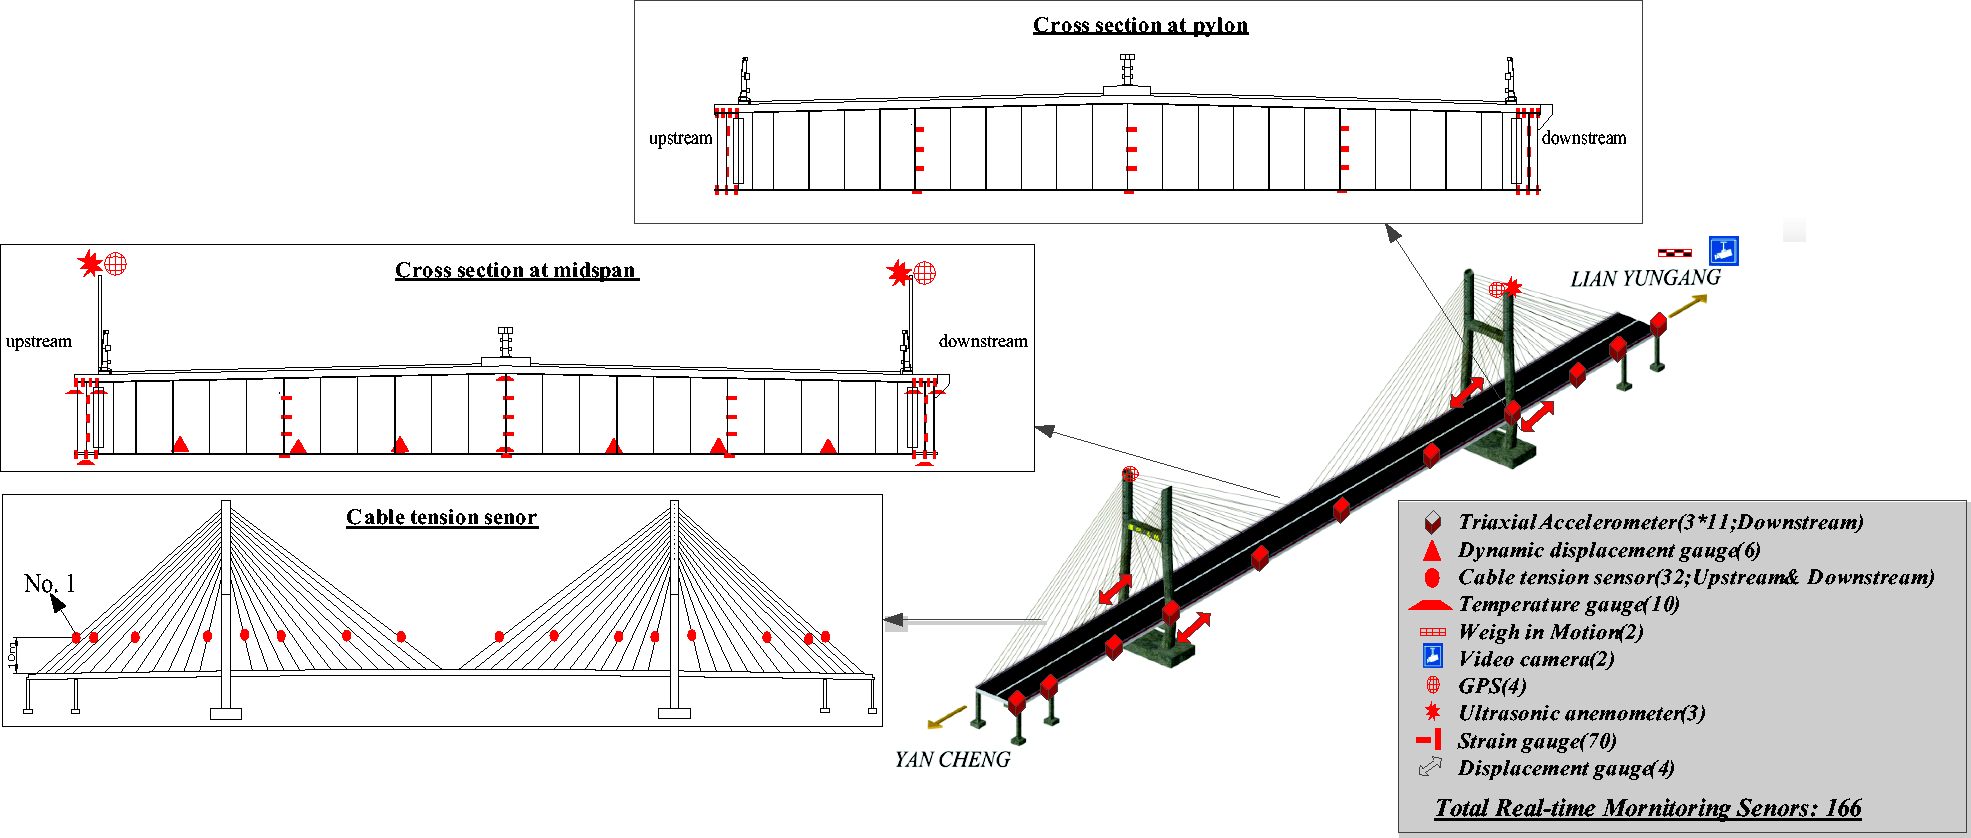
Sensors setting of SHM system.
Numerical simulation
The case of a stay cable system shows that the CPD method can be used to extract the time-invariant frequency. In this section, a stay cable with time-varying stiffness coefficients is employed to illustrate the accuracy and capability of this method.
As shown in Figure 5(a), the stiffness of the stay cable is a sinusoidal function of time,
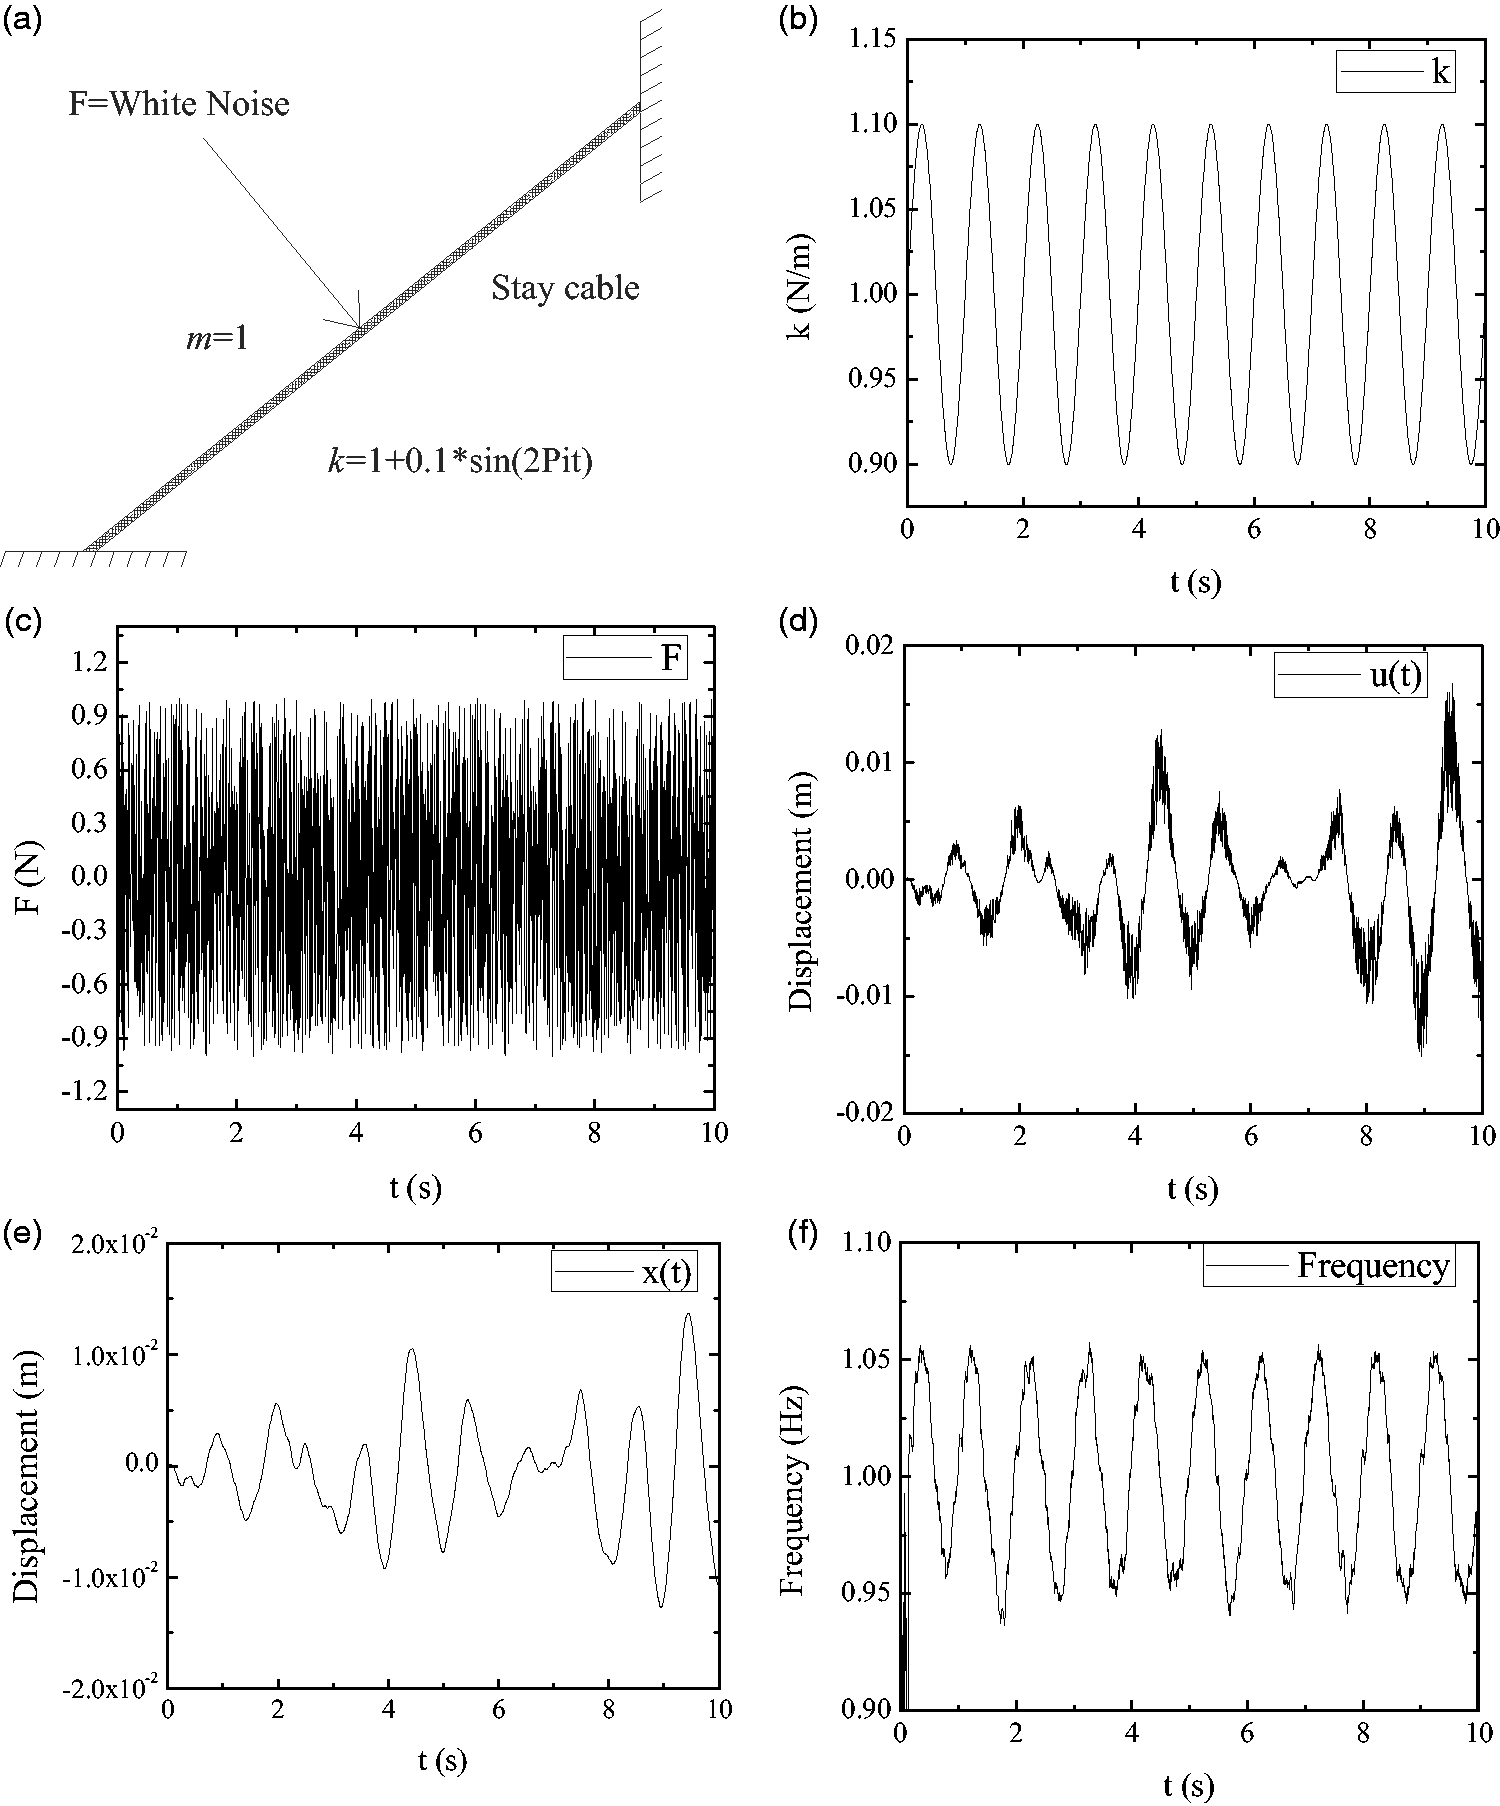
Extraction of time-varying frequency: (a) spring-mass-damper system; (b)
Moreover, EMD is used to extract the first IMF
Time–frequency analysis of tensioned cable
Lots of numerical simulations and steel beam experiments have been used to verify CPD method requires only a short data length and a low sampling rate and is capable of IF tracking. In this paper, we concentrate on the use of CPD method for natural frequency of stay cable from measured velocities.
With a static initial deformed geometry, the tensioned cable’s free transient vibration was measured using a sampling frequency 50 Hz
The first five natural frequencies were experimentally determined using the PP method to be 0.77 Hz, 1.55 Hz, 2.31 Hz, 3.01 Hz, and 3.80 Hz. Based on the estimate method of cable tension,
8
the fifth frequency can be employed to estimate cable tension, damage detect, and damage prognosis, and it can be separated using the EMD. However, one can perform EMD on the measured velocity or the integrated displacement. Numerical study shows that it is better to decompose the velocity first and then numerically obtain each IMF’s displacement and acceleration. First we add to the original velocity signal a harmonic function with a frequency at the 50 natural frequency (3.80 Hz) and an amplitude of 100 mm/s (slightly larger than the original velocity amplitude), and then EMD extracts the added function and the third mode as the first IMF. Subtracting the added function from the extracted IMF yields the true, first IMF. After the first IMF (
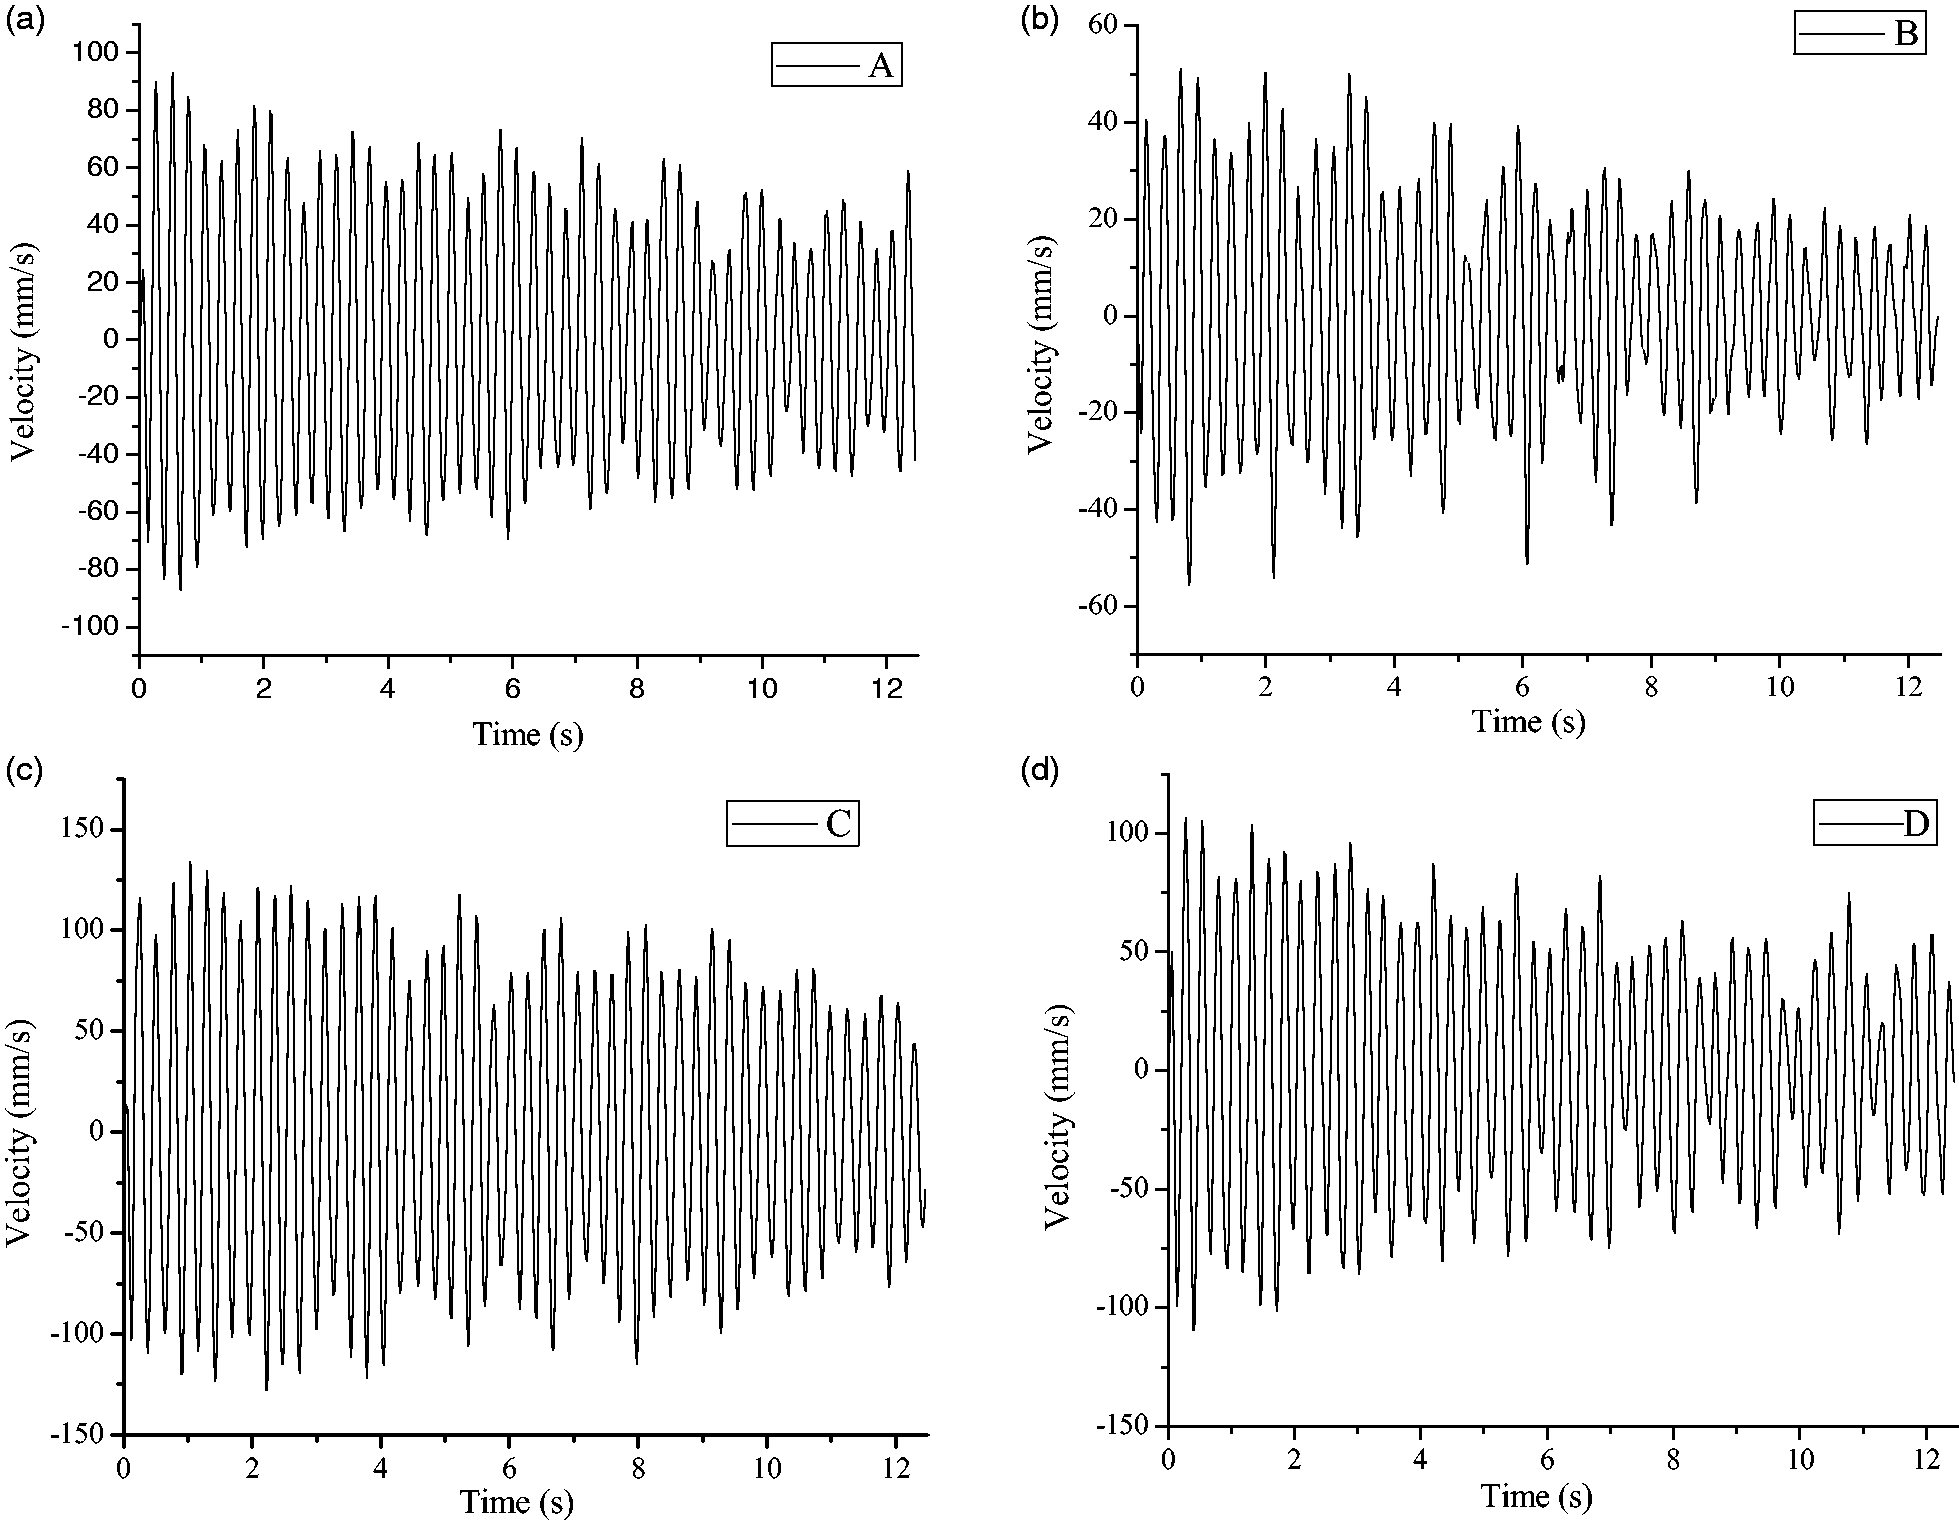
Measured samples of stay cable. (a) Sample A. (b) Sample B. (c) Sample C. (d) Sample D.
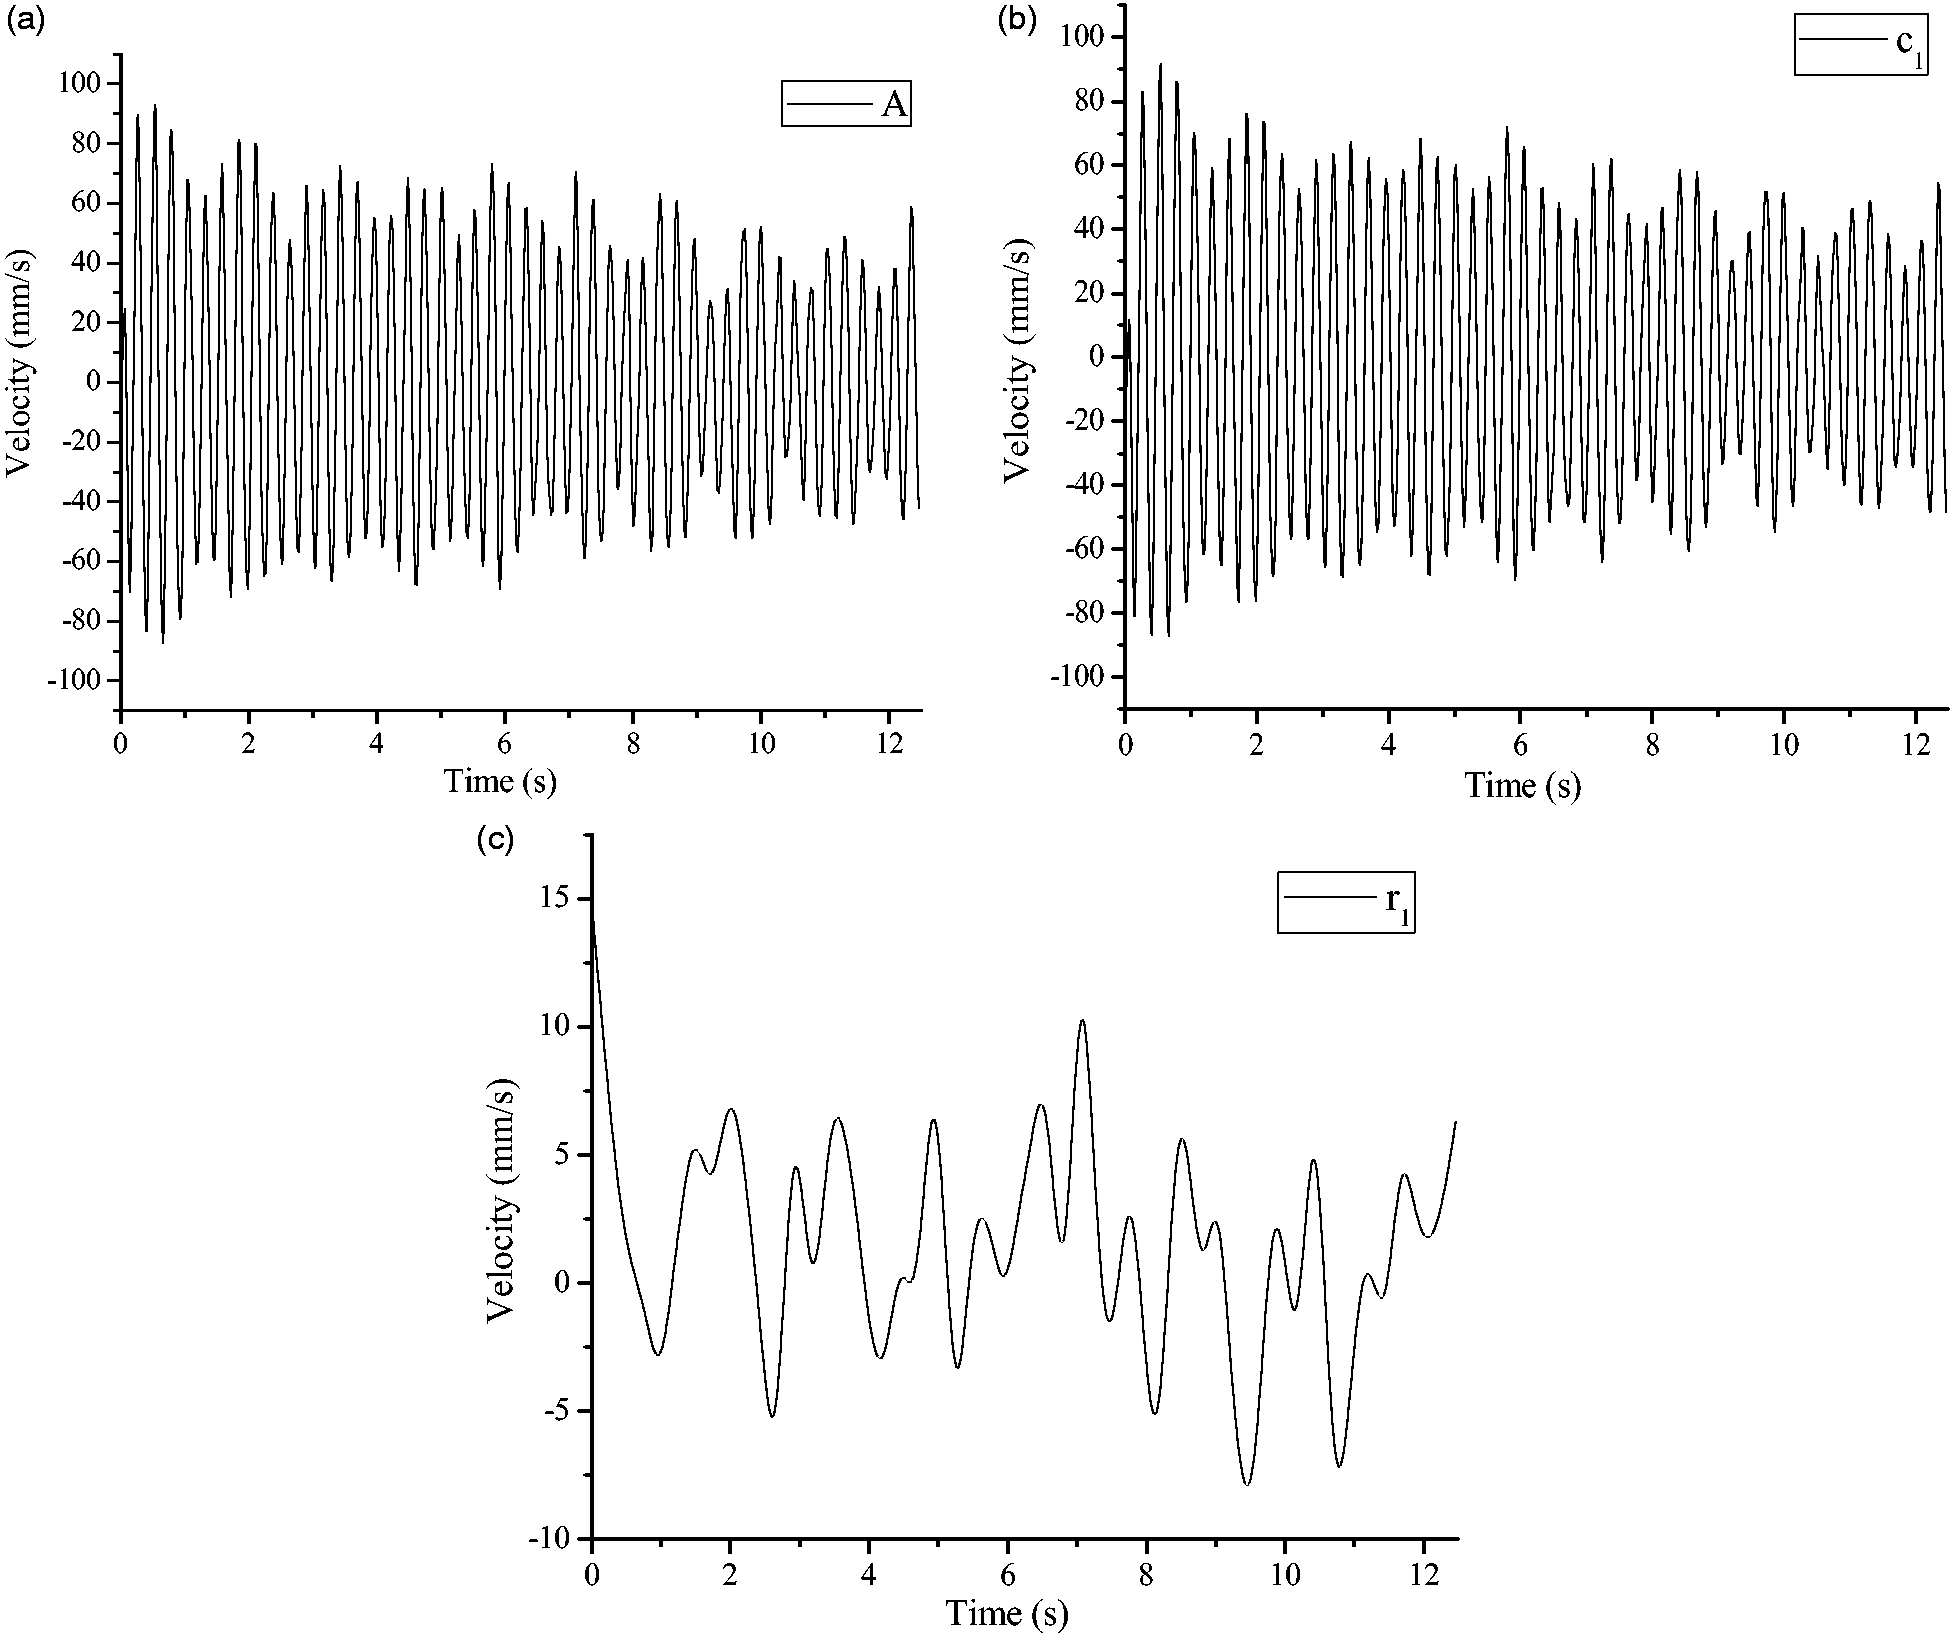
EMD of Measured samples. (a) Integrated displacement. (b) Extracted first IMF from Figure 7(a). (c)The residual of Figure 7(a).
For CPD analysis, five data points from each side (m = 11 in equation (13)) are used. The IF can be obtained based on CPD method, and it can be used to compare with the time–frequency analysis using HHT, as shown in Figure 8(a). However, to well capture the signal’s behavior, the time length of three points should cover at least one-fourth of the signal’s period in CPD analysis, 15 and HHT suffers from the edge effect, so the first and last IF analysis in Figure 8(a) using HHT and CPD are inaccurate, the first and last 11 frequency points should be deleted in the P-box analysis, as shown in Figure 8(b). It is clear that the identify results are close to each other using CPD and HHT, respectively; but the variance of CPD is less than HHT. Figure 9(a) and 9(b) and 9(c) shows the time–frequency analysis of measured samples B and C and D using HHT and CPD, respectively; the similar conclusions can be got from these figures.
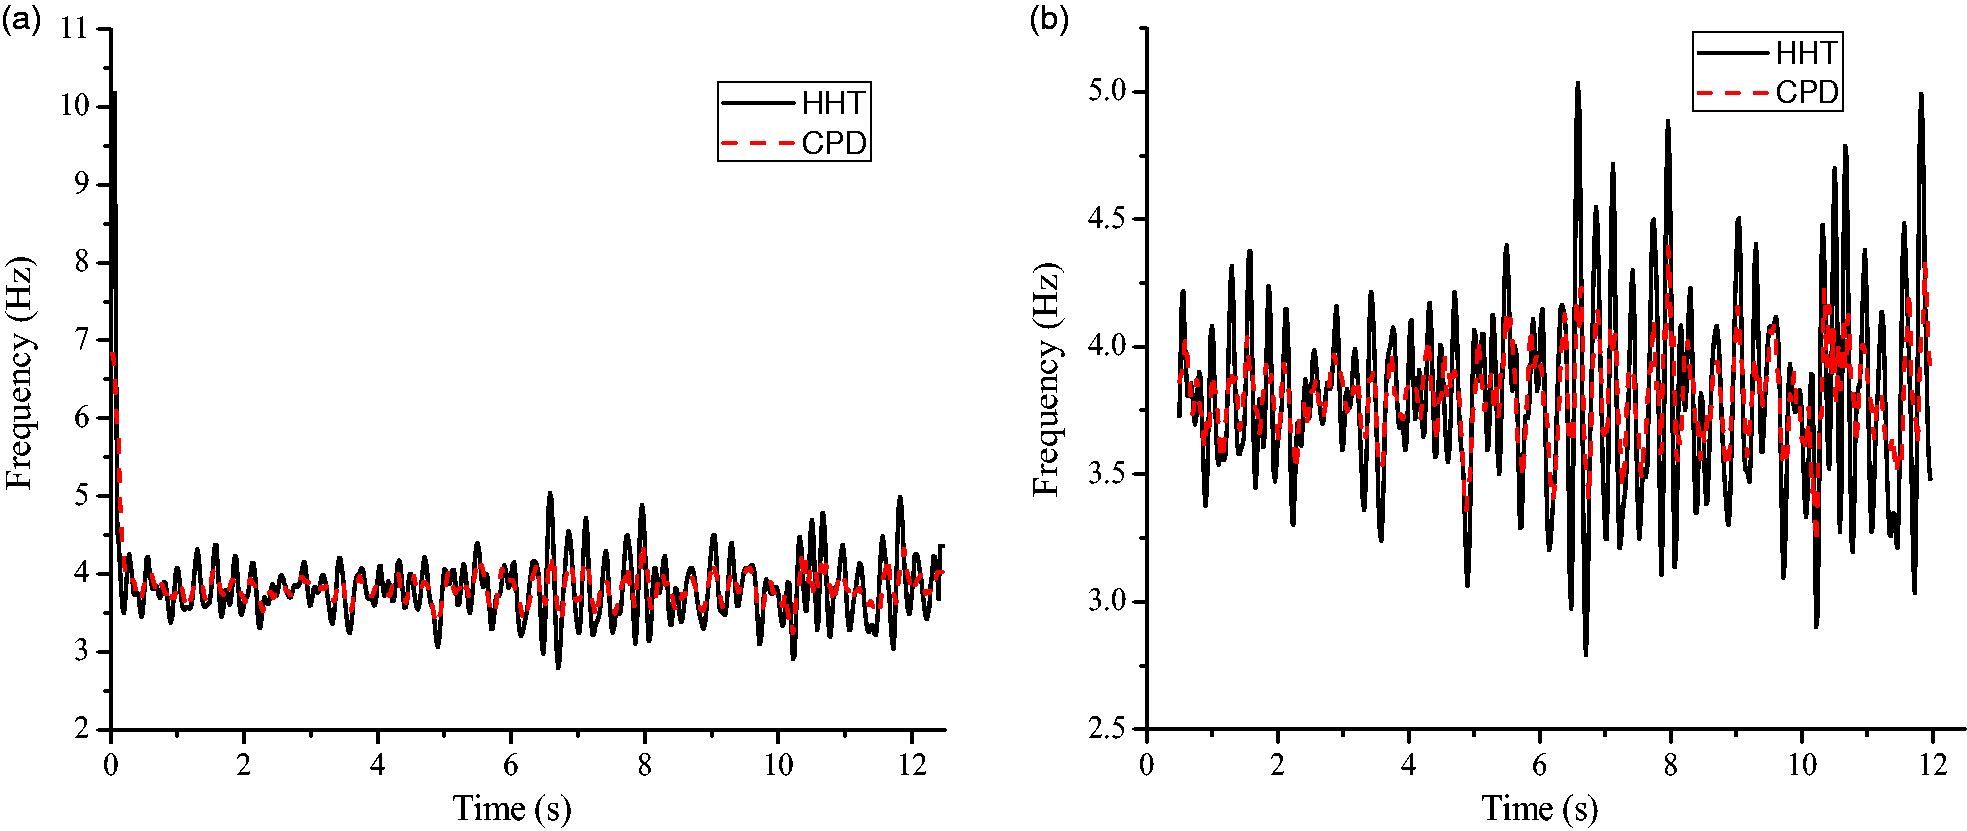
Time-varying frequencies from HHT and CPD analyses. (a) Time-varying frequencies before updated. (b) Time-varying frequencies after updated.
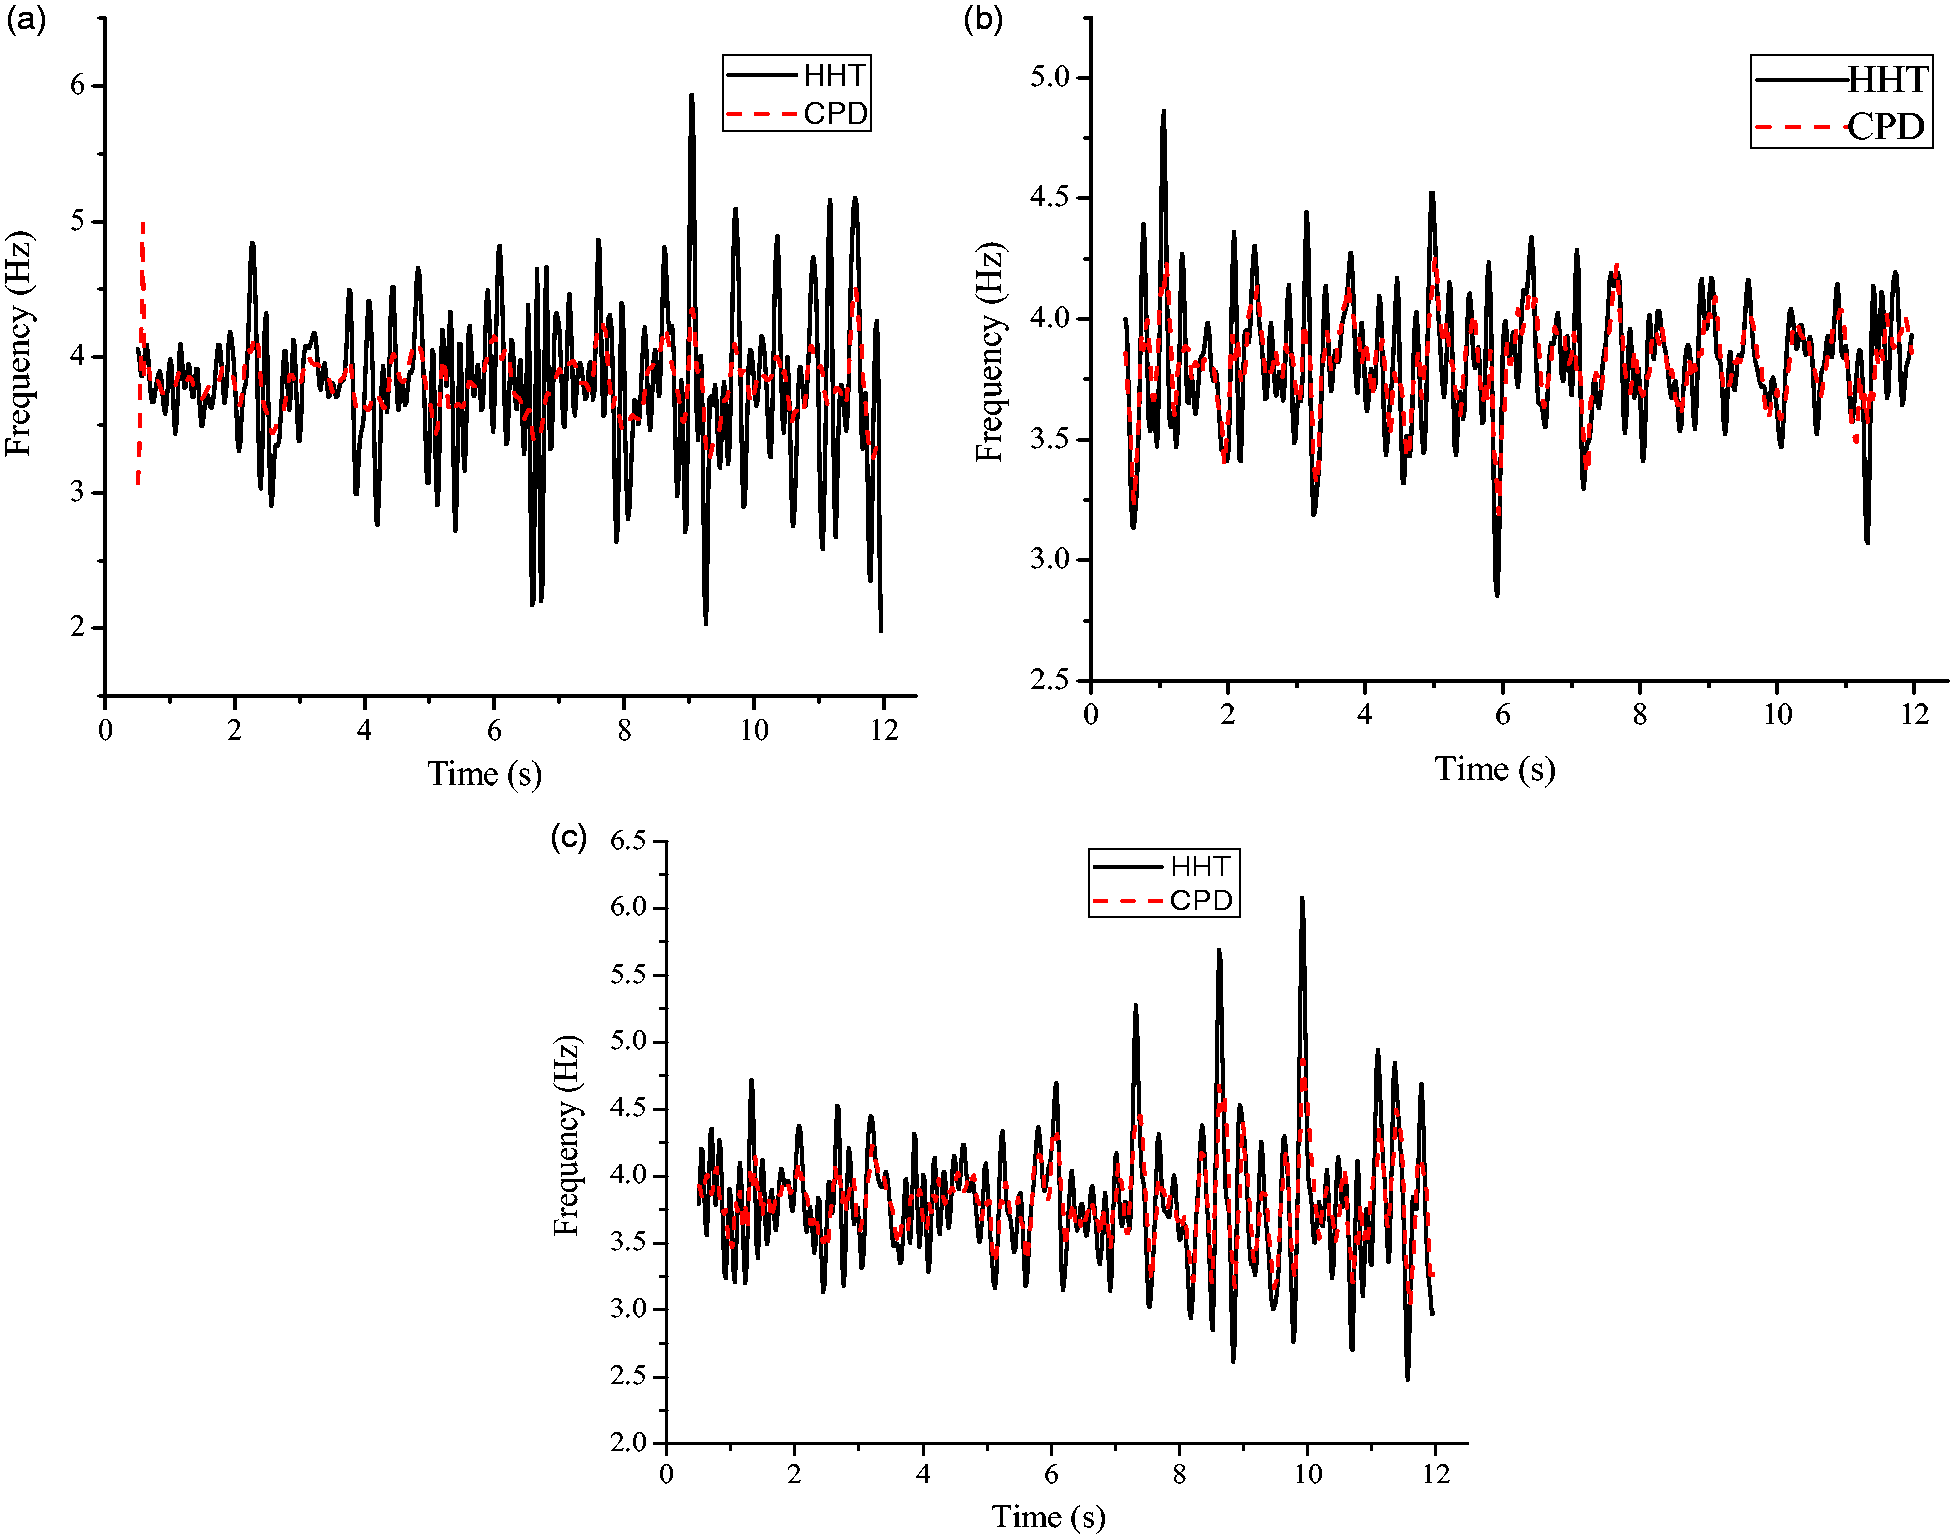
Time-varying frequencies from HHT and CPD analyses. (a) Sample B. (b) Sample C. (c) Sample D.
P-box analysis of IF
As shown in Figures 8 and 9, the IF of tensioned cable is changing over time. In order to obtain the probabilistic distribution of IF, an uncertainty quantification (UQ) methodology is proposed in this section, P-box is aim at developing rigorous methods to characterize the statistics characteristics of interest. It will provide the basis to estimate cable tension force, predict the development of cable tension force and determine proper maintenance planning.
Based on the SHM system of Guanhe Bridge, four measured samples according to time were obtained. Based on the statistical principle and method, the CDF of normal distribution, generalized extreme value distribution (GEV), gamma distribution, and t-location scale distribution are employed to fit the cumulative distribution of samples, as shown in Figure 10, the CDF of normal distribution is in a good coincidence with measured samples.
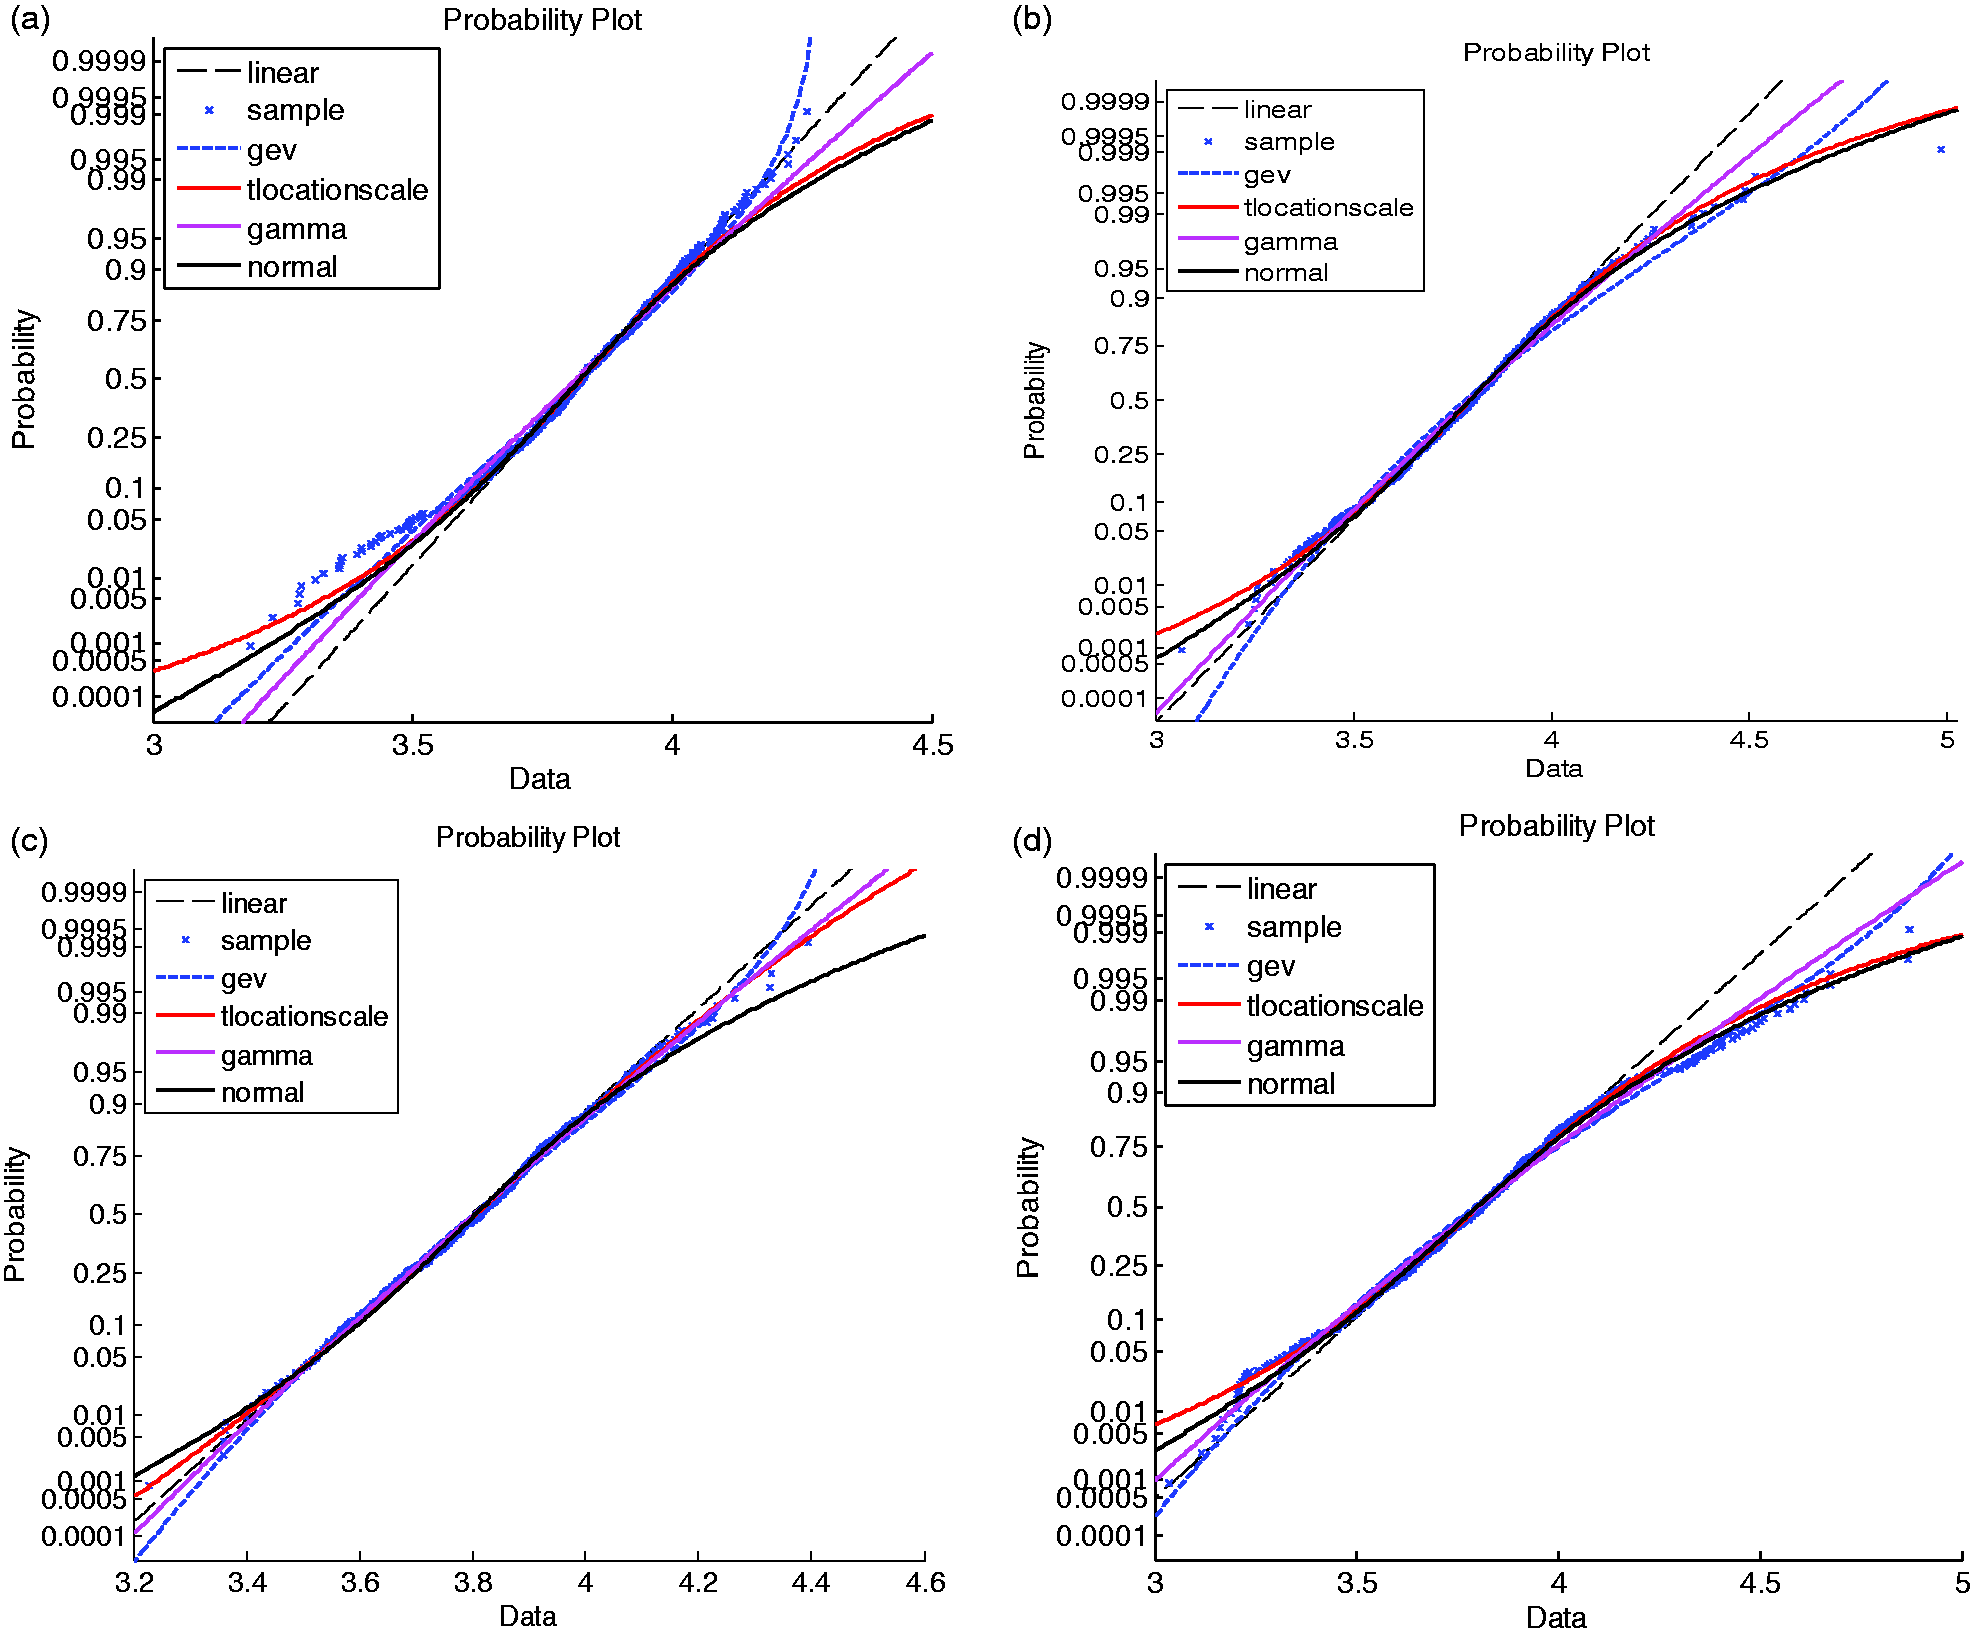
The CDF of instantaneous frequencies. (a) Sample A. (b) Sample B. (b) Sample C. (d) Sample D.
A P-box is an imprecise probability that is embraced by a lower and an upper bound. Treating the P-box as an empirical distribution function, we can make use of a variety of statistical tools for bounding distribution functions. Since an empirical distribution function is an unbiased estimator of the true CDF, confidence bounds can be constructed around it that contains the true CDF for a chosen probability. Distributional bounds or p-boxes can be viewed as a set of intervals. We can either interpret the distributional bounds as a set of curve bounds for the probability at different values. As shown in Figure 11, the lower and an upper bound can be obtained while the interval of curve bounds is 0.01 Hz, and the P-box will be refreshed constantly as the SHM system continues to collect new samples. It is clearly observed that the mean and variance of frequency are different during different time, it is related to the environment and cable tension of Guanhe Bridge, this paper will only focus on the CDF of frequencies, and the main relation between the cable’s IF and environment will be discussed in the future research.
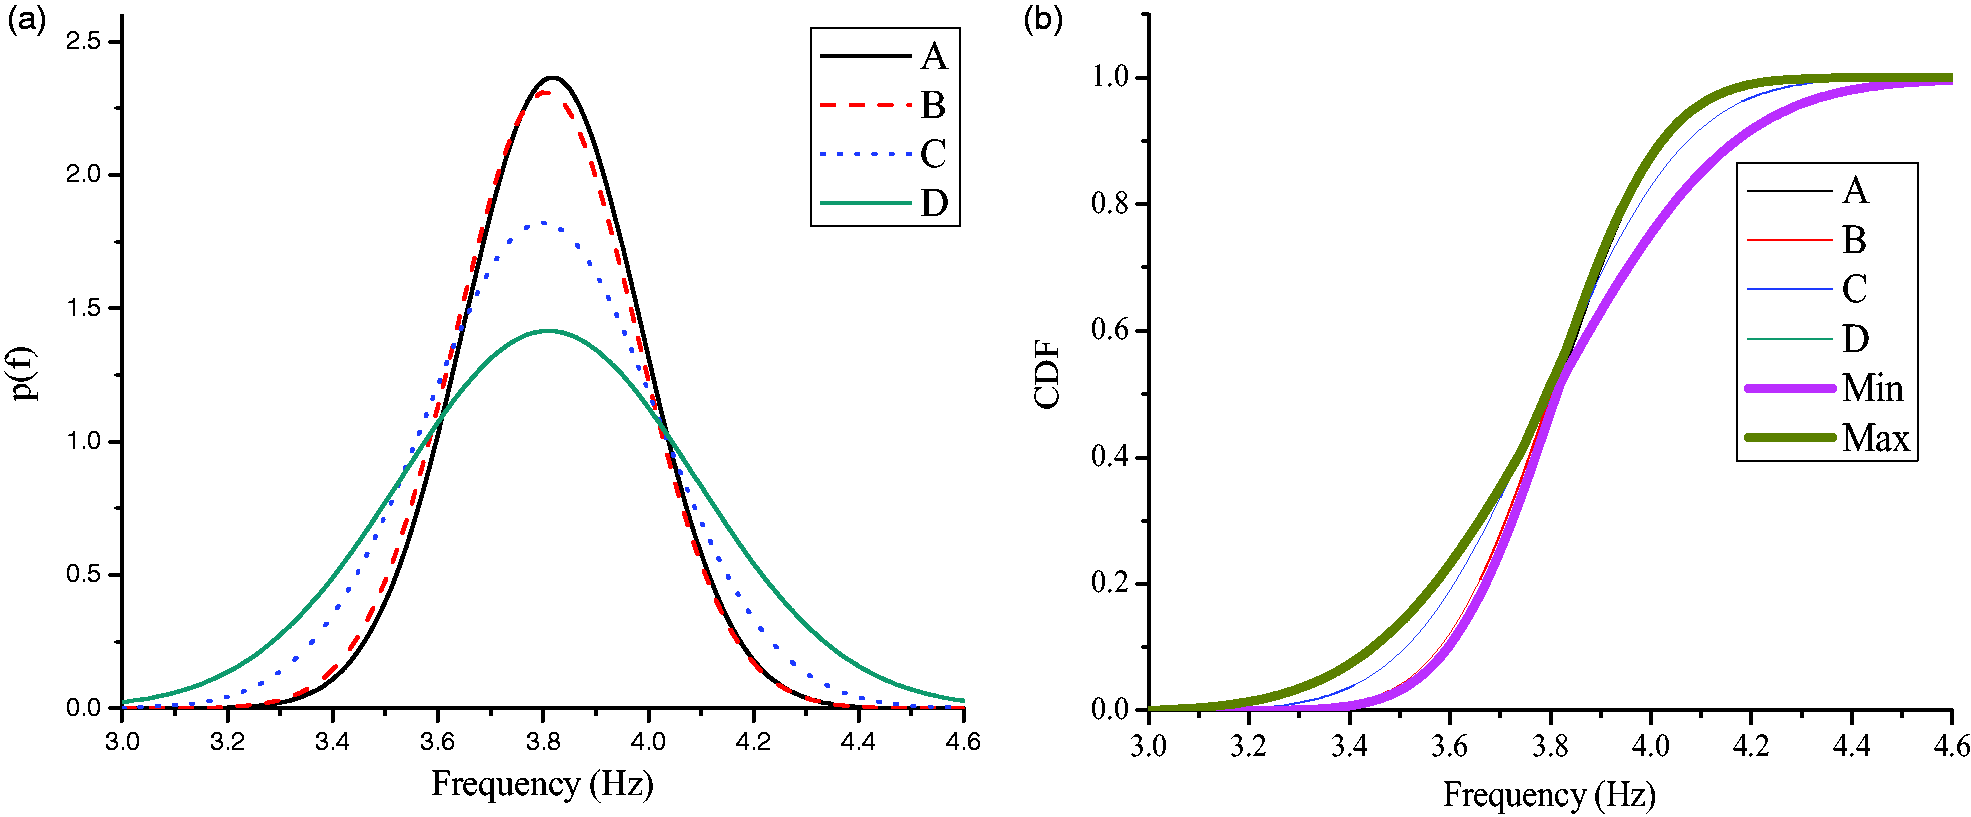
The P-box of instantaneous frequencies. (a) Probability density function. (b) Cumulative distribution function.
As shown in Figure 11, the P-box of IF can indicates the dynamic performance of stay cable, the P-box will be refreshed constantly as the SHM system continues to collect new samples. Moreover, these measured frequencies can be used to estimation of cable force by vibration method,25,26 they will be useful to update finite element model and reproduce the behavior of a whole family of stay-cable Bridge. If use effectively filtering method, it is expected to increase its adaptability to the data and expand its application in stochastic signal processing, and the CPD method and SHM system can be employed to track the IF of stay cable, a more complete P-box which is embraced by a lower and an upper bound can be obtained, and it will be useful to evaluate safety and potential fatigue problems in the bridge cables.
Conclusions
Here we derive and validate a CPD method that uses only three (or more) recent data points to accurately track the IF of a vibration signal, and P-Box theory was employed to obtain the uncertain probability distribution of IF, it is instrumental to extract interpretable information from imprecise probability representations. It provides faithful estimations of upper and lower estimates of the probability of events of instantaneous frequencies. The proposed methodology is demonstrated using a cable-stayed bridge, and the results for the real bridge case show the capability of the proposed methodology for IF identification, the identify results are close to each other using CPD and HHT, respectively; and the variance of CPD is less than HHT, but CPD requires only a few data points for sliding-window fitting to extract the IF, and the P-box of IF will be useful to evaluate safety and potential fatigue problems in the bridge cables.
Footnotes
Declaration of conflicting interests
The author(s) declared no potential conflicts of interest with respect to the research, authorship, and/or publication of this article.
Funding
The author(s) disclosed receipt of the following financial support for the research, authorship, and/ or publication of this article: The authors gratefully acknowledge the financial support provided by the China Postdoctoral Science Foundation (Grant Nos. 2018M630945 and 2018M633051). The viewpoints of this paper represent only the authors’ opinions and do not represent the views of the fund committee.