
Abstract
Tooth fractures and cracks are common defects in gear transmission systems. Crack propagation paths of the spur gears are acquired using the fracture mechanics theory. Based on the simulated crack propagation path, the flexible body model of the cracked gear system is established in multibody dynamic software ADAMS. The vibration signals of cracked gear under different torques obtained from the simulation are verified by the experimental results. Some statistical indictors (root mean square and Kurtosis) are used to quantify the damage degree. In addition, the fault features of the gear system under crack and tooth fracture faults are analyzed by utilizing the instantaneous energy. The results indicate that the amplitude of the harmonics of the meshing frequency and the sideband frequencies increase gradually with the increase of torques and crack lengths. Especially, for the tooth fracture fault, its influence on Kurtosis value is particularly obvious. Meanwhile, according to the instantaneous energy, the tooth fracture fault will result in severe energy impacts and cause a sharp increase in the vibration amplitude.
Introduction
Gear transmission system, including gears, bearings, shafts, and gearbox casing, is a complex dynamic system. For the research methods of gear system, there are mainly analytical method, finite element method, and experimental method. It is difficult to truly consider the influences of assembly error and machining error in the analytical method and finite element method. Therefore, some scholars1–12 mainly apply the experimental methods to the researches of meshing characteristics and vibration characteristics of gear systems. Pandya et al. 1 and Raghuwanshi et al.2,3 used photoelasticity technique and strain gauge technique to compute the mesh stiffness of spur gears with crack, and their experimental results were compared with the results obtained from the potential energy method. Based on the fracture mechanics and test machine, Aslantaş et al. 4 simulated the crack propagation path on tooth surface and designed the experiment to determine the pitting formation life, and the pitting formation life obtained from the experimental and simulated methods was compared. Endo et al. 5 used the finite element method to compute the static transmission error under different crack levels (tooth fillet crack) and spall sizes, and then, they developed a differential diagnostic technique for different signals of tooth fillet crack and spall. The method was also proved to be applicable to experimental signals. Glodež et al. 6 studied the influences of different load distributions on crack growth path using the experimental test. Kubur et al. 7 proposed an analytical dynamic model to analyze the influences of system parameters, including shaft length, bearing stiffness, etc., on the dynamic transmission error, the dynamic gear mesh force, and so on. And, their simulated result was validated by the experimental data. Ma et al.8–10 calculated the time-varying mesh stiffness of spur gear under different crack lengths using the potential energy method and the finite element method, and the mesh stiffness was imported into the dynamic model to analyze the dynamic response. And, the established dynamic model was validated by experimental results. Based on dynamic model and experimental method, Ma et al. 11 studied the nonlinear dynamic and vibration characteristics of spur gear pair with spalling defect, which provide a certain basis for the spalling mechanism and fault diagnosis. Based on the elastohydrodynamic lubrication theory, Wei et al. 12 studied the stress of tooth surface of spur gears with pitting under different contact types (including pure rolling contact and sliding contact) using theoretical analysis and experimental method.
Multibody dynamic analysis of gear systems is always a research hotspot. Considering the elastic connection between the rigid teeth and the rigid foundation of each gear, Ebrahimi et al. 13 established an improved rigid-elastic model, and further compared the contact force and some kinematic results obtained from the proposed model, finite element method, and totally rigid model. Cirelli et al.14,15 established the partial flexible multibody gear model and compared the transmission error with the fully flexible model. Then, a novel nonlinear dynamic model is established and the results under quasi-static conditions are verified by the finite element model and the nonlinear dynamic responses are tested by the experimental data. In order to evaluate the whine noise, Cho et al. 16 proposed a quasi-flexible-body gear modeling method to calculate the dynamic transmission error and the results obtained from the proposed method have a good agreement with the experimental results. Palermo et al. 17 established a contact element to simulate the complex contact conditions in the meshing process of spur gear and helical gear pairs. The dynamic transmission error, normal contact force, and contact pattern are analyzed under different angular speeds, applied torques, and angular misalignment errors. With the development of software technology, the multibody dynamics software is mainly introduced into the researches of gear system dynamics. Using the ADAMS software, Chen et al. 18 established a rigid–flexible coupled model of planetary gearbox to analyze the effects of the crack parameters on dynamic responses and used some statistical indicators to investigate the relationship between the crack sizes and fault characteristics. Zhou et al. 19 investigated the influence of shaft flexibility, rotation speeds, and load on the vibration response of gear system by the rigid–flexible coupled model. Considering the bending of the gear teeth and torsional flexibility of shaft, Han et al. 20 constructed a rigid-body dynamic model of helical gears to calculate the gear meshing forces and bearing forces, and the results were compared with the frequency-based model. Li et al. 21 built a mixed model that used gear tooth profile curves to take place of the solid model to simulate the dynamic meshing force and it was proved that the proposed model had higher efficiency. Chen et al. 22 compared the difference of gear meshing force between the rigid–flexible coupling model and rigid model of gear transmission system and demonstrated that the rigid–flexible coupling model could reflect the real motion better.
Due to excessive service load and inappropriate operating conditions, gear crack fault is commonly seen in gear transmission system.23–25 Chaari et al. 26 proposed an analytical method to compute the mesh stiffness of spur gears with different crack types. Fernandez del Rincon et al. 27 presented an analytical-finite element method to analyze the effects of torque and crack lengths on load sharing ratio, transmission error, and mesh stiffness. Yu et al. 28 and Li et al. 29 studied the effects of spatial crack propagation on gear mesh stiffness. Furthermore, Chen et al.30,31 calculated the mesh stiffness of spur gears with different crack parameters and crack types and analyzed the vibration characteristics under different crack depths. Based on the numerical simulation and experimental method, the differences between the vibration signals with the tooth crack and spalling failure were discussed by Ma et al. 32 Chen et al. 33 simulated the crack propagation path using Franc 2 D. Based on the crack path and potential energy method, the time-varying mesh stiffness under different crack lengths and crack paths was calculated. Finally, the vibration signals of cracked gear were obtained from the proposed model with 6 degrees of freedom. Jia et al. 34 established a gear dynamic model with 26 degrees of freedom, including three shafts and two spur gear pairs, and compared the vibration signals of the gear tooth with crack and spalling.
The phenomenon of tooth fracture caused by the tooth crack is very frequent in engineering practice. Lu et al. 35 developed a mathematical model to analyze the frequency characteristics of wind turbine gearbox with broken tooth in variable-speed conditions. Chaari et al. 36 and Ma et al. 37 discussed the effects of tooth fracture (also known as tooth breakage) on mesh stiffness, and the dynamic responses of tooth breakage were analyzed using the one-stage spur gear dynamic model. Qu et al.38,39 evaluated the vibration characteristics of spur gears under different tooth cut levels and tooth root crack using acoustic emission sensors.
In this paper, based on the simulated and experimental method, the vibration signals under different torques and different crack lengths are monitored. Then, some statistical indictors, including root mean square (RMS) and Kurtosis, are used to analyze the effects of torques and crack lengths on dynamic response of cracked gear system. Because the tooth fracture fault is often accompanied with large energy impact and the vibration signal is hard to capture, the researches about the tooth fracture fault are insufficient. Based on the simulation model and experimental method, this paper compares the signal features on time-domain and frequency-domain under crack and tooth fracture faults. Using the instantaneous energy, the fault features under crack and tooth fracture faults are analyzed.
In this paper, five sections are included. The research status about the simulated and experimental methods of cracked gear system is reviewed in this section. In the forthcoming sections, the simulation model and experimental measurement are introduced. Then, in the penultimate section, the vibration signals under different torques, crack lengths, and tooth fracture fault are analyzed. Some conclusions are drawn in the final section.
Simulation model
Crack propagation model
The real crack propagation path is of great significance to accurately evaluate the dynamic characteristics of cracked gear systems. Meanwhile, there exists mainly the penetrating crack in the spur gear under cyclic load. Therefore, based on the fracture mechanics theory, the plane crack propagation path will be simulated in this part.
Initial crack parameters, including crack initial angle ψ, crack initial length l0, and initial crack propagation angle υ (see Figure 1(a)) have a certain influence on the crack propagation path. However, it has been proved that the crack initial angle ψ has the most obvious influence on the crack growth path, 33 which indicates that it is important to determine the exact crack initial angle. In this paper, the crack initial angle is determined according to the maximum tooth root stress position of the healthy gear (see Figure 1(b)).
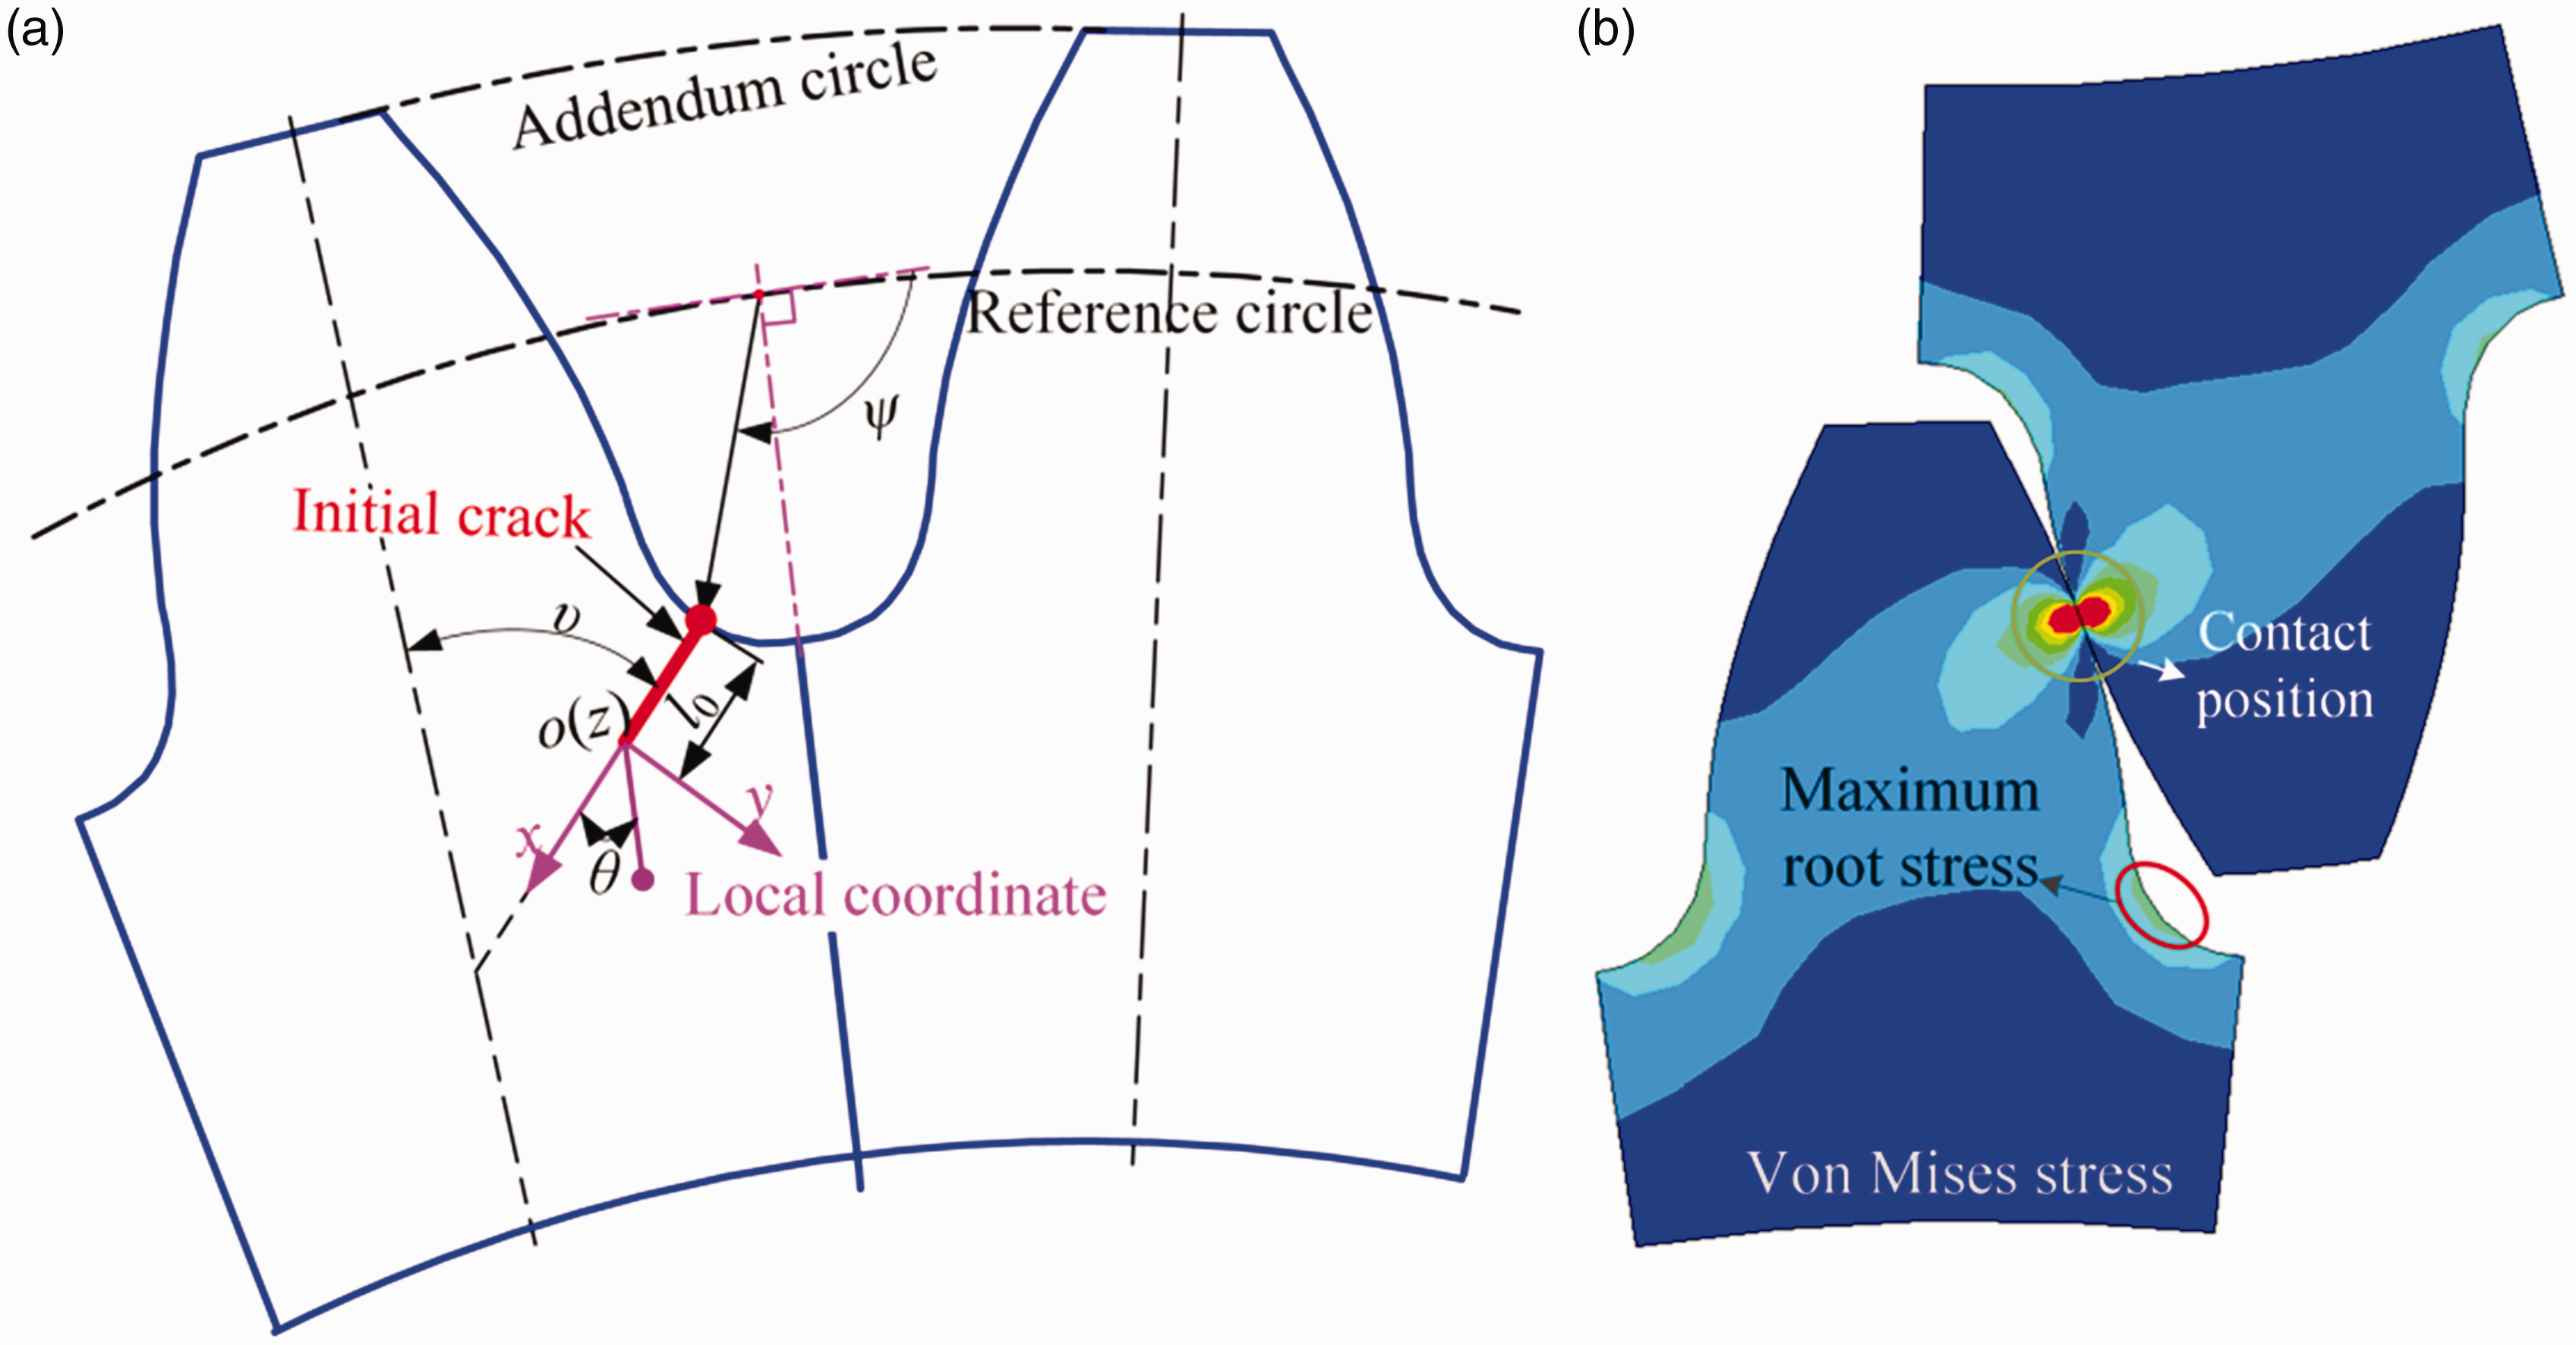
Initial crack parameters and the crack initial angle: (a) initial crack parameters and (b) von Mises stress.
In the crack propagation process, the crack propagation angle θ and the crack propagation increment ls determine the crack propagation direction and the smooth level of crack propagation paths. In this part, the crack propagation increment ls is assumed to be 0.2 mm.33,40 According to the fracture mechanics, the mode I and II stress intensity factors KI, KII are used to determine the crack propagation angle θ. In order to calculate the mode I and II stress intensity factors KI, KII, the finite element model is established (see Figure 2). In the finite element model, the degrees of freedom of the nodes at the hub circles of the cracked gear are constrained. The force F is applied on the highest point of the single-tooth contact zone (F = T/rb1, T denotes the torque and rb1 is the radius of the base circle of the pinion). According to the initial crack parameters, including crack initial angle ψ, crack initial length l0, and initial crack propagation angle υ (see Figure 1(a)), the initial crack is determined, and a singular element is established at the crack tip. The stress intensity factors KI, KII are calculated by the finite element model containing the singular element (see Figure 2). Using the maximum tangential stress criterion,33,40,41 the crack propagation angle can be expressed as
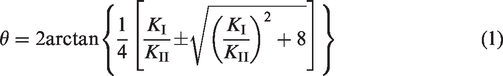
Finite element model containing the singular element.
Finally, based on the initial crack parameters and the crack propagation angle under different growth steps, the plane crack propagation path can be determined accurately. Then, the three-dimensional finite element model of spur gears with penetrating crack is obtained by extruding the spur gear with plane crack.
Multibody dynamic model
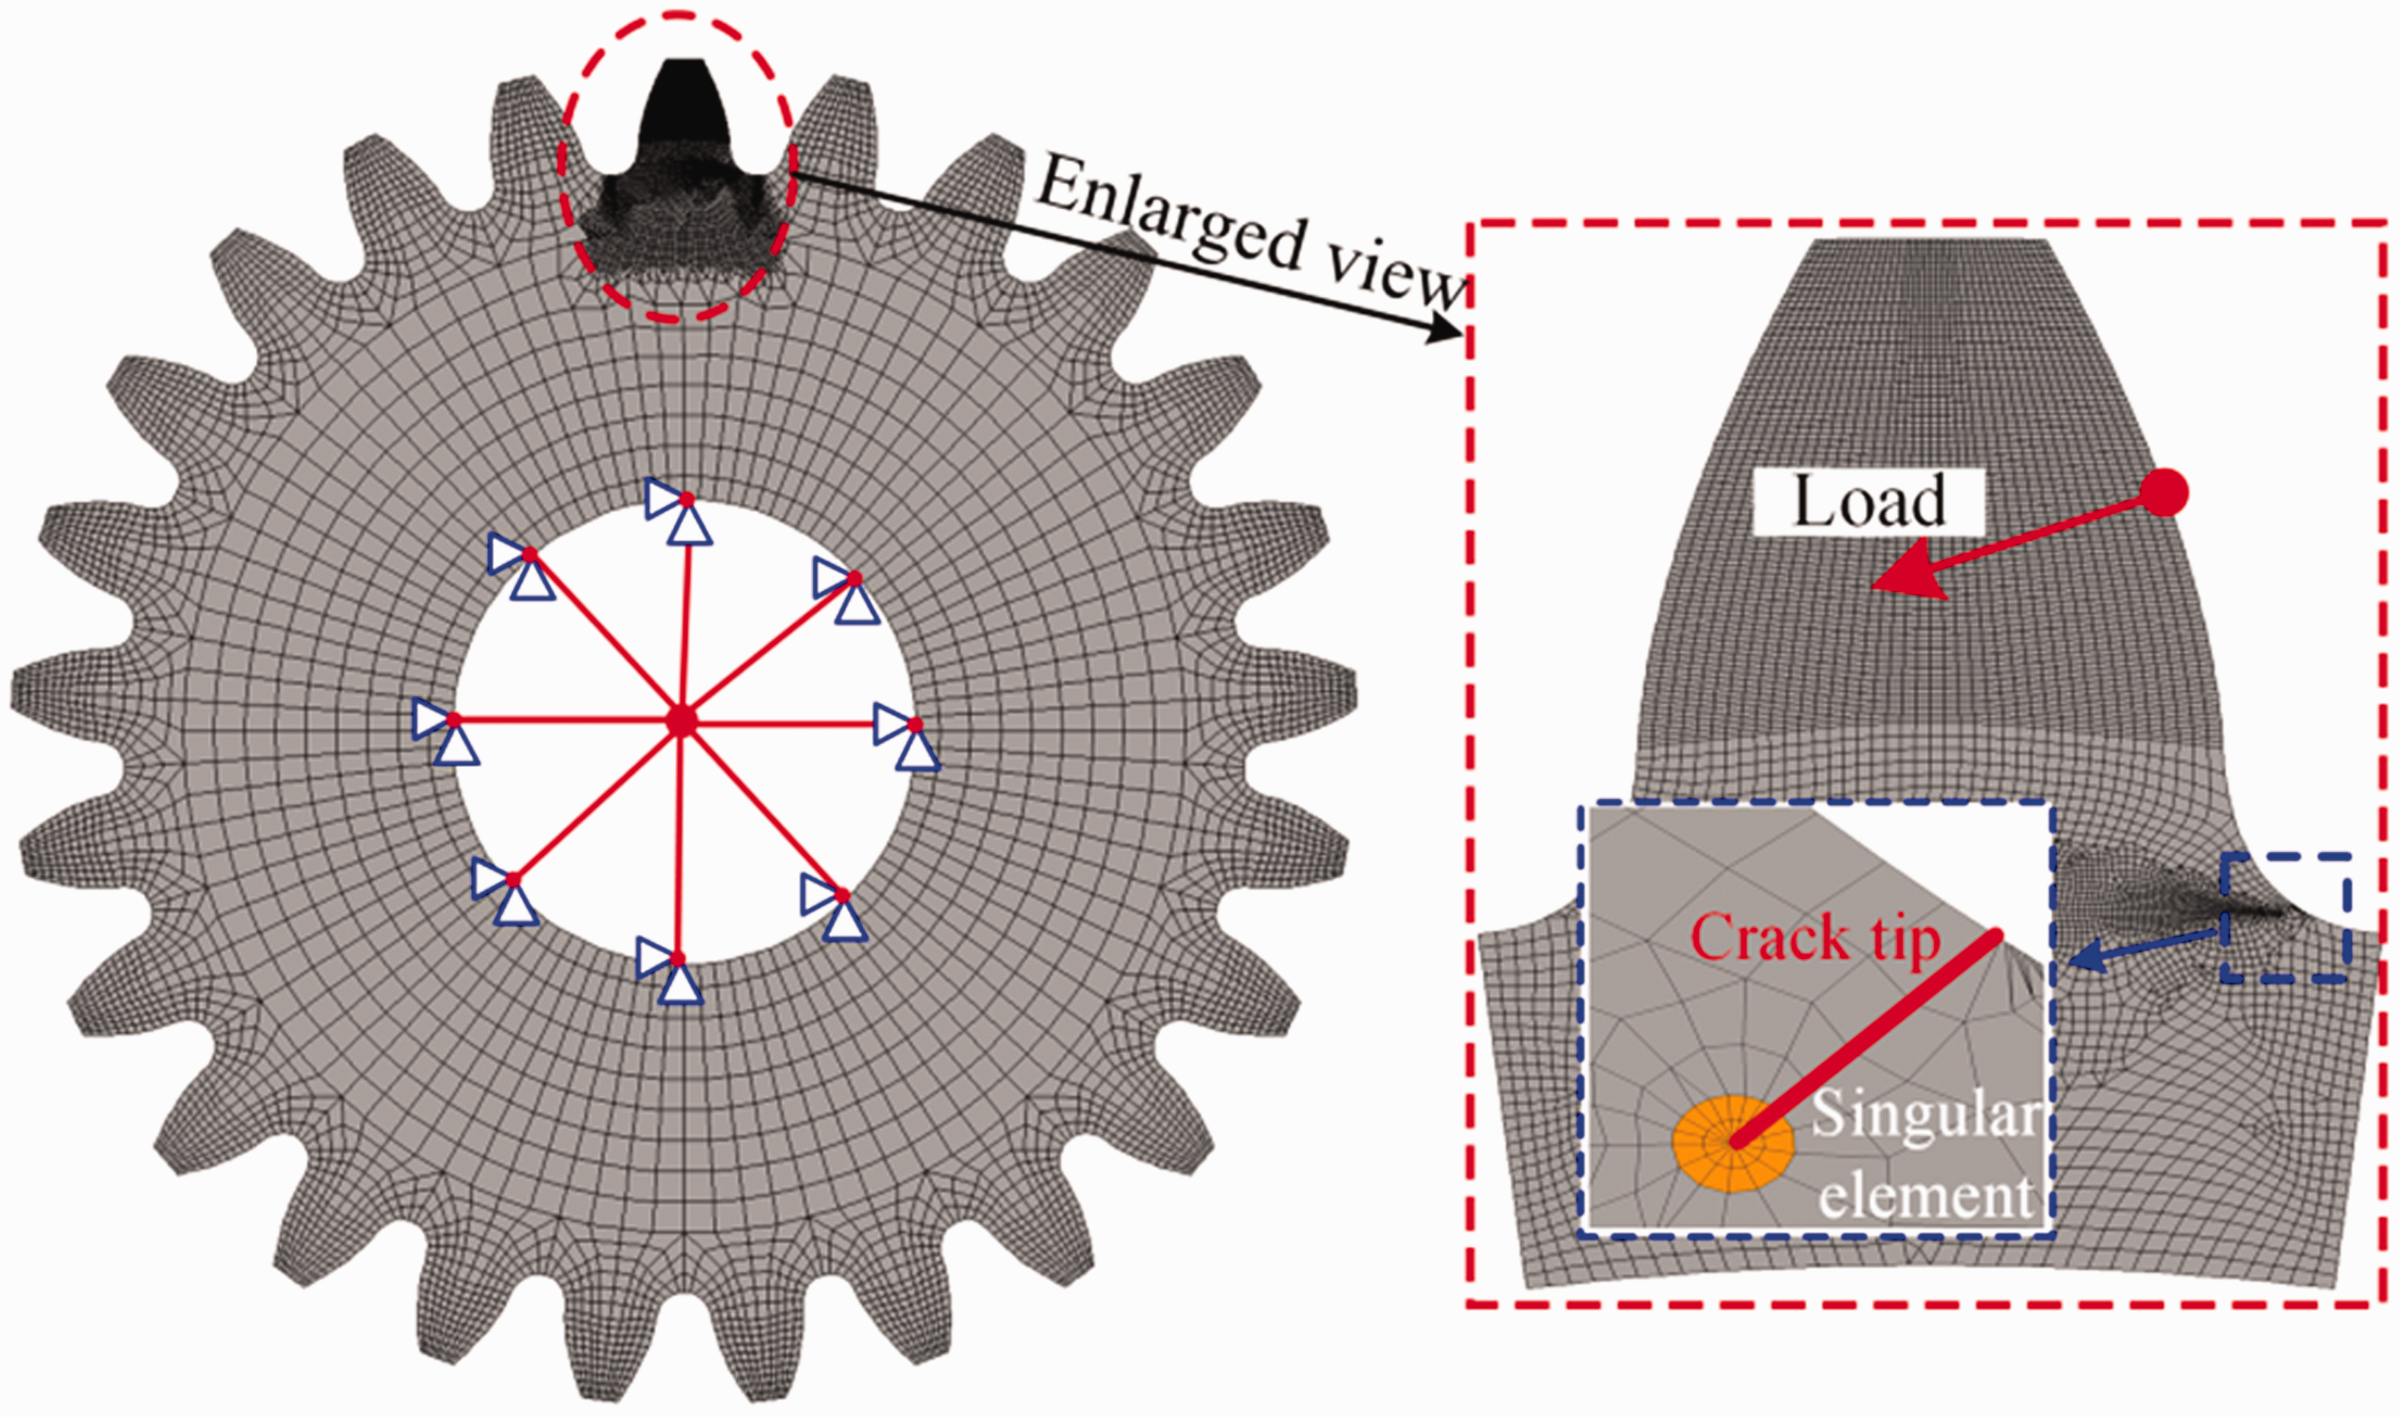
In order to consider the influence of tooth crack and fracture faults on dynamic characteristics of gear system, the flexible model of the cracked gear system is established in ADAMS software (see Figure 4). Based on the crack propagation path obtained from “Crack propagation model” section, the dynamic response of cracked gear system (crack in the driving gear) is simulated.
Considering the flexibility of shaft and bearing, the simulation model is established as shown in Figure 4. First, in ANSYS software, the driving shaft and driven shaft are established by the Beam188 element and the driving and driven gears are modeled by the Solid185 element. Meanwhile, the nodes at the holes of each gear are coupled with the each master node on the central axis (see Figure 3). Then, based on the modal neutral file (MNF) obtained from the ANSYS software, the flexible model is established in ADAMS software. The translational and rotational springs are used to simulate the bearings and the bearing stiffness is shown in Table 1. Meanwhile, the revolute joints are established at the bearing positions (see Figure 4). The contact is set between the driving gear and the driven gear, and the contact and friction parameters are listed in Table 1. The rotating motion is applied on the revolute joint 1 and a torque is exerted on the driven shaft (see Figure 4). Finally, the vertical acceleration at the bearing 2 is measured.
Finite element model in ANSYS software.
Parameters and settings in ADAMS software.
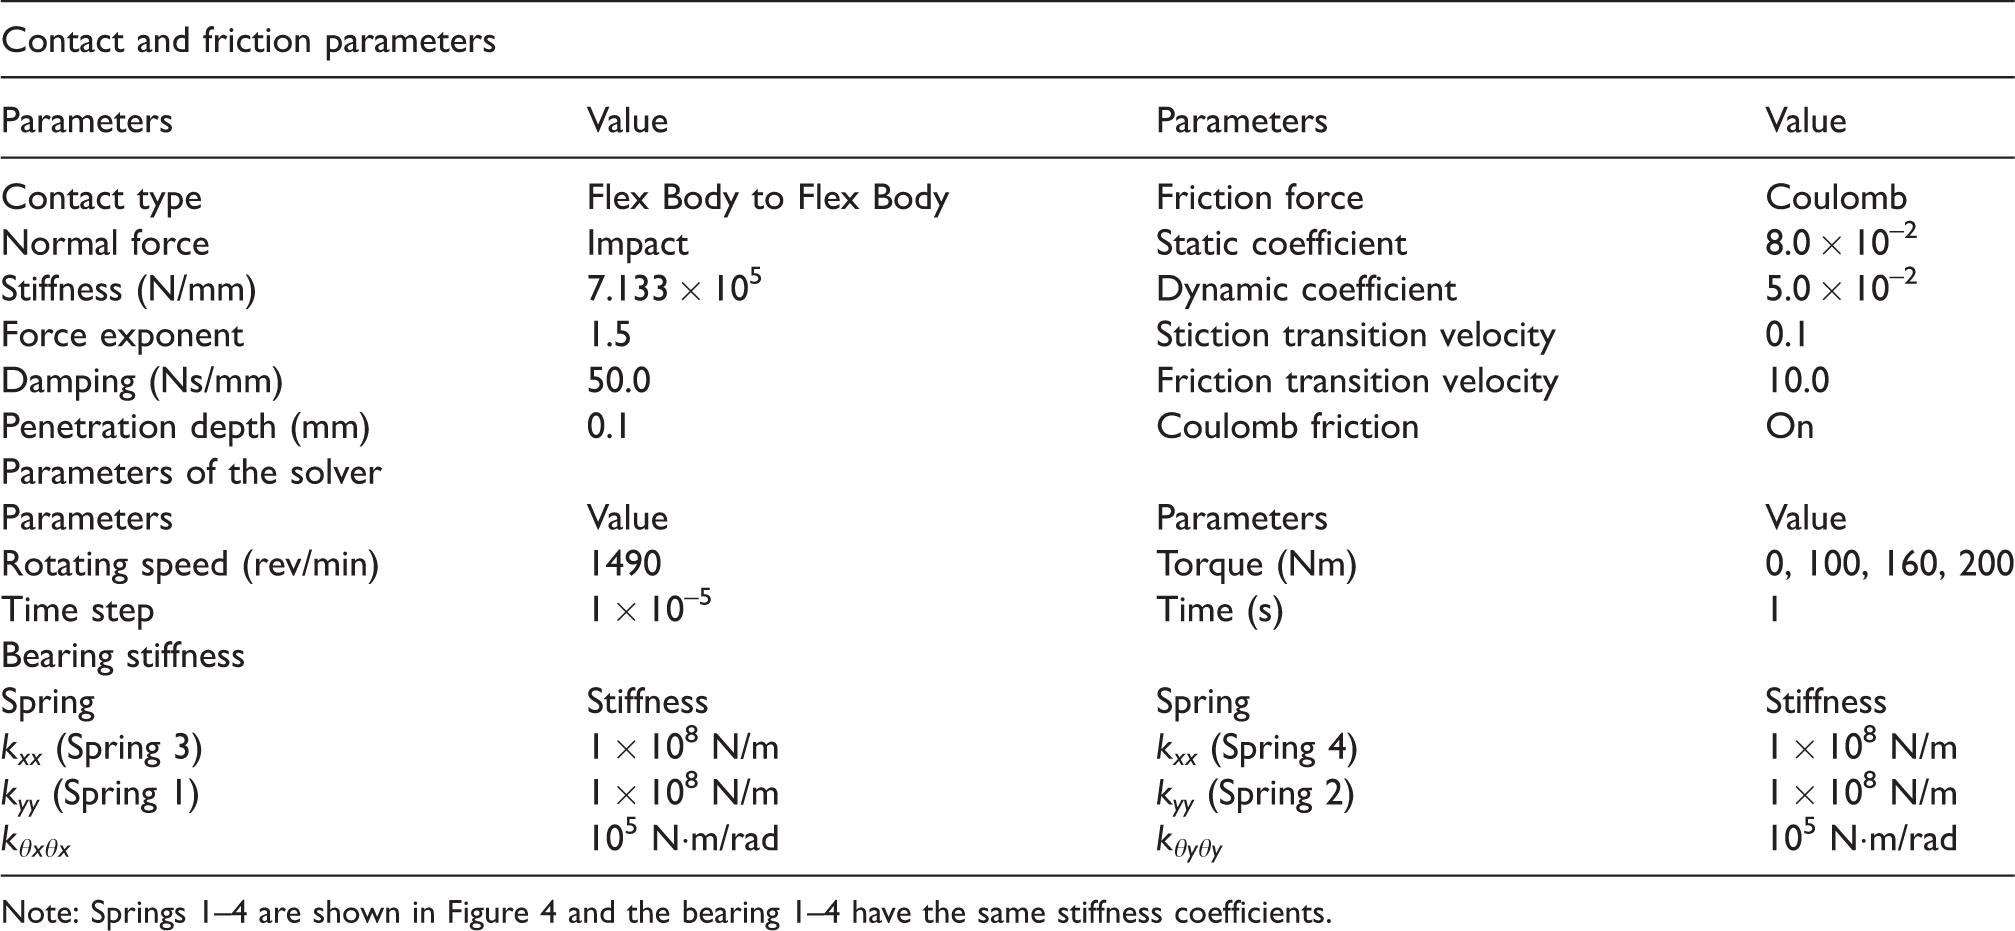
Note: Springs 1–4 are shown in Figure 4 and the bearing 1–4 have the same stiffness coefficients.
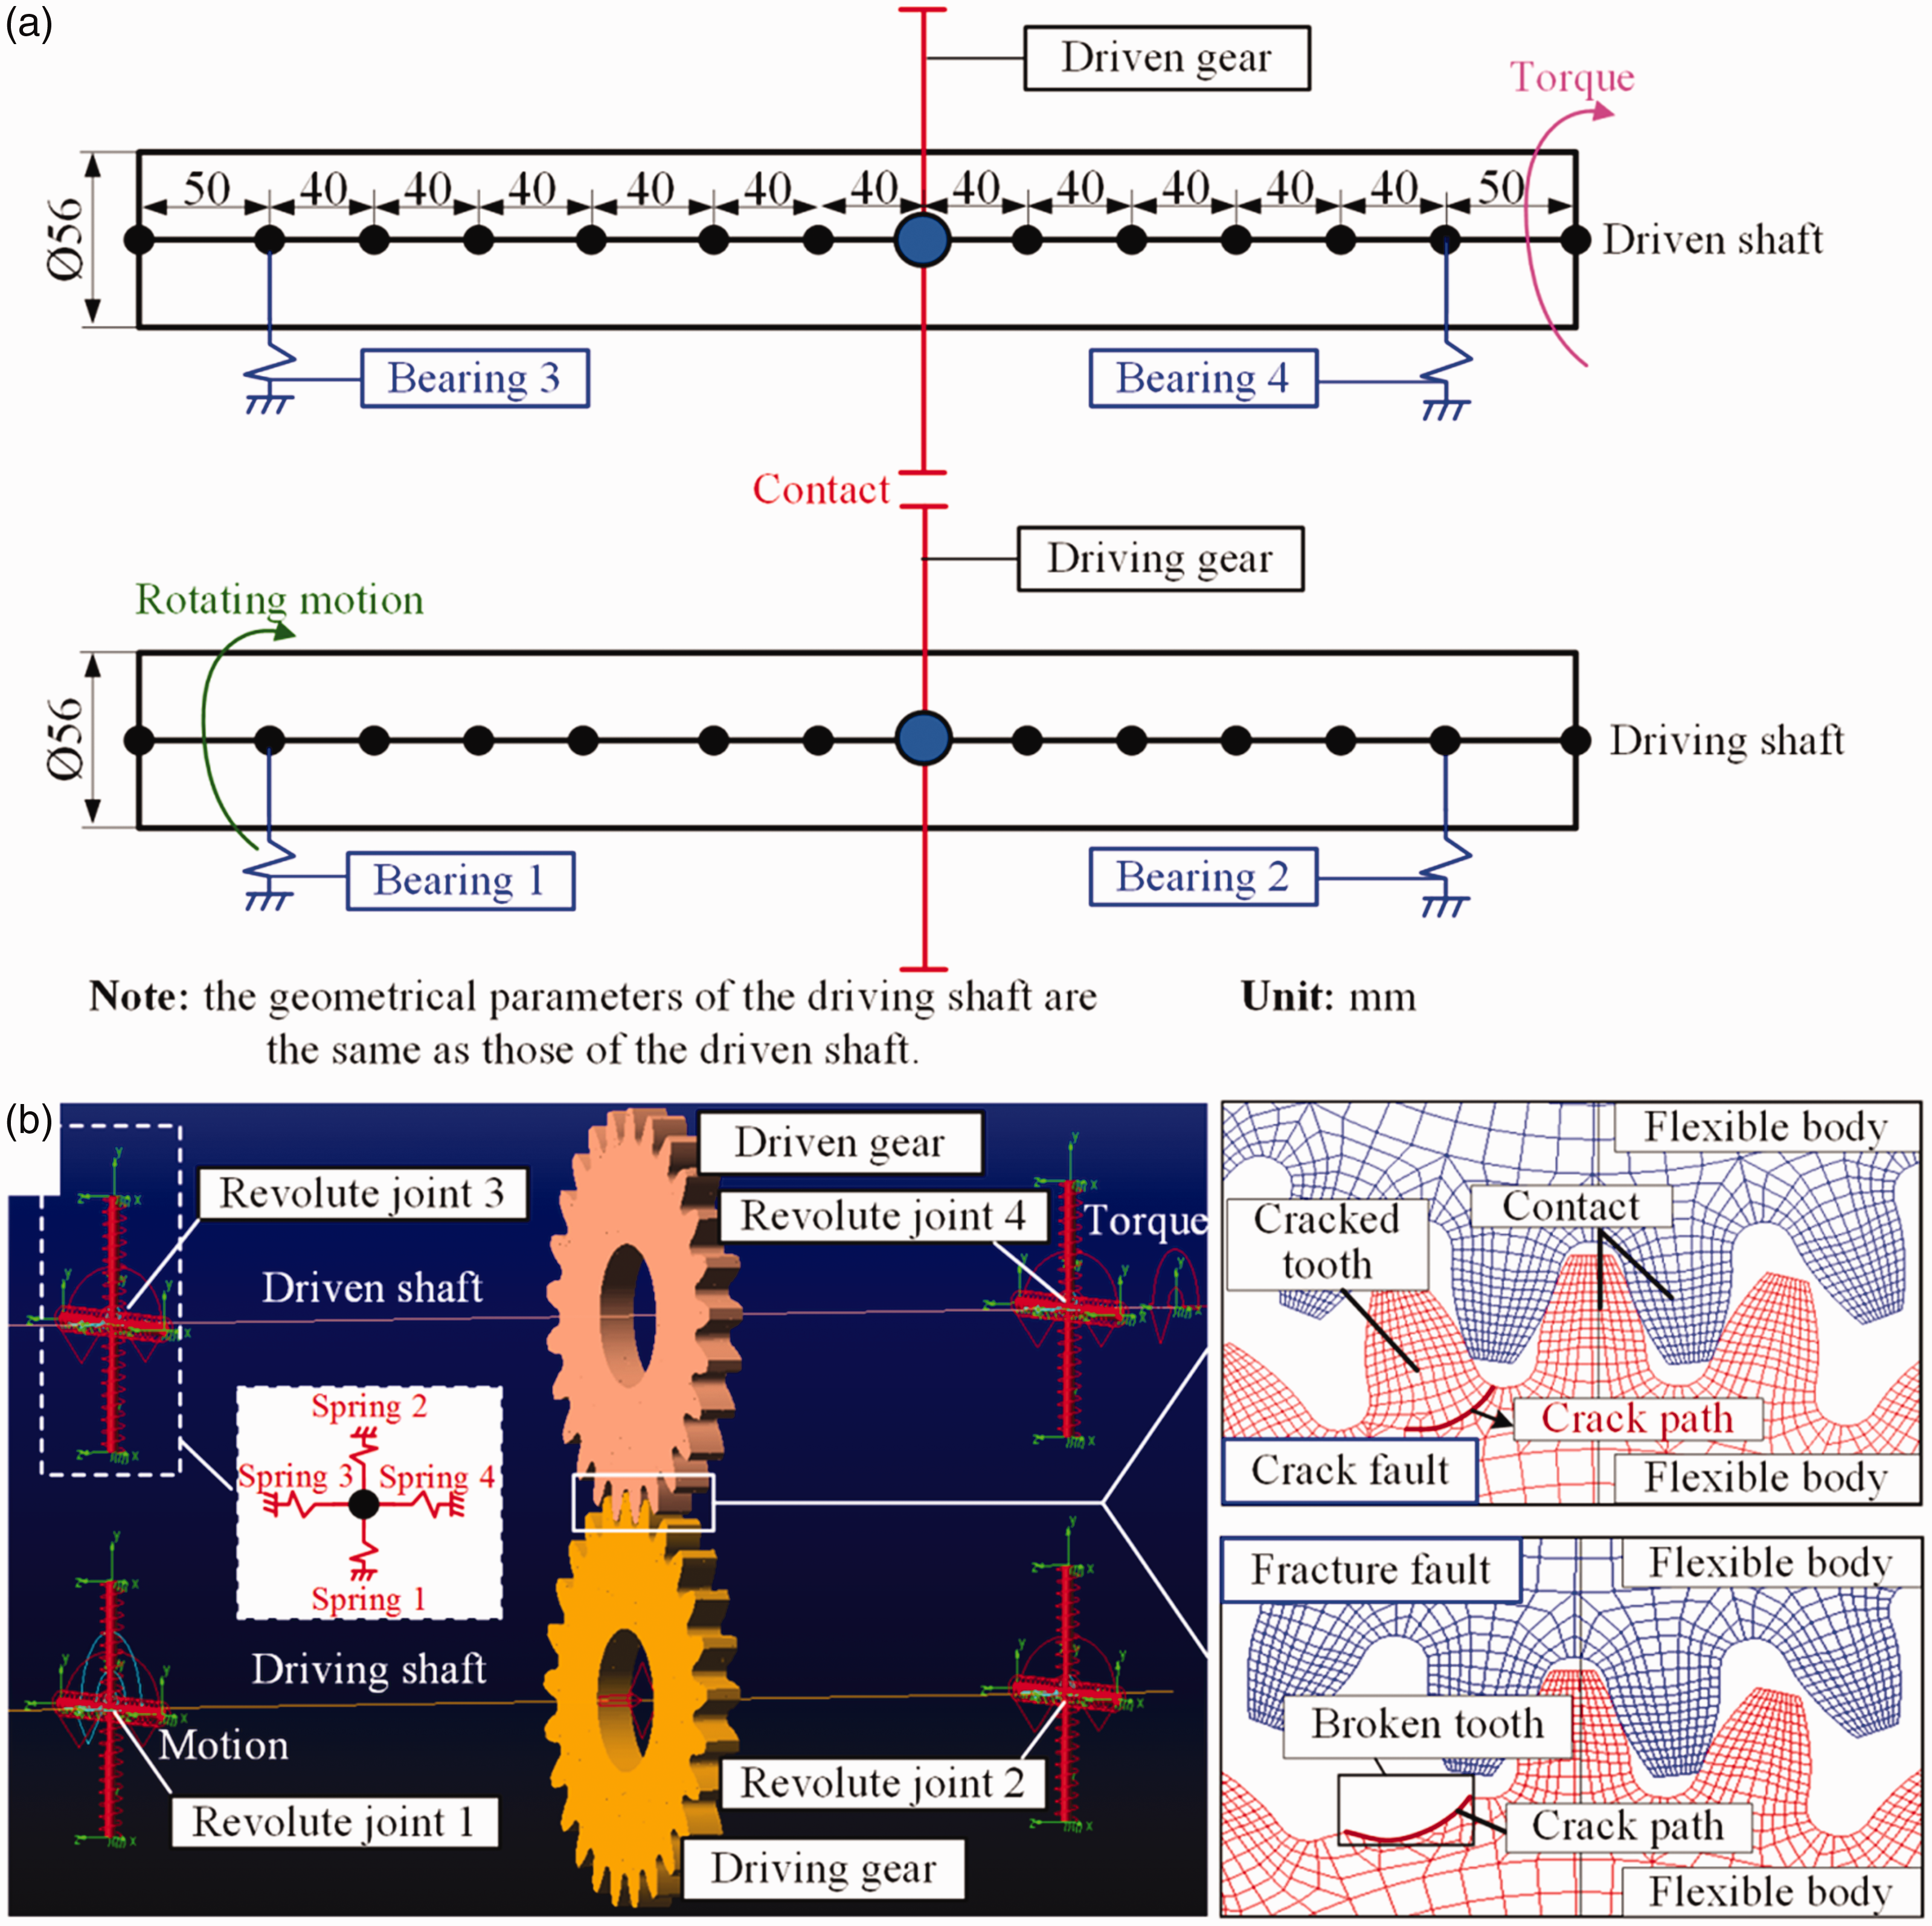
The improved multi-body dynamic model of the cracked gear system: (a) geometrical parameters of the geared rotor system and (b) dynamic model in ADAMS software.
The modeling procedure of the cracked gear dynamic system is briefly described as follows:
Step 1.1: Based on the simulated method in “Crack propagation model” section, the crack propagation paths under different crack stages are obtained.
Step 1.2: In ANSYS software, the driving shaft and driven shaft are established by the Beam188 element and the driving and driven gears are modeled by the Solid185 element. Meanwhile, considering the crack paths in Step 1.1, the MNF file of driving and driven gears with shaft is exported.
Step 2.1: The MNF of the driving and driven gears are imported into ADAMS software. Then, the revolute joints are set at the bearing position. Meanwhile, the rotating motion is applied on the revolute joint 1 (see Figure 4(b)) and a torque is exerted on the shaft of the driven gear.
Step 2.2: The contact pair between the driving and driven gears are established and the contact and friction parameters are listed in Table 1.
Experimental measurement
Introduction of the test rig
In this paper, the power flow enclosed gear rotary test machine 42 (see Figure 4) is employed to carry out the vibration experiment of spur gears with crack and tooth fracture faults. For the spur gears, the spray lubrication is applied to ensure that the gears are well lubricated. The loading device is shown in Figure 4(a) and the torque can be stored in the system. The rated speed of the test machine is 1490 rev/min. It is noted that the transmission ratio of the gear pair is 1.
Measurement of vibration signal
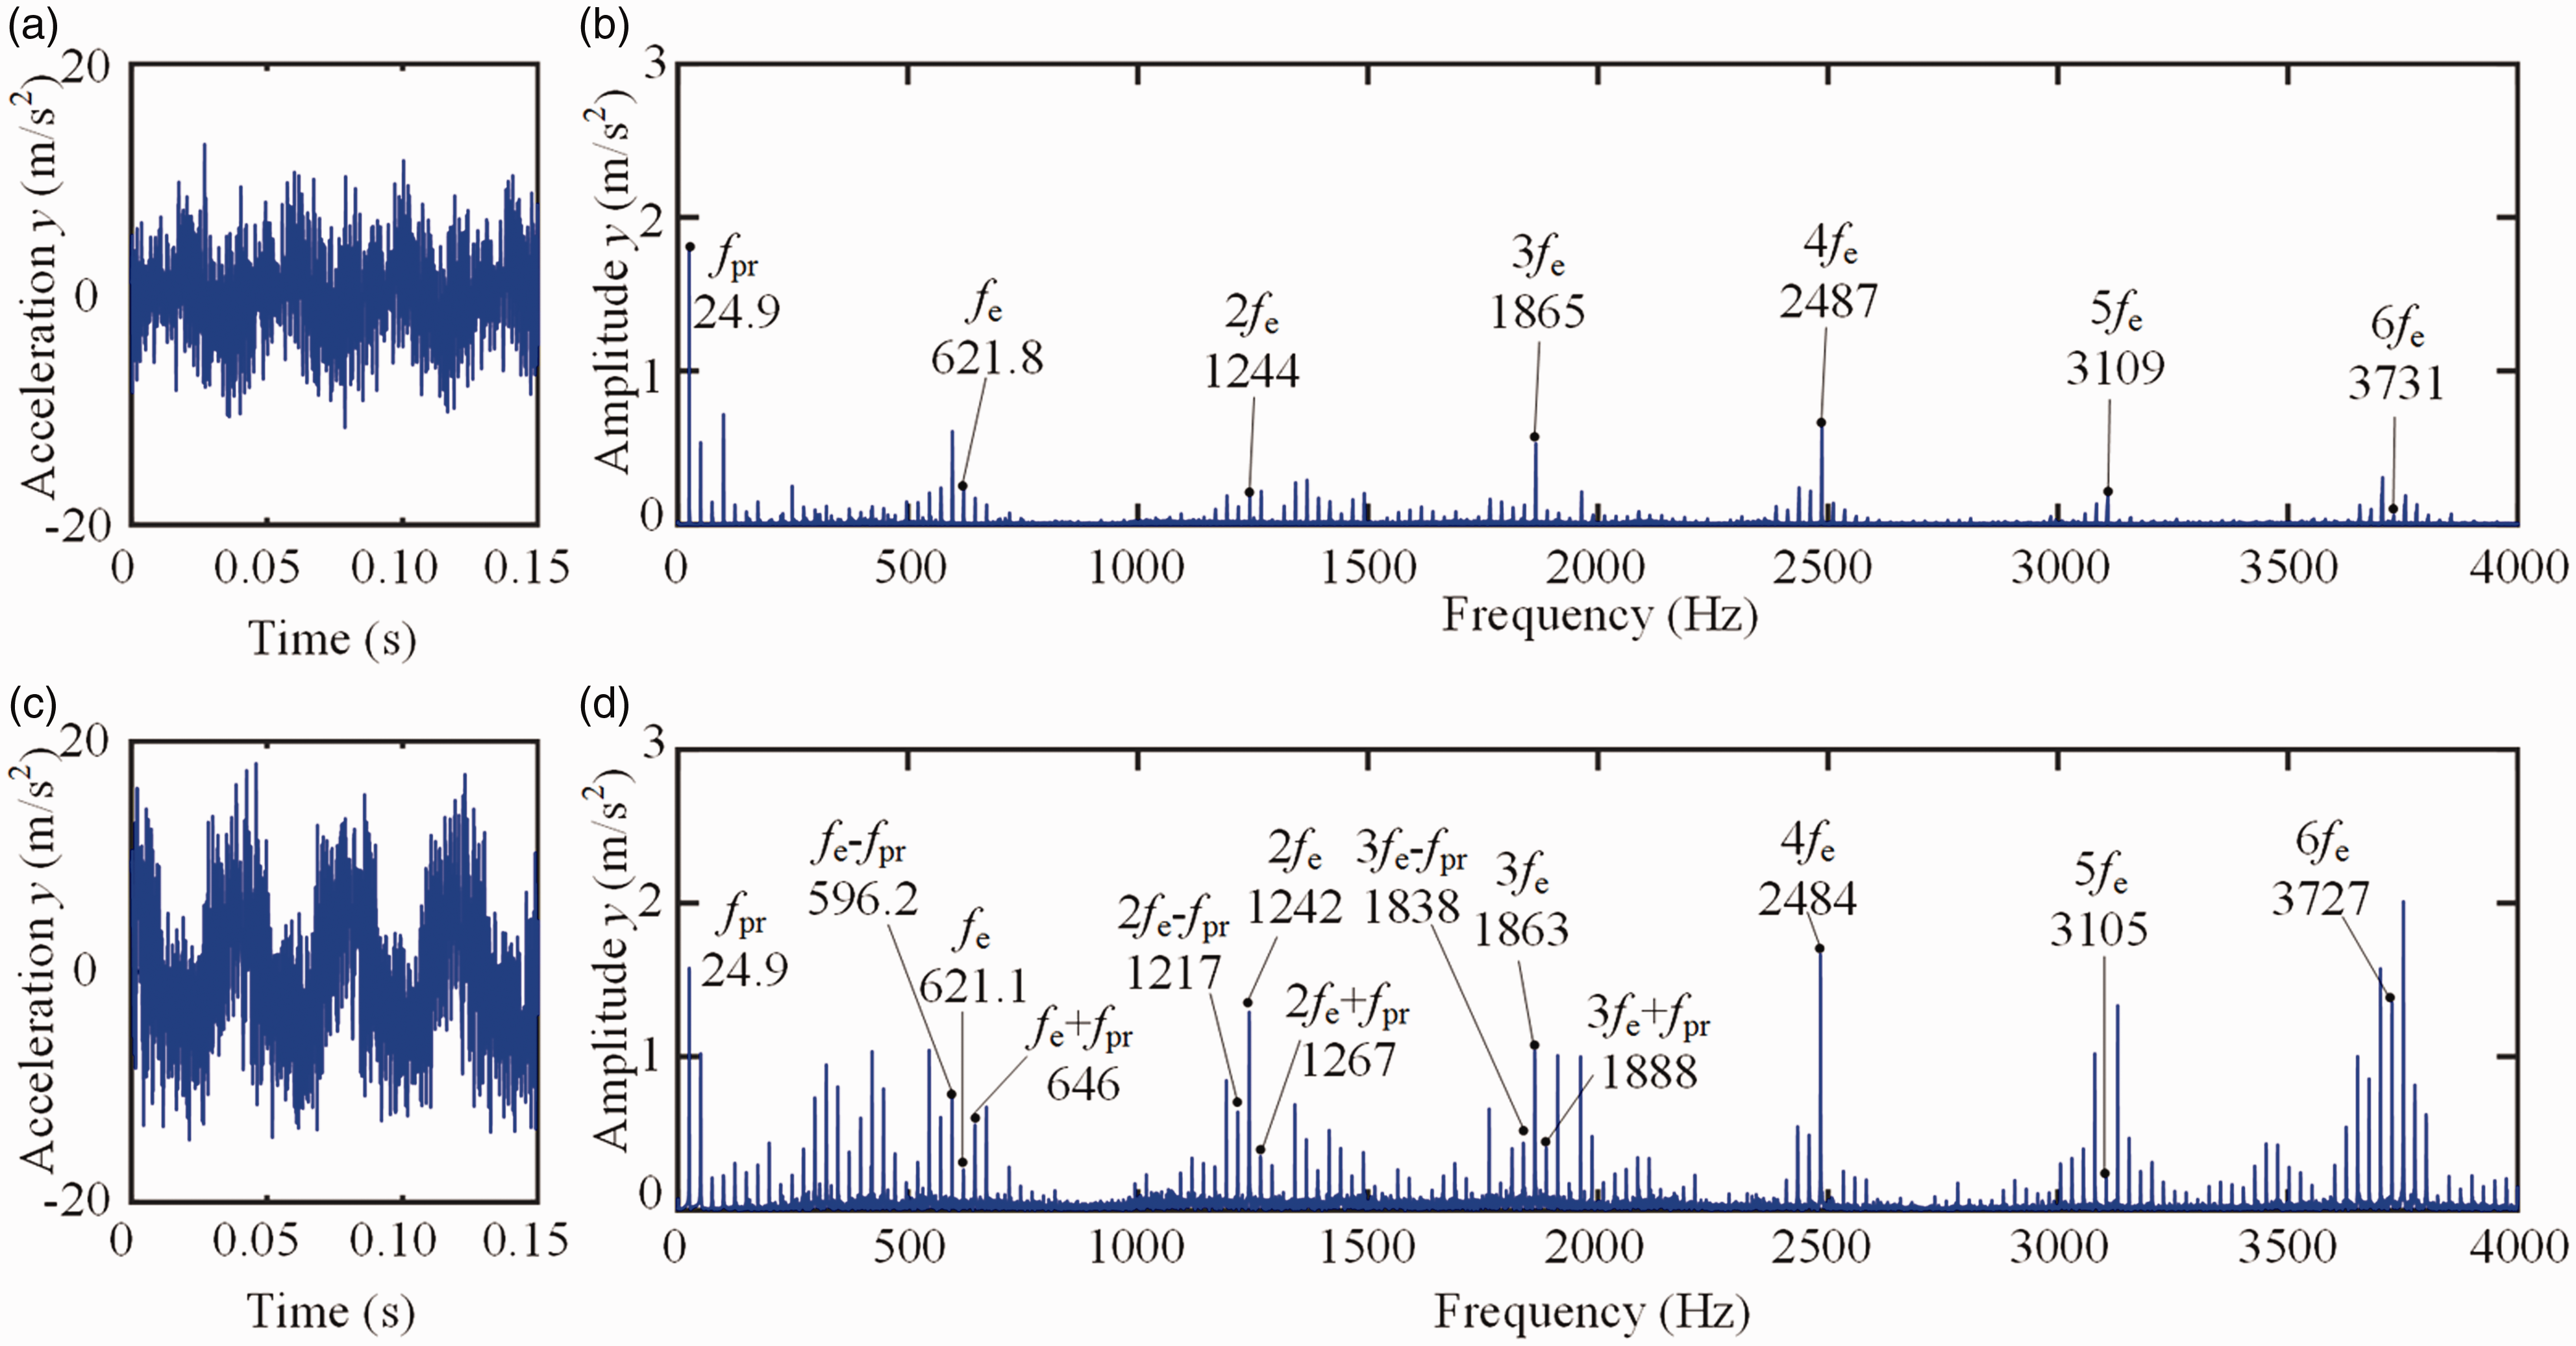
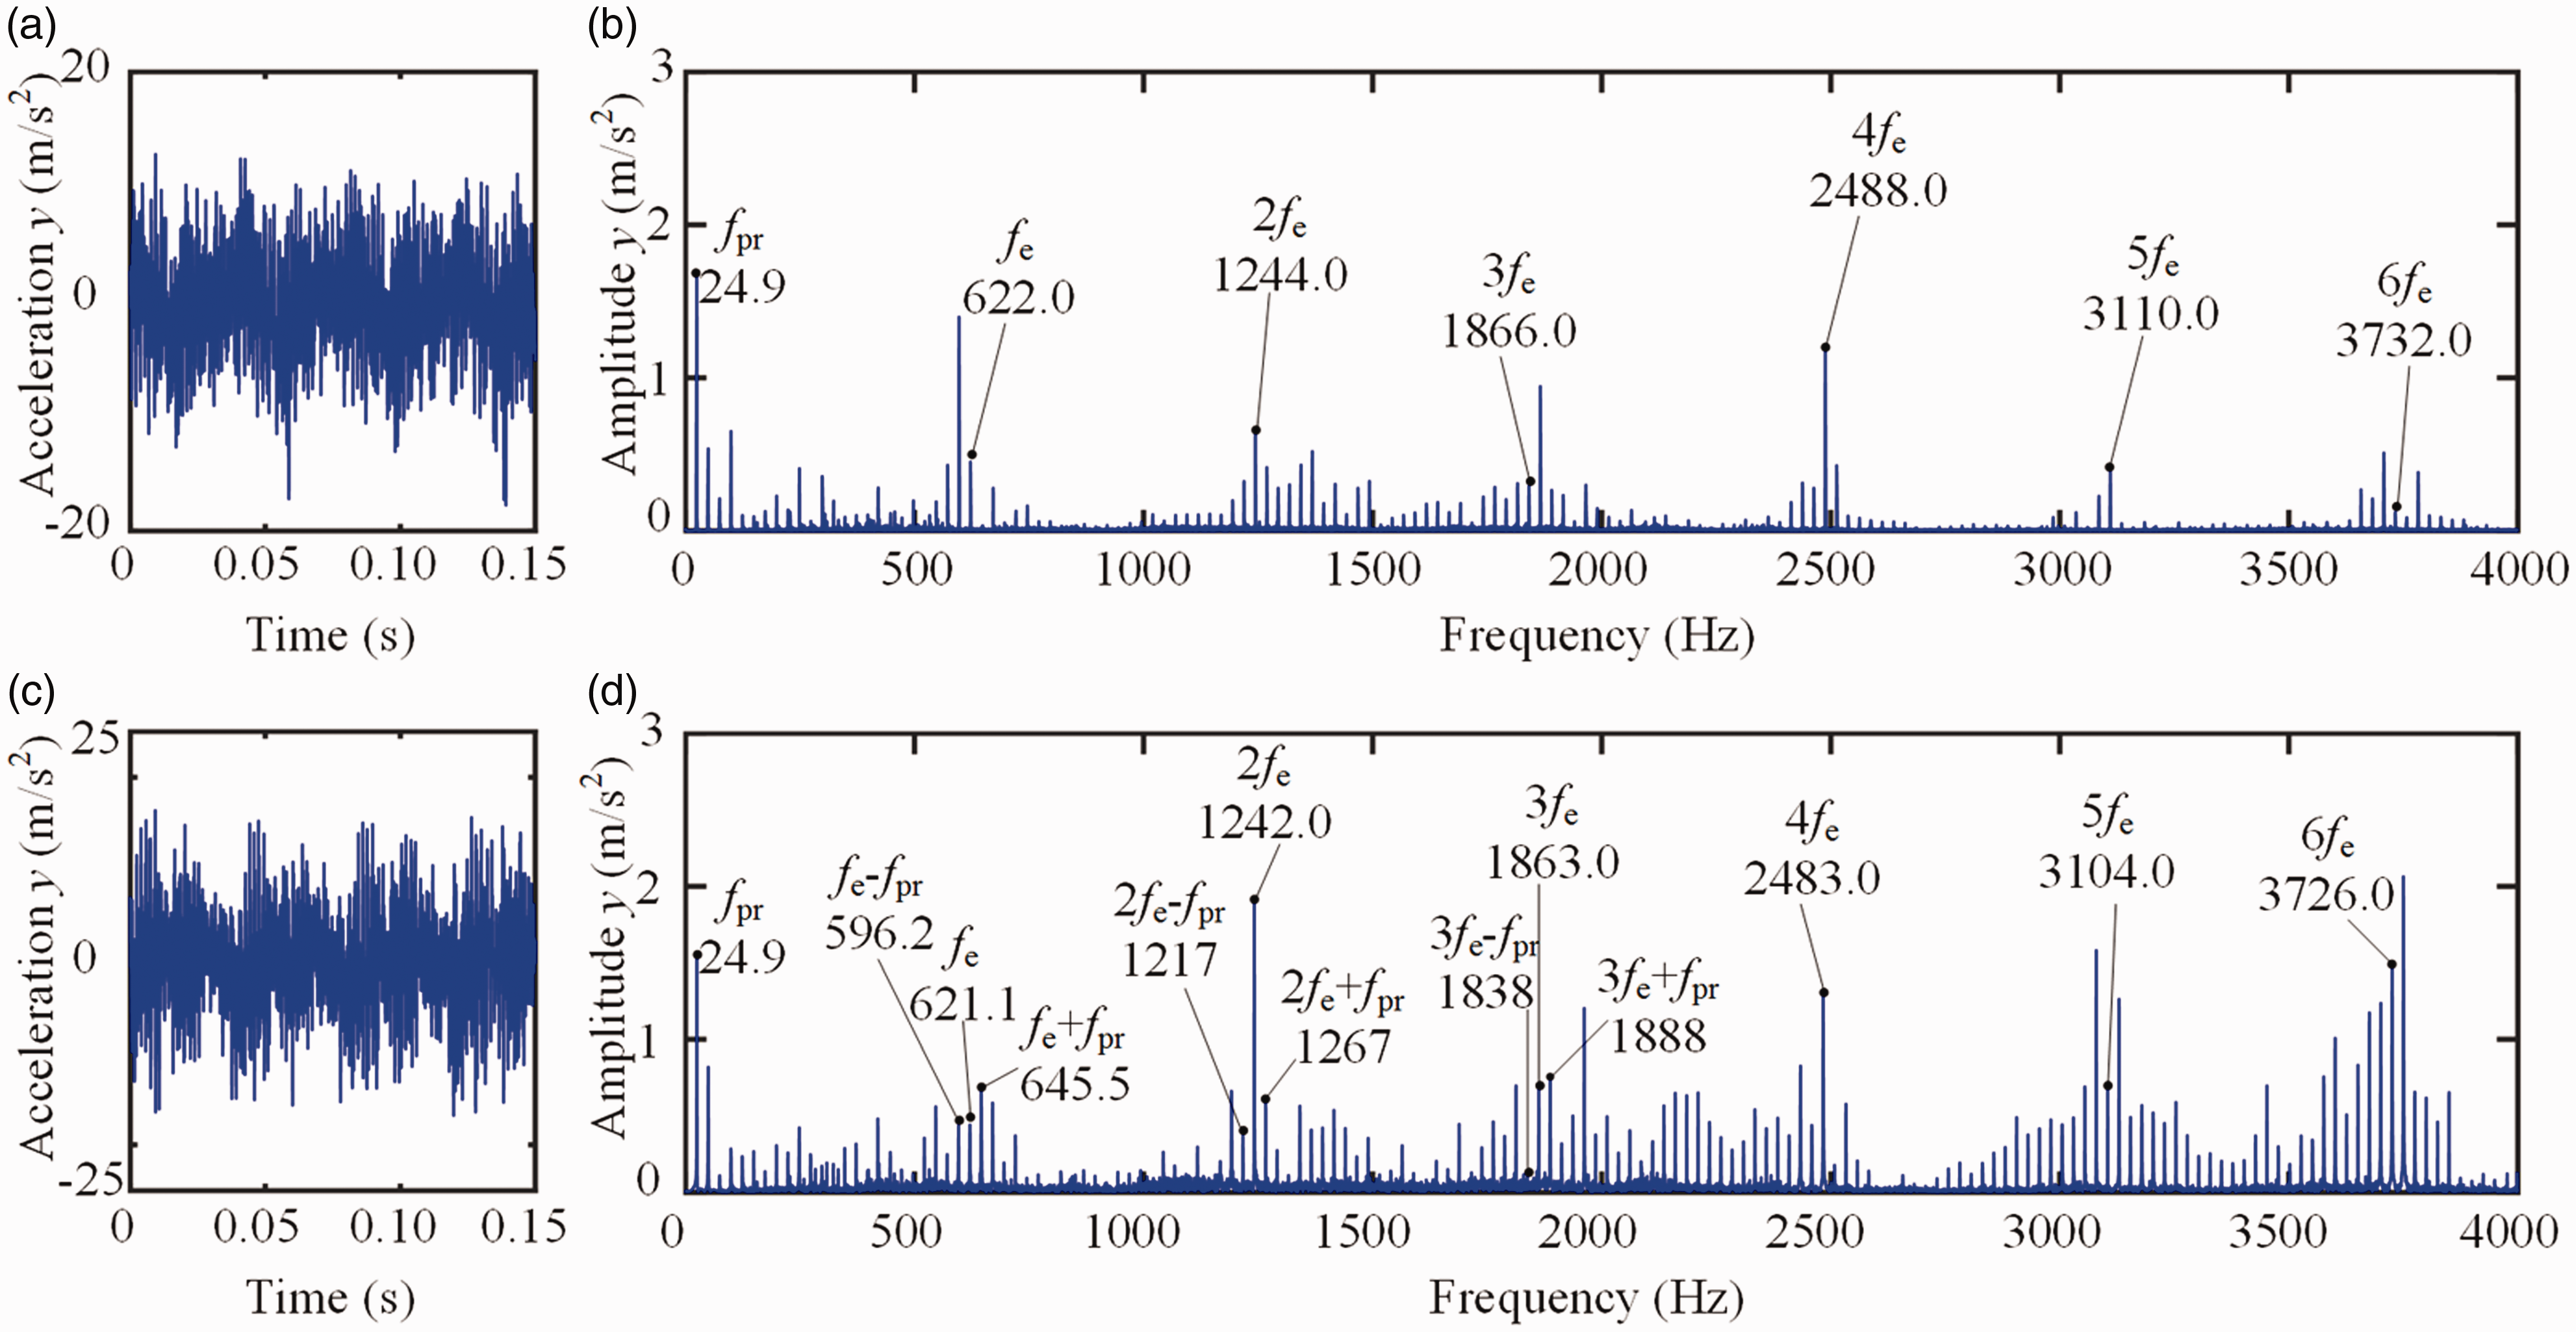
In this experiment, the vibration signals of cracked gear systems under different torques, crack lengths, and tooth fracture fault are measured by acceleration sensors (see Figure 5(b)). The dynamic signal analyzer is YE6232B, the sample frequency is 8000 Hz, and the sensitivity of acceleration sensor is 2 mV/g. Because the cracked gear was used as the driving gear in this experiment, the vibration signal of the driving shaft was mainly measured. It should be noted that the vertical vibration can reflect the vibration characteristics better, so the vertical direction signal is mainly adopted in the later analysis. According to the speed of the motor (1490 rev/min), the rotating frequency of the driving shaft fpr is about 24.83 Hz and the gear meshing frequency fe is about 620.8 Hz.
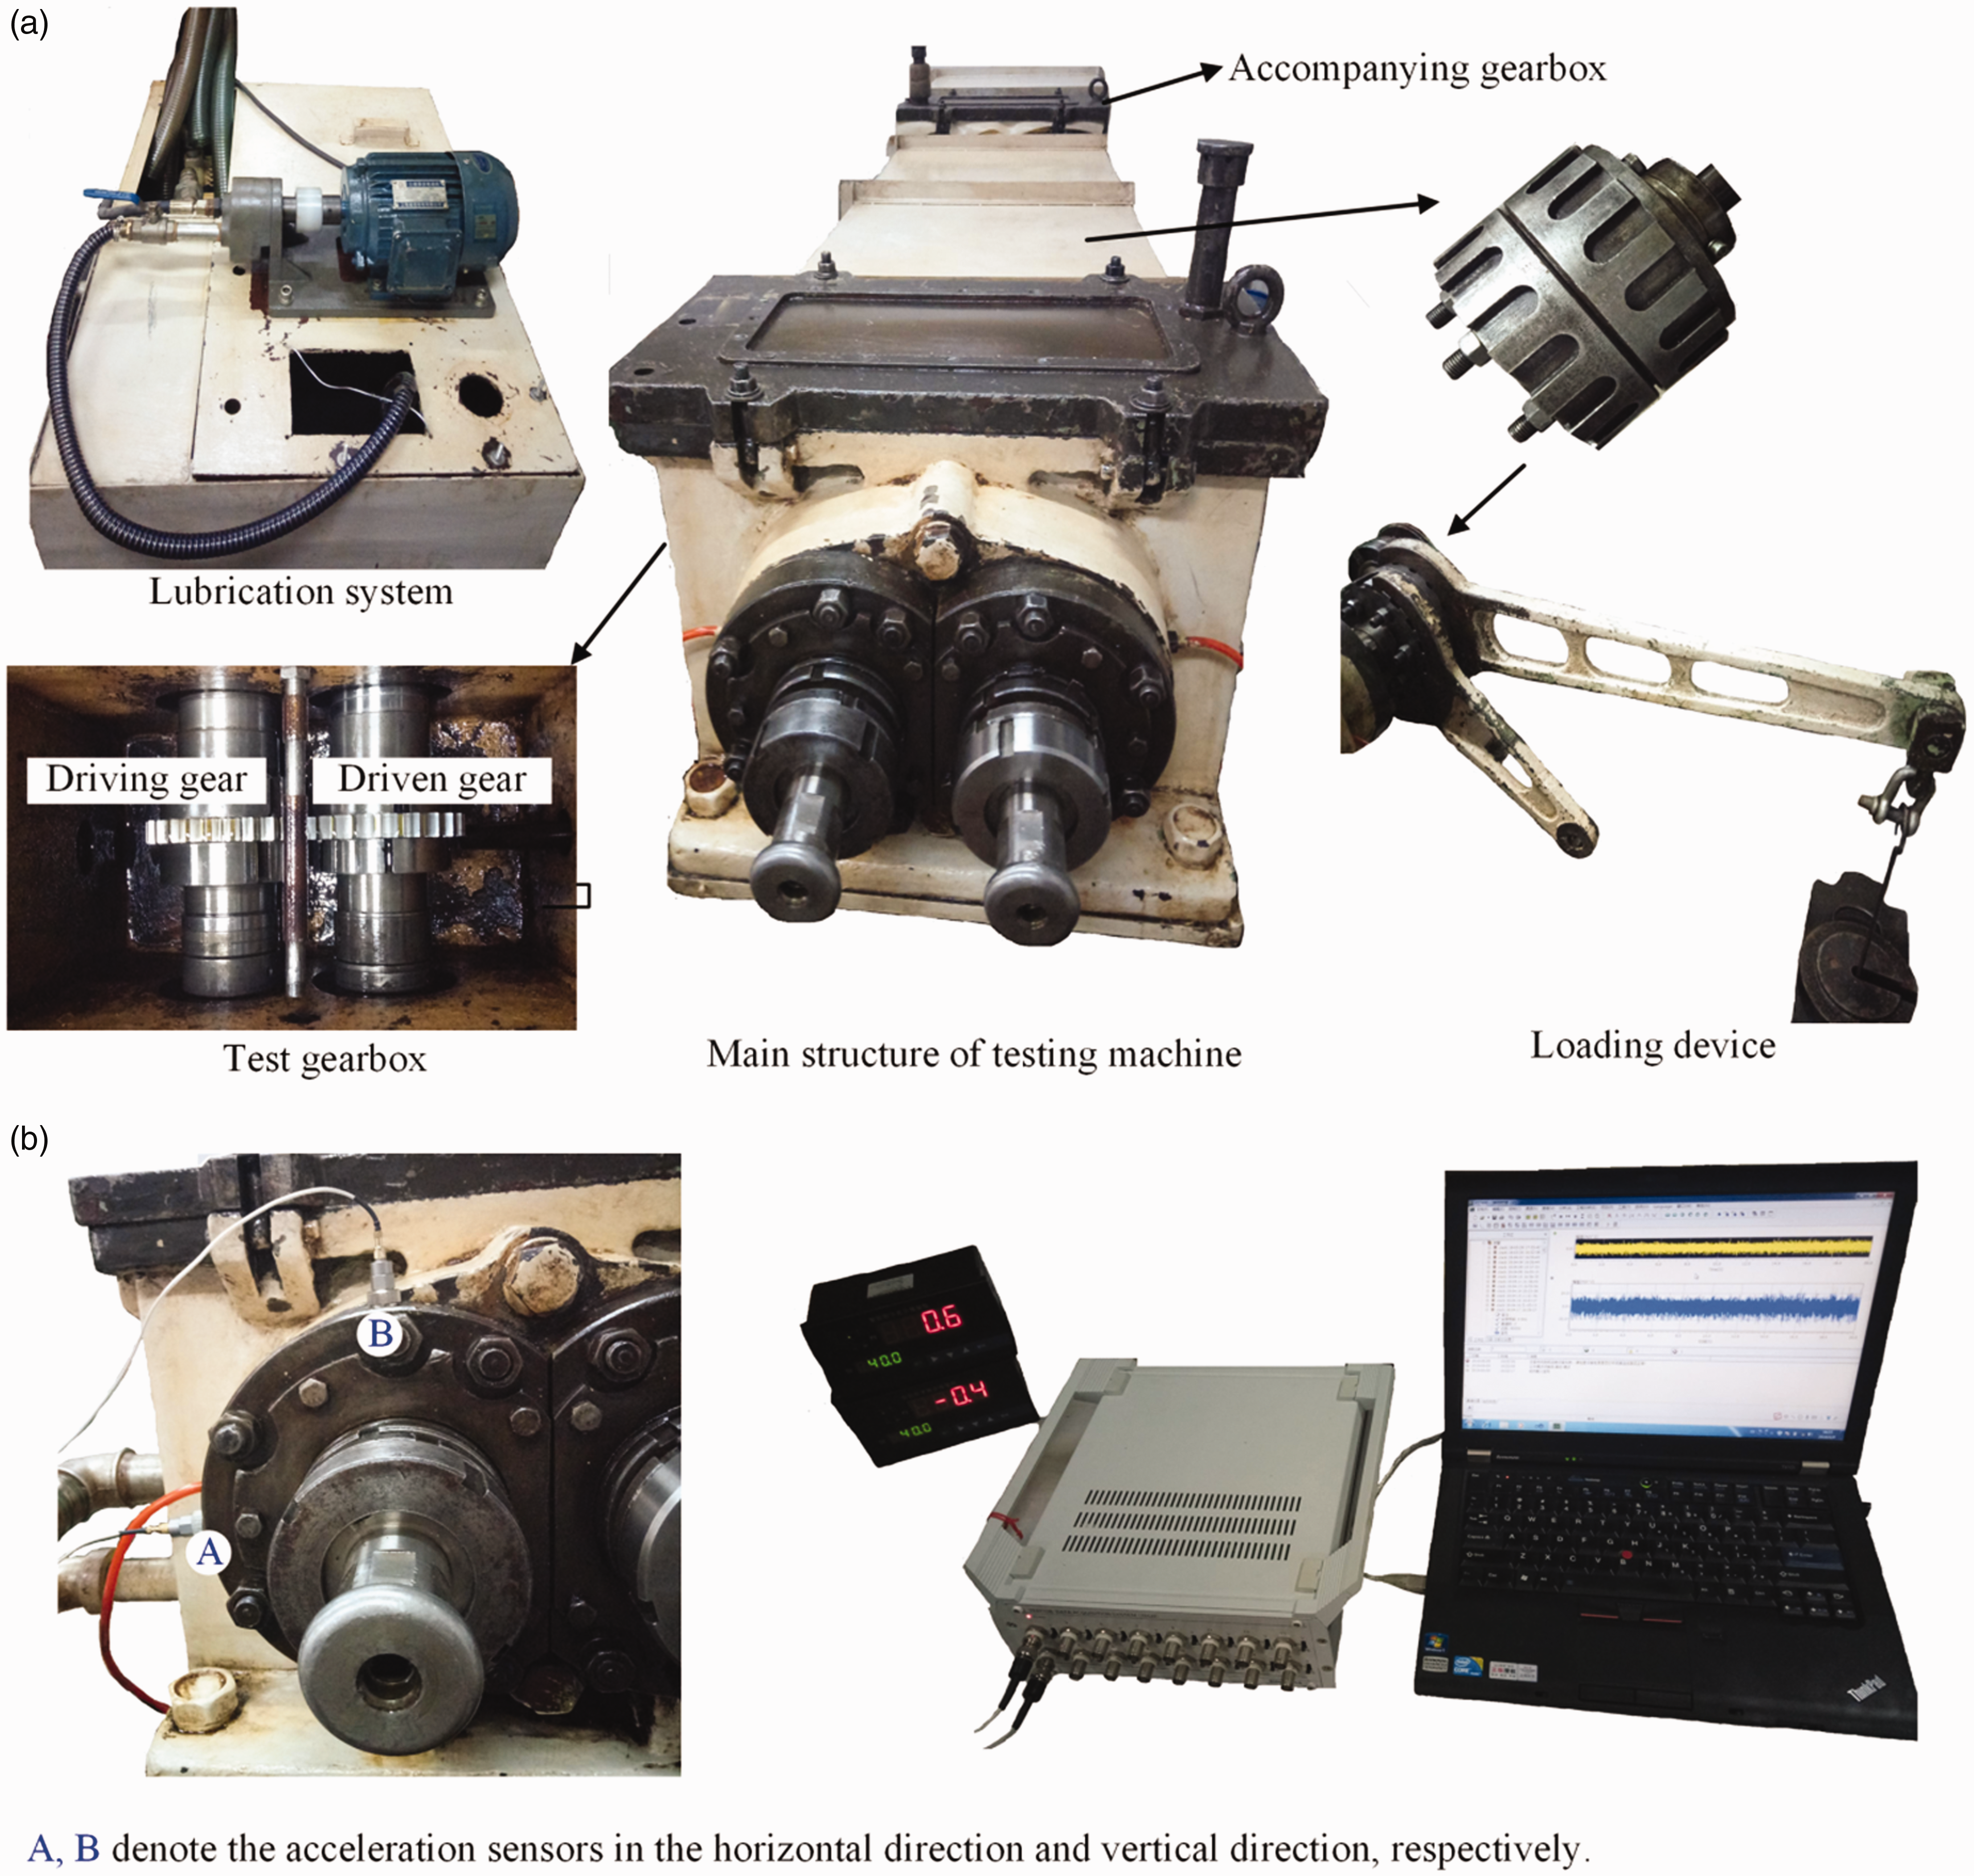
Experimental equipment: (a) power flow enclosed gear rotary test machine and (b) signal monitoring device.
Result and discussion
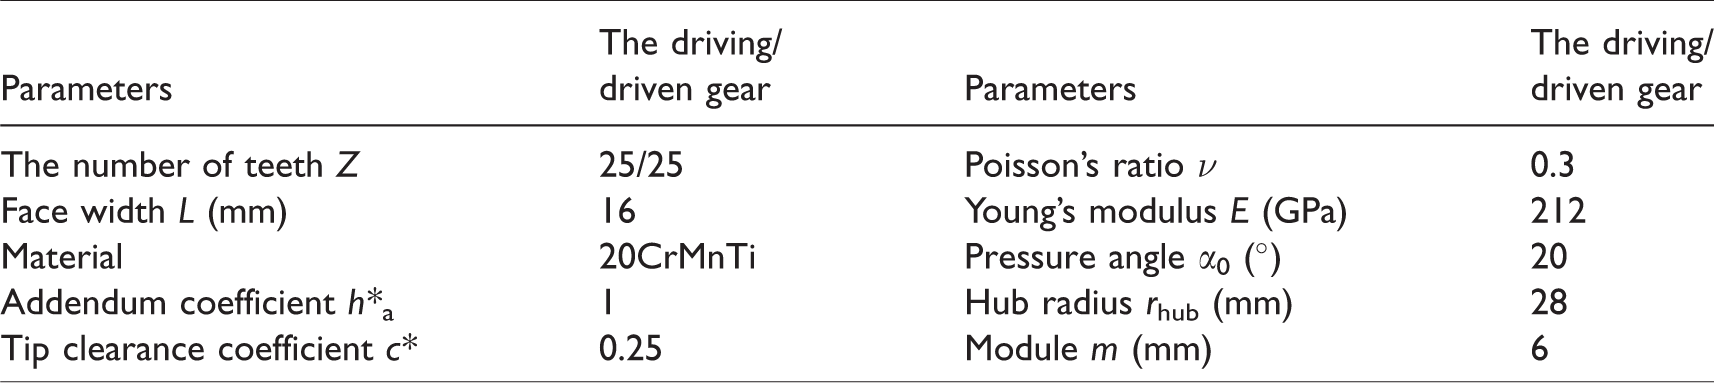
In this paper, the parameters of the test gear are listed in Table 2 and the pictures of test gears are shown in Figure 6. First, the crack propagation path obtained from the simulation model is verified by the experimental results. And using the simulated and experimental methods, the vibration signals of spur gears with crack are measured under different torques (0, 100, 160, and 200 N·m). In order to analyze the vibration characteristic of cracked gear under different torques, some statistical indictors are applied. Then, the effects of different crack lengths on dynamic response are analyzed by the simulated method. Finally, the fault features of spur gears under crack and tooth fracture faults are compared using the time-domain and frequency-domain results and the instantaneous energy.
Basic parameters of the spur gear.
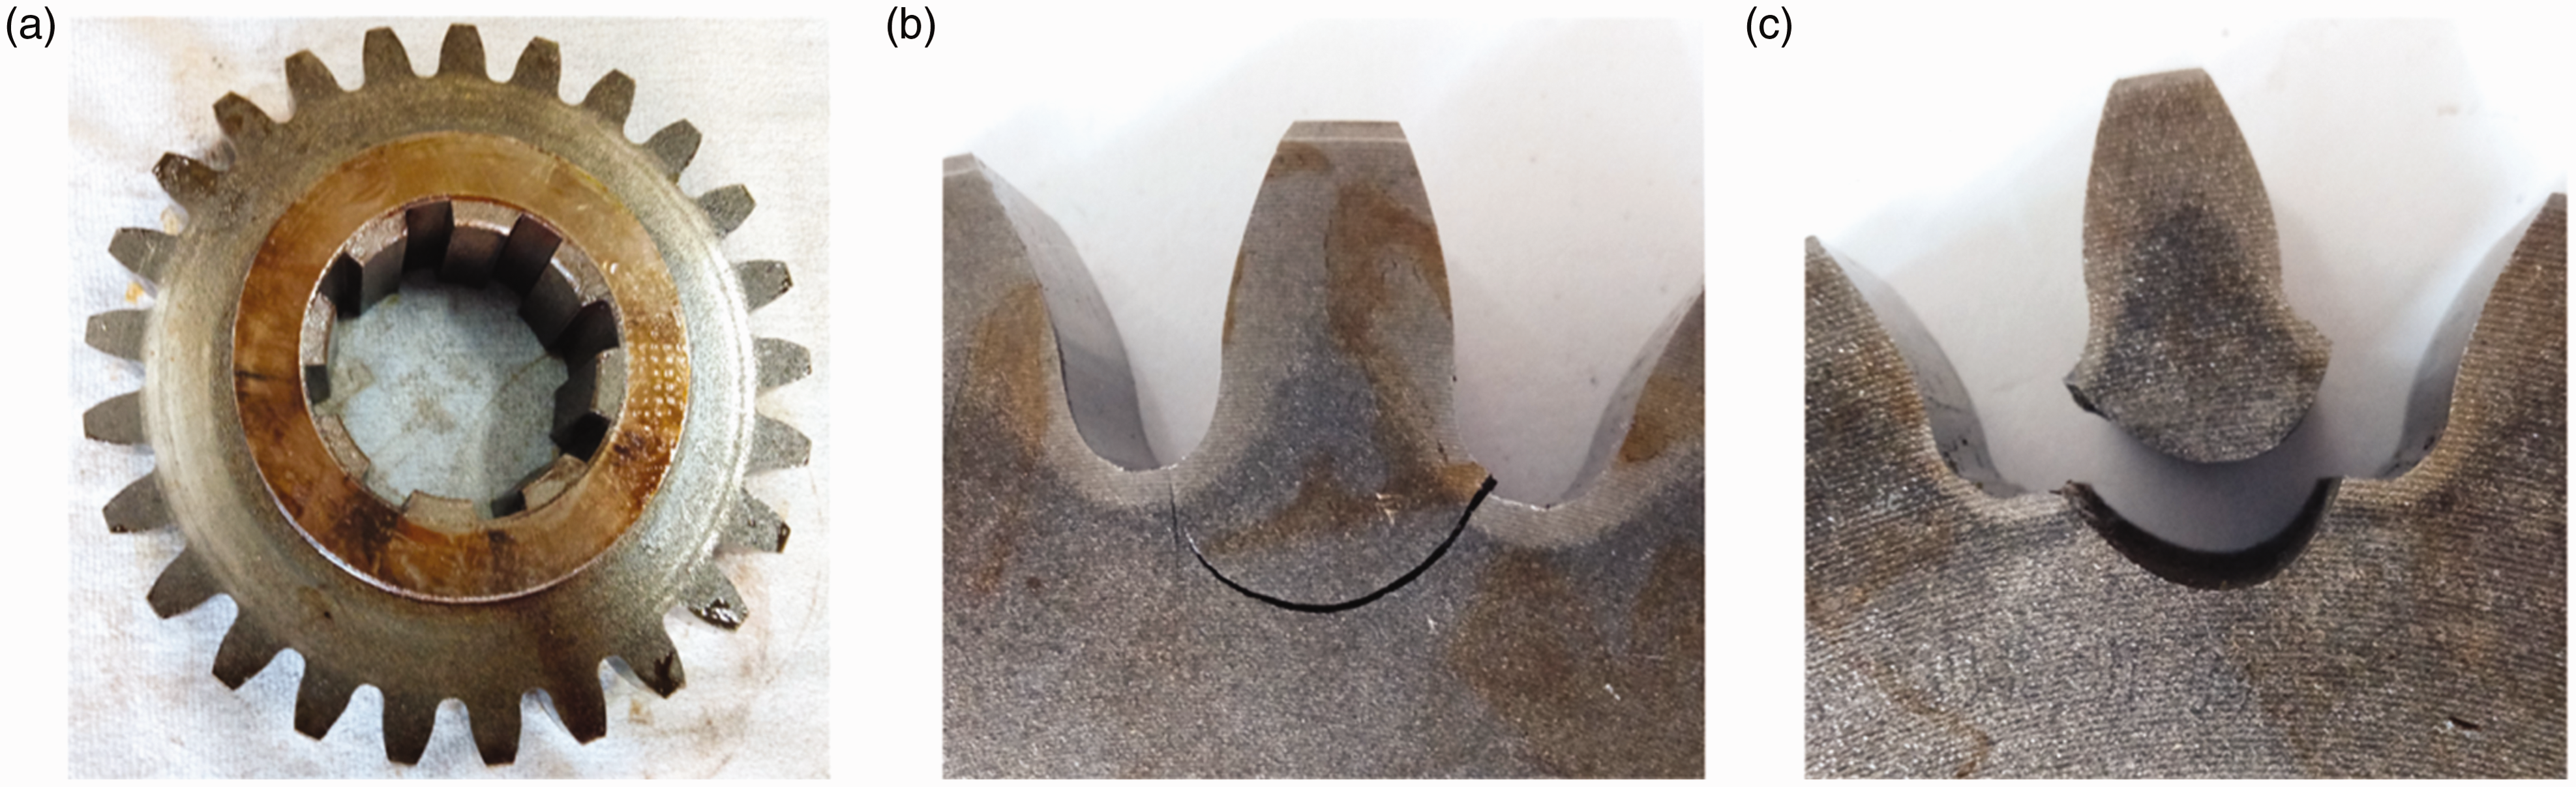
Schematic of the experimental gear: (a) experimental gear; (b) cracked tooth; (c) broken tooth.
In order to verify the correctness of the simulated crack path, the crack path obtained from the proposed method in “Crack propagation model” section is compared with the experimental results (see Figure 7). It is obvious that the crack paths obtained from the two methods are similar, which verifies the accuracy of the proposed method for simulating the crack propagation paths of spur gears.
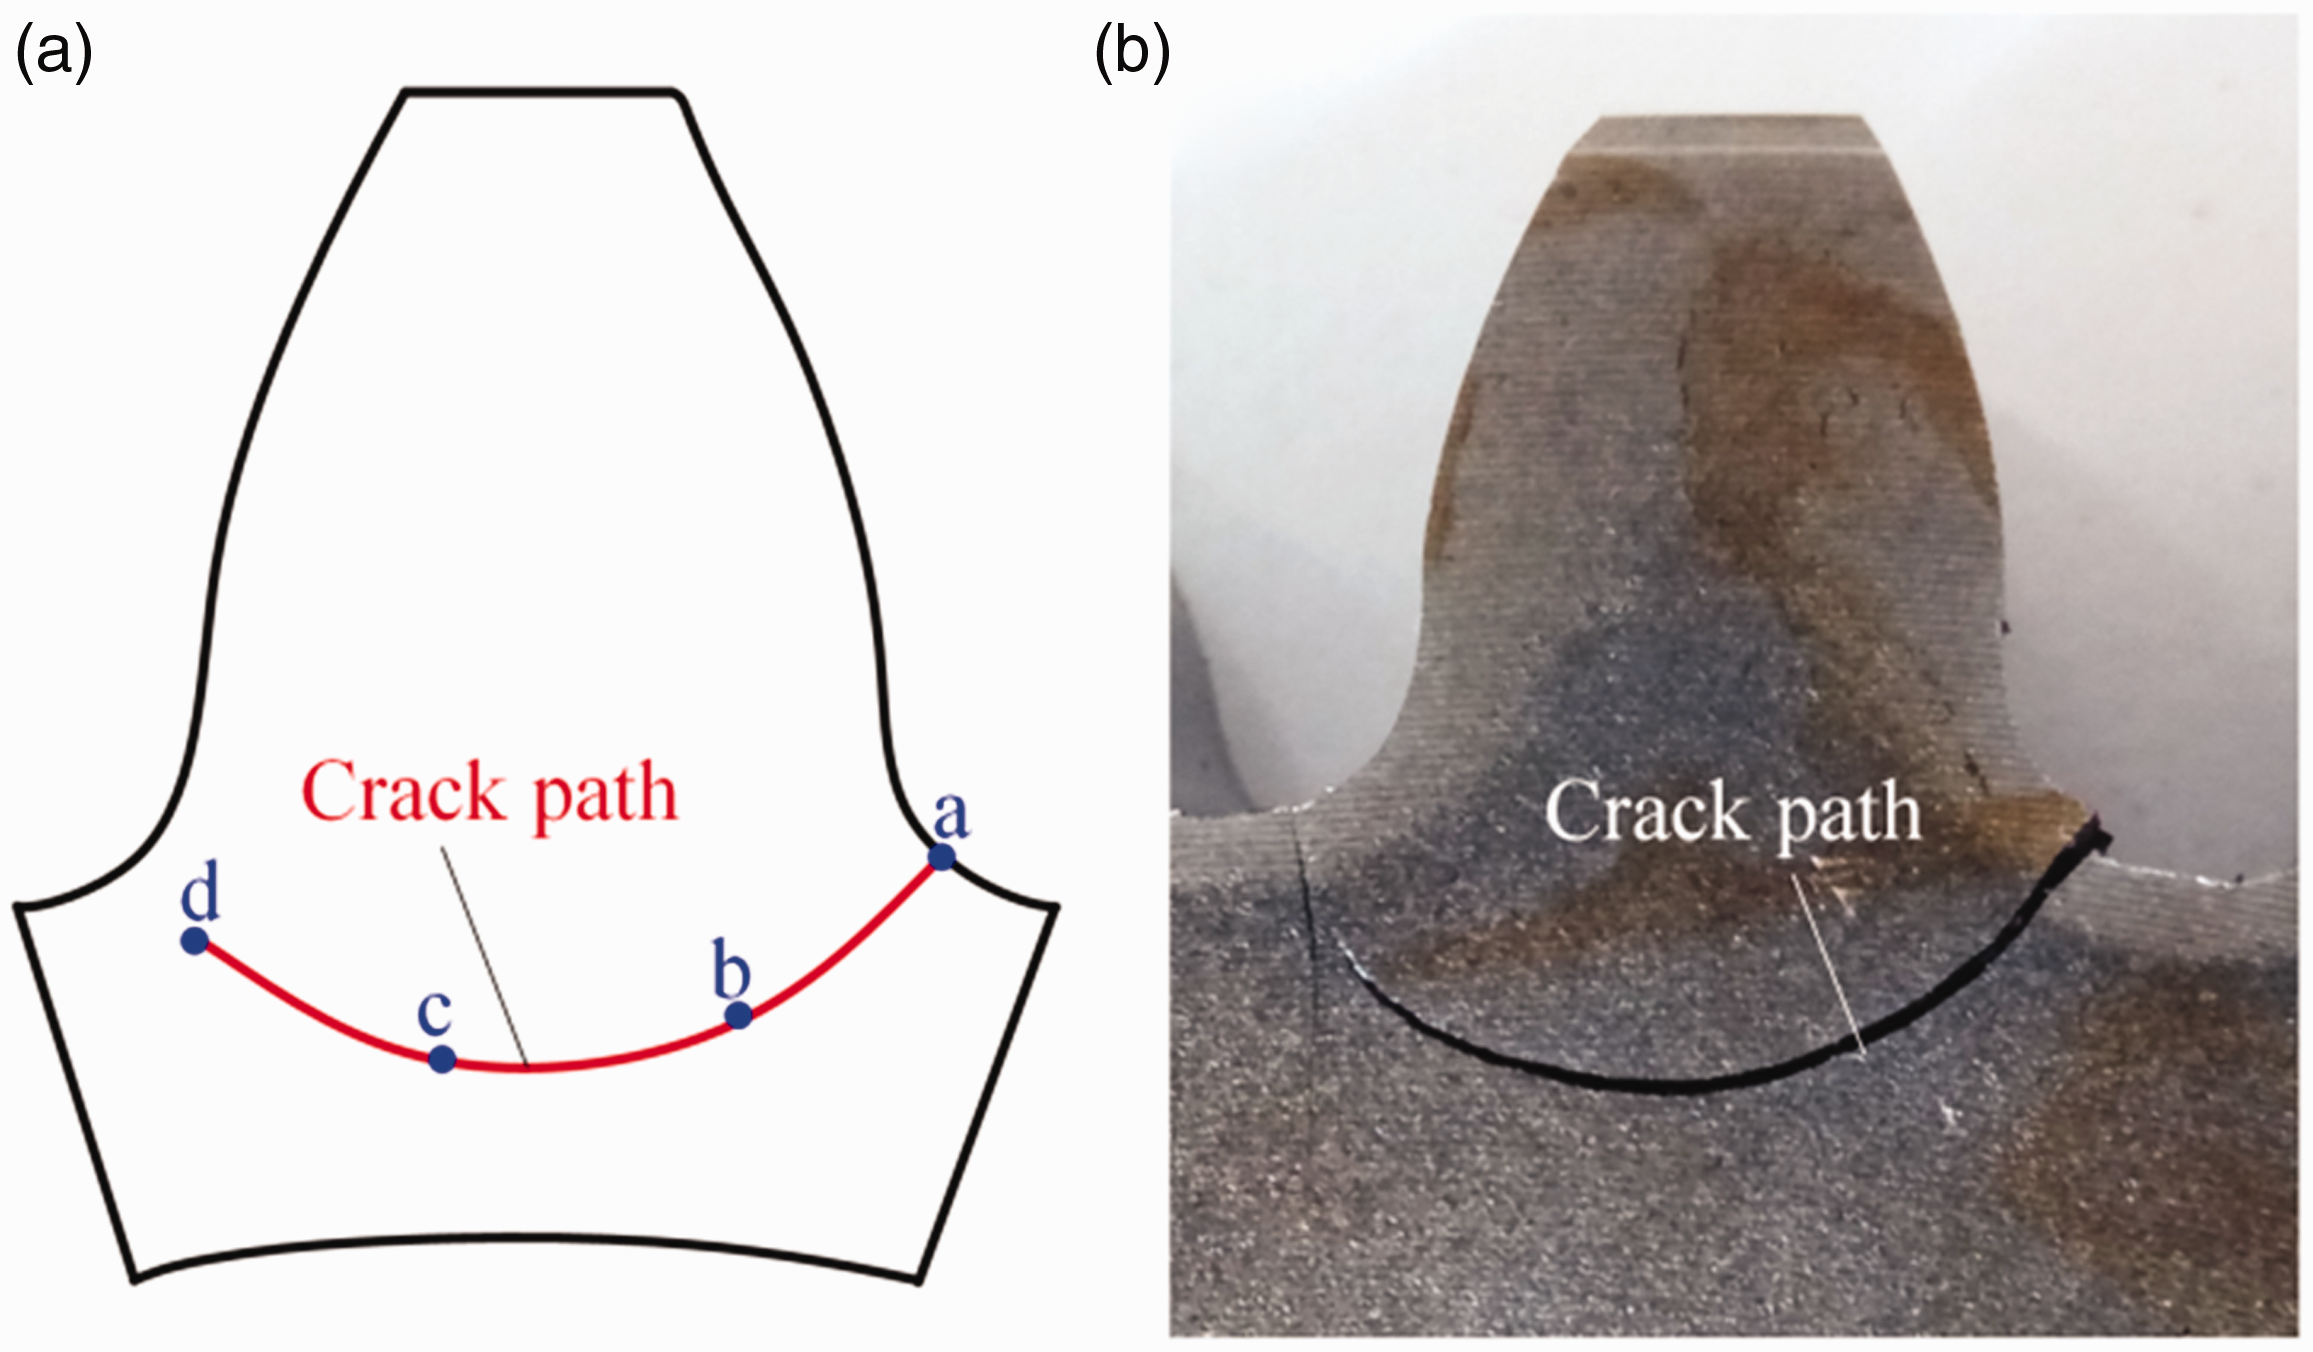
Comparison of crack path obtained from different methods: (a) simulation model and (b) experiment.
Vibration characteristics under different torques
Signal analysis under different torques
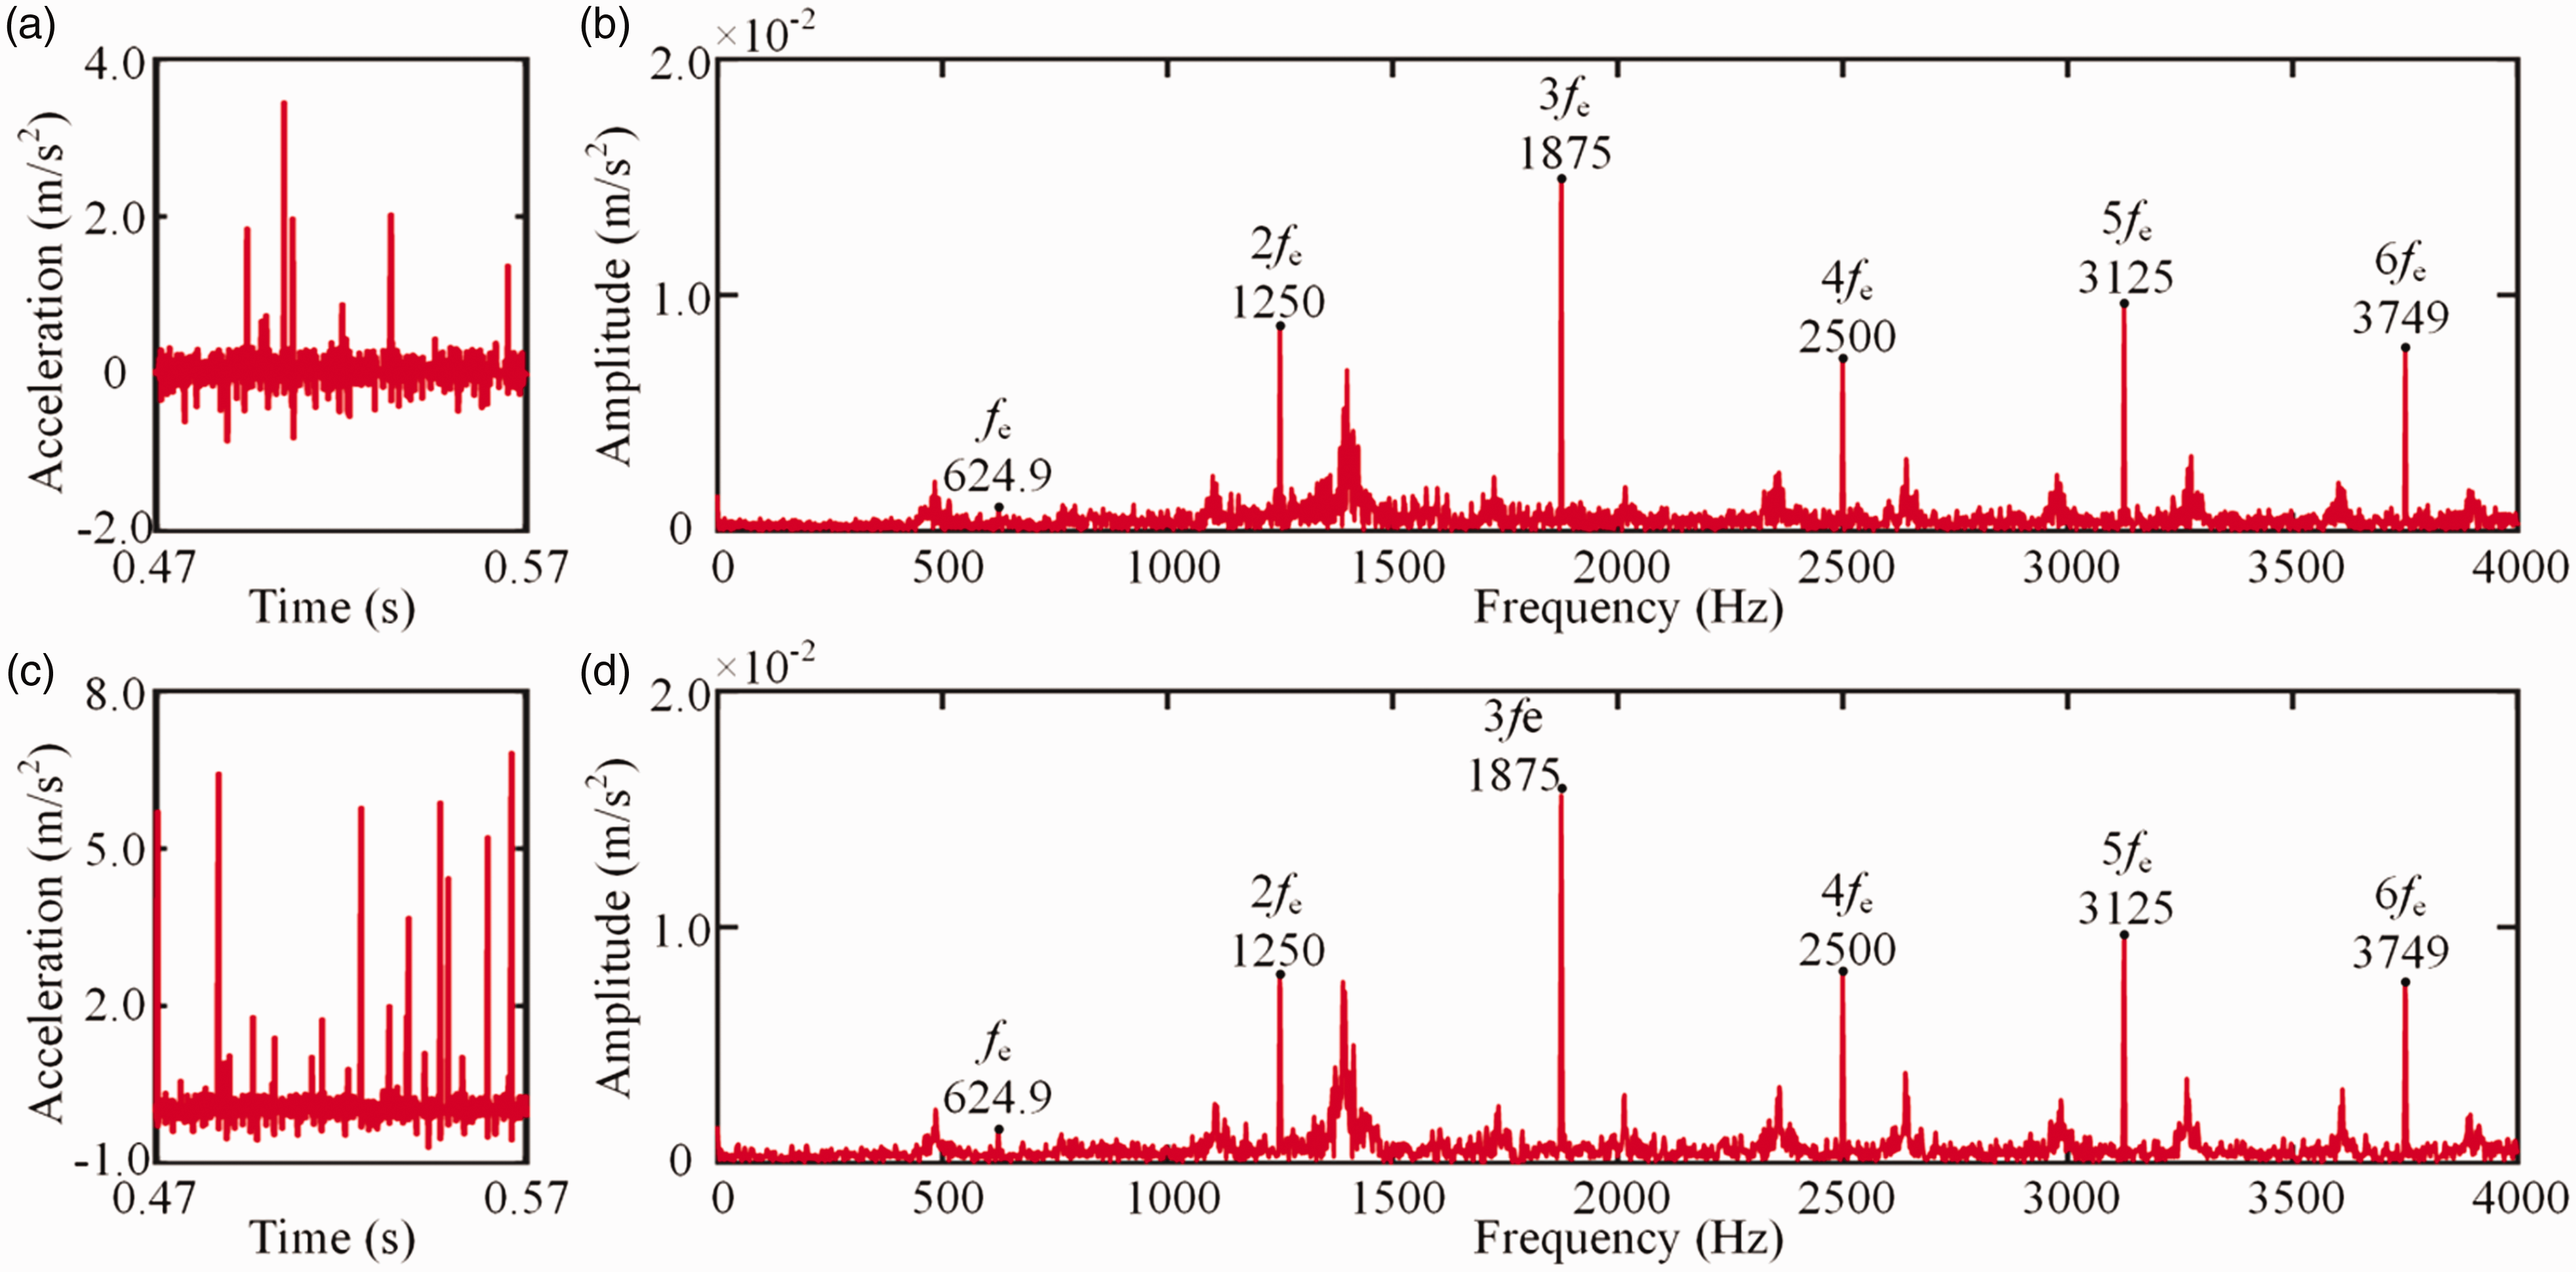
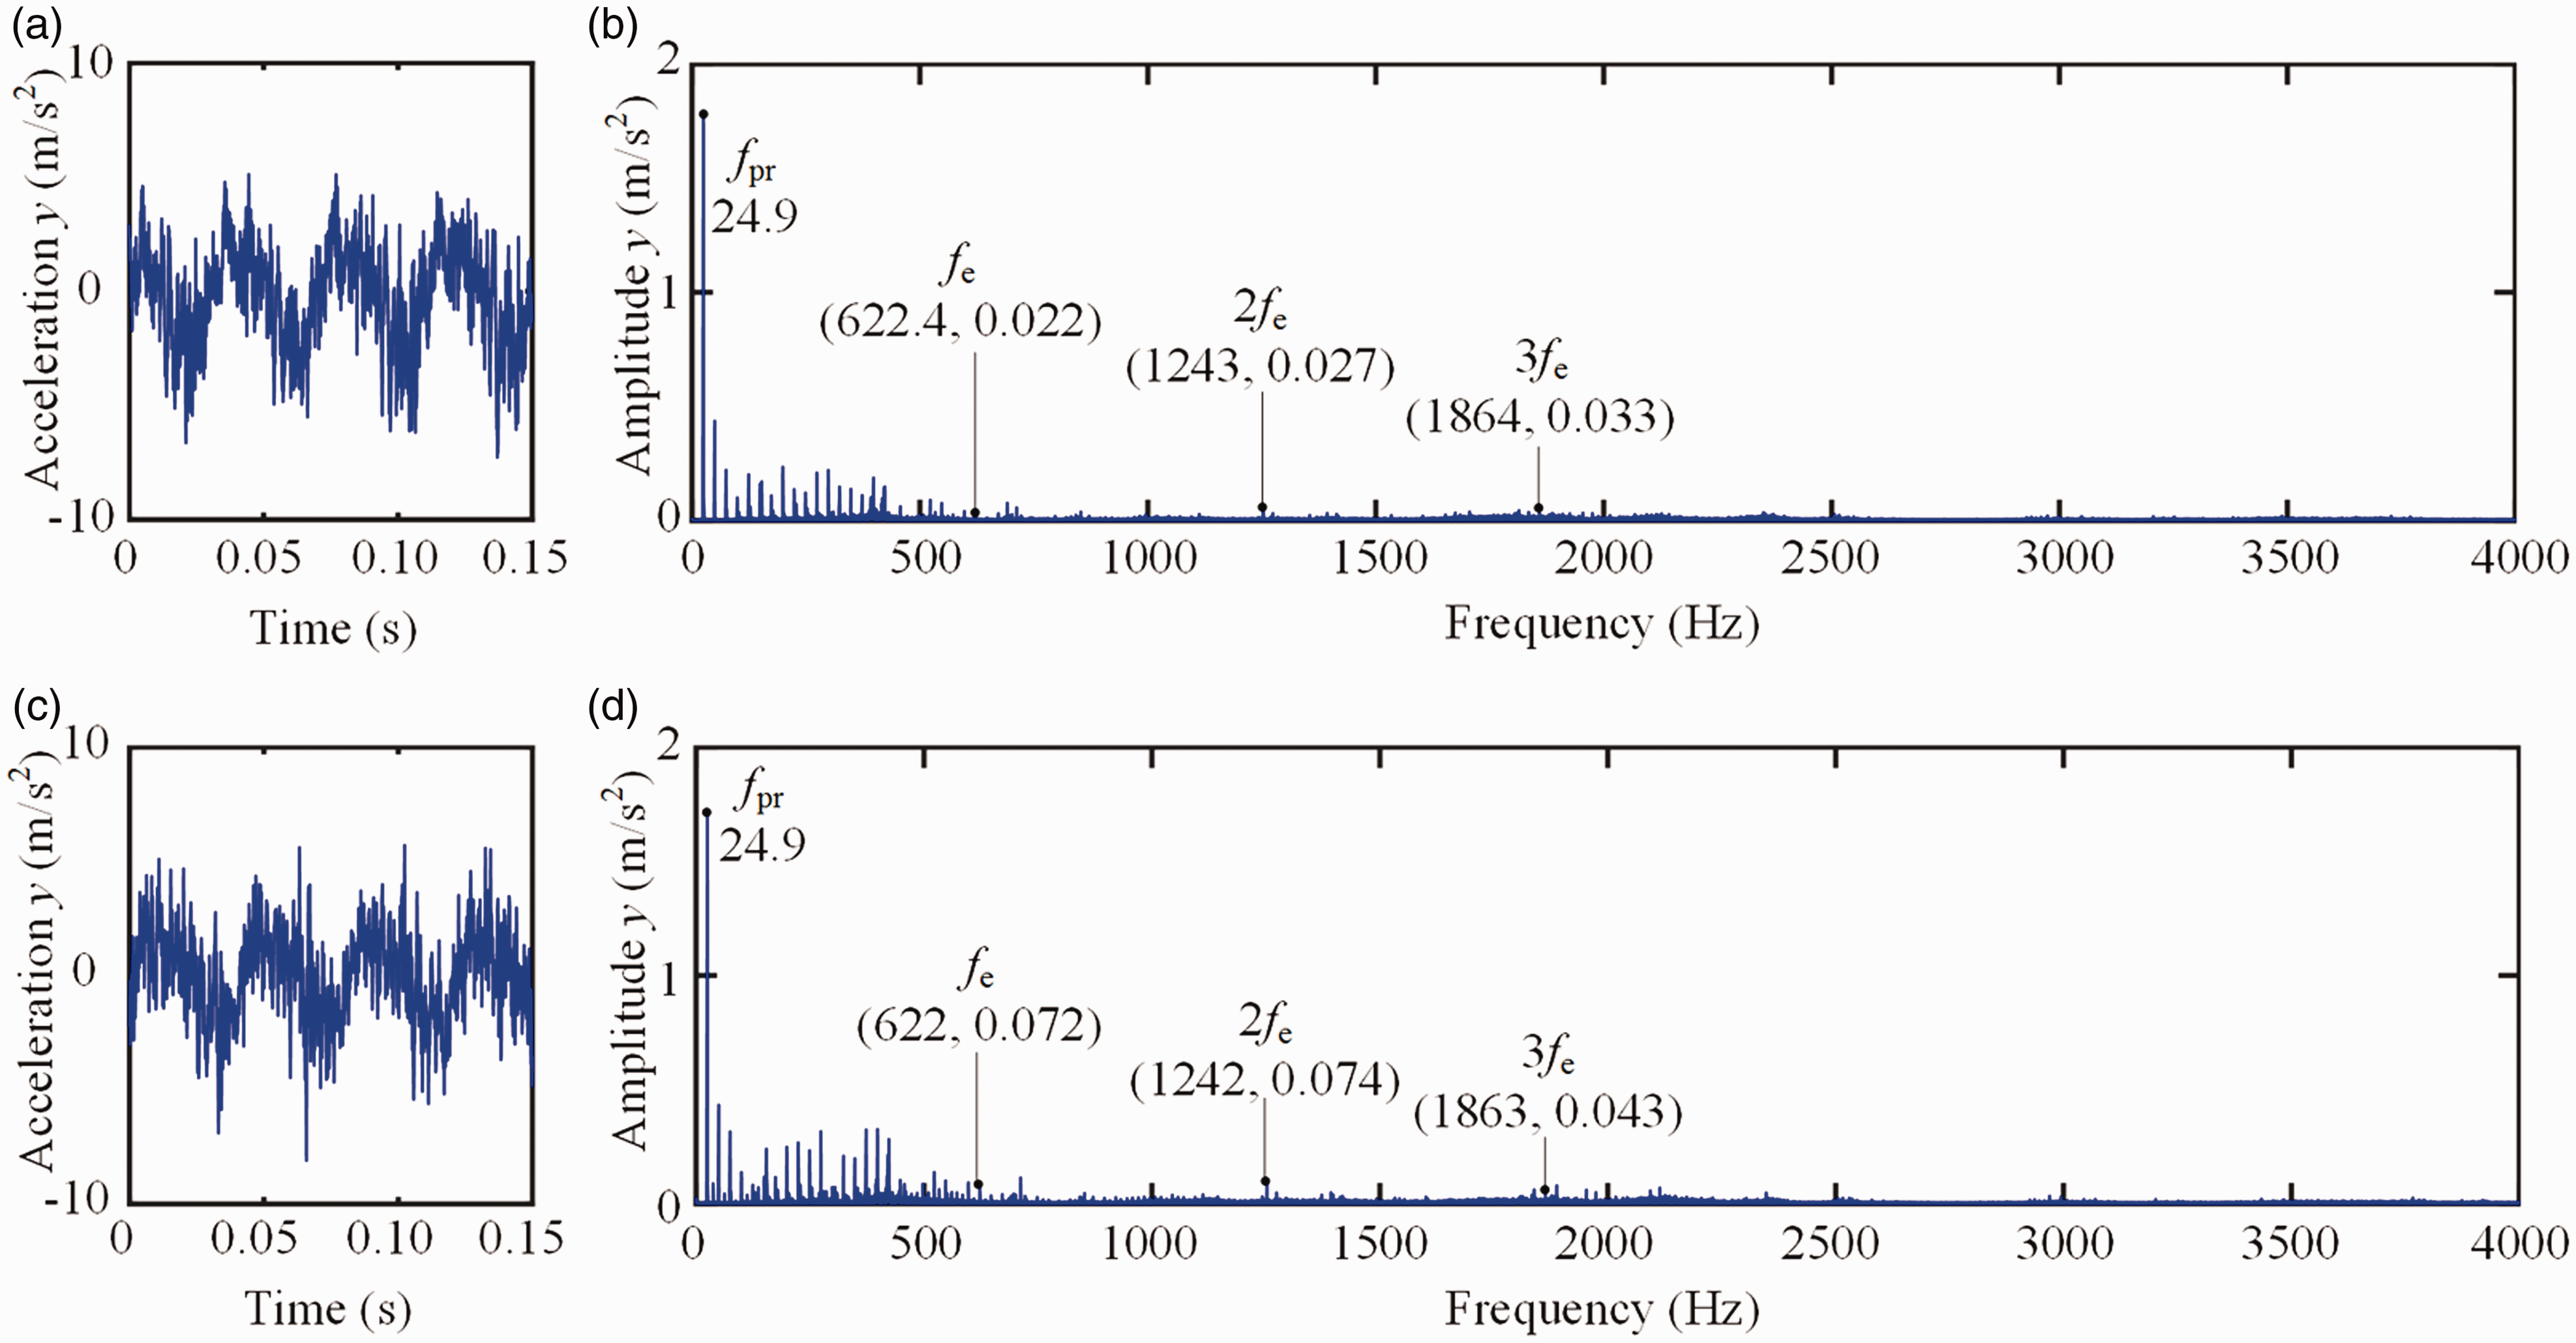
In this part, the simulated results obtained from the proposed method will be verified by the experiment. Meanwhile, the dynamic characteristics of cracked gears obtained from two methods are analyzed. The time-domain and frequency-domain acceleration signals of cracked (crack length 12 mm, see Figure 7(a)) and healthy gears obtained from the simulation and experiment under different torques (0/100/160/200 Nm) are shown in Figures 8 to 15.
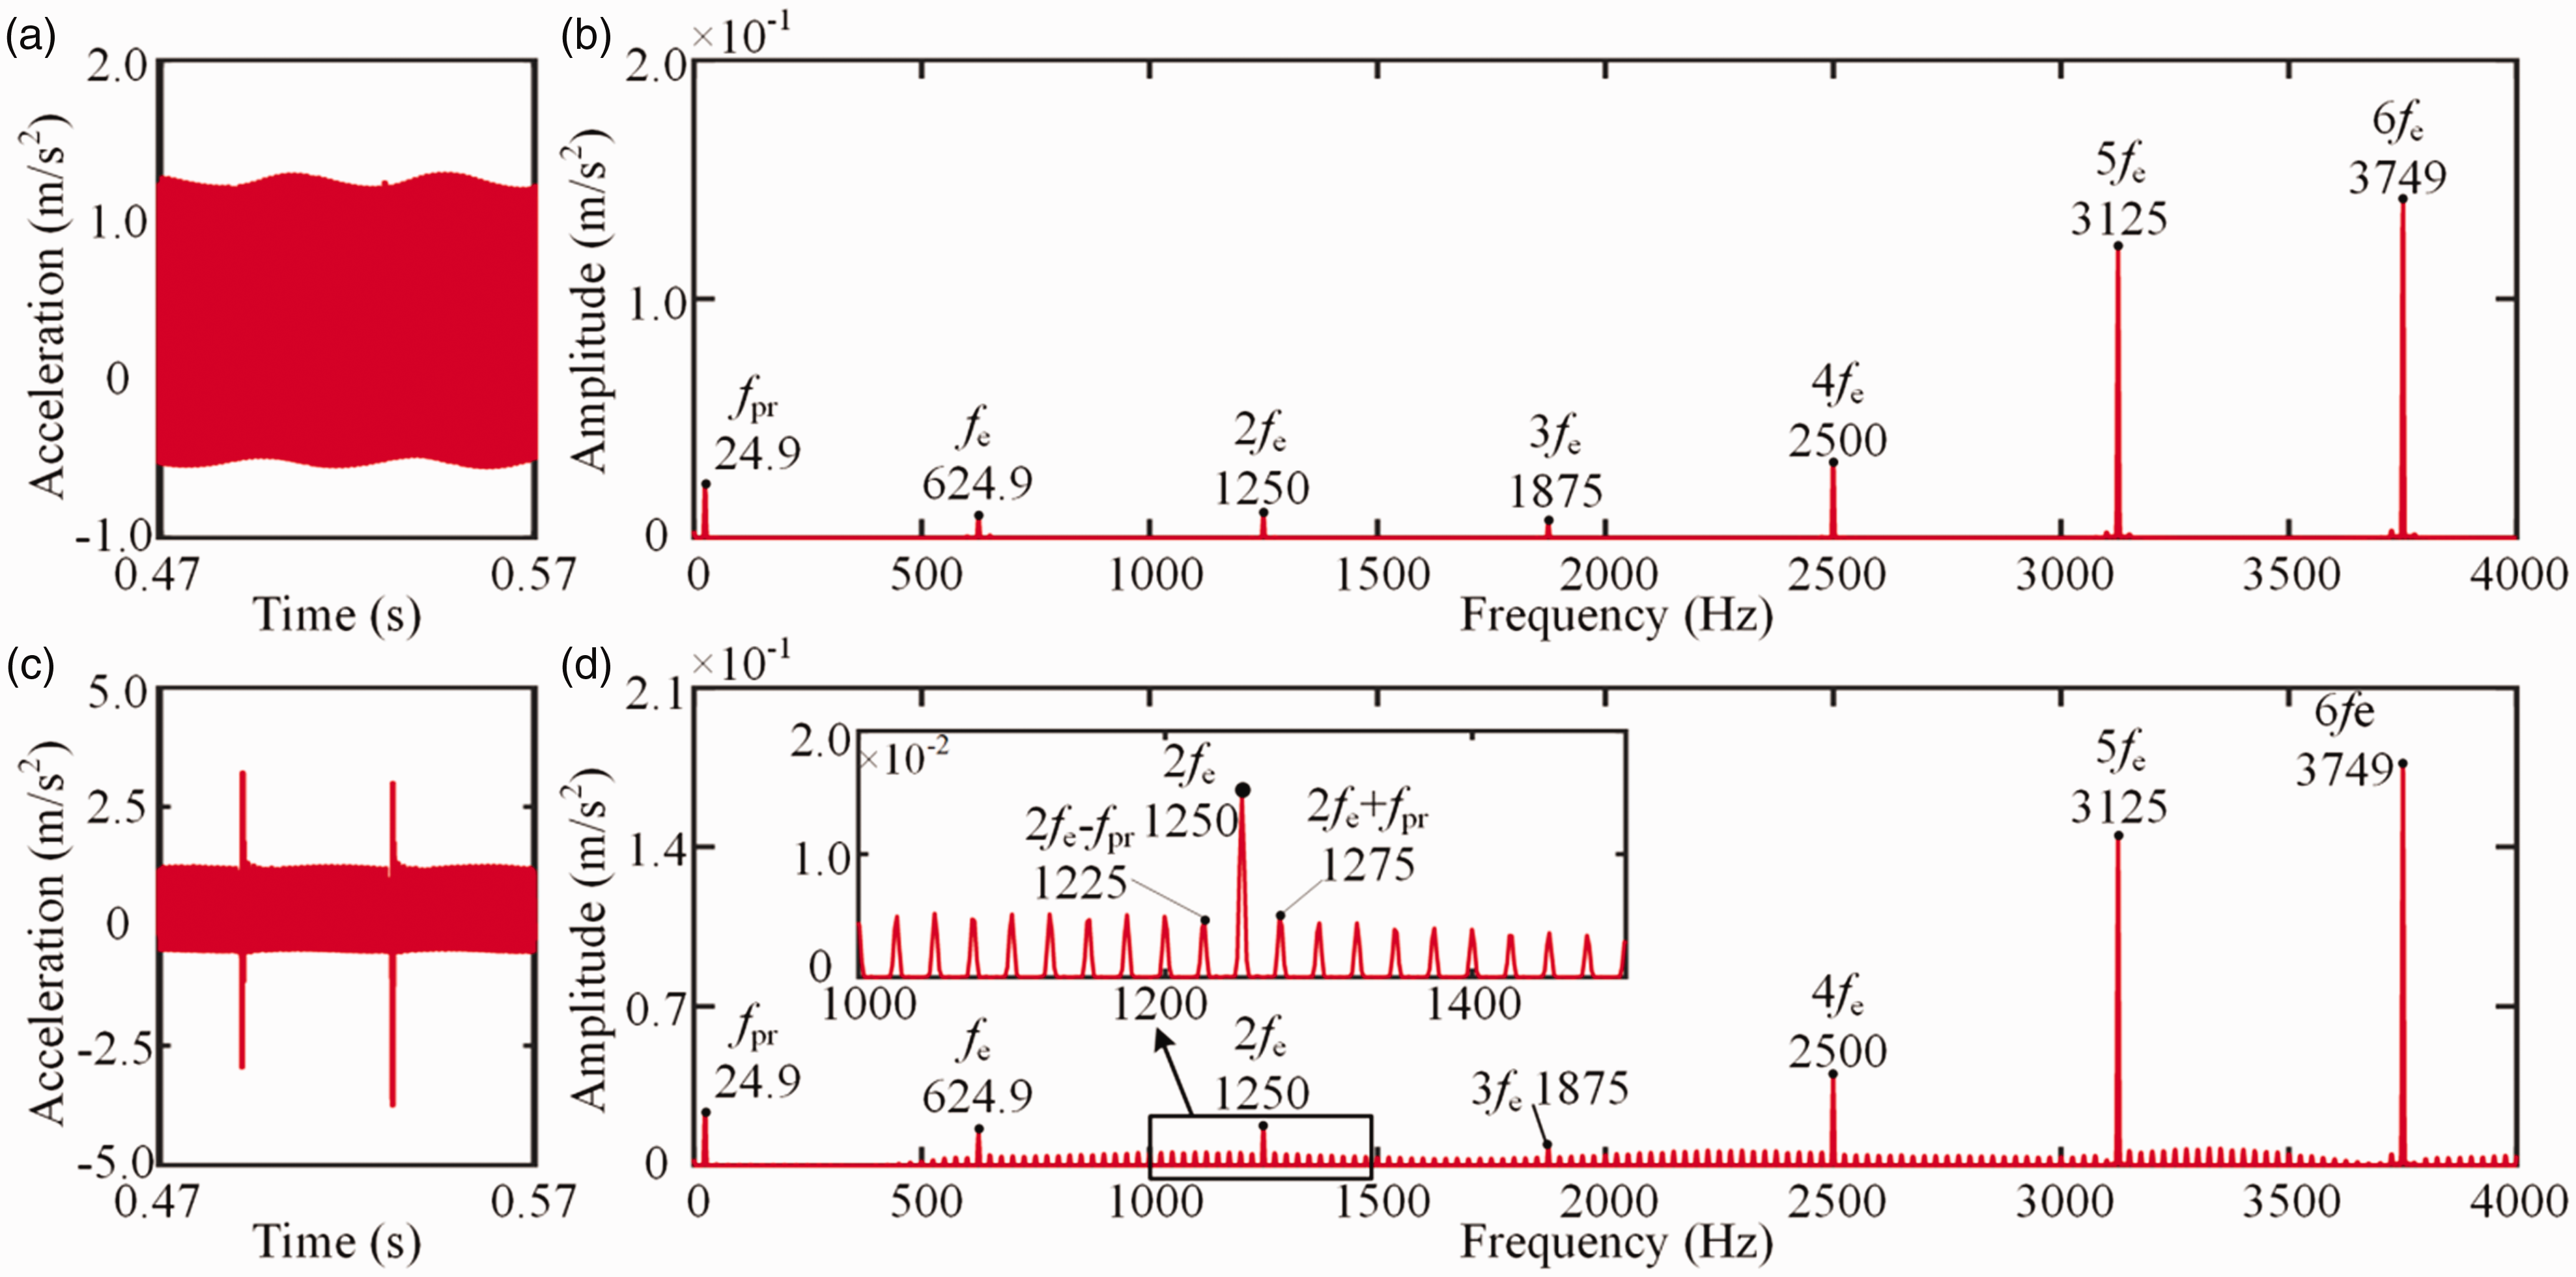
Based on the comparison of dynamic response for the healthy and cracked gears under different torques, it is indicated that the crack fault has no obvious influence on the dynamic response of gear system under idling condition (0 Nm), but there is a severe impact on the time-domain response for the gear system with high torques. Under the no-load state, the deformation of the cracked teeth is small, so the impact on the dynamic transmission error is small. However, under the large load condition, the large deformation leads to obvious impact in time-domain signal.
According to the dynamic response under different torques (see Figures 8 to 15), with the increase of torques, the time-domain and frequency-domain vibration amplitude increases gradually and the sideband amplitude of cracked gears obviously increase. Meanwhile, relative to the healthy gear, cracked gear leads to larger acceleration amplitude at the meshing frequency and its harmonics and the amplitudes at high-order harmonics of meshing frequency (4fe, 5fe, 6fe) are very prominent.
The signal characteristics of cracked gear system obtained from simulation and experiment are similar, i.e., the simulation results can effectively reflect the fault features of cracked gear system. It should be noted that the measured and simulated frequency-domain signals of the healthy gear have obvious rotating frequency components. It is mainly due to the asymmetrical supporting layouts (the gear is not at the middle position between two bearings, see Figure 4(a)). The shaft deflection leads to the misalignment between the driving and driven gears.43,44 Meanwhile, due to the assembly errors and unbalance of the gear in the experimental equipment, the amplitude of rotation frequency of healthy gears obtained from the experimental results is relatively larger (see Figure 8(b)). It is worth noting that due to the existence of tooth impact behavior under idling condition (see Chen et al. 45 ), the noise component is obvious in the simulated signal (see Figure 8(b) and (d)).
Simulated acceleration signal under 0 Nm: (a) time-domain waveform of the healthy gear pair; (b) amplitude spectrum of the healthy gear pair; (c) time-domain waveform of the cracked gear pair; and (d) amplitude spectrum of the cracked gear pair.
Measured acceleration signal under 0 Nm: (a) time-domain waveform of the healthy gear pair; (b) amplitude spectrum of the healthy gear pair; (c) time-domain waveform of the cracked gear pair; and (d) amplitude spectrum of the cracked gear pair.
Simulated acceleration signal under 100 Nm: (a) time-domain waveform of the healthy gear pair; (b) amplitude spectrum of the healthy gear pair; (c) time-domain waveform of the cracked gear pair; and (d) amplitude spectrum of the cracked gear pair.
Measured acceleration signal under 100 Nm: (a) time-domain waveform of the healthy gear pair; (b) amplitude spectrum of the healthy gear pair; (c) time-domain waveform of the cracked gear pair; and (d) amplitude spectrum of the cracked gear pair.
Statistical indictors
Statistical indicators (RMS and Kurtosis) are used to quantify the damage degree of the cracked gears. The expressions of RMS and Kurtosis are as follows


Vibration characteristics under different crack lengths
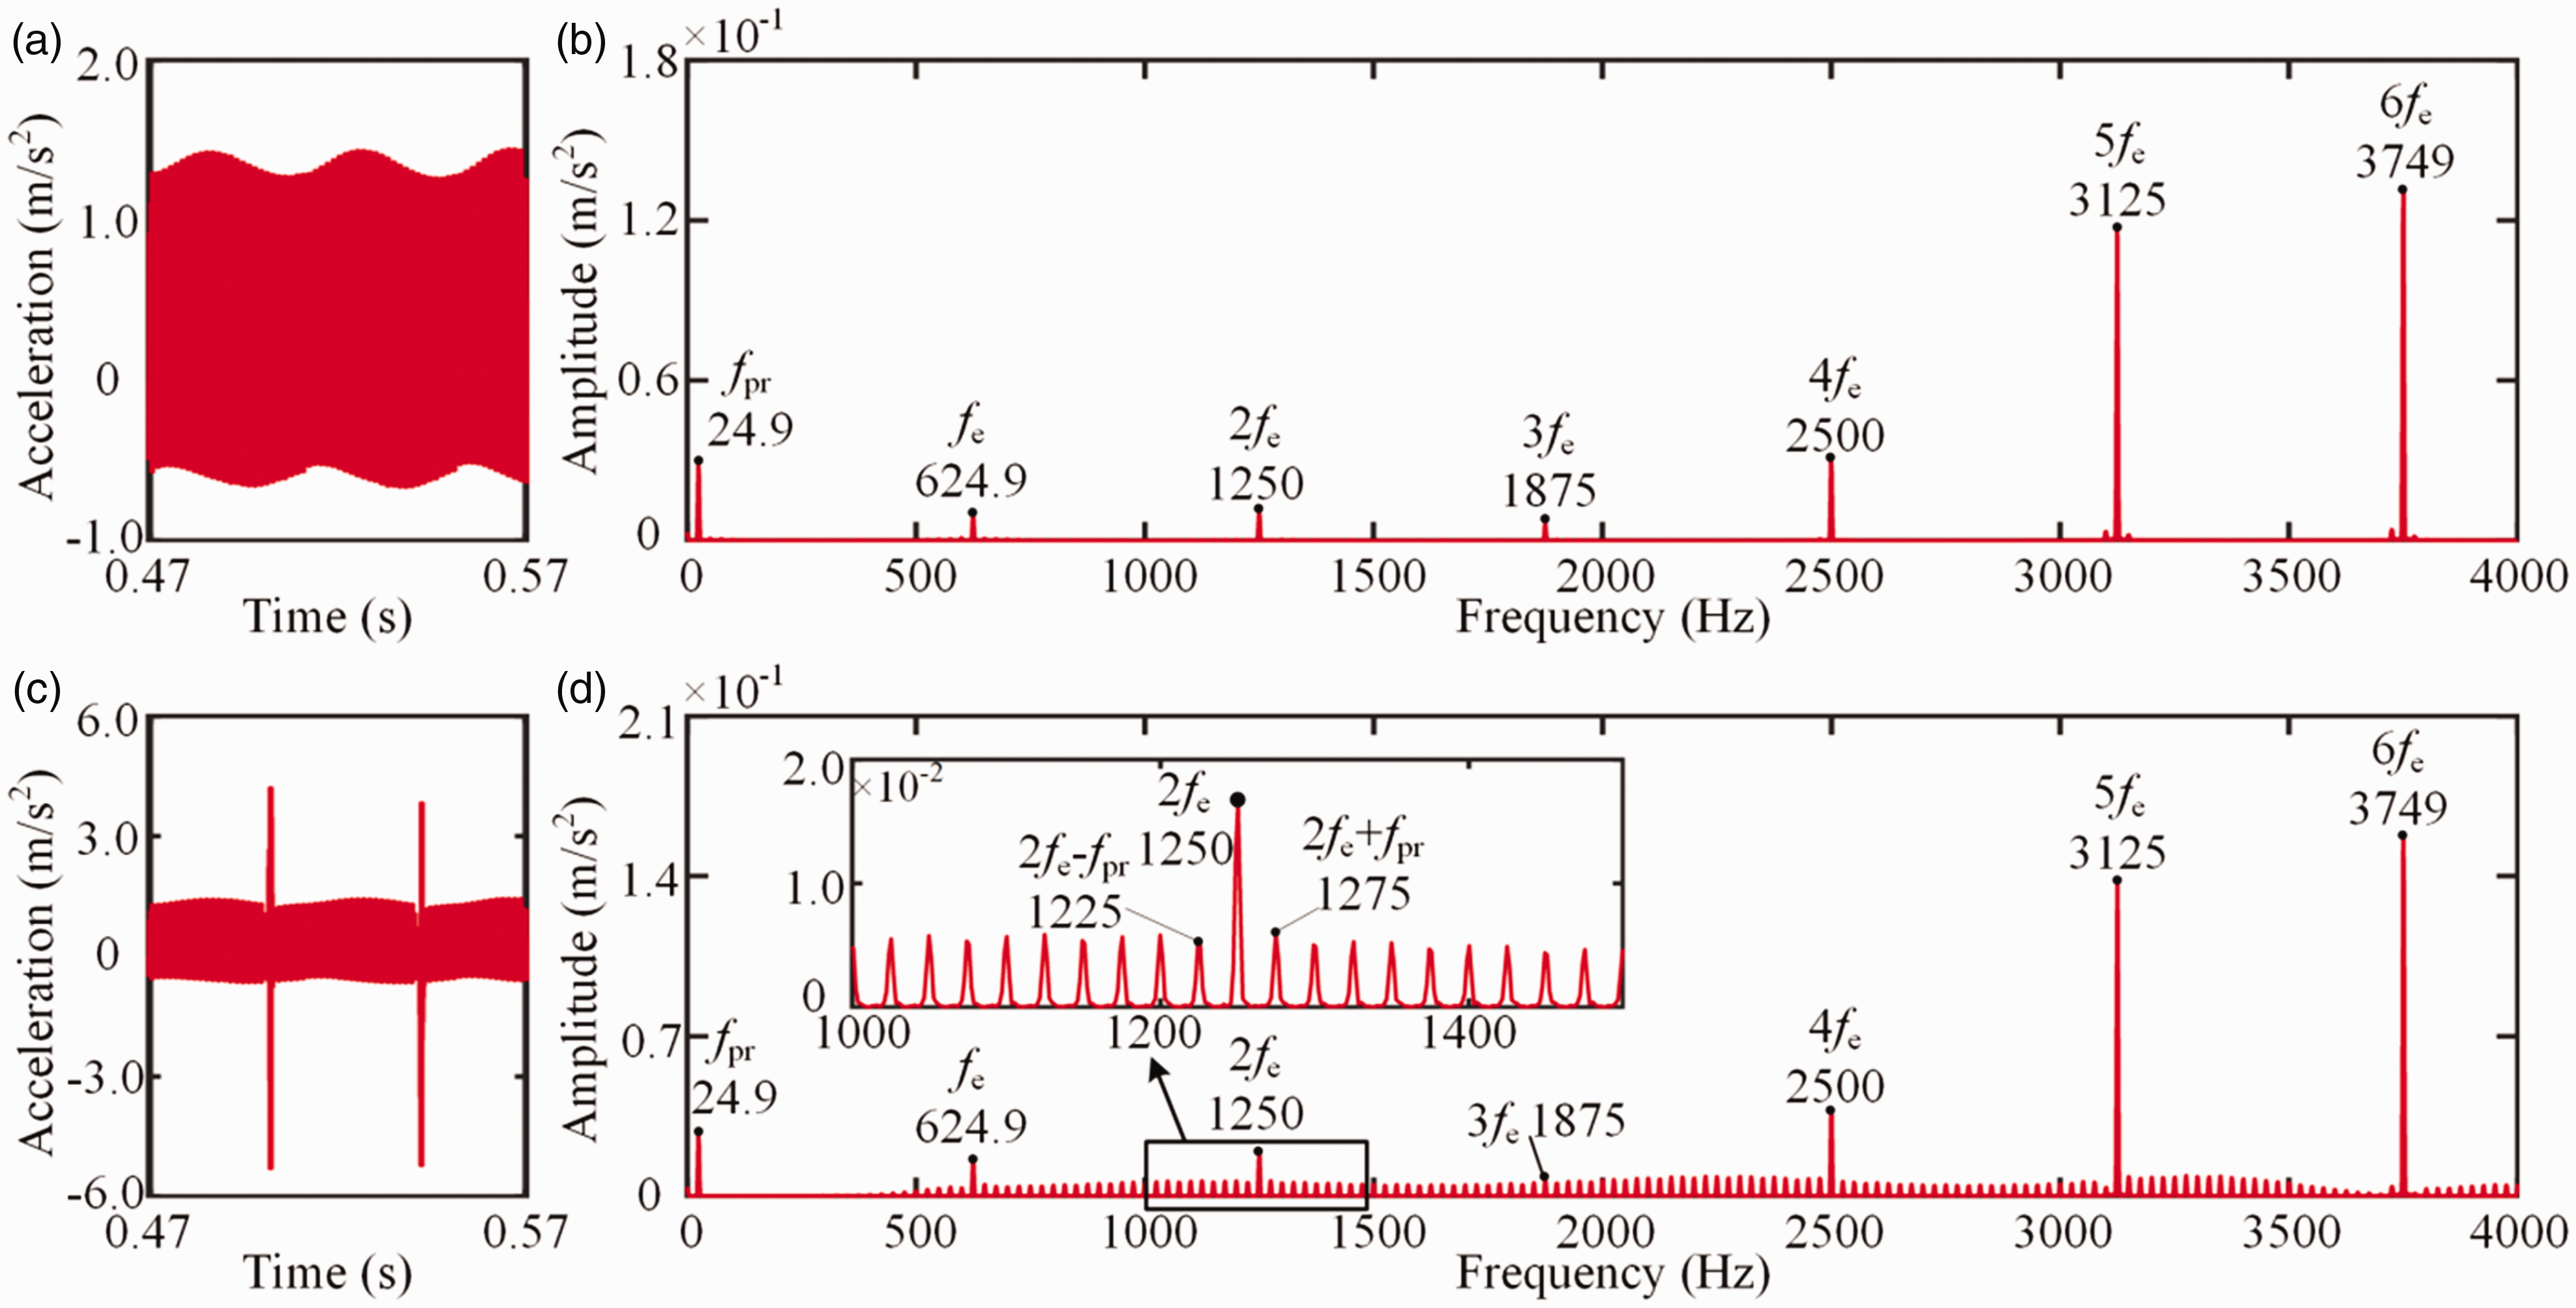
Since it is difficult to identify and monitor the early crack fault of gear system in the experiment method, this part mainly analyzes the fault characteristics of crack gear system under different crack lengths through the simulation model. Under the torque of 200 N·m, the vibration signals of cracked gear with crack lengths 0 and 15 mm are shown in Figure 14 and the vibration signals of cracked gear with crack lengths 4, 8, and 15 mm are plotted in Figure 17 (the crack length of broken tooth is about 15 mm). According to the results, the amplitude of acceleration signal in time-domain increases with the increase of crack lengths. Meanwhile, it can be seen from the amplitude spectrum that with the increase of crack lengths, the amplitude of rotating frequency and sideband frequencies increases gradually. For spur gears with tooth fracture fault, it should be noted that the amplitudes of sideband frequencies of meshing frequency’s harmonics (4fe, 5fe, 6fe) are very prominent.
Simulated acceleration signal under 160 Nm: (a) time-domain waveform of the healthy gear pair; (b) amplitude spectrum of the healthy gear pair; (c) time-domain waveform of the cracked gear pair; and (d) amplitude spectrum of the cracked gear pair.
Measured acceleration signal under 160 Nm: (a) time-domain waveform of the healthy gear pair; (b) amplitude spectrum of the healthy gear pair; (c) time-domain waveform of the cracked gear pair; and (d) amplitude spectrum of the cracked gear pair.
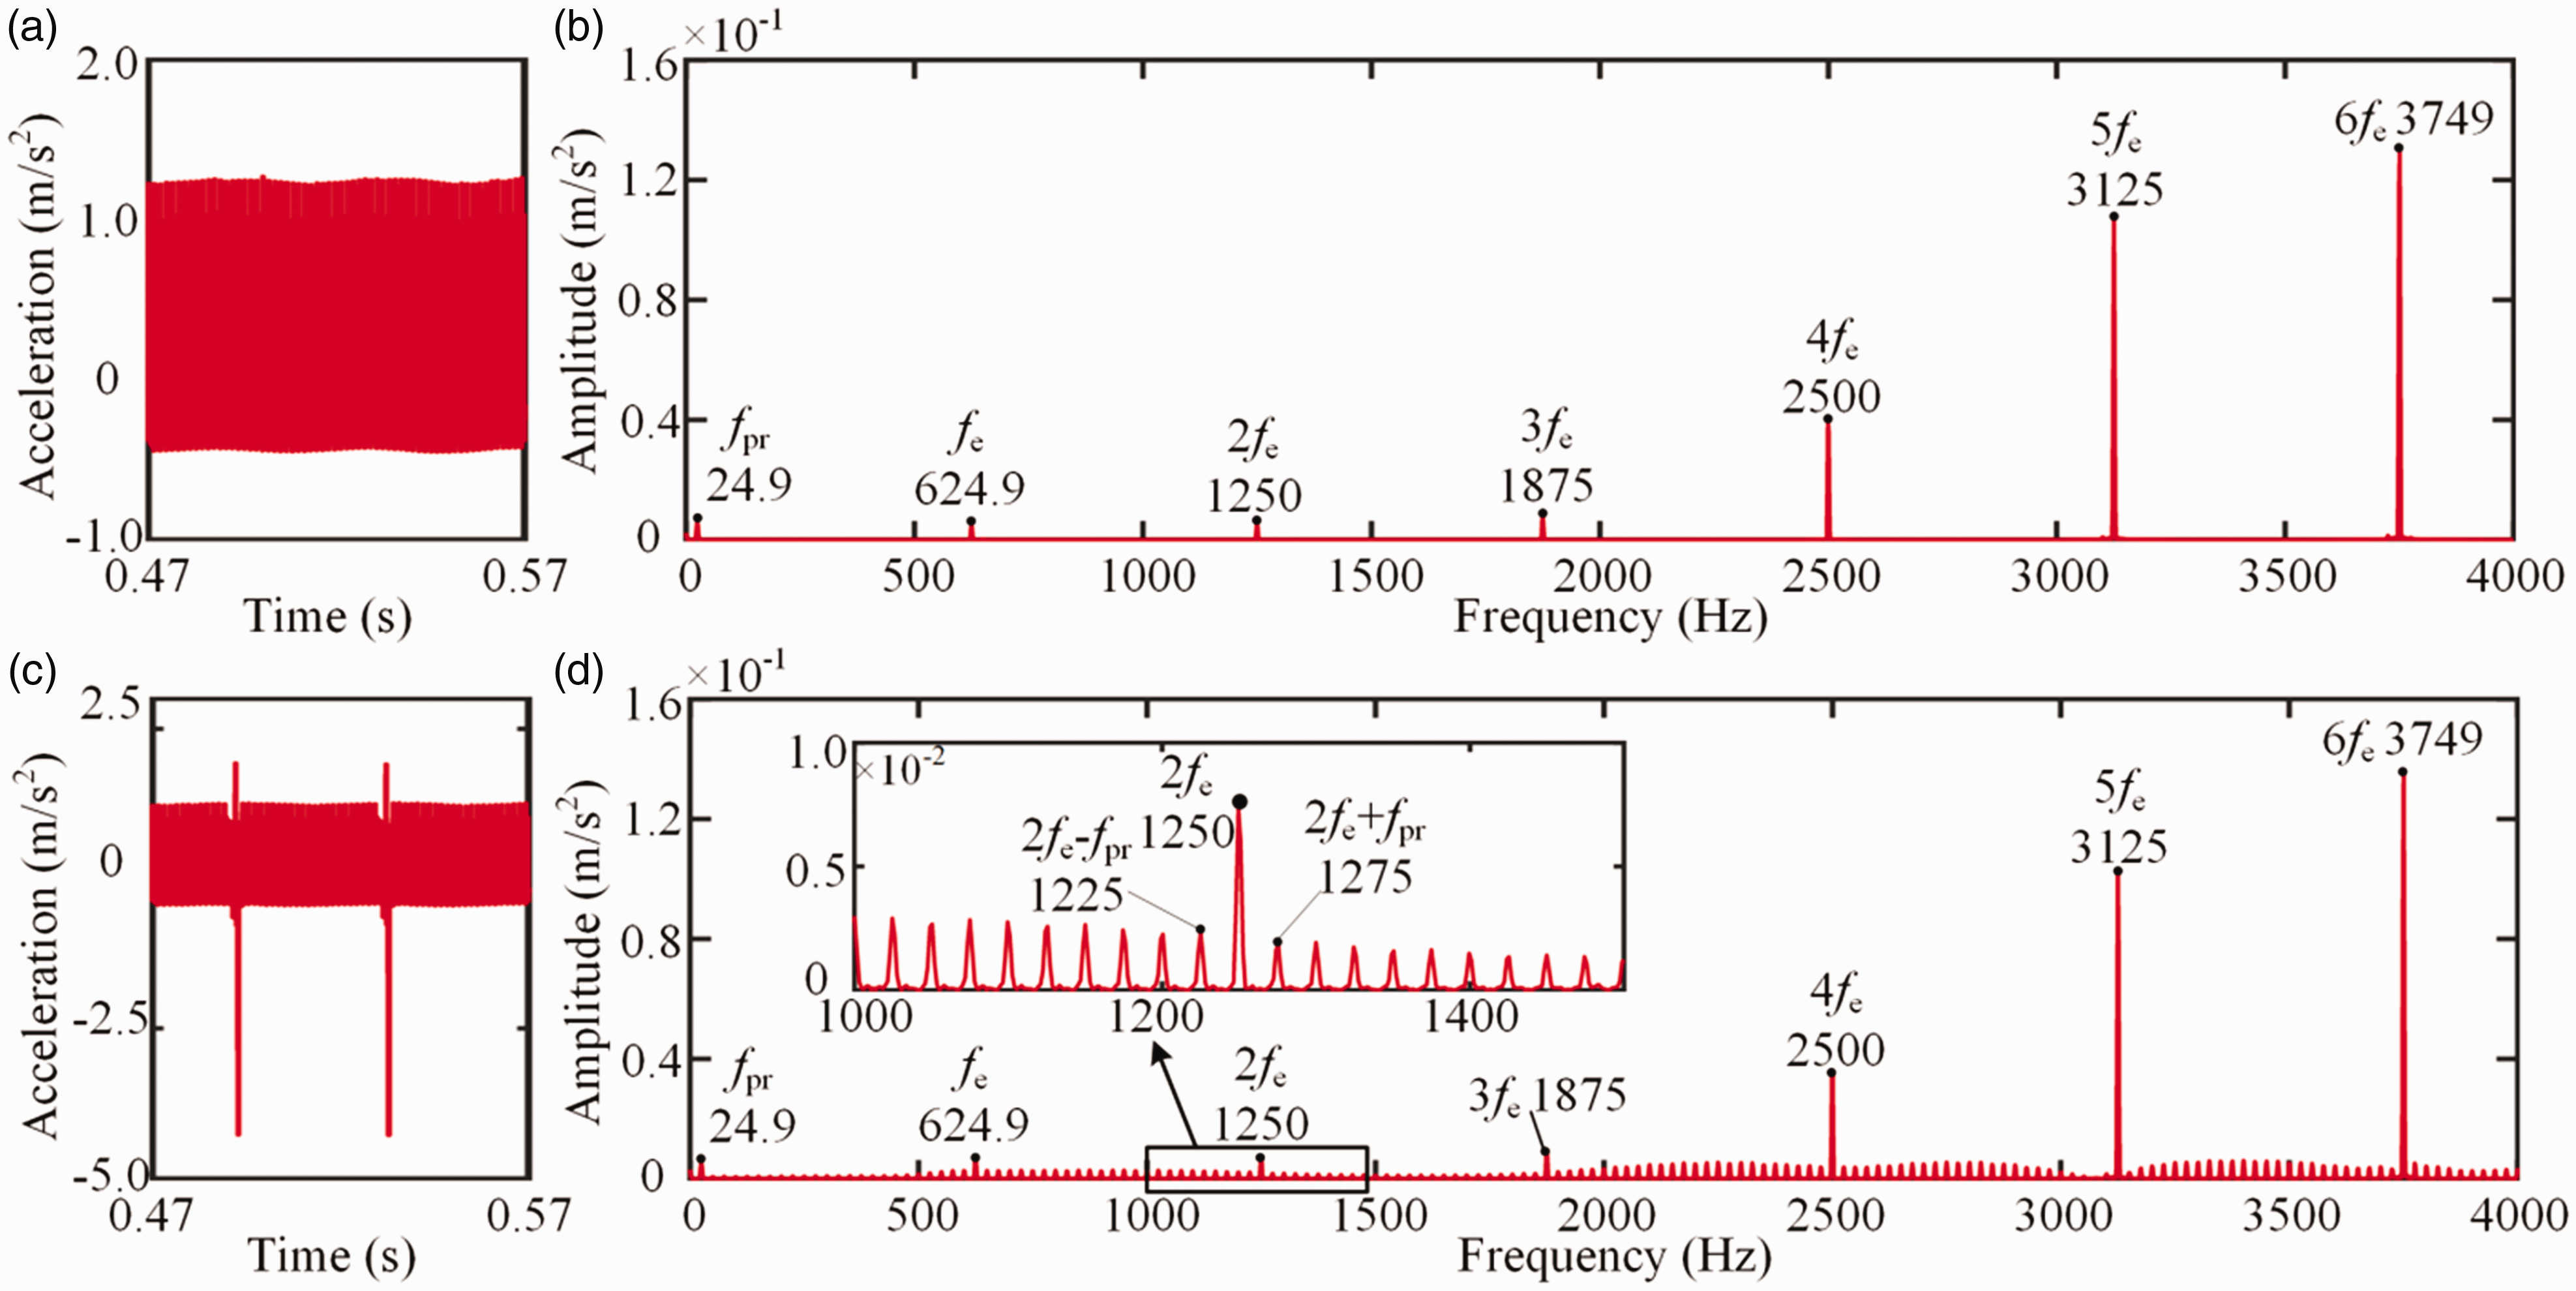
Simulated acceleration signal under 200 Nm: (a) time-domain waveforms of the healthy gear pair; (b) amplitude spectrum of the healthy gear pair; (c) time-domain waveforms of the cracked gear pair; (d) amplitude spectrum of the cracked gear pair.
Measured acceleration signal under 200 Nm: (a) time-domain waveforms of the healthy gear pair; (b) amplitude spectrum of the healthy gear pair; (c) time-domain waveforms of the cracked gear pair; and (d) amplitude spectrum of the cracked gear pair.
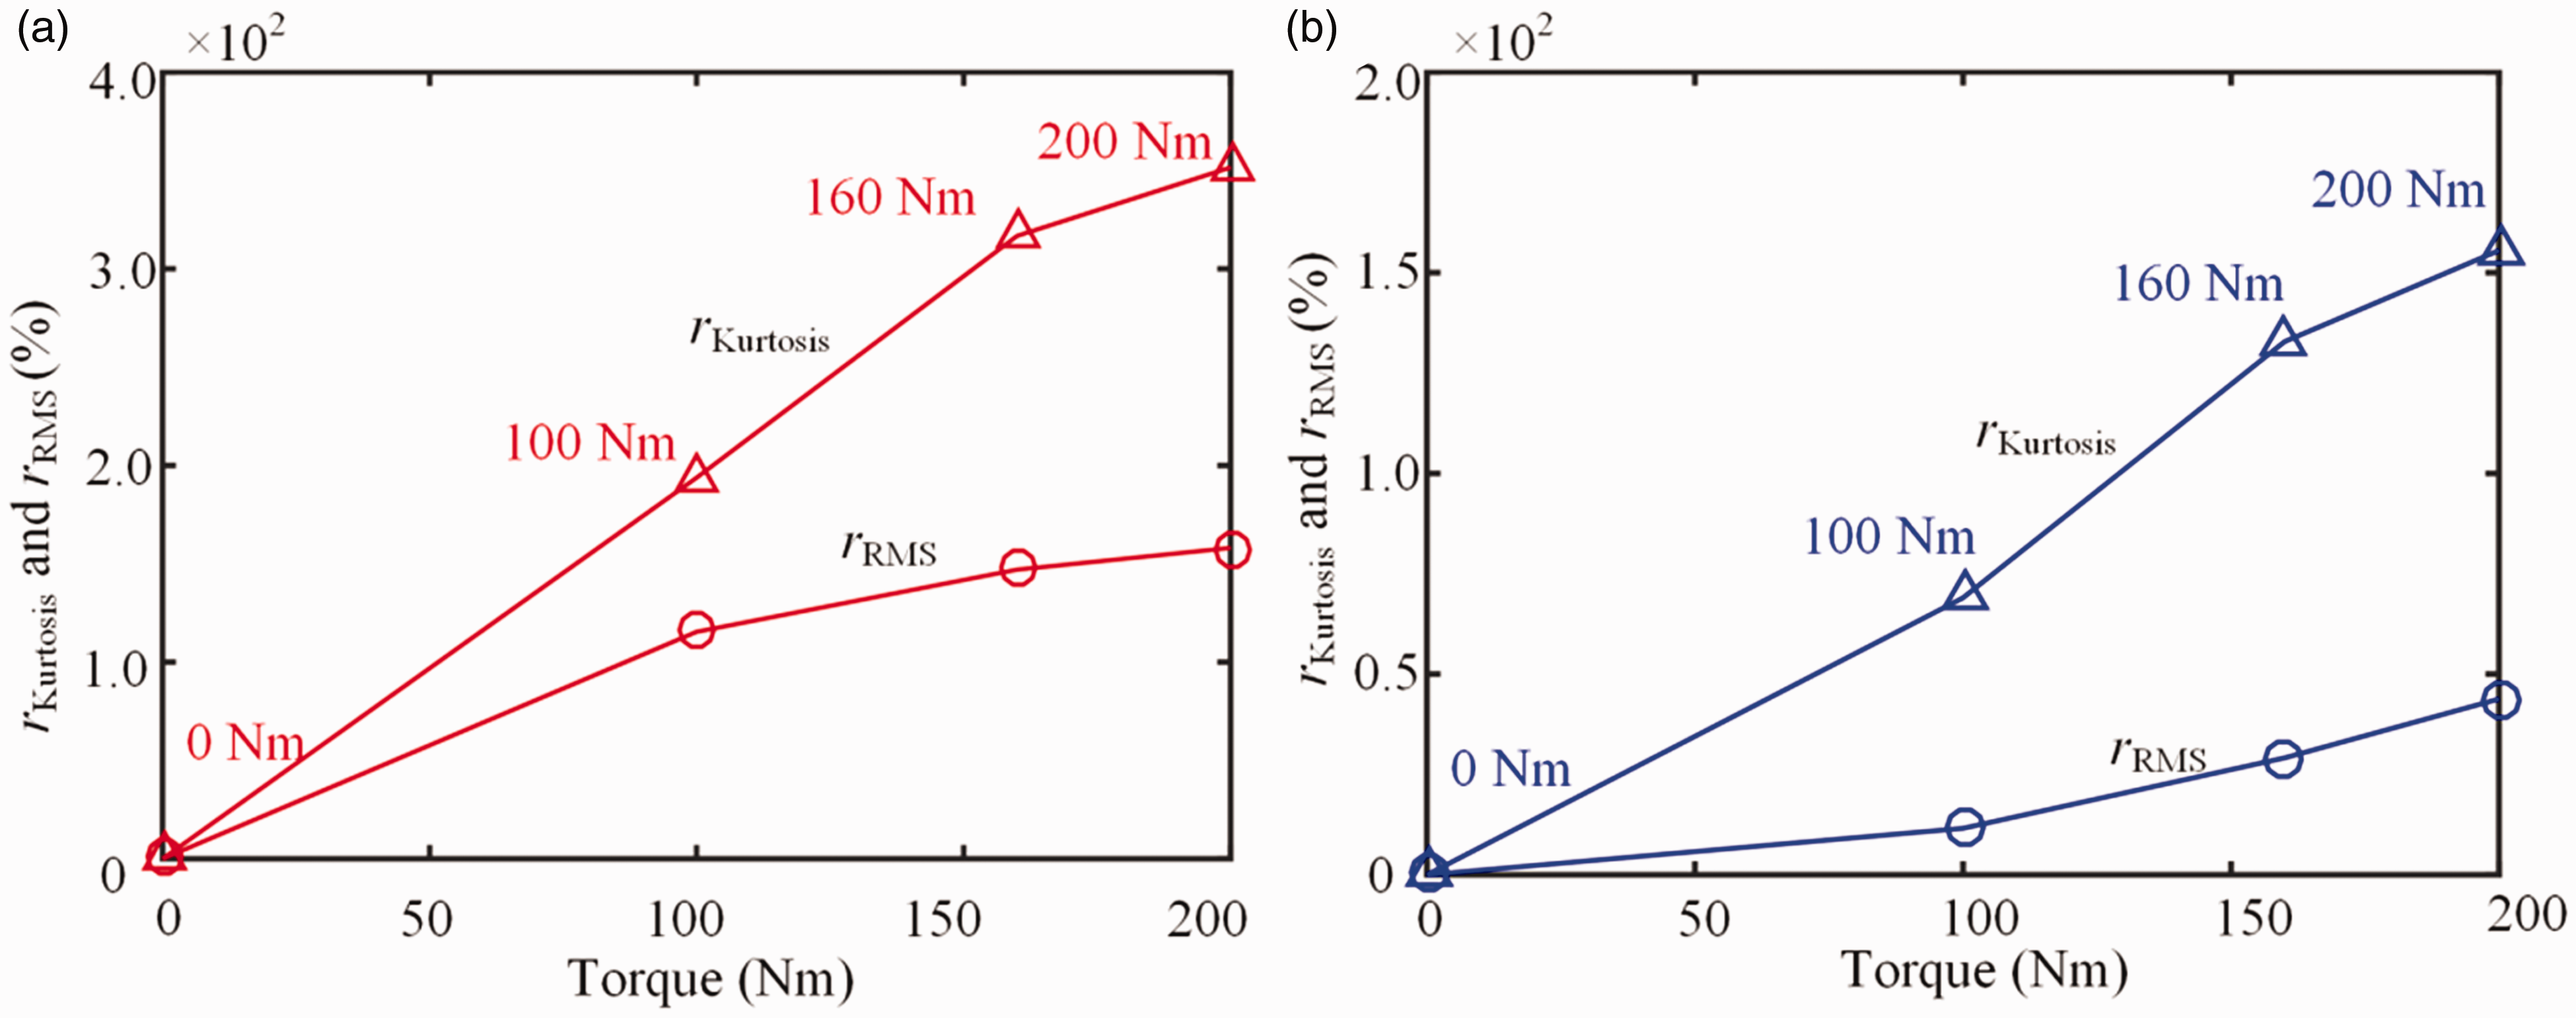
Statistical indicators under different torques: (a) simulated signal and (b) measured signal.
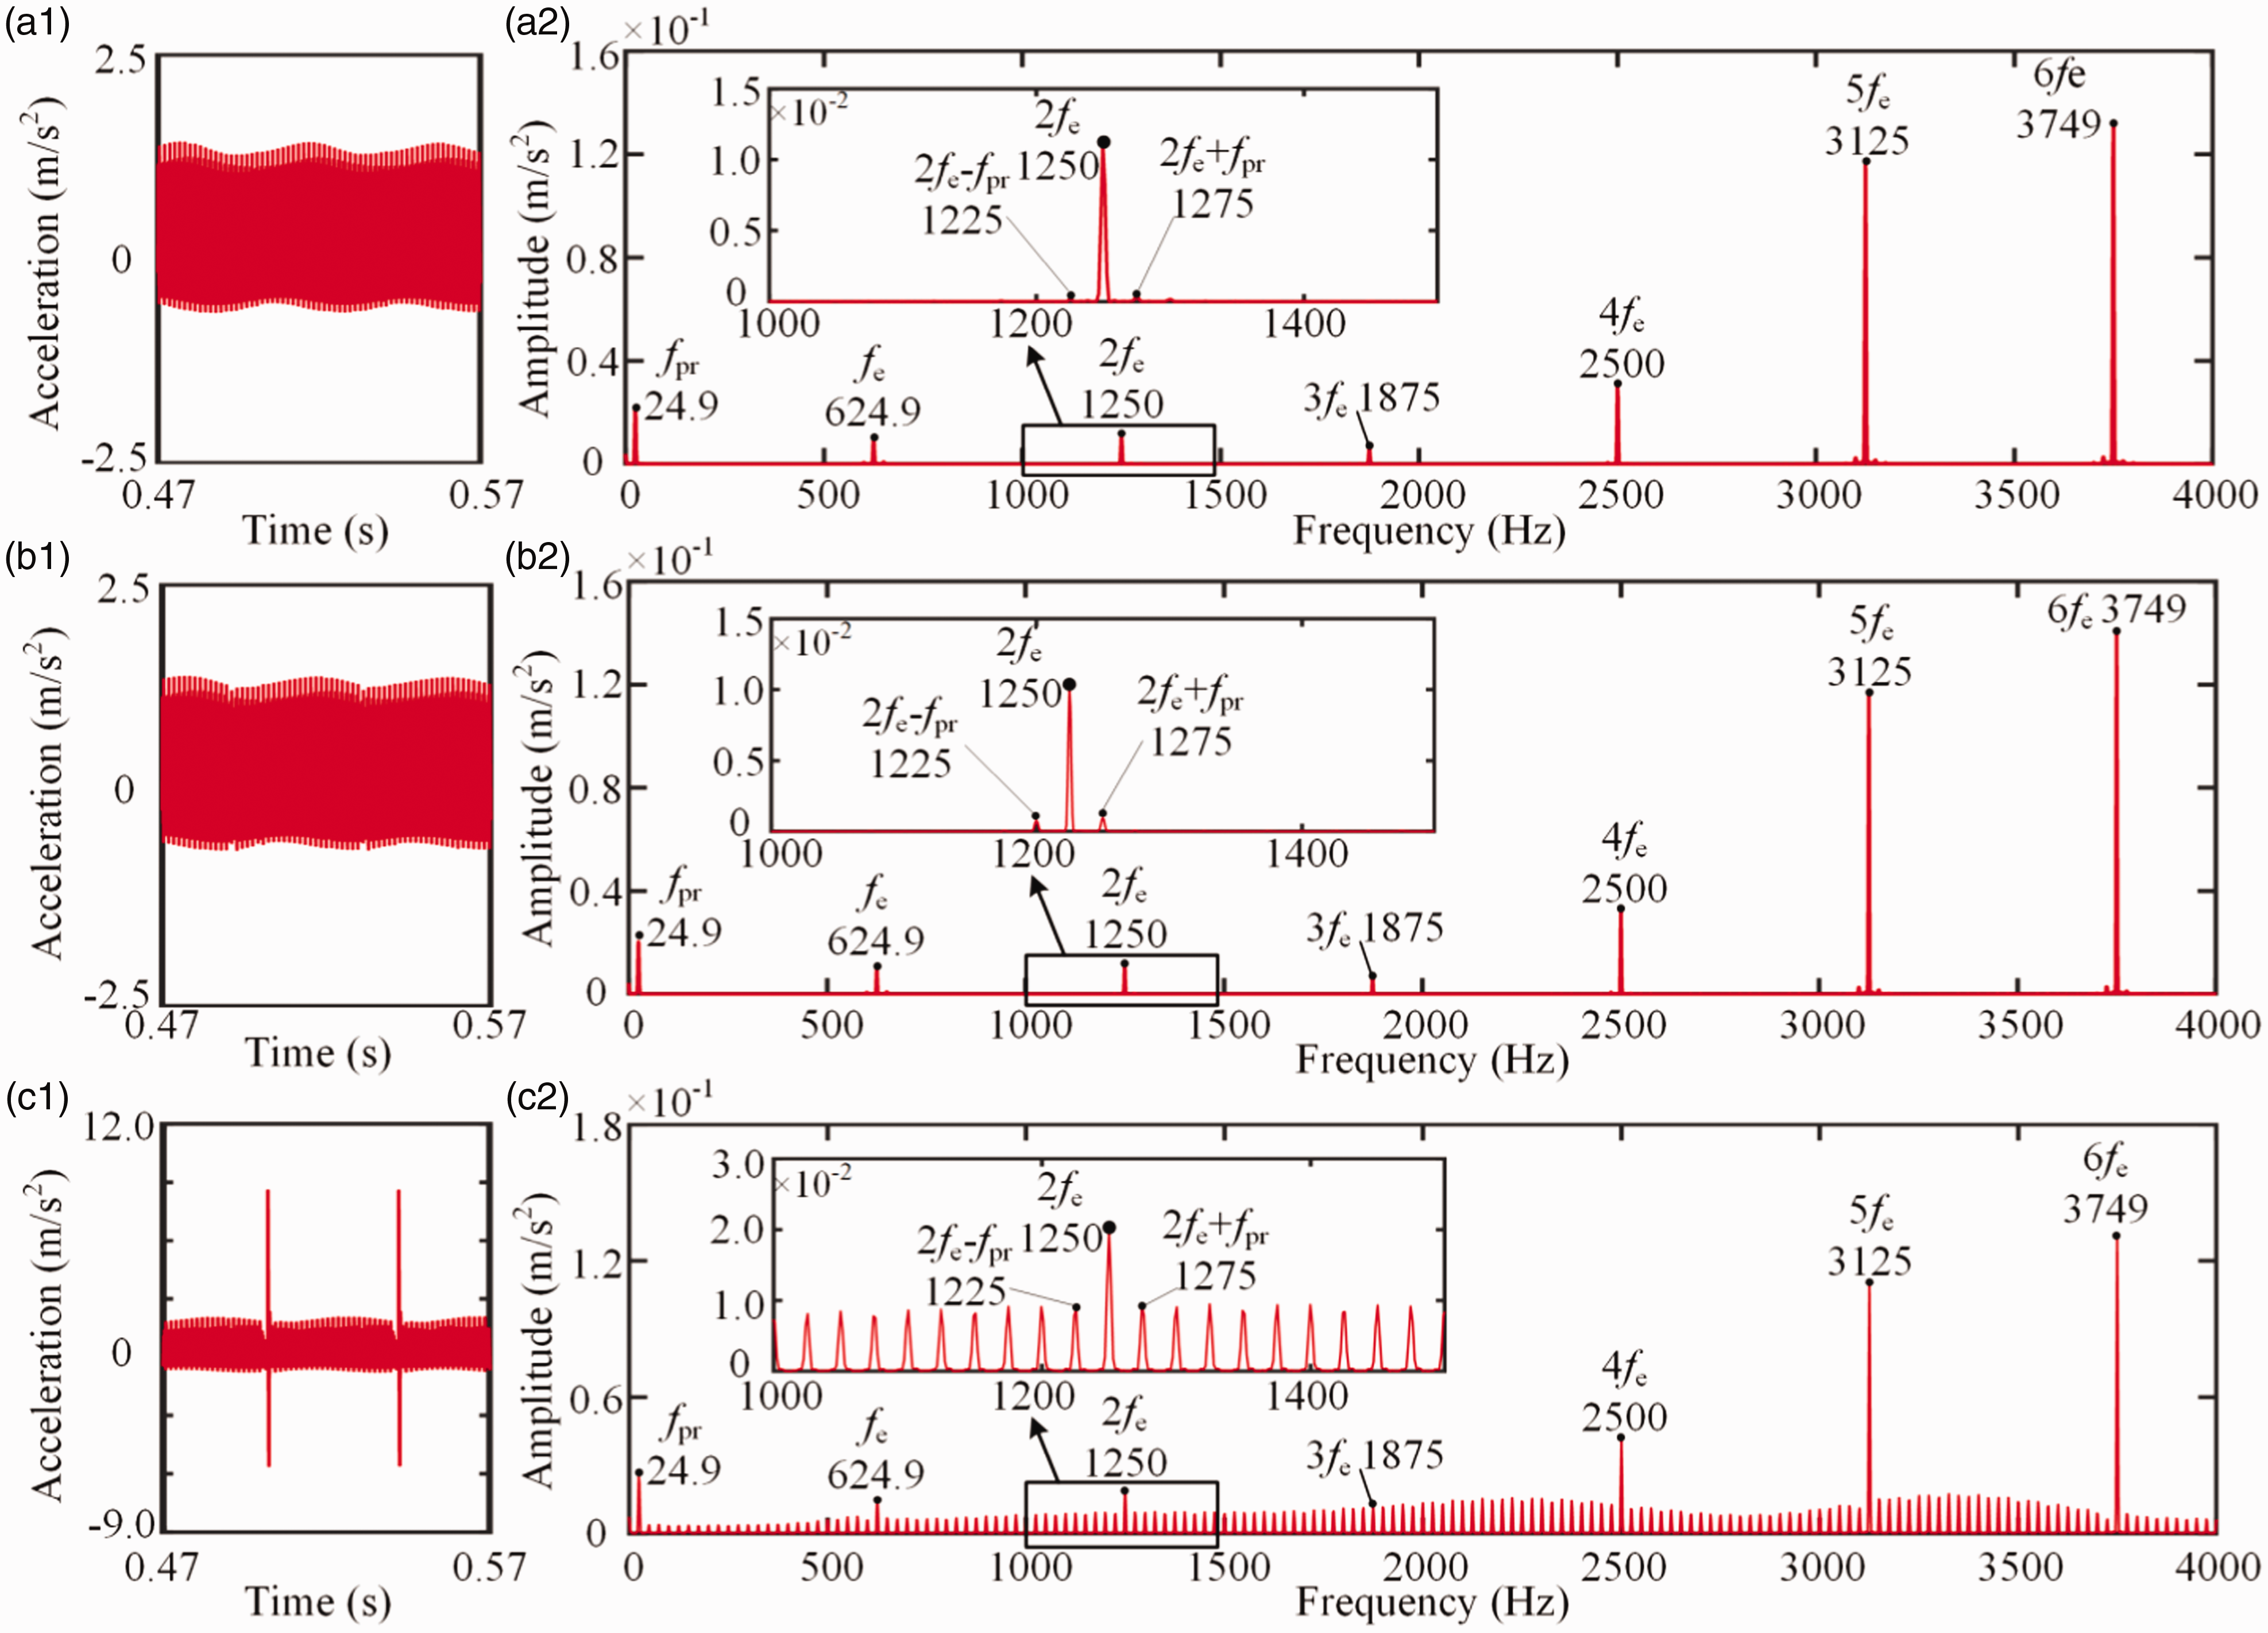
Acceleration of cracked gear under different crack lengths: (a) time- and frequency-domain signals under length 4 mm; (b) time- and frequency-domain signals under length 8 mm; and (c) time- and frequency-domain signals under length 15 mm.
In order to further analyze the influence of crack lengths on dynamic response of gear systems, the statistical indicators, rRMS and rKurtosis, under different crack lengths are shown in Figure 18. According to the results, as the fault severity increases, the values of rRMS and rKurtosis of vibration signal of cracked gear system increase gradually. Especially, for the gear system with tooth fracture fault, rRMS and rKurtosis increase dramatically.
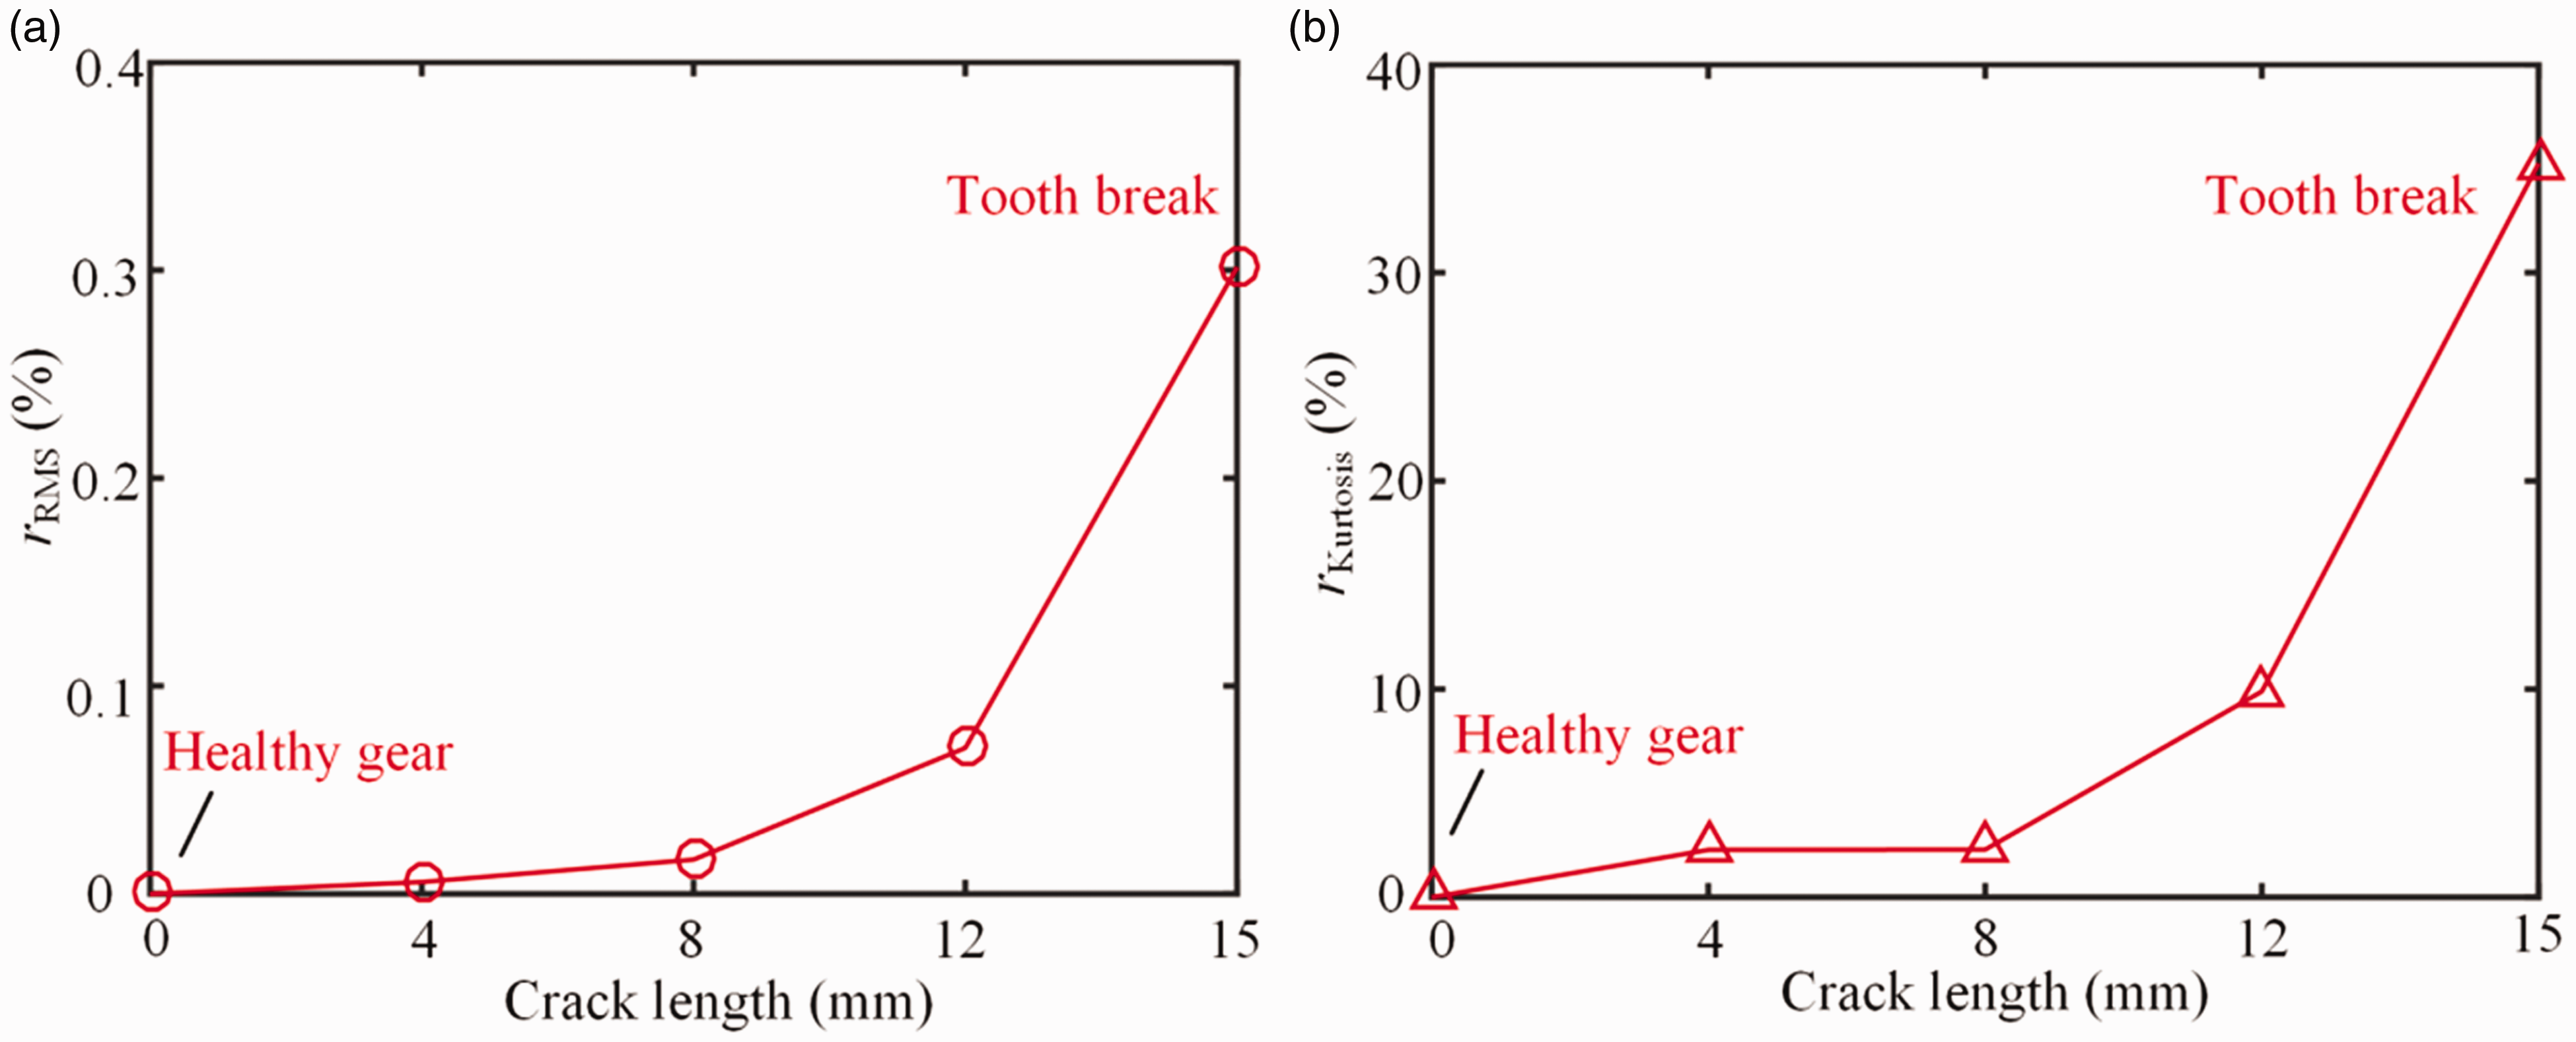
Statistical indicators under different crack lengths: (a) rRMS and (b) rKurtosis.
Comparison of vibration characteristics between crack and tooth fracture faults
Vibration signal under crack or tooth fracture faults
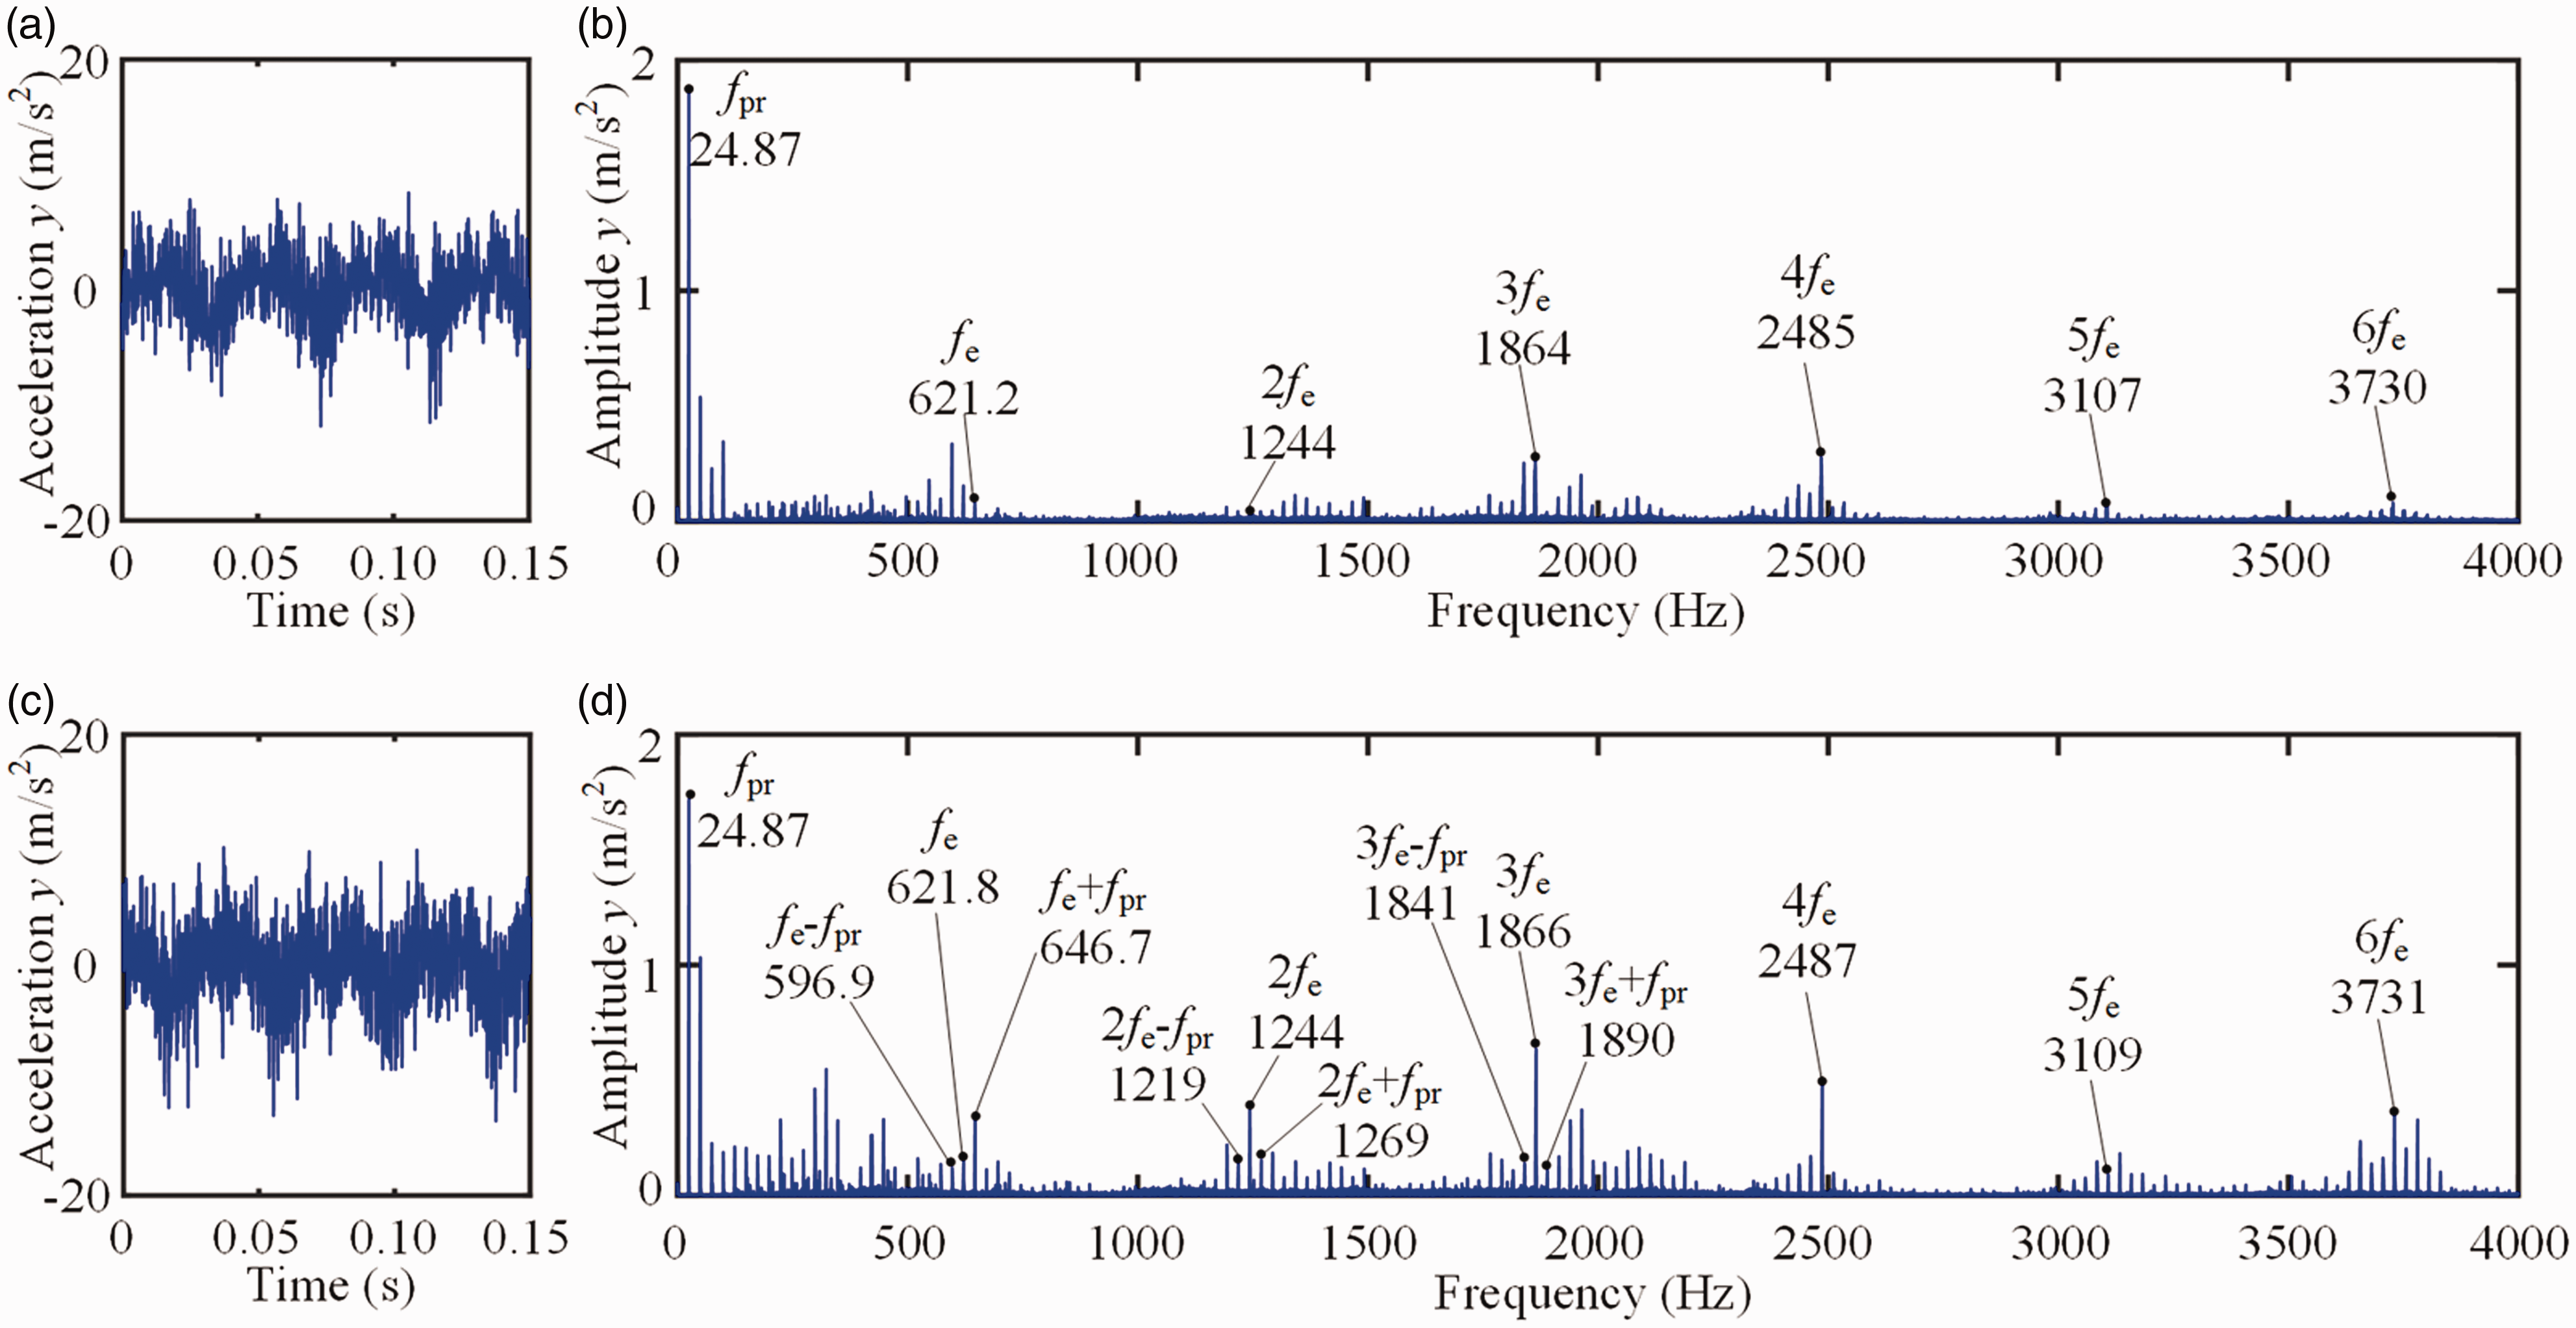
Based on the simulation model and experiment, this part mainly analyzes the vibration signals of gear systems with crack or tooth fracture faults. At the torque of 200 N·m, the time-domain vibration signals under crack and tooth fracture faults are shown in Figure 19. First, by comparing the vibration signals of two fault types, the vibration amplitude of gear system with tooth fracture fault is much larger than that of crack fault. Then, based on the comparison of vibration signals of crack fault obtained from the simulated and experimental methods, the impact characteristic of vibration signals obtained by simulation model is more obvious than that of the experimental method, which is influenced by the noise components in the experimental method. It should be noted that the impulse interval caused by the crack and broken tooth Δt is equal to the rotating period of driving shaft (see Figure 19), which also verifies the accuracy of the simulation model.
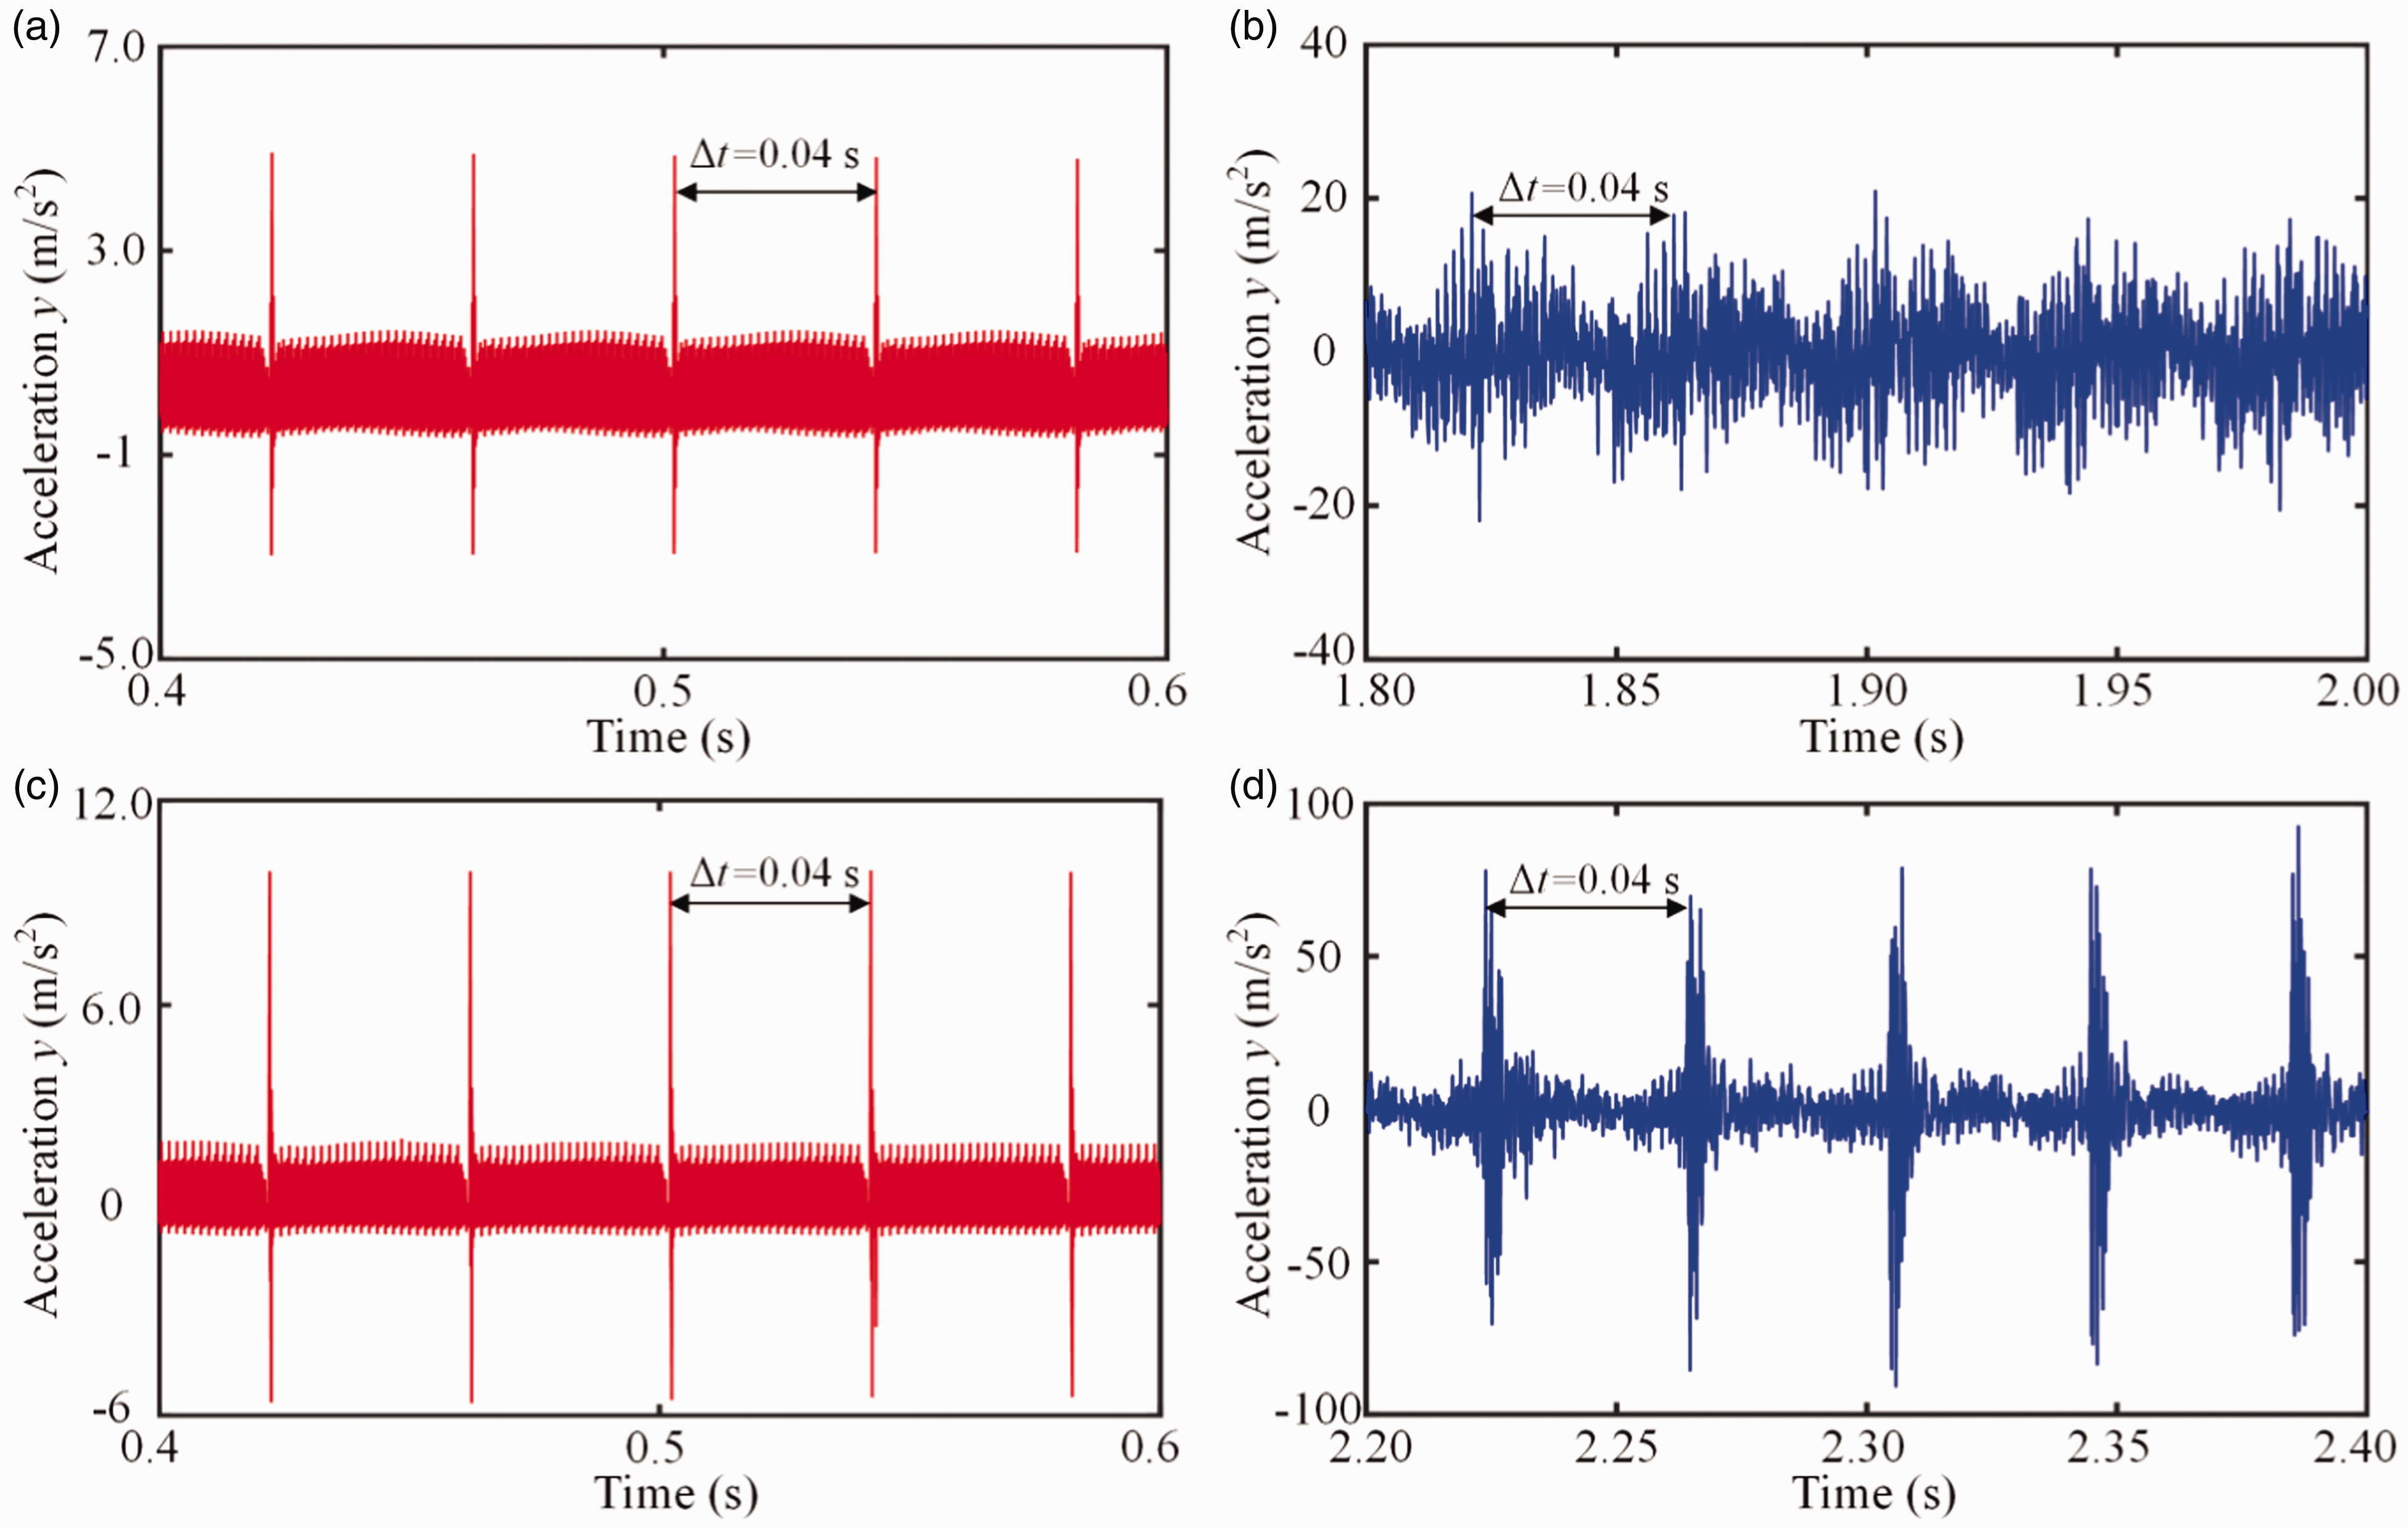
Time-domain signal under different faults: (a) simulated signal under crack fault; (b) experimental signal under crack fault; (c) simulated signal under tooth fracture fault; and (d) experimental signal under tooth fracture fault.
The amplitude spectrums under crack and tooth fracture faults are shown in Figure 20. By comparing the amplitude spectrum under crack and tooth break faults, it is found that the vibration amplitude of meshing frequency and its high-order harmonics increases obviously after tooth fracture. For the experimental results (see Figure 20(b) and (d)), the vibration amplitudes of sideband frequencies are more obvious than that of the simulation model. The main reason for the difference is that the flexibility of the gearbox housing, the nonlinear bearing stiffness, the assembly error, and the rotor eccentricity are not taken into account in the simulation.
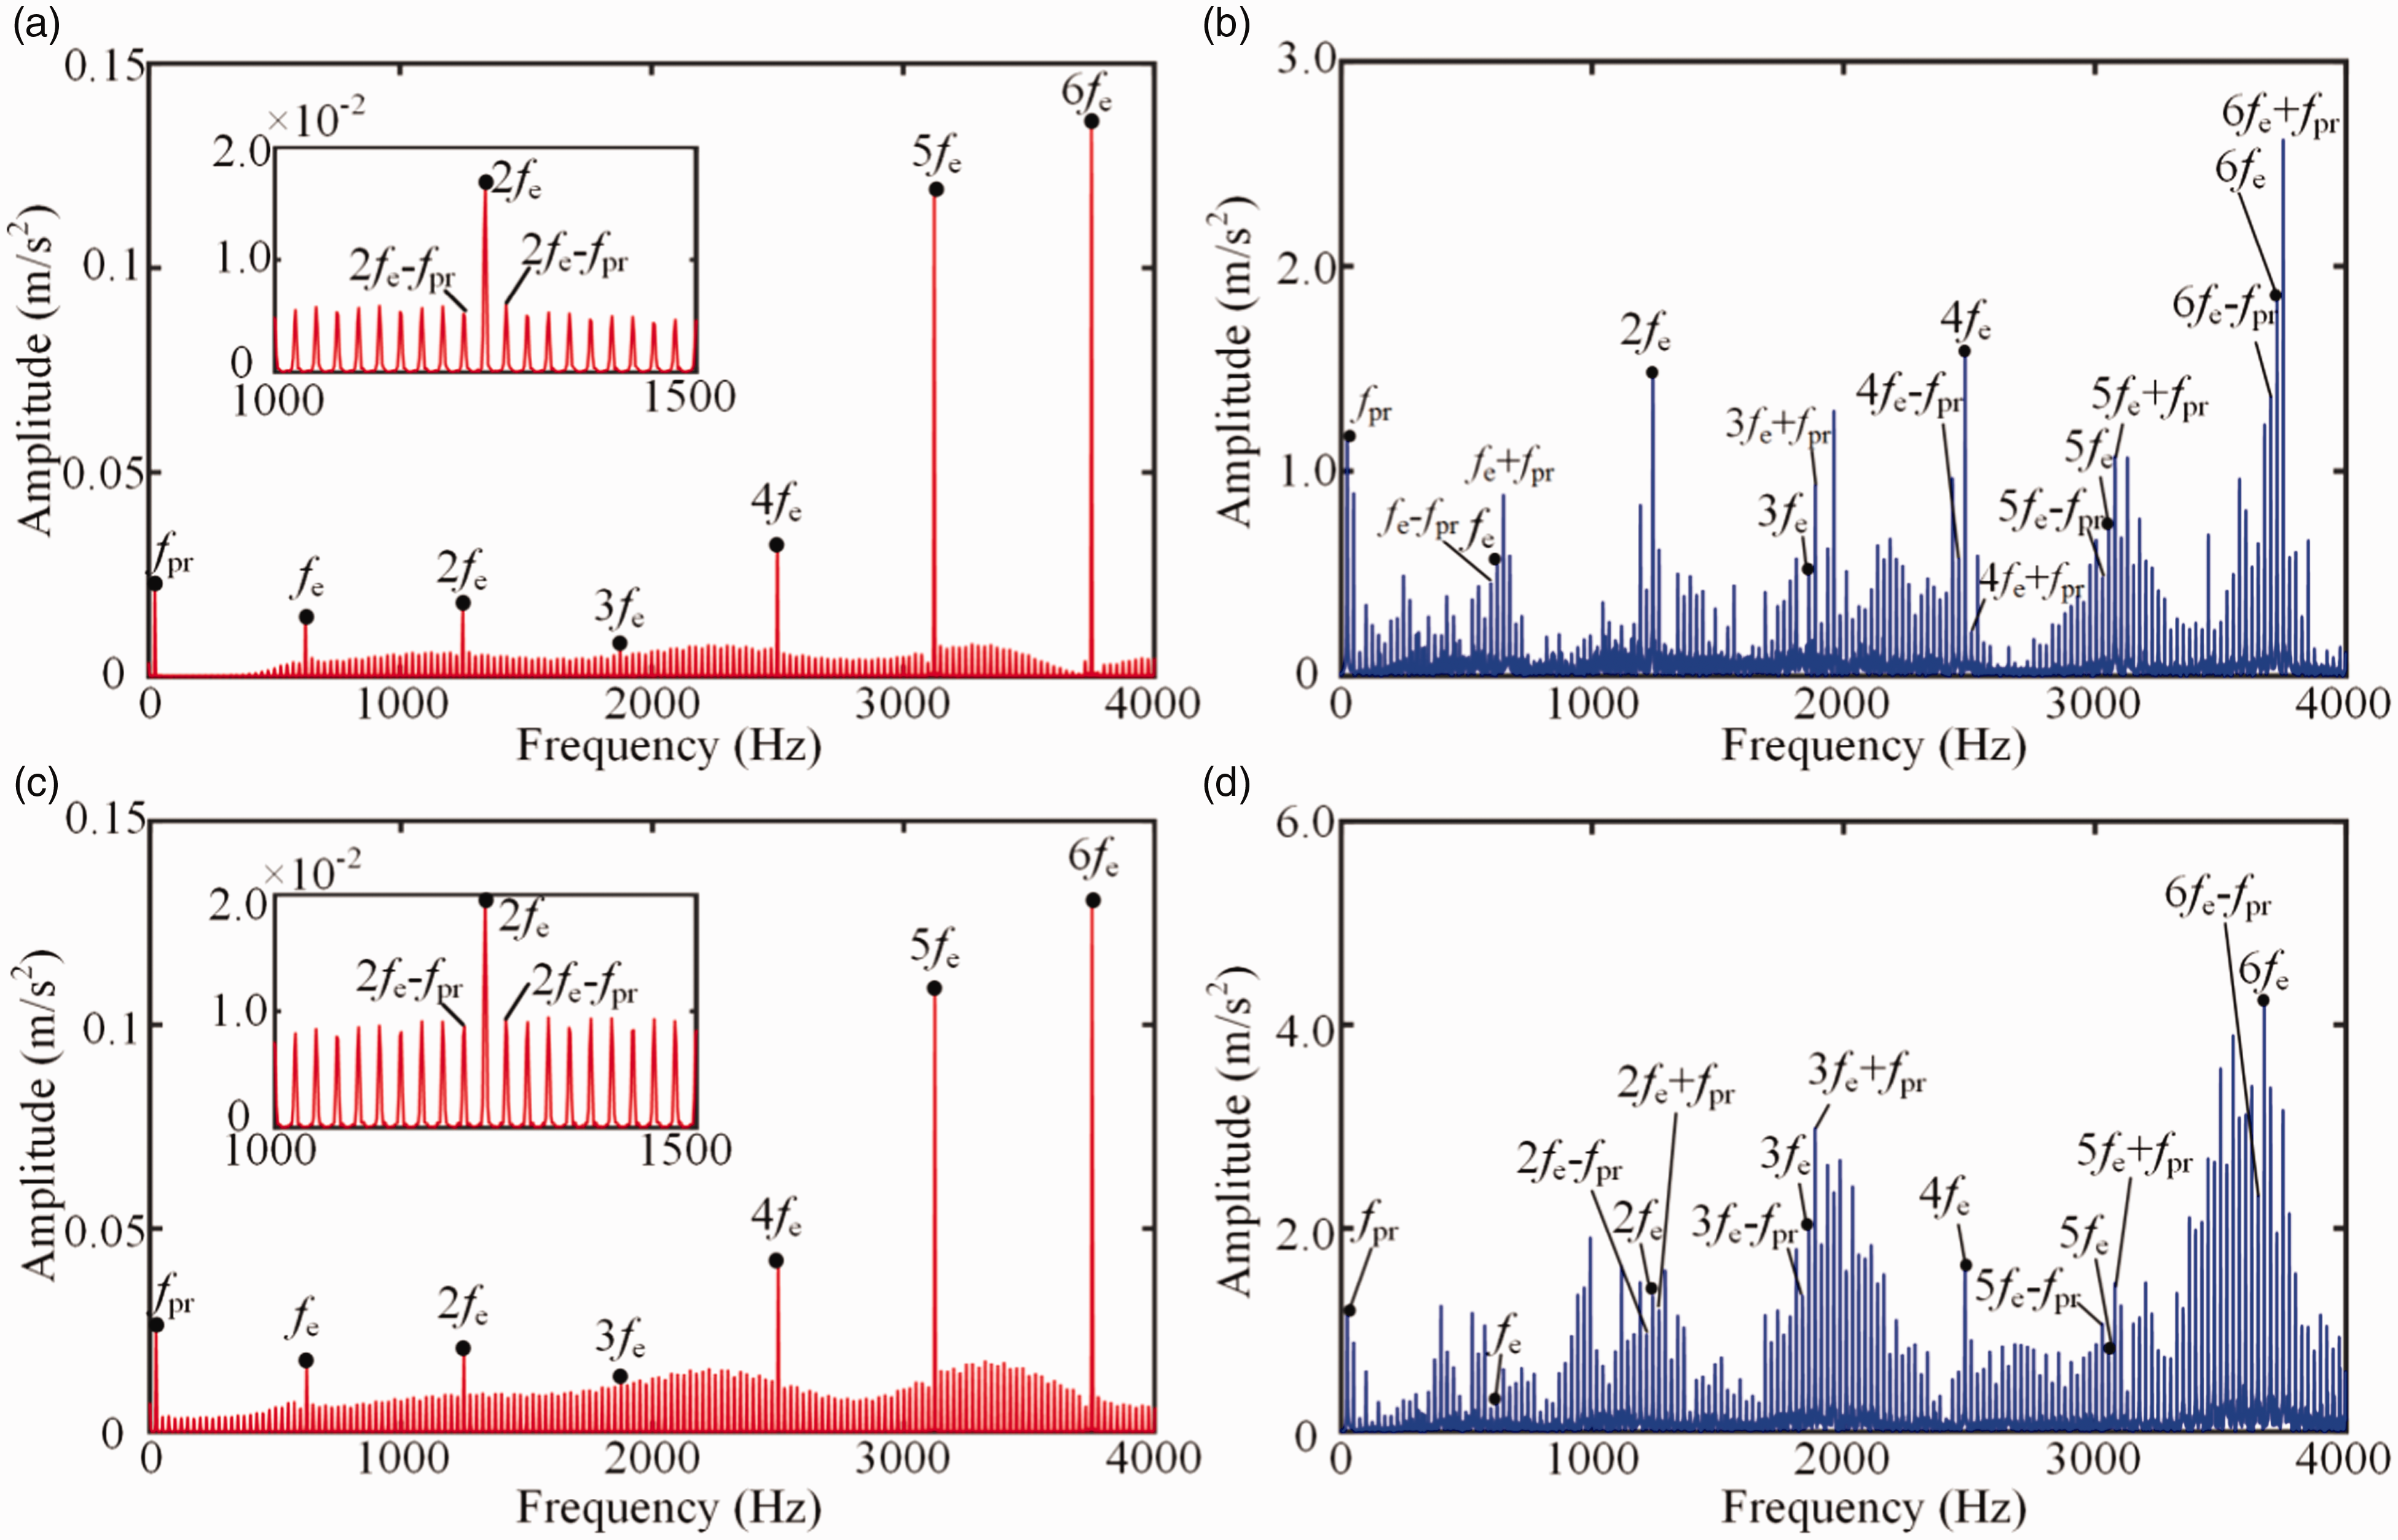
Amplitude spectrum under different faults: (a) simulated signal under crack fault; (b) experimental signal under crack fault; (c) simulated signal under tooth fracture fault; and (d) experimental signal under tooth fracture fault.
Instantaneous energy under crack and tooth fracture faults
Instantaneous energy is a summation of the square of the amplitude of a number of components, which owns great capability to highlight the transient impulse characteristic in noise contained signal.10,46 In this section, the instantaneous energy of gear system under crack and tooth fracture faults is obtained (see Figure 21). For the gear pairs under crack fault, the meshing process has small energy impact relative to that under tooth fracture fault (see Figure 21(a) and (c)), i.e., the tooth fracture fault will lead to the sudden change of the instantaneous energy. Meanwhile, it can be seen from Figure 21(c) and (d) that the instantaneous energy at the meshing position of broken tooth is enormous and the time interval of the huge energy impact is equal to the rotating period of the driving shaft Δt, which has similar change law with simulation model. According to the change of instantaneous energy, the energy impact caused by crack fault and tooth fracture fault is obvious, which provides an effective method for the fault diagnosis of gear pair under tooth fracture fault.
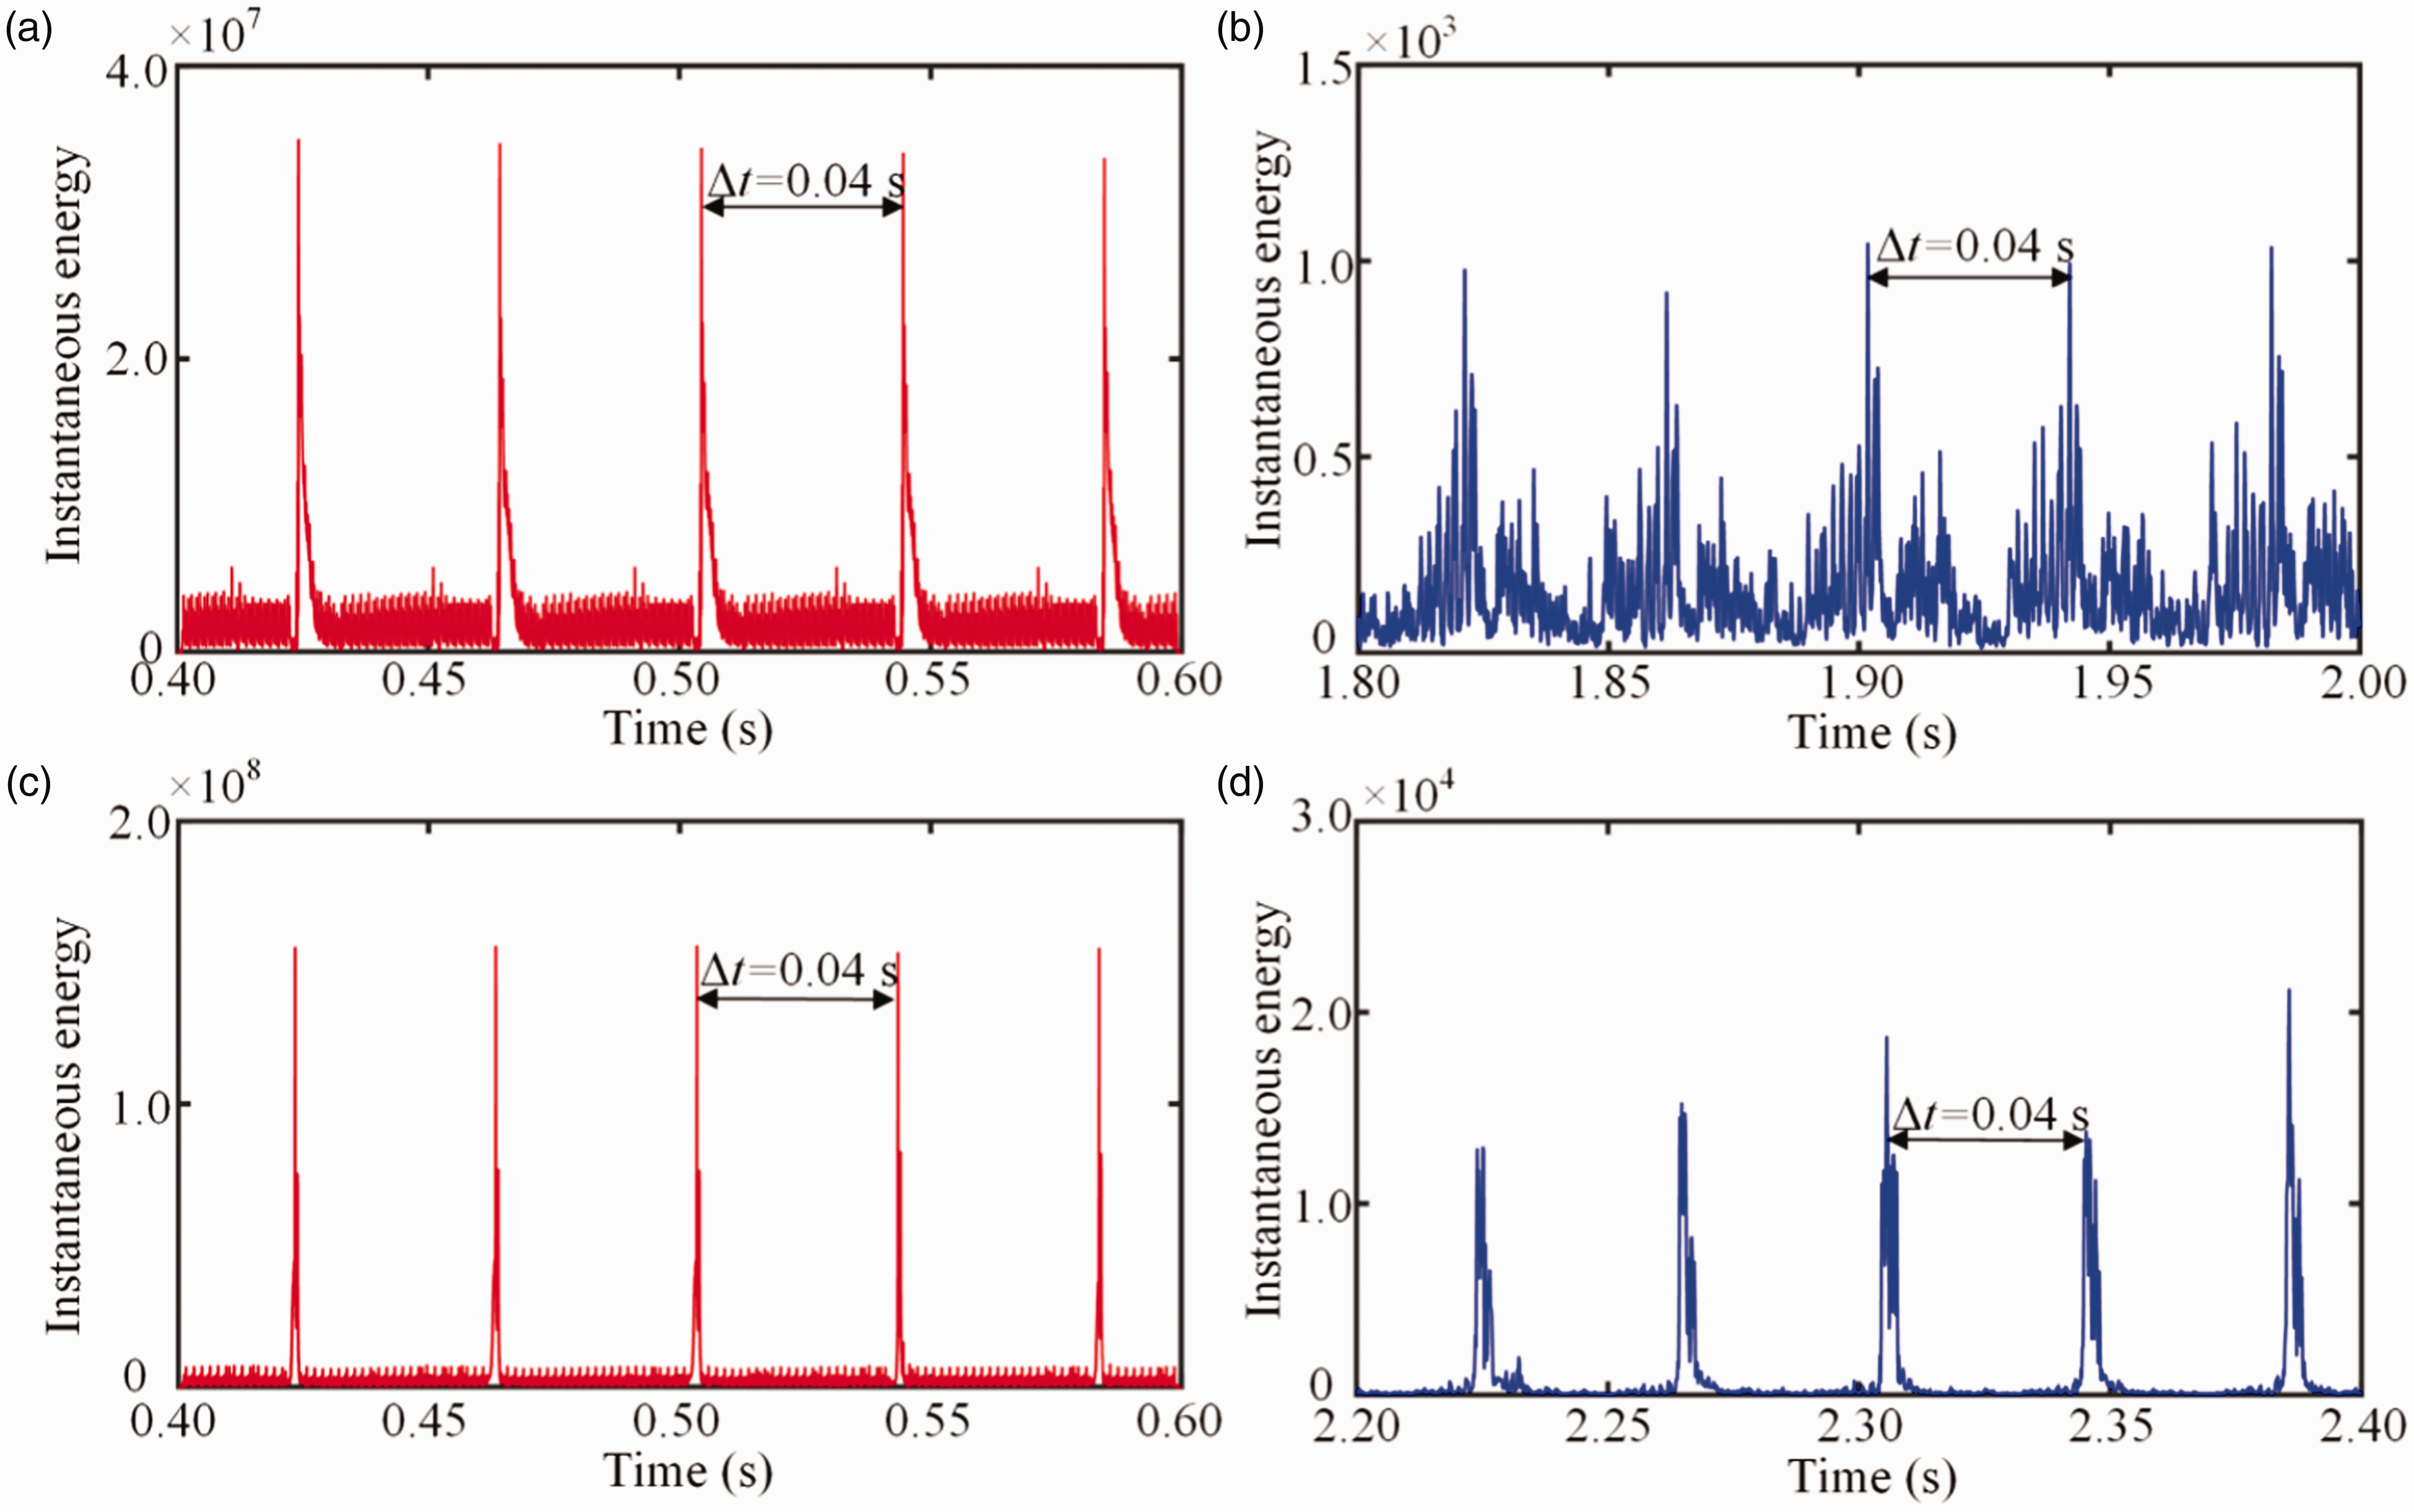
Instantaneous energy under different faults: (a) simulated signal under crack fault; (b) experimental signal under crack fault; (c) simulated signal under tooth fracture fault; and (d) experimental signal under tooth fracture fault.
Conclusions
Based on the fracture mechanics theory, the simulation of the tooth crack propagation is carried out. Then, the simulated crack propagation paths are imported into the multibody dynamic software ADAMS to establish the flexible body model of the gear pair with crack and tooth fracture faults. The simulated vibration signals under different torques are compared with those obtained from the experiment. Moreover, some statistical indictors (rRMS and rKurtosis) and the instantaneous energy are used to evaluate the vibration signals. Some conclusions can be drawn:
With the increase of torques, the sideband amplitudes of meshing frequency and its harmonics of cracked gear gradually increase. It is noted that the sideband amplitudes of meshing frequency and its harmonic of cracked gears are much larger than that of healthy gears. Meanwhile, based on the comparison between the simulated signal and the experimental signal, the simulation model can effectively reflect the fault feature of cracked gear systems. With the increase of crack lengths, the vibration amplitude of acceleration increases sharply. With the increase of crack lengths, the value of statistical indictors increases gradually. Especially, for the vibration signal under tooth fracture fault, the rRMS and rKurtosis of fault signals will increase sharply. According to the vibration signal of the tooth fracture fault, the broken tooth will result in the large impulse amplitude, and the sideband amplitudes of meshing frequency and its harmonic will be larger than that under crack fault. Based on the instantaneous energy, the tooth fracture will bring about significant energy impacts, which can be regard as the obvious difference between crack fault and broken tooth fault.
In the future, more signal analysis methods25,47,48 will be used to analyze the vibration characteristics of cylindrical gears with different faults, which will provide positive significance for the fault diagnosis of gear transmission systems.
Footnotes
Declaration of conflicting interests
The author(s) declared no potential conflicts of interest with respect to the research, authorship, and/or publication of this article.
Funding
The author(s) disclosed receipt of the following financial support for the research, authorship, and/or publication of this article: This project is supported by National Key R&D Program of China (Grant No. 2017YFB0304100), National Natural Science Foundation of China (Grant No. 51634002 and Grant No. 11772089), Fundamental Research Funds for the Central Universities (Grant No. N170308028 and N180306005), Program for the Innovative Talents of Higher Learning Institutions of Liaoning (LR2017035), and LiaoNing Revitalization Talents Program (Grant No. XLYC1807008).