
Abstract
To increase the productivity of injection molding machines, we developed a smart injection part weight stability control system based on C++ programming and domain knowledge. The proposed system is meant to eliminate variability in the quality of injected parts by adjusting the changeover position. We developed a viscosity index based on melt pressure data related to guide the adjustment to the changeover position in accordance with material properties. This was achieved by mounting a pressure sensor on the nozzle of the injection molding machine to enable the on-line monitoring of pressure throughout the injection molding process. A series of experiments was conducted to characterize the relationship between viscosity index and injection-molded samples in order to validate the efficacy of the proposed injection stability system. Single-factor experiments were conducted with the changeover position and melt temperature as parameters. The quality of the molded samples obtained under different process parameters was evaluated in terms of weight. Experiment results revealed a correlation between changes in viscosity index and changes in the weight of the samples. The injection stability system can also be operated in self-adjusting mode, in which the changeover position is varied according to viscosity index. In experiments, abnormal machine operations prompted the adjustment of changeover position. Variation in the weight of parts was used to define an index to validate the efficacy of the proposed system.
Keywords
Introduction
Labor shortages are a growing concern in many countries. From the marketing standpoint, the life cycle of products is becoming shorter even as quality standards rise. This is fueling the growth of Industry 4.0, the objective of which is to enhance quality and productivity through the adoption of smart technologies. Increased automation and smart machines are being developed to increase product quality and productivity.
Product quality can be affected by any number of external factors, such as the physical environment, process parameters, and material properties. In traditional manufacturing systems, consistency in product quality depends largely on the operator. Today, smart manufacturing can be used to improve product quality through adaptive process control (APC).
Injection molding process can be divided into seven major stages: plasticization, clamping, filling, packing, cooling, demolding, and ejecting. The filling and packing stages are the most important in terms of product quality. The time between the filling stage and packing stage is referred to as the changeover point. Setting the changeover too early can result in an unfilled cavity (i.e., short shot) or molding defects. Setting the changeover too late can result in overshot, resulting in flash or excessive internal stress. The most popular method to determine the optimal changeover point is controlled by screw position. In this study, we adjusted the changeover position according to the position of the barrel.
We also applied APC to mediate instability in the injection molding process with the aim of enhancing product quality. The fact that the weight of a molded item is related to its quality means that consistency in the weight of items could be used as an indicator of consistency in product quality. The pressure–volume–temperature (P-V-T) relationship in the melt dictates that inconsistencies in the specific volume can be attributed to variations in pressure and temperature. Difficulties in measuring the specific volume in injection molding processes prompted us to develop the viscosity index (VI), proposed in literature1,2, to represent the relationship between the weight of a molded item and its material properties. The VI was calculated by mounting a pressure sensor at the nozzle of the injection molding machine to determine the melt pressure. We adopted the method described in Orzechowski and Dobbin 3 to calculate the integral of the melt pressure. Experiment results in that study revealed that the influence of the melt pressure on quality far exceeds that of the melt temperature.
We also mounted a sensor within the cavity, as in previous research. Huang 4 proposed the use of the Grey model to determine the changeover point instantaneously simply by monitoring the cavity pressure profile in each cycle. Stable quality is the result of consistent cavity pressure profiles. Wang and Mao 5 proposed a method to control molding quality based on the P-V-T relationship. In that study, process pressure was controlled by a cavity sensor rather than as a function of time. The fact that the relationship between pressure and temperature can be controlled means that the specific volume (or weight of the part) can be controlled according to the invariable P-V-T relationship of the melt.
A smart servo-controlled hydraulic system was used in Lin 6 to elucidate the hardware required for APC over injection molding parameters. That system simulates control over pressure and velocity during the injection molding process. In experiments, they considered overshoot, response time, and RMSD as indexes to evaluate the performance of the system. Previous research has shown that data acquisition at high sampling rates is necessary to achieve performance targets. A servo-proportional valve was used in one study; however, that scheme did not provide the accuracy required for screw position control. In this study, we adopted a servo valve to increase the accuracy of screw position control.
We developed a novel control system, namely the smart injection part weight stability control system, to enable the on-line calculation of a VI in each cycle. As mentioned earlier, the proposed self-adjusting scheme attempts to derive the relationship between viscosity and part weight (VI) which used in adjusting the changeover position in response to external conditions. We adopted variations in the weight of molded items as an index to evaluate the efficacy of the proposed system.
Methods and experiment setups
Injection molding process
Figure 1 presents a flow chart showing the process of injection molding. Plastic is first poured into the hopper and then transported to the barrel, where it is melted. The barrel compresses the plasticized material (the melt), which forces it to move along a designated path. During the filling stage, the melt is driven out of the nozzle at high velocity under high pressure to fill the mold cavity. During the packing stage, the barrel continues compressing the melt to compensate for the loss of volume. After the cooling stage, the mold opens to eject the completed part.
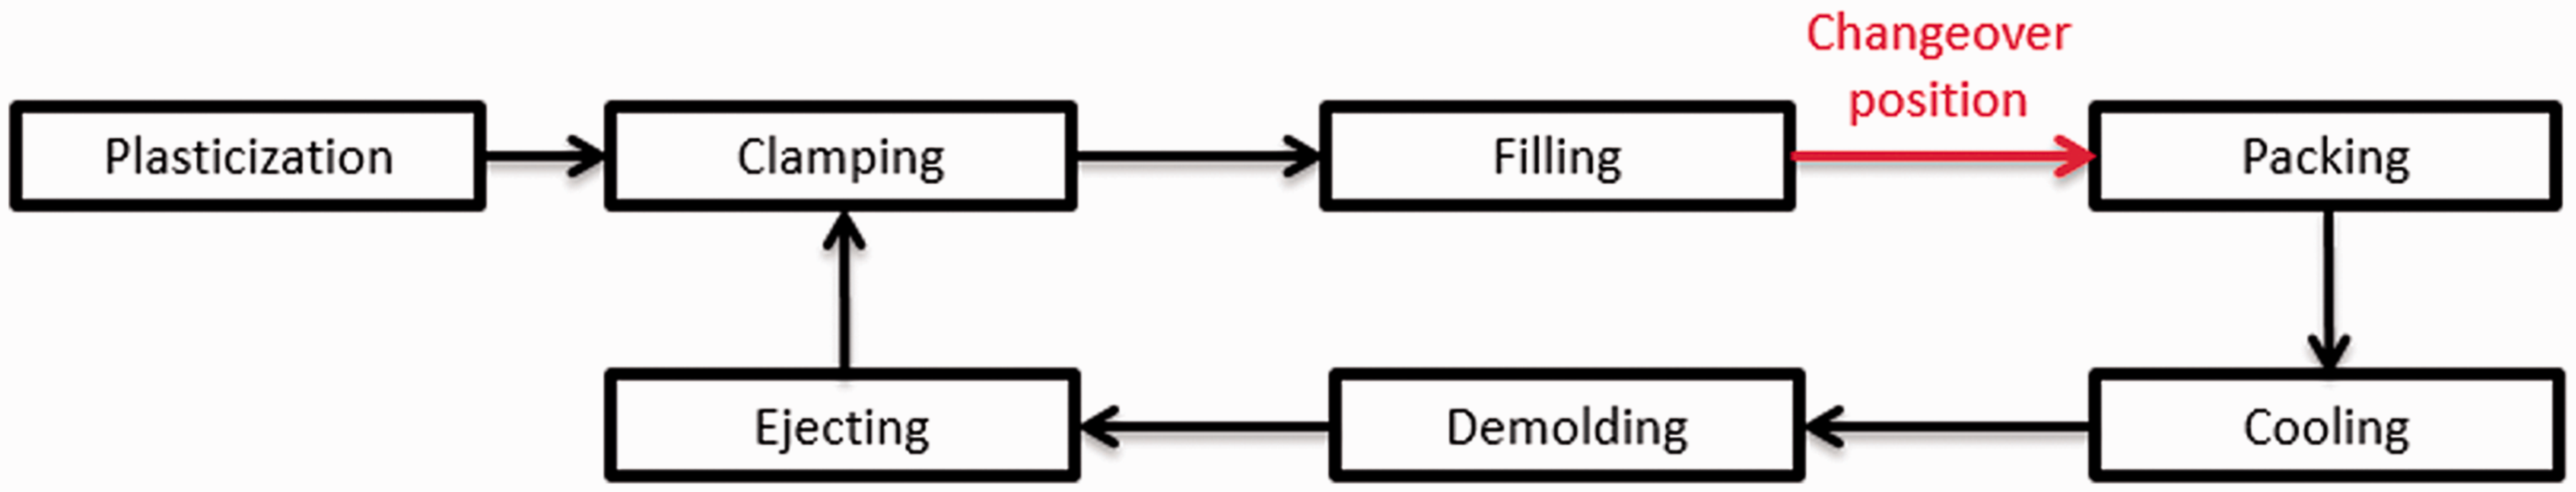
Flow chart of injection molding process.
Viscosity index
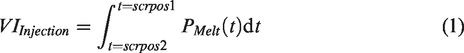
During injection molding, the properties of a material can vary considerably. High-viscosity materials generally required high injection pressure in order to obtain samples with a specific weight. We sought to characterize the material properties during the injection molding process by formulating a VI, as follows:
We used a pressure sensor to measure the melt pressure in order to calculate the VI. Pressure sensors are generally mounted either in the cavity or at the nozzle. In this study, the changeover position was deemed a key factor in controlling the weight of samples, which meant that the pressure profile during the filling stage was more important than the pressure profile during the packing stage.
The experiment results in Kruppa and Holzinger 2 , revealed that when using a pressure sensor at the nozzle, the pressure profiles during filling varied with the material, whereas the pressure profiles during packing remained unchanged. When using a pressure sensor in the cavity, pressure profiles during filling did not vary, whereas pressure profiles during packing varied noticeably. Based on differences between filling pressure profiles, we deduced that mounting a pressure sensor at the nozzle would be preferable; i.e., pressure measurements obtained in the cavity could be disregarded in calculating the VI.
Adaptive process control
In some systems, the parameters are largely indeterminate and tend to change radically. For example, the weight and center of gravity of an aircraft changes as it uses up its fuel supply. Conventional control schemes are able to resist only slight changes in the system. Under APC, the system is initially unstable and remains so until it is able to track the input values, whereupon the stability exceeds that of conventional method.
In injection molding, the material properties can vary with the environmental conditions and/or process variations, causing inconsistencies in product quality. In this study, we adopted a semi-empirical APC method to determine the changeover position. First, define the appropriate VI as the VI for a process which can generate good quality injection-molded parts. During production, with pressure history data, VI for each injection shot can be found by integrating the pressure data through time as shown in equation (1). Repeat molding experiments three consecutive times and obtains average viscosity index (VIave) by averaging the three VI values from the experiments. Next, calculate deviation (D) defined by equation (2). After that, changeover position can be adjusted according to VIave range as shown in equation (3). This paper classified the VI into five intervals. The tolerance (t) and coefficient of tolerance(c) are user defined. Then, changeover position would be determined based on the value of VIave. α and β are constants and β is larger than α

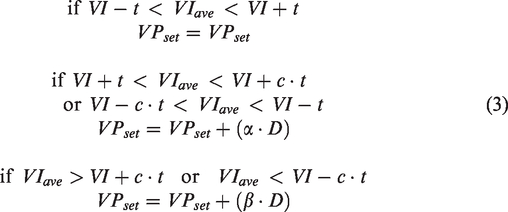
Under different production process, the parameters VI, t, c, α, and β are different and can be determined by injection molding experiments. About 20 shots of experiments are needed to determine all the parameters. For example, for the case under 200°C melt temperature, VI was 325 MPa·s, t was 3 MPa·s, c was 6, α was 0.03, and β was 0.075. The experiment results with APC are shown in “Self-adjusting mode experiments” section.
Experiment setups
General purpose polypropylene was used in the injection molding of a dozen plastic knives, the mold which is shown Figure 2. A pressure sensor with sensitivity of 3.3 mV/bar (Gefran IJ-85179A) was mounded at the nozzle to measure melt pressure. The pressure sensor is able to withstand temperatures of up to 350°C, which is sufficient for the melt in this study.
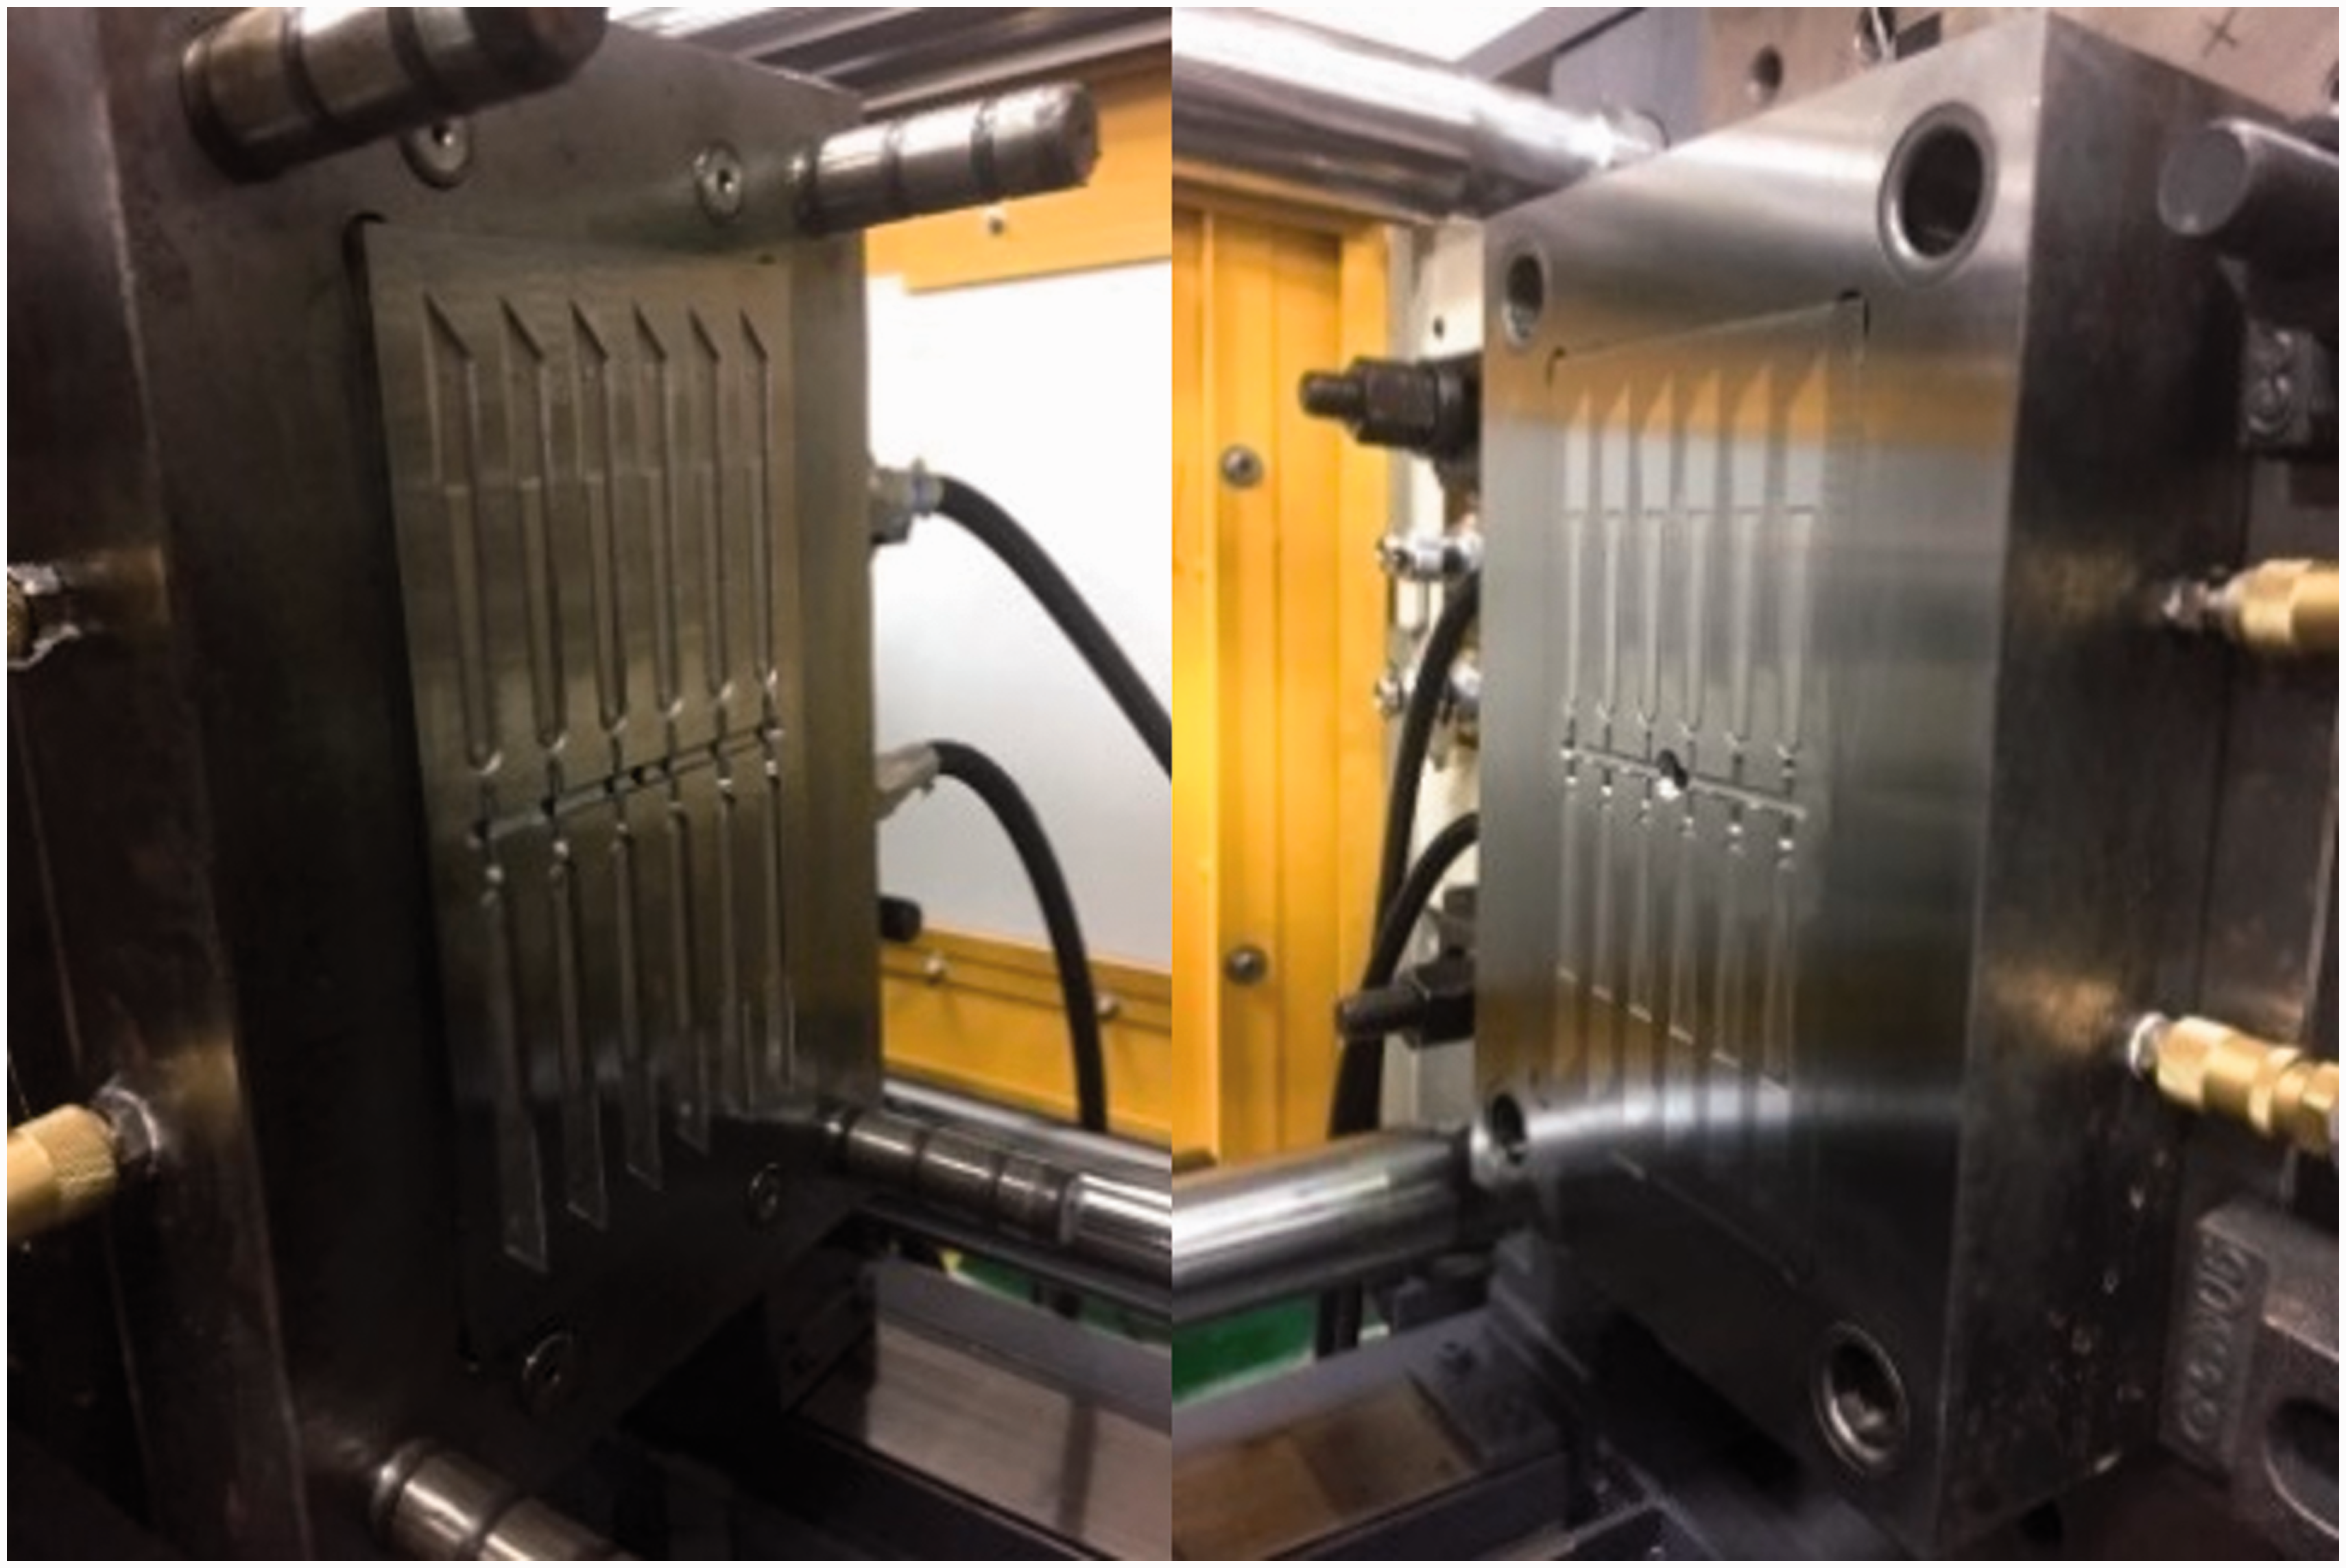
The mold of the knives sample.
Figure 3 presents the smart injection part weight stability control system. A 60-ton injection molding machine (CLF-60TX, Chuan Lih Fa Co., Ltd, Tainan, Taiwan) with a machine controller (MIRLE Automation Corporation) was used to fabricate samples under a variety of process parameters. A data acquisition module (USB-4716, Advantech Co., Ltd) with high sampling rate (20 kHz) was used to obtain melt pressure data.
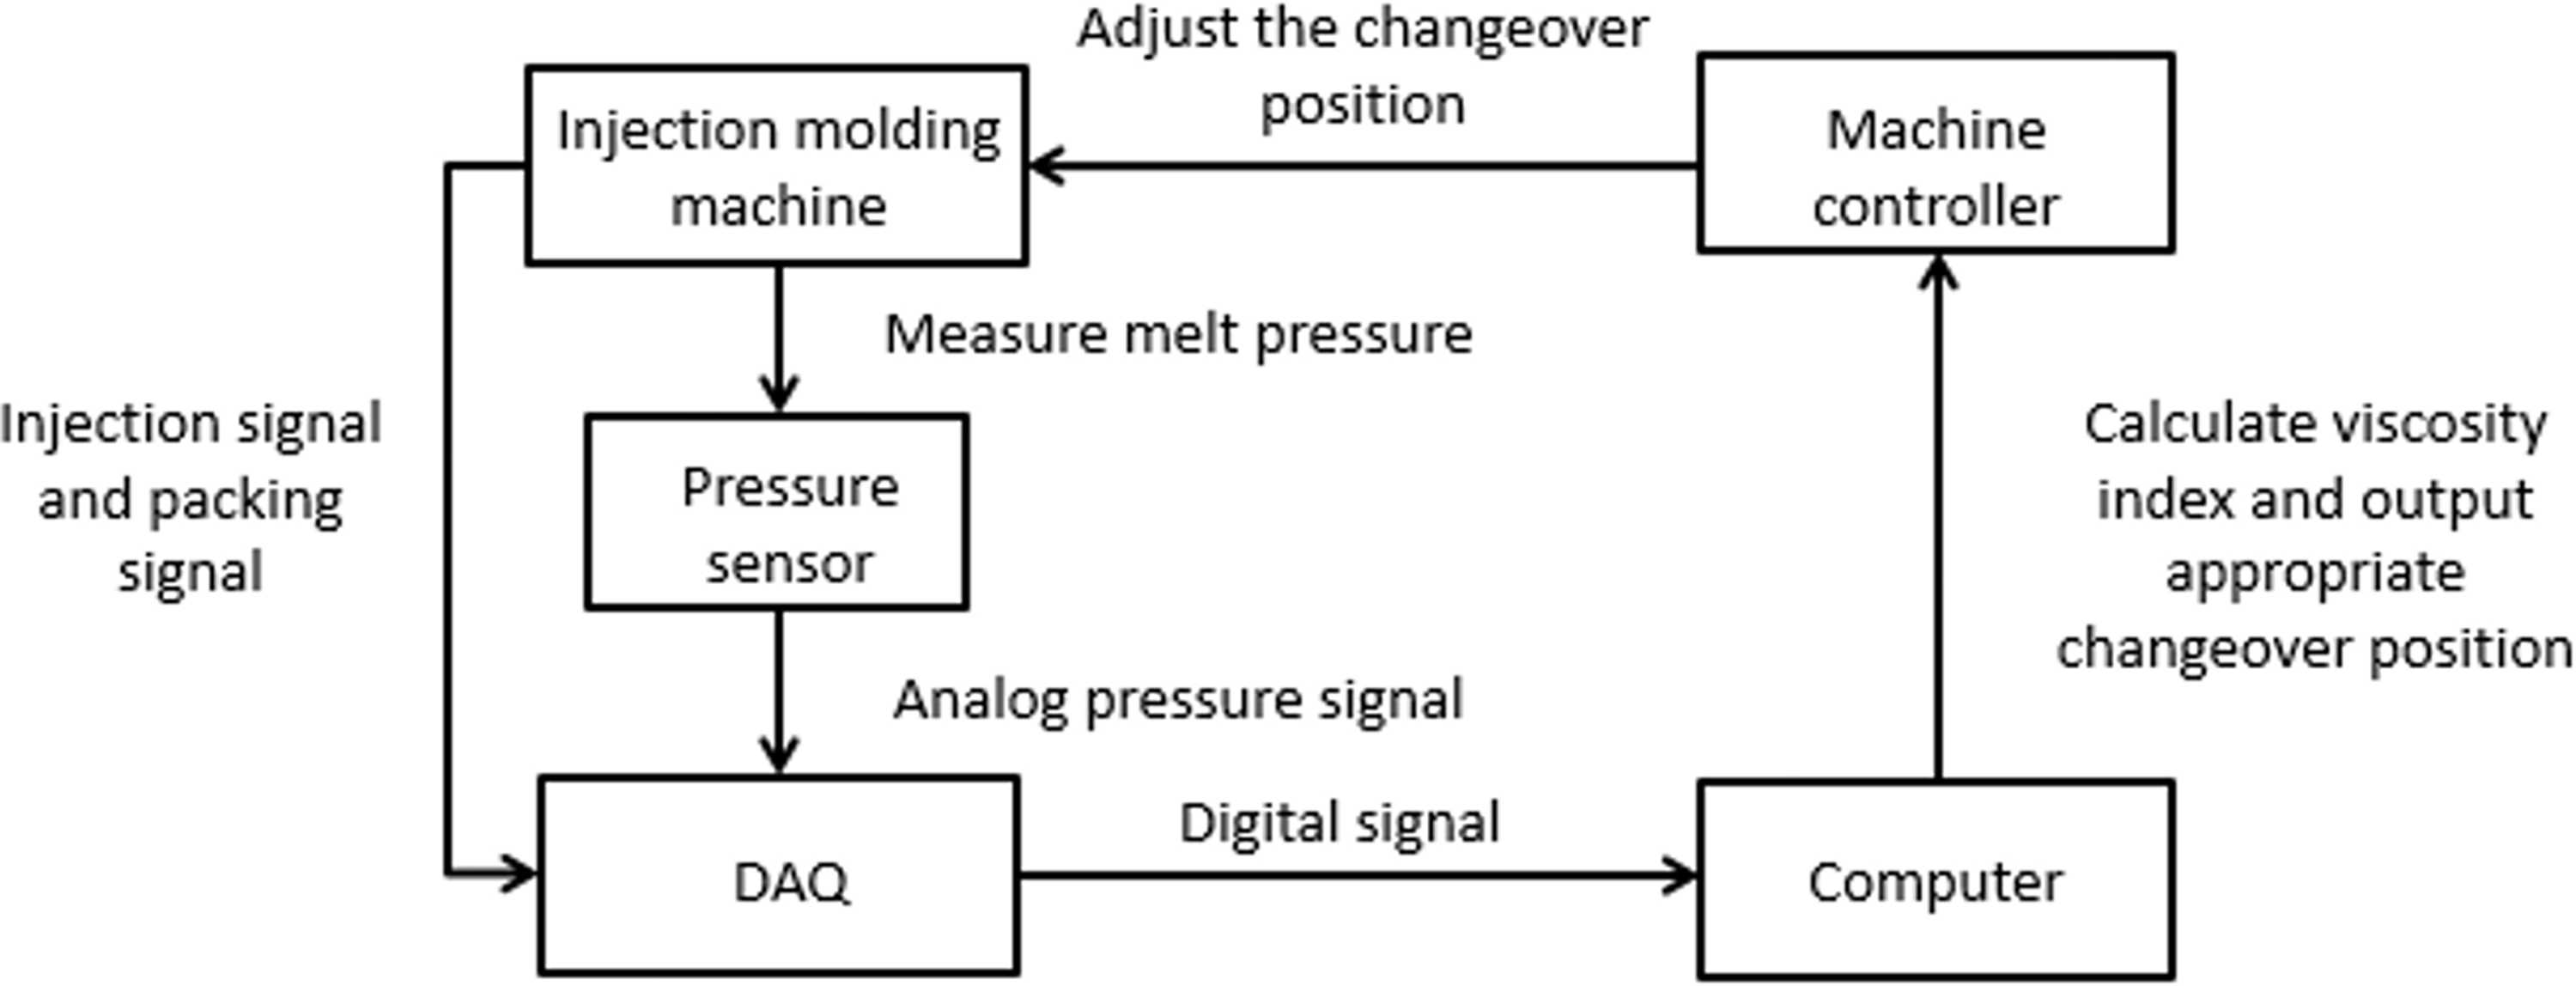
Procedure of the smart injection part weight stability control system.
Analog signals from the pressure sensor were sent to the data acquisition unit. The range of the VI was calculated by sending analog signals obtained during the filling and packing stages from the injection molding machine to the data acquisition unit. The data acquisition unit transmitted digital pressure-related data to the computer for analysis. A melt pressure profile appeared on the human–machine interface. The VI during each cycle was recorded to monitor the production history. In self-adjusting mode, the computer output changeover positions to the machine controller via a cable connection.
A series of experiments were conducted to characterize the relationship between the VI and the weight of the molded items. The changeover position and melt temperature were the parameters in these single-factor experiments. The process parameters are listed in Table 1. Experiments were conducted using various melt temperatures to verify the efficacy of the self-adjusting schema. We also formulated an index representing variations in the weight of the samples to quantify the stability of product quality in this study. The index is calculated as follows

Process parameters.
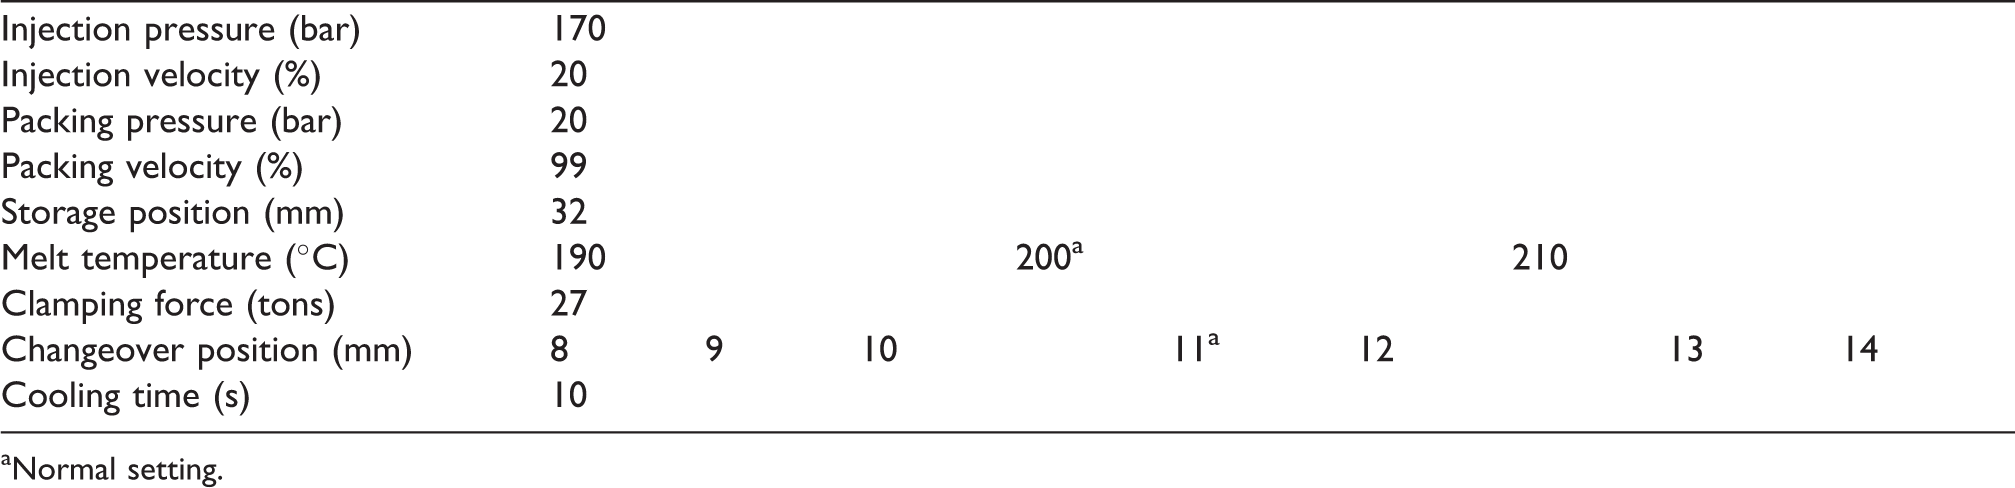
aNormal setting.
Experiment result and discussions
Single factor experiment of the changeover position
Our objective in this experiment was to characterize the relationship between the VI and the weight of samples fabricated using different changeover positions with the melt temperature set as 200°C. Figure 4 shows the distribution of the VI and weight of the molded parts. Figure 5 shows the distribution of the VI with different changeover positions. Figure 6 shows the distribution of the part weight with different changeover positions. Table 2 lists the variations in the VI and part weight with different changeover positions.
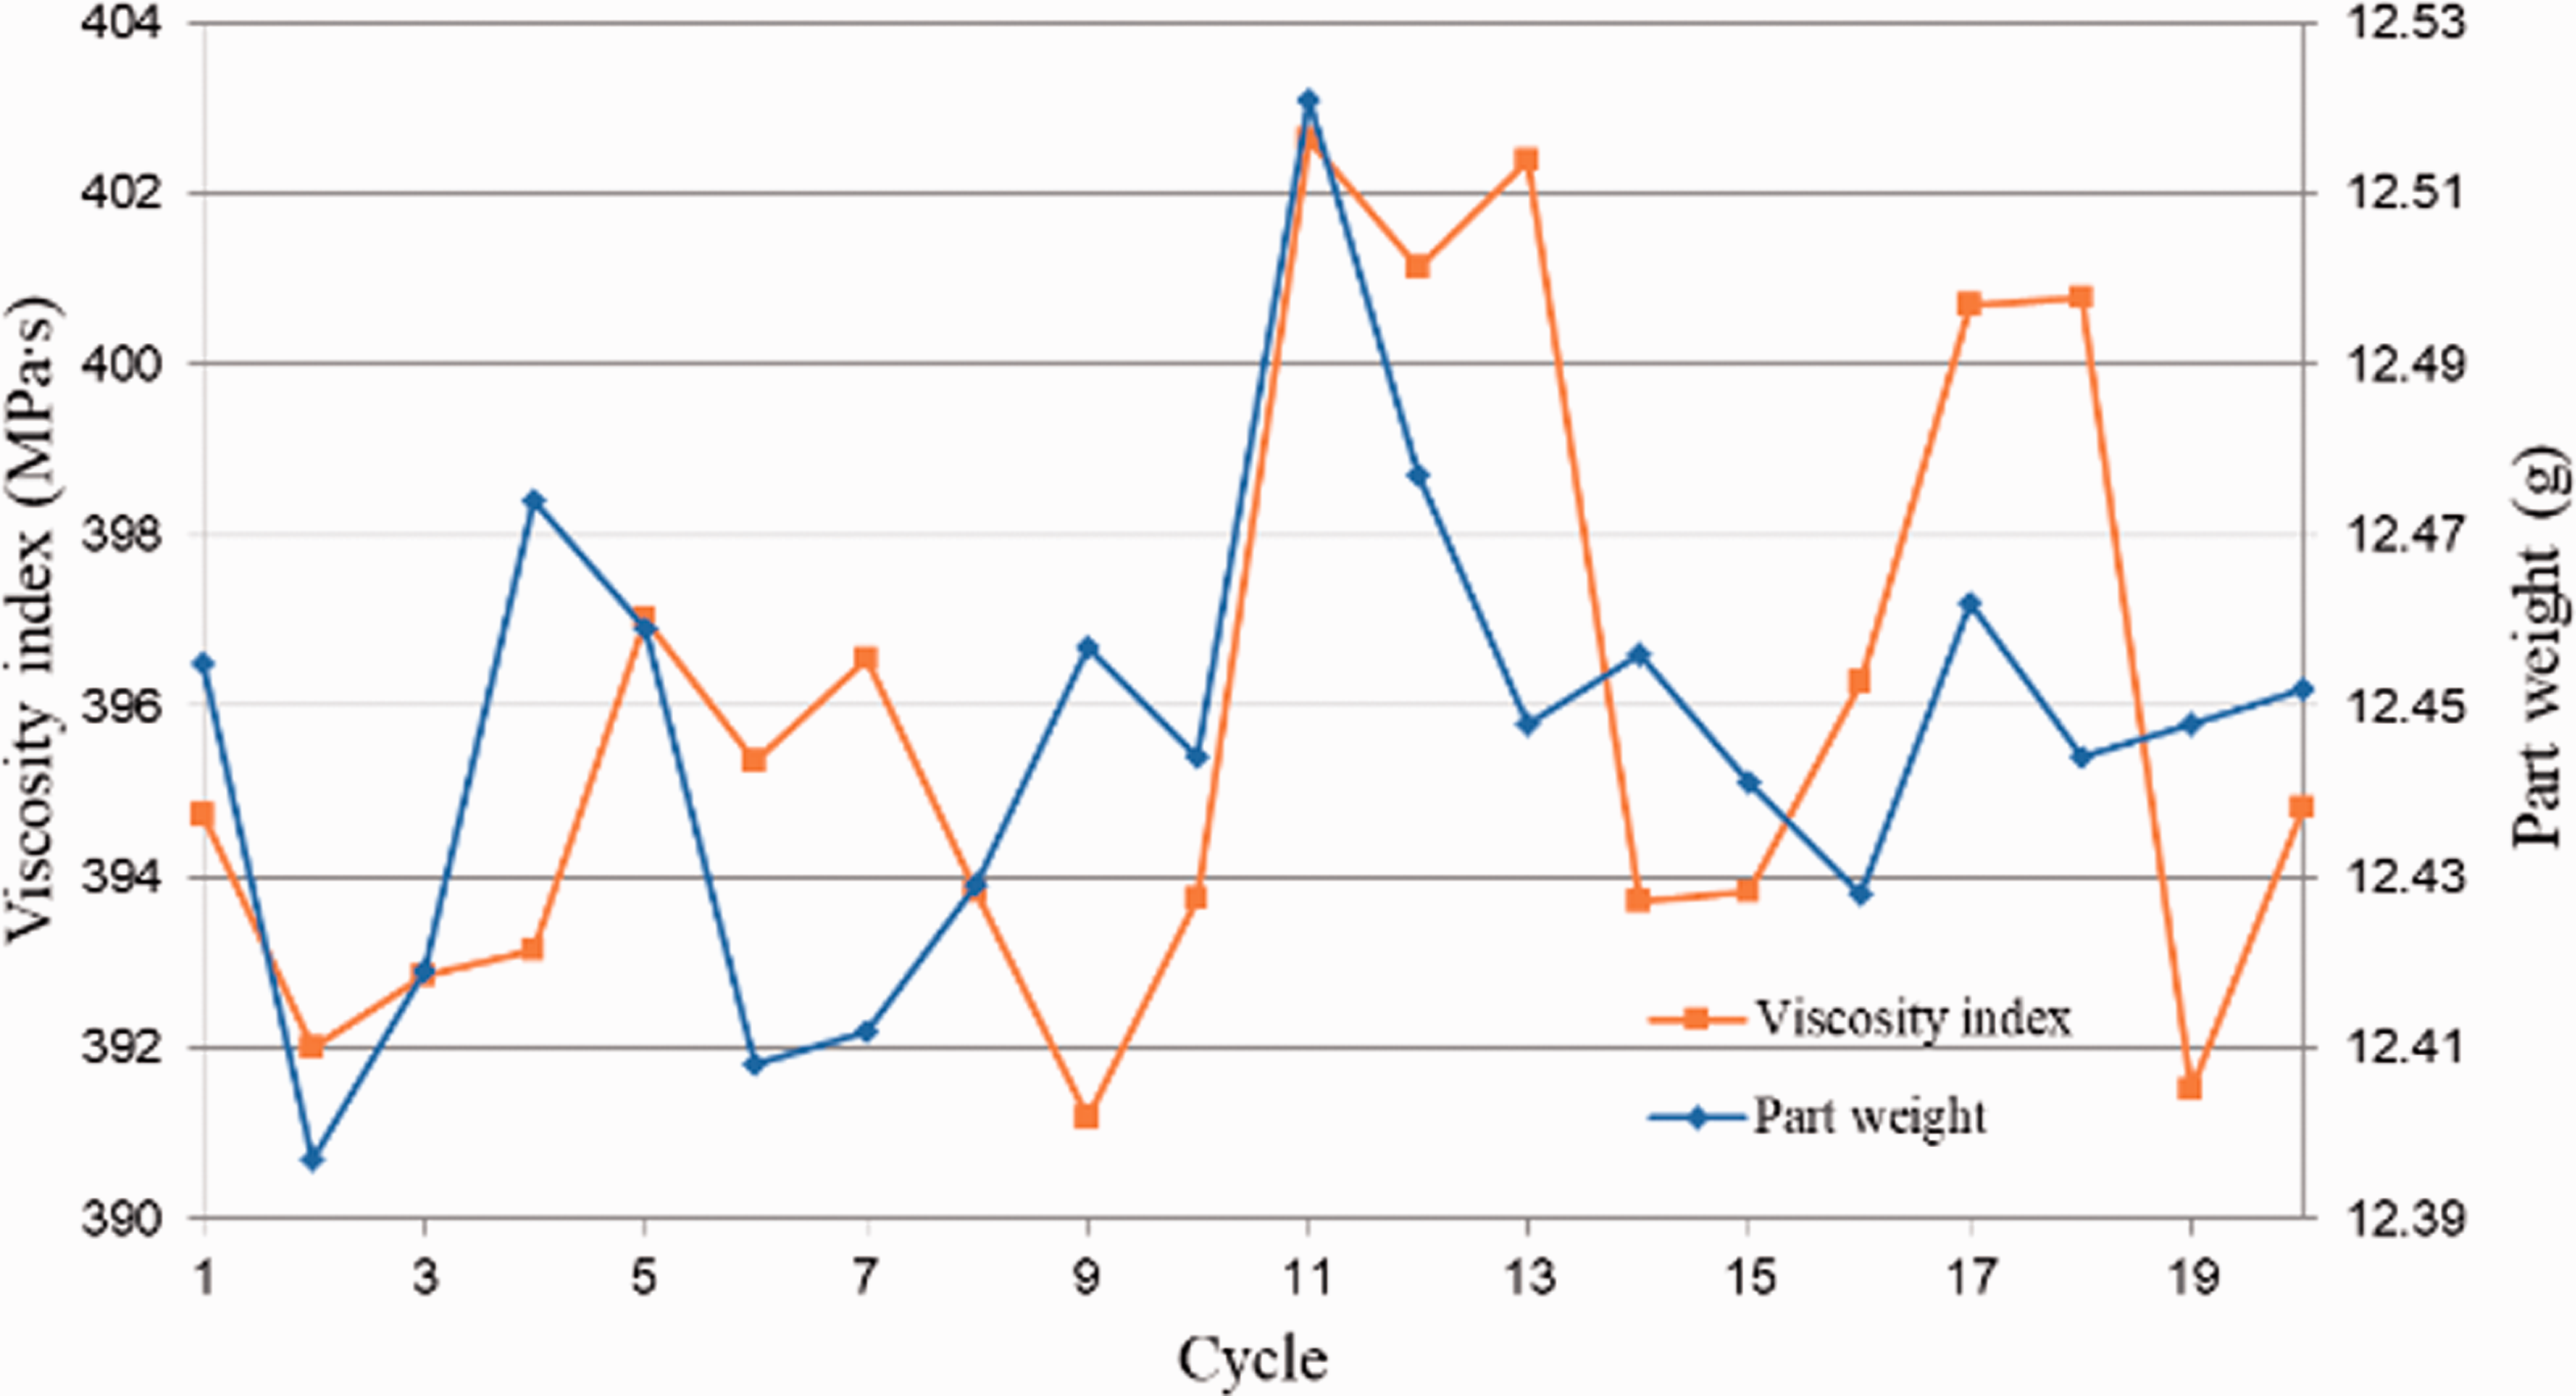
Distribution between viscosity index and the part weight (changeover position: 8 mm).
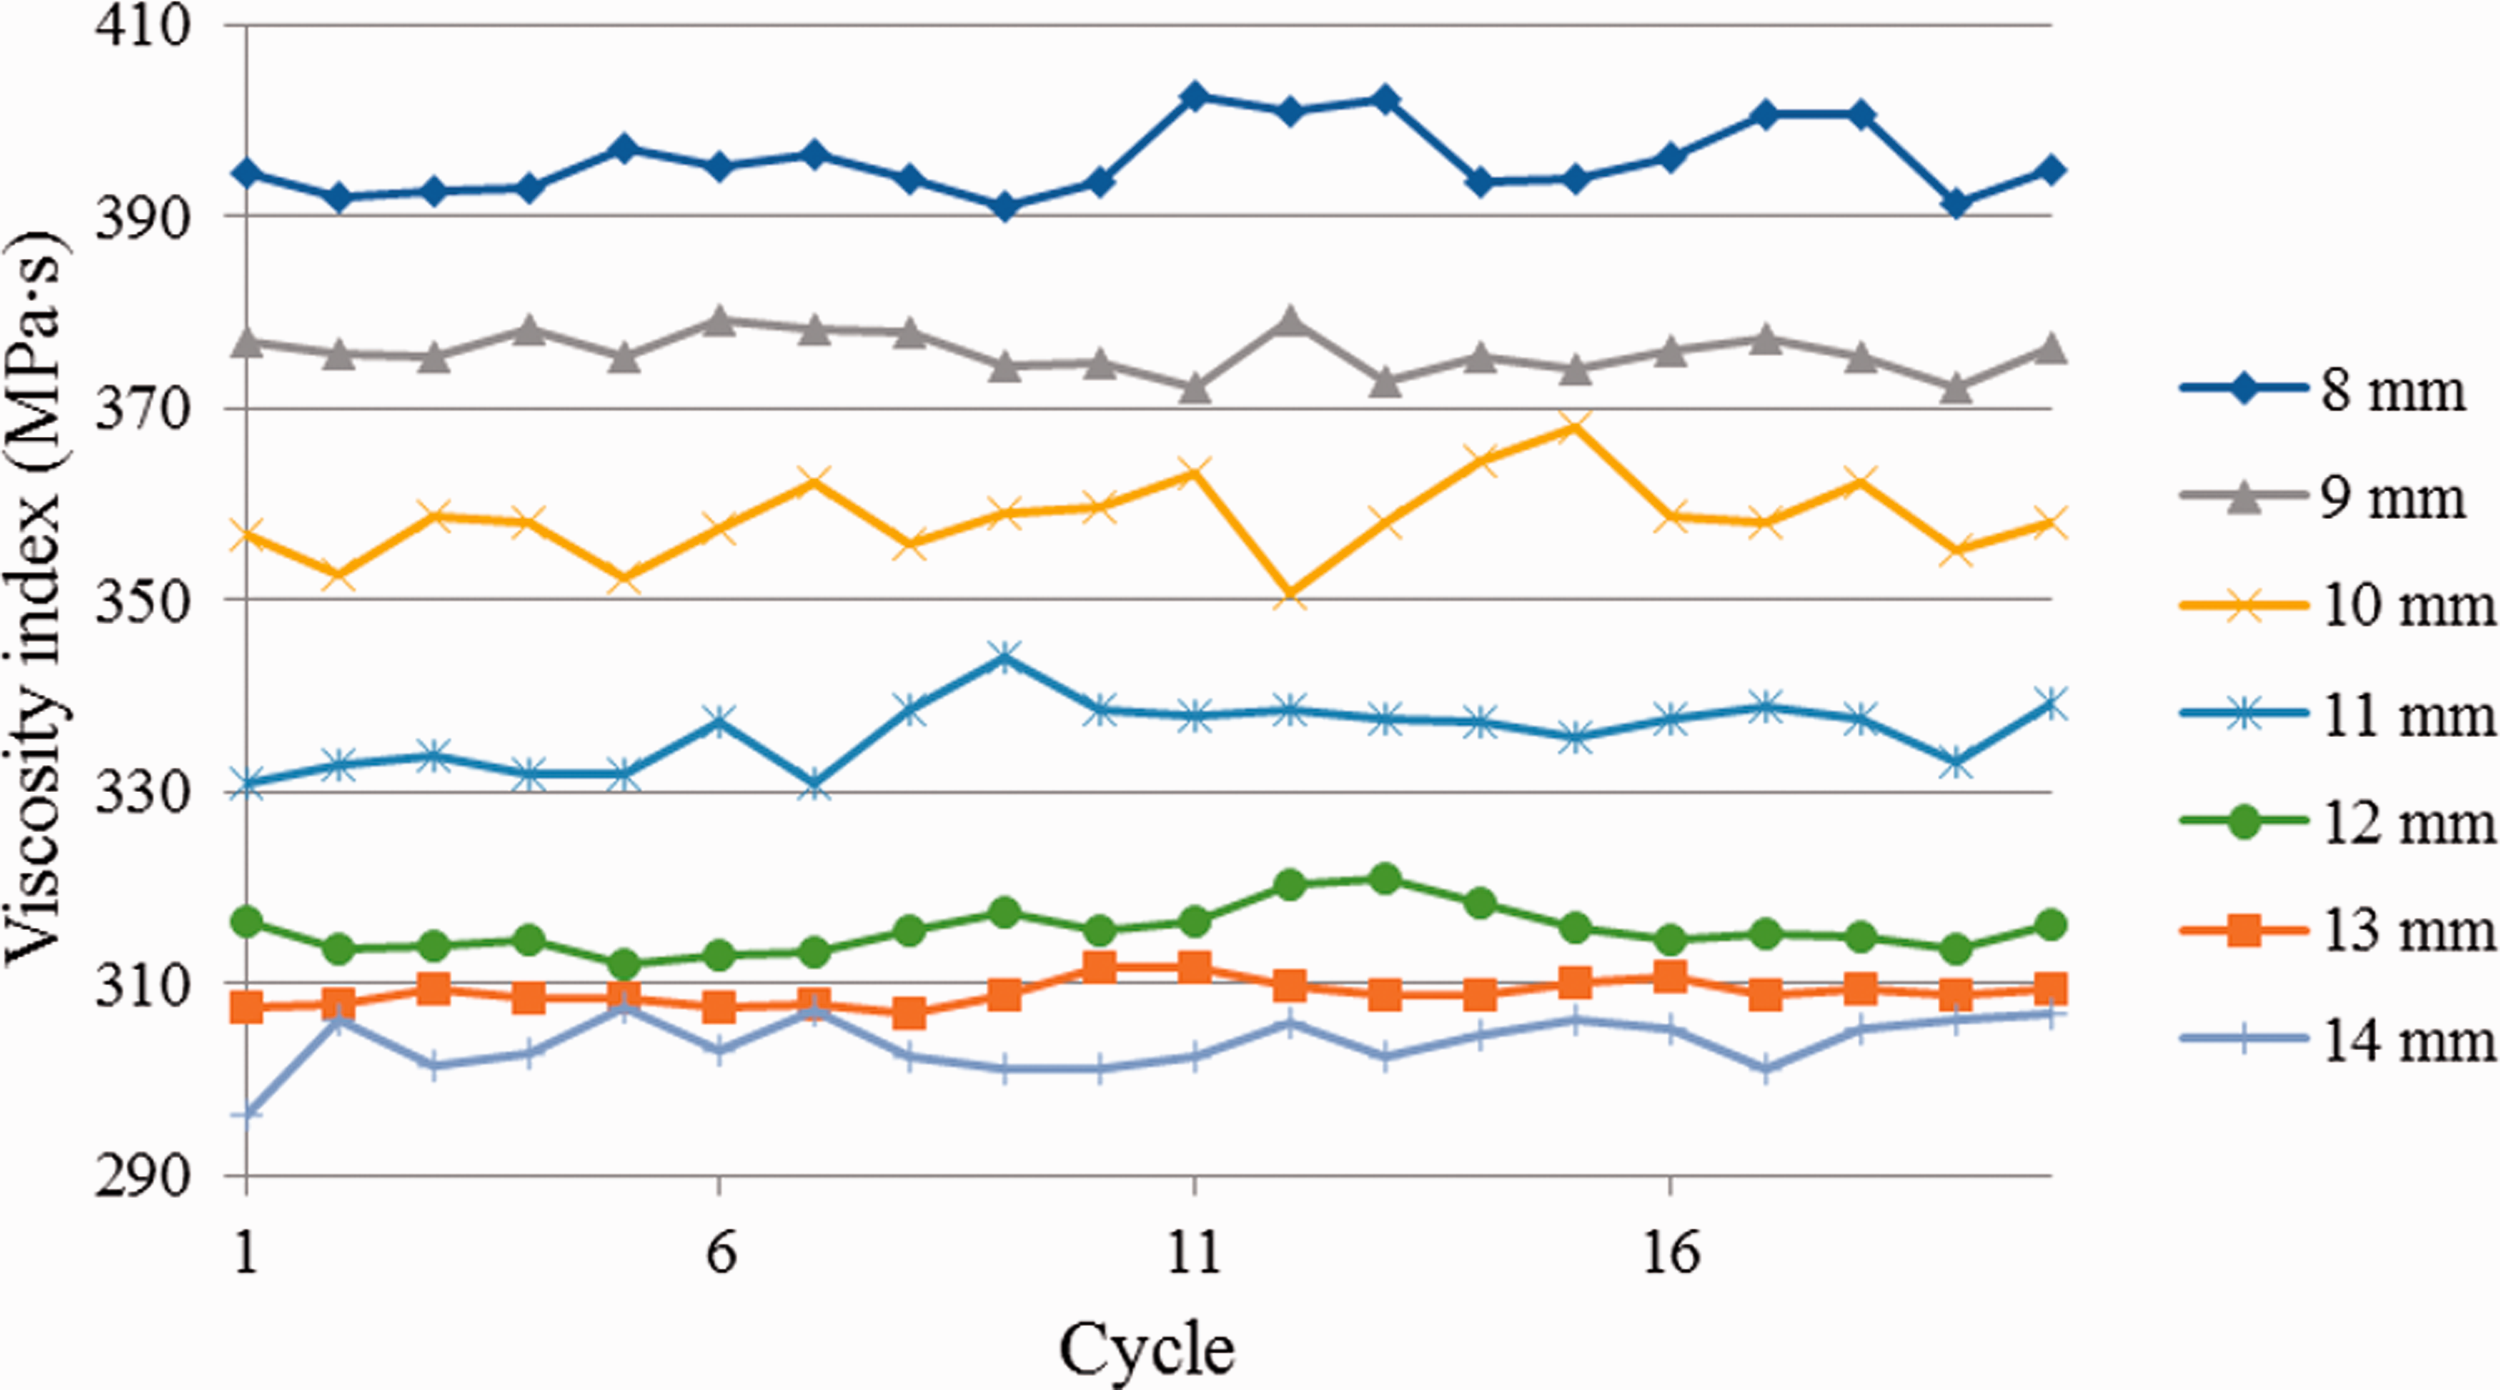
Distribution of viscosity index with different changeover positions.
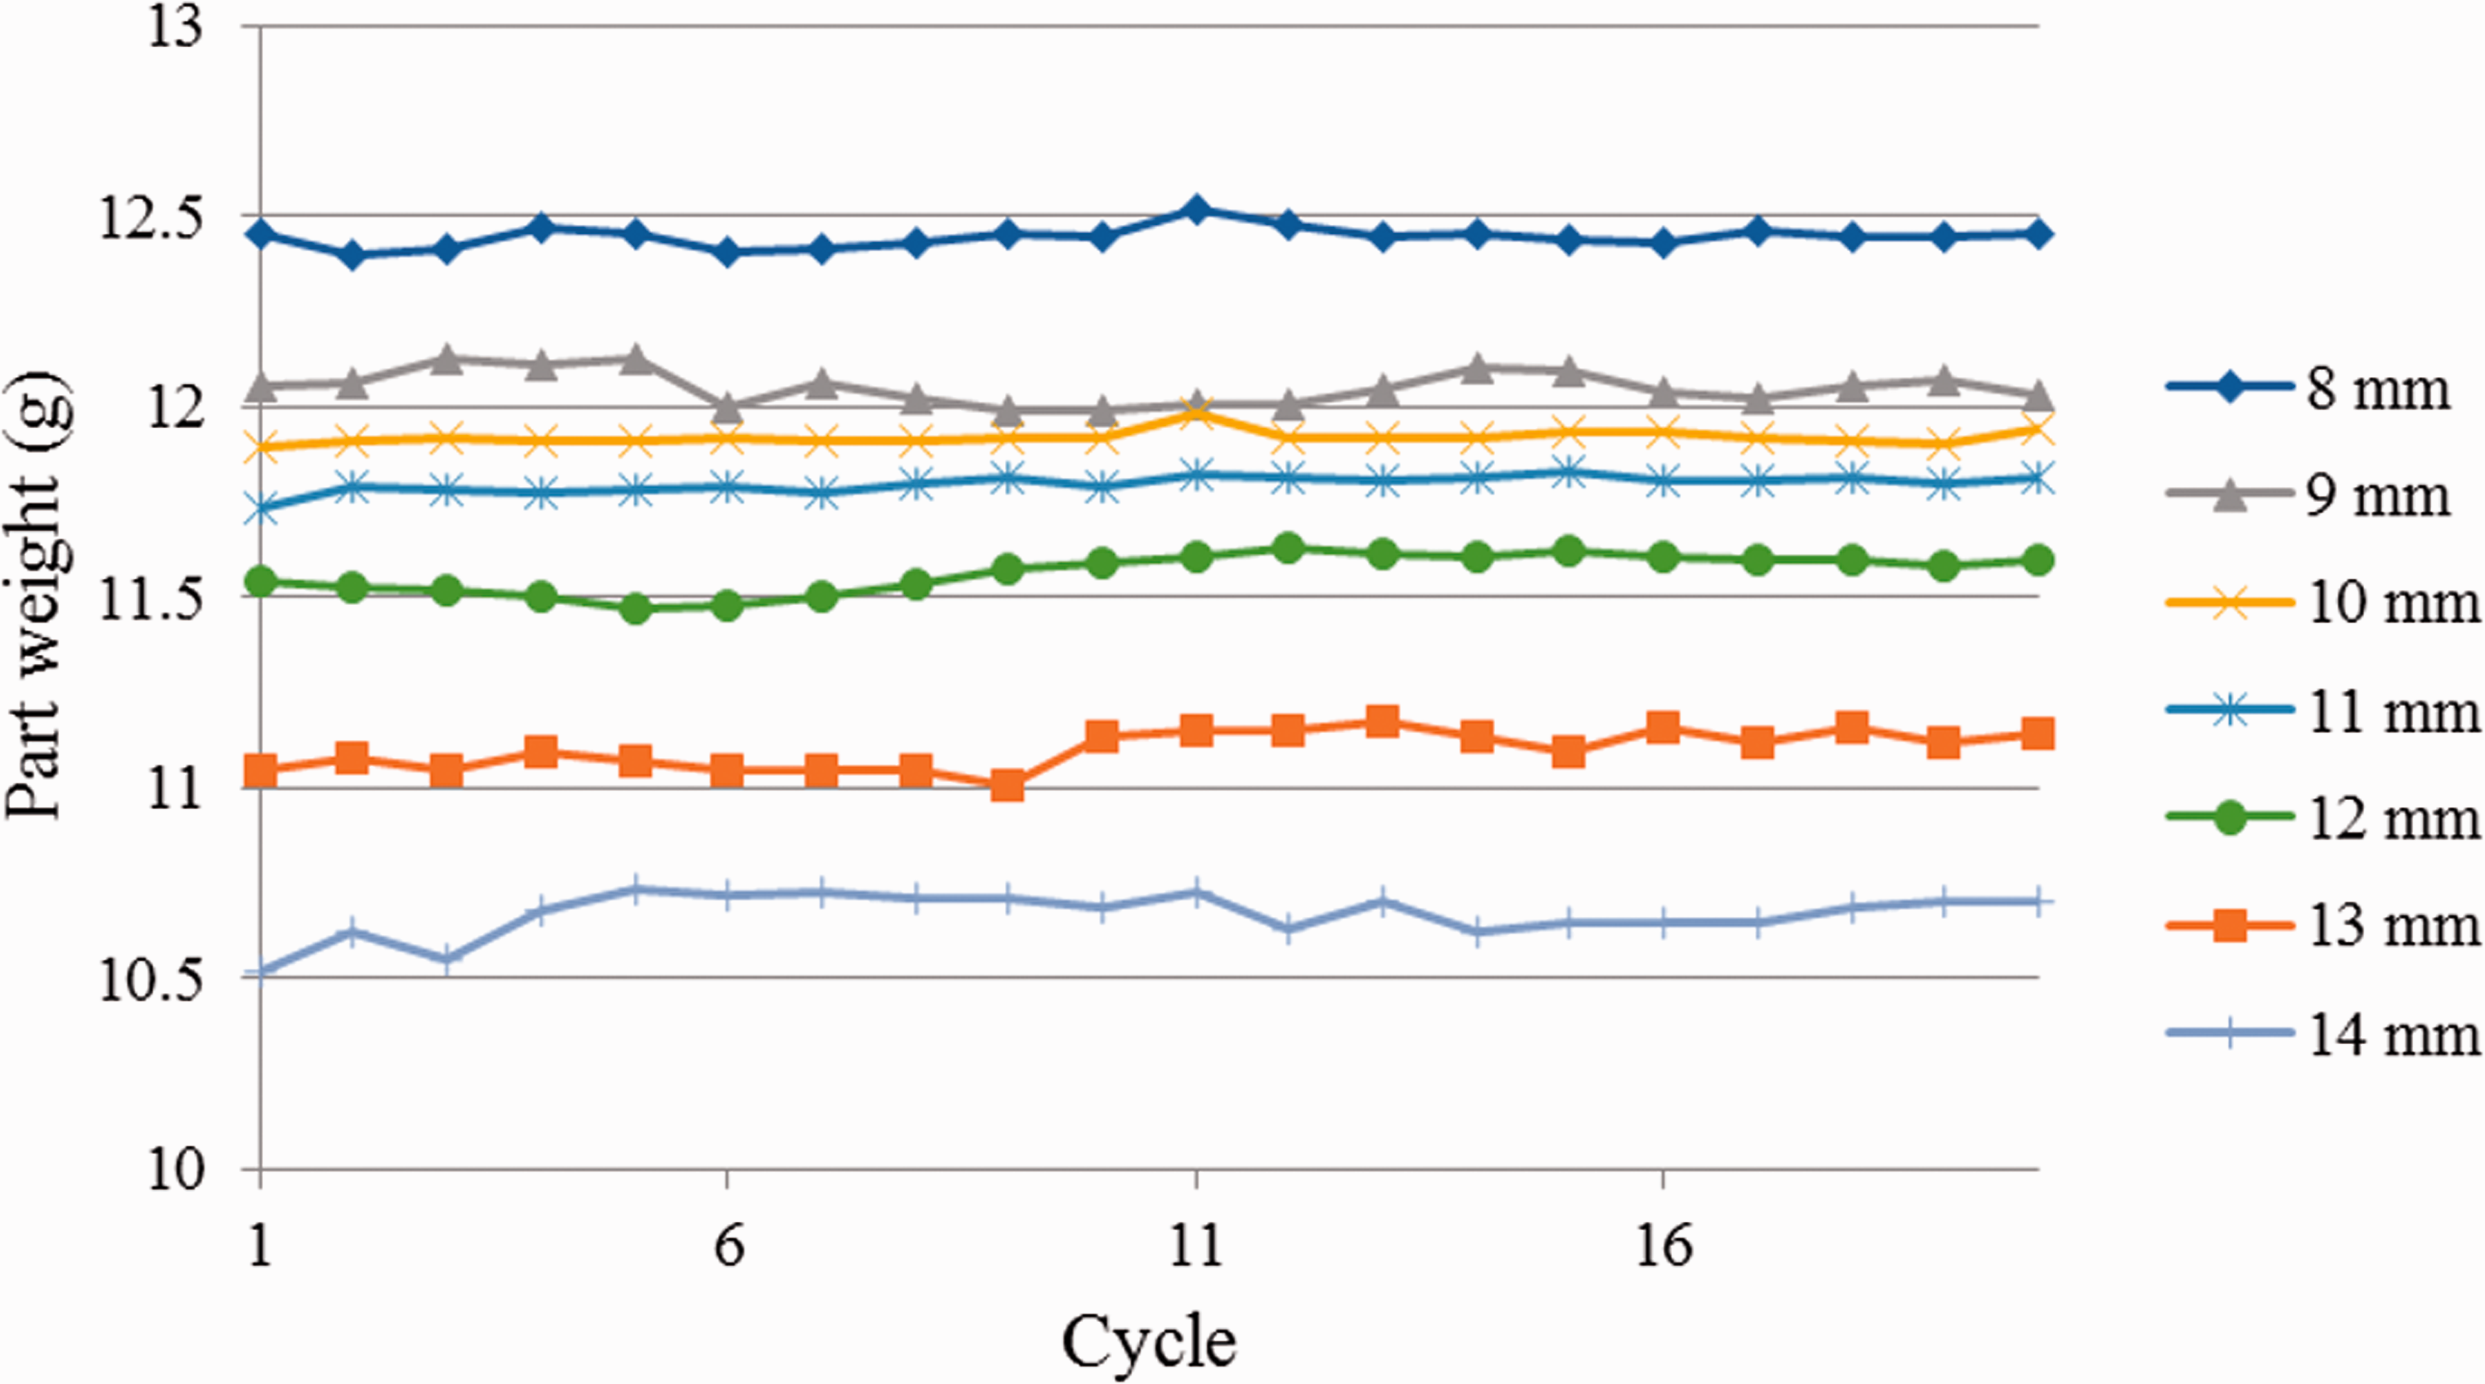
Distribution of the part weight with different changeover positions.
Variation of viscosity index and the part weight with different changeover positions.
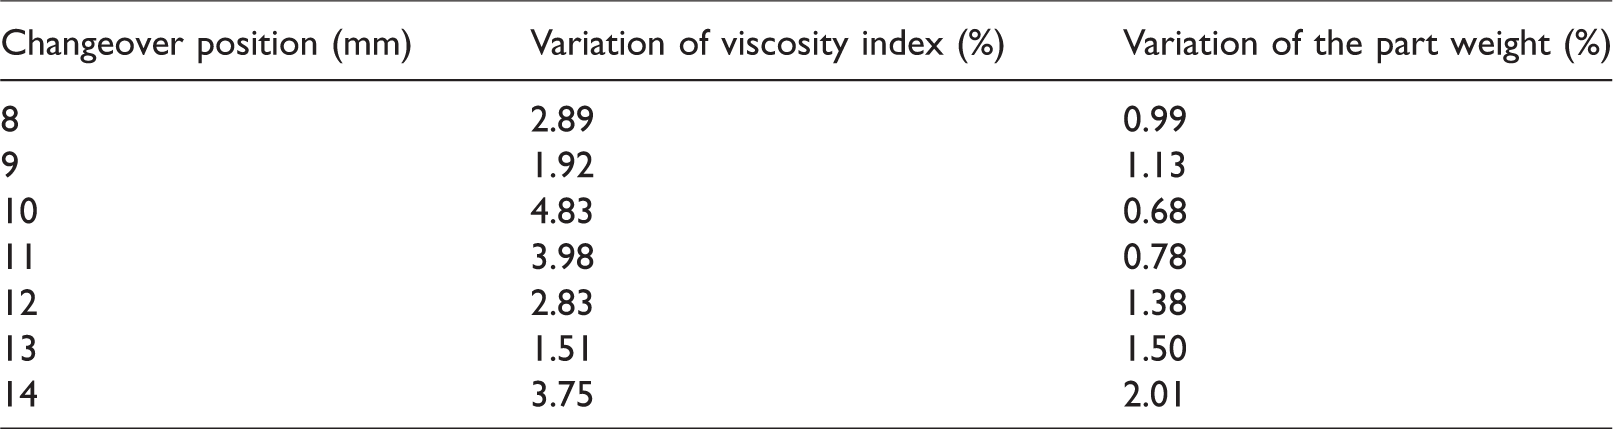
When the changeover position was early, the part weight and VI both decreased, and vice versa. The degree of variation in the part weight far exceeded the precision required for most industrial applications. The degree of variation in the VI exceeded by several times the degree of variation in the weight of the parts.
Single factor experiment
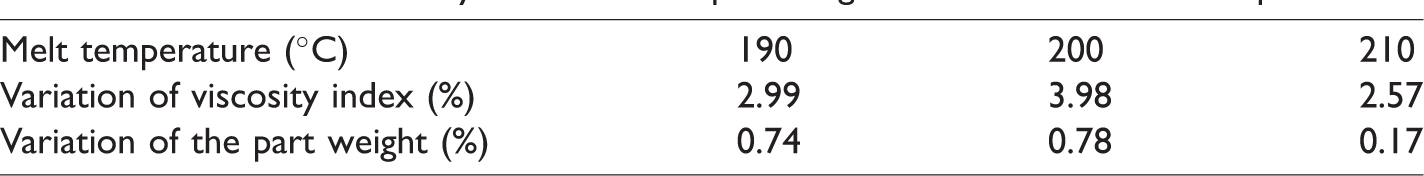
Our objective in this experiment was to characterize the relationship between the VI and the weight of the parts under different melt temperatures with the changeover position set at 8 mm. We calculated the VI and measured the weight of the parts in each cycle; the results of which are shown in Figures 7 to 9. Table 3 indicates the degree of variation in the VI and part weight under various melt temperatures.
Variation of viscosity index and the part weight with different melt temperatures.
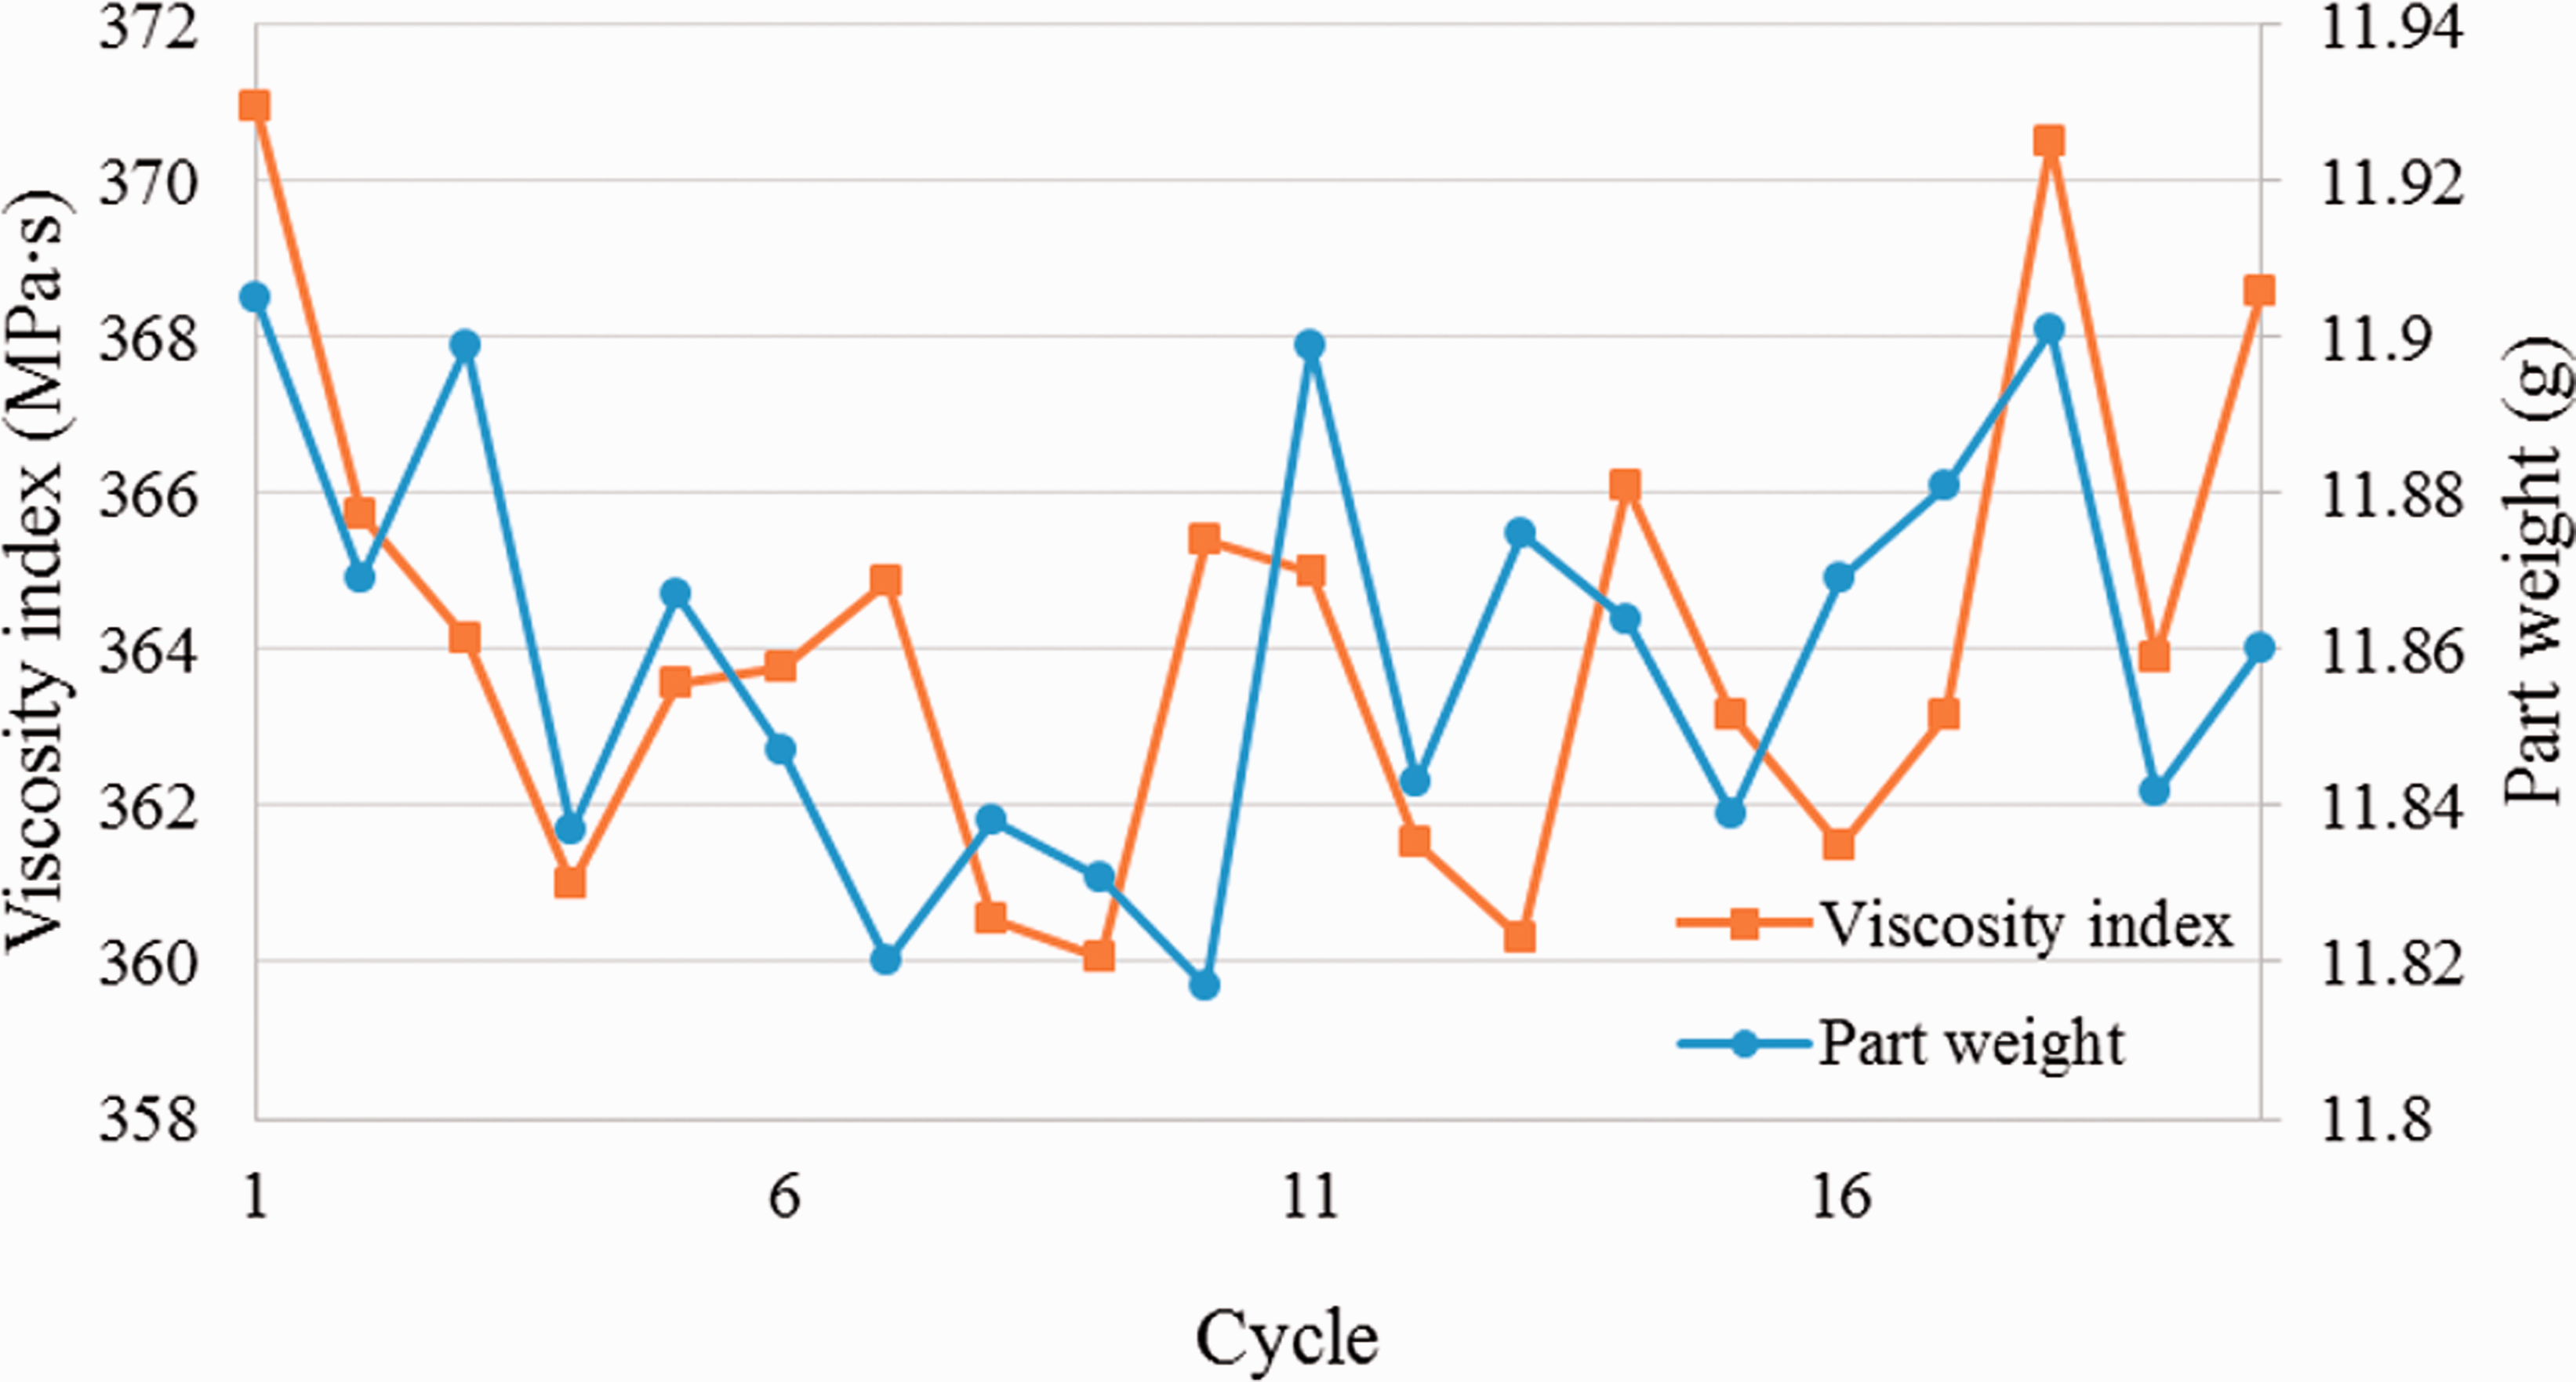
Distribution between viscosity index and the part weight (melt temperature: 190°C).
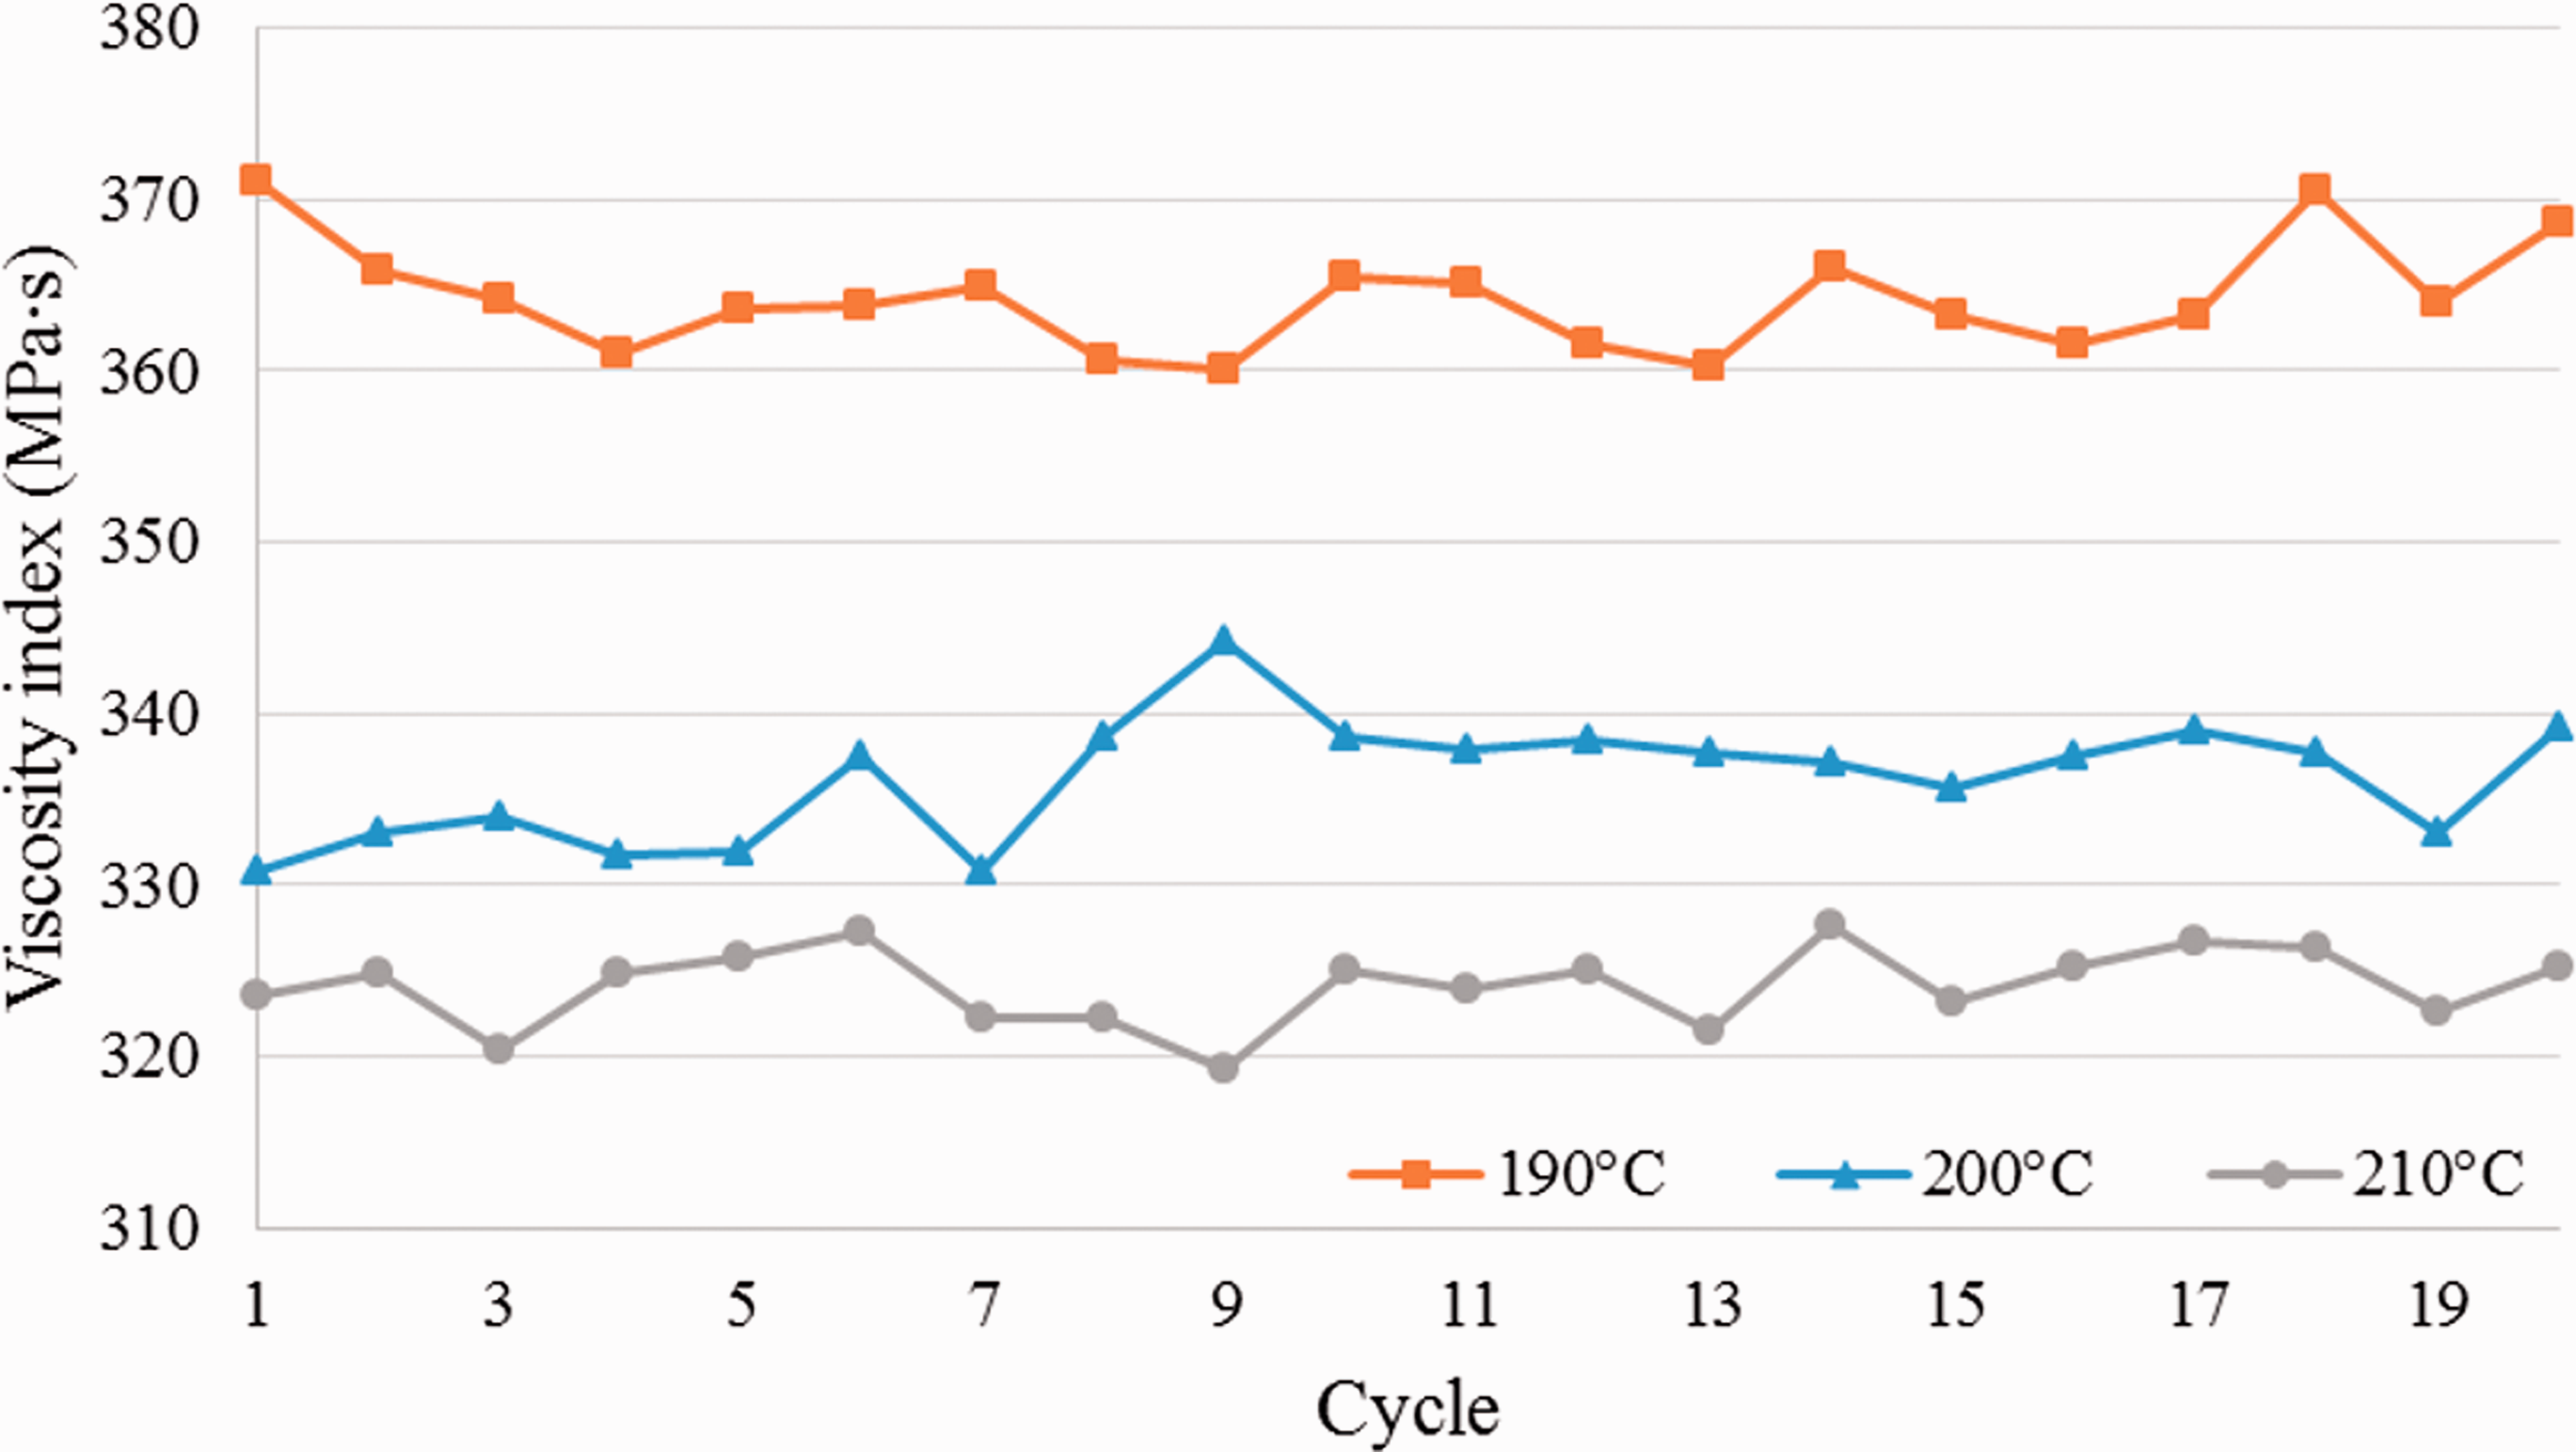
Distribution of viscosity index with different melt temperatures.
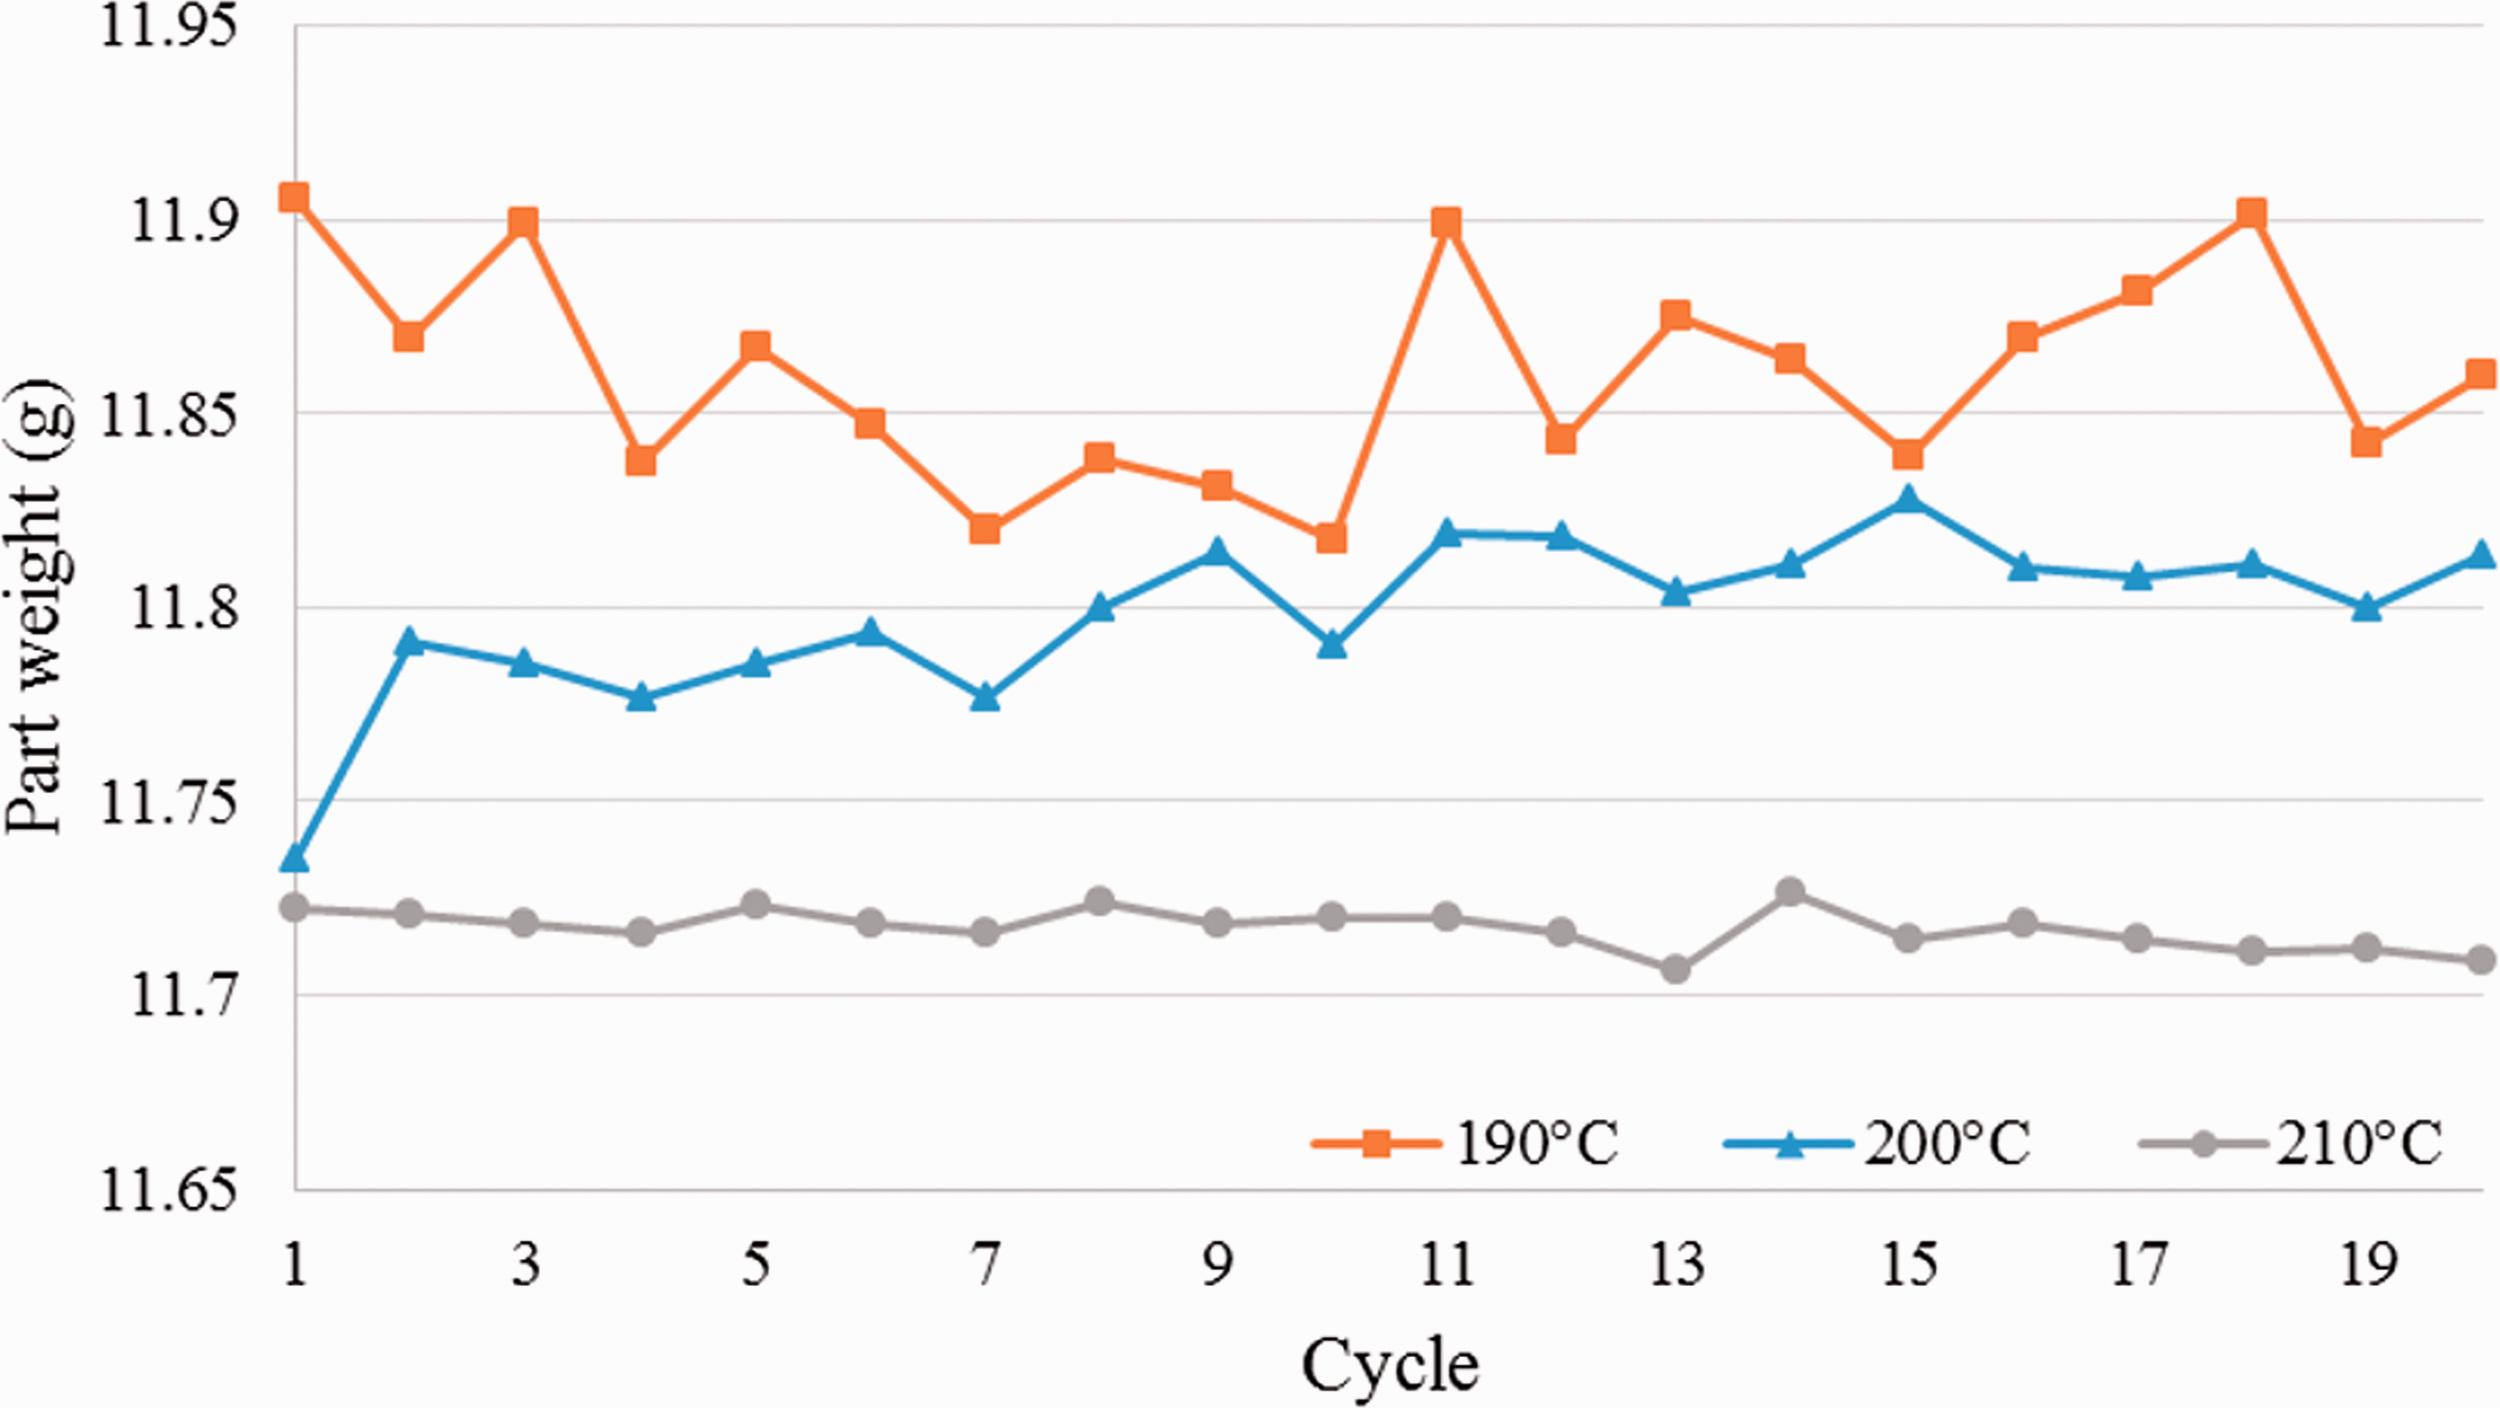
Distribution of the part weight with different melt temperatures.
For a given melt pressure profile, a decrease in the melt temperature led to a decrease in the specific volume of the melt. For a given injection volume, a decrease in the specific volume of the melt led to increases in part weight and the VI. The degree of variation in the part weight exceeded the precision required for most industrial applications. The degree of variation in the VI exceeded by several times the degree of variation in the weight of the parts.
In the single-factor experiment on melt temperature, the viscosity distribution was particularly stable at higher temperatures. This can be attributed to the fact that at higher temperatures, increased fluidity in the melt facilitates the precise measurement of variations in melt pressure.
Self-adjusting mode experiments
After validating the relationship between the VI and the weight of the parts, we developed a novel control method that would enable adaptation to variations in melt properties during extended production runs. Specifically, we developed a self-adjusting scheme to enable the automated adjustment of changeover positions according to VI. The flowchart of self-adjusting mode is shown in Figure 10.
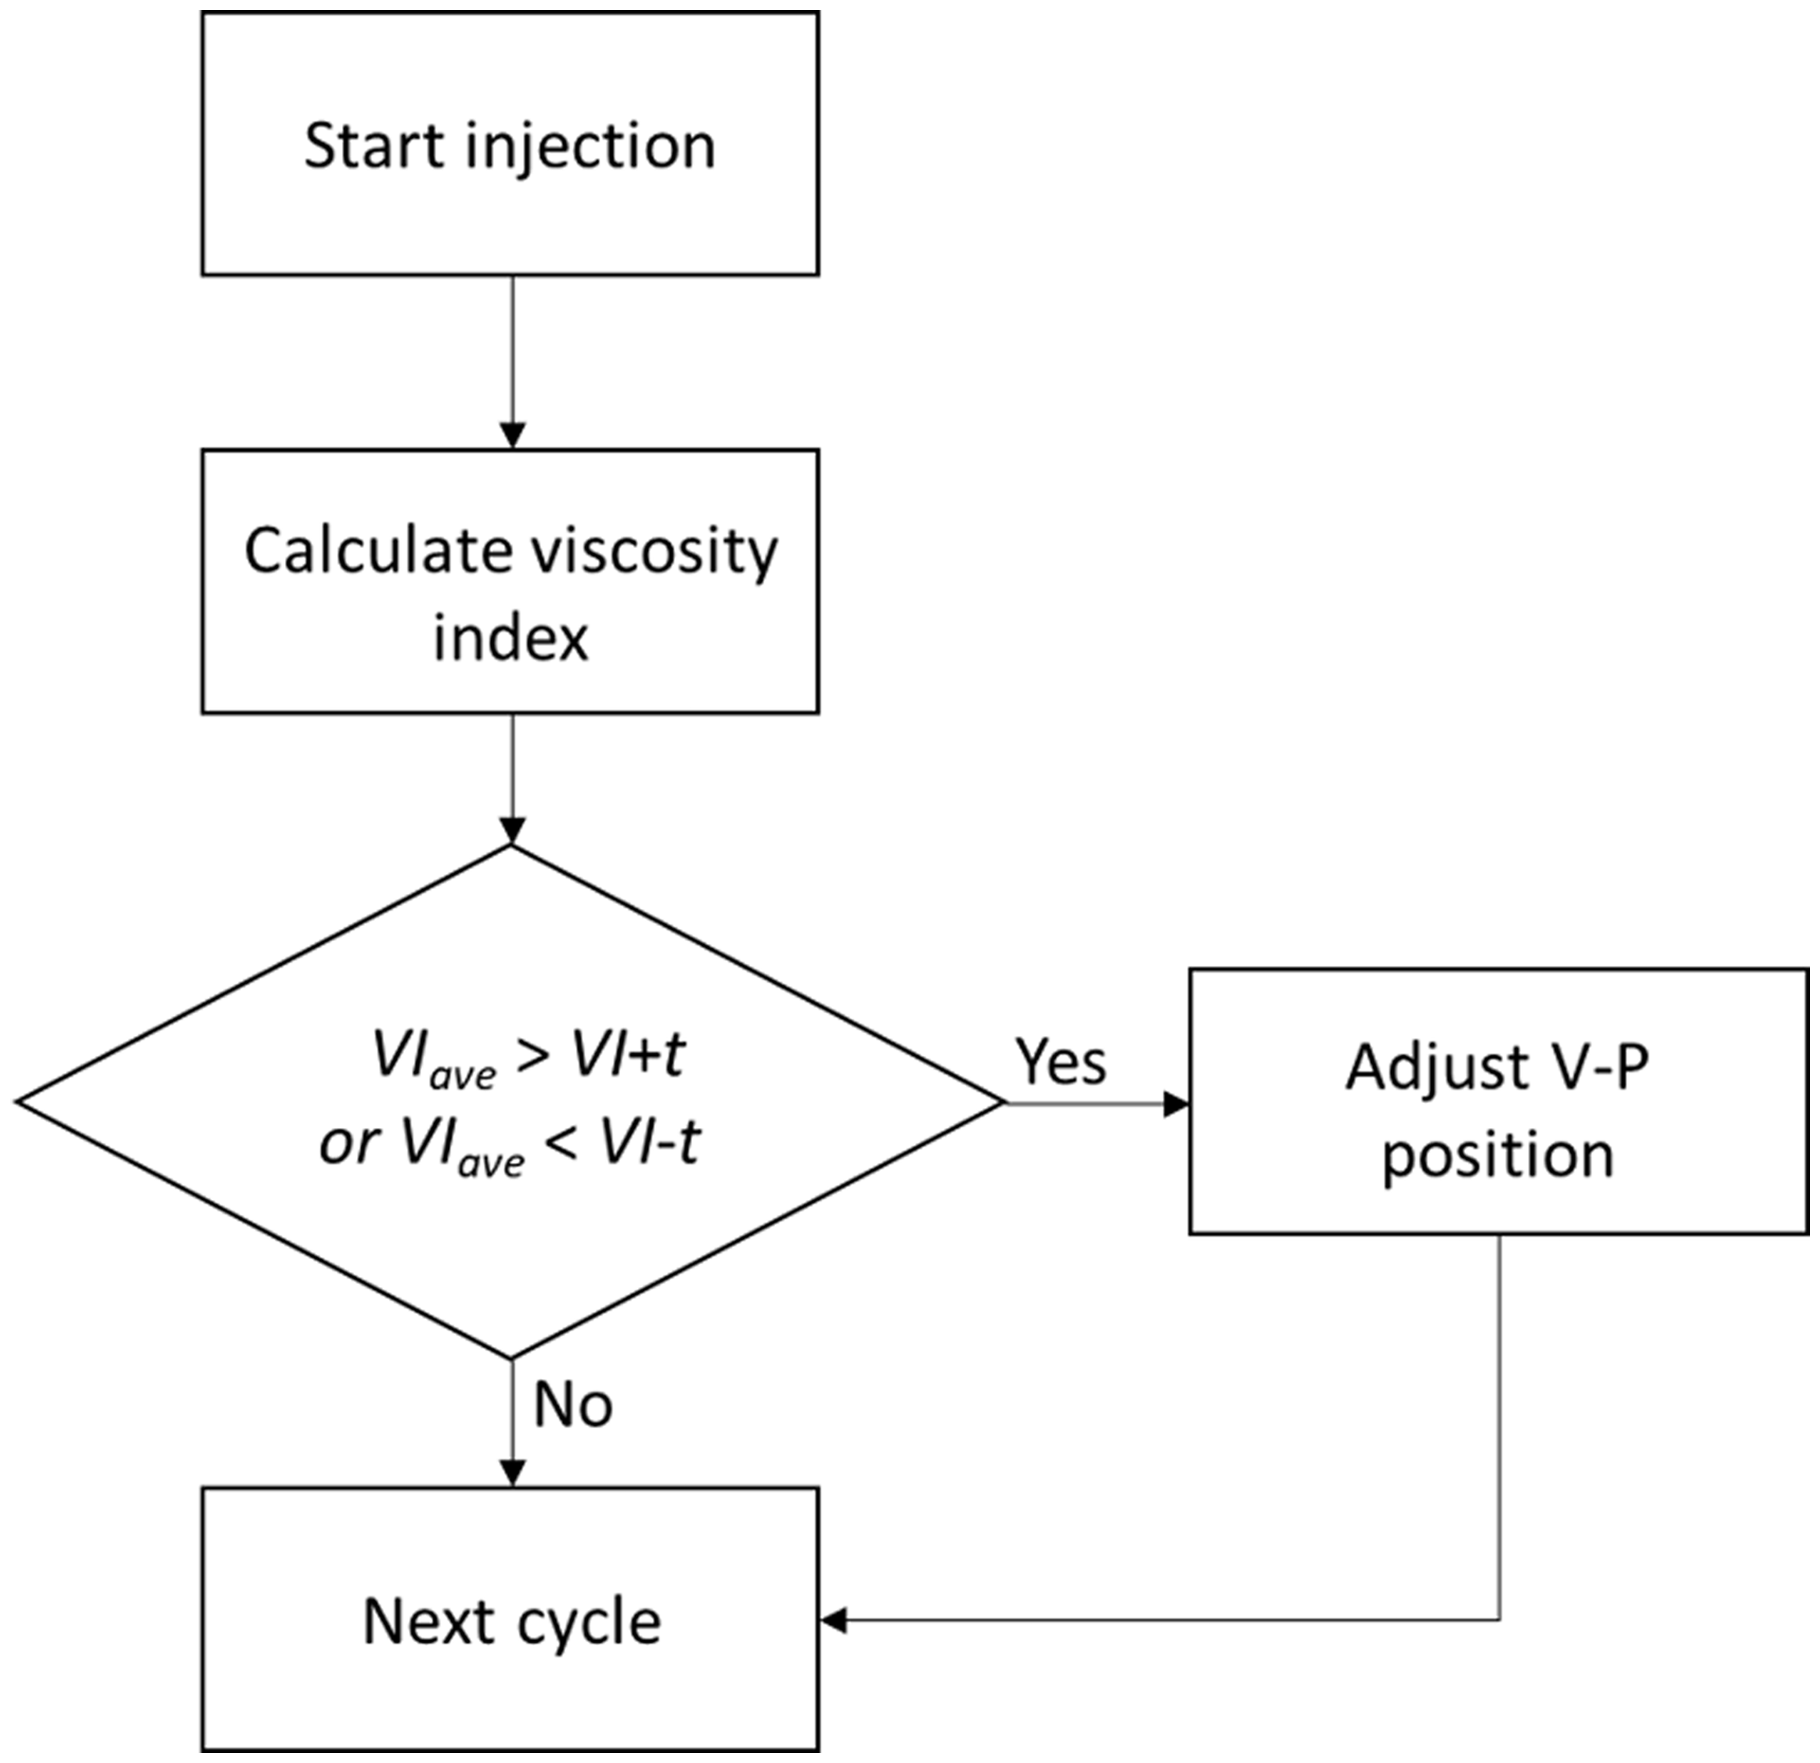
Flowchart of self-adjusting mode.
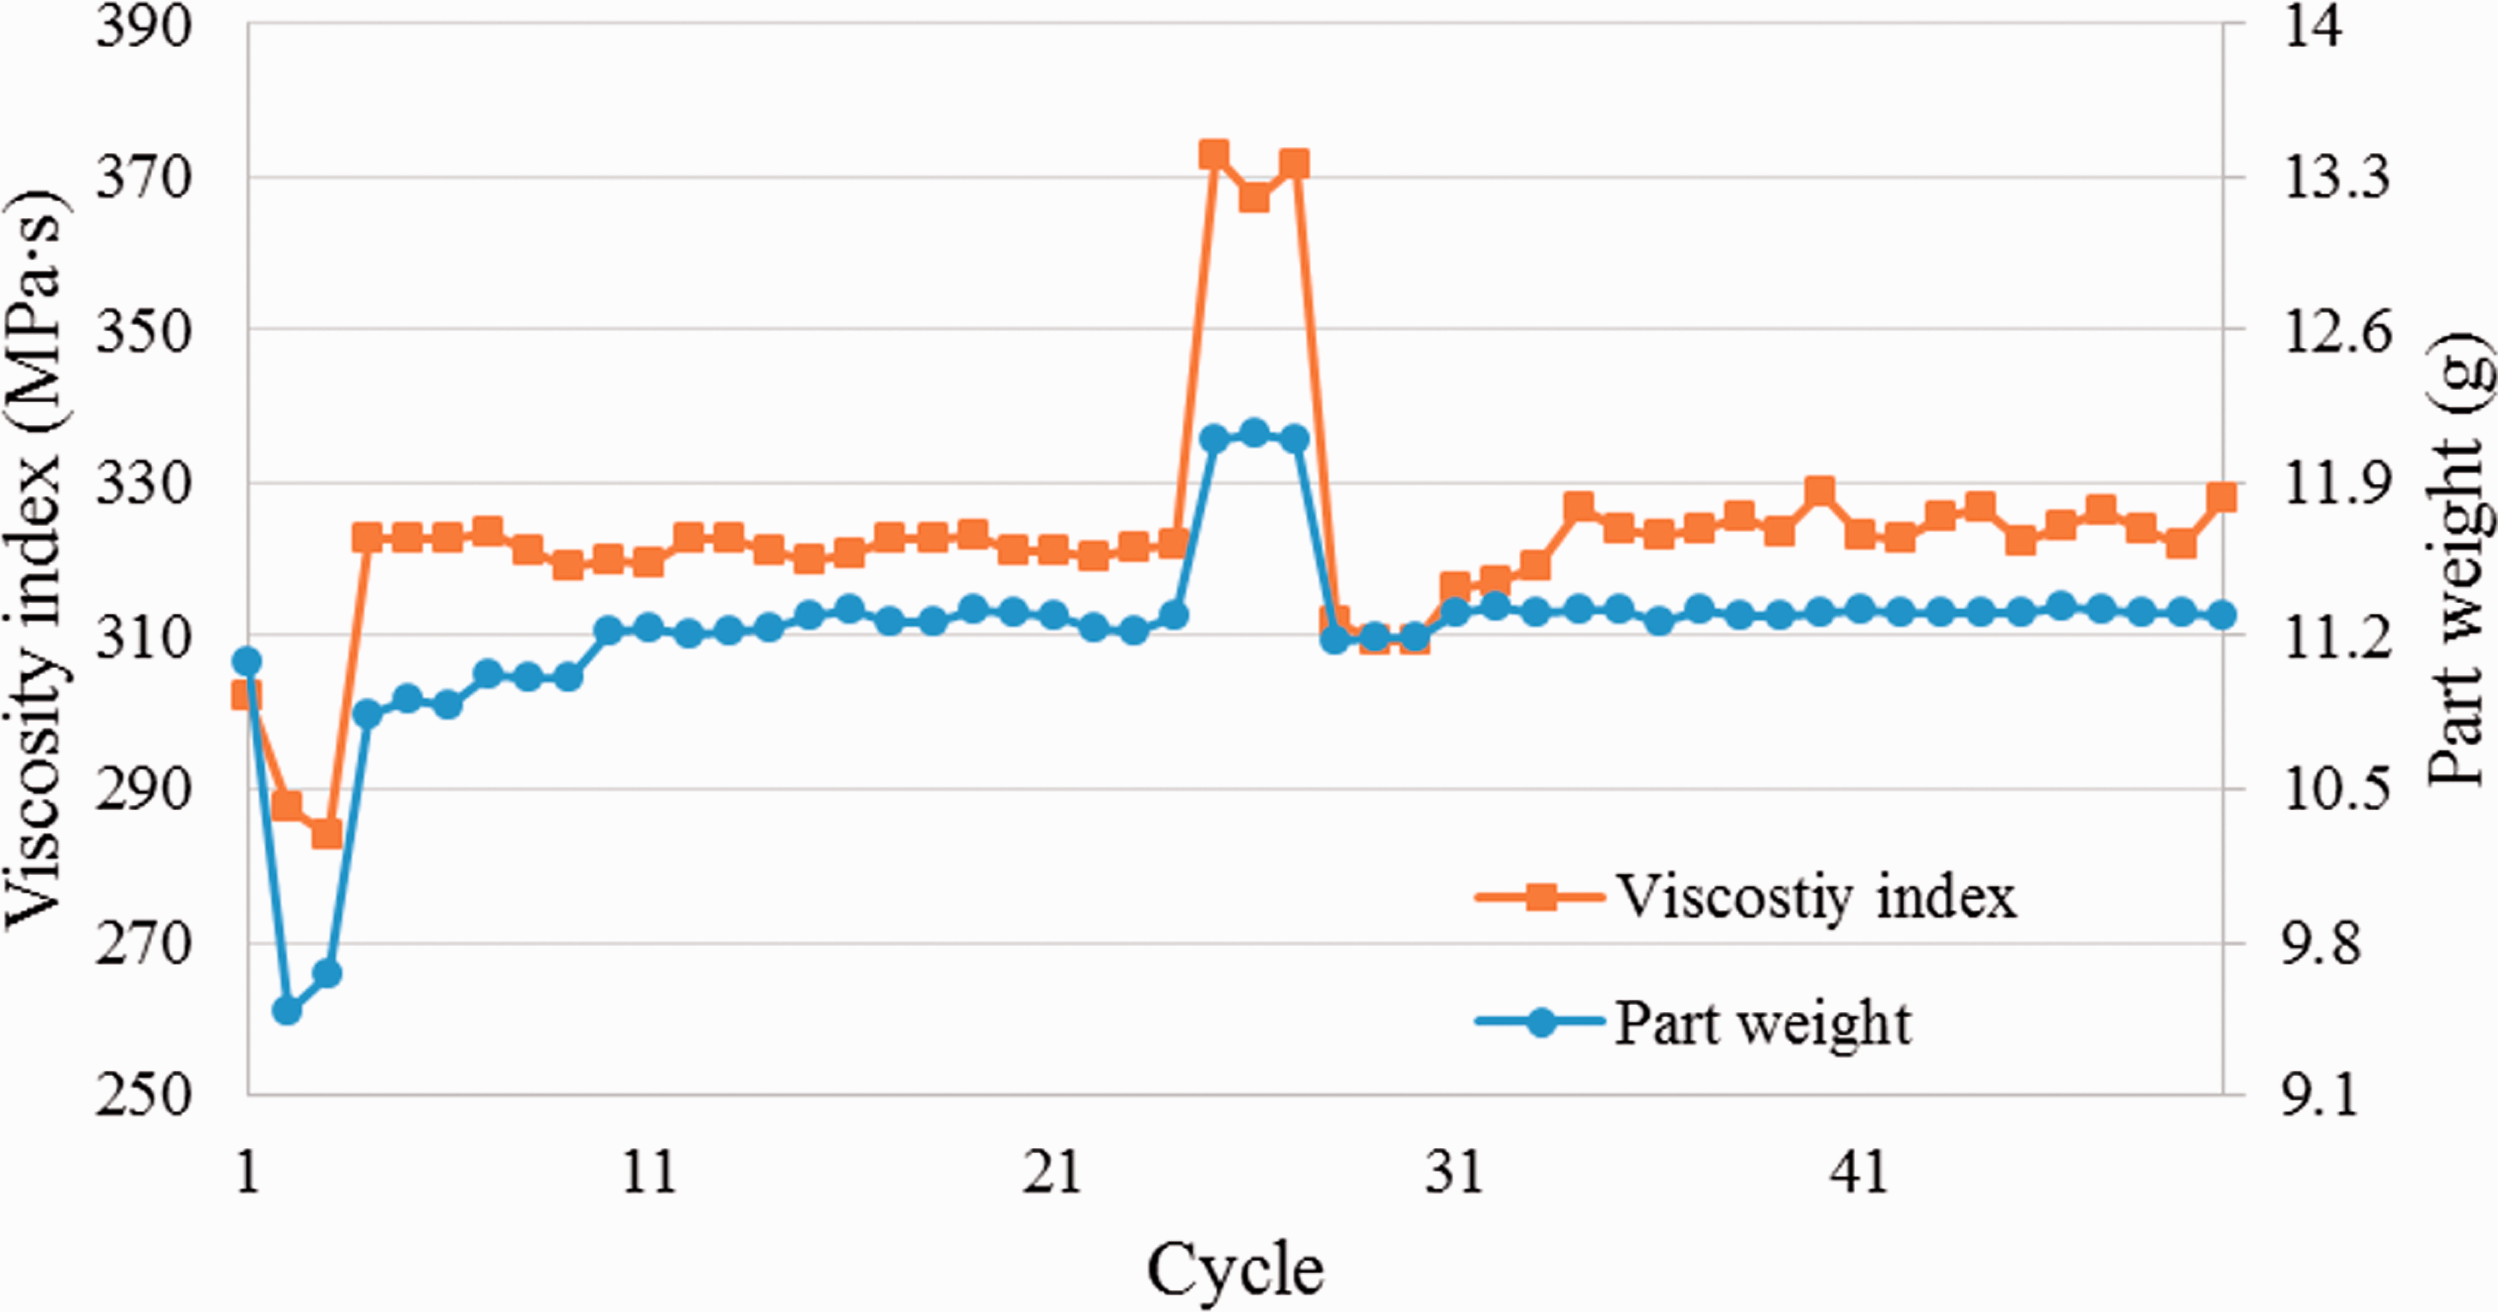
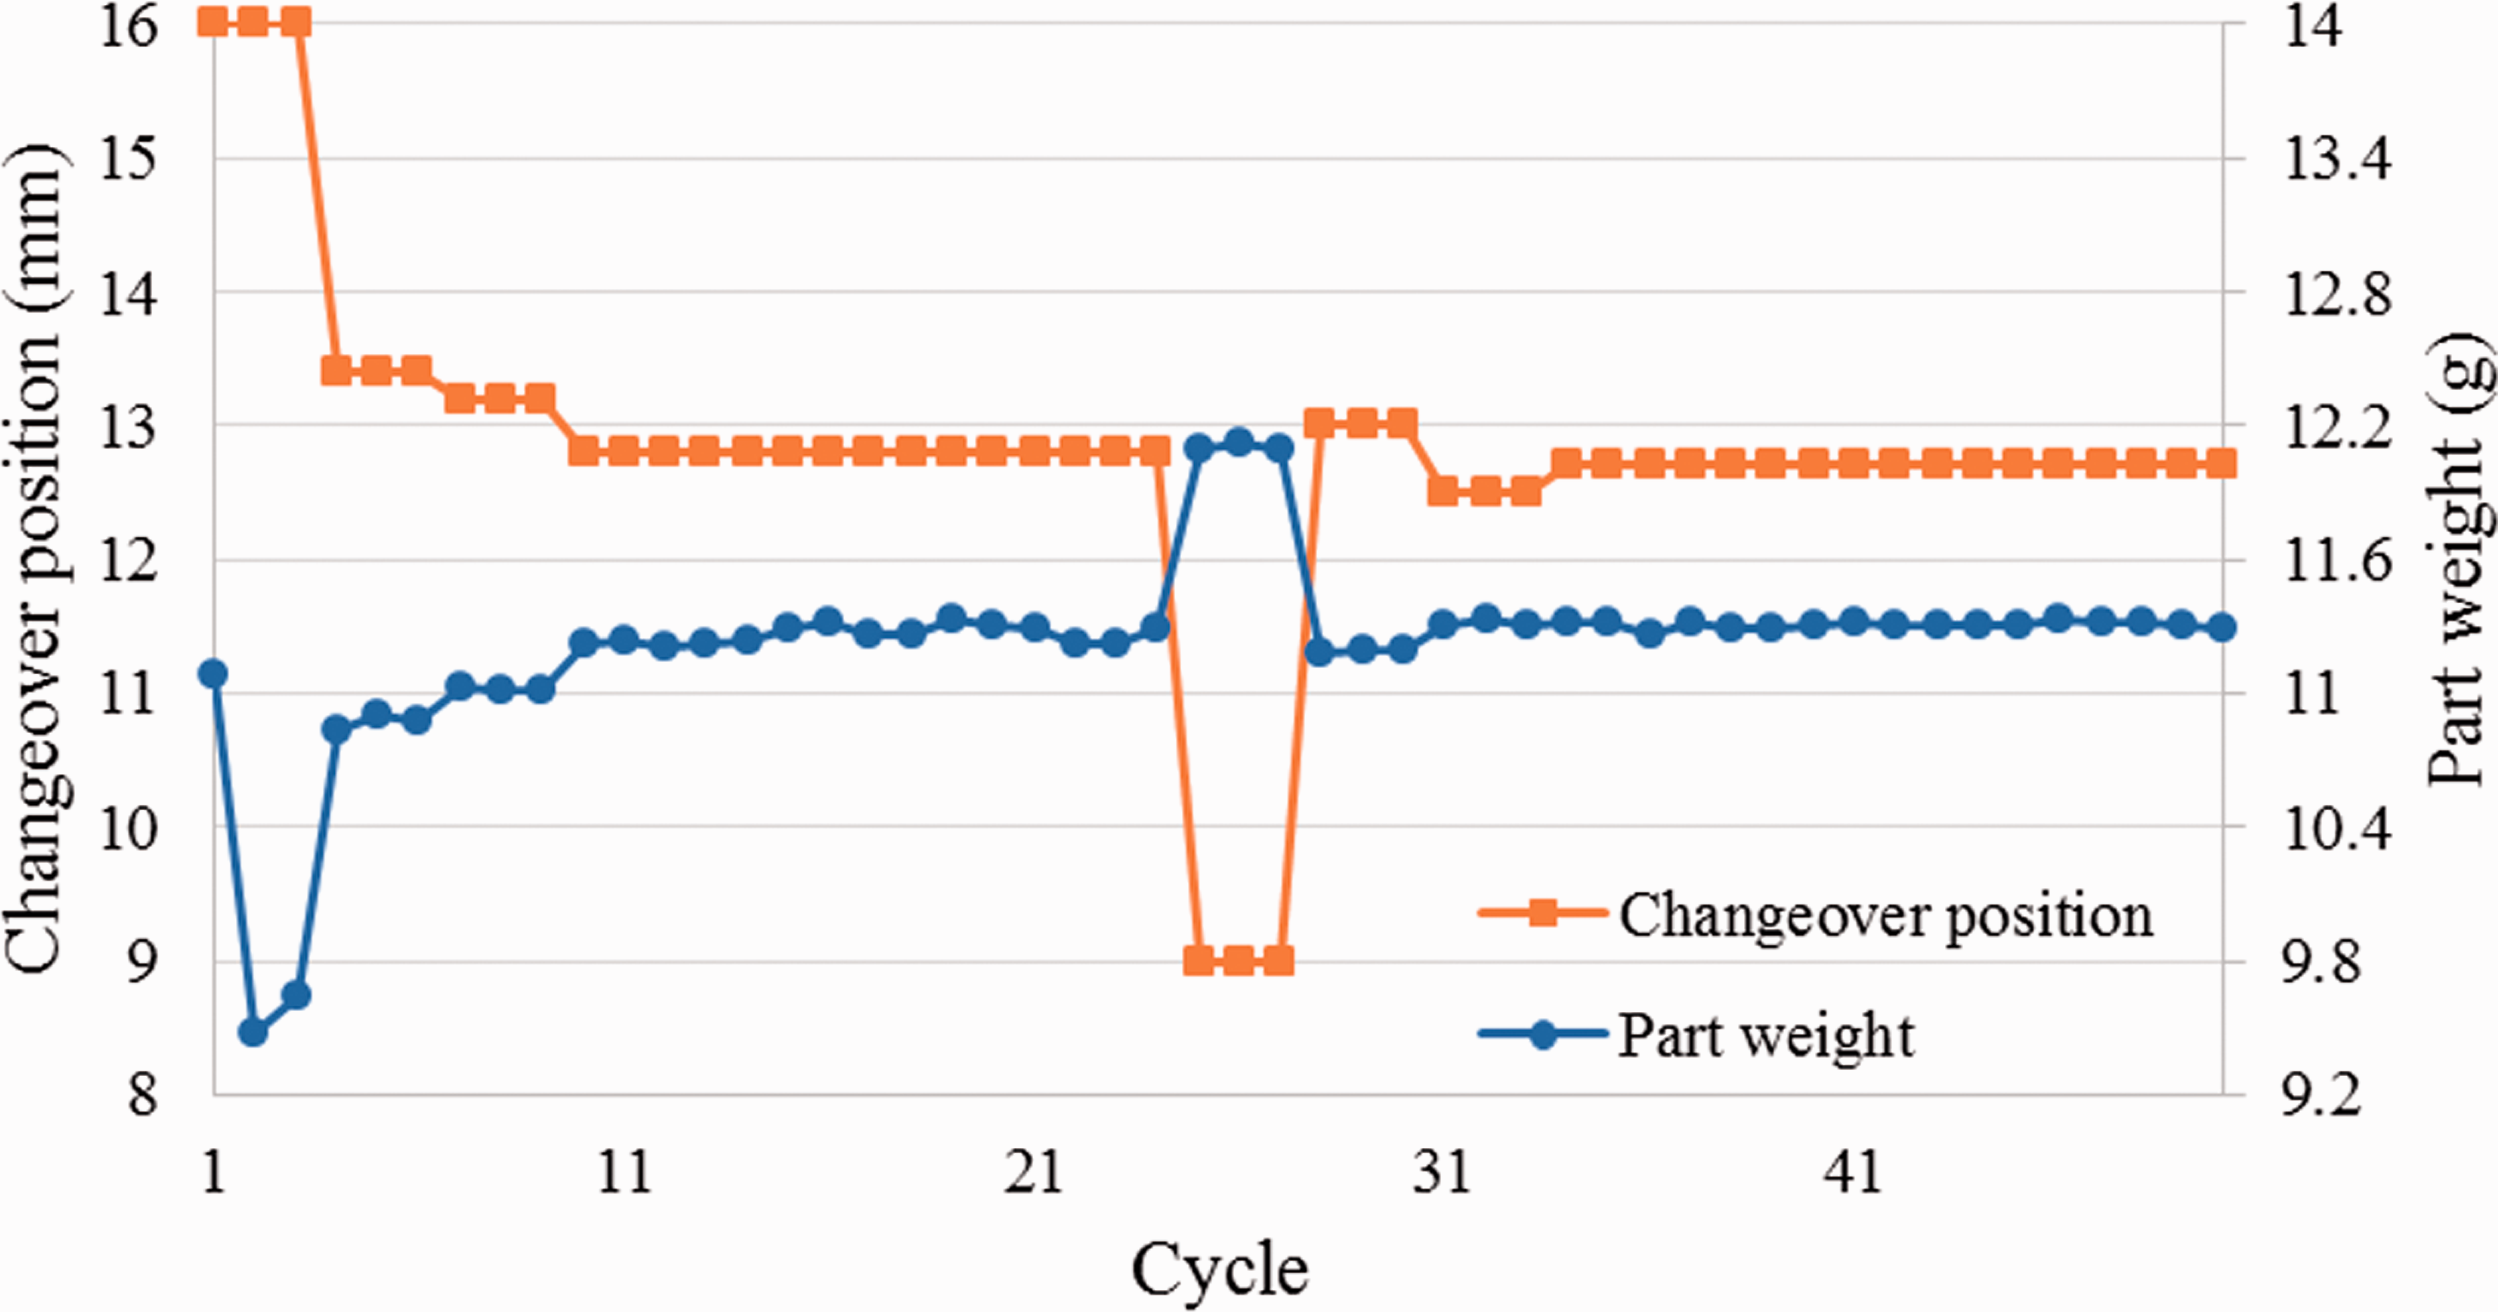
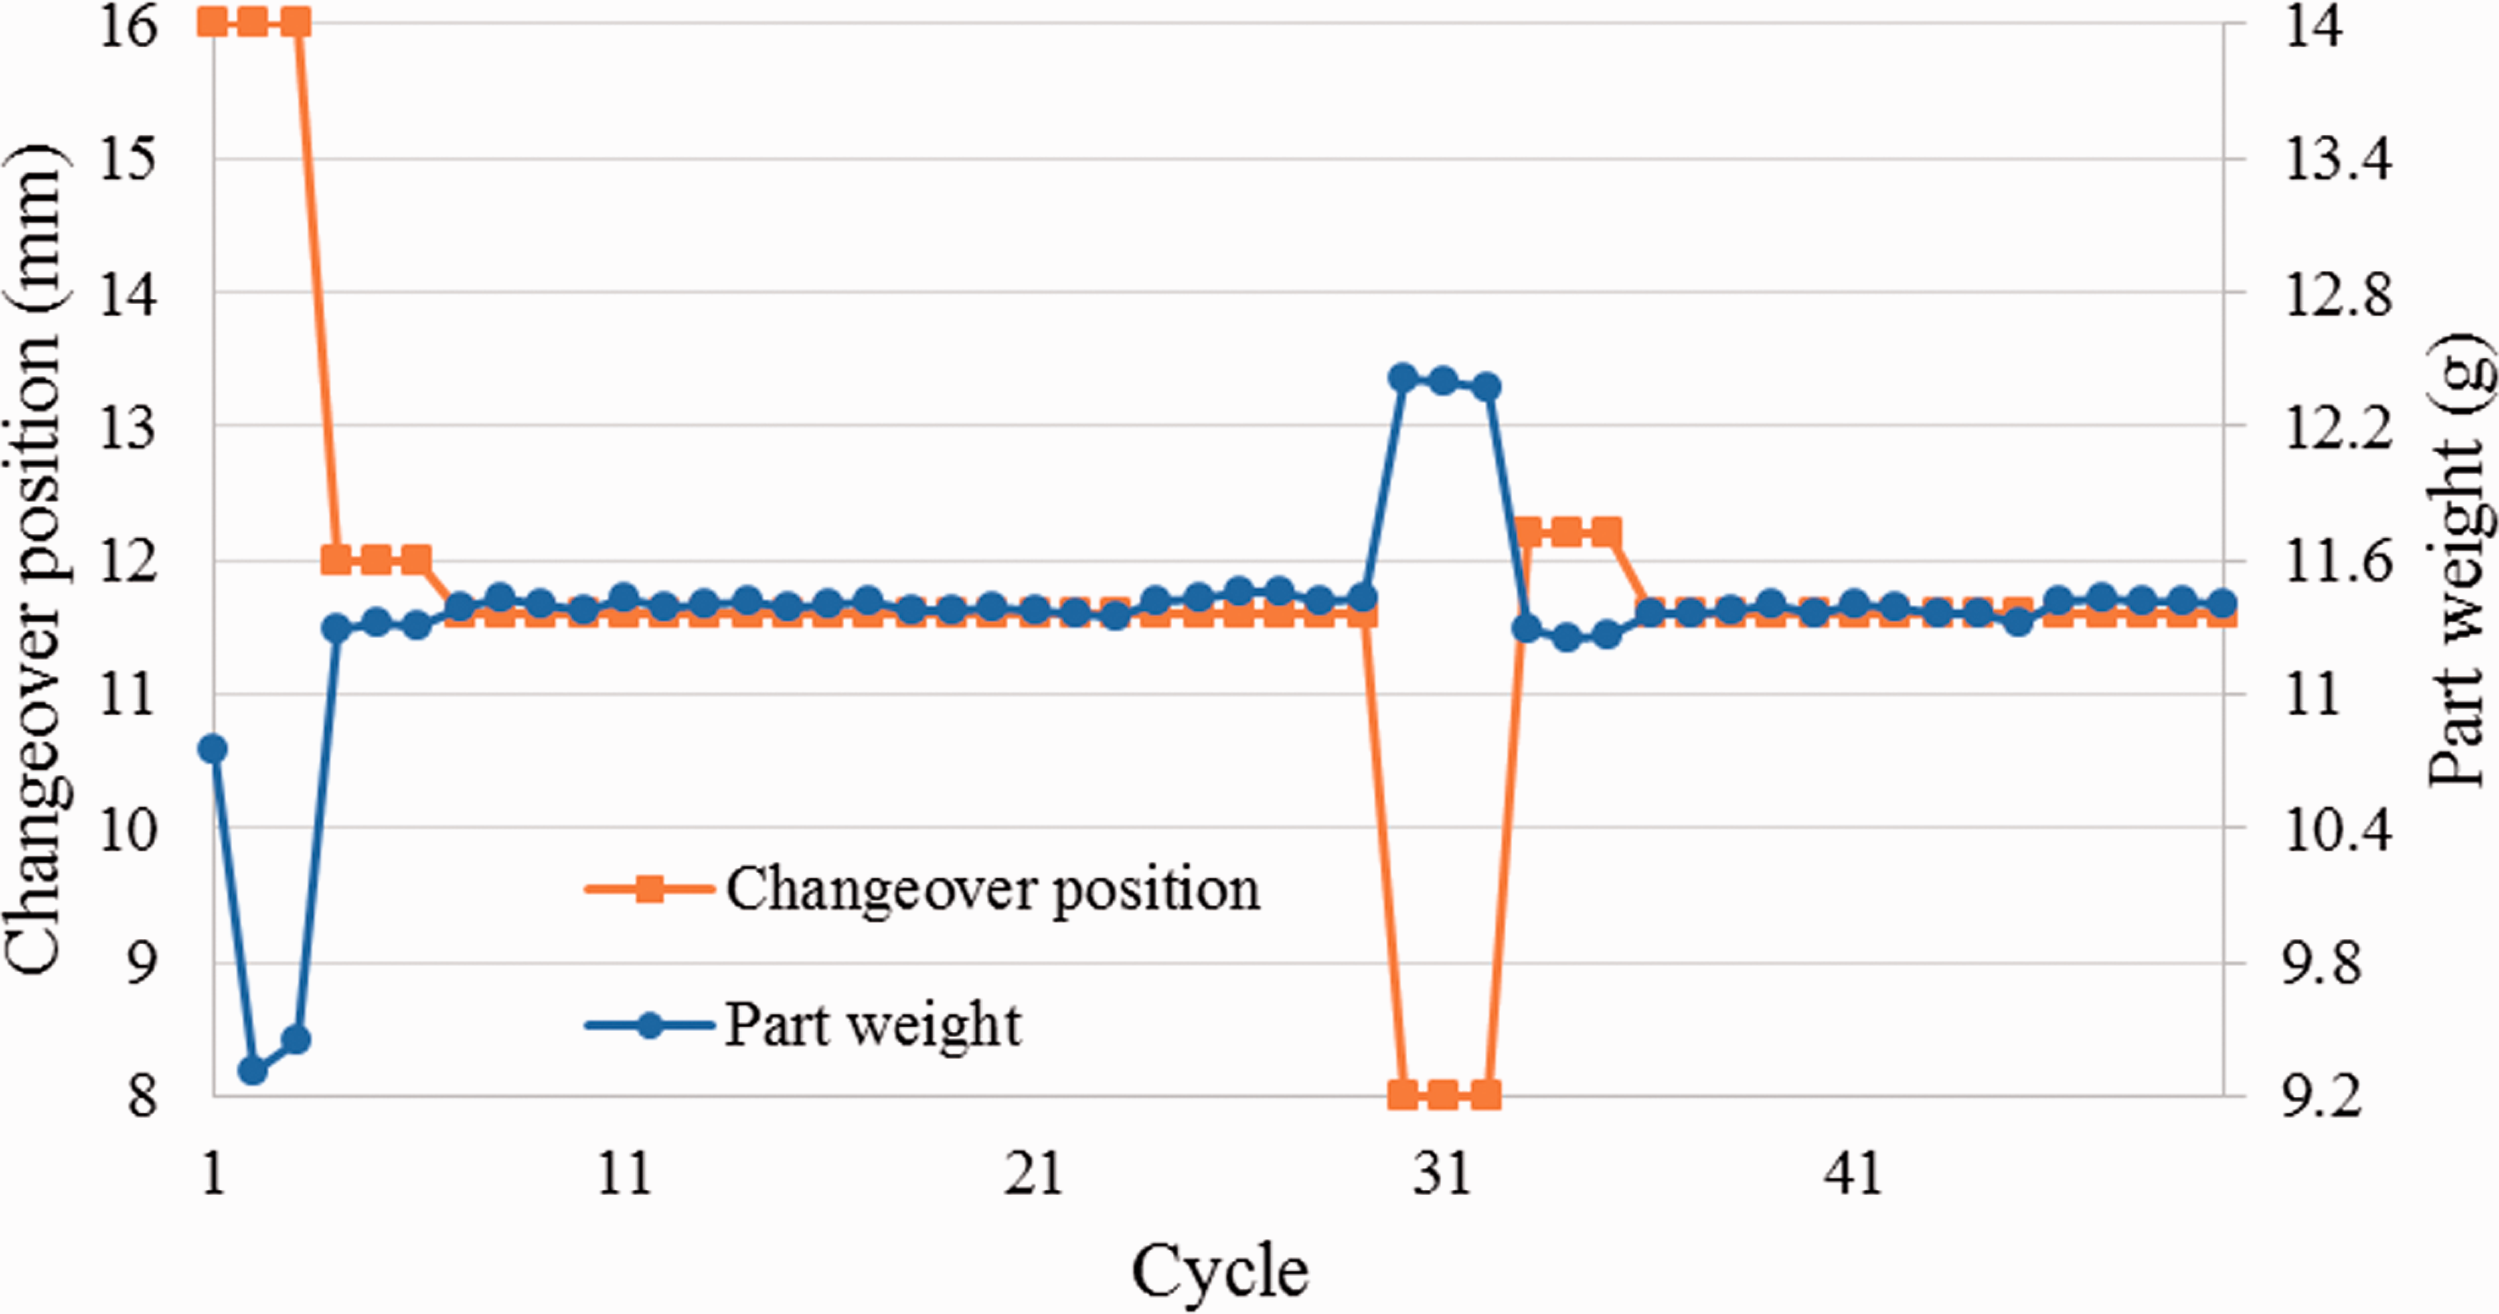
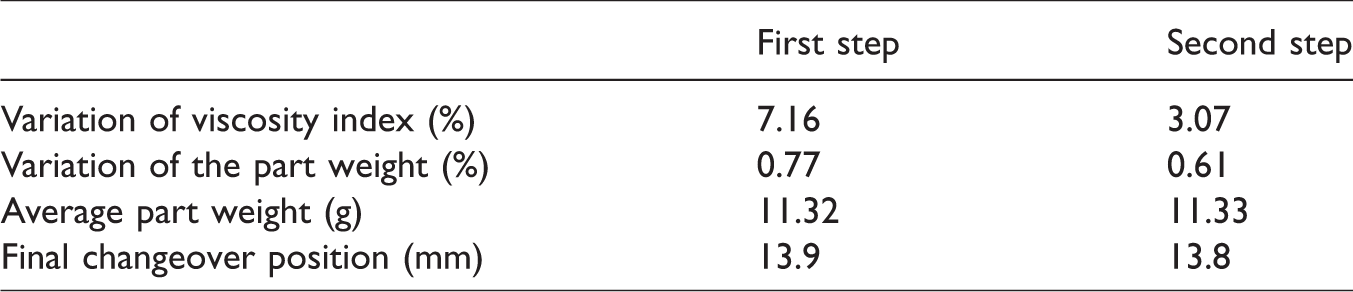
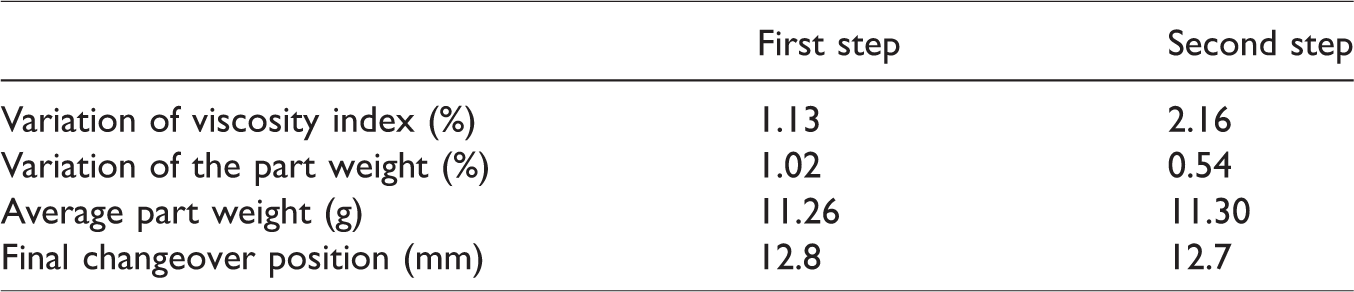
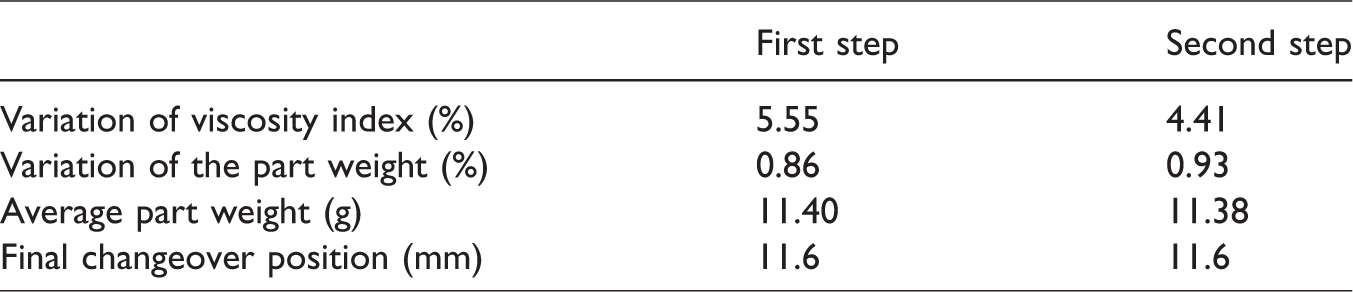
In the experiments used to assess the self-adjusting scheme, we first set an early changeover position and allowed the system to make adjustments in response. After the system became stable, we set a late changeover position in order to simulate an error during the injection molding process. Results from these experiments are shown in Figures 11 to 16. Table 4 to 6 present variations in the VI and weight of the parts, while the system was operating in self-adjusting mode.
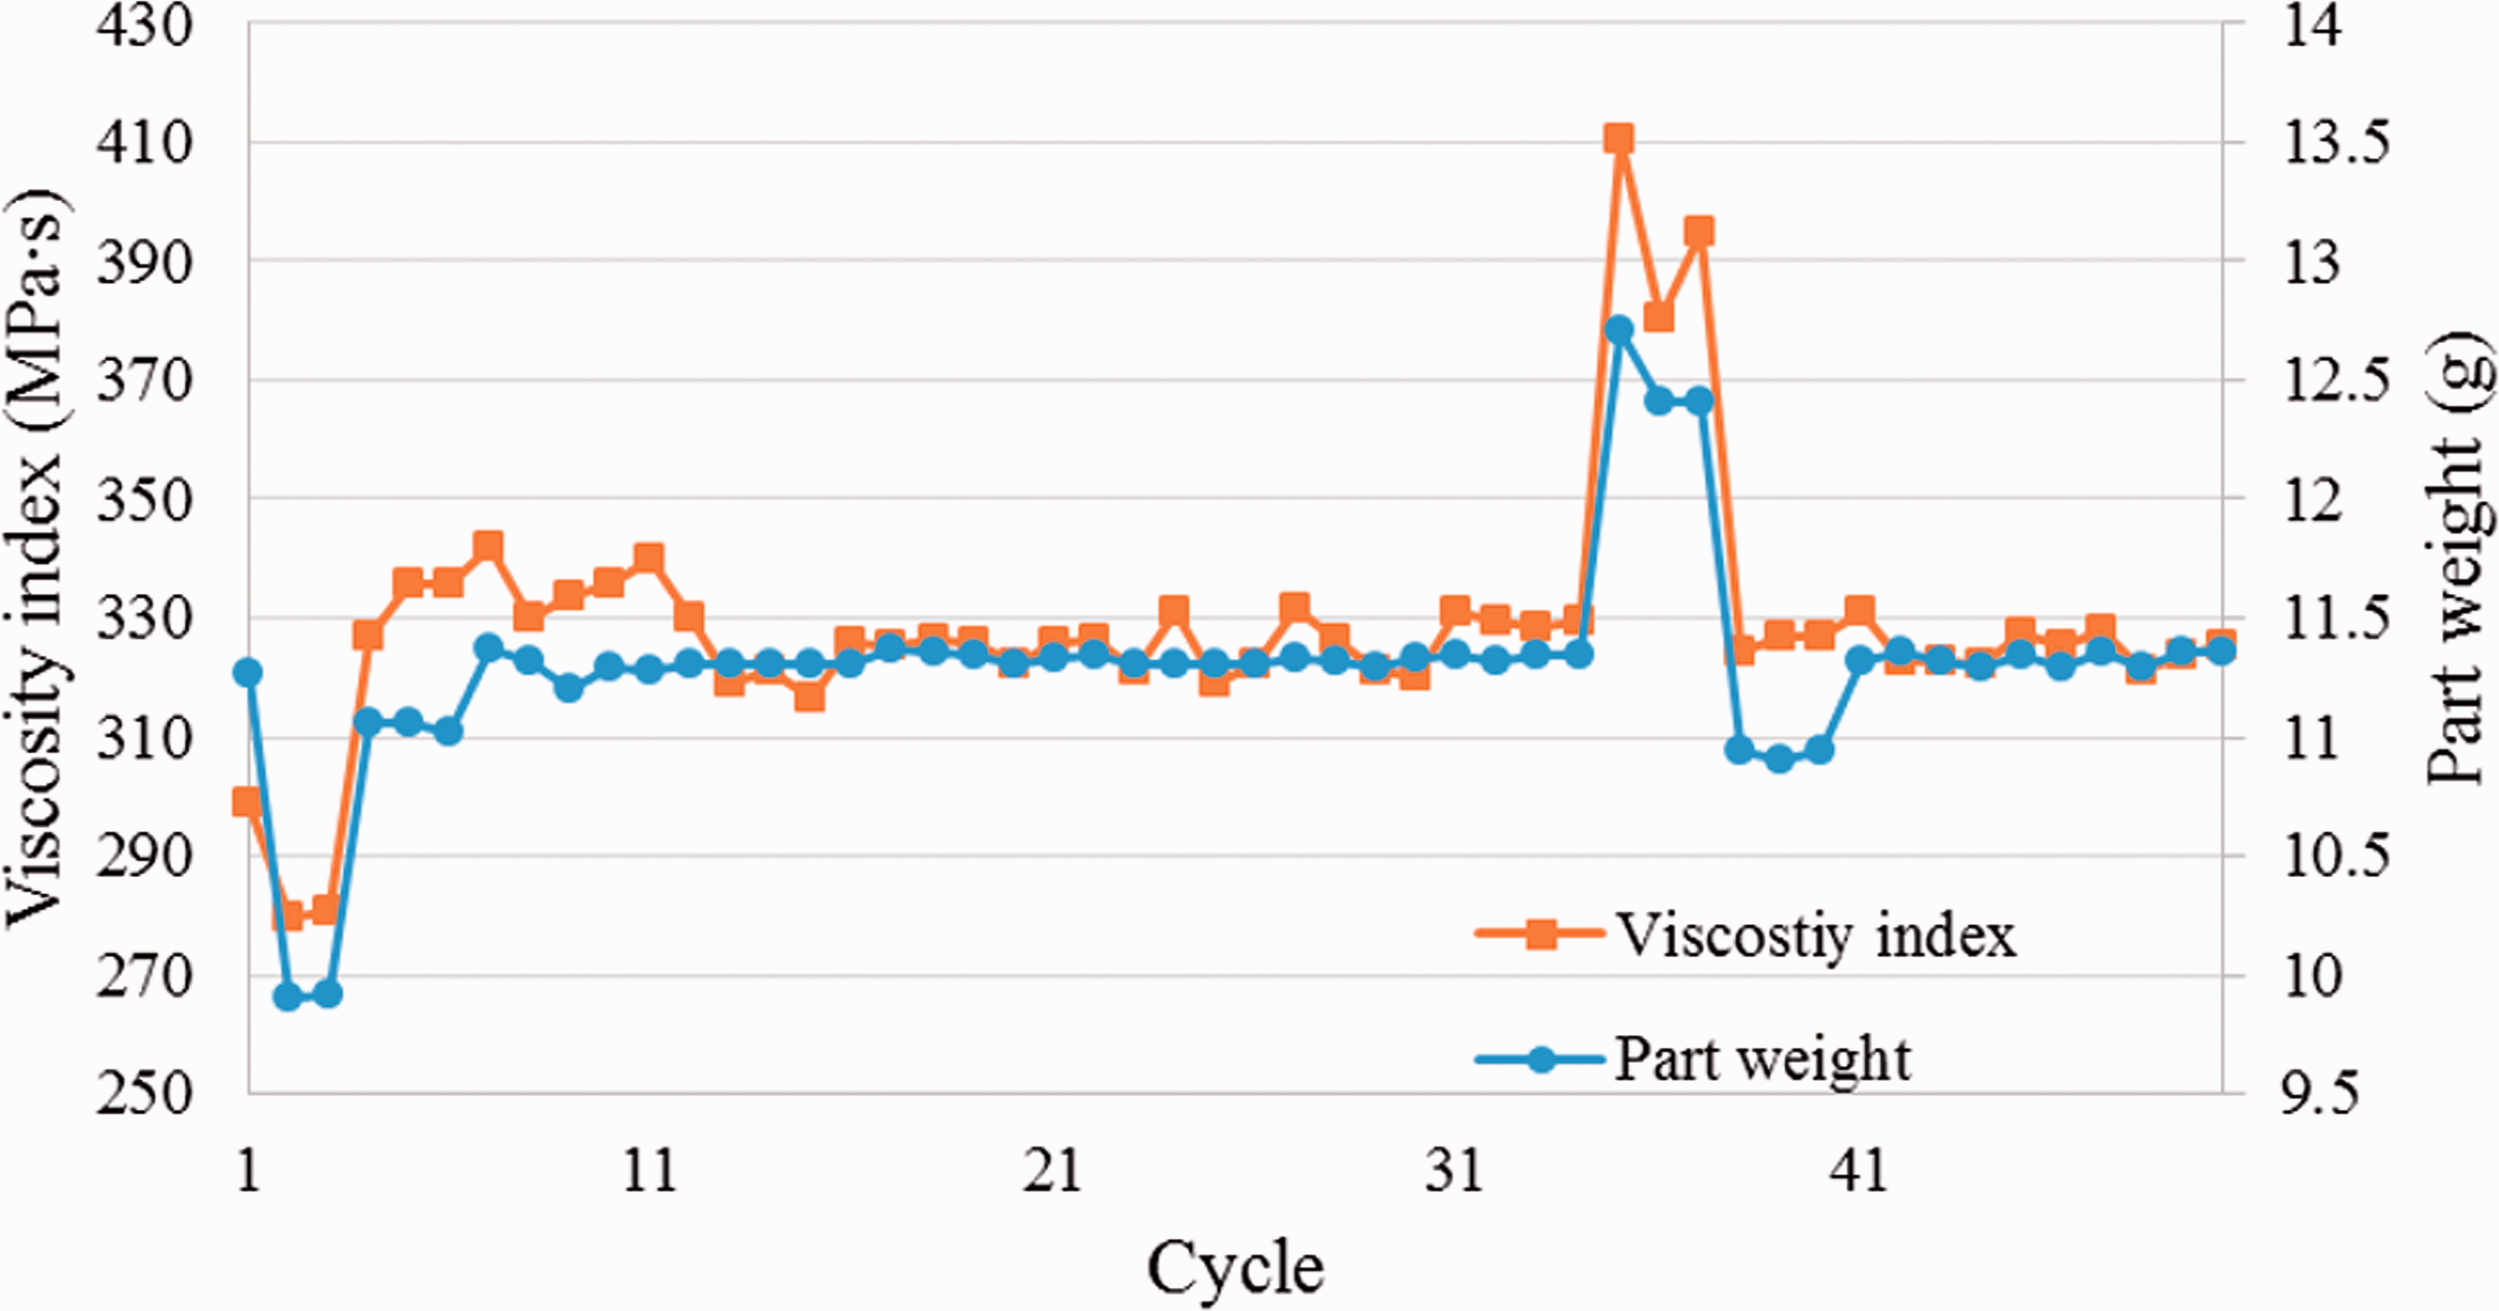
Distribution between viscosity index and the part weight in the self-adjusting mode experiment (melt temperature: 190°C).
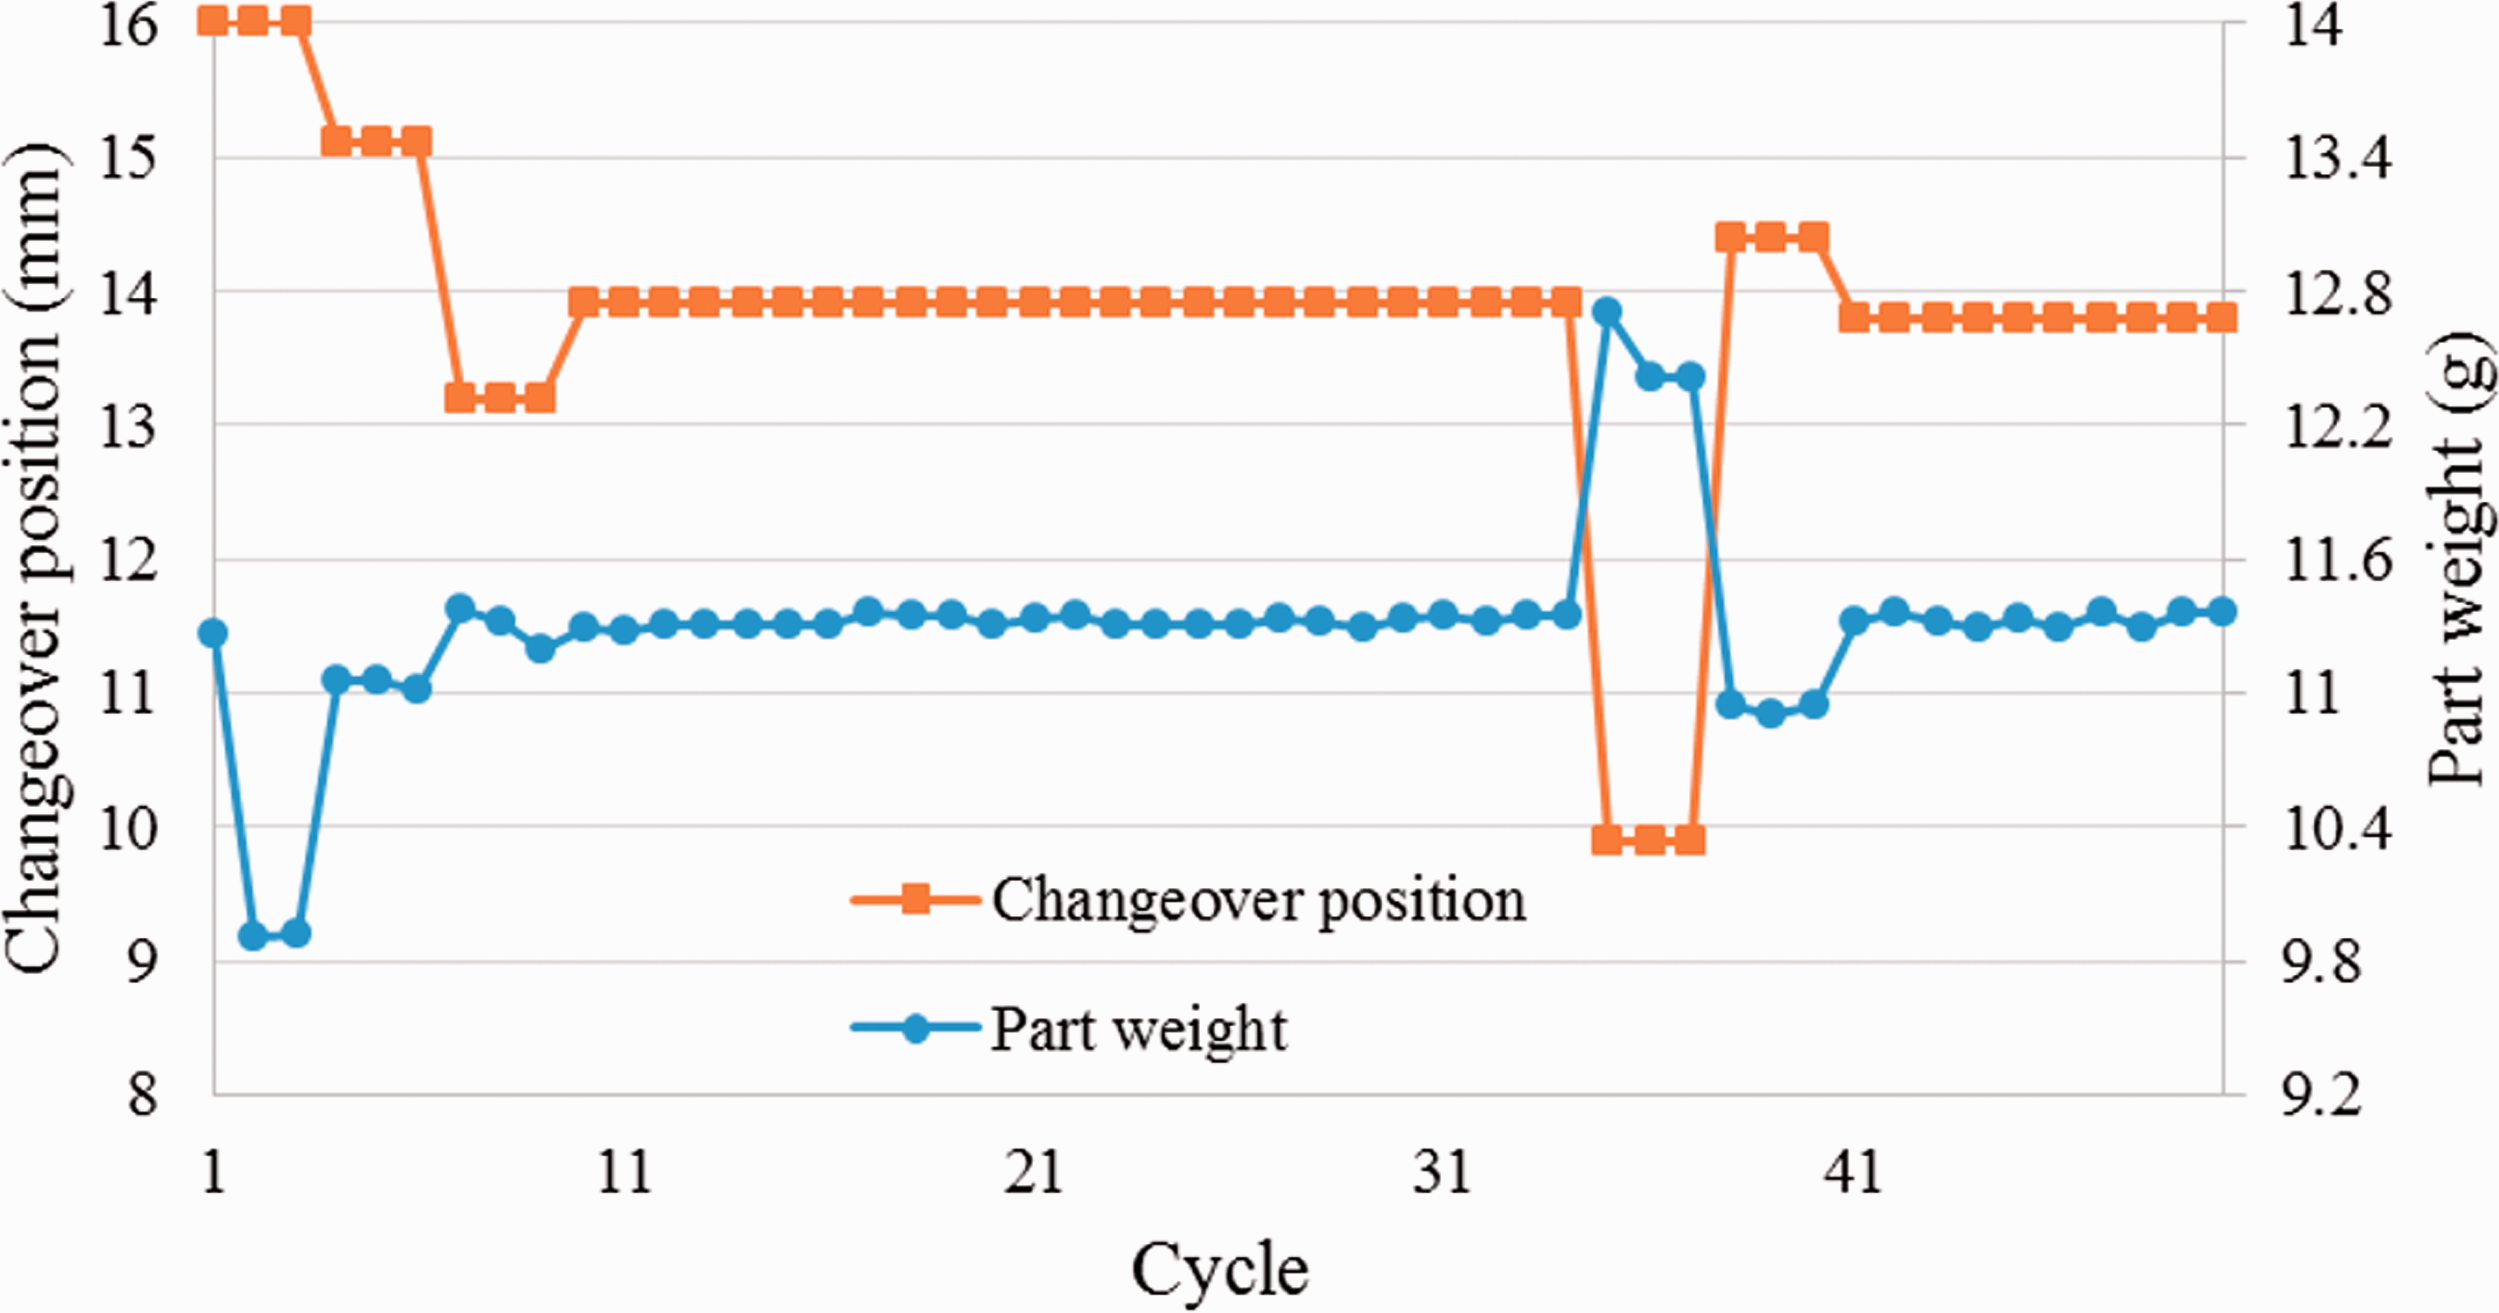
Distribution between changeover position and the part weight in the self-adjusting mode experiment (melt temperature: 190°C).
Distribution between viscosity index and the part weight in the self-adjusting mode experiment (melt temperature: 200°C).
Distribution between changeover position and the part weight in the self-adjusting mode experiment (melt temperature: 200°C).
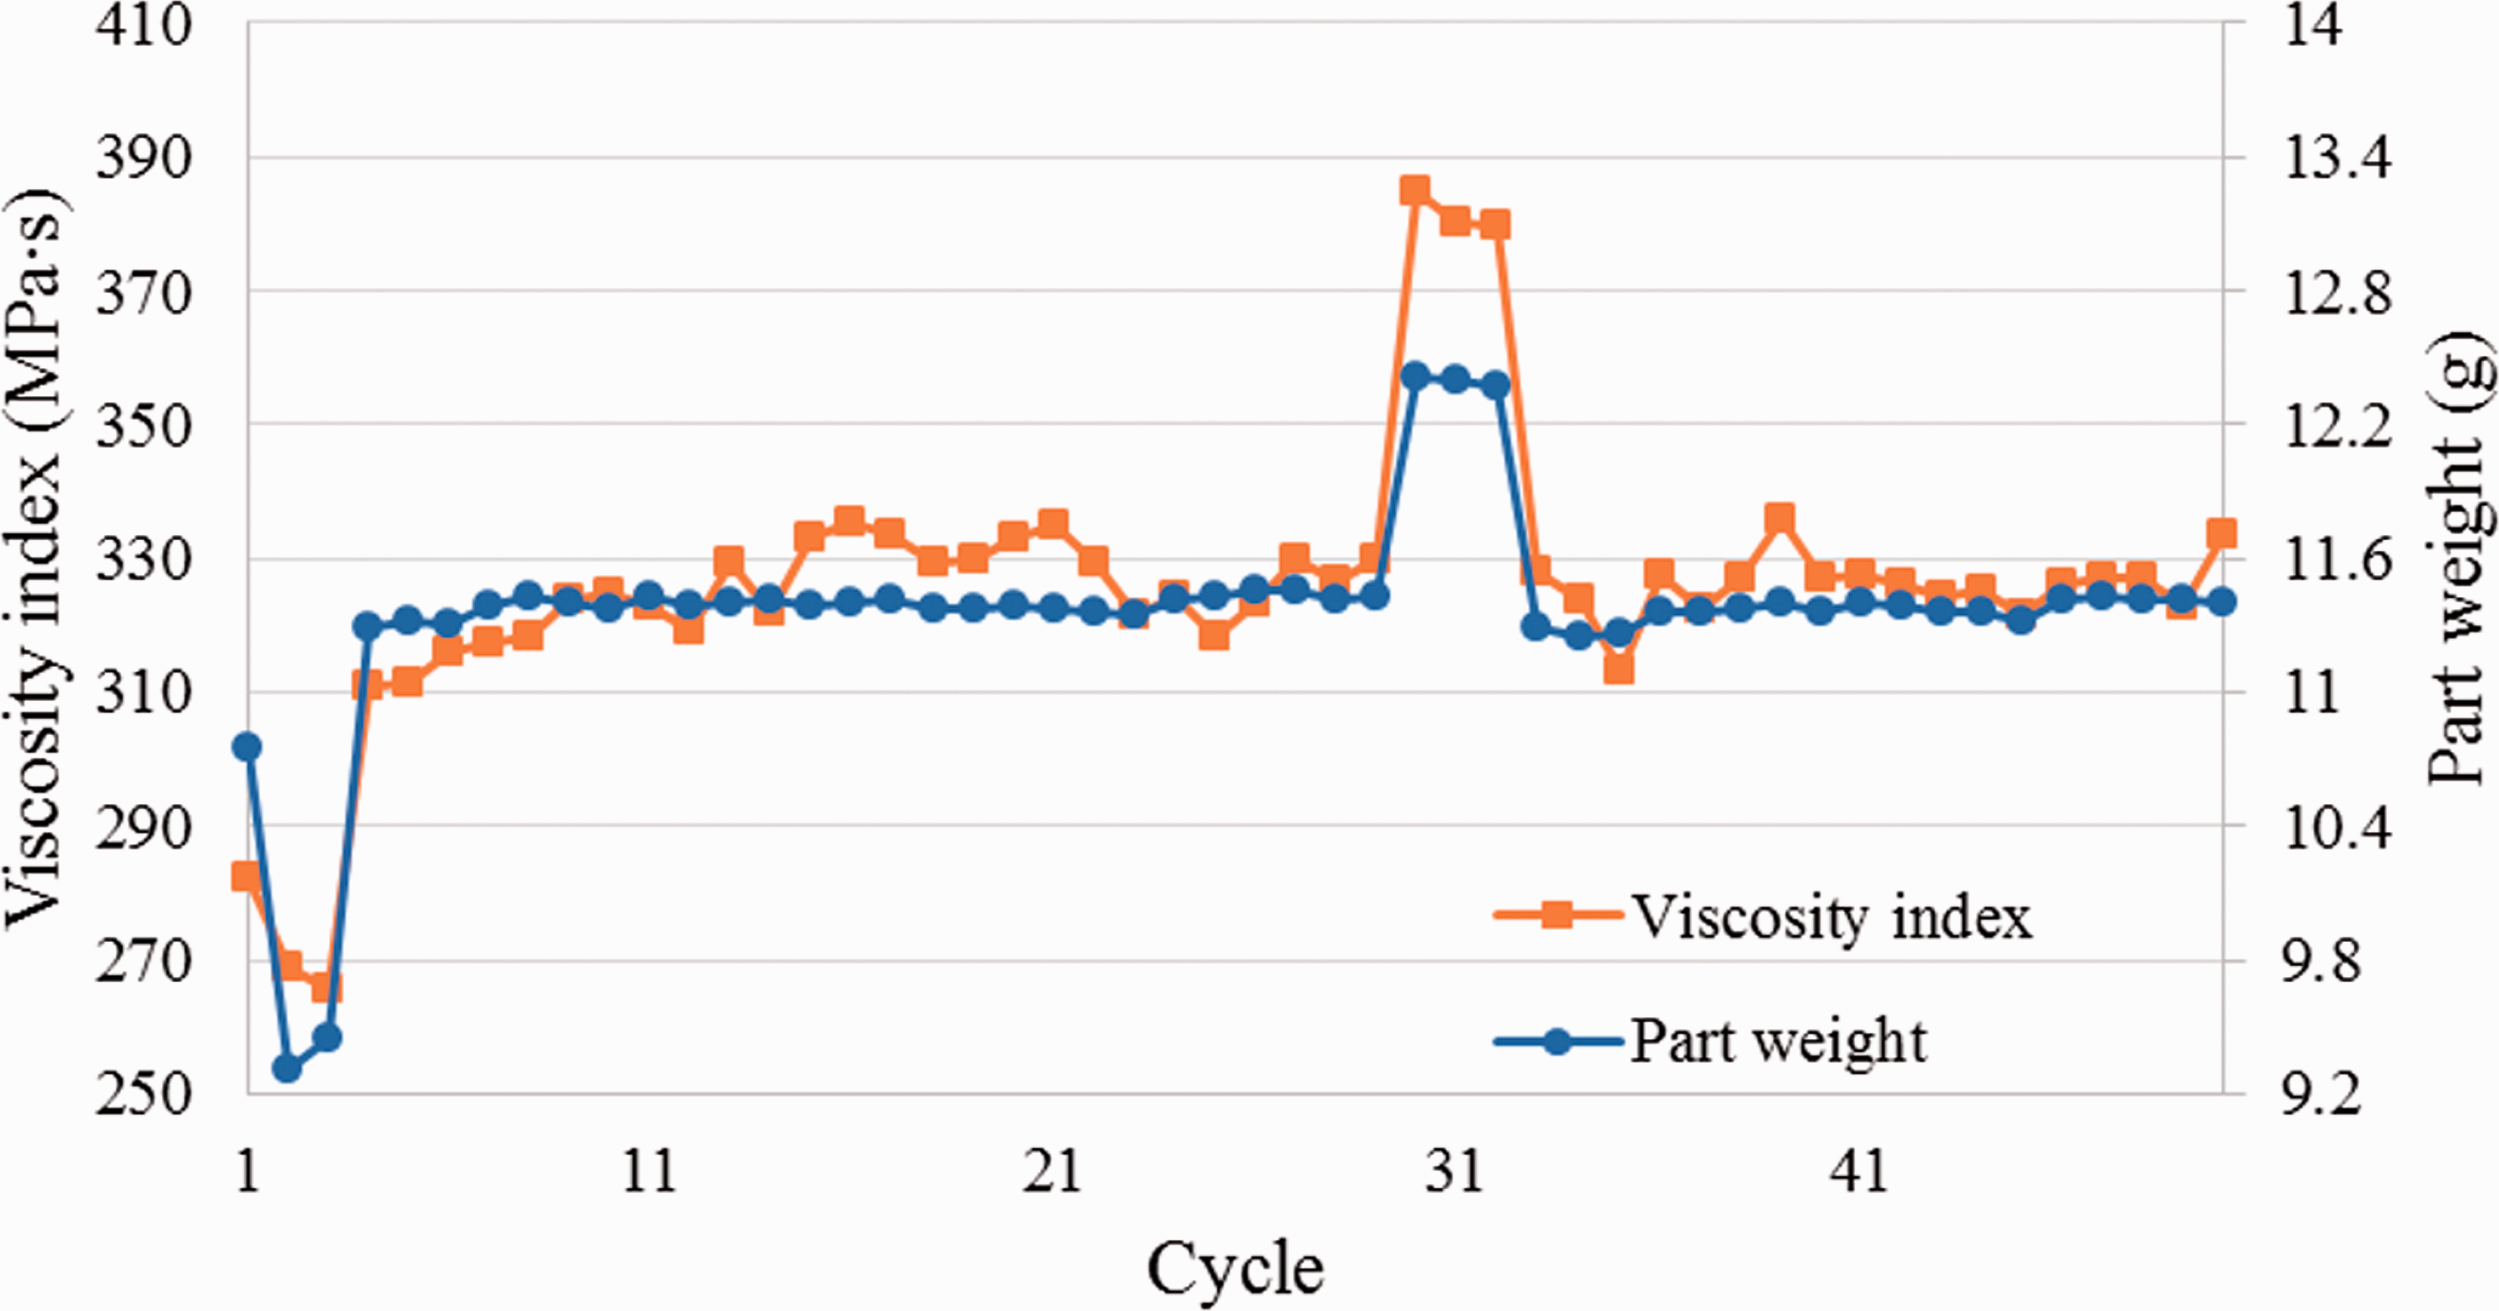
Distribution between viscosity index and the part weight in the self-adjusting mode experiment (melt temperature: 210°C).
Distribution between changeover position and the part weight in the self-adjusting mode experiment (melt temperature: 210°C).
Variation of viscosity index and the part weight in the self-adjusting mode experiment (melt temperature: 190°C).
Variation of viscosity index and the part weight in the self-adjusting mode experiment (melt temperature: 200°C).
Variation of viscosity index and the part weight in the self-adjusting mode experiment (melt temperature: 210°C).
In the experiments assessing self-adjusting mode, the changeover position would be shifted when three consecutive errors occurred. The system would even be able to react appropriately to situations where the changeover position changed unexpectedly during a production run, and in so doing maintain stable quality.
The self-adjusting scheme was shown to reduce variations in the weight of parts; however, the degree of variation was still excessively high.
Conclusions
The results of single-factor experiments on changeover position and melt temperature revealed that the distribution between the VI and weight of parts conforms to the P-V-T relationship. The VI was shown to increase as the part weight increased, and vice versa. The experiment results in this study validate the efficacy of the VI to guide the adjustment of the changeover position.
The purpose of packing stage is to compensate for a reduction in the volume of melt material. It is possible that the process of packing could affect the relationship between the VI and the weight of parts.
In experiments evaluating the self-adjusting scheme, APC proved an effective approach to adjusting the changeover position during injection molding. The changeover position is adjusted in the event of unexpected variation during a production run. The proposed system was shown to reduce variations in the weight of parts from 1 to 0.8%. In the future, the proposed control method will be modified with the aim of achieving specified performance targets.
Footnotes
Declaration of conflicting interests
The author(s) declared no potential conflicts of interest with respect to the research, authorship, and/or publication of this article.
Funding
The author(s) disclosed receipt of the following financial support for the research, authorship, and/or publication of this article: This work was funded by National Science Council under grant MOST-106–2218-E-035–005.