
Abstract
Seismic response of five-story frame structure supported by lead-rubber bearings isolation system is investigated subjected to near-fault ground motions. The main structure is modeled as a simple linear multi-degrees-of-freedom vibration system with lumped masses, excited by near-fault ground motions in the horizontal direction. The variation curves of peak top floor acceleration and peak bearing displacement of isolated building are plotted under different yield shear coefficient. The objective function selected for optimality is to maximize the seismic energy dissipated by the lead-rubber bearings. The main constraint conditions selected for optimality are the minimization of both peak bearing displacement and peak top floor acceleration. Optimum parameters of lead-rubber bearing isolation system are investigated and found that optimum yield shear coefficient of lead-rubber bearings is found to be in the range of 0.10–0.14 under near-fault ground motions. Optimum yield shear coefficient decreases with the increase of second isolation period. Optimum yield shear coefficient of lead-rubber bearings with higher yield displacement is larger than that of lead-rubber bearings with low yield displacement. Optimum ratio of pre-yield stiffness to post-yield stiffness of lead-rubber bearings is found to be in the range of 16–35. Optimum stiffness ratio increases proportionally with the decrease of yield displacement. Optimum stiffness ratio increases slightly with the increase of yield shear coefficient. Excluding the effect of pre-yield stiffness, the optimum second isolation period is recommended to be in the range of 4–6 s.
Keywords
Introduction
In order to reduce structural damage in the earthquake, the base isolation system has been suggested in contrast to the conventional seismic technology. The basic principle of base isolation is to extend the natural vibration period of the structure by setting the isolators to effectively reduce the seismic response of the building. Second, the primary goal of base isolation is to dissipate the seismic energy by providing the dampers and thereby, reducing the seismic energy into the superstructure. Therefore, by using the base isolation technique, the superstructure can be basically decoupled from the ground motion during earthquake. Base isolation technology has been used widely as an effective seismic method during the past few decades. According to the principle of isolation, seismic isolation devices can be divided into rubber bearings, sliding bearings, and roller bearings by Buckle and Mayes 1 and Jangid and Datta. 2 Among the various base isolation systems, the lead-rubber bearing (LRB) isolation system had been used widely in the United States and other countries. The structure isolated by the LRBs had been proved to have a better isolation effect under the Northridge and Kobe earthquake by Nagarajaiah et al.3,4
According to the distance of the site away from the fault, the ground motion can be divided into near-fault ground motions and far-field ground motions. Near-fault ground motion generally refers to the ground motion of the site no more than 20 km away from the fault. Hall et al., 5 Chopra and Chintanapakdee, 6 Mavroeidis et al., 7 Bray and Rodriguez-Marek, 8 and Kalkan and Kunnath 9 investigated the motion characteristics of near-fault ground motion and its impact on the buildings. Base-isolated building is vulnerable to large pulse ground motion in near-fault areas. The long period pulse of near-fault ground motion causes a larger displacement of isolation bearings, which can cause the instability of base-isolated buildings. And the resulting overturning moment may cause the tension of rubber isolation bearings. The reliability of base isolation structure in the near-fault area has received a considerable amount of attention by Hall et al. 5 and Mazza et al.10,11 Recently, some studies on seismic response of base isolation system under near-fault ground motion had been reported by some scholars.9,12–19 Jangid 20 suggested that the yield strength of LRB isolation system is in the range of 0.1–0.15 of the total weight of the isolated building under near-fault motions. The optimum ratio of pre-yield stiffness to post-yield stiffness of the LRB isolation system was not reported under near-fault ground motions in the above studies. Therefore, it is necessary to further study the optimum parameters of LRB isolation system under near-fault ground motions.
Herein, the optimum parameters of LRB isolation system supporting a linear flexible five-story structure subjected to near-fault ground motions are investigated. The specific objectives of the study are: (1) to study the seismic response of LRB isolation system under near-fault ground motion, (2) to investigate the optimum parameters of LRB isolation system under near-fault ground motions, (3) to study the influence of different parameters of isolation system on the optimal parameters of LRB isolation system. Further, the research results may provide reference for the design of structure isolated by LRB under near-fault ground motions.
Dynamic analysis model of LRB isolation system
Mechanical model
The mechanical model of the LRB can be simplified as the bilinear hysteretic model, shown in Figure 1. Where K 1 is the initial stiffness of the LRB; K 2 is the post-yield stiffness of the LRB. The first isolation period of LRB isolation system and the second isolation period are, respectively, defined as follows: T 1 = 2π(M/K 1 )0.5, T 2 = 2π(M/K 2 )0.5, where M is the total mass of the base isolation structure. αk= K1/K2 is defined as the ratio of pre-yield stiffness to post-yield stiffness. Qy = αMg is defined as yield shear of the isolation layer, where α is the yield shear coefficient, and g is the gravity acceleration. Xy is the yield displacement. Sb and Xb are, respectively, the maximum shear force and the maximum displacement for the LRB isolation system, so, the largest base shear coefficient of the isolation system, αb is defined as: αb = Sb/Mg. The viscous damping, cb in the lead rubber bearing is evaluated by the damping ratio, ξb is expressed as: ξb= cb/2Mω, where ω = 2π/T 2 .
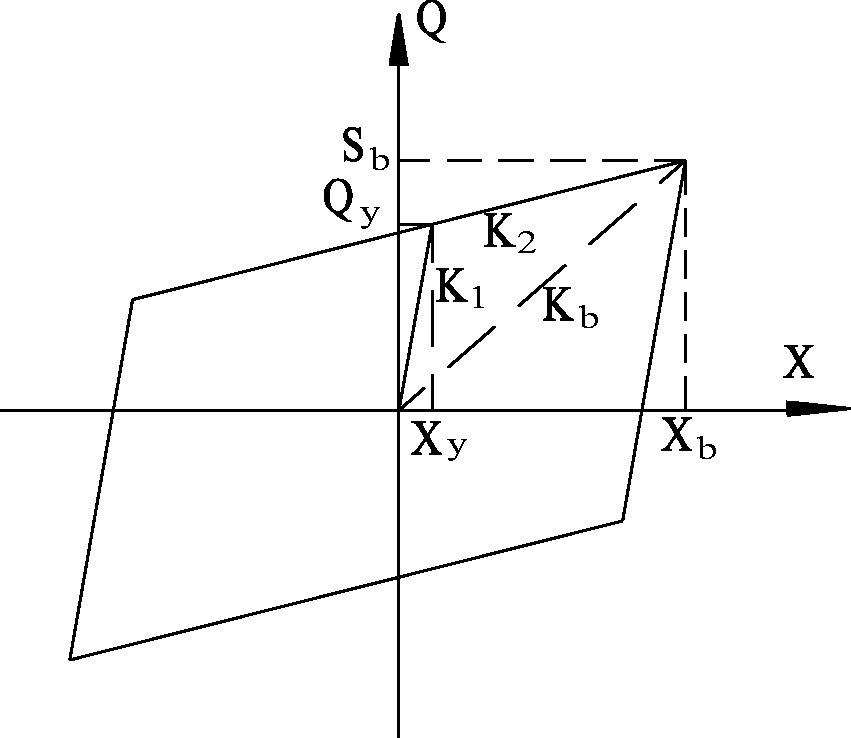
Bilinear model of LRB isolation system.
Motion equation of isolated structure with LRB
The isolated structure is assumed as follows: (1) the each story floor of the superstructure is assumed to be rigid, (2) the main structure is assumed as a simple linear MDOF vibration system with lumped masses (3) the isolated structure is excited by near-fault ground motions in a single horizontal direction, and the vertical component of the earthquake is neglected. Base-isolated structure is simplified to multi-degrees-of-freedom system; the calculation model is shown in Figure 2, where mb is the mass of isolation layer, mj is the mass of jth floor of superstructure. The equation of motion of the superstructure can be expressed as

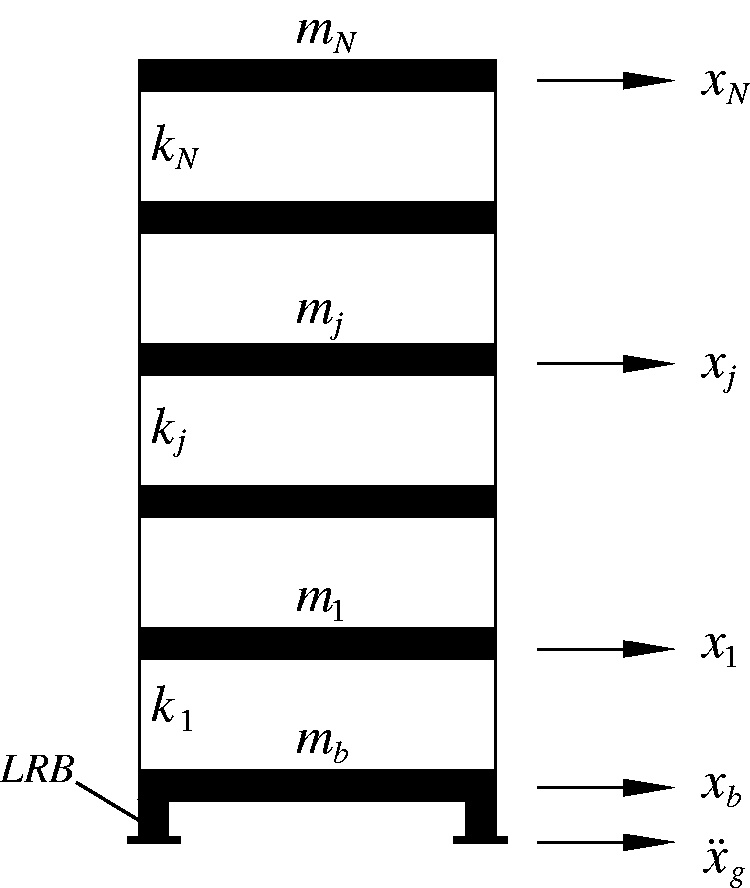
Computing model of MDOF isolation system.
The equation of motion of the isolation layer can be expressed by

Optimum parameter
Selection of near-fault seismic records
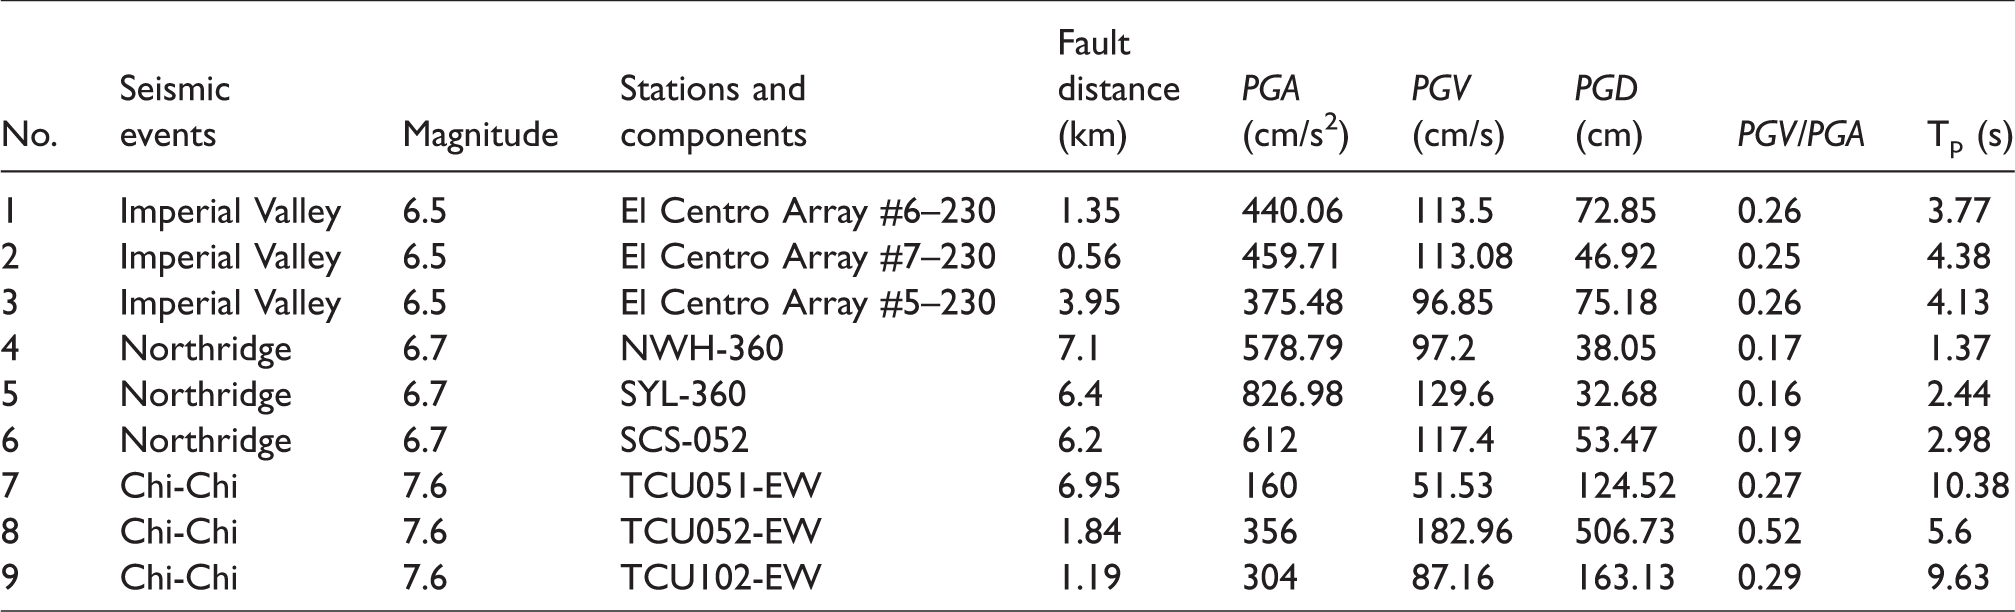
The fault distance, PGA (peak ground acceleration), PGV (peak ground speed), PGD (peak ground displacement), PGV/PGA (ratio of peak velocity to peak acceleration), Tp (pulse period), earthquake duration, and other characteristic parameters of ground motion are taken into account when selecting input seismic wave. The selection principle of seismic wave is as follows: (1) PGV/PGA is greater than 0.1, (2) the fault distance is within 20 km, (3) it contain obvious speed pulse, and (4) the pulse period is greater than 1 s. Nine near-fault seismic records are selected from the strong earthquake database of the Pacific earthquake Engineering Research Center (PEER). Some parameters of the selected seismic records are shown in Table 1.
The near-fault ground motions.
The displacement time history curve and response spectra of near-fault ground motion (Imperial Valley-El Centro Array #6–230) are shown in Figure 3. Figure 3(a) depicts the waveform of the Imperial Valley earthquake, in which a significant displacement pulse can be clearly observed, and the pulse shows a clear one-way trend. Figure 3(b) shows that the displacement spectrum value of near-fault earthquake is significantly greater than the displacement spectrum value of far-field earthquake (El Centro-NS), and indicates that due to the existence of the long-period pulse, near-fault ground motion induces a larger displacement spectra values for a structure with a period longer than 1 s. Period of the isolated building is generally longer, which means that the isolated structure is likely to induce a greater bearing displacement under near-fault ground motions.
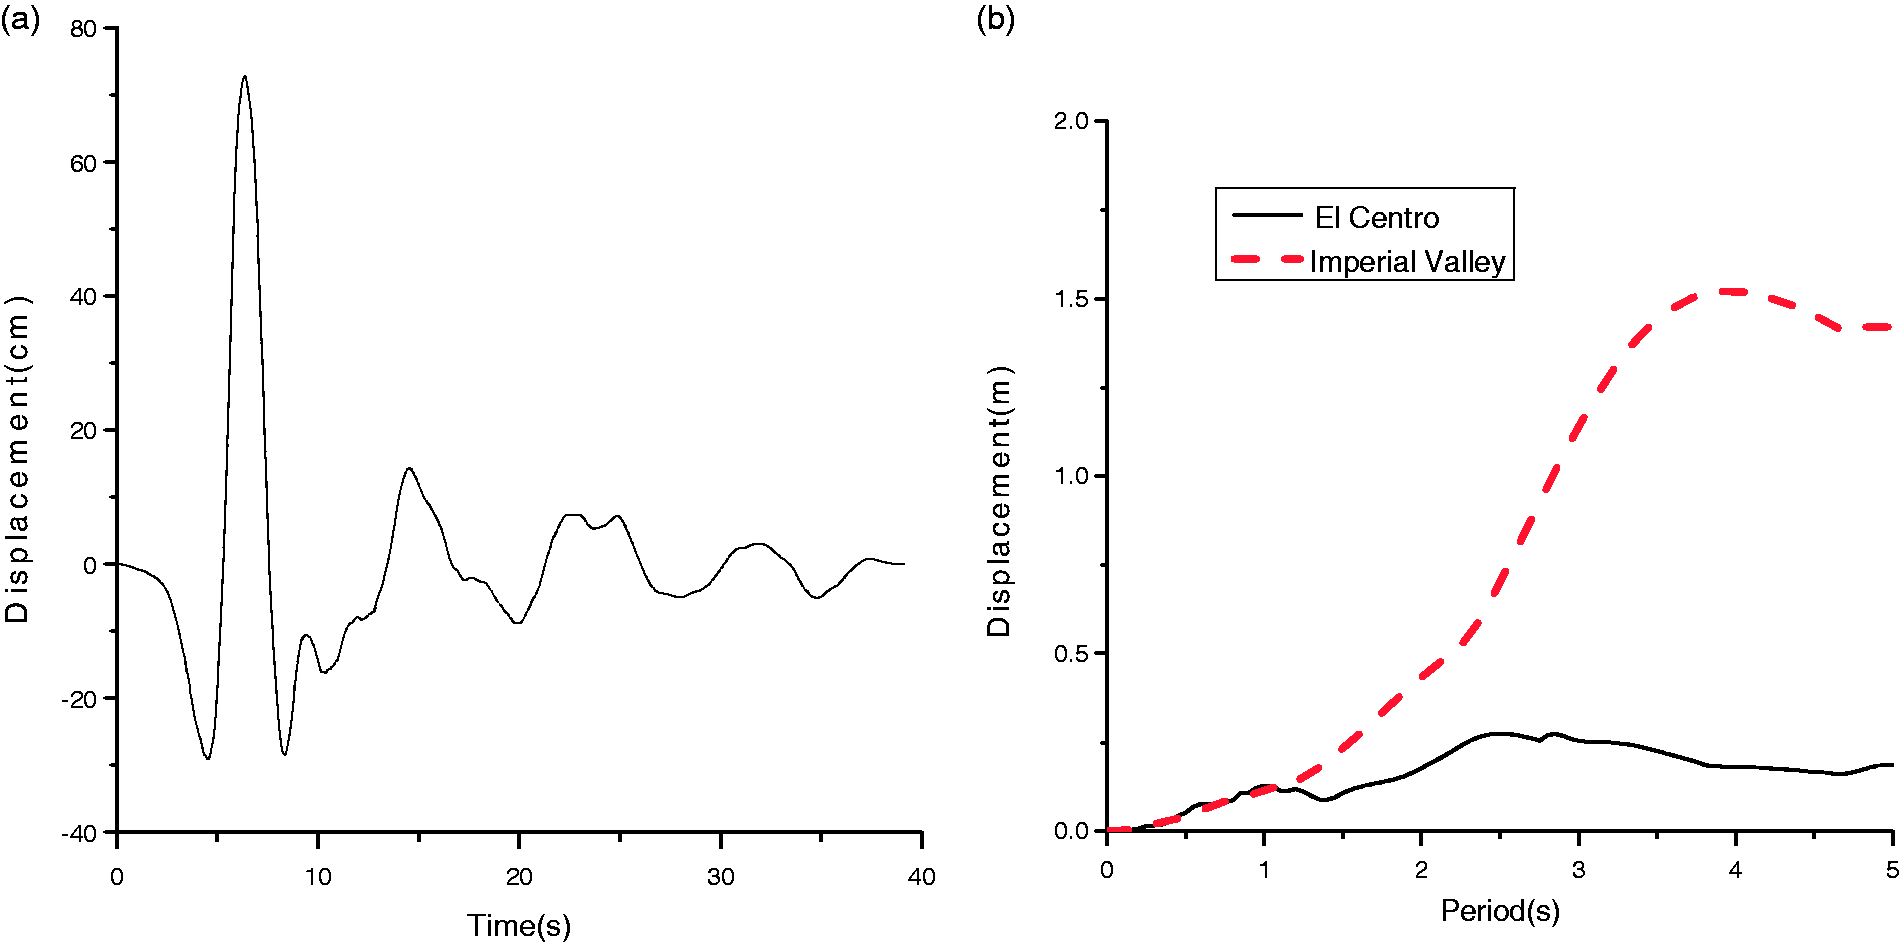
Displacement time history curve and response spectra of near-fault ground motion (Imperial Valley-El Centro Array #6–230): (a) displacement time history curve; (b) displacement spectra (5% damping).
Numerical study
For the present study, a five-story frame structure isolated by the LRB system is taken as the research object. The LRB isolation system under consideration can be characterized by the parameters namely, the mass of jth floor of the superstructure (mj), the horizontal stiffness of each floor of the superstructure (kj), and damping ratio of the superstructure (ξs). The parameters mj, kj, and ξs are held constant with mj=4.45 × 10⁵ kg, kj=4.48 × 10⁵ kN/m, and ξs =0.02. Entering the selected nine near-fault seismic records, according to the Chinese building code “Code for seismic design of buildings”, the peak ground acceleration of earthquake motion will be adjusted to 510 cm/s2, which is obtained by dividing the maximum value of the seismic influence coefficient by the amplification factor (about 2.25), it is equivalent to the corresponding peak ground acceleration of the basic seismic intensity of 8 degree (0.3g) in the rare earthquake. Because the fault distances of the nine seismic records selected in this paper are quite different, the near-field influence coefficient is not considered when inputting seismic waves. Figure 4 shows the variation curves of the maximum displacement of isolation bearings and the peak top floor acceleration against normalized yield shear coefficient of LRB, α under the different near-fault ground motions. The seismic responses are shown for a five-story base-isolated structure with T 2 =2.5 s and Xy=3 cm.
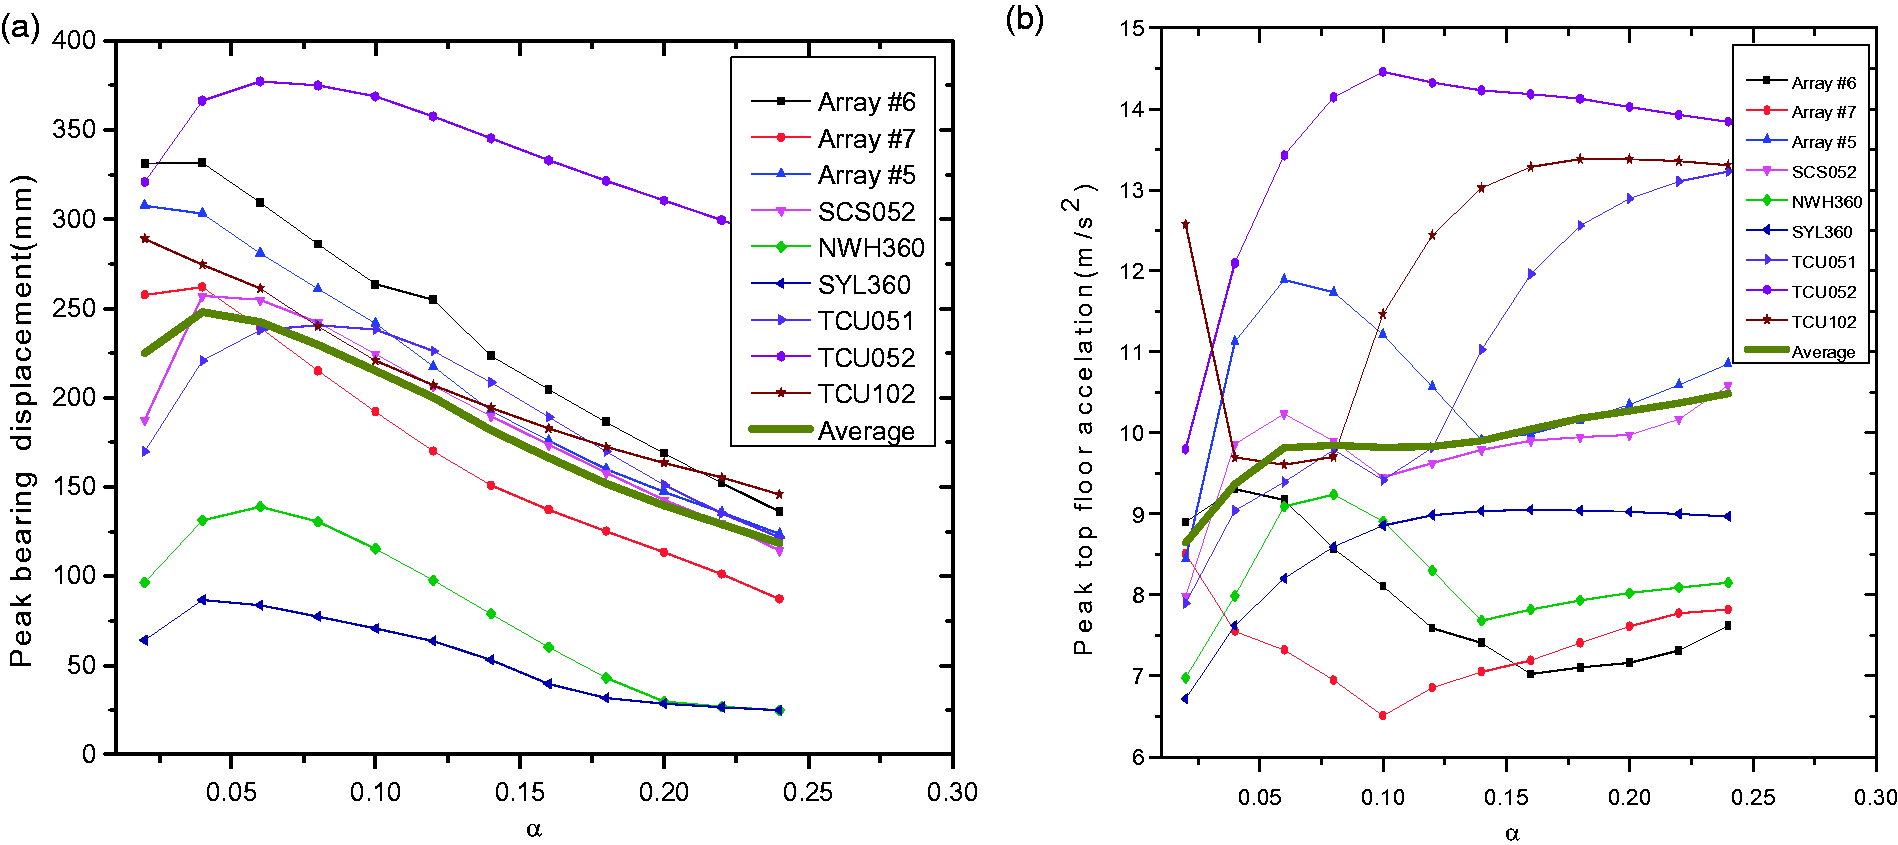
Variation curve of peak bearing displacement and peak top floor acceleration (T2=2.5 s, Xy=3 cm): (a) variation curve of peak bearing displacement; (b) variation curve of peak top floor acceleration.
In Figure 4, the variation curves of the average peak bearing displacement and peak top floor acceleration are also plotted. The figure shows that the maximum displacement of isolation bearing decreases substantially with the increase of yield shear coefficient. It can be seen from Figure 4 that as the bearing yield shear coefficient increases the peak top floor acceleration first increases and gradually tends to level and then continues to increase with the increase of yield shear coefficient. Therefore, the peak bearings displacement can be effectively reduced by increasing the yield shear coefficient of the LRB under near-fault ground motions. The peak top floor acceleration increases slightly with the increase of yield shear coefficient, but the change is not significant. The displacement of isolation bearings is too large, which may lead to the overturning of base-isolated structure, and excessive peak top floor acceleration will make inhabitants of the building to have a strong sense of shock under the near-fault ground motions. Therefore, the peak bearing displacement and the peak top floor acceleration are the important parameters, which can be used to verify the damping effect of LRB isolation system. Compared with the two parameters, the peak bearing displacement should be given more weight for the optimum parameter.
In order to distinguish the shock absorption performance of LRB isolation system under the different yield shear coefficient, the corresponding hysteresis loops are plotted in Figure 5. It can be seen from Figure 5 that for α = 0.05 the bearing displacement is significantly greater as compared with α = 0.15. The shape of LRB hysteresis curve at the higher yield shear coefficient is relatively full, which indicates that the base-isolated structure at higher yield shear coefficient has better plastic deformation capacity, seismic capacity, and energy dissipation capacity. The relatively better shock absorption performance exhibited by LRB at higher yield shear coefficient is mainly due to the strengthening of the isolator caused by the higher yield shear coefficient. For relatively small yield shear coefficient, the effective period of the base-isolated building is about 2.5 s, which is equivalent to the pulse duration that causes the large displacement of the isolation bearings. Therefore, the yield shear coefficient of the LRB should provide the sufficient initial stiffness when the lead-core does not yield.
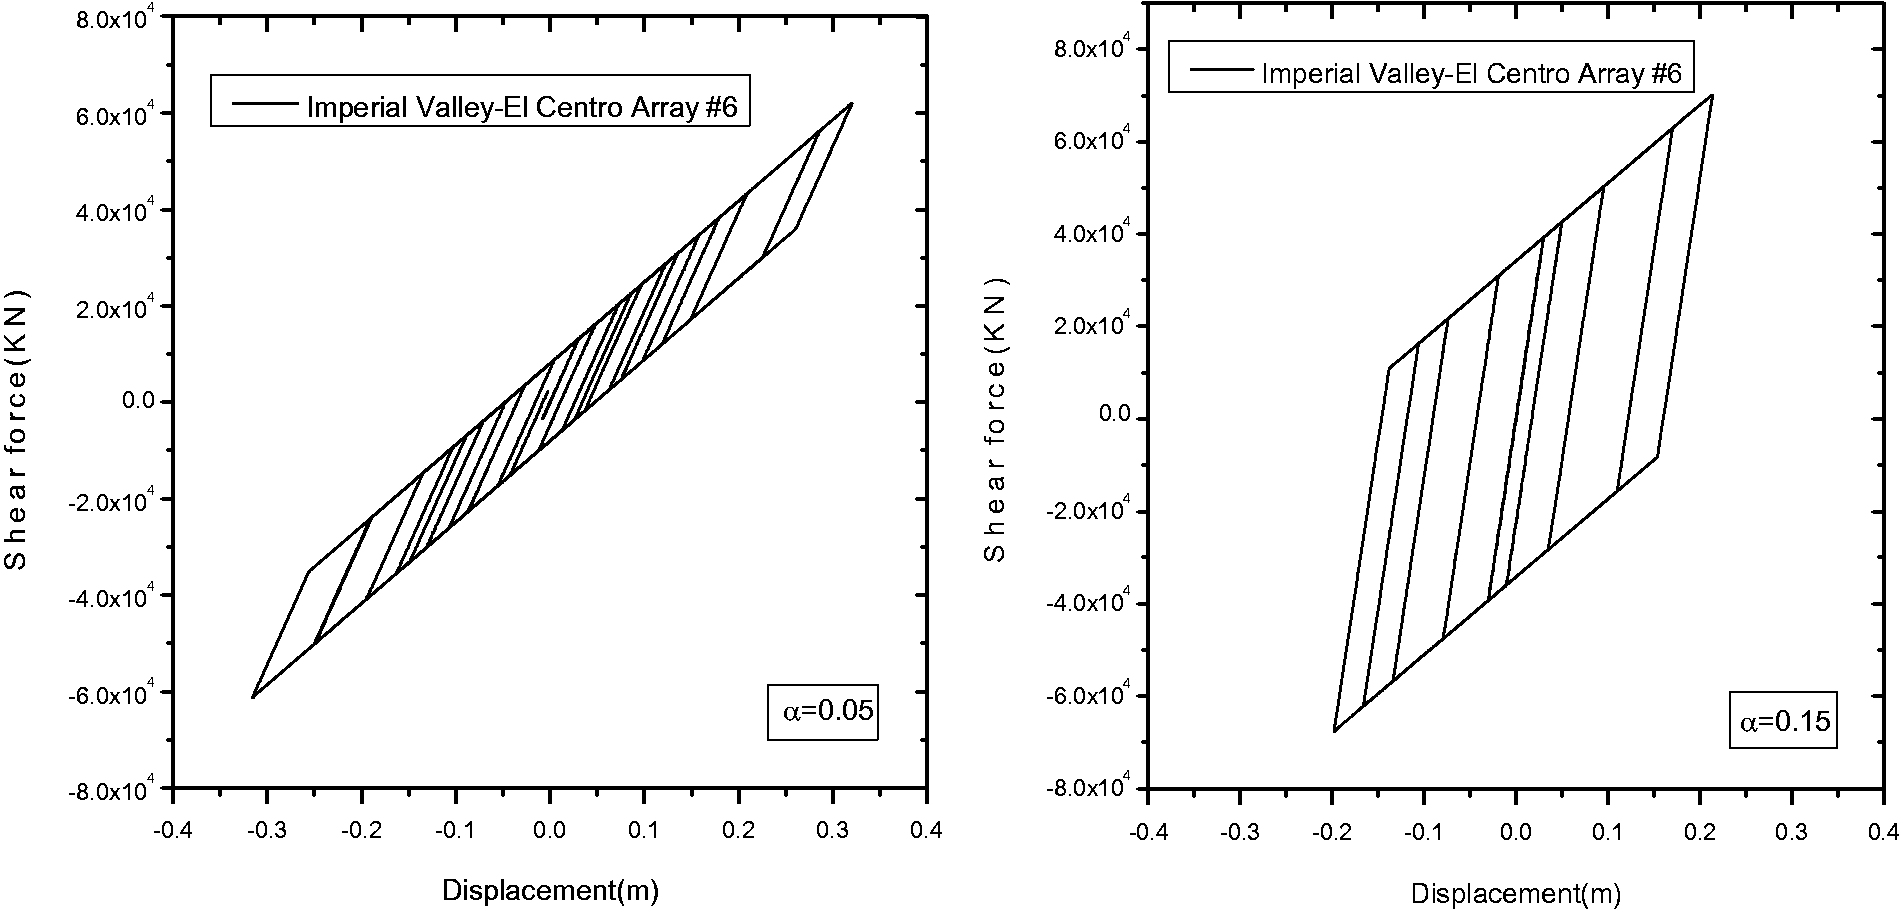
Hysteretic curve of LRB isolation system for two levels of yield shear coefficient (T2=2.5 s, Xy=3 cm).
Parameter optimization model
The objective function is the goal of optimization. The optimal goal of base-isolated buildings is usually selecting the reasonable control parameters of isolation devices to reduce the seismic response of the structure. According to the purpose of base-isolated structure design, the maximum of seismic response of the structure under the rare earthquake tends to the minimum; it can be regarded as the objective function. From the energy point of view, it is assumed that changing the parameters of the isolation system does not change the seismic energy input into the isolation system. The objective function selected for optimality is to maximize seismic energy dissipated by the LRB. The constraint conditions selected for optimality are the minimization of both the peak top floor acceleration and the peak bearing displacement. In mathematics, the optimum design of the LRB isolation system can be attributed to the following optimization problem.
Objective function

Constraint condition

The above optimum model belongs to the category of nonlinear dynamic optimization design. Where Rd = Ed/Ee is the energy dissipation scale factor, Ed is the seismic energy dissipated by the LRB, Ee is the seismic energy input into the isolation system, Xb is the peak isolation bearing displacement, and At is the peak top floor acceleration.
Optimum yield shear coefficient
The yield strength of the bilinear hysteretic model is generally in the range of 5–10% of the structural weight under far-field ground motions. For the present study, the yield shear coefficient, α of the LRB is taken in the range of 0.02–0.24. The yield displacement, Xy of the LRB are taken as 3 cm and 1 cm under near-fault ground motions, respectively. Figure 6 shows the variation curves of four seismic response indicators of isolation system namely Rd, Xb, At, and αb against the normalized yield shear coefficient under near-fault ground motions. The variation curves of four seismic response indicators of isolation system against the different second isolation period are shown in Figure 7. The values of response indicators in Figures 6 and 7 are the average of the calculation results of nine near-fault seismic records.
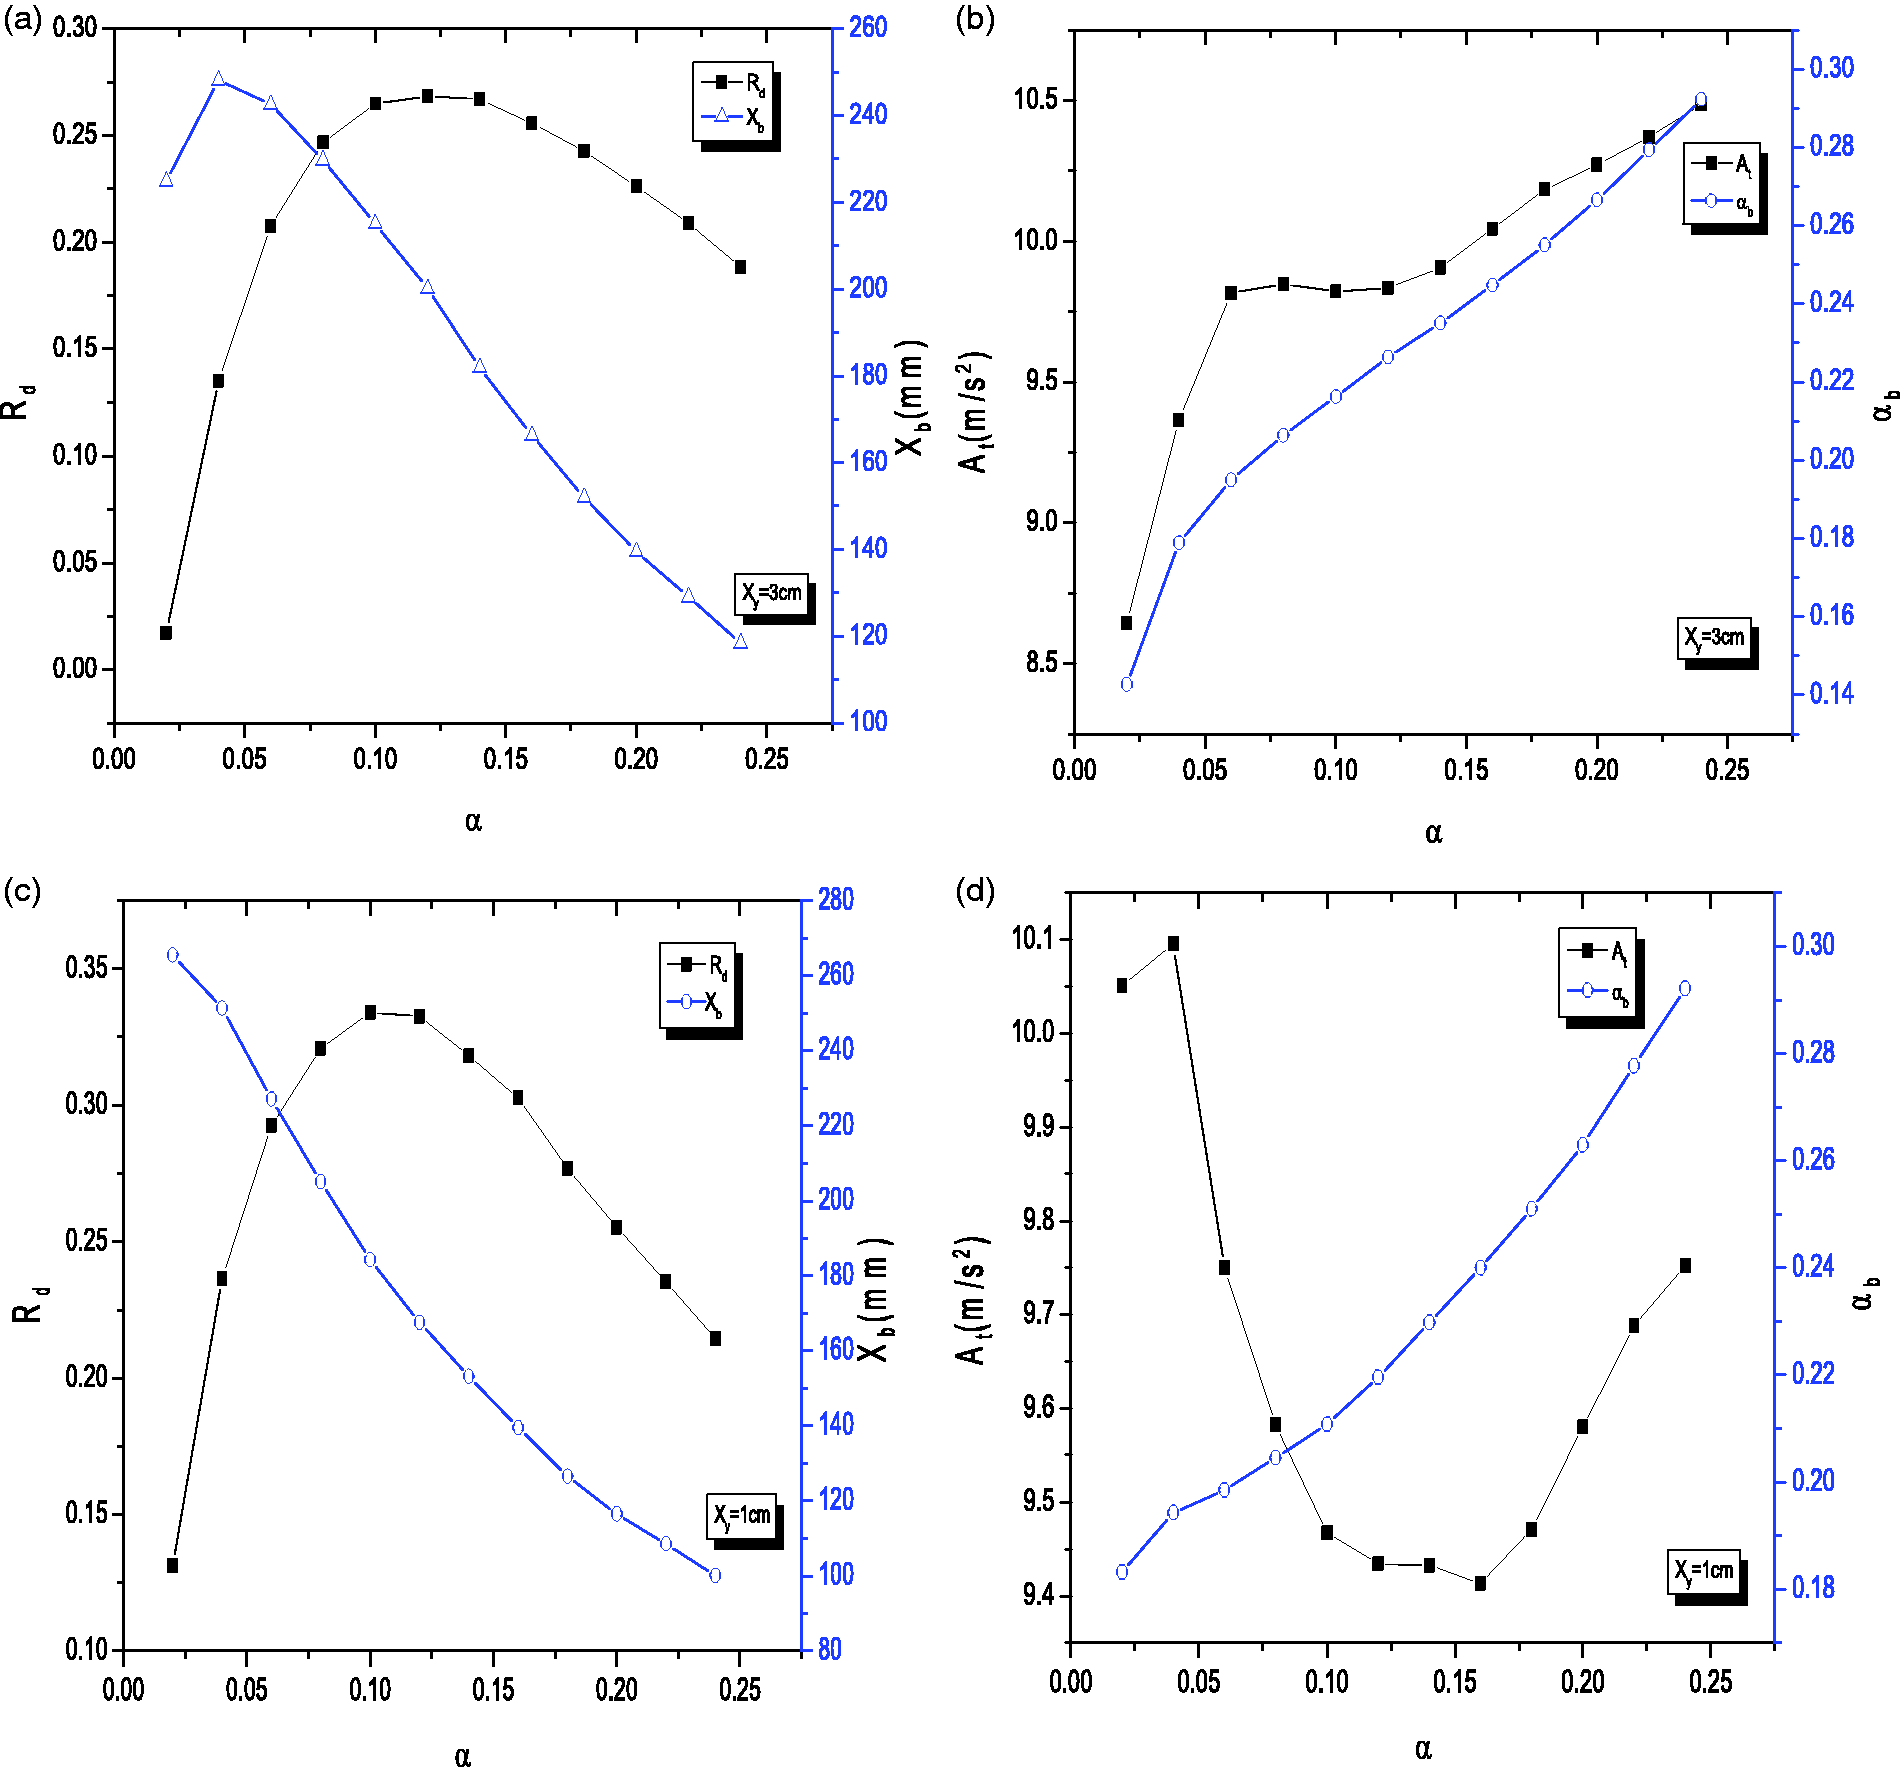
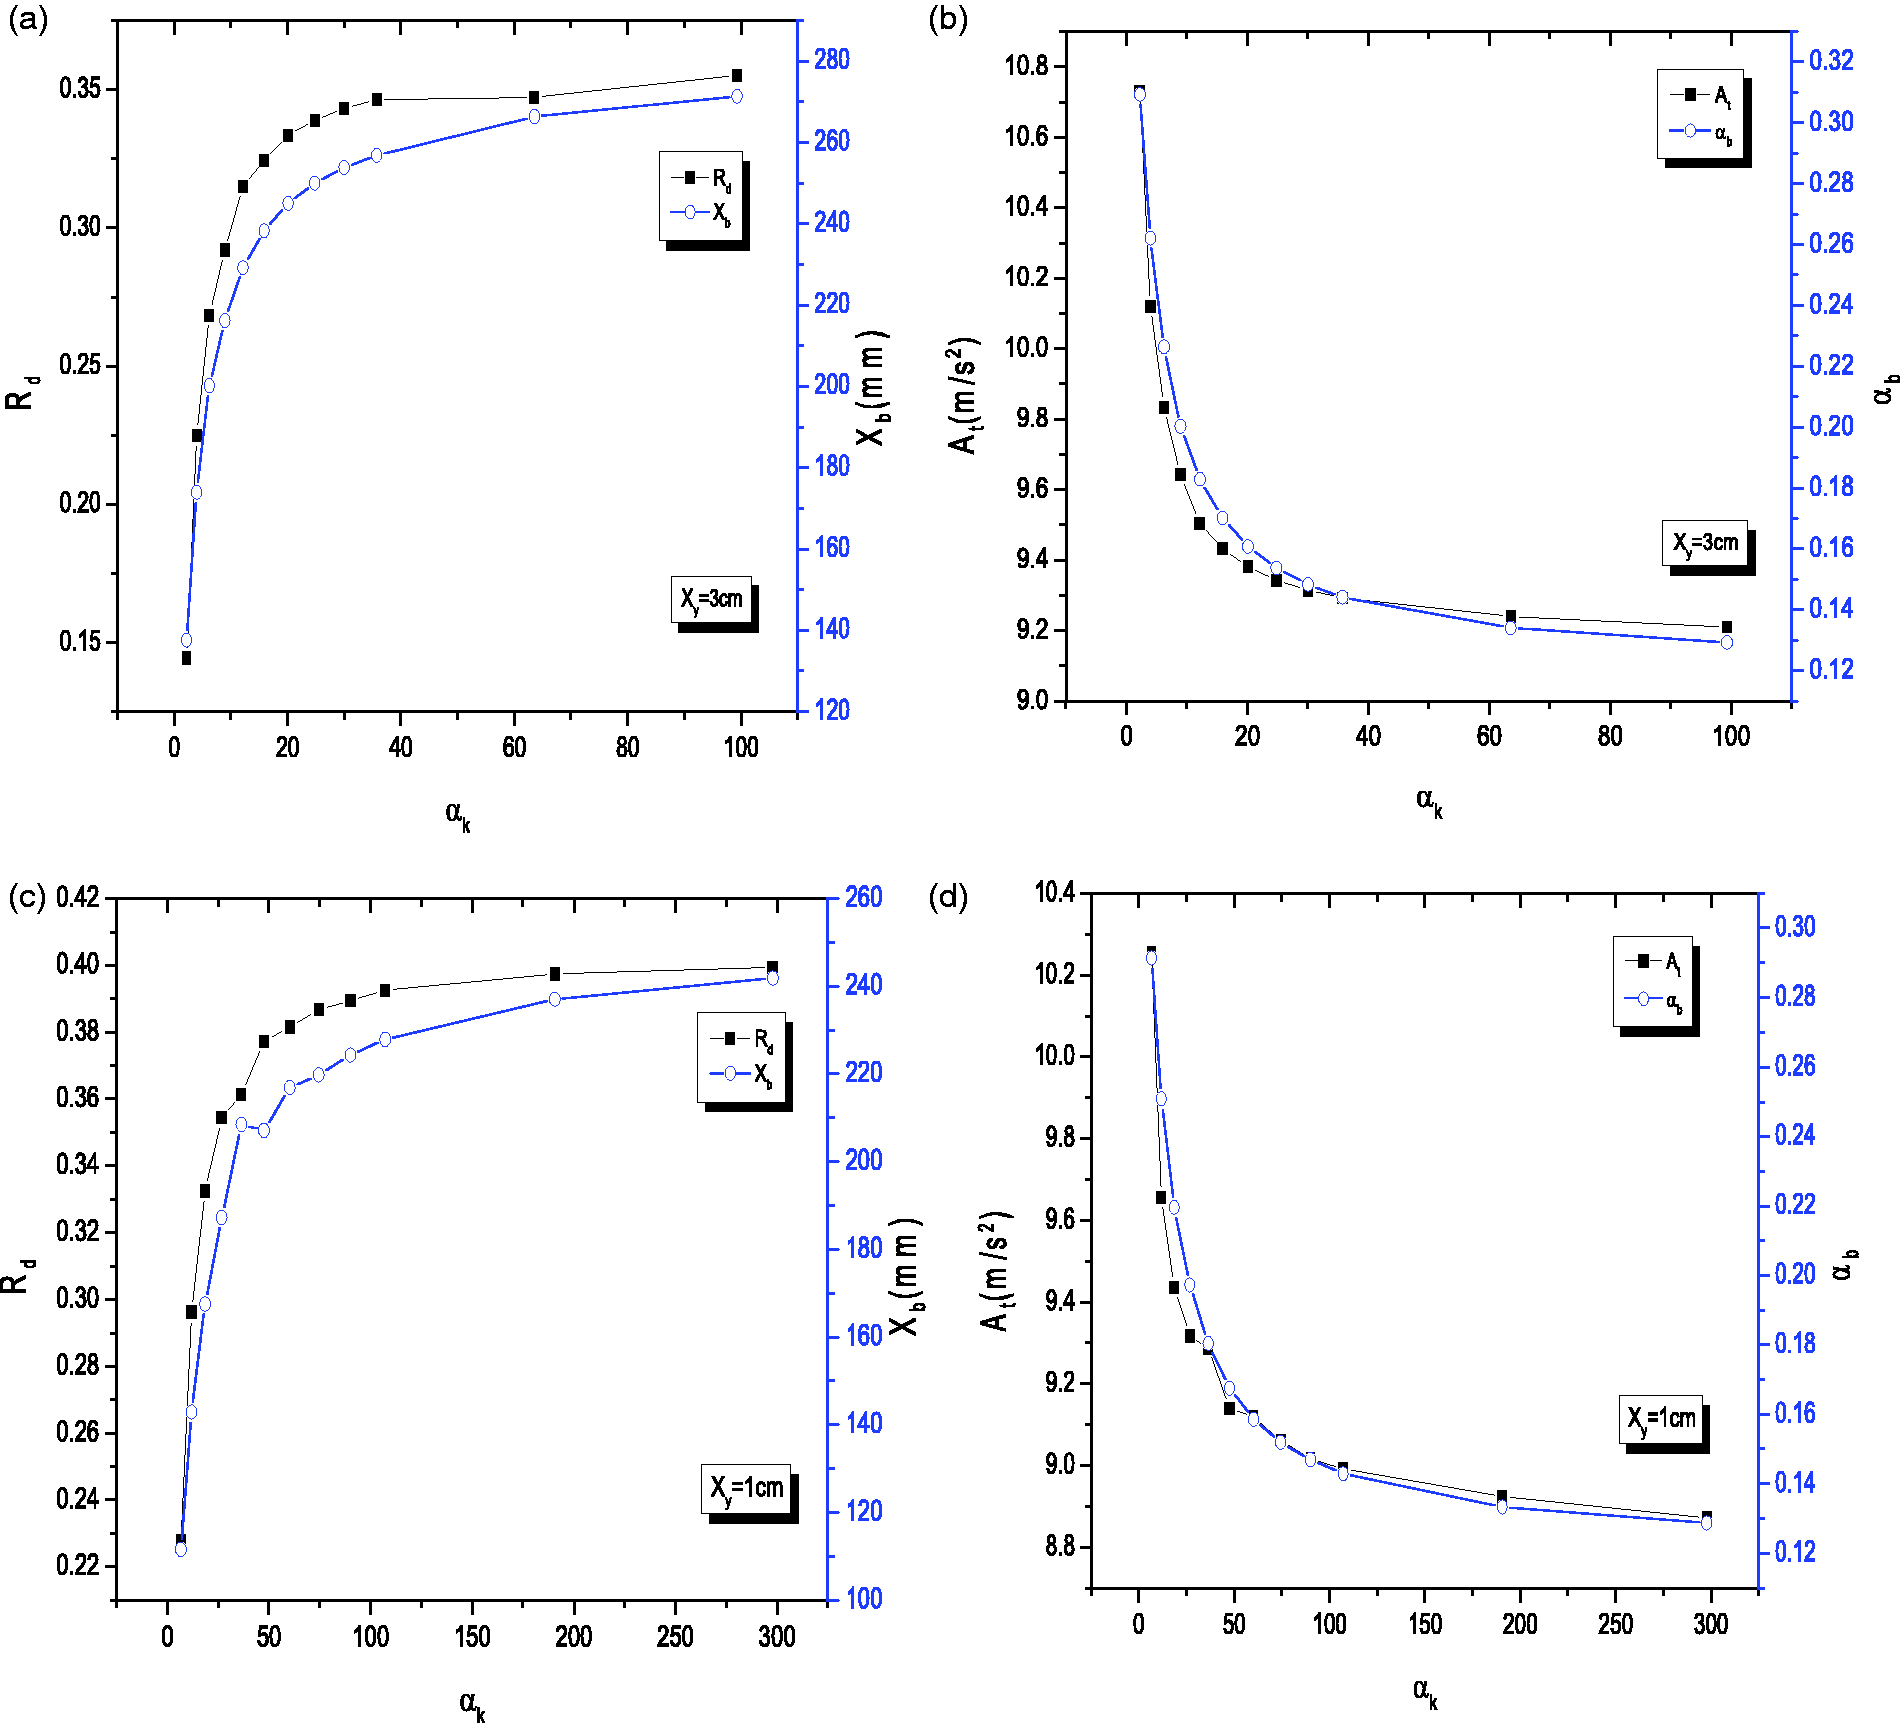
Variation of four seismic response indicators against the normalized yield shear coefficient (T2 = 2.5 s): (a) influence curve of α for Rd, Xb (Xy = 3 cm); (b) influence curve of α for αb, At (Xy = 3 cm); (c) influence curve of α for Rd, Xb (Xy = 1 cm); (d) influence curve of α for αb, At (Xy = 1 cm).
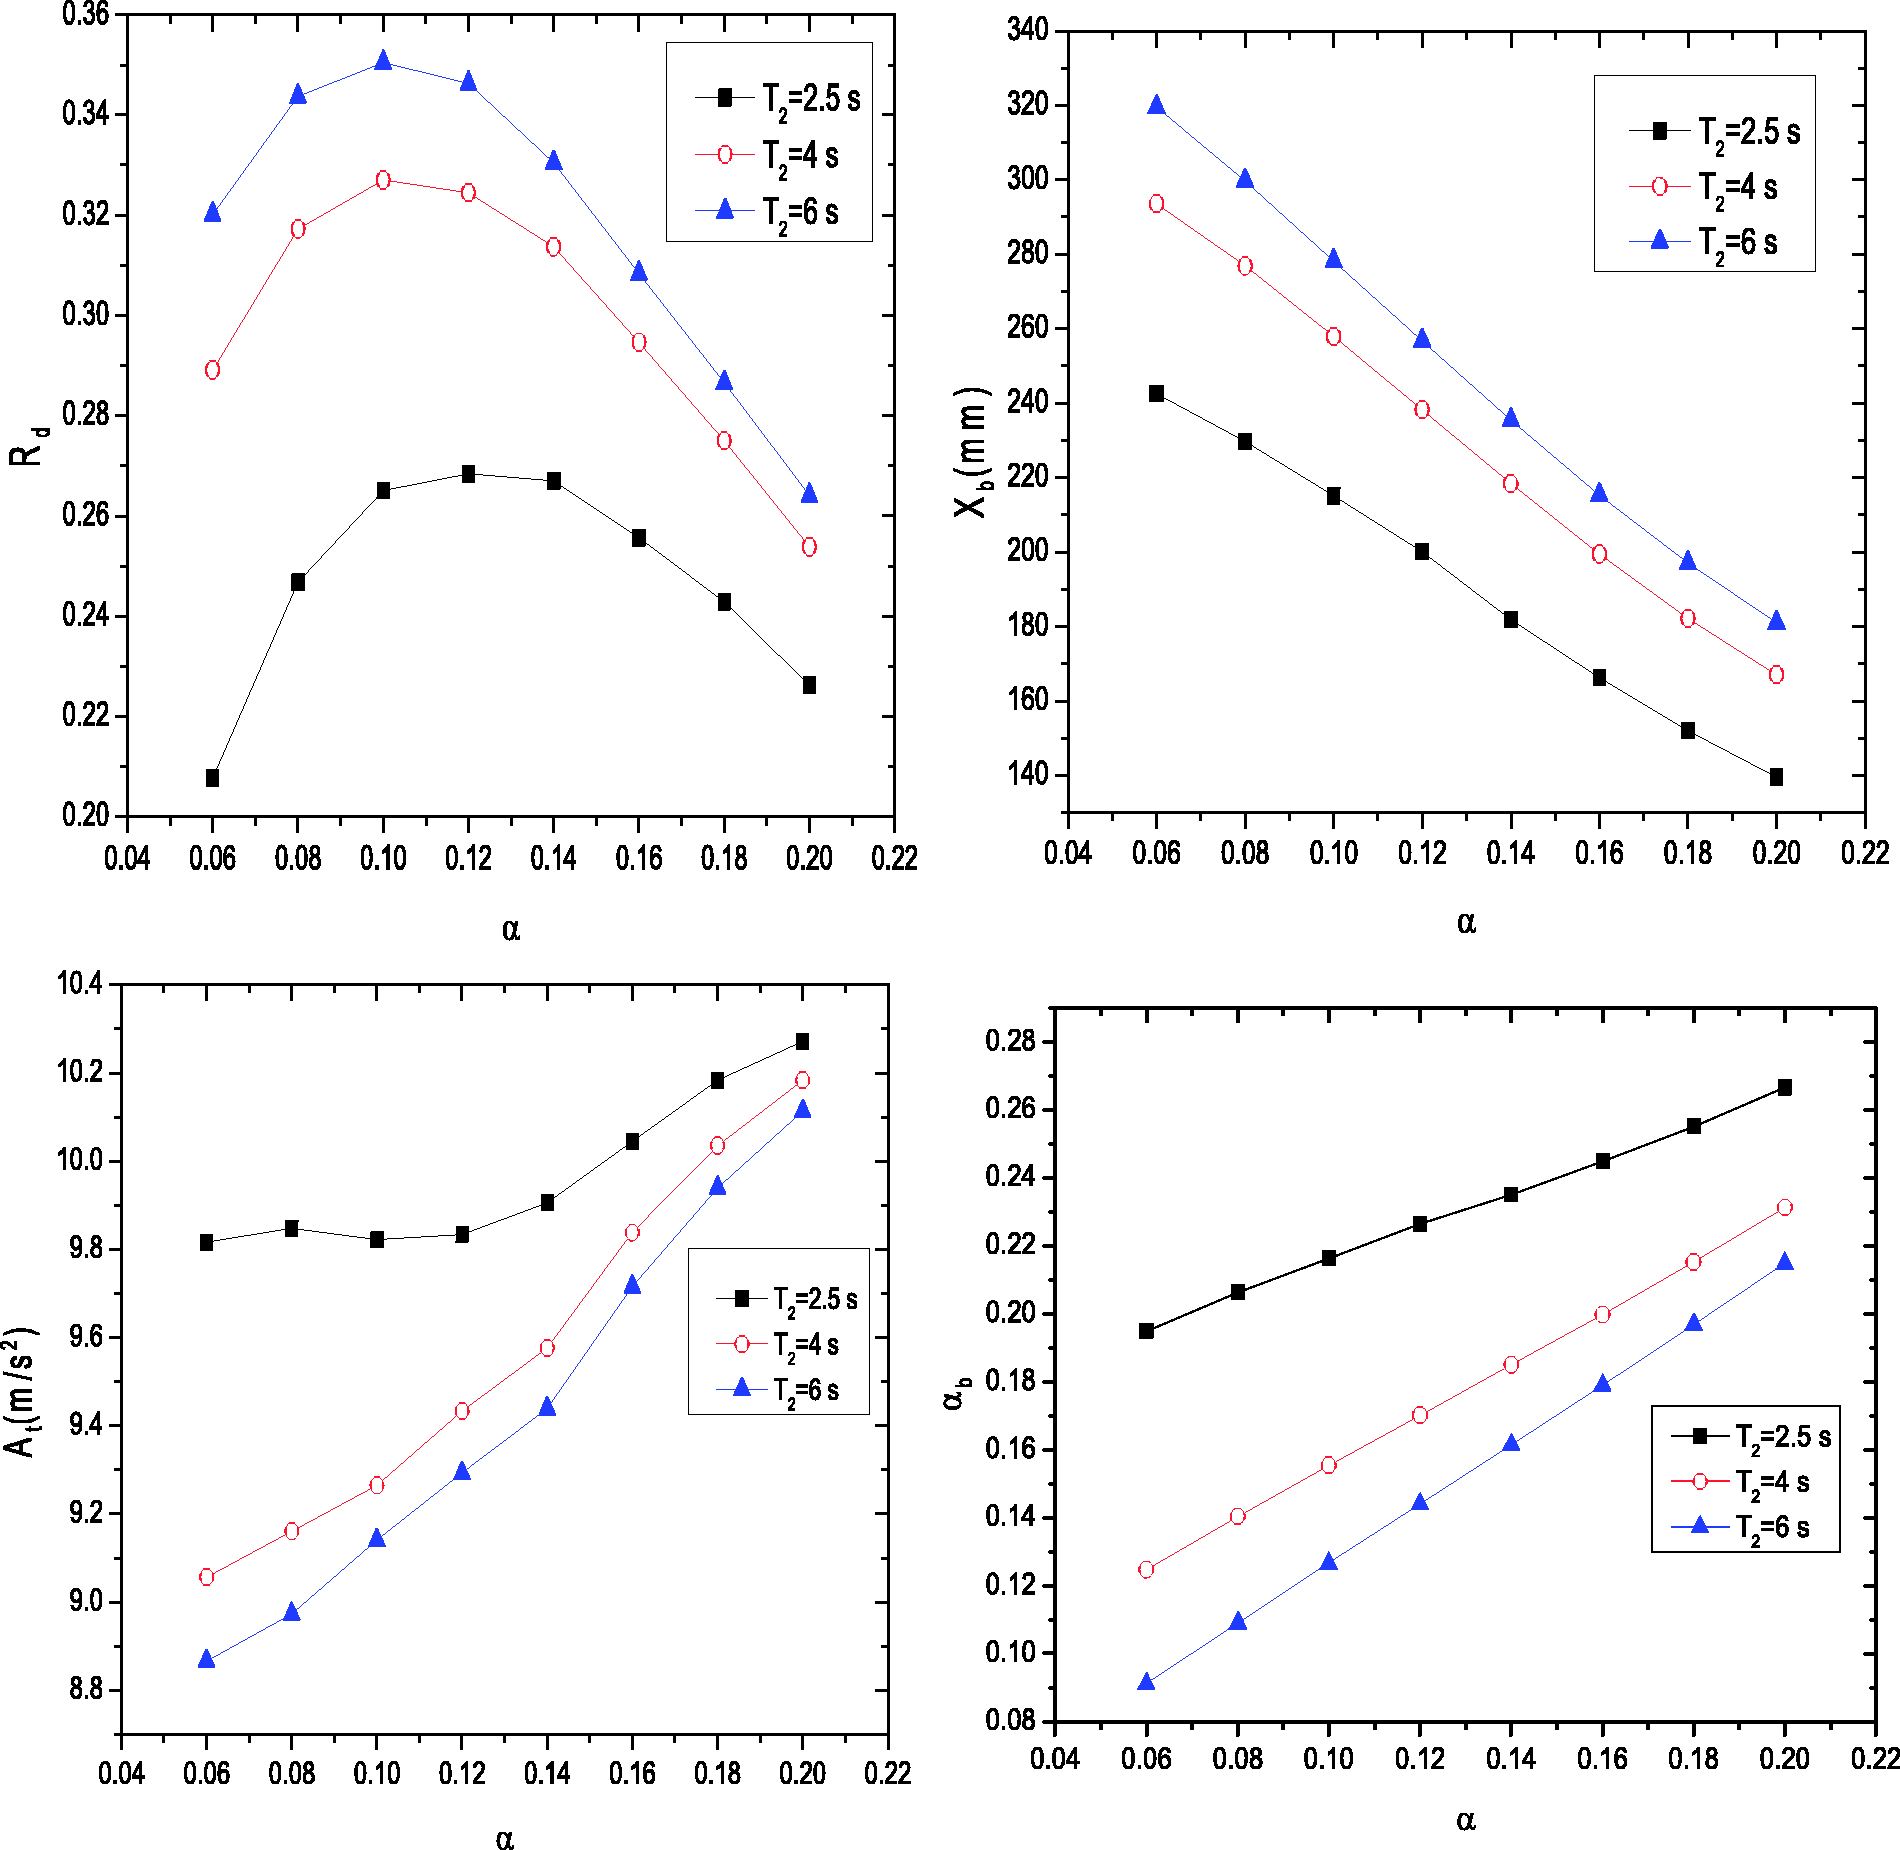
Variation of four seismic response indicators against different second isolation period (Xy = 3 cm).
It is observed from Figure 6(a) and (b) that for Xy=3 cm the average of energy dissipation scale factor, Rd first increases with the increase of yield shear coefficient and then attains the maximum value at α = 0.12. The energy dissipation scale factor is not much influenced by the variation of yield shear coefficient (i.e. in the range of 0.10–0.14). The energy dissipation scale factor decreases with the increase of yield shear coefficient up to a certain value (i.e. up to 0.14). On the other hand, the maximum displacement of isolation bearings, Xb decreases gradually with the increase of yield shear coefficient up to a certain value (i.e. up to 0.04). The peak top floor acceleration first increases with the increase of yield shear coefficient and is not much influenced by the variation of yield shear coefficient (i.e. in the range of 0.06–0.14), and then continue to increase. The maximum base shear coefficient, αb increases with the increase of yield shear coefficient. According to the parameter optimization model, the optimum yield shear coefficient is recommended to be in the range of 0.10–0.14 by considering four seismic response indicators. It is to be noted that the proposed value for the optimum yield shear coefficient of the LRB is consistent with the proposed result by Jangid. 20 Figure 6(c) and (d) shows that for Xy=1 cm energy dissipation capacity of LRB isolation system has increased. The variation of energy dissipation scale factor, the maximum bearing displacement and the maximum base shear coefficient is almost unchanged with the increase in the yield shear coefficient. The average of energy dissipation scale factor attains the maximum value at α = 0.10. The energy dissipation scale factor is not much influenced by the variation of yield shear coefficient (i.e. in the range of 0.10–0.12). The peak top floor acceleration first decreases with the increase of yield shear coefficient and is not much influenced by the variation of yield shear coefficient (i.e. in the range of 0.10–0.16), and then continue to increase. Compared with Xy=1 cm, the optimum yield shear coefficient for Xy=3 cm is higher. Therefore, the comparison of the seismic response of LRB for two values of the yield displacement indicates that the optimum yield shear coefficient of LRB with higher yield displacement is higher.
It is observed from Figure 7 that the variation of four seismic response indicators is almost unchanged with the increases of second isolation period. The energy dissipation capacity of the LRB isolation system increases and the optimum yield shear coefficient decreases with the increases of the second isolation period. In addition, the maximum displacement of isolation bearings corresponding to the optimum yield shear coefficient increases with the increase of the second isolation period. As the second isolation period increases, the corresponding peak top floor acceleration decreases and the maximum base shear coefficient decreases gradually. Therefore, the optimal yield shear coefficient of LRB isolation system is found to be in the range of 0.10–0.14 under near-fault ground motions. The optimal yield shear coefficient increases with the increase of the yield stiffness of LRB. The desired value of the yield shear coefficient of isolation bearing can be achieved by properly selecting the lead-core size of lead-rubber bearings.
Optimum yield stiffness
The yield stiffness of LRB isolation system can ensure that the second isolation period of base-isolated structure is in the range of 2–4 s. According to the number of isolation bearings, the variation range of the second isolation period may be larger. For the present study, the second isolation period, T 2 is taken to be in the range of 1.5–10 s for Xy=3 cm and 1 cm, respectively. Figure 8 shows the variation curve of four seismic response indicators of isolation system namely Rd, Xb, At, and αb against the normalized ratio of pre-yield stiffness to post-yield stiffness, αk under near-fault ground motions. The variation curve of four seismic response indicators against the different yield shear coefficient are shown in Figure 9. The value of response indicators in Figures 8 and 9 are the average of the calculation results of nine near-fault seismic records.
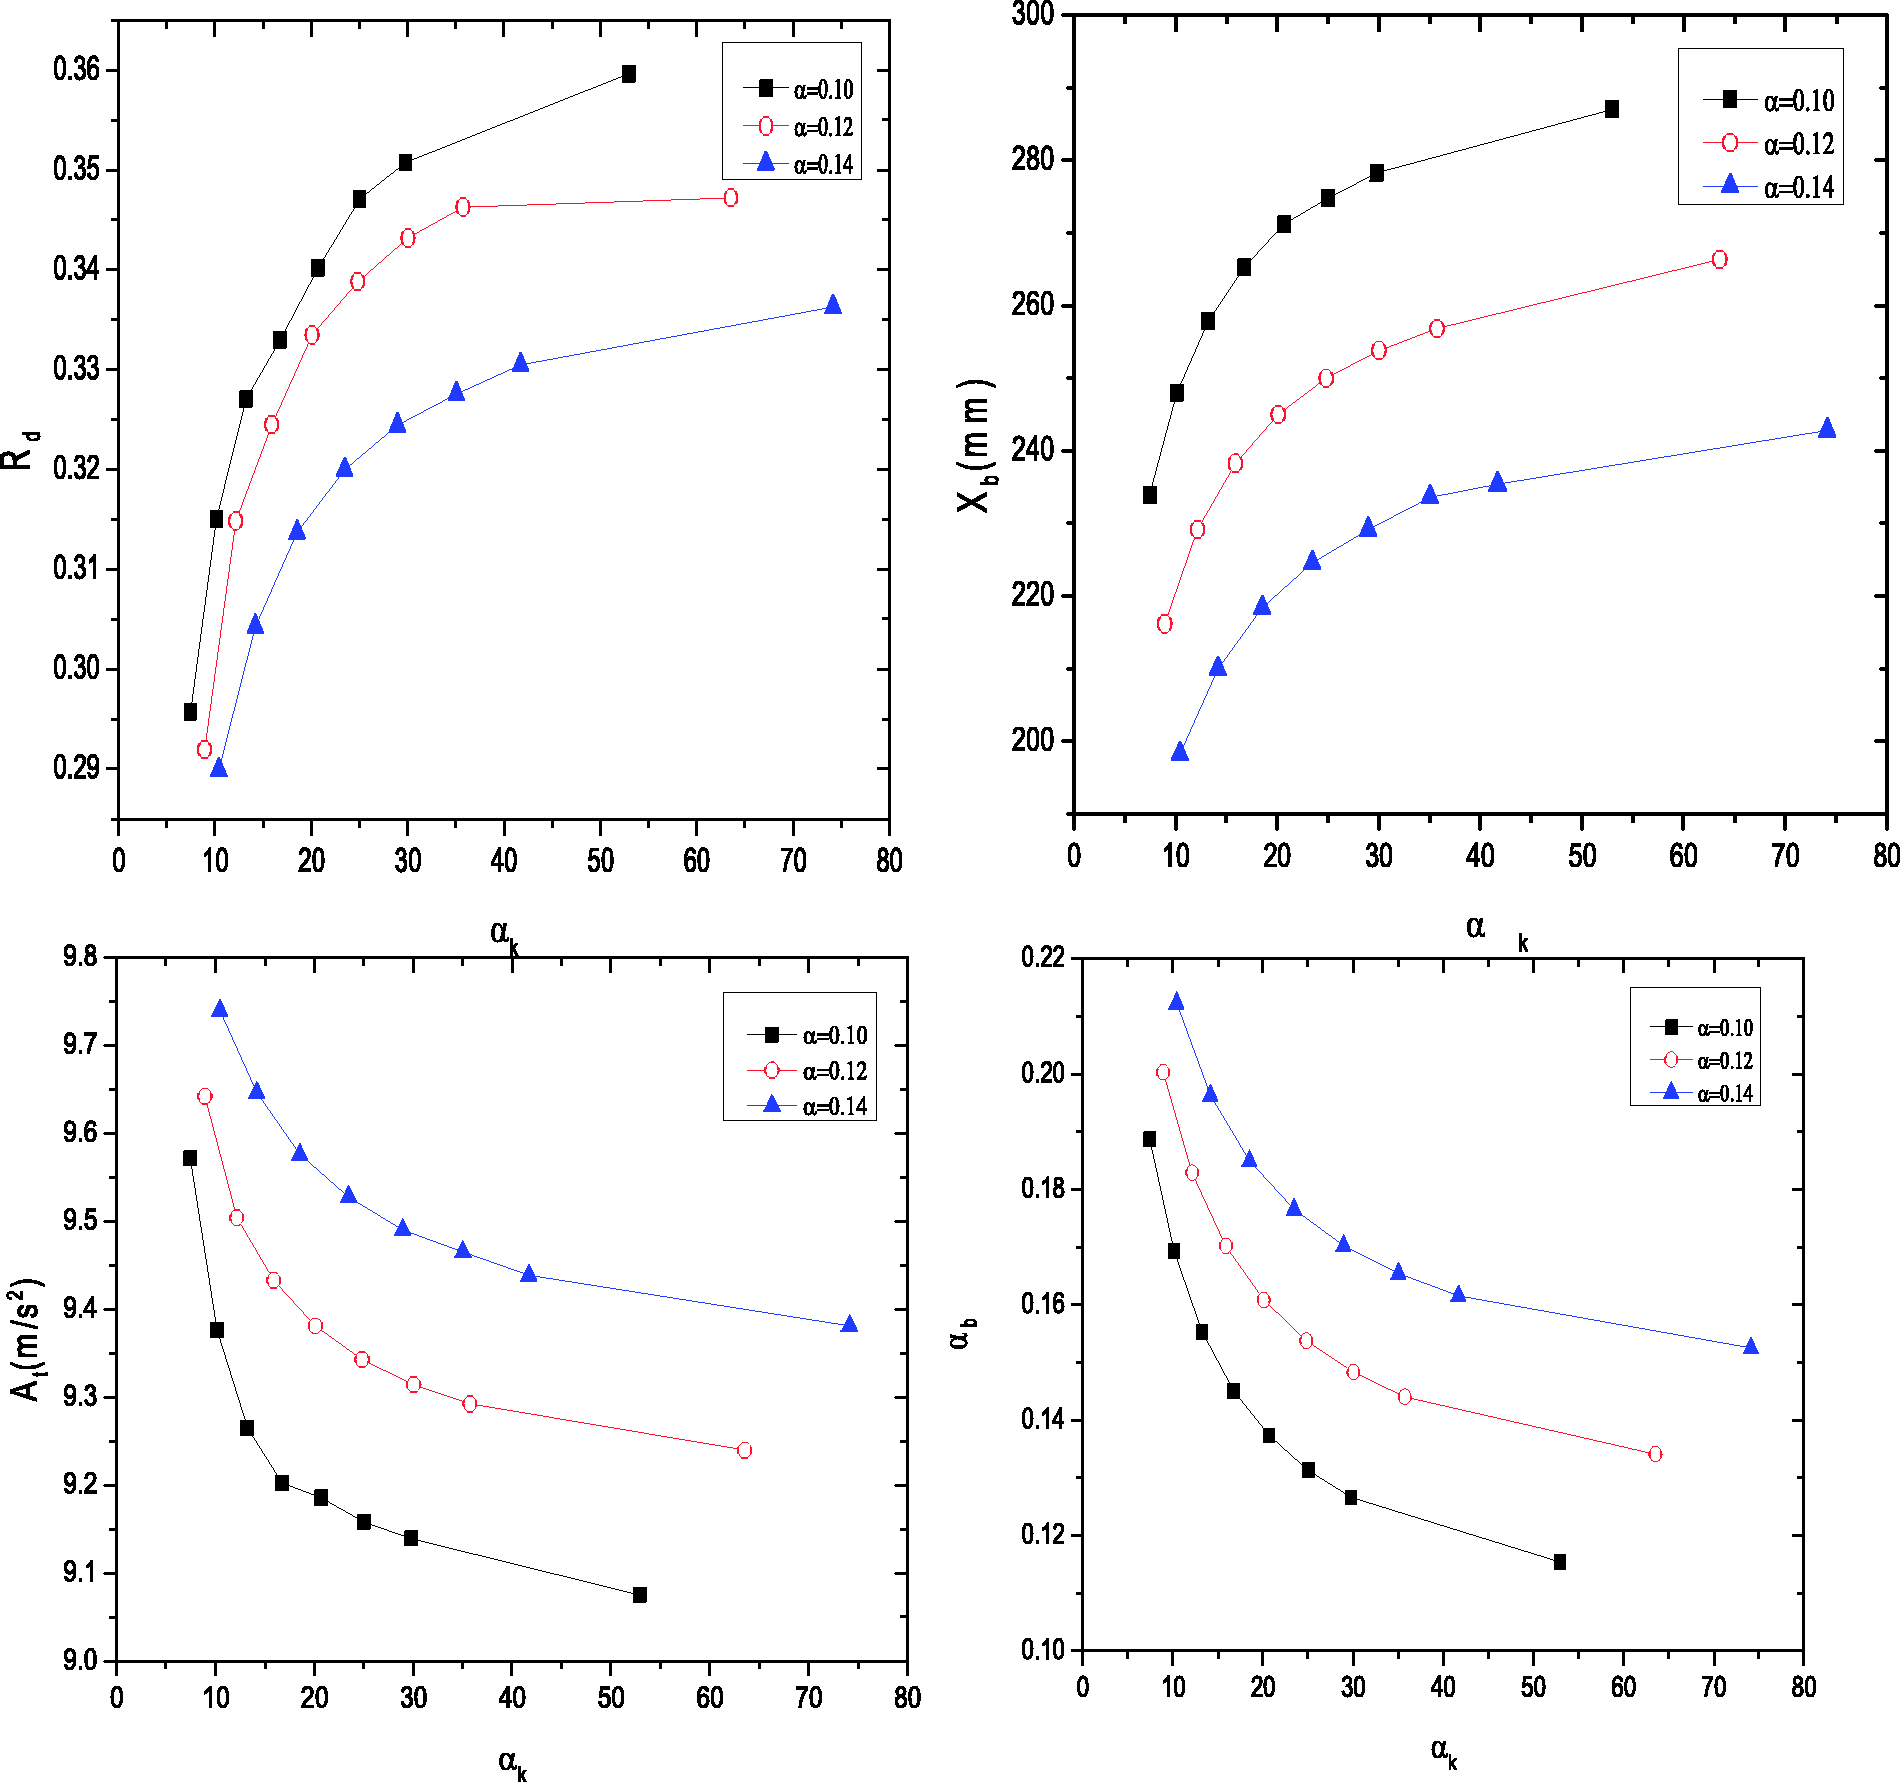
Variation of four seismic response indicators against the normalized ratio of pre-yield stiffness to post-yield stiffness (α = 0.12): (a) influence curve of αk for Rd, Xb (Xy = 3 cm); (b) influence curve of αk for αb, At (Xy = 3 cm); (c) influence curve of αk for Rd, Xb (Xy = 1 cm); (d) influence curve of αk for αb, At (Xy = 1 cm).
Variation of four seismic response indicators against different yield shear coefficient (Xy = 3 cm).
It is observed from Figure 8(a) and (b) that for Xy=3 cm as the ratio of pre-yield stiffness to post-yield stiffness, αk (second isolation period T 2 ) increase the energy dissipation scale factor increases and the maximum displacement of isolation bearings increases gradually. The energy dissipation scale factor and the peak bearing displacement are not much influenced by the variation of the ratio of pre-yield stiffness to post-yield stiffness up to 15.89 (i.e. T 2 up to 4 s). When the stiffness ratio, αk is greater than 35.75 (T 2 is greater than 6 s), both the energy dissipation scale factor and the maximum bearing displacement change substantially in a straight line. The peak top floor acceleration, At and the maximum base shear coefficient, αb decrease with the increase of the stiffness ratio. The peak top floor acceleration and the maximum base shear coefficient are not much influenced by the variation of the ratio of pre-yield stiffness to post-yield stiffness up to 15.89 (i.e. T 2 up to 4 s). As the stiffness ratio increases beyond 35.75, both the peak top floor acceleration and the maximum base shear coefficient vary approximately linearly. According to the optimization criteria, the optimum ratio of pre-yield stiffness to post-yield stiffness is recommended to be in the range of 16–35 (T 2 takes 4–6 s) by considering four seismic response indicators. Figure 8(c) and (d) shows that for Xy=1 cm, the energy dissipation capacity of LRB isolation system has increased. The variation of four seismic response indexes is almost unchanged with the increase of stiffness ratio. The optimum ratio of pre-yield stiffness to post-yield stiffness is recommended to be in the range of 48–107 (T 2 takes 4–6 s). Thus, the optimum stiffness ratio increases proportionally with the decrease of the yield displacement. Without considering the effect of the pre-yield stiffness, the optimum second isolation period is recommended to be in the range of 4–6 s.
It can be seen from Figure 9 that the variation of four seismic response indexes is almost unchanged with the increase of the yield shear coefficient. As the yield shear coefficient increases, the energy dissipation capacity of the LRB isolation system gradually decreases, and the optimum stiffness ratio increases slightly. In addition, the maximum displacement of isolation bearing corresponding to the optimal stiffness ratio decreases with the increase of the yield shear coefficient, and the corresponding peak top floor acceleration increases with the increase of the yield shear coefficient. The maximum base shear coefficient increases gradually with the increase of yield shear coefficient. Therefore, the optimum ratio of pre-yield stiffness to post-yield stiffness of LRB isolation system increases slightly with the increase of the yield shear coefficient under near-fault ground motions. The value of second isolation period is not sensitive to changes in the yield shear coefficient. The optimum second isolation period is recommended to be in the range of 4–6 s.
Conclusions
The present study investigates a theoretical model of a five-story frame structure supported by LRB isolation system. The main structure is modeled as a simple linear MDOF vibration system with lumped masses, excited by near-fault ground motions in the horizontal direction. This study focuses on analyzing numerical results of the seismic response of the main structure subjected to the excitations which have been selected from the available database of seismic records by the Pacific earthquake Engineering Research Center. The parameter analysis of LRB isolation system is presented in detail, including some recommendations on optimal design parameters of LRB isolation systems. From the results of the present study, the following conclusions can be drawn:
For the lower values of yield shear coefficient of LRB isolation system, the seismic isolation bearing has a significant displacement under the near-fault ground motions. As the yield shear coefficient increases, the displacement of isolation bearings is significantly reduced without much changing the peak top floor acceleration. The optimum yield shear coefficient of LRB isolation system is found to be in the range of 0.1–0.14 under near-fault ground motions. The optimum yield shear coefficient increases with the increase of the yield stiffness of LRB. The optimum yield shear coefficient of the LRB with higher yield displacement is larger than that of LRB with low yield displacement under near-fault ground motions. The optimum ratio of pre-yield stiffness to post-yield stiffness of LRB isolation system is found to be in the range of 16–35 under near-fault ground motions. However, the optimum stiffness ratio increases proportionally with the decrease in the yield displacement, and the optimum stiffness ratio increases slightly with the increase of yield shear coefficient. Excluding the effect of the pre-yield stiffness, the optimum second isolation period is recommended to be in the range of 4–6 s.
Footnotes
Declaration of conflicting interests
The author(s) declared no potential conflicts of interest with respect to the research, authorship, and/or publication of this article.
Funding
The author(s) received no financial support for the research, authorship, and/or publication of this article.