
Abstract
The small forward-curved blades known as Sirocco fan units are very common and widespread solution for air conditioning used in public transportation applications, as buses or trains. The users quietness and comfort have become a main concerns in the automotive industry. For such kind of turbomachinery flow , the patterns becomes always highly 3D and unsteady, compromising the referred comfort, and setting the focus on the working flow variables. A mathematically exact solution for that flow, which would provide any required information on pressure or forces, is out of scope at the current engineering design processes. Nevertheless, some flow features and mechanical data are needed to progress in the frame of a modern industrial environment, involving maintenance protocols with important temporal and economic constraints for different design procedures.
The correctness of a given maintenance protocol relies on its feasibility to handle a set of machine working parameters or variables, including a number of them as wide as possible. Doing so, a set of not-dangerous ranges for them can be established. Such ranges are often defined promoting a series of failures similar to real ones, when the machine is in its operative lifetime.
In this paper and in order to establish proper working ranges for maintenance purposes, a series of failures have been experimentally tested for a Sirocco fan unit. Initially, real data from industry have been required and a list of main failures was made, including (1) impeller or rotor unbalance, (2) impeller channel obstruction and (3) blocked inlet. The failures are studied using a purified orbit diagram (POD) technique and a symmetrized dot pattern (SDP) technique. All four working conditions are studied for at least three different flow rates and, therefore, a deeper insight into the fan working parameters and options are made feasible. In the frame of the maintenance protocol, a full set of ranges for the considered failures has been obtained.
Therefore, the present paper shows a novel possibility to enhance existing maintenance protocol using two advanced frequency-based techniques.
Keywords
Introduction
Squirrel cage or Sirocco fans are centrifugal turbomachines with forward-curved blades. Very often, they are manufactured in small sizes and commonly used in public transportation. Other practical applications cover a wide range of industrial plant usages and are also widespread on transportation applications (buses, trains and so on). The name Sirocco fan was introduced in the classic textbook by Eck, 1 with a global overview of the existing geometries. More recently, Rouse 2 has commented on the global variables of these units, in the frame of a general fan classification. Their relative small dimensions and low cost make them competitive for residence heating systems, automotive units or other industrial applications. Their working parameters include a high specific speed and a large width-to-diameter ratio (b/D2), while the flow deceleration imposed by the blade passages precludes the separation inception, as explained by Kind. 3 Other important features, as the short chord and the large number of blades, were previously pointed out by Kind and Tobin 4 where a particular and detailed study of the geometry and flow features is given. Globally speaking, this kind of unit becomes an economic solution when dealing with a small unit for a relatively high flow rate delivery.
Due to the before mentioned interest and current applications, the number of classical studies on forward-curved centrifugal fans is quite exhaustive, going from the initial experimental search for secondary flow patterns in Cau et al. 5 to more advanced and complementary experimental and numerical works. 6 Other and more recent studies, for instance, Kim and Seo, 7 Engin 8 and Velarde-Suárez et al.,9,10 have proposed a series of geometrical modifications or rearrangements to improve some given design parameters as, for instance, the performance enhancement or the noise reduction, among others. Particularly, Engin 8 studied the flow in the tip region of centrifugal fans, using a numerical approach. In the same frame, and as a starting point for the work presented here, the study by Ballesteros-Tajadura et al. 11 has shown a numerical solution for the pressure fluctuations in the volute of a centrifugal fan unit.
The importance of a proper definition of a maintenance protocol for any kind of mechanical machine is deeply referred in the bibliography and several works are available, like the one by Jardine et al. 12 with a wide review on the topic. The particular features for rotating machines and different approaches are explained in Chen et al., 13 Lu et a. 14 and Cui and Craighead 15 Regarding the diagnosis of failures in fans, a number of very important frequencies are numbered in Chen et al. 13 as theoretical values. Failure characteristics or diagnostic indexes cannot be defined quantitatively, but other failure characteristics are clearly observed, as explained in Shi et al. 16 On the other hand, the Fast Fourier Transform (FFT) has been established as the standard method to obtain the corresponding spectra revealing its composition in the frequency domain, see examples in Lu et al. 14 and Shi et al. 16 Nevertheless, some other methods are available in the literature, see for instance Shibata et al. 17 and Bianchi et al., 18 and may also be considered as relevant tools.
Combining both methodologies (numerical and experimental), a study about the flow in a forward-curved centrifugal fan was proposed by Lin and Huang. 6 Focusing on the thermal performance of small units used for cooling purposes in personal computers, they provide a quite ambitious parametric study of the aerodynamic and sound properties of different geometries, both experimentally and numerically.
Considering the previously mentioned studies and many other important contributions which might be found in the bibliography, the interest on the topic is clear. The present work takes into account the researchers concern about the definition of a maintenance protocol using an experimental approach. Both POD and SDP techniques are used to complement previous efforts of the research group, according to different previous publications.19–22 It can be considered in the frame of previous works by the same working team, see for instance, Velarde-Suárez et al., 9 Ballesteros-Tajadura et al.11,19 González et al.20,21 and Delgado et al. 22 Regarding the SDP method, interesting recent contributions are those by Bianchi et al. 18 and Wu et al., 23 for slightly different machines and Shibata et al. 17 for a generic rotating machine.
This study describes a sort of predictive maintenance that allows to realize the fan operating diagnosis by means of detecting aerodynamic instability. There are several methods that analyze vibration or pressure signals by means of the amplitude variation in the time or in the frequency domain, although sometimes the signals of the incipient failure are not detected during the application of these methods and additional time delays would be required to identify them. Thus, these methods are difficult to apply for the continuous monitoring of the performance of the machines, see Bianchi et al. 18 and Meng et al., 24 also complemented for fans by the more recent works by Zhang et al. 25 or Xu et al.26,27 Nevertheless, the SDP technique shows visually the amplitude and frequency variations of the pressure or vibration signals. Furthermore, the SDP diagram could be obtained with the data acquired during only one rotor revolution, so it is fast enough for its application to a real-time monitoring.
Geometrical arrangements
The squirrel cage fan studied in this article is a double impeller unit, arranged as shown in Figure 1. The two impellers are placed at both sides of the electrical motor and supported by the two sides of the shaft in cantilever. The shaft produces also the rotation of both impellers in a forward direction with respect to the blade curvature. Covering the whole unit, there is a volute or external casing, providing two rectangular outlet sections. In such arrangement, each impeller is not producing a symmetric flow due to the presence of an obstructed inlet at the motor side of each impeller. In other words, there is a free inlet, at each impeller side opposite to the placement of the motor, but also an obstructed inlet, next to the motor side.
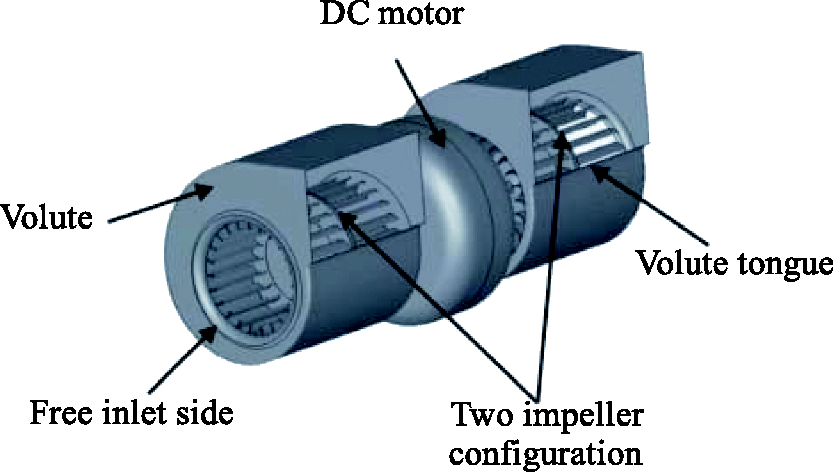
Simplified schematic of the tested fan.
Additionally, each impeller is built with two staggered parts, which are linked together by a central plate, as can be observed in Figures 1 and 2. The staggering of these two parts means that, for each impeller, they are mounted producing a shift of the 23 blades, so that the mechanical resonances are minimized (see Figure 2). Figure 3 shows the piece connecting the fan outlet with the test benchmark. The main working parameters can be found in previous works, see Ballesteros-Tajadura et al. 20 or González et al. 21
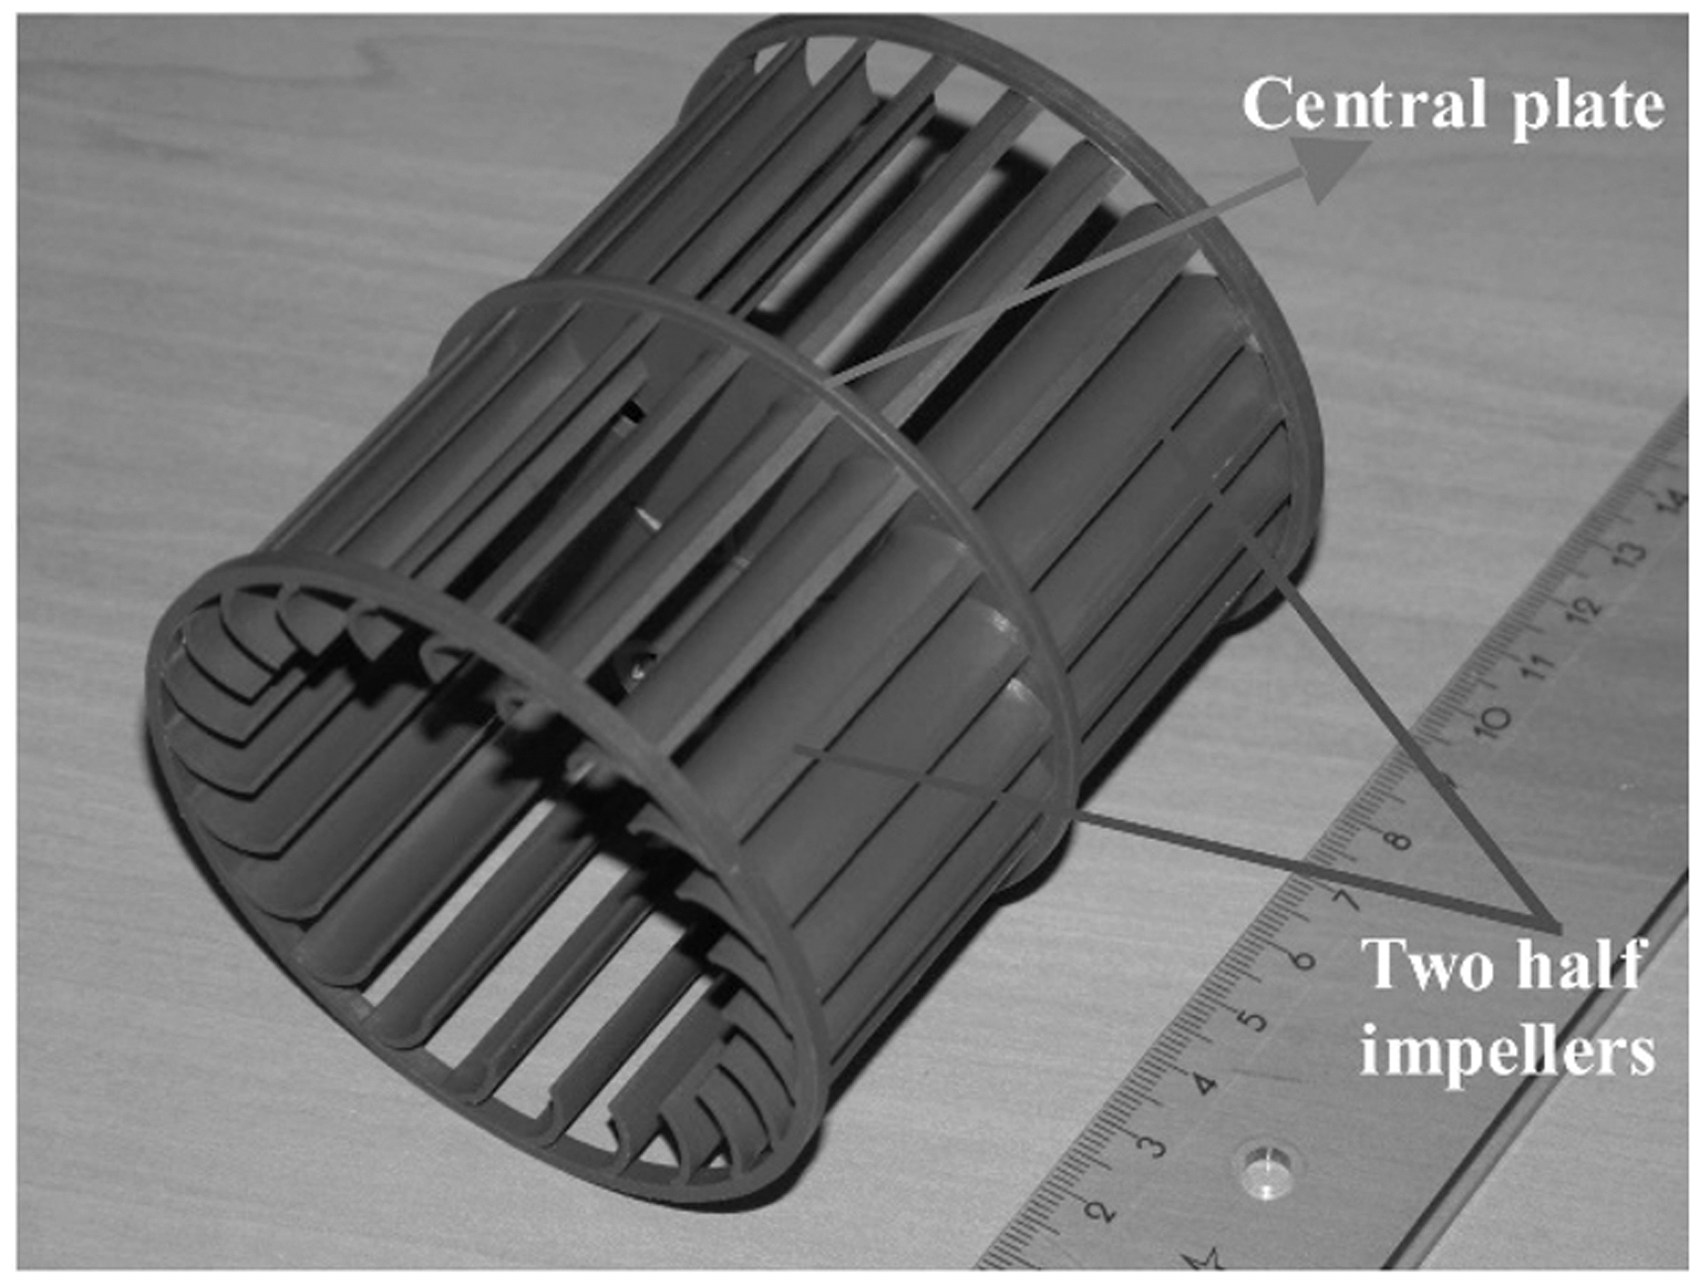
Each of the two impellers.
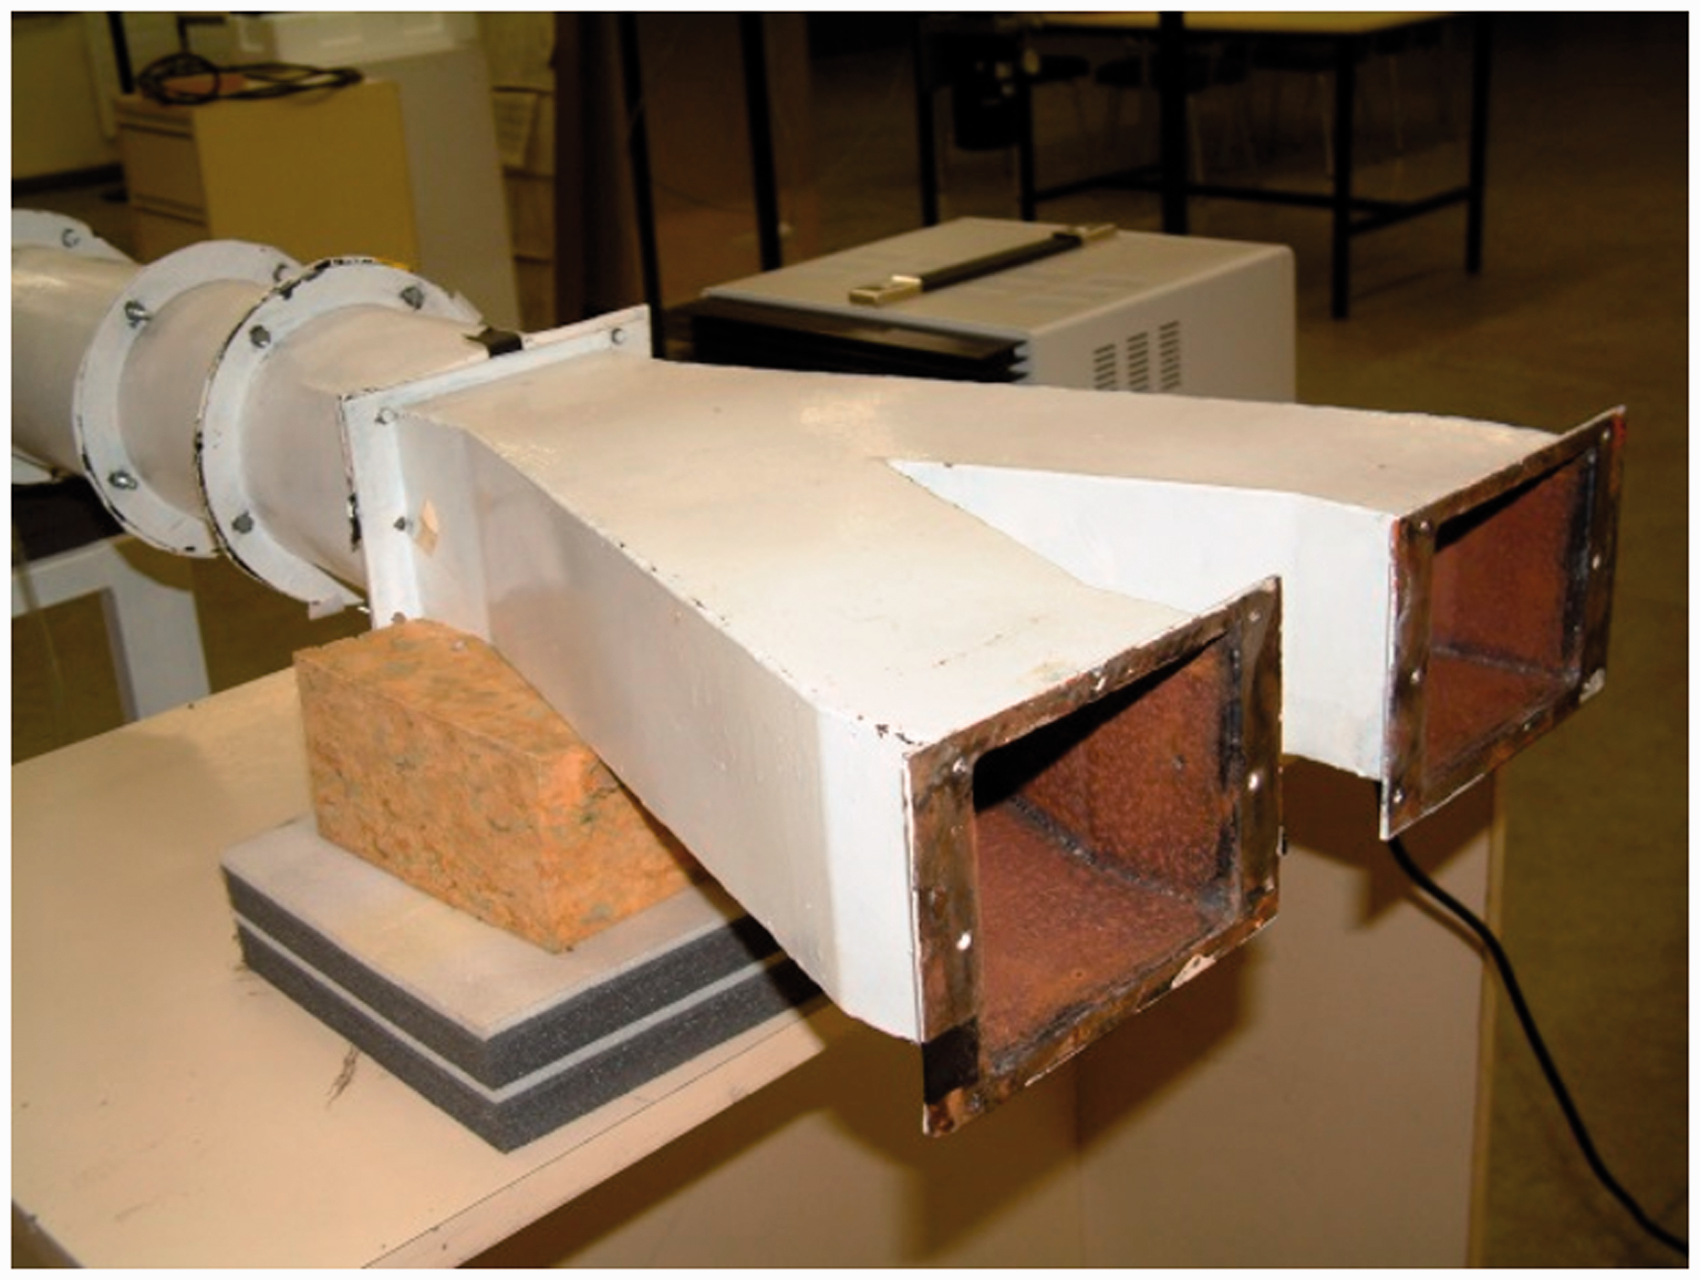
Test bench, ready for the fan.
Experimental set-up and measurements
To consider a given fault diagnosis protocol, different measurements must be taken for different operation conditions producing, in such way, different standard faults to the fan under study. The obtained measurements will provide a possible comparison of the observed changes in the fans performance with the baseline, or operation without any fault. In the present study, apart from the baseline operation, two different faults have been considered for the experimental study: one blade-to-blade channel obstruction and an unbalanced impeller operation. The facility, properly instrumented to carry out the designed measurements, was arranged as shown in Figure 4. The fan is placed at one end of the pipe and in the other end, a regulation cone is installed. Here, the studied variable is the vibrating state of the fan. For its definition, two B&K-4384 fast response piezoelectric accelerometers are available. They are connected to a charge amplifier, B&K-2635, especially suitable for acceleration measurements. The sensitivity of the sensors is 10 pC/g. The cut frequency for the accelerometers is 10 kHz, although the maximum valid frequency was found to be 3 kHz due to the particular arrangement for the tests. The measurements chain is completed with the acquisition unit Harmonie, connected to the PC. The whole set-up is schematically represented in Figure 4. Tests repeatability was carried out for several configurations and different flow rates, showing maximum variations of the characteristic peaks below 3%. To account for the fan working point, three different flow rates were studied: nominal flow rate and two off-design working points (one at 0.7 and other at 1.3, respectively, and relative to the nominal one).
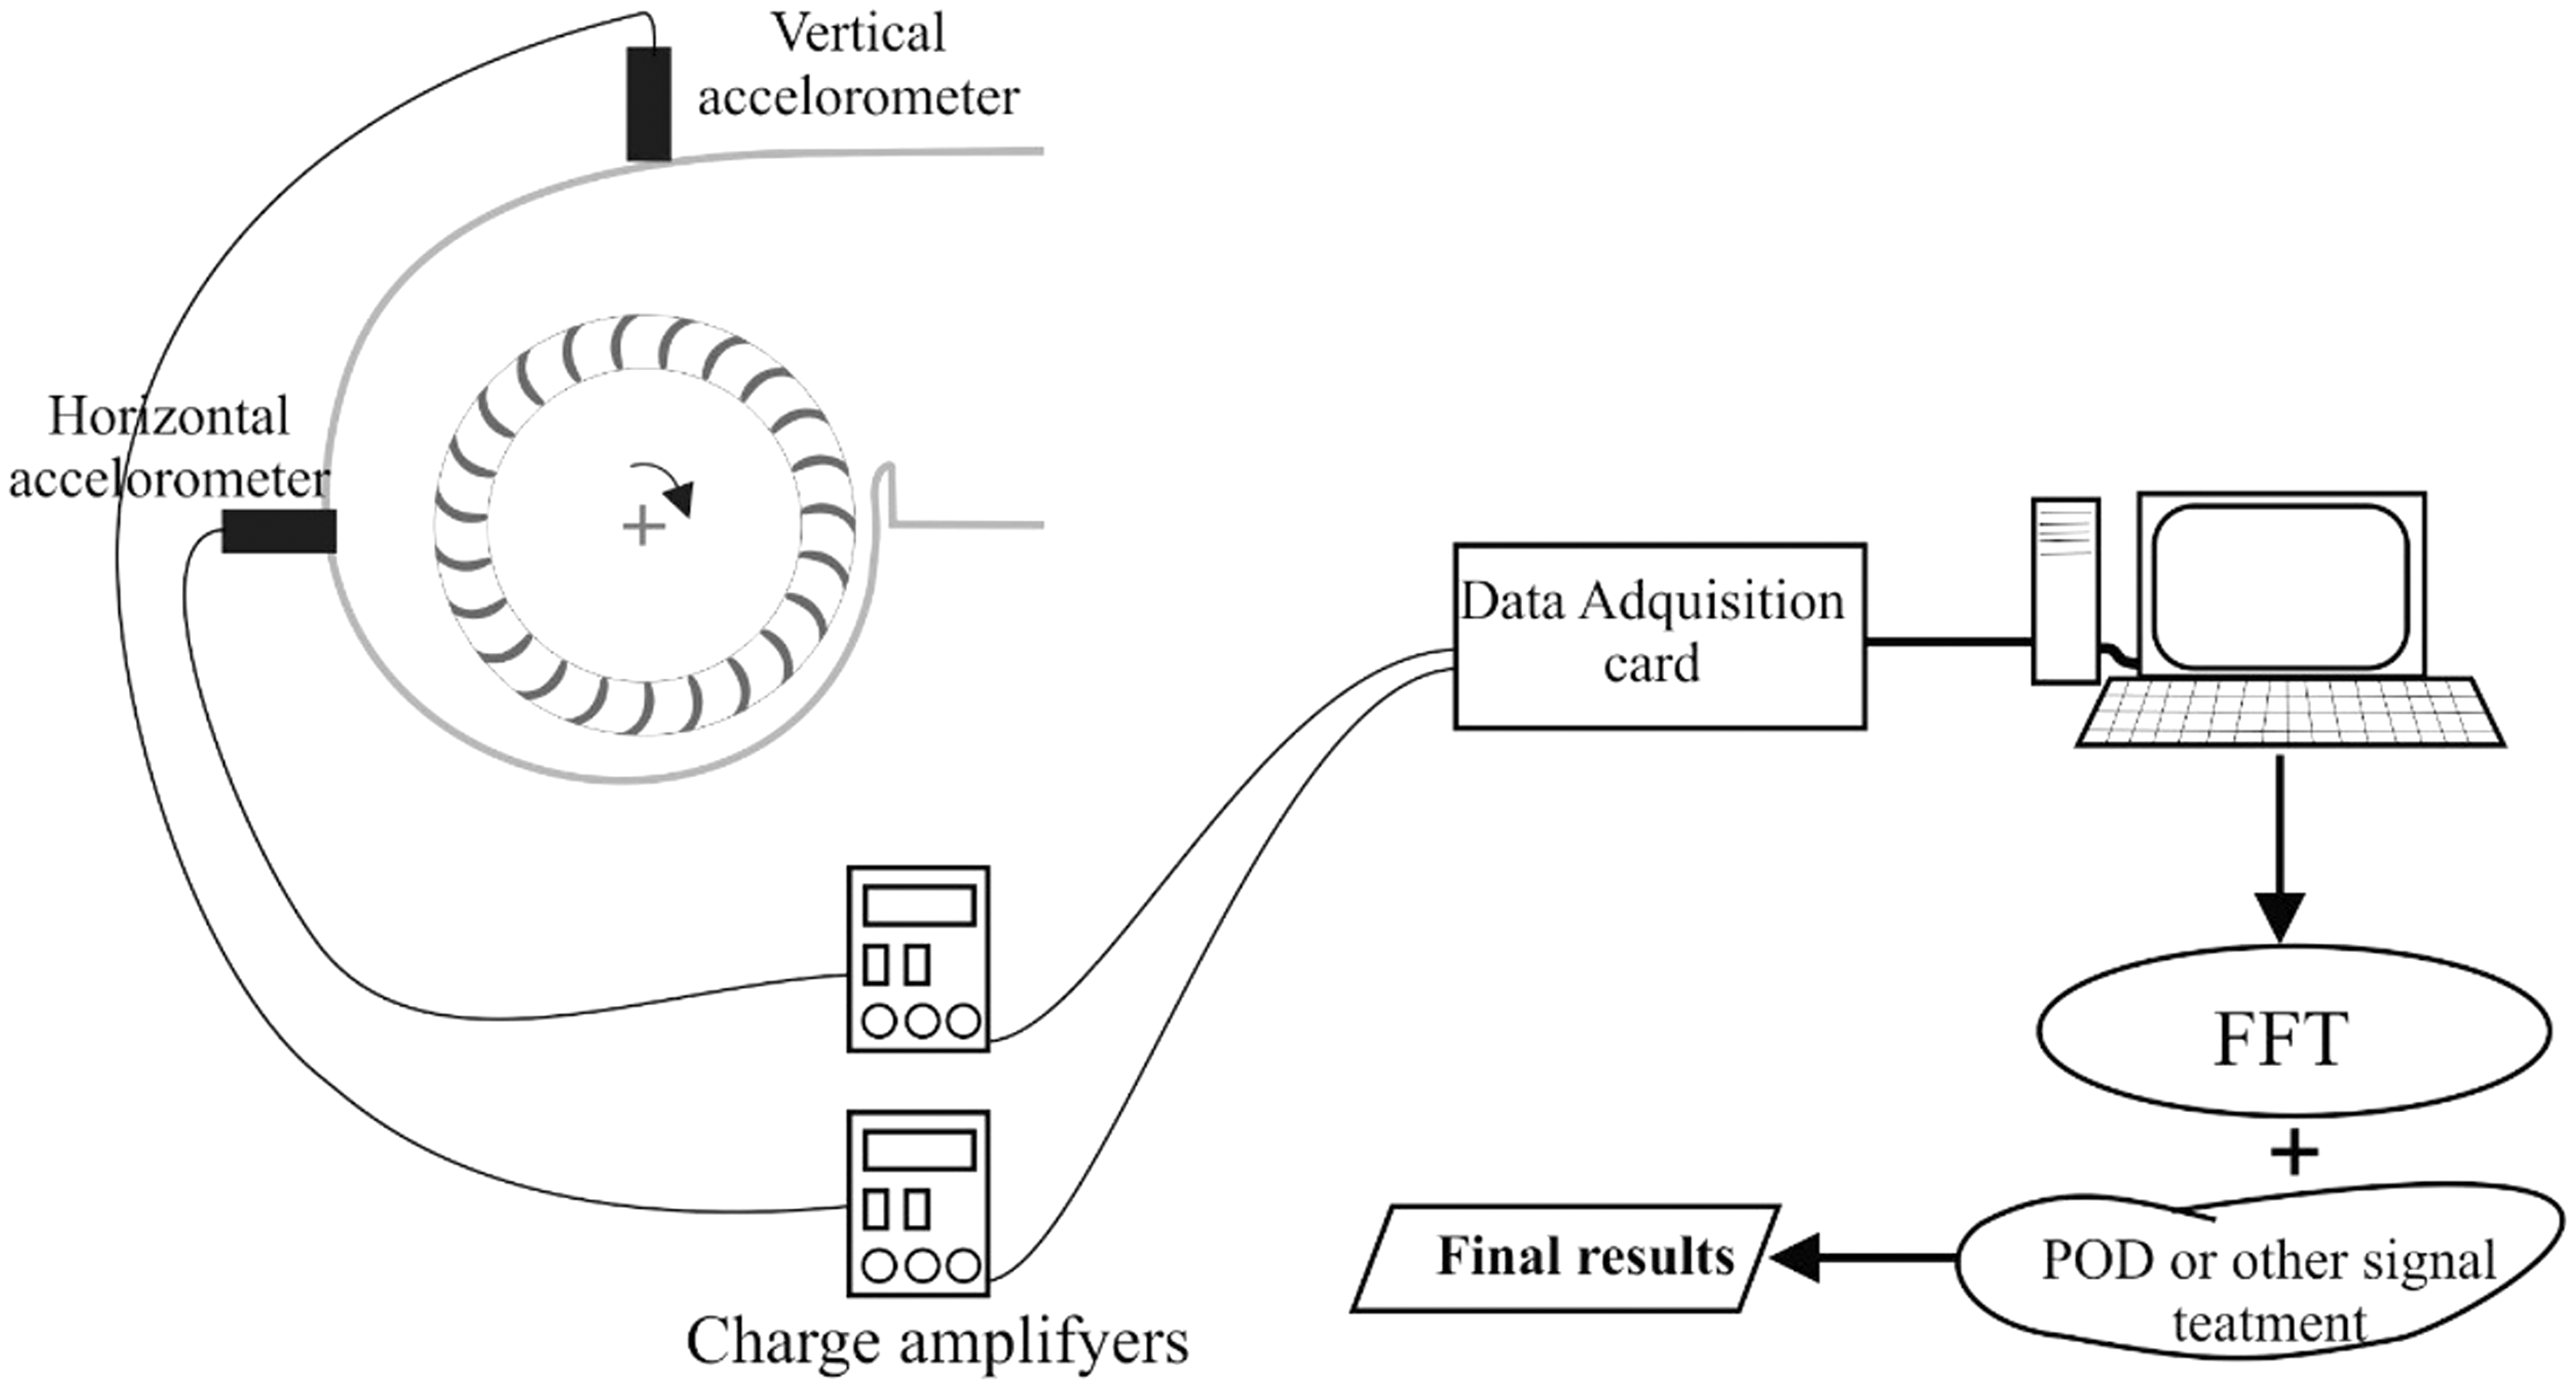
Tested fan and measurements chain.
An example of the recorded data is shown in Figure 5. The unsteady acceleration is recorded in a time basis for a series of impeller rotations, in order to get enough resolution. After application of the FFT procedure, a frequency domain signal is obtained, typically as shown in Figure 6. It corresponds to a low flow rate and for the baseline operation. As can be read in Chen et al., 13 the expected peaks and their meaning are always quite clear for rotating machinery. From most relevant peaks, a set of failure conditions might be analyzed. Nevertheless, the focus of the present paper is to find out the most relevant frequencies in order to achieve or define a good diagnosis for the studied failures. With this purpose in mind, a full study of the relevant peaks is mandatory and the result will be analyzed in detail in what follows.
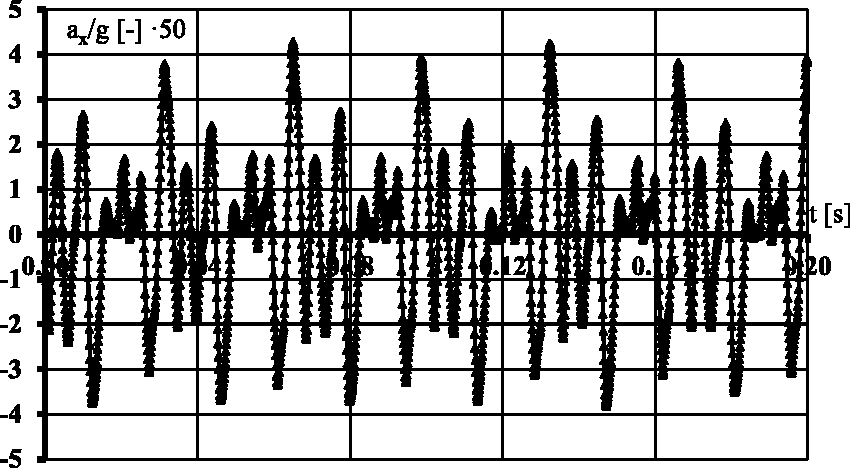
Example of a recorded time evolution.
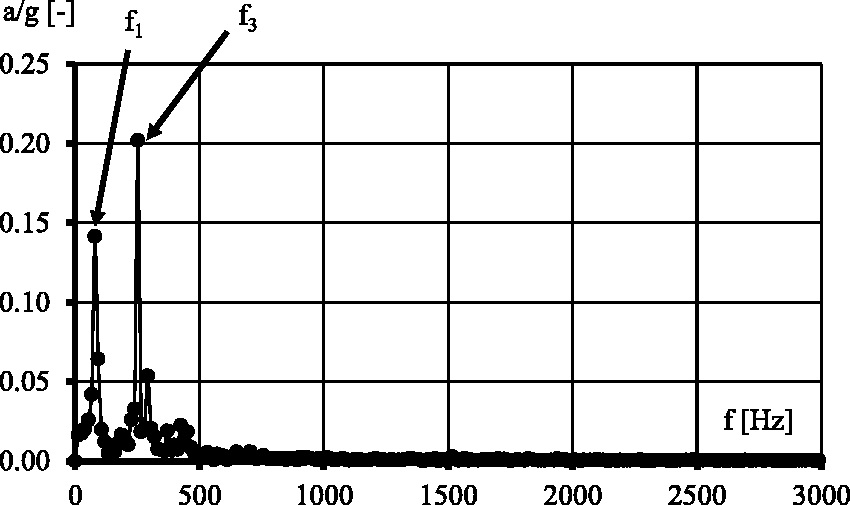
Signal after FFT analysis.
As a starting point, real data from industry have been required and a list of main failures was made, including (1) impeller or rotor unbalance, (2) impeller channel obstruction and (3) blocked inlet. The considered faults are the first two ones, as the blocked inlet changes the performance operation of the fan and a comparison with the baseline operation becomes unrealistic in terms of flow rate delivery.
As observed in Figure 6, the purified spectrum depends only in the values of a few, but stronger or more relevant frequencies. If there is a change in value or phase for any other frequency, the spectrum will remain constant. Firstly, the nominal flow rate is considered and then, two others were analyzed, a low and high one respectively, in order to cover the possible fan working range. The three operation conditions considered at the experimental campaign were: the baseline operation, obstructed channel and unbalanced rotor operation. The impeller arrangement for these failures is shown in Figure 7. A detail of the obstructed channel failure is shown in Figure 7 (left picture). For the unbalance of the rotor, small metal pieces of 1.6 g (including the fixing material) were fixed up to one of the fan blades, as can be observed in Figure 7 (right picture).
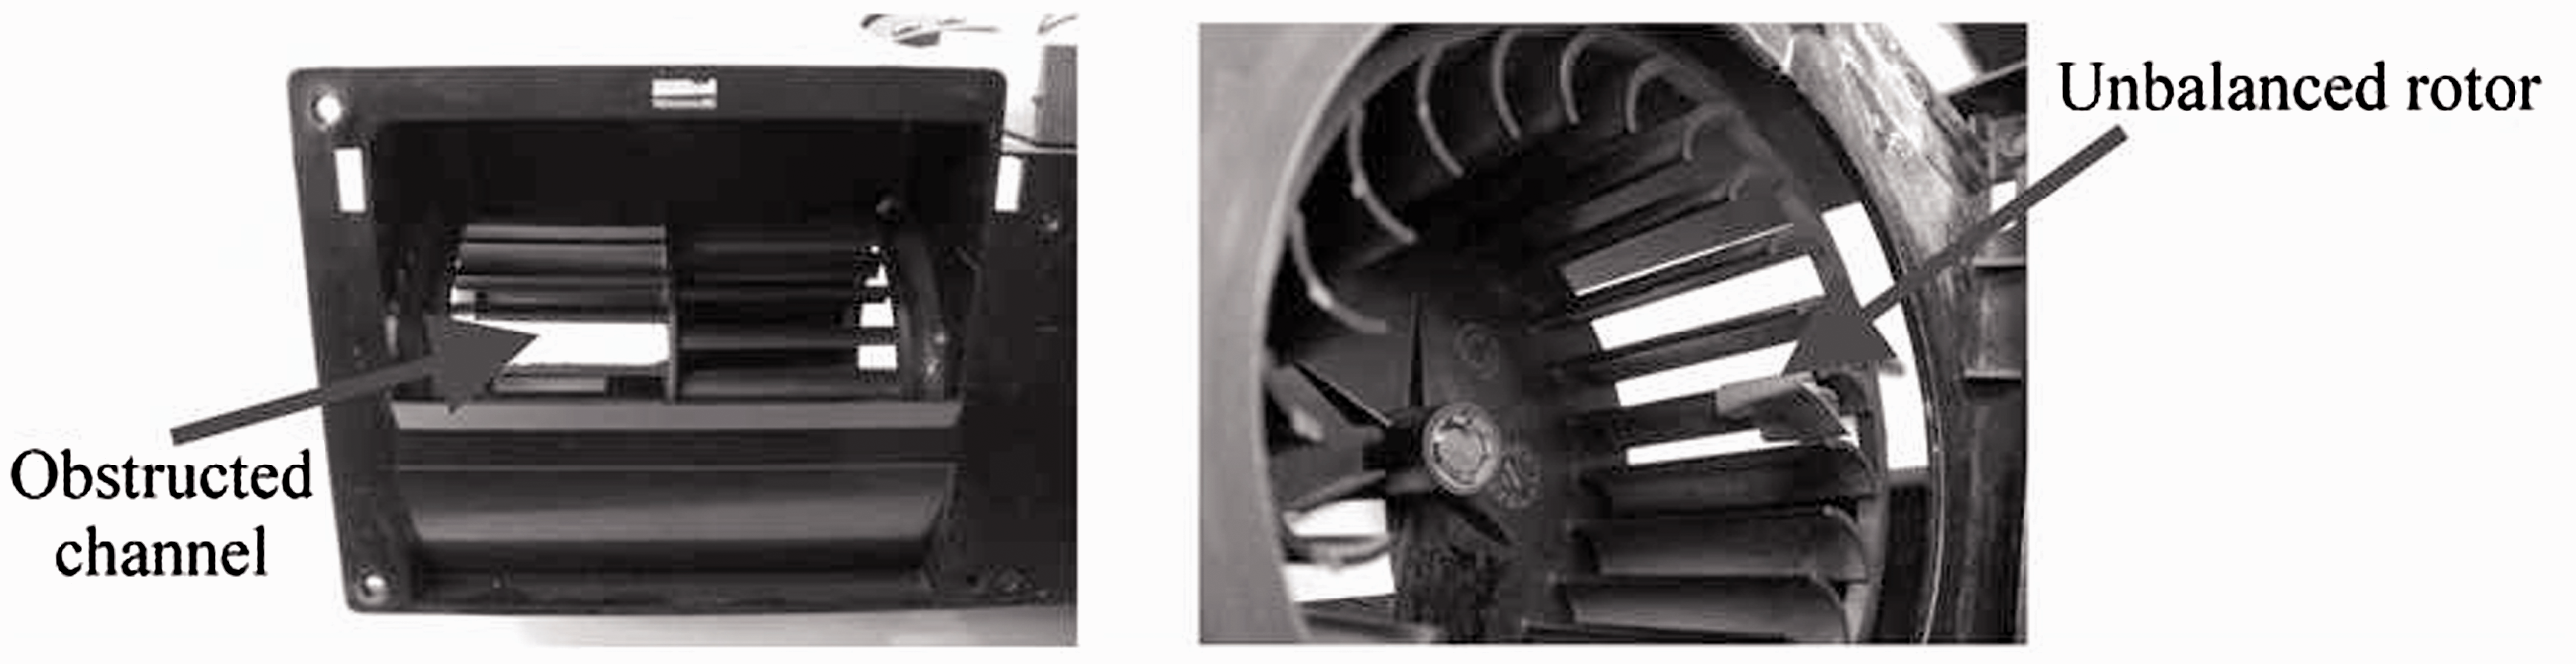
Impeller modifications for the two failure operations considered.
POD and SDP analysis
The purified orbit diagram (POD) technique consists of a spectral analysis technique that may be applied to different measurements when those evolve over time. In the particular application studied in the present paper, a POD technique is applied to the horizontal and vertical signals recorded from the two sensors used (see Figure 3 for the global setting of the sensors at the fan casing). An example of the time signal recorded is shown in Figure 5 for nominal flow rate and baseline operation. These kinds of signals were recorded for the three different operations and for three representative flow rates.
The implemented procedure, following the global frame depicted in Chen et al.,
13
works as follows:
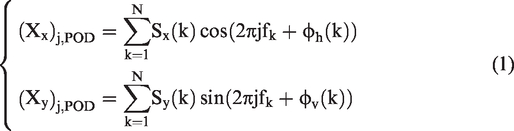
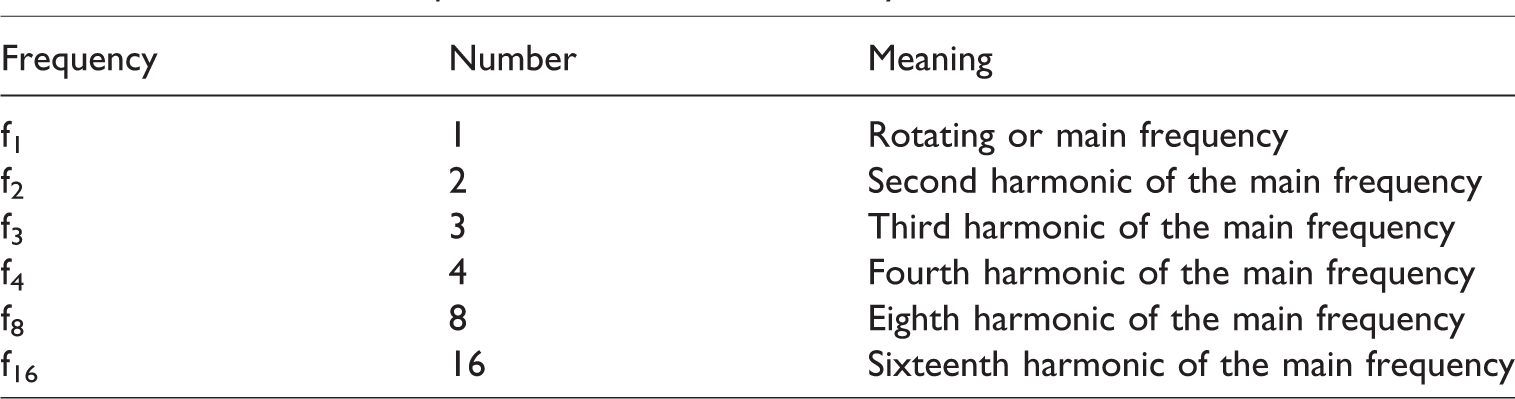
Measure of the time signal for the horizontal and vertical components of the acceleration. The acceleration is recorded as a function of time, following the experimental routine and apparatus previously described. Apply a standard FFT to get the frequency decomposition of the signals. The information is transformed into a set of data (fk, φ(k)), that is, into the frequency domain, and splitting the energy components for the different frequencies. Search for the predominant frequencies with their relative values and obtain the (so called) modified spectrum of the signal (S). This new value is a simplification of the real spectrum considering only N frequencies of interest or relatively more intense than the others. Therefore, S is a filtered spectrum at the stronger measured frequencies. In our particular application, the following are found to be the most relevant frequencies (not all apply to all operations but no others related to electrical or others were found to be important), as shown in Table 1. Apply the POD technique to get the purified spectrum. The following equations are considered to obtain the horizontal and vertical component of the orbit diagram, according to the equation
Alternatively, the SDP technique is an algorithm which provides a visual correlation that allows to recognize the peculiarities of any signal and to distinguish each other. In this study, this technique is used to link each vibration signal with its operating condition respectively, so that, visually, it allows to determine if a machine is operating properly and, if it were not the case, it is even possible to diagnose the failure it has.
By means of this technique, a radial and an angular component is assigned to each point of the periodic wave. The expressions used to do the polar transformation R(i) from polar wave to SDP are the following set of equations
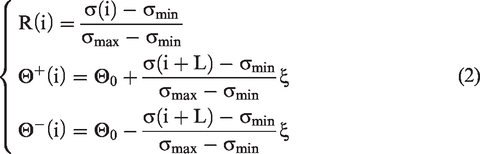
Typical time signal with relevant points for SDP technique.
Therefore, to make the transformation of the input waveform into a SDP plot, it is necessary to determine first the σmax and σmin values of the sample and then apply the previous expressions. Regarding the sine type periodical waves, it was noticed that the lobe curvature depends on the variety of frequencies of the sampling and the fuzziness on the sampling amplitude which increases the thickness of the SDP fingerprint.
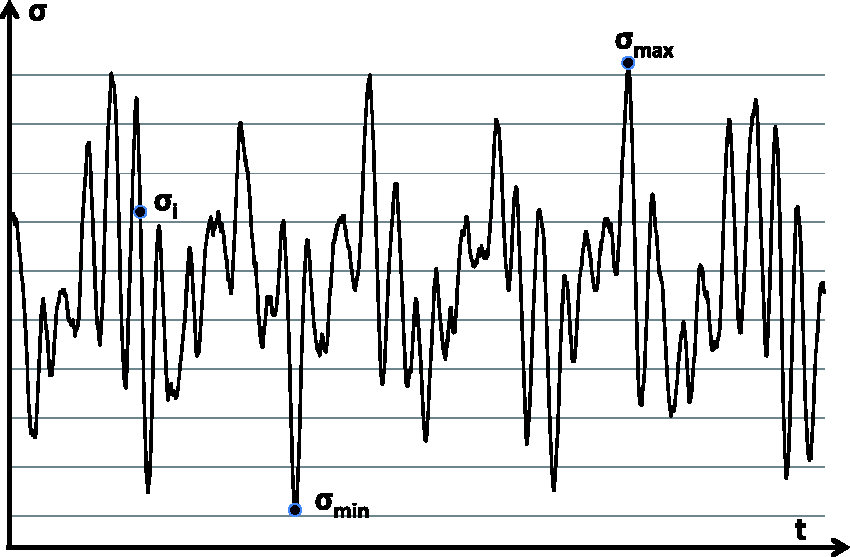
SDP is a method with the purpose of representing, in a visual and easy-to-understand way, changes in the amplitude and frequency of periodic signals. The parameters that are necessary to set in order to obtain a good SDP pattern are the time lag coefficient L and the angular gain ξ. Figure 9 shows the plot variation depending on the L and ξ values selected. For this study, values of L = 6 and ξ = 1.2° were chosen as they provided optimal SDP fingerprints.
Parameters sensitivity for the SDP analysis.
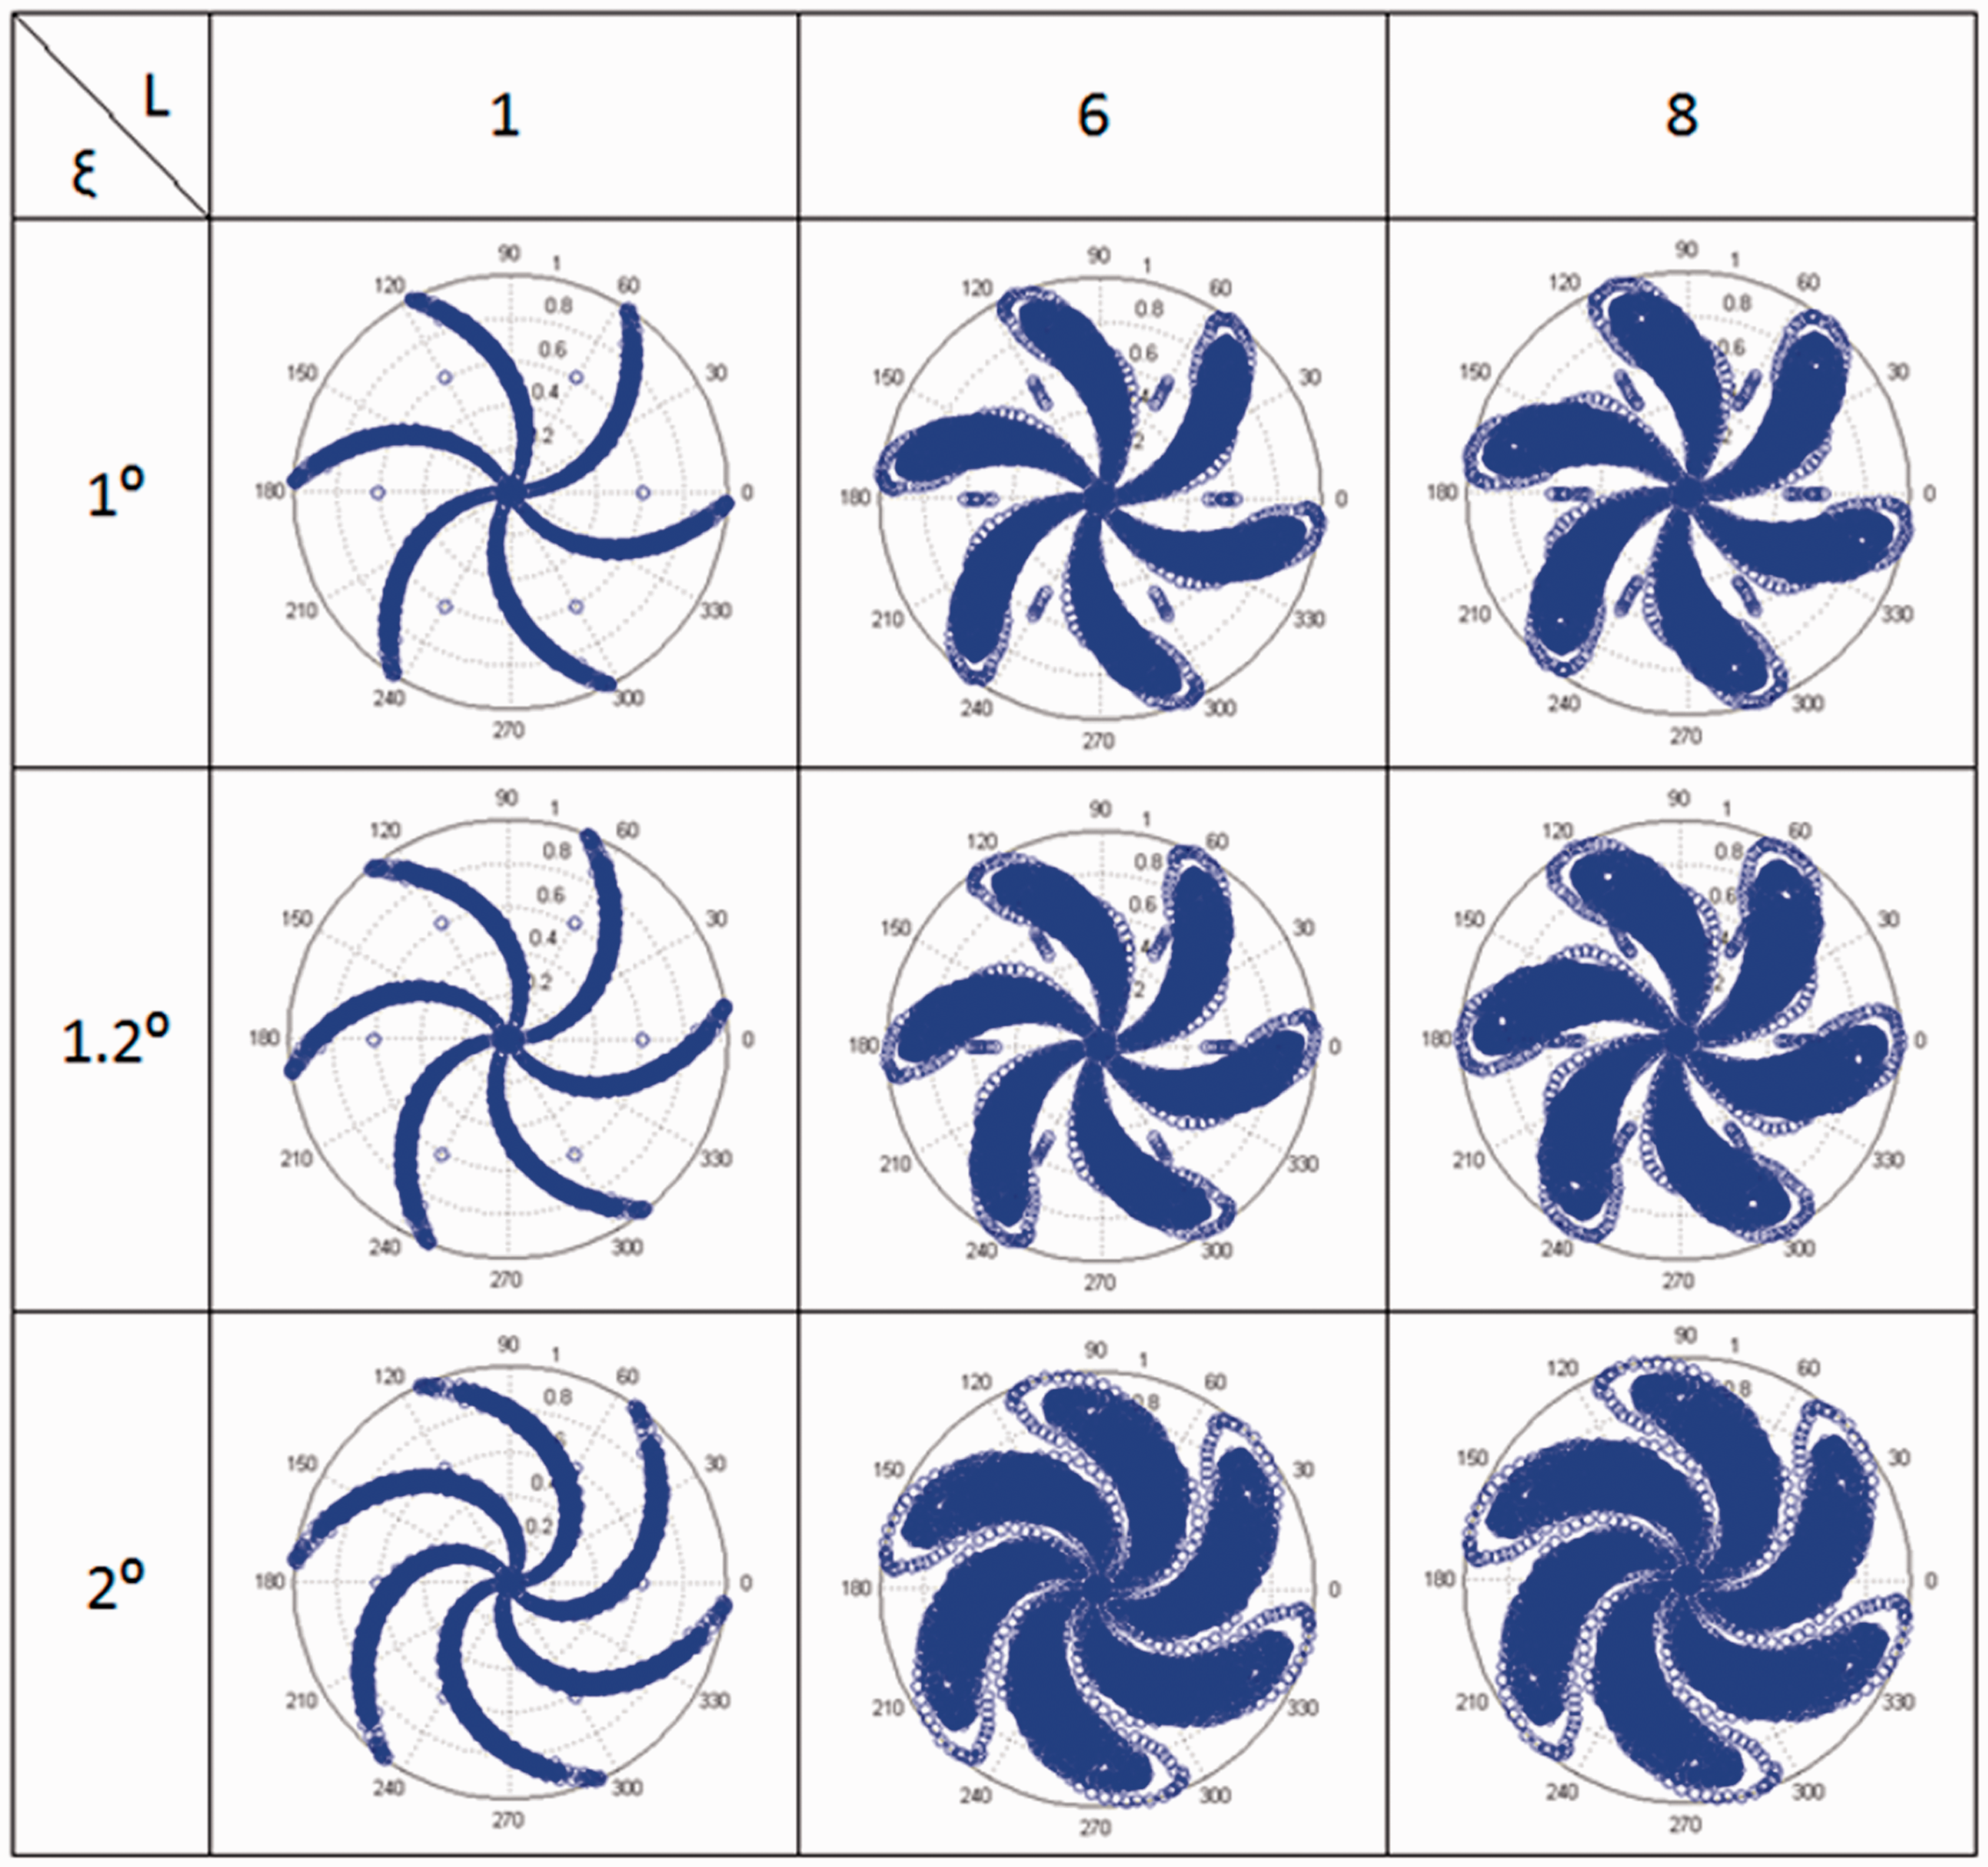
The sampling frequency and the acquisition time were 10 kHz and 0.2048 s, respectively. These values correspond to a given number of rotor revolutions during the sampling time. Note that due to variations in the driven frequency of the electrical motor as a function of the flow rate (see González et al. 21 ), the number of the rotor revolutions for the same acquisition time depends on the fan flow. In the case of high flow rate, the speed of the rotor was 4125 r/min, so the sampling time lasted 14 revolutions of the rotor, whereas for the medium flow rate lasted 15 revolutions and finally for the low flow rate 16 revolutions were recorded (see Figure 10). Also, in Figure 10, the different SDP fingerprints obtained for nominal flow rates at different sampling times showed that differences between the SDP fingerprints are practically marginal. Thus, an acceptable analysis could be realized using a sampling time of 53 ms, that is 4 rotor revolutions only.
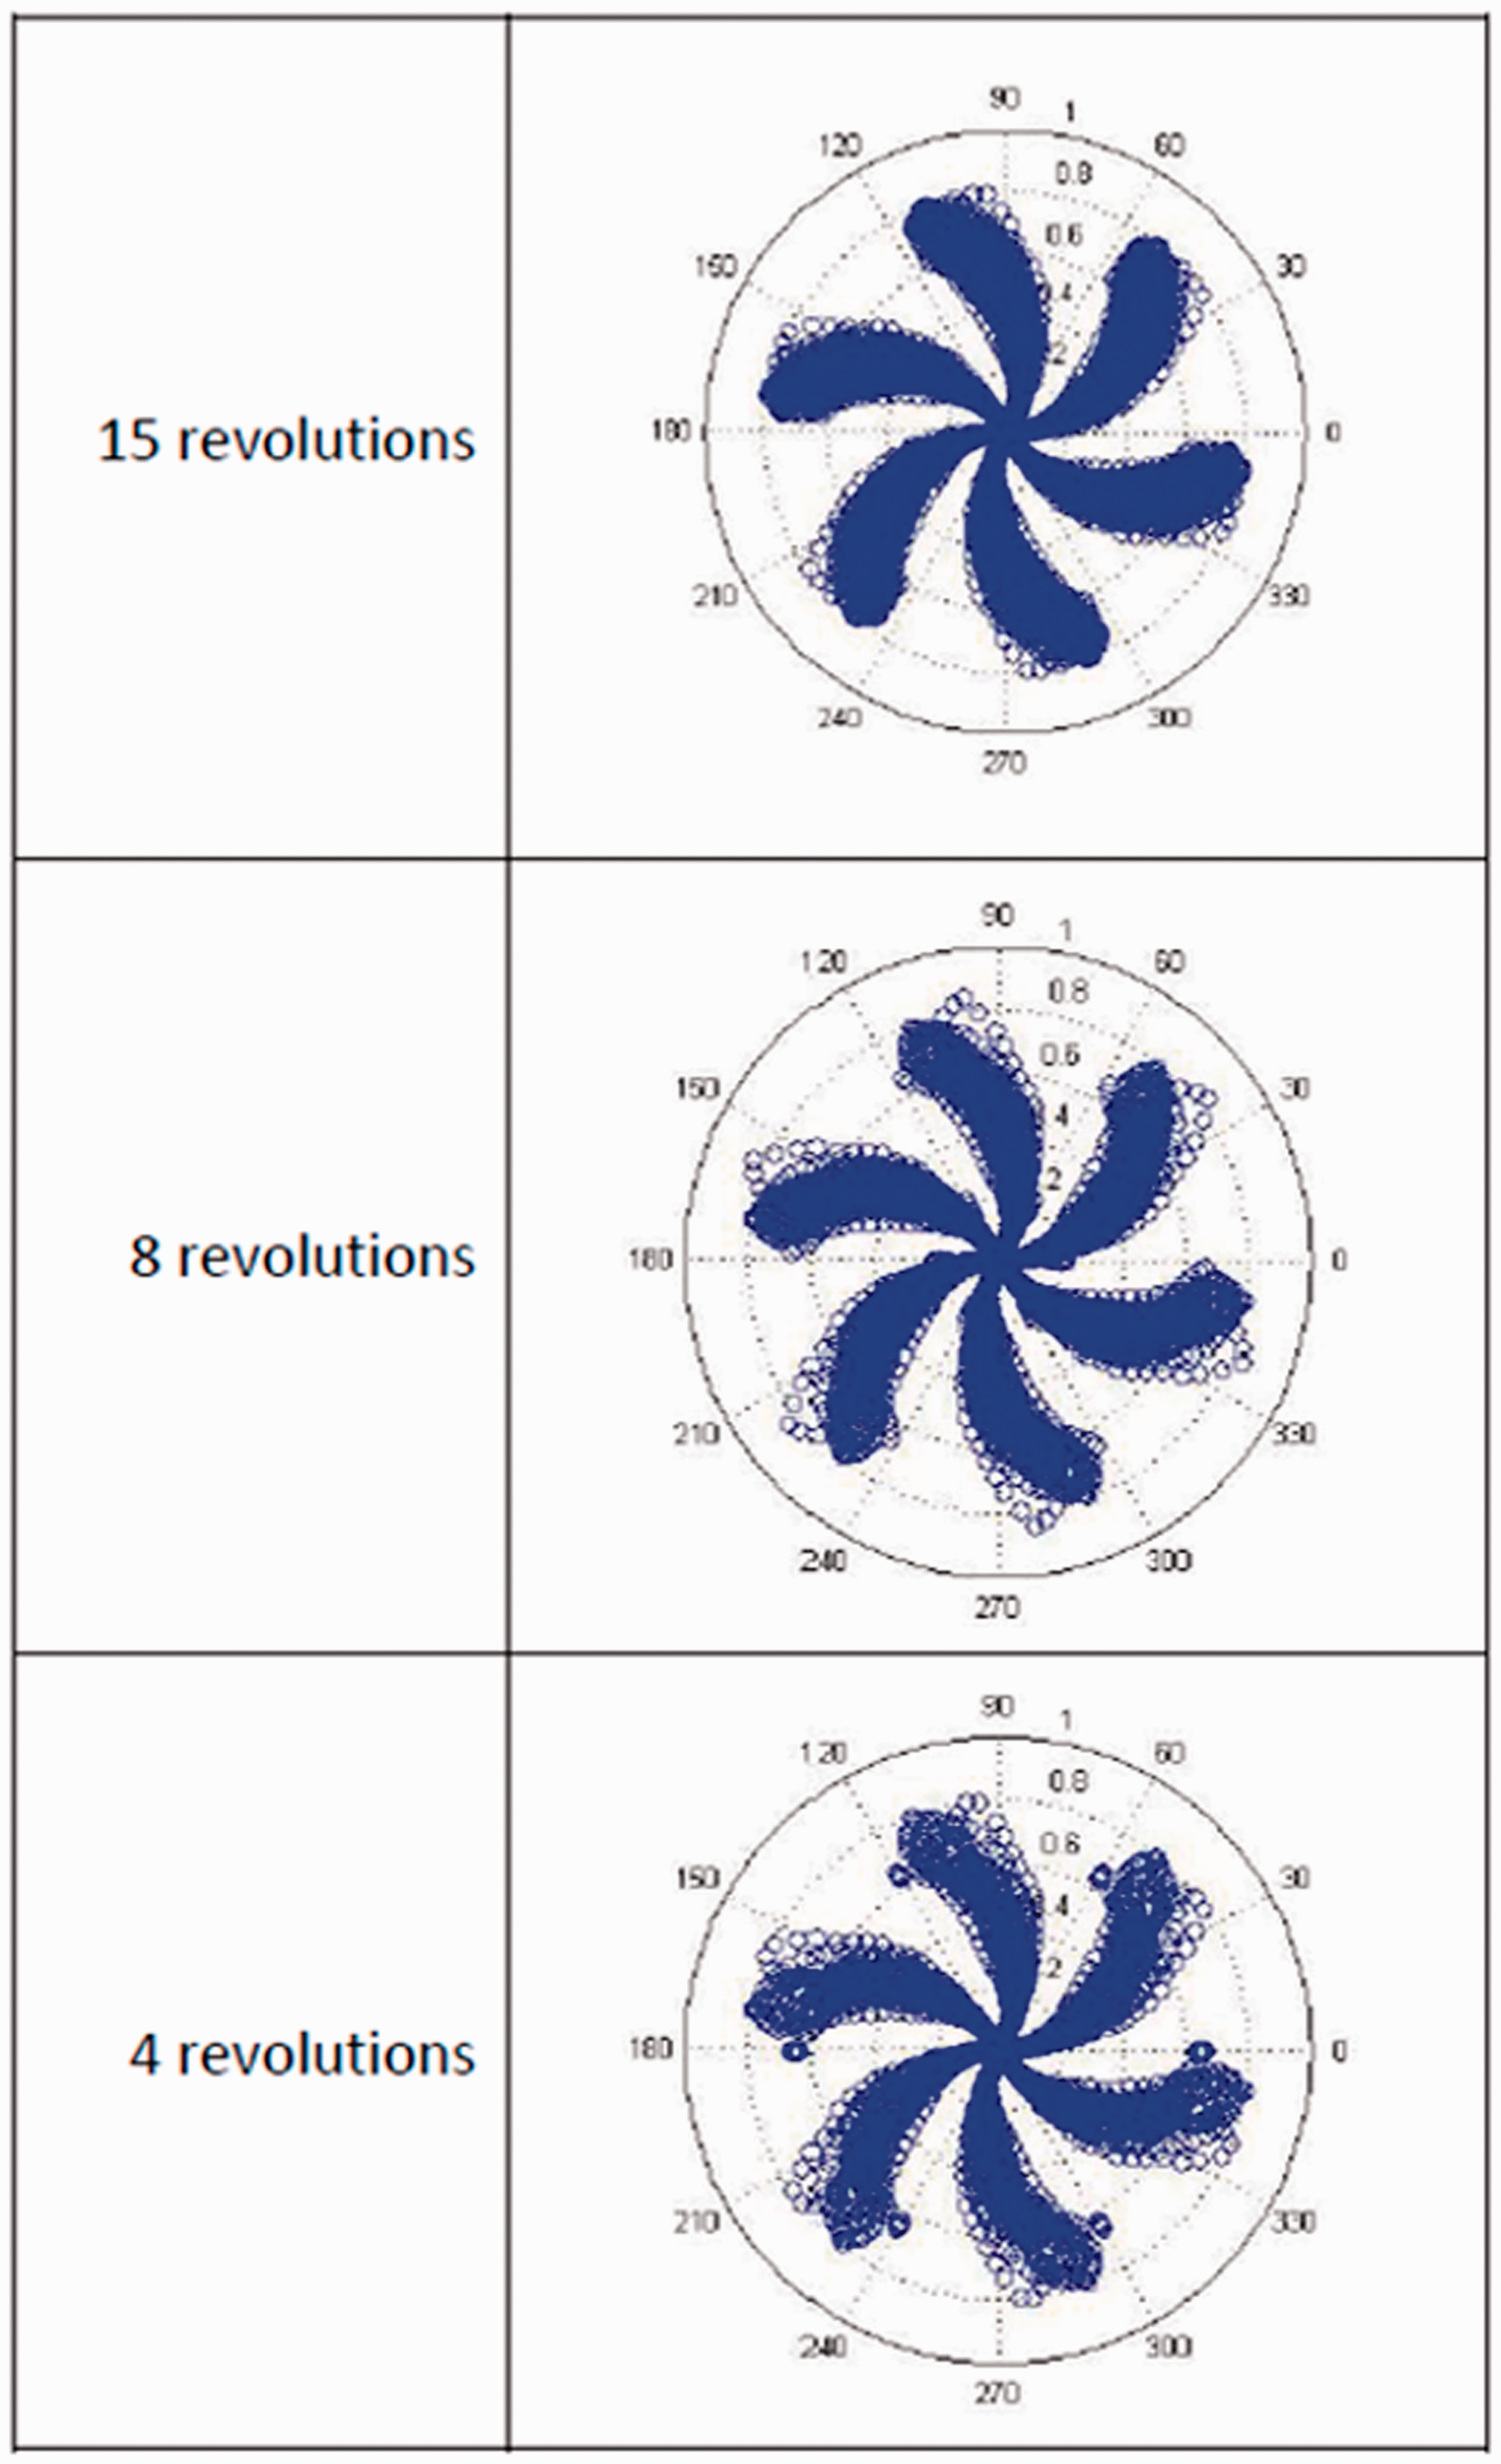
SDP patterns for different impeller revolutions at nominal flow rate.
From the kind of spectrum as the one shown in Figure 6, the POD technique is then applied to the nine studied data sets. After doing the peak selection, Figure 11 shows the composition of peaks and the resulting diagram for the nominal flow rate and the baseline operation. As the whole diagram is a summation of vectors, the result is graphically obtained as explained for the first point. Repeating this for a full rotation of the blades (a 360° turning of the impeller), the result is the plotted diagram or, in other words, the outer or envelope curve on Figure 11. In this particular graph, the result is the summation of the three most relevant frequencies: f1, f2 and f4. Also, the strongest signal or the most relevant one is the rotation frequency (f1). Then, it can be appreciated the fourth harmonic as second stronger one and, finally, the second harmonic, with relative less importance. Other harmonics influence at a lower level and, therefore, are not considered, obtaining in such way the POD of the signal. The vector summation of the three components is the result shown in Figure 11 (only the first point of the data set is remarked) and it resembles the POD graph of the nominal flow rate at the baseline operation of the fan. It shows a maximum vibration resultant for an angle near 45°, which indicates the almost equal contribution of the vertical and horizontal components in the vibration of the machine. For each rotation of the impeller, the composition of the x and y components, for a given flow rate, completes one of the elliptical-shape figures (similar to the one in Figure 11).
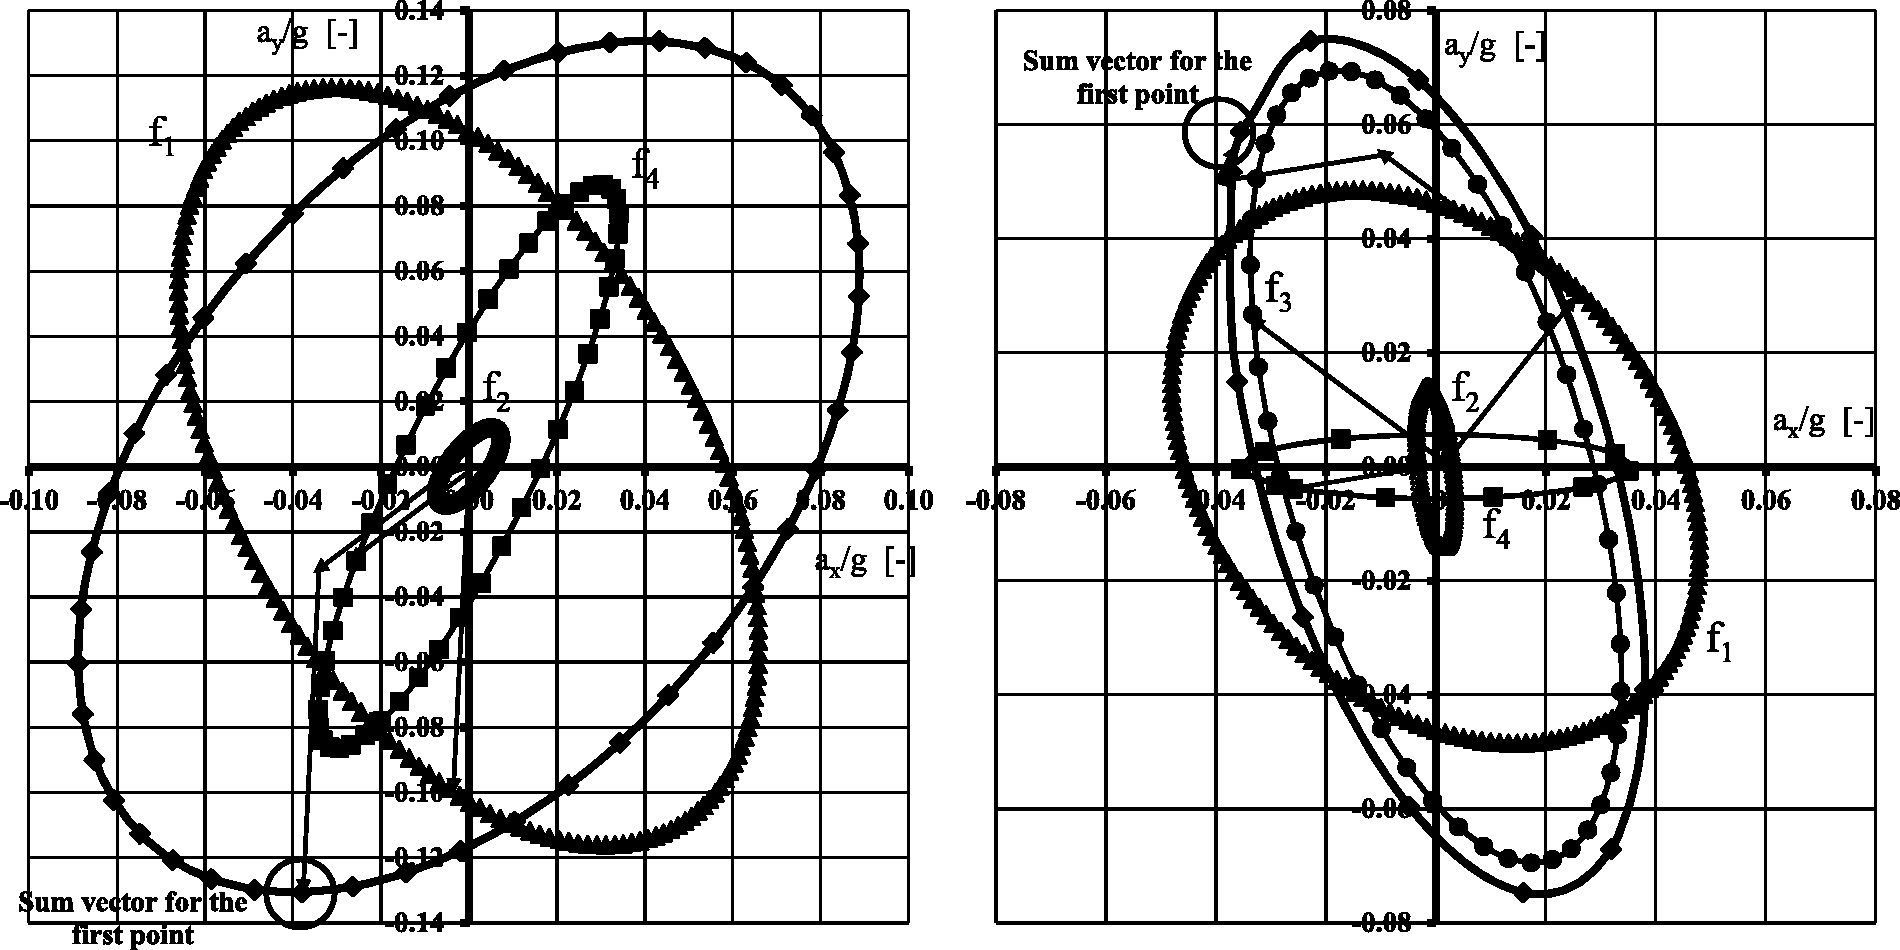
POD vector summation of the different frequencies for the nominal flow rate, left, and high flow rate, right.
The procedure is then repeated for the low and high flow rates. The result for the high flow rate and baseline operation is shown in Figure 11. The predominant frequencies are, for this working point, the rotating frequency and the four basic harmonics. Again, the vector summation is showed for the first point. The POD graph for this flow rate becomes more vertical than the one obtained in Figure 11. In this flow rate and operating at the baseline condition, the vertical component of the force is more important than the horizontal one.
Note that the scale for the two diagrams in Figure 11 is not the same and, therefore considering this scale change, the relative importance of each POD is re-scaled and compared in Figure 12. The comparison shows how the vibration at a high flow rate is less important, but with an order of magnitude very similar to the nominal flow rate. The highest vibrating levels are found at the low flow rate, with maximum vibration almost twice as the maximum for the other two analyzed flow rates.
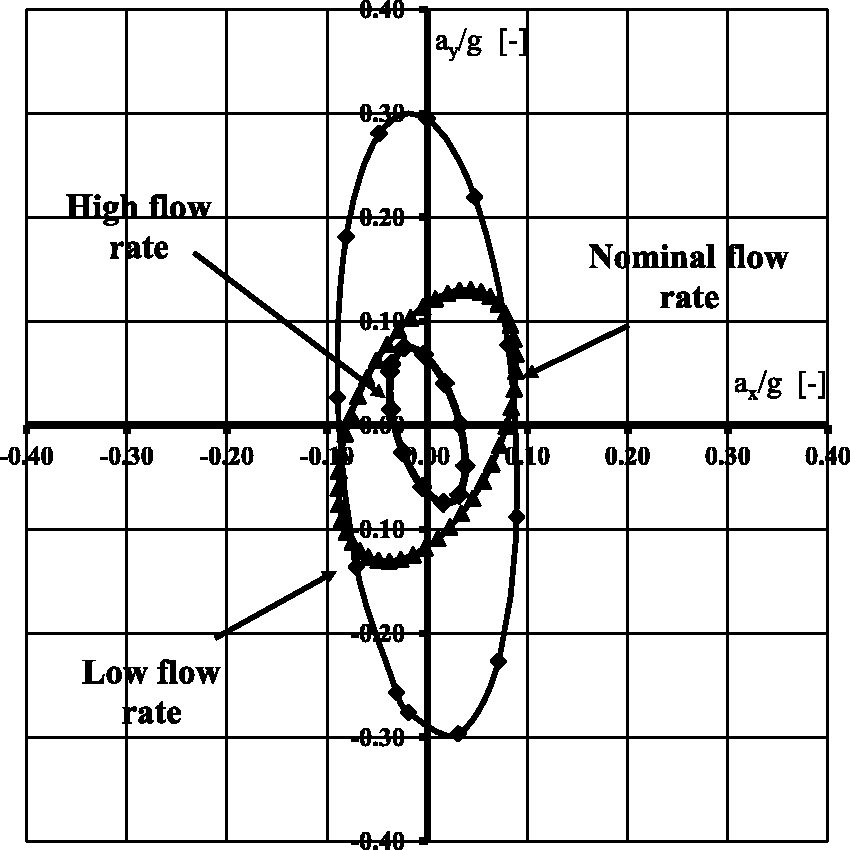
POD for the baseline operation and the three studied flow rates.
Results and discussion
Initially, the POD results are considered, then the SDP is analyzed, and finally a global remark is done on a cross-comparison basis of the two methods.
The full orbit diagram would be the result of plotting equation (1) for the whole set of valid and selected frequencies, within the limits of the experimental measurements chain, disregarding the ones with lower amplitude. In the performed measurements, the upper limit for the frequencies is restricted to 3 kHz. This means that the orbit summation in equation (1) could be a quite high number. Nevertheless, and once the experiments were carried out and only the significant frequencies are selected, the N value becomes much lower, in particular less than 5 in all the studied conditions.
Similar comparison is possible for the unbalanced rotor and the obstructed channel operations. Figure 13 provides the comparison as a function of the flow rate for the unbalanced rotor operating condition. The final comparisons, and more relevant in terms of fan operation and fault diagnosis, are the graphs showing the results for the same flow rate and different operation conditions. Such graphs are plotted in Figures 14 and 15. The scale is fixed for the nine studied data sets, in order to allow a direct comparison among them.
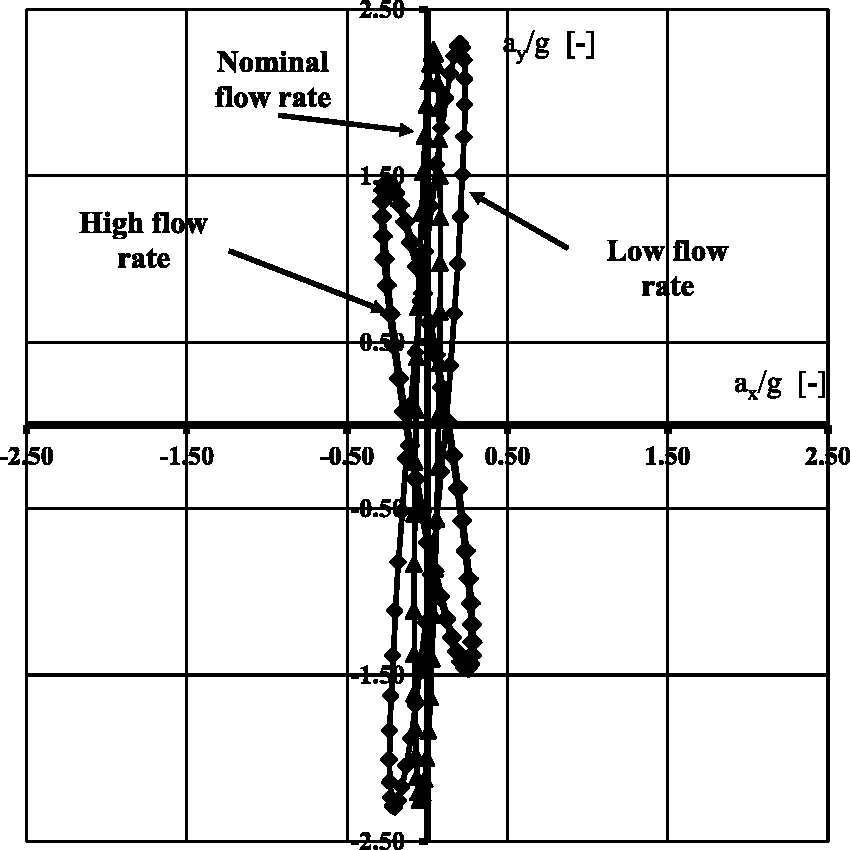
Comparison of the POD for the three flow rates: unbalanced rotor operating condition.
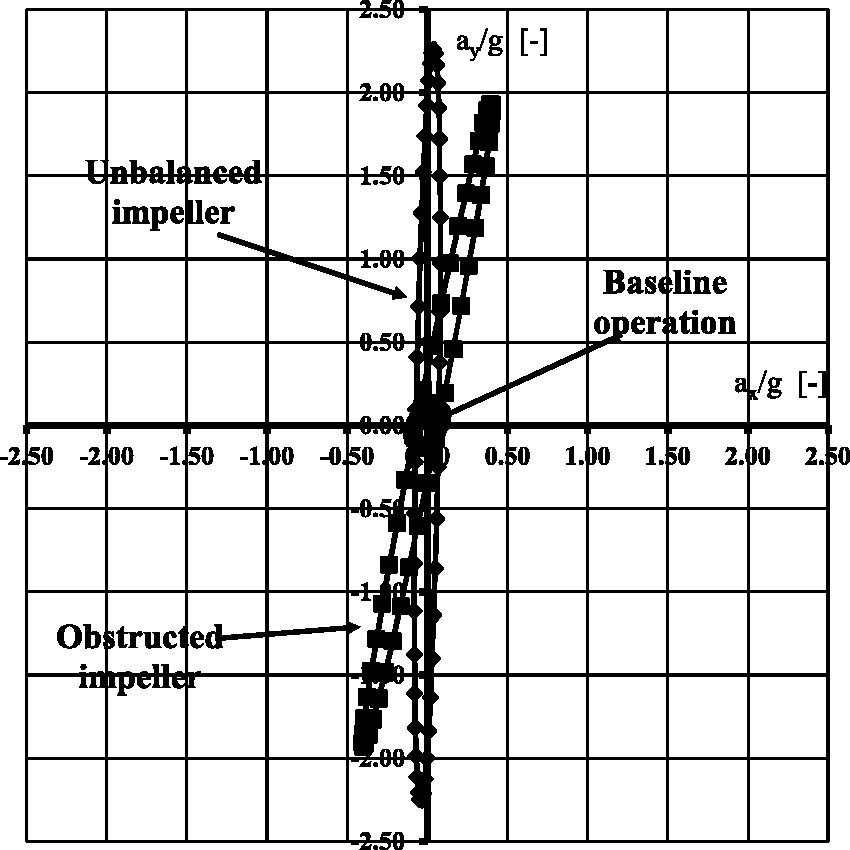
POD results for the nominal flow rate.
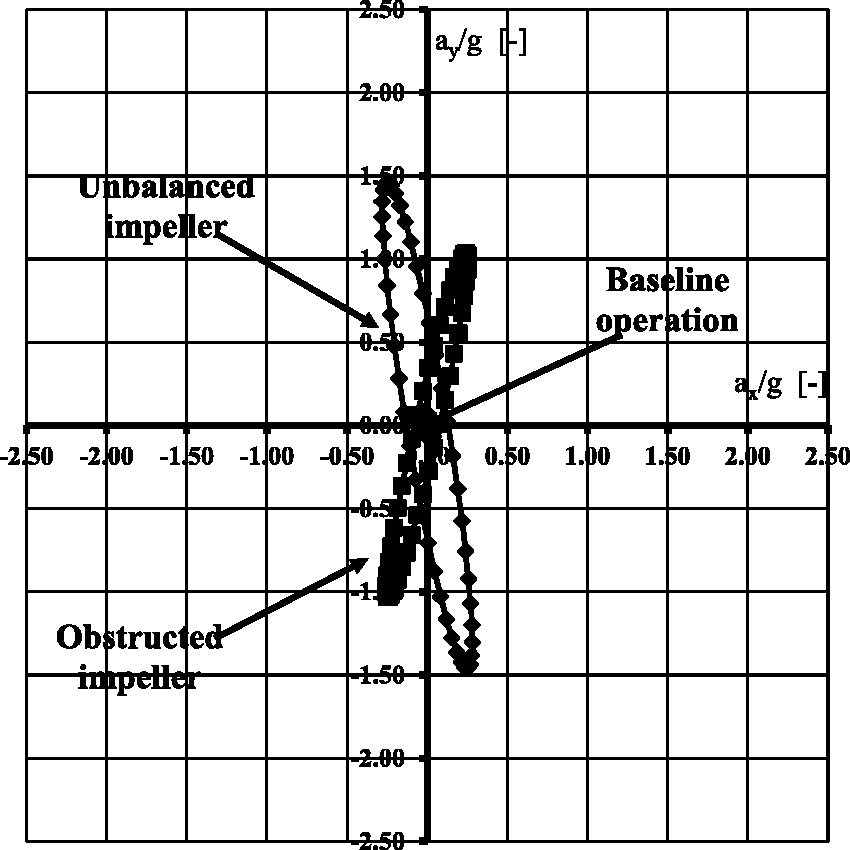
POD results for the high flow rate.
In particular, Figure 14 shows the comparison of the POD for the nominal flow rate. A minimum vibrating value is found for the baseline configuration and similar behavior is found for both of the studied failure. In fact, the baseline operation shows vibration levels in the order of six times lower as the failures ones. The impeller unbalance gives rise to the highest vibrations, with a maximum of nearly 2.5 times the gravitational acceleration. The main component for the three configurations is almost vertical, meaning that this is the main stress direction for such operation.
Figure 15 plots the POD for the highest analyzed flow rate. According to the previous results and to what might be expected, the minimum is found for the baseline operation. The relative values are around 20 times lower than the ones for the unbalanced rotor. The obstructed channel operation shows a medium range of vibrations, around 12 times higher than the baseline operation values. For off-design flow rates, the results for the unbalanced impeller fault show even higher accelerations, while for the nominal flow rate, both studied faults produce equivalent acceleration levels. The maximum acceleration for this flow rate is around 1.5 times the gravitational one and the main direction is again the vertical one. The quotient between the maximum acceleration for a given failure and the baseline operation becomes of the order of up to 20 times.
As a conclusion, the POD results allow a clear distinction between the baseline and the fault operation; however, the difference between the two failures tested is not clear. The clearest way to recognize the kind of failure from the experiments would be the angle of the main vibration, which is always more vertical for the unbalanced impeller operation. The maximum vibrations are found for the vertical direction and the ratio between the different failures and the baseline range from 3 to 20 times, being the maximum acceleration around 2.5 times the gravitational one.
For the SDP analysis and starting with the acceleration data recorded versus time, the previously given expressions to make the data transformation are considered, namely equation (2) is applied. The results are shown in Figures 16 and 17, and will be studied in detail in what follows.
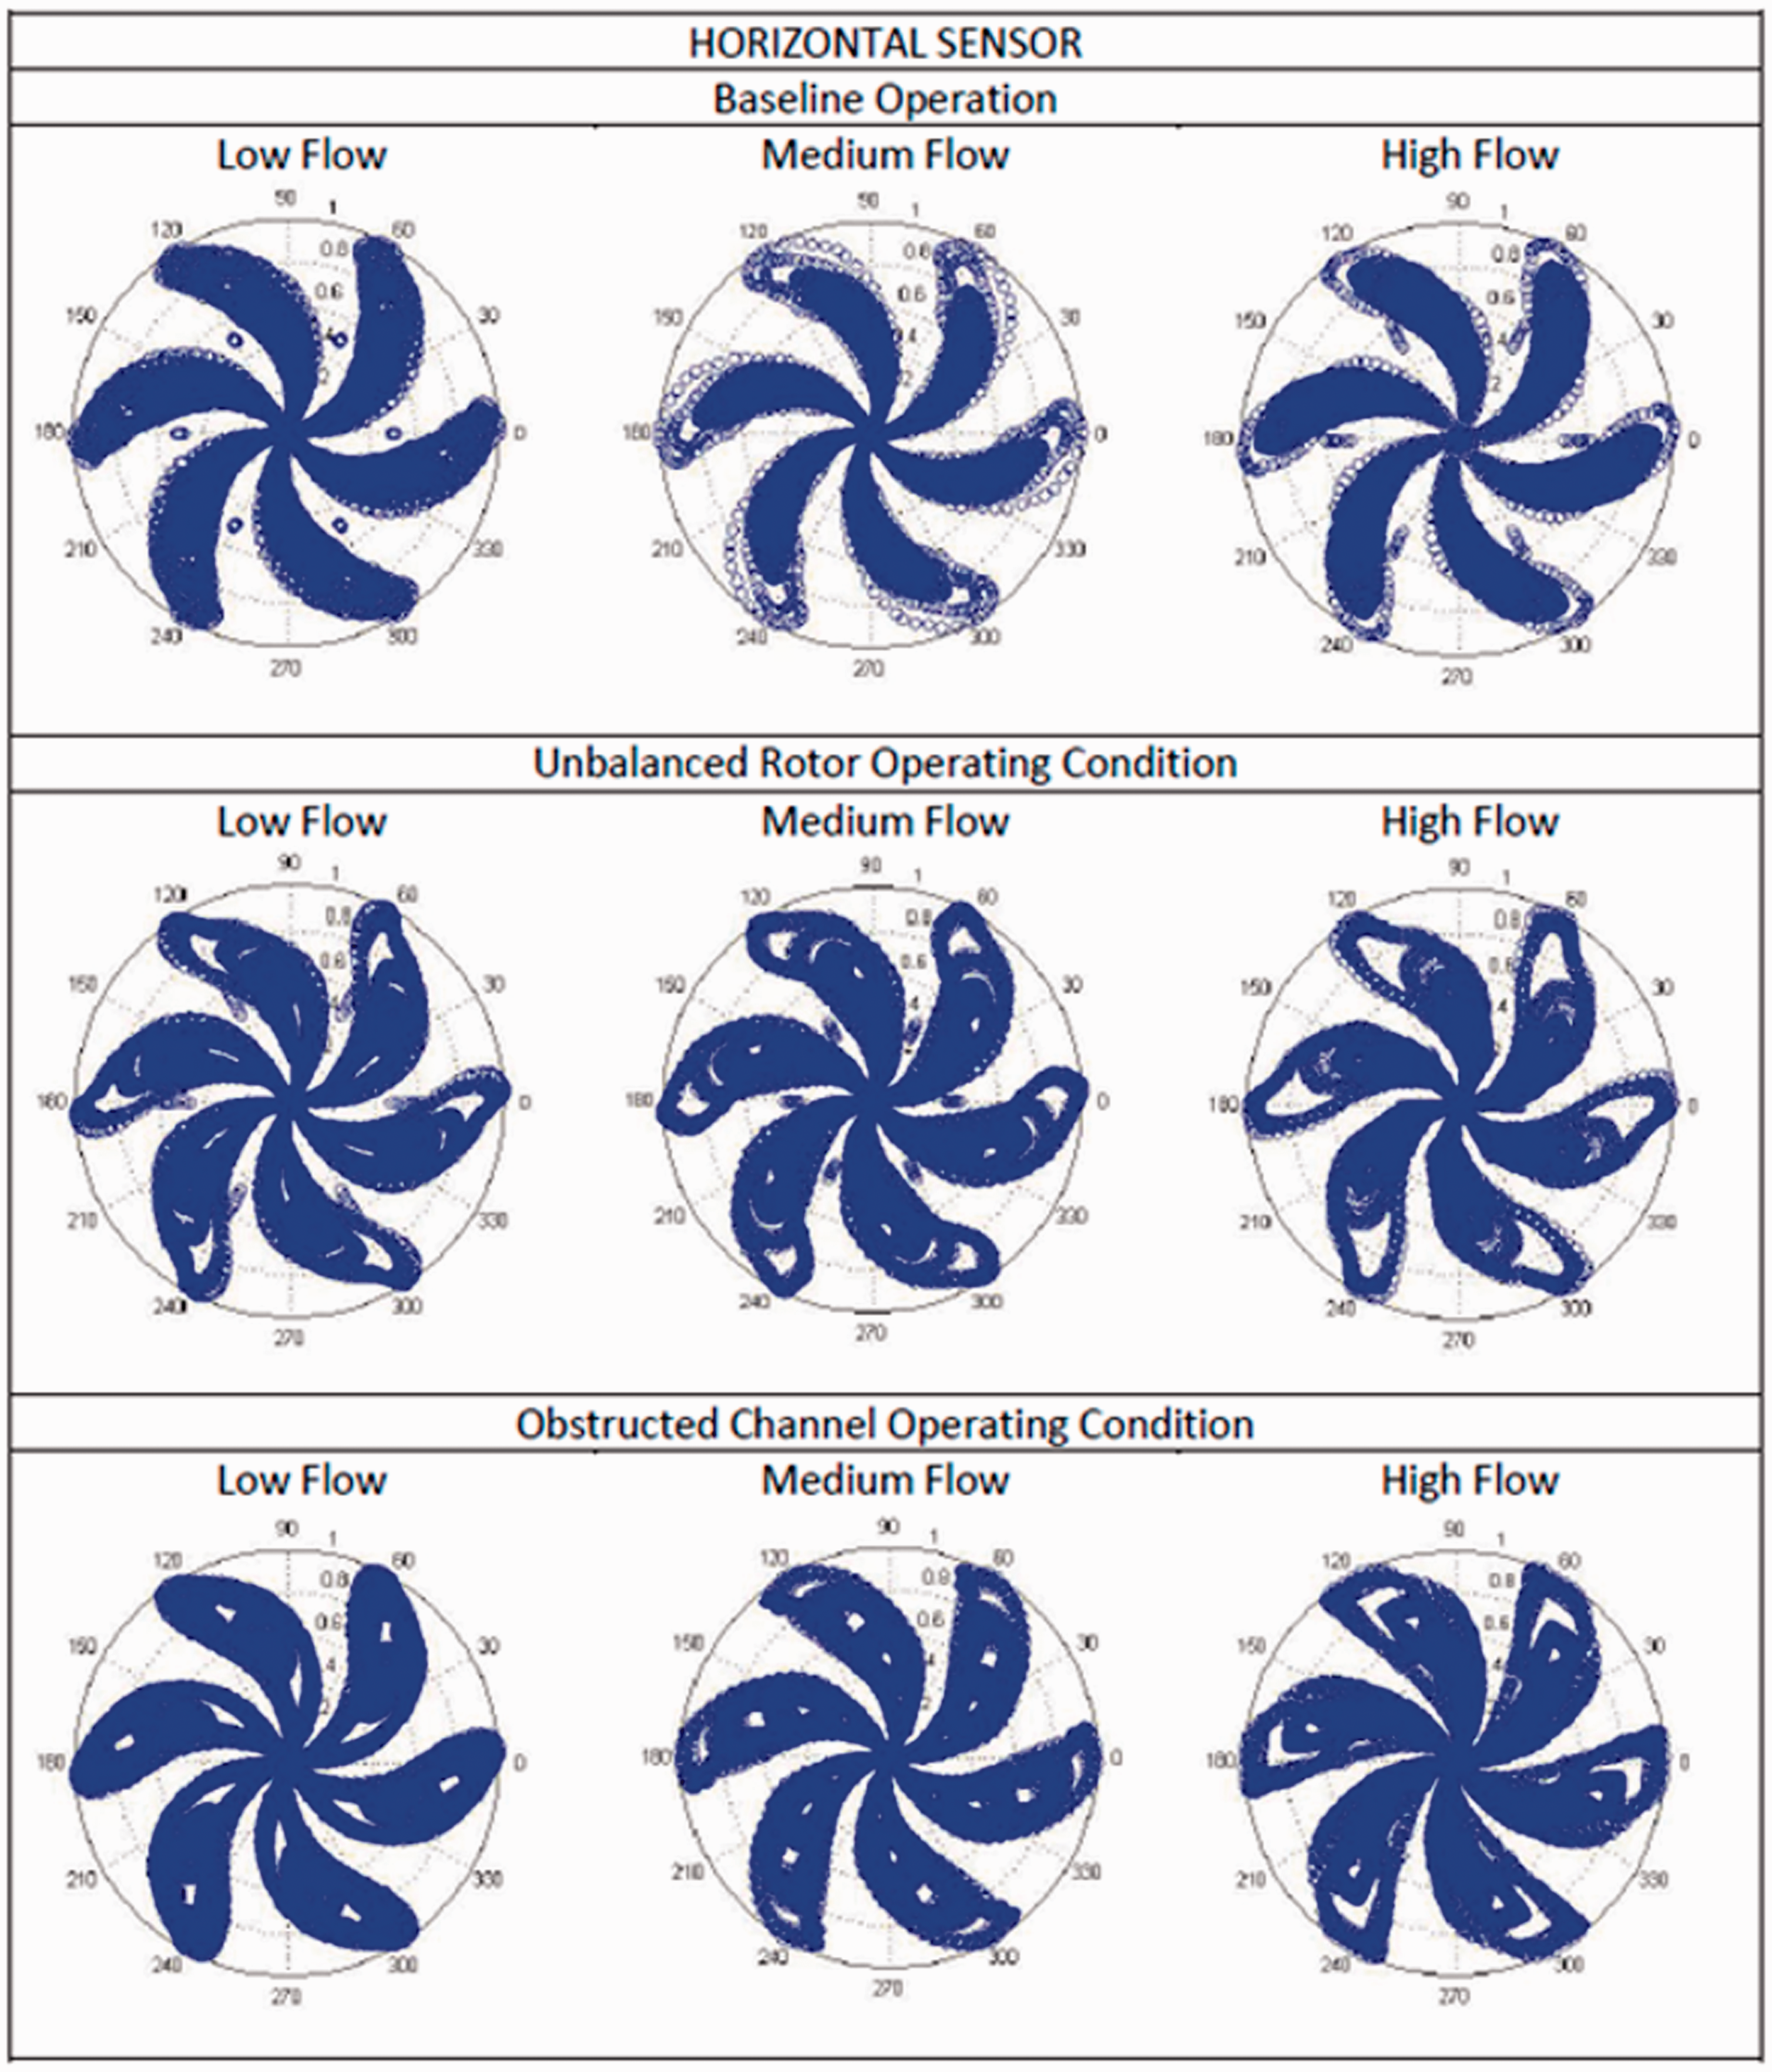
SDP maps for the horizontal sensor data.
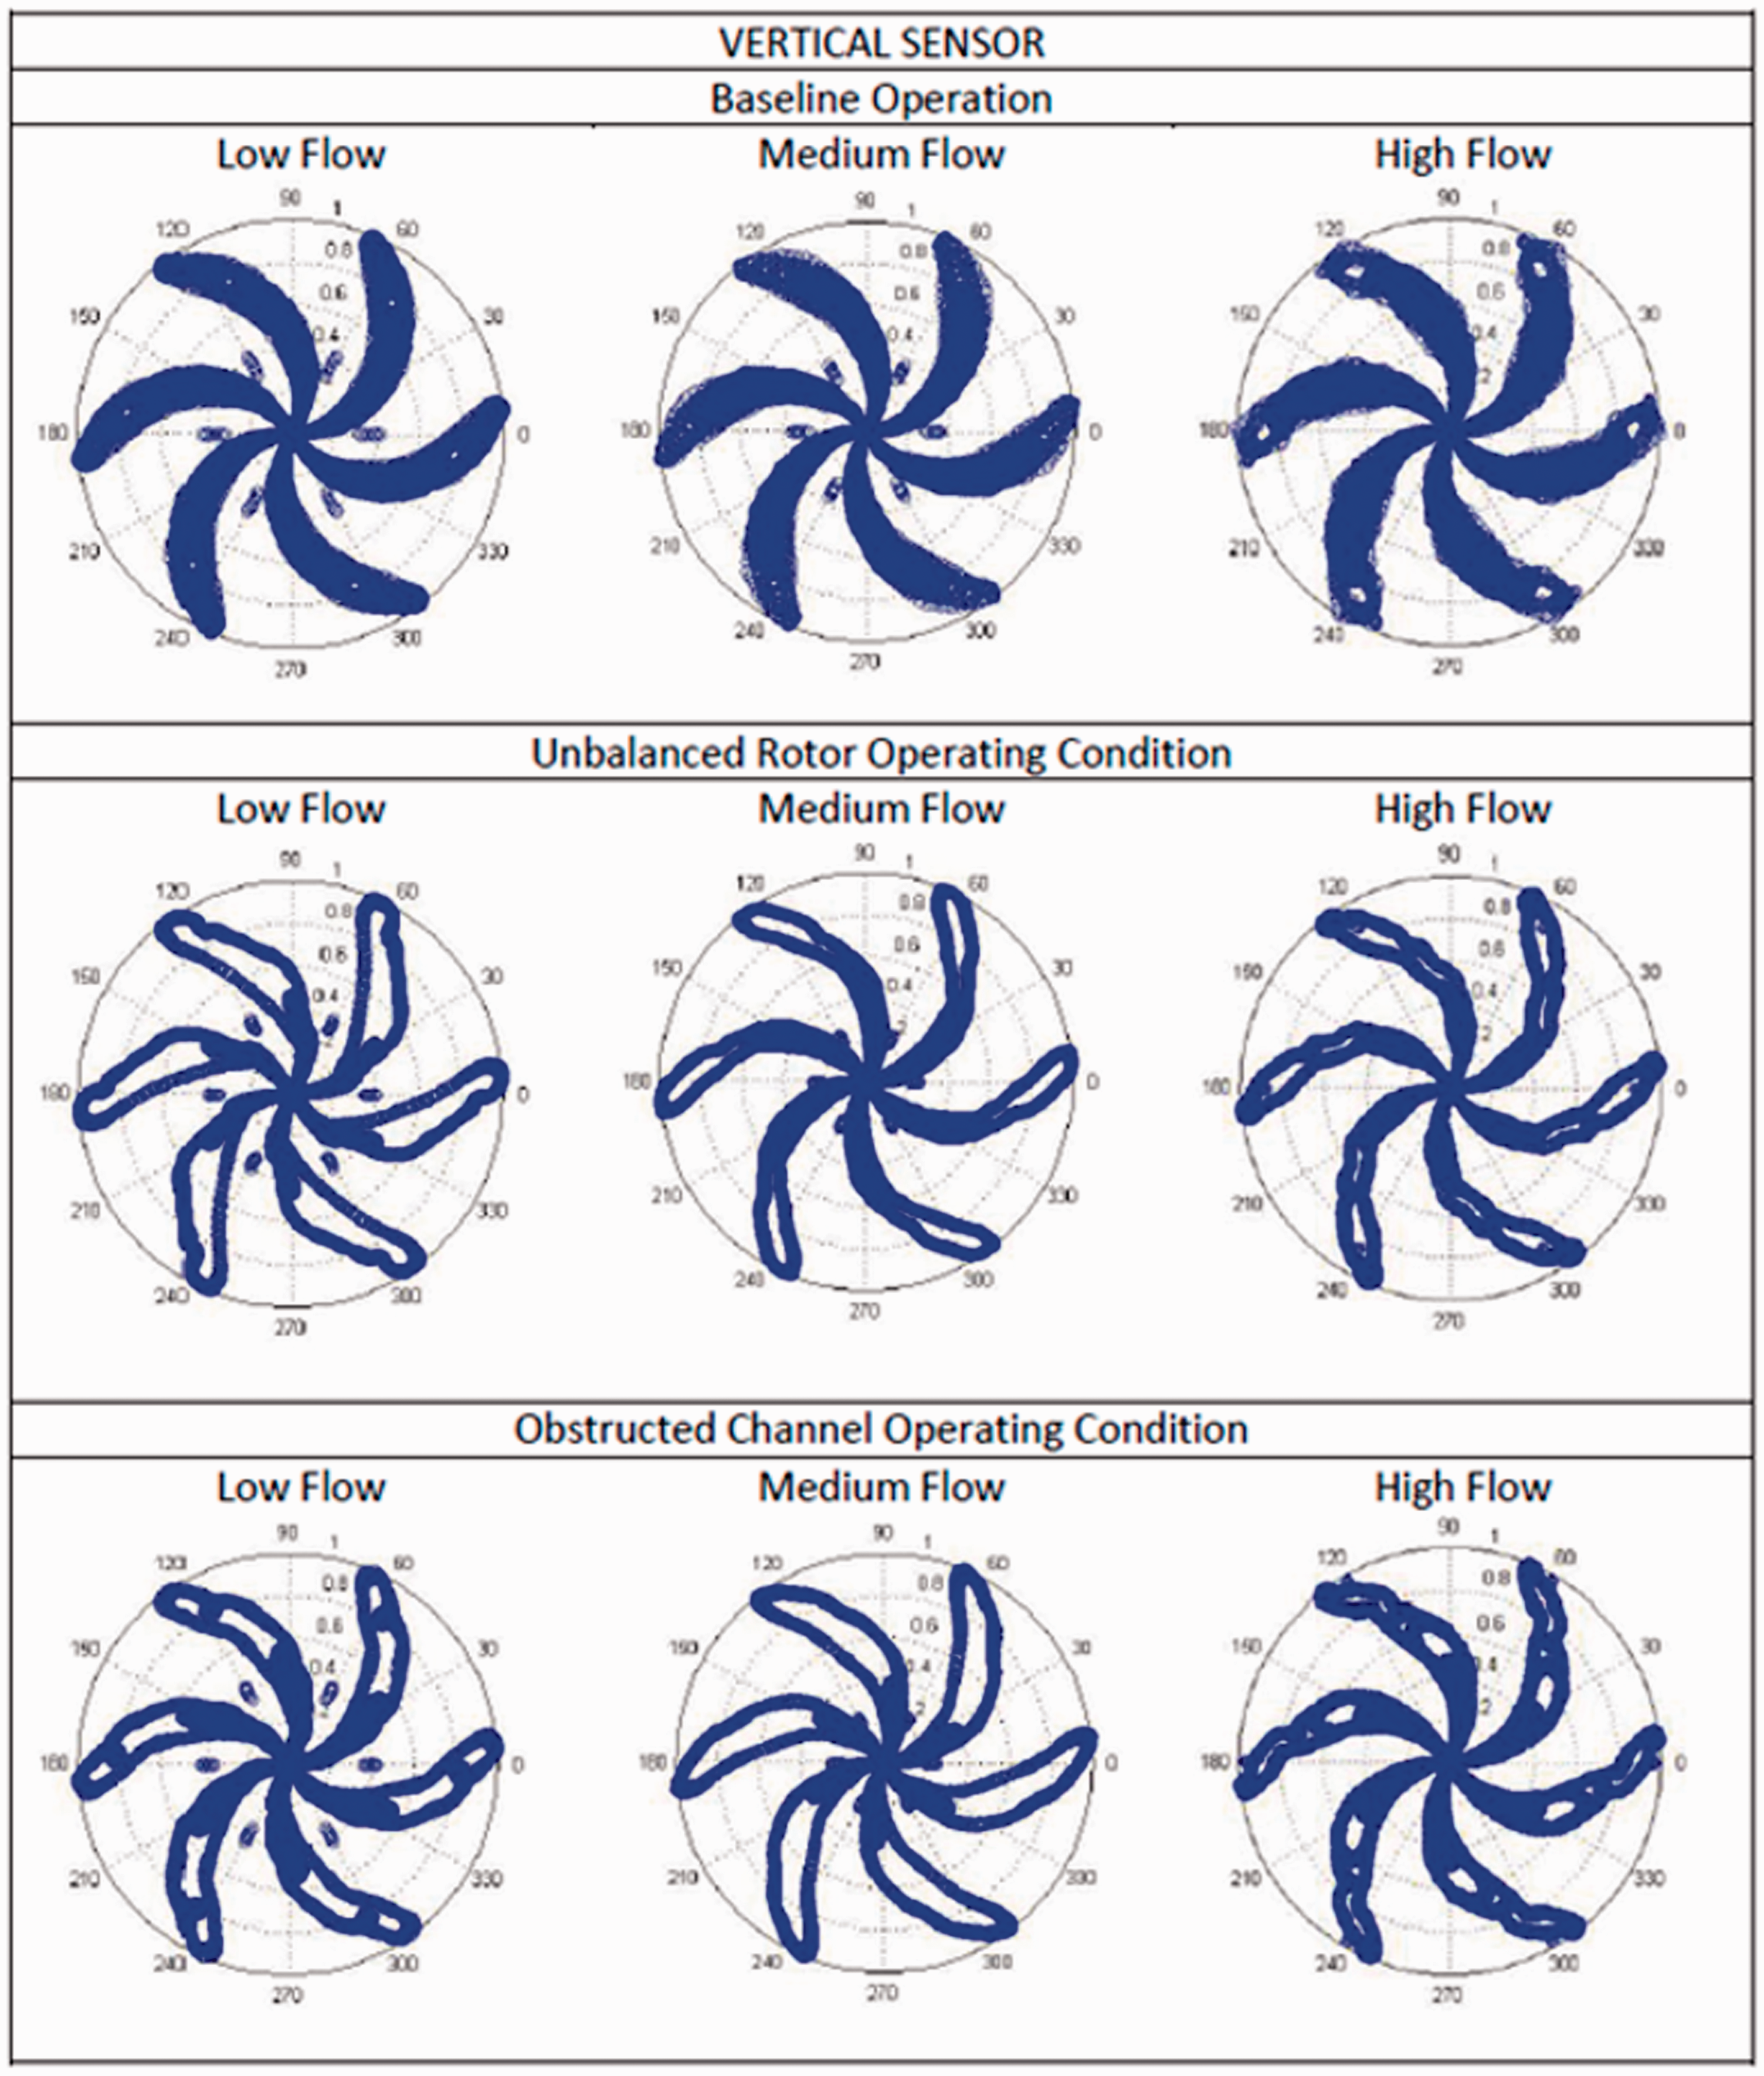
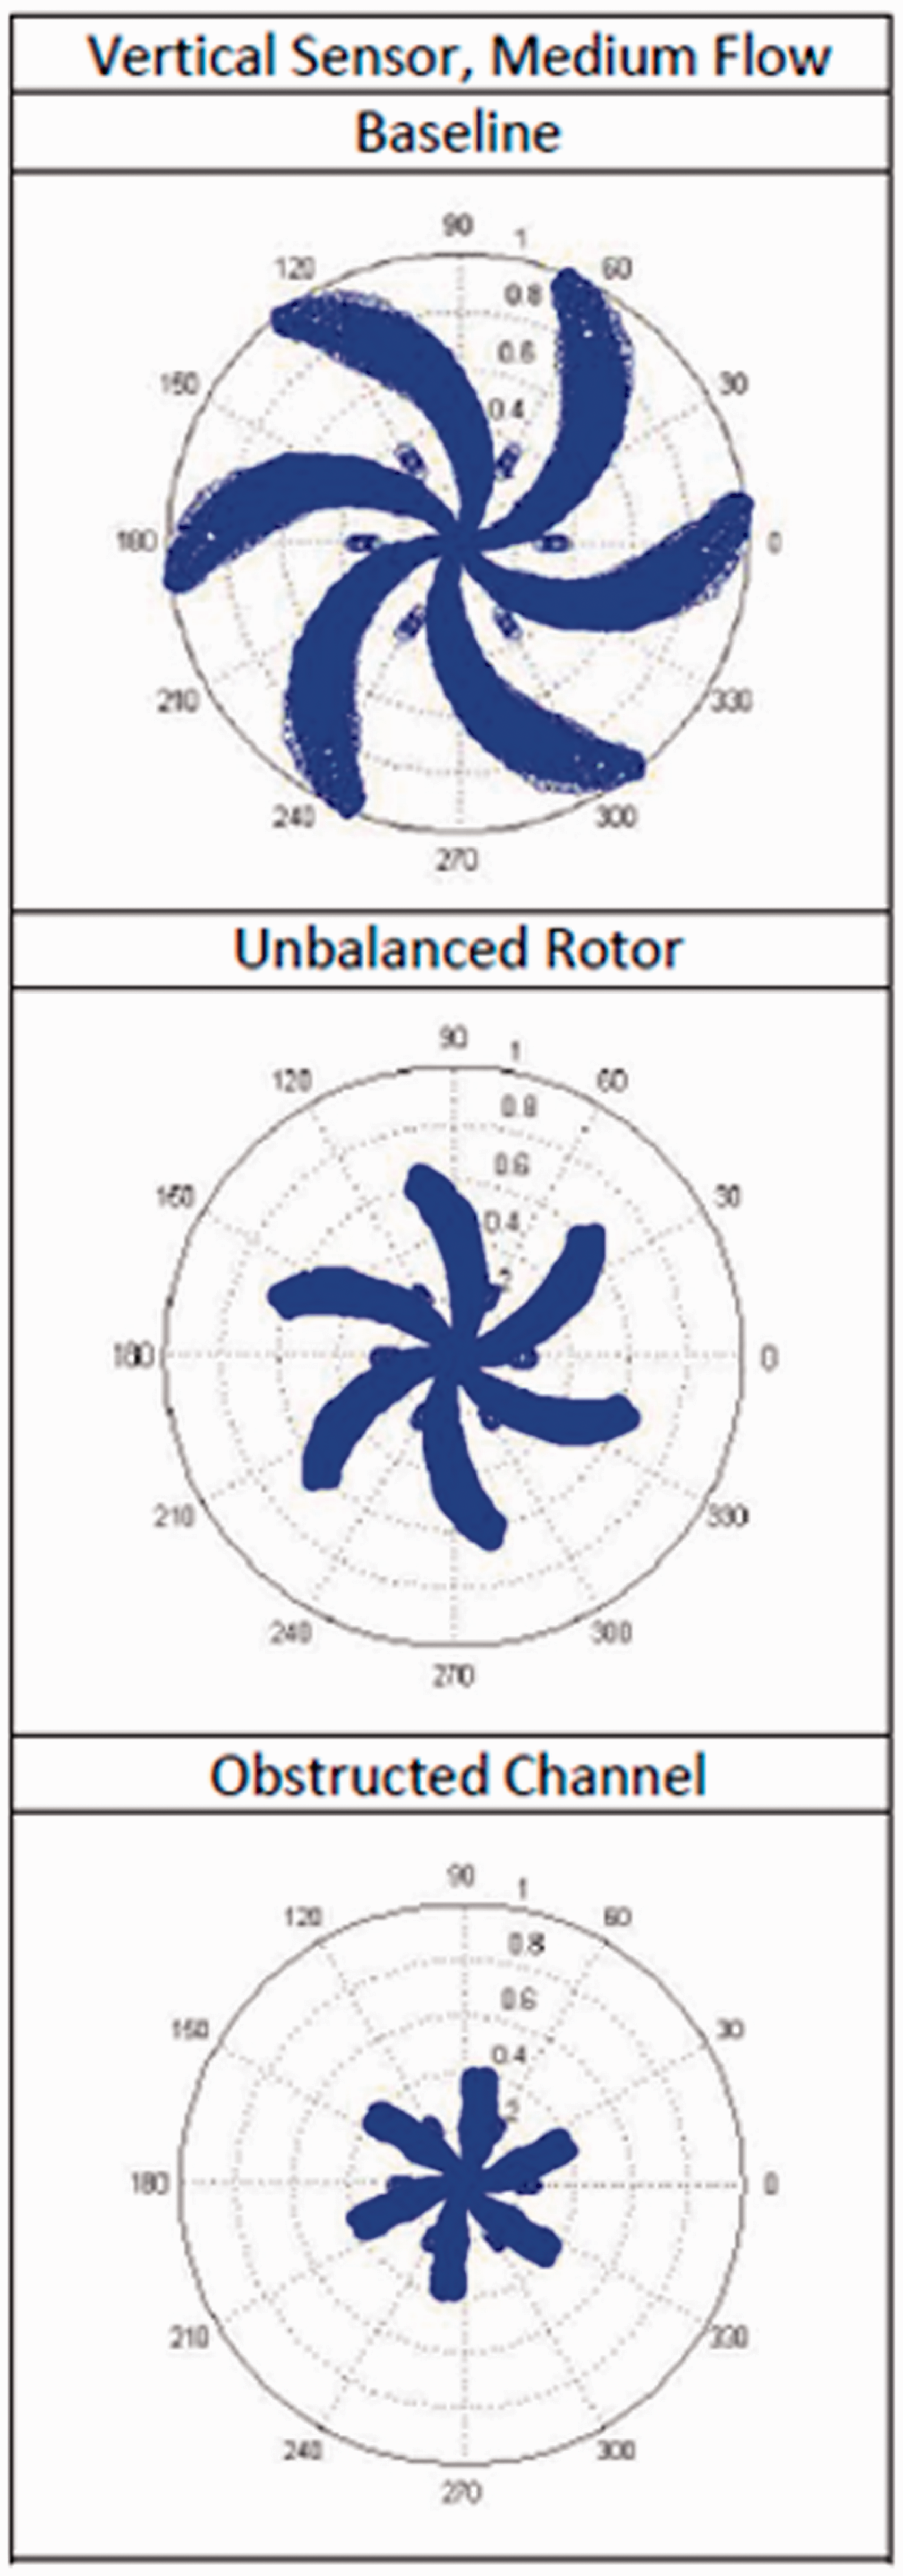
SDP maps for the vertical sensor data.
Once the SDP plots have been obtained, the next stage is to look for the differences between them and their tendencies in order to obtain general rules that allow the diagnosis of all fans. To do this, the plots obtained for the normal operating condition are compared with those obtained for the other performance conditions, as well as the plots of those failures with each other to find out whether it is possible to determine, with only one vibration analysis, which is the operating condition of the fan. For instance, the horizontal sensor results (Figure 16) are studied with the aim of characterizing the three different operating conditions. The remarks that follow are related to that Figure 16.
Normal operating (baseline) versus unbalanced rotor
As it is possible to see at first sight, with just the data acquired by the horizontal sensor, it is already seen that the fan is not operating properly, since the pattern obtained from the analysis of the unbalanced rotor fan is quite different from the normal operating pattern. Measurements were taken for three different flows, but it would not have been necessary, because, for example, for the case of the high flow, the normal SDP operating condition and the unbalanced rotor SDP operating condition are easy to differentiate. These last ones, as a matter of fact, for the same value of the parameters L and ξ, show a higher dot dispersion that makes the SDP fingerprint wider and presents a characteristic region without dots. The number of these regions grows as the flow of the unbalanced rotor fan decreases.
Normal operation (baseline) versus obstructed channel
Again, it is easy to distinguish between the normal and the obstructed channel SDP fingerprint, as in the previous case. The obstructed channel SDP fingerprints are wider than the normal SDP fingerprints. This bigger dot dispersion shows that the obstructed channel fan vibration is higher than the normal operating condition. Also, they have the characteristic regions without dots.
Unbalanced rotor versus obstructed channel
In this case, the differences between the SDP fingerprints related to these failures, obtained with the horizontal sensor data, are not as clear as in the previous case. Thus, the experience of the person who has to interpret the vibration analysis starts to acquire importance. The high flow and low flow plots are similar; however, the high flow unbalanced rotor SDP fingerprint presents more rounded edges. The low flow obstructed channel SDP fingerprint is formed by a dot outline with a series of dots inside that form a circumference. There are two characteristic regions without dots, one in the edge of the lobes and the other in the base. These are the rules that would be used to differentiate the obstructed channel from the unbalanced rotor SDP.
Therefore, the results obtained by the horizontal sensor do not allow to determine clearly the type of failure the machine has, and it is necessary to consider the results from the vertical sensor to discern between the two failures. The results obtained by the vertical sensor (Figure 17) are now considered in what follows.
Normal operation versus unbalanced rotor
In this case, both the normal and unbalanced rotor SDP have thicker lobes than for the SDP obtained with the horizontal sensor. Like in the previous case of the horizontal sensor, the unbalanced rotor SDP lobes present regions without dots in their interior. So, it is easy to differentiate the SDPs that belong to a normal operating condition from those that belong to an unbalanced rotor operating condition.
Normal operation versus obstructed channel
The SDPs obtained with this accelerometer allows to differentiate easily the fan operating condition. The thickness of the lobes is quite similar for these two types of operating conditions. It is the region without dots inside the lobes which allows to distinguish these types of failures.
Unbalanced rotor versus obstructed channel
Unlike the horizontal sensor SDPs, thanks to the medium and low flow SDP fingerprints obtained from the vertical sensor it is easy to differentiate between the two types of failures. Regarding the obstructed channel medium flow SDP, this is formed by a dot series that draw the lobes which have, in their center, a characteristic region without points, while in the unbalanced rotor lobes, the only region without dots is in their outer half.
The low flow SDPs for the two types of failures have the same arrangement, but the lobes present two characteristic regions that permit to identify each failure with its SDP. These characteristic regions are placed, one towards the end of the lobes and the other in the base. The low flow unbalanced rotor SDP has a lower dot density in the characteristic regions mentioned previously than the low flow obstructed channel SDP. This one has a dot concentration in the form of a circumference, in the lobe tip area, that joins the two outlines and forms two regions without dots, one towards the tip and the other to the base. Regarding the base area, in the obstructed channel SDP, the “dot mark” of the lobes takes up almost all the lower half of the lobes, whereas for the unbalanced rotor SDP, the stain is smaller than in the other case.
Another possibility of interpretation would be to eliminate from the SDP fingerprint the set of dots that encircle the regions without dots. Figure 18 shows the SDP diagram obtained by the application of this procedure. The lobes of the obstructed channel SDP obtained in this way have a shorter length than for the normal operating and unbalanced rotor SDP as Figure 19 shows. This is due to the fact that, for the obstructed channel operating state, the predominant waves are of low frequency and their amplitude is larger than in the other cases.
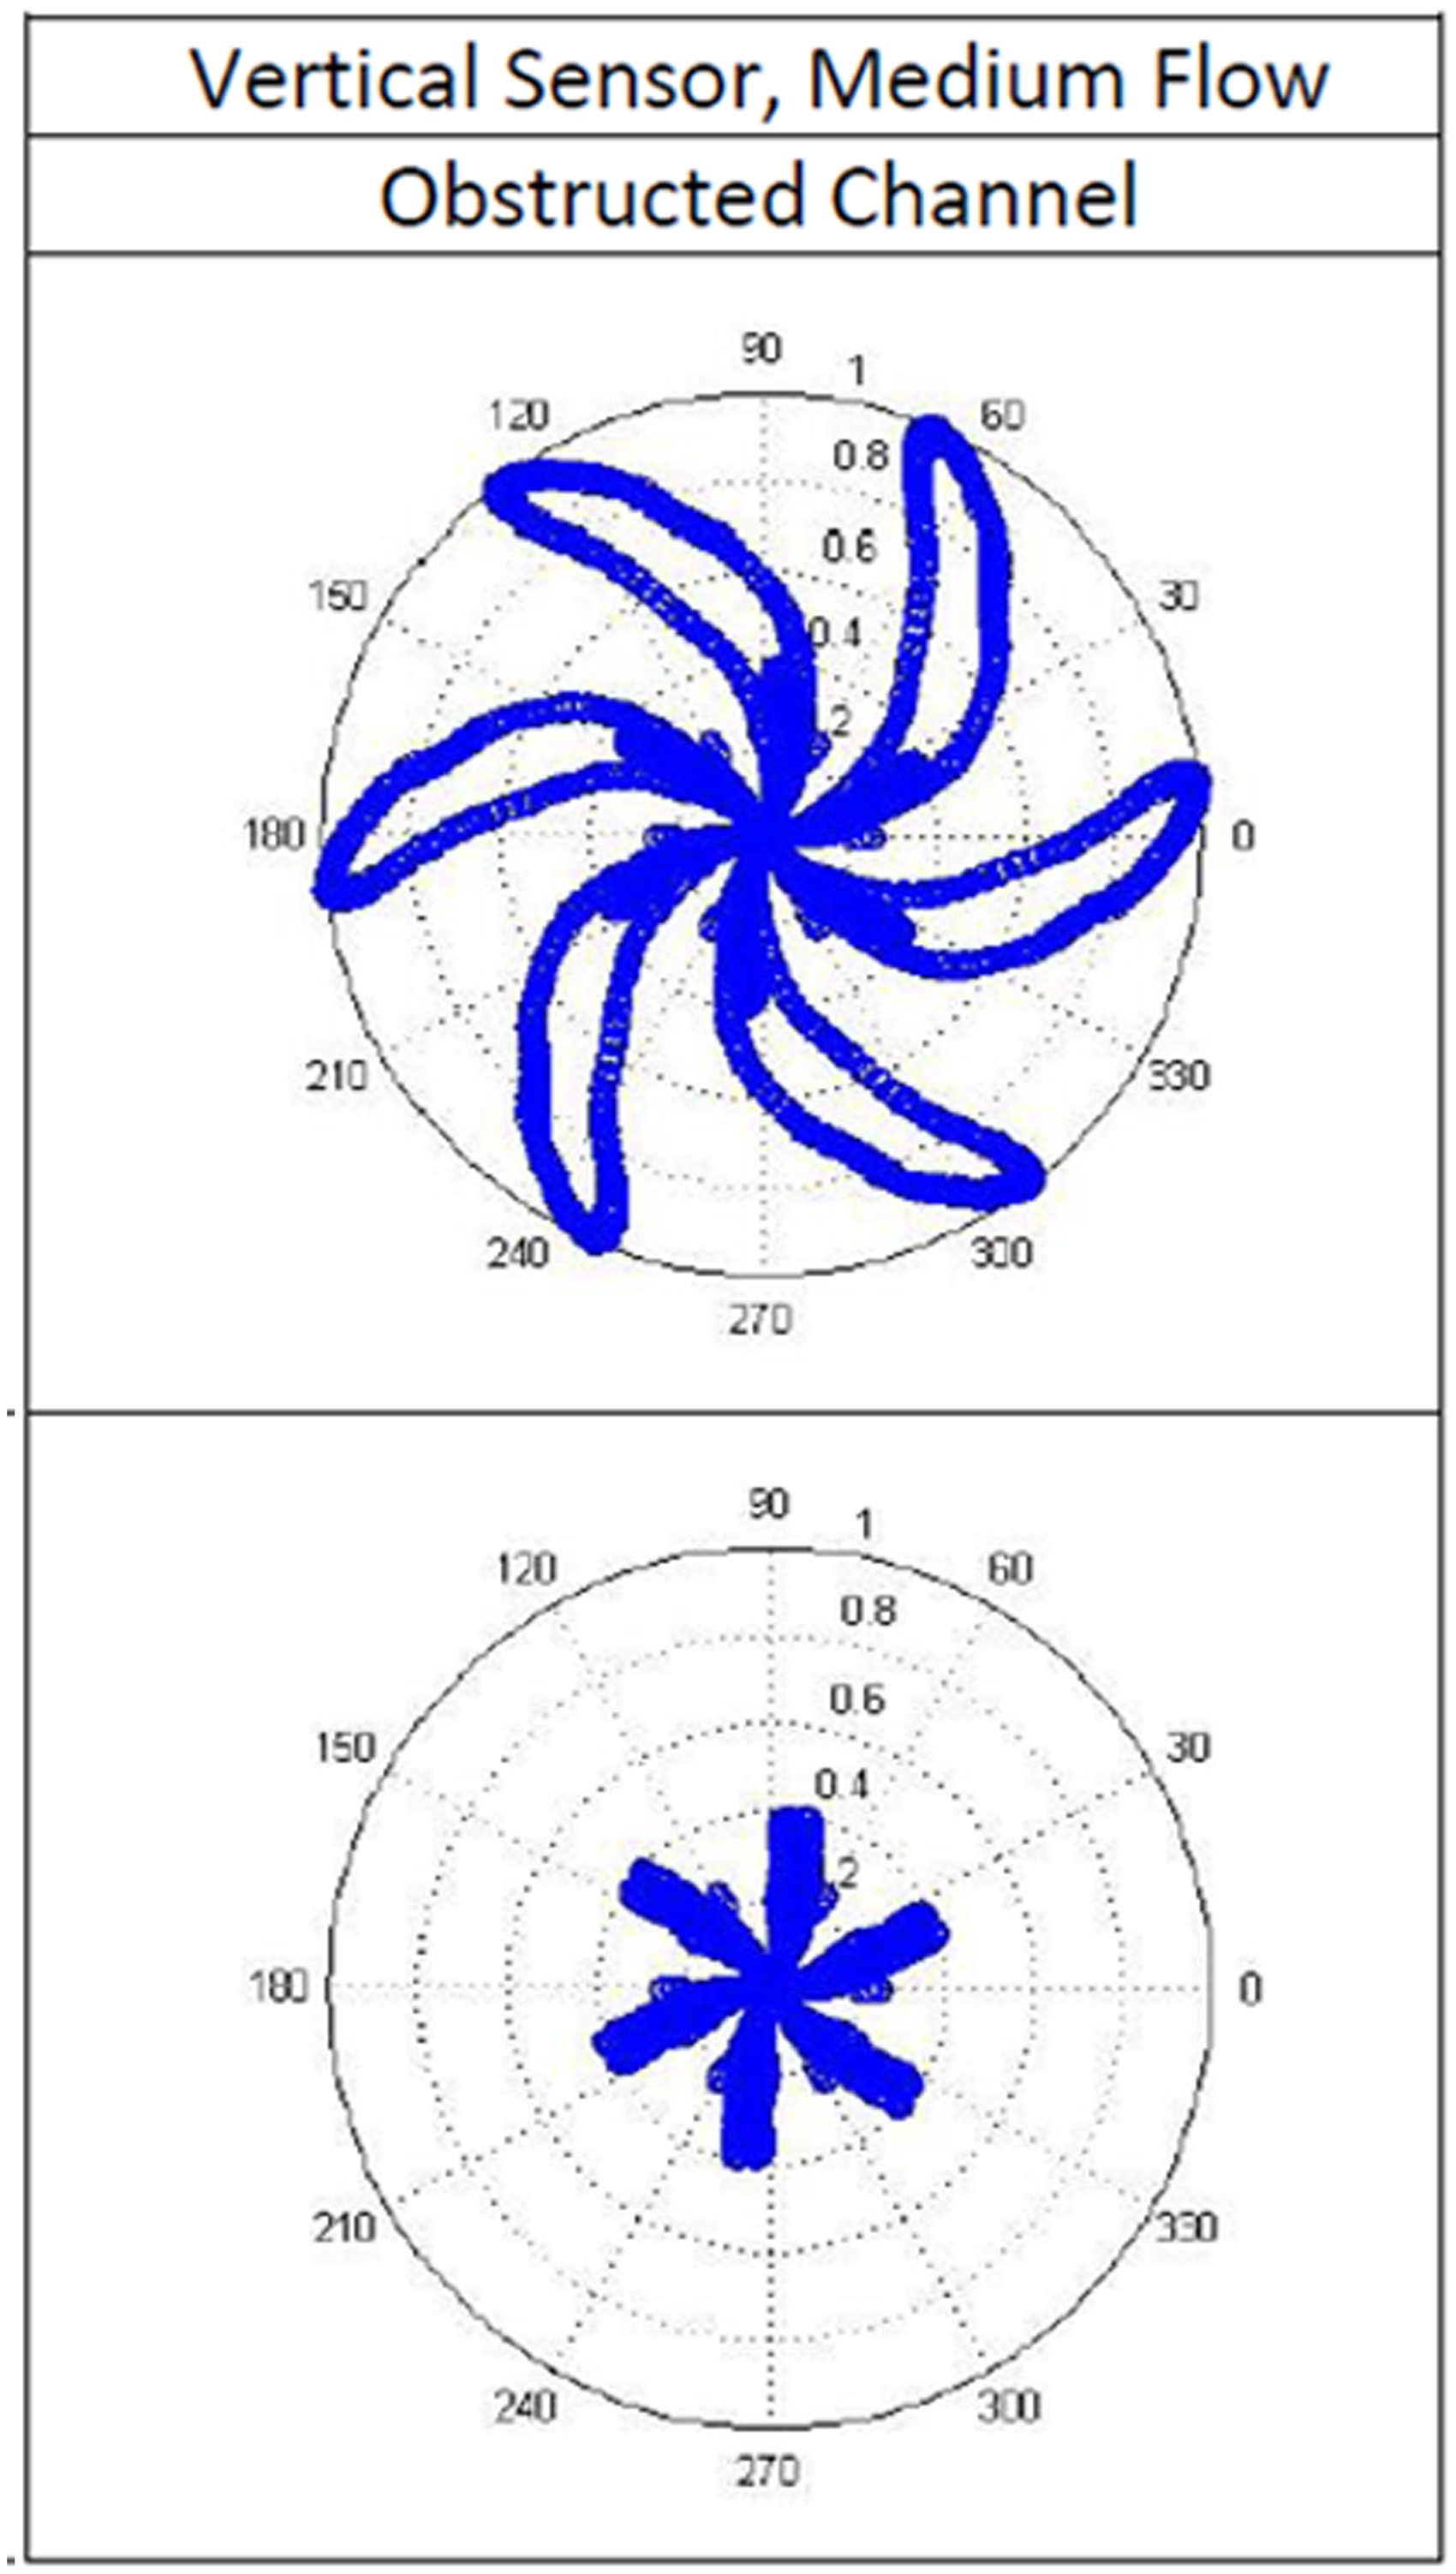
SDP with and without fingerprint.
Different options for the length of the lobes.
The machine operating condition will be determined by the acceleration value and by the orbit shape that shows the direction of the predominant acceleration. As regards SDP fingerprints, the dot absence inside the lobes indicates the presence of low frequency vibration components (considering low frequencies as being those lower than the rotating frequency in each operating condition: high flow 70 Hz, medium flow 75 Hz and low flow 80 Hz) so that, a greater dot amount inside the lobes will indicate the predominance of high frequencies.
On the other hand, it is necessary to consider the thickness of the lobes. This is associated with the vibration wave amplitude value of the sample, therefore the greater it is, the greater the lobe thickness will be.
Keeping these criteria in mind, a relationship could be observed between SDP and DOP diagrams. Figures 20 and 21 show the comparison for the two kinds of diagrams. Regarding the normal operating SDP diagram obtained by the vertical sensor, it denotes that the vibration wave amplitude values are low but even so they are higher than the ones acquired by the horizontal sensor and this is shown in the DOP diagram with an orbit that indicates a vertical acceleration value higher than the horizontal acceleration value (Figure 20).
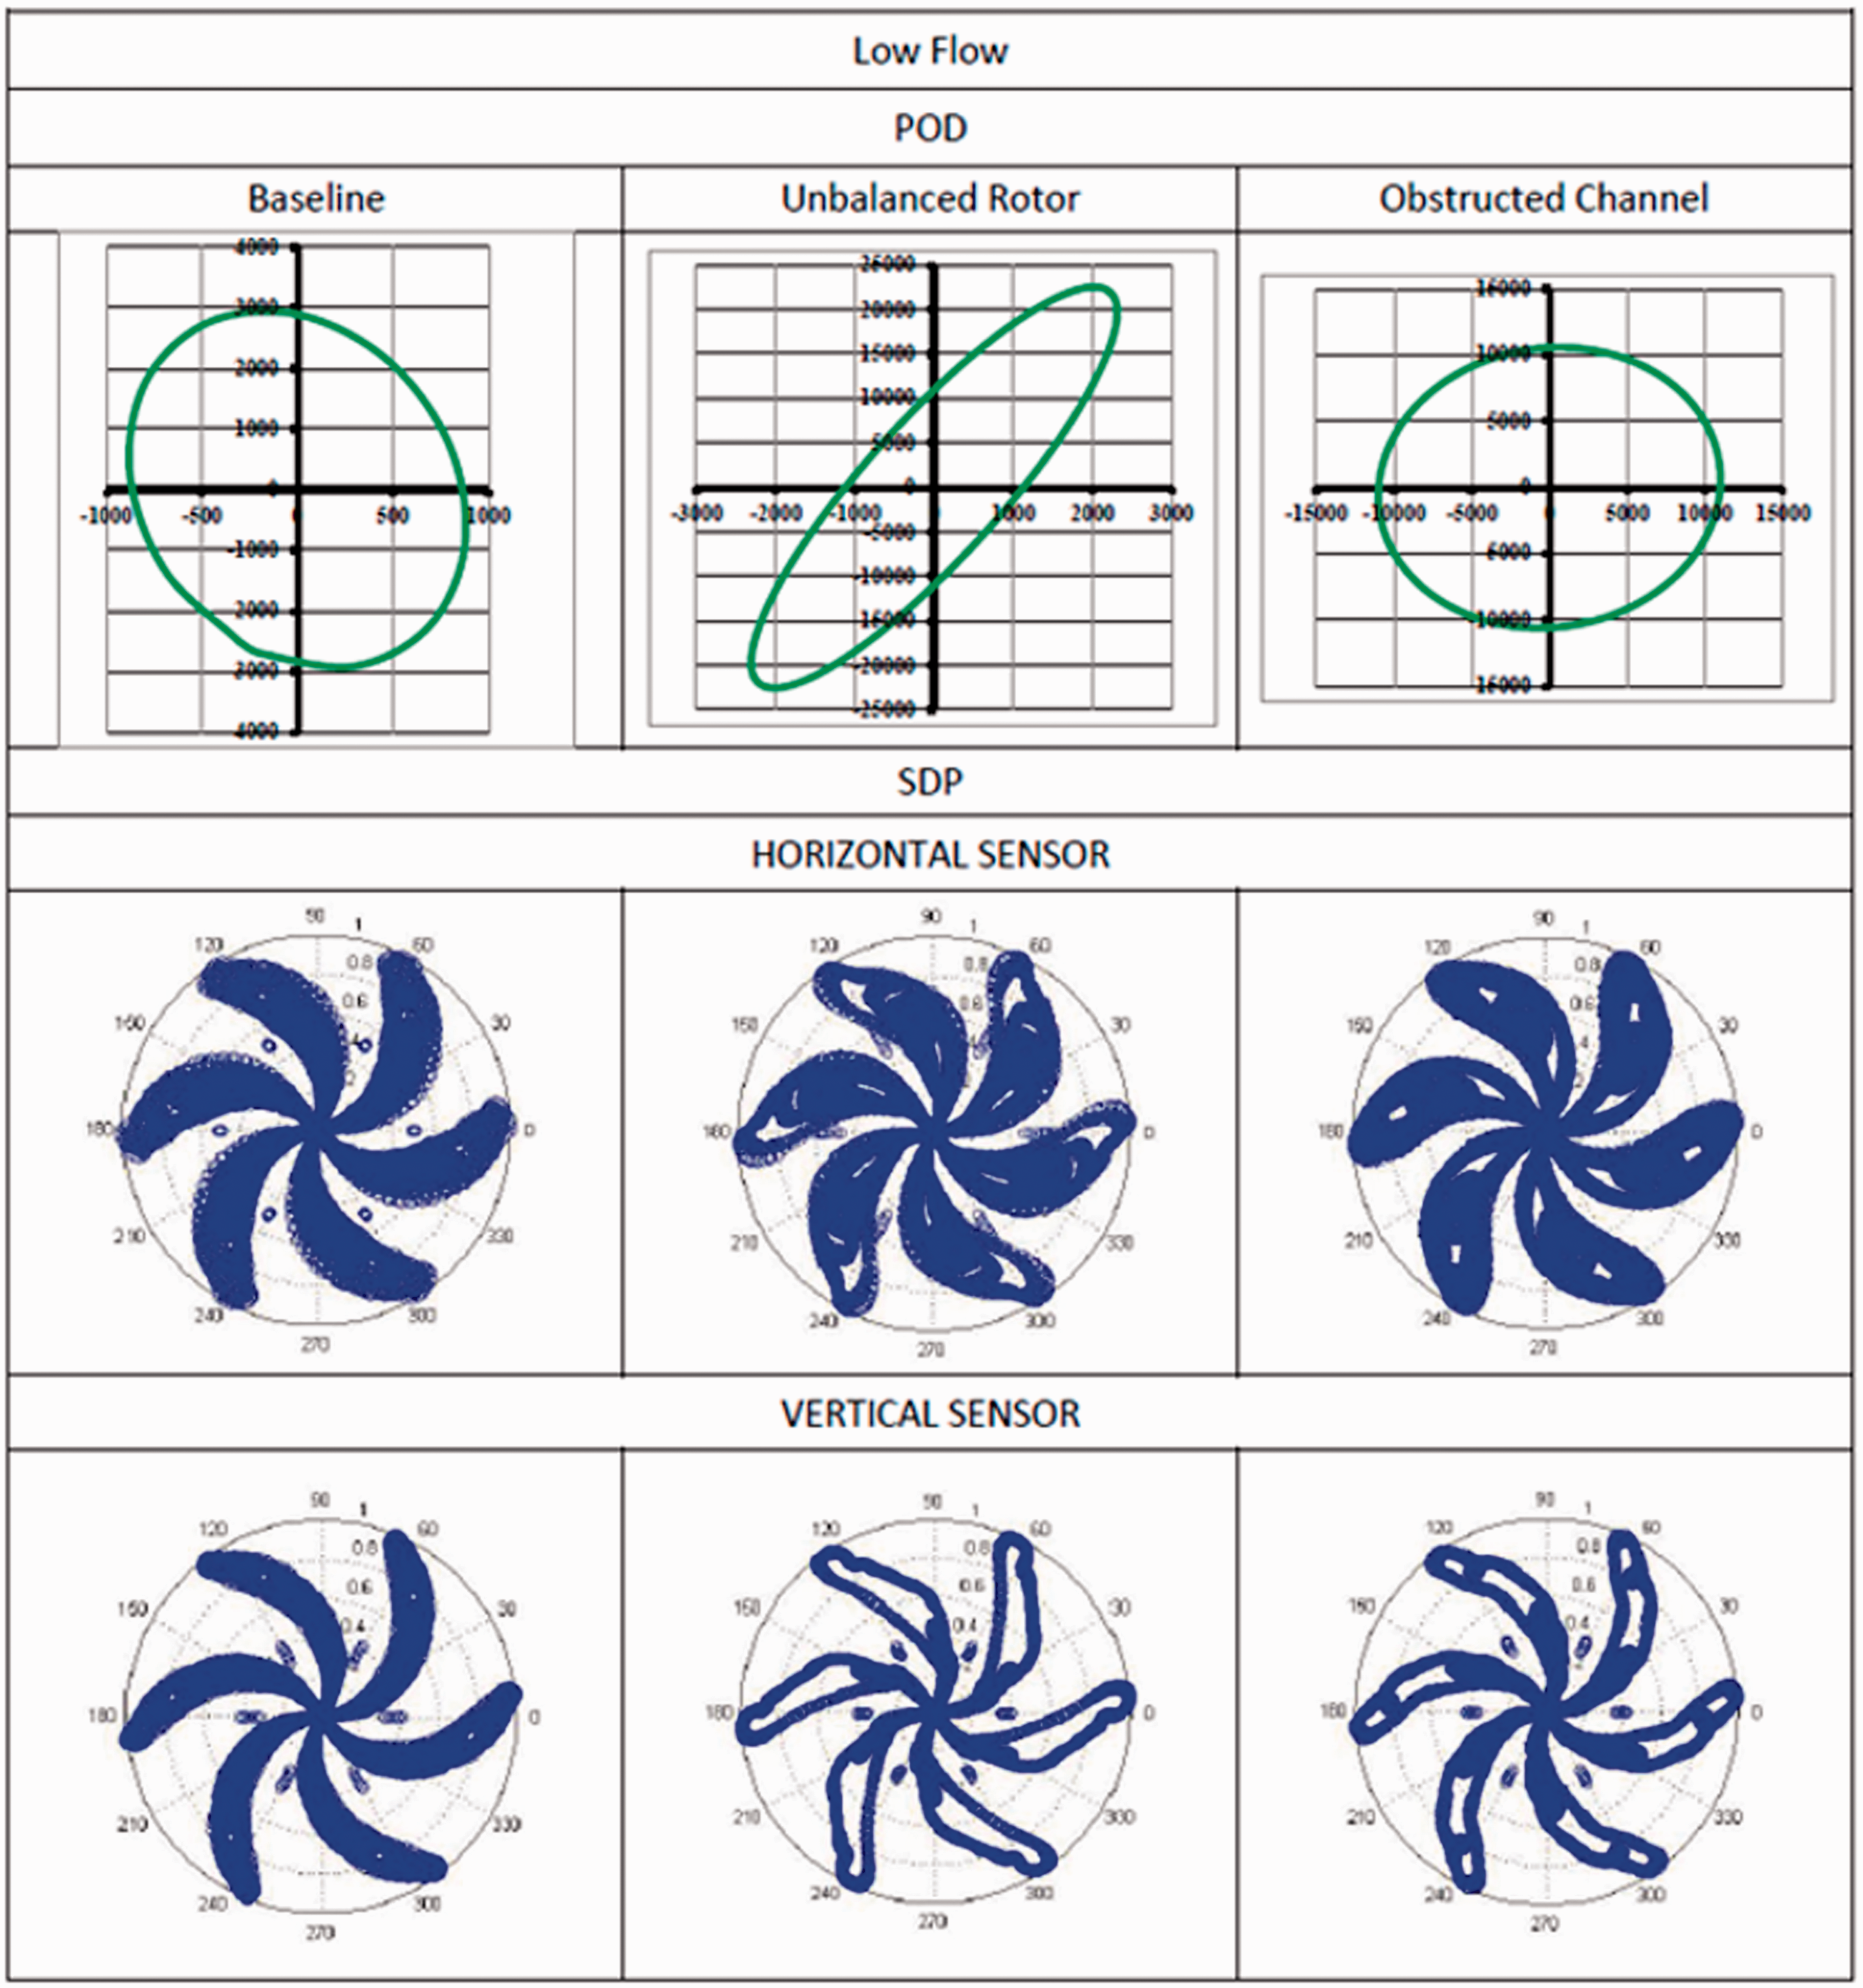
POD and SDP comparison for the low flow rate.
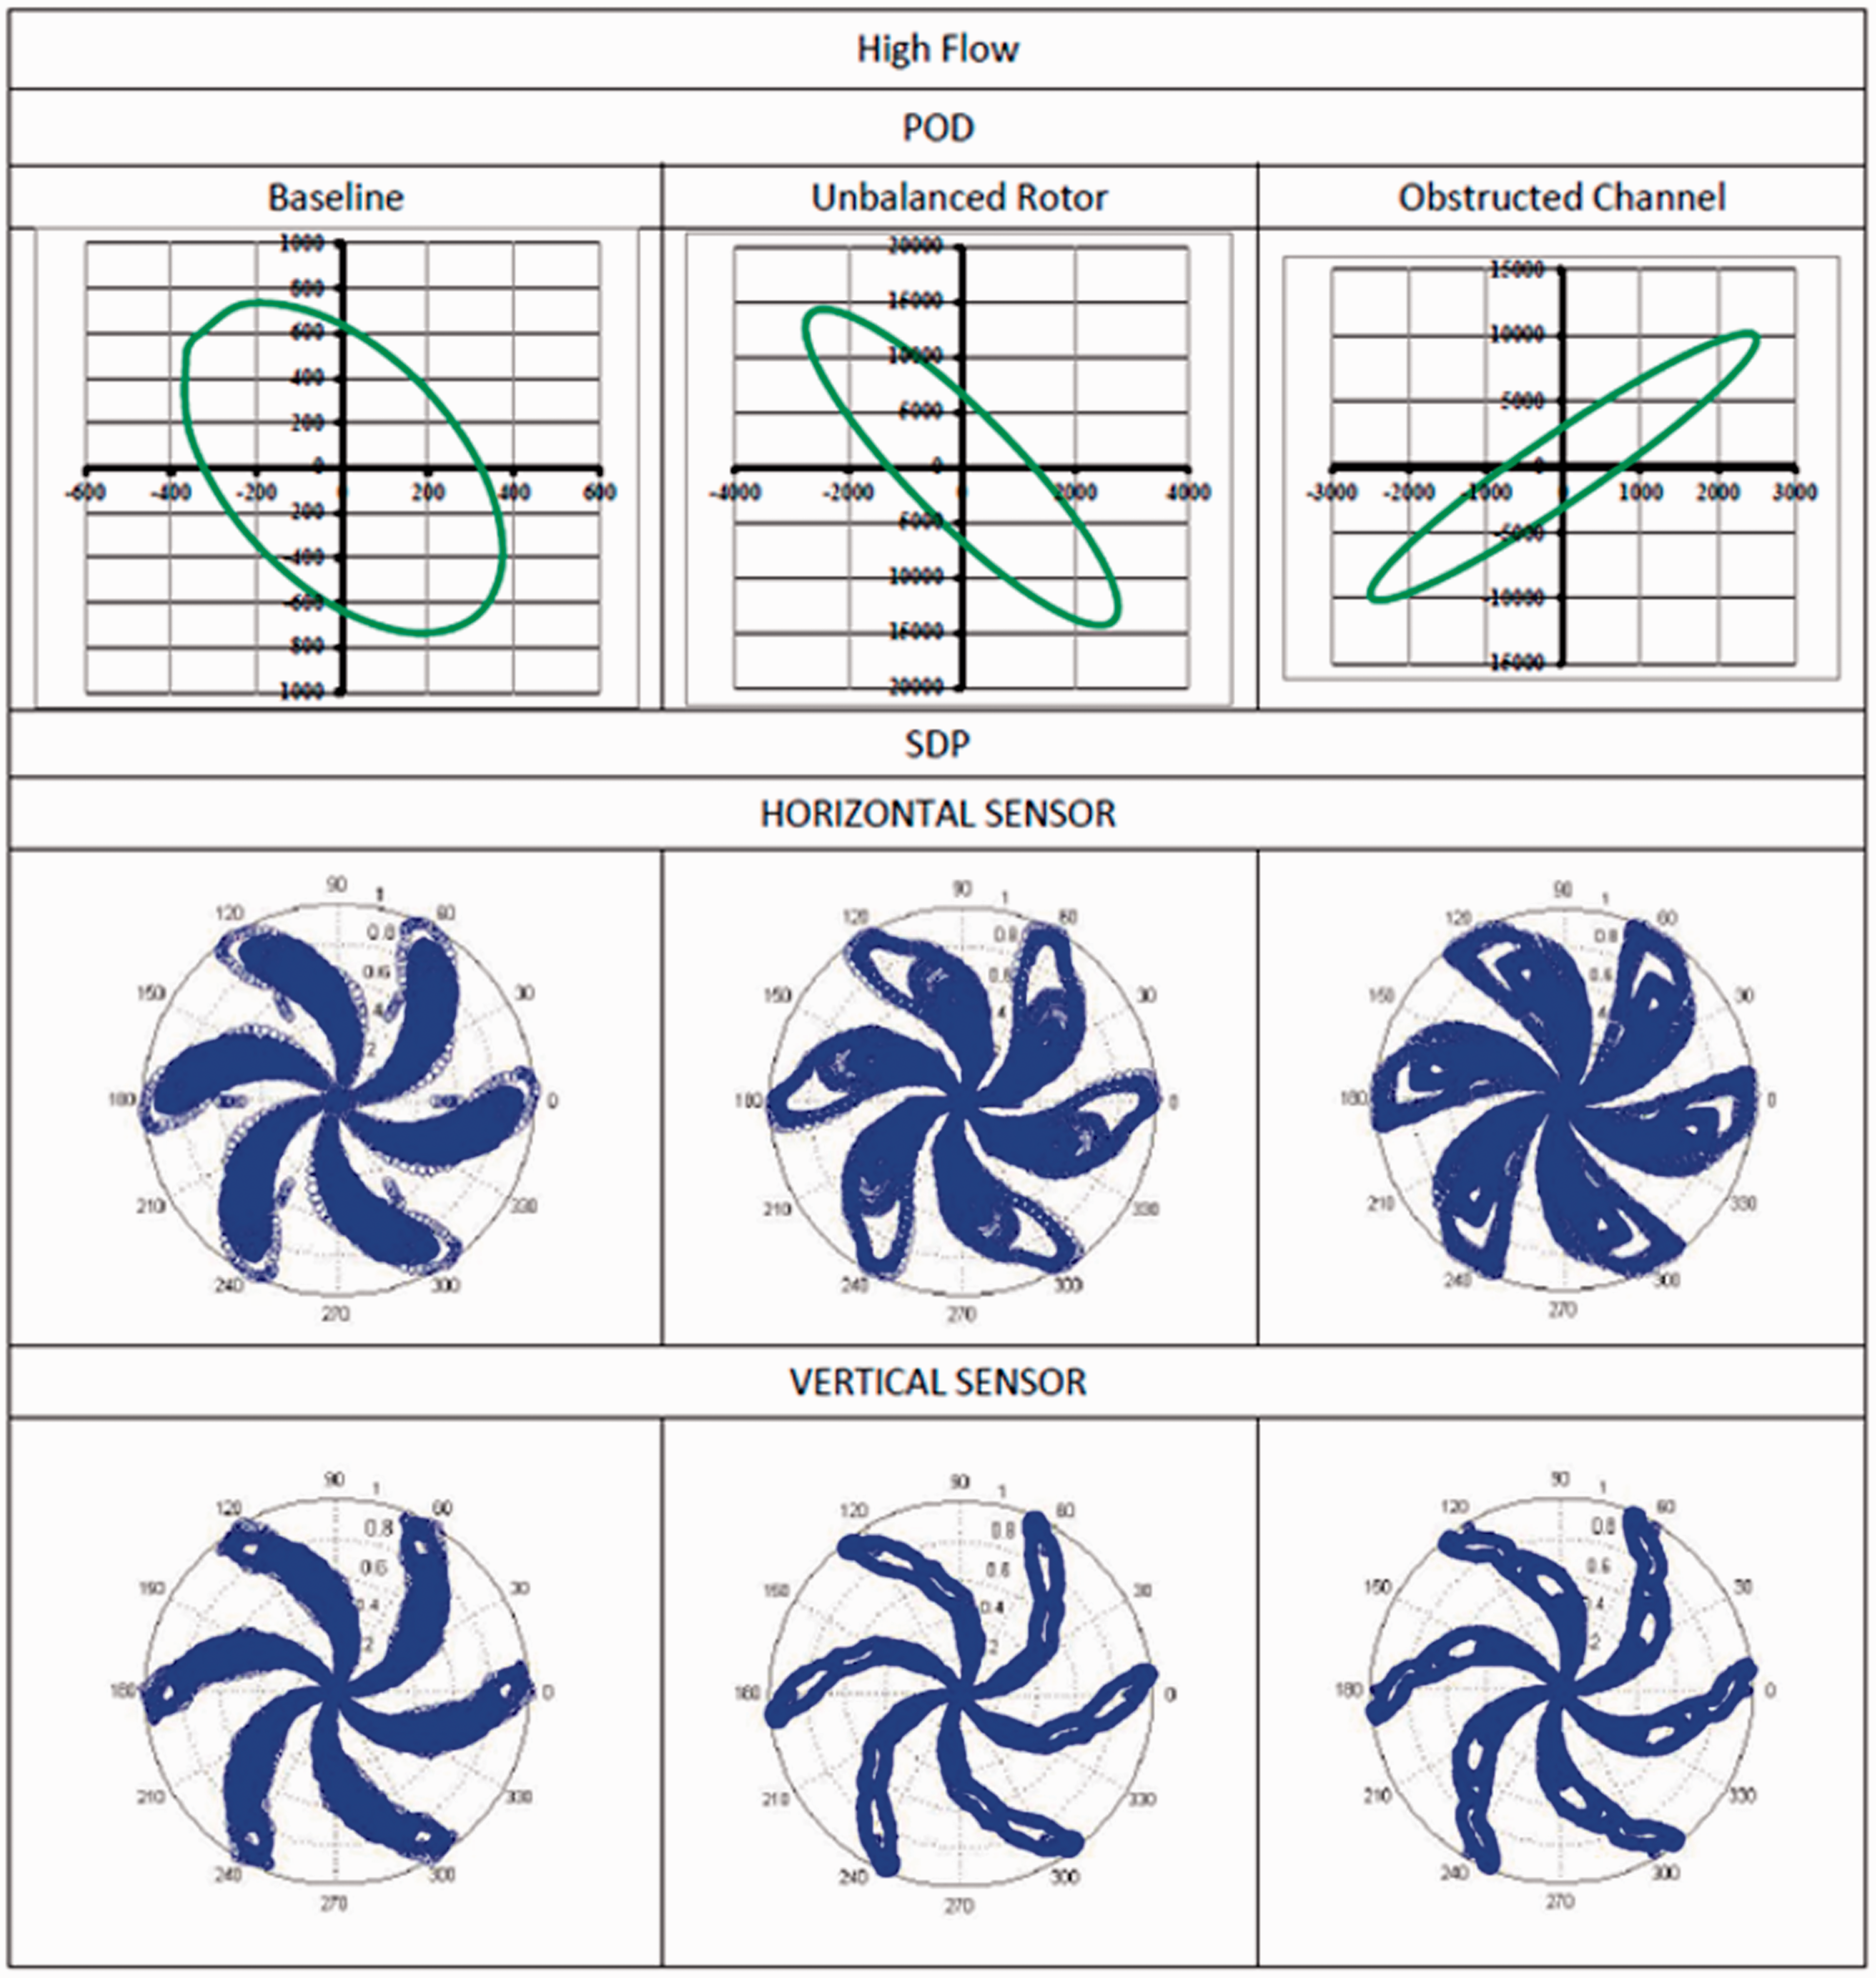
POD and SDP results for the high flow rate.
The low flow unbalanced rotor SDP diagram obtained by the vertical sensor data (Figure 20), provides wider lobes with a big region without dots in its center,which indicates that the predominant waves are of low frequency and of a considerable amplitude. This is reflected by the high acceleration value of the DOP diagram. To explain the horizontal acceleration value, it is necessary to study the horizontal sensor SDP diagram. The lobe thickness is similar to the normal operating lobes and have some regions without dots in its inside because the higher amplitude waves are equally distributed in the frequency spectrum, so the acceleration value of the DOP diagram is a little higher than the one for the normal operation.
From the obstructed channel SDP diagrams, it could be observed that the vertical and horizontal accelerations have a very similar value, as shown in the DOP diagram, since the inside of the horizontal sensor SDP lobes are the negative of the values of the vertical sensor.
For the other off-design condition (Figure 21), the results of both techniques also become complementary. Vertical sensor data again provide wider lobes with a big region without dots in its center, indicating that the predominant waves are of low frequency and of considerable amplitude. This is also reflected by the high acceleration value of the DOP diagram. For the horizontal sensor, lobe thickness is also of the same range as for the normal operation and higher regions without dots appear in the diagrams.
Most relevant frequencies observed in the study.
Conclusions
The dynamic effects of the flow in a centrifugal fan have been studied by the experimental recording of vibration signals, following two perpendicular directions, the horizontal and vertical. Considering the experiments, two well-established fault diagnosis protocols, namely the POD and SDP techniques were considered in order to describe the fan operation and characterize it.
The main conclusions of the experiments and POD analysis indicate that the highest vibration to be found is 2.5 times the gravitational acceleration, and it happens for the unbalanced of the impeller fault. The lower vibration is always for the baseline operation at any flow rate, with a maximum of 0.3 times the gravitational acceleration. The obstructed channel configuration shows a quite different behavior in comparison with the baseline and the unbalance of the impeller. A minimum of vibrations is found for the baseline operation and relatively high flow rates. At off-design flow rates, the unbalanced impeller fault results in higher accelerations, while for the nominal flow operation, both studied faults produce equivalent acceleration values.
The SDP technique allows for incipient fan failure detection so, when the SDP fingerprint obtained from the vibration analysis is different from the normal operating SDP, it will be possible to identify if it will produce a mechanical failure or not. The regions without dots inside the SDP fingerprint lobes denote the presence of low frequency vibrational components and the lobes thickness increases with the vibration wave amplitude, that is, with the acceleration value.
The normal operating SDP lobes do not present regions without dots and they are narrower than the lobes for the other operating conditions due to the low value of the accelerations that appear in this case.
Overall, the SDP technique is simpler than the POD technique. In addition, the SDP diagrams obtained by the horizontal and vertical sensors allow an approximation of the POD orbit form by observing the lobes shape, because the greater their thickness, the greater the acceleration value. Nevertheless, to know the horizontal and vertical acceleration values, it would be necessary to apply the POD technique. A lower data treatment is required for the SDP method and the search of the characteristic frequencies is not necessary, this technique is a fully visual one.
Considering the global overview, the study preludes a maintenance method for small centrifugal fans. The main fault diagnosis study performed gives already an idea of the main working range parameters and the possible fault detection procedures. Finally, it can be stated that the studied techniques do extend the state of the art for the considered machine.
Footnotes
Acknowledgements
The authors acknowledge the constant cooperation and permission for the publication of the article, provided by Hispacold Internacional, S.A. Mainly, the help of Juan Bernal-Cantón must be recognized.
Declaration of conflicting interests
The author(s) declared no potential conflicts of interest with respect to the research, authorship, and/or publication of this article.
Funding
The author(s) disclosed receipt of the following financial support for the research, authorship, and/or publication of this article: The financial support from the “Ministerio de Ciencia e Innovación” (under Projects numbers TRA2007-62708, DPI2011-25419, ENE2017-89965-P and “Tecnologías ecológicas para el transporte Urbano, ecoTRANS” (CDTI) is also gratefully acknowledged. The financial support of the Instituto Universitario de Tecnología Industrial (IUTA), through projects SV-17-GIJON-1-07 and SV-18-GIJON-1-04 has also helped in the final stages of the present study.