
Abstract
A numerical analysis method for wind-induced response of structures is presented which is based on the pseudo-excitation method to significantly reduce the computational complexity while preserving accuracy. Original pseudo-excitation method was developed suitable for adoption by combining an effective computational fluid dynamic method which can be used to replace wind tunnel tests when finding important aerodynamic parameters. Two problems investigated are gust responses of a composite wing and buffeting vibration responses of the Tsing Ma Bridge. Atmospheric turbulence effects are modeled by either k–ω shear stress transport or detached eddy simulation. The power spectral responses and variances of the wing are computed by employing the Dryden atmospheric turbulence spectrum and the computed values of the local stress standard deviation of the Tsing Ma Bridge are compared with experimental values. The simulation results demonstrate that the proposed method can provide highly efficient numerical analysis of two kinds of wind-induced responses of structures and hence has significant benefits for wind-induced vibration engineering.
Keywords
Introduction
The increasing awareness of the harmful effect of wind-induced vibration on structures has led to extensive research. Such vibration of tall/slender structures may cause structural failure, discomfort to occupants, or malfunction of equipment. Hence determining wind-induced structural dynamic responses is important. It is very common to deal with wind loads as random functions of time and space, e.g. Sivakumar and Haran 1 presented aircraft random vibration analysis with random runway mathematical profiles.
Traditional structural random vibration analysis methods are widely adopted for response prediction with the two most famous being the complete quadratic combination (CQC) and square root of the sum of squares (SRSS) methods. The former is theoretically accurate but involves heavy computation and the latter is only effective for structures for which all modes have small damping ratios. Also multiexcitation problem has been a challenging research difficulty. 2 Lin 3 presented a pseudo-excitation method (PEM) (initially called a fast CQC algorithm) to deal with dynamic responses of structures subjected to random seismic excitation. PEM is an accurate high-speed computation method which can be employed to analyze single- or multi-excitation random seismic responses which can be stationary or nonstationary.4,5 In this method, the determination of random response of a structure is converted into the determination of response of the structure to a series of harmonic loads, i.e. the so-called pseudo excitations.
Wind tunnel tests were always employed to predict the wind-induced structural responses. Useful aerodynamic parameters (e.g. aerodynamic force coefficients and flutter derivatives) were also important data which could be found through experiments. 6 Significant aeroelastic progress was achieved through wind tunnel tests, beginning with Scanlan and Tomko, 6 e.g. Ge et al. 7 investigated aerodynamic stabilization of central stabilizers for box girder suspension bridges. Over recent decades computational fluid dynamics (CFD) has been extensively used in solving fluid–structure interaction (FSI) problem due to advances in computer power and algorithms.8,9 CFD aeroelastic analysis of slender structures involves the difficulties of how to account both for FSI and for turbulent flow. Zhao and Li 10 investigated coupling oscillations due to transient energy growth of flow disturbances with a simplified model based on Dirichlet boundary conditions, which developed advanced air flow analysis based on the usage of novel energy methods.11,12 Bai et al.13,14 proposed a numerical method for aerodynamic analysis of airfoil or bluff bodies. The FSI problem was solved by a block-iterative coupling method and different turbulence models were tested. Two-dimensional or three-dimensional (3D) CFD modeling was adopted to find aerodynamic parameters efficiently.
Evaluating gust buffeting response has been a main research topic in structure vibration for several decades. At the beginning, simplified algorithm was proposed. Solari 15 proposed a gust effect factor technique to determine the maximum displacements and internal forces of vertical structures subjected to gust-excited vibrations and investigated the limit value of this technique. Based on simplified algorithms and actual statistical excitations, gust response predictions continued to be implemented; Chaya et al. 16 investigated the coupled gust response in nonstationary wind.
An accurate and efficient structural dynamic analysis method has significant potential while investigating the gust-excited vibration of structures, because it can reduce the dependence on wind tunnel tests. The present work mainly focuses on proposing a valuable numerical method based on PEM and CFD to gust response analysis of a composite wing and to buffeting vibration response analysis of long-span bridges. The power spectral responses and variances of the wing are computed with a kind of atmospheric turbulence spectrum, whereas the computed values of the local stress standard deviation of the Tsing Ma Bridge are compared to the experimental values. During the computation process, turbulence effects are included through
PEM for wind-induced vibration analysis
For complicated structures, wind-induced response computations may require the use of several modes of vibration, rather than just the first mode which suffices for most common structures. Use of the classical random-vibration-based mode superposition approach can be difficult in such cases, whereas PEM converts such problems to the determination of the response of the structure to a series of harmonic loads, i.e. the so-called pseudo excitations.
Nonstationary random processes are generally of short duration and their basic characteristic is that the statistical properties vary significantly with time. The basic principle of PEM for nonstationary random vibration analyses is illustrated by Figure 15 as follows.
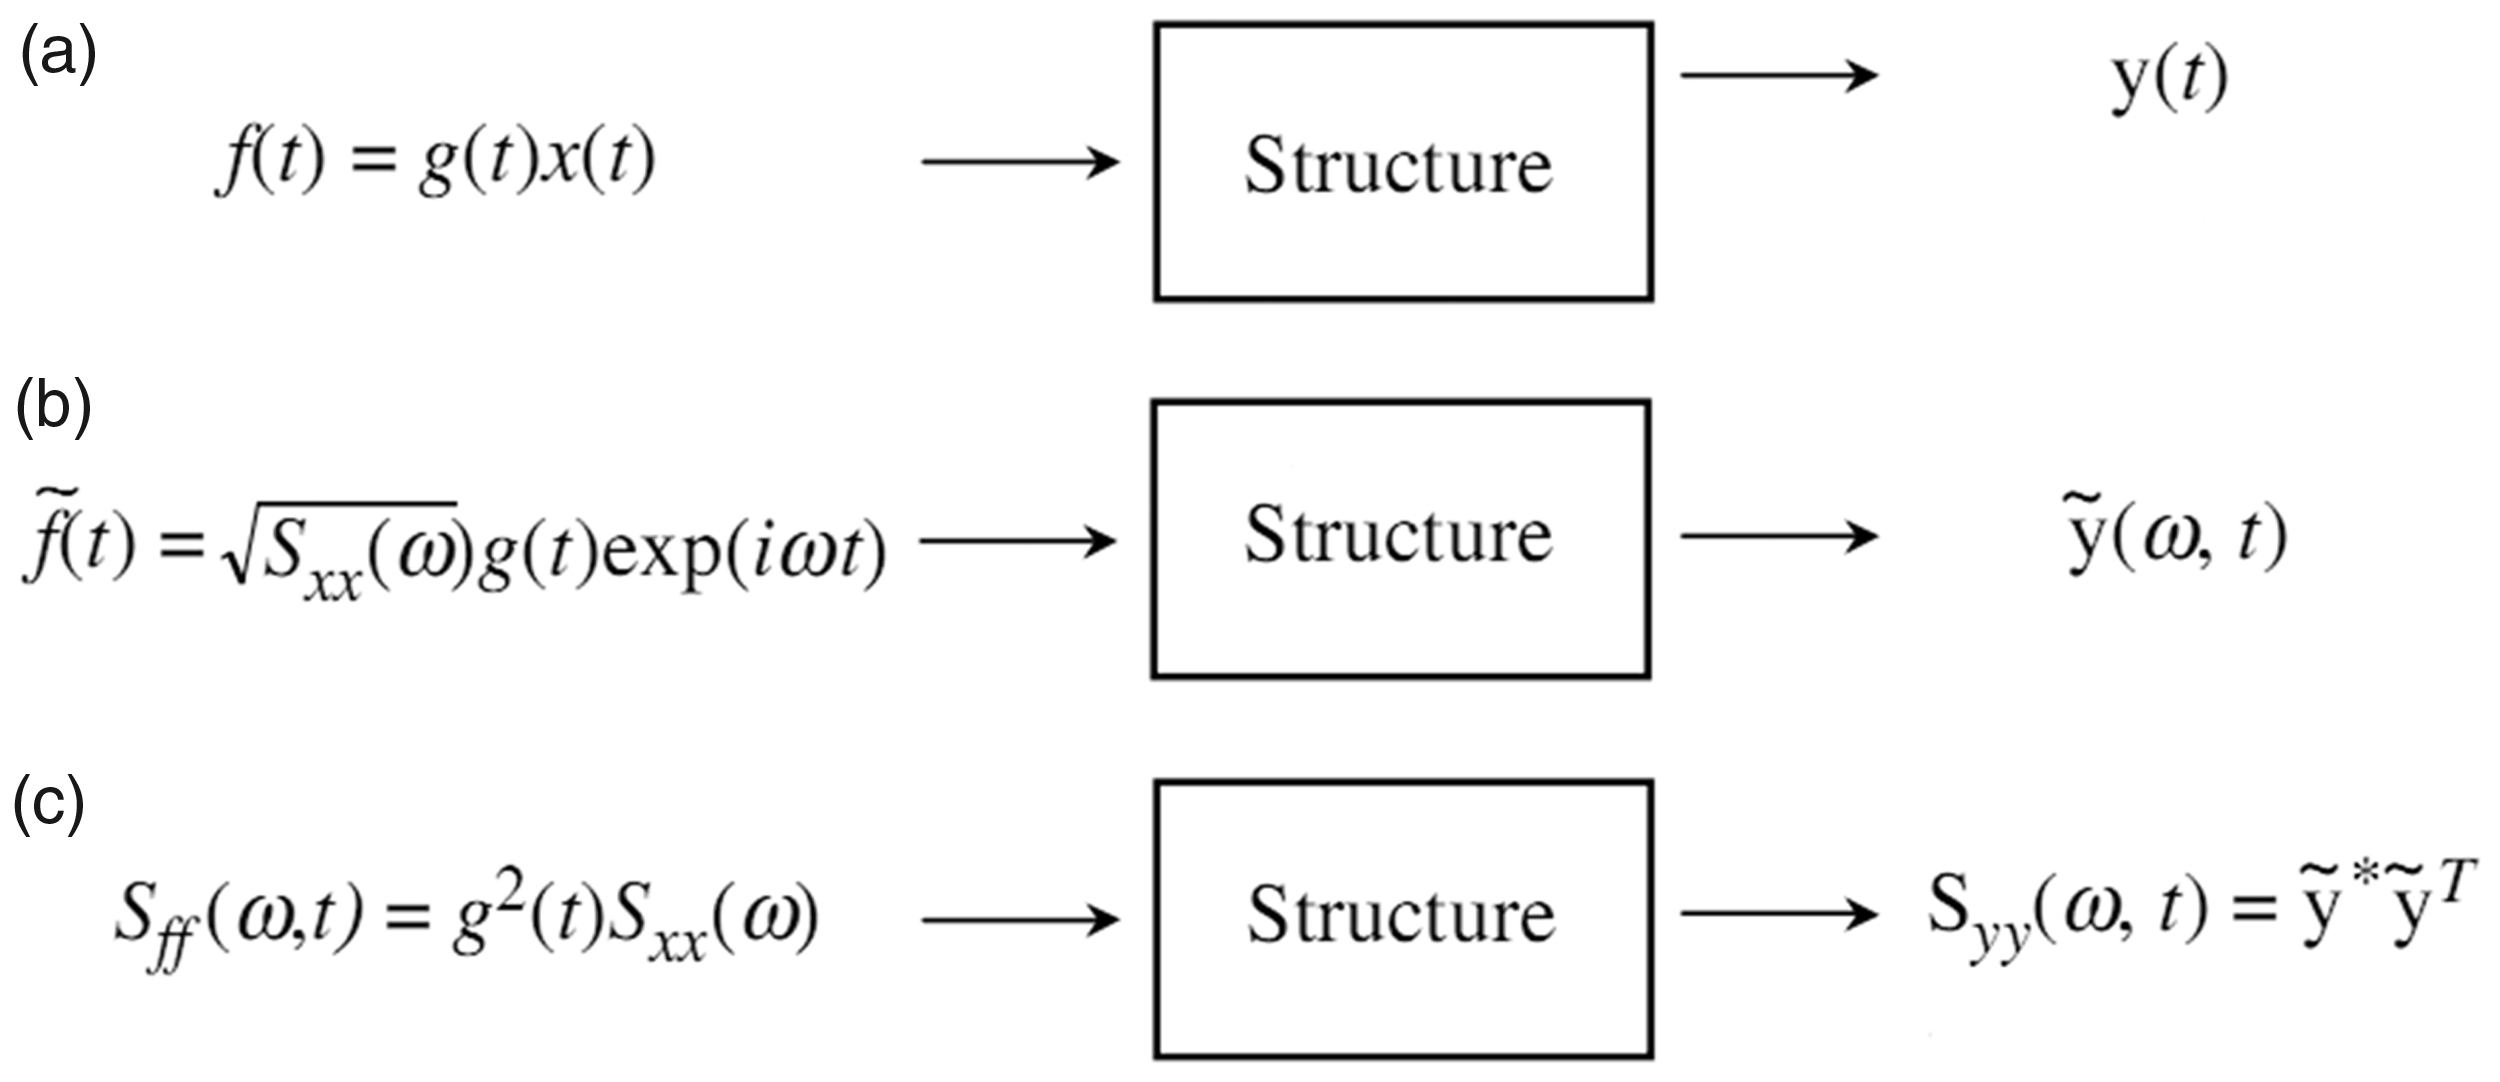
Basic principle of pseudo-excitation method (nonstationary analysis).
Consider a structure subjected to an evolutionary random excitation


In order to compute the PSD functions of various linear responses caused by f(t), a form of the pseudo (denoted by ∼ below) excitation can be given as

Now suppose that

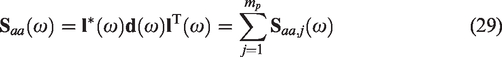
It has been found that when CQC, SRSS, and PEM are used to calculate power spectral responses, N-dimensional vectors are multiplied, respectively,
Numerical algorithm for aerodynamic parameter computation
A 2D flat plate in incompressible flow is taken as an example (see Figure 2). Here U is the flow velocity,

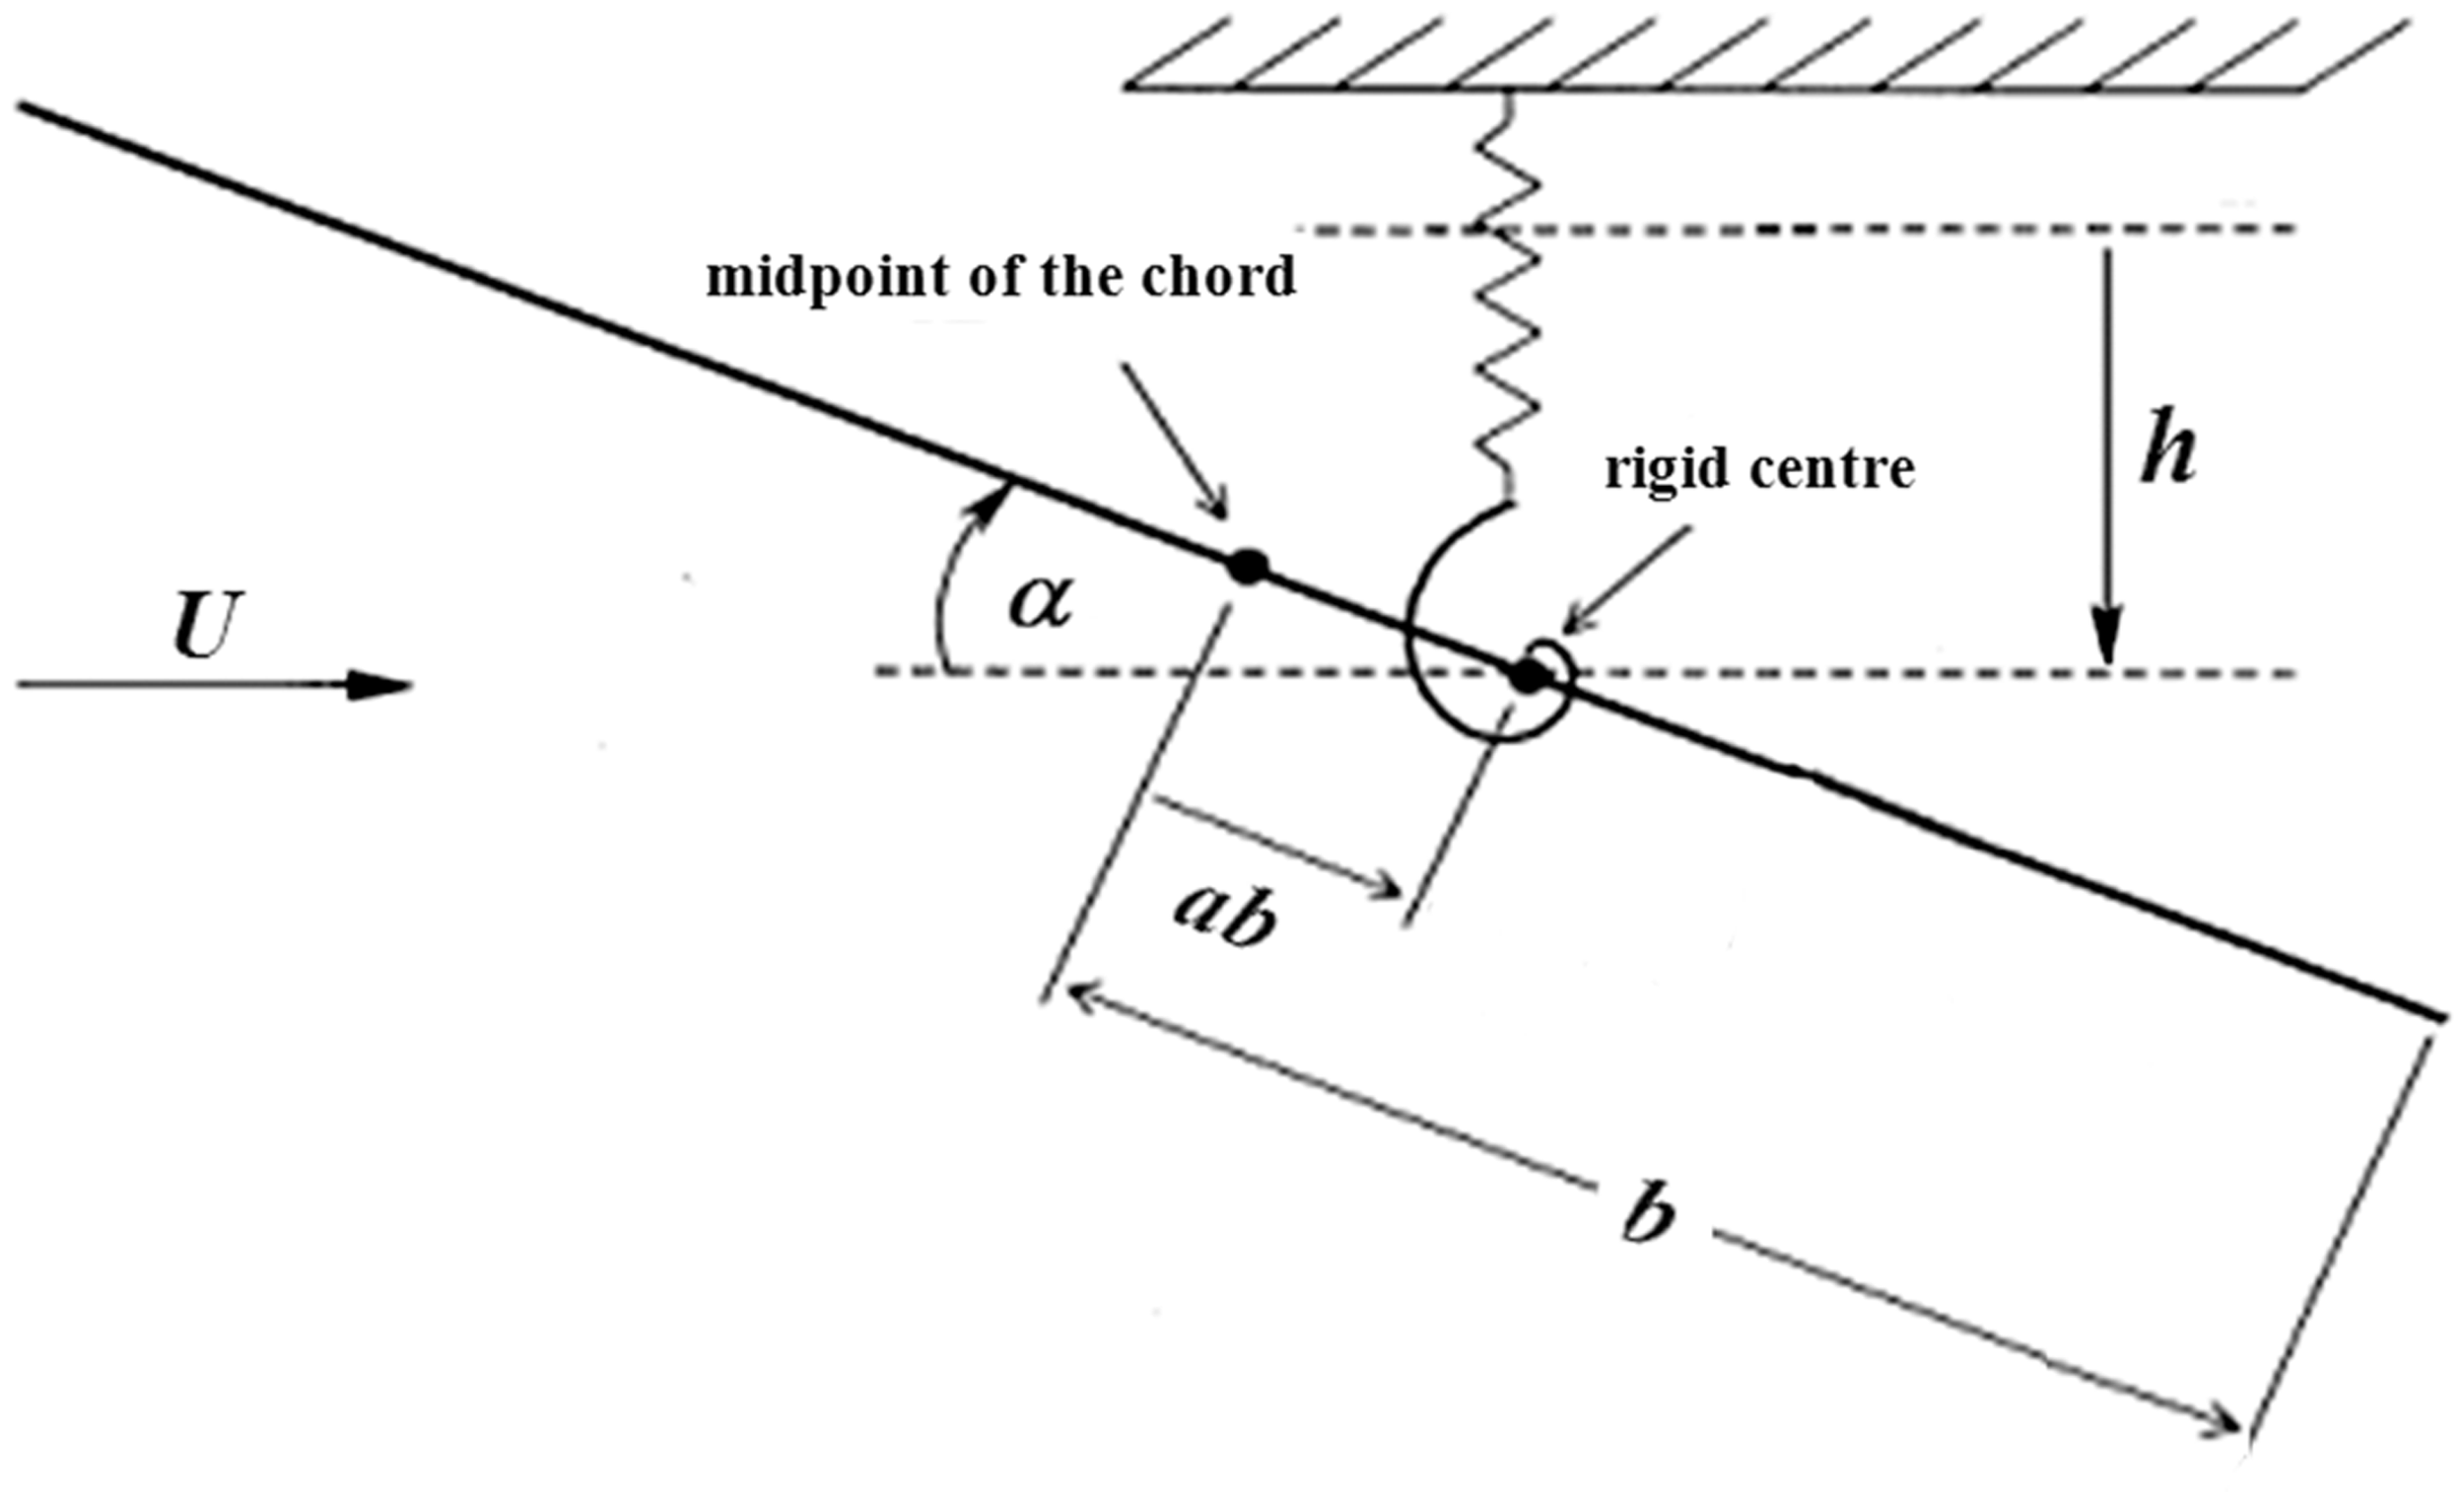
Schematic of the 2D thin plate.
For the same 2D flat plate of Figure 2, Scanlan and Tomko
6
proposed the expansions


To get the six flutter derivatives, a CFD method based on block-iterative coupling and turbulence modeling is used in this paper. 13 Wind–structure interaction effects can be included during the prediction process by using this method. Solvers based on this method were implemented by existing CFD and structural analysis codes, i.e. a CFD code CFX and a FEM code JIFEX (i.e. it was developed by Dalian University of Technology). 19
Gust analysis of a composite wing
The structure
Composite materials have many advantages in industrial aerospace applications, e.g. high strength, high stiffness, long fatigue life, and good damping characteristics. So the laminated NACA0012 (i.e. NACA represents National Advisory Committee for Aeronautics) wing structure consisting of composite materials is chosen in this paper (see Figure 3). The total span thickness (i.e. perpendicular to the section shown in Figure 3) of the wing is 5 m, the thickness of each layer is 0.02 m, and the wing is fixed at its root. The material constants of the laminate are longitudinal elastic modulus
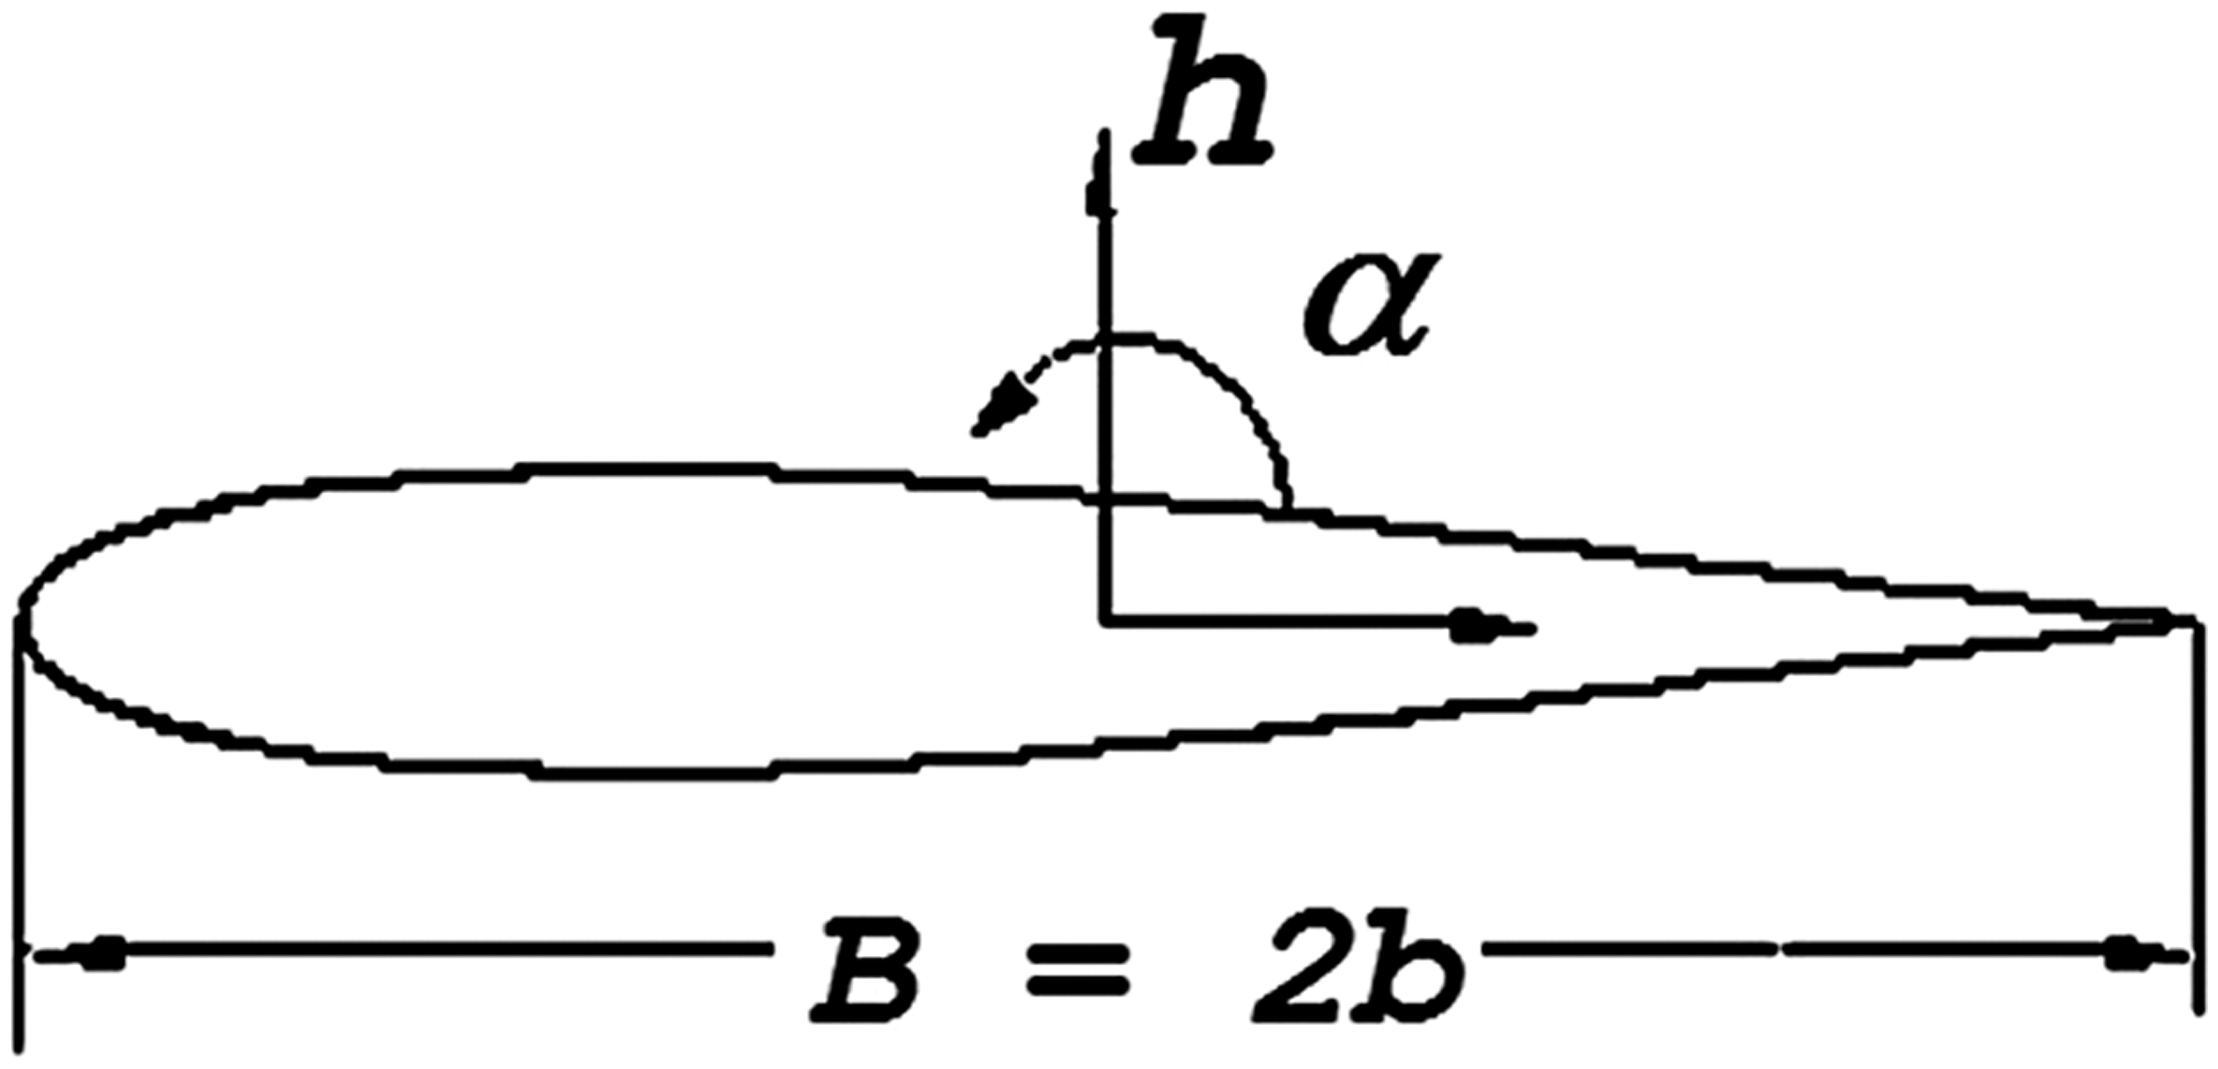
The classical NACA0012 airfoil model.
Analysis method by developing PEM
When flying in a vertical simple harmonic gust wind, the wing vibrates harmonically. So equations (6) and (7) can be rewritten as

Considering the case in which the rigid center and the midpoint of the chord coincide, the wing has two degrees of freedom, i.e. vertical translation and rotation about its center. The equation of motion of the wing after discretization can be written as


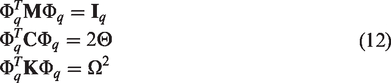


Rewriting the pseudo excitation
Then, equation (12) can be solved to give


With the initial conditions
With the presented numerical method, aerodynamic forces due to the harmonic vertical and twist vibration can be converted into the aerodynamic damping and stiffness matrices of the dynamic equations, and the unsteady aerodynamic forces due to the harmonic gust wind can be taken as the external excitation to be applied. Then the random atmosphere turbulence excitation can be replaced by deterministic harmonic vertical gust wind excitation based on PEM, which enables the response PSD and variance of the wing to be found.
Atmosphere turbulence spectrum and corresponding numerical modeling
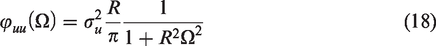
The Dryden and Von Karman models are the two main representations of the atmosphere turbulence spectrum
20
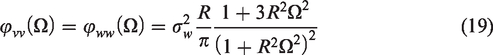
and the former is adopted in this paper because of its simplicity of expression and its convenient computation. Its vertical and transverse spectrum functions are, respectively

Unsteady Reynolds-averaged Navier–Stokes models are popular for CFD simulations. In this paper, the k–ω SST model is employed for CFD simulations, because it allows direct integration through the boundary layer and also benchmark testing shows that it is particularly superior for wall layer simulation. 21
Numerical wing results comparison between CFD simulation and Theodorsen theory
With a mesh generation method proposed by Bai et al.,
13
2D CFD modeling of the airfoil of the wing is given in Figure 4. The mesh region was divided into three parts: rigid, wake, and buffer region. It was cylindrical and centered on the airfoil and has radius
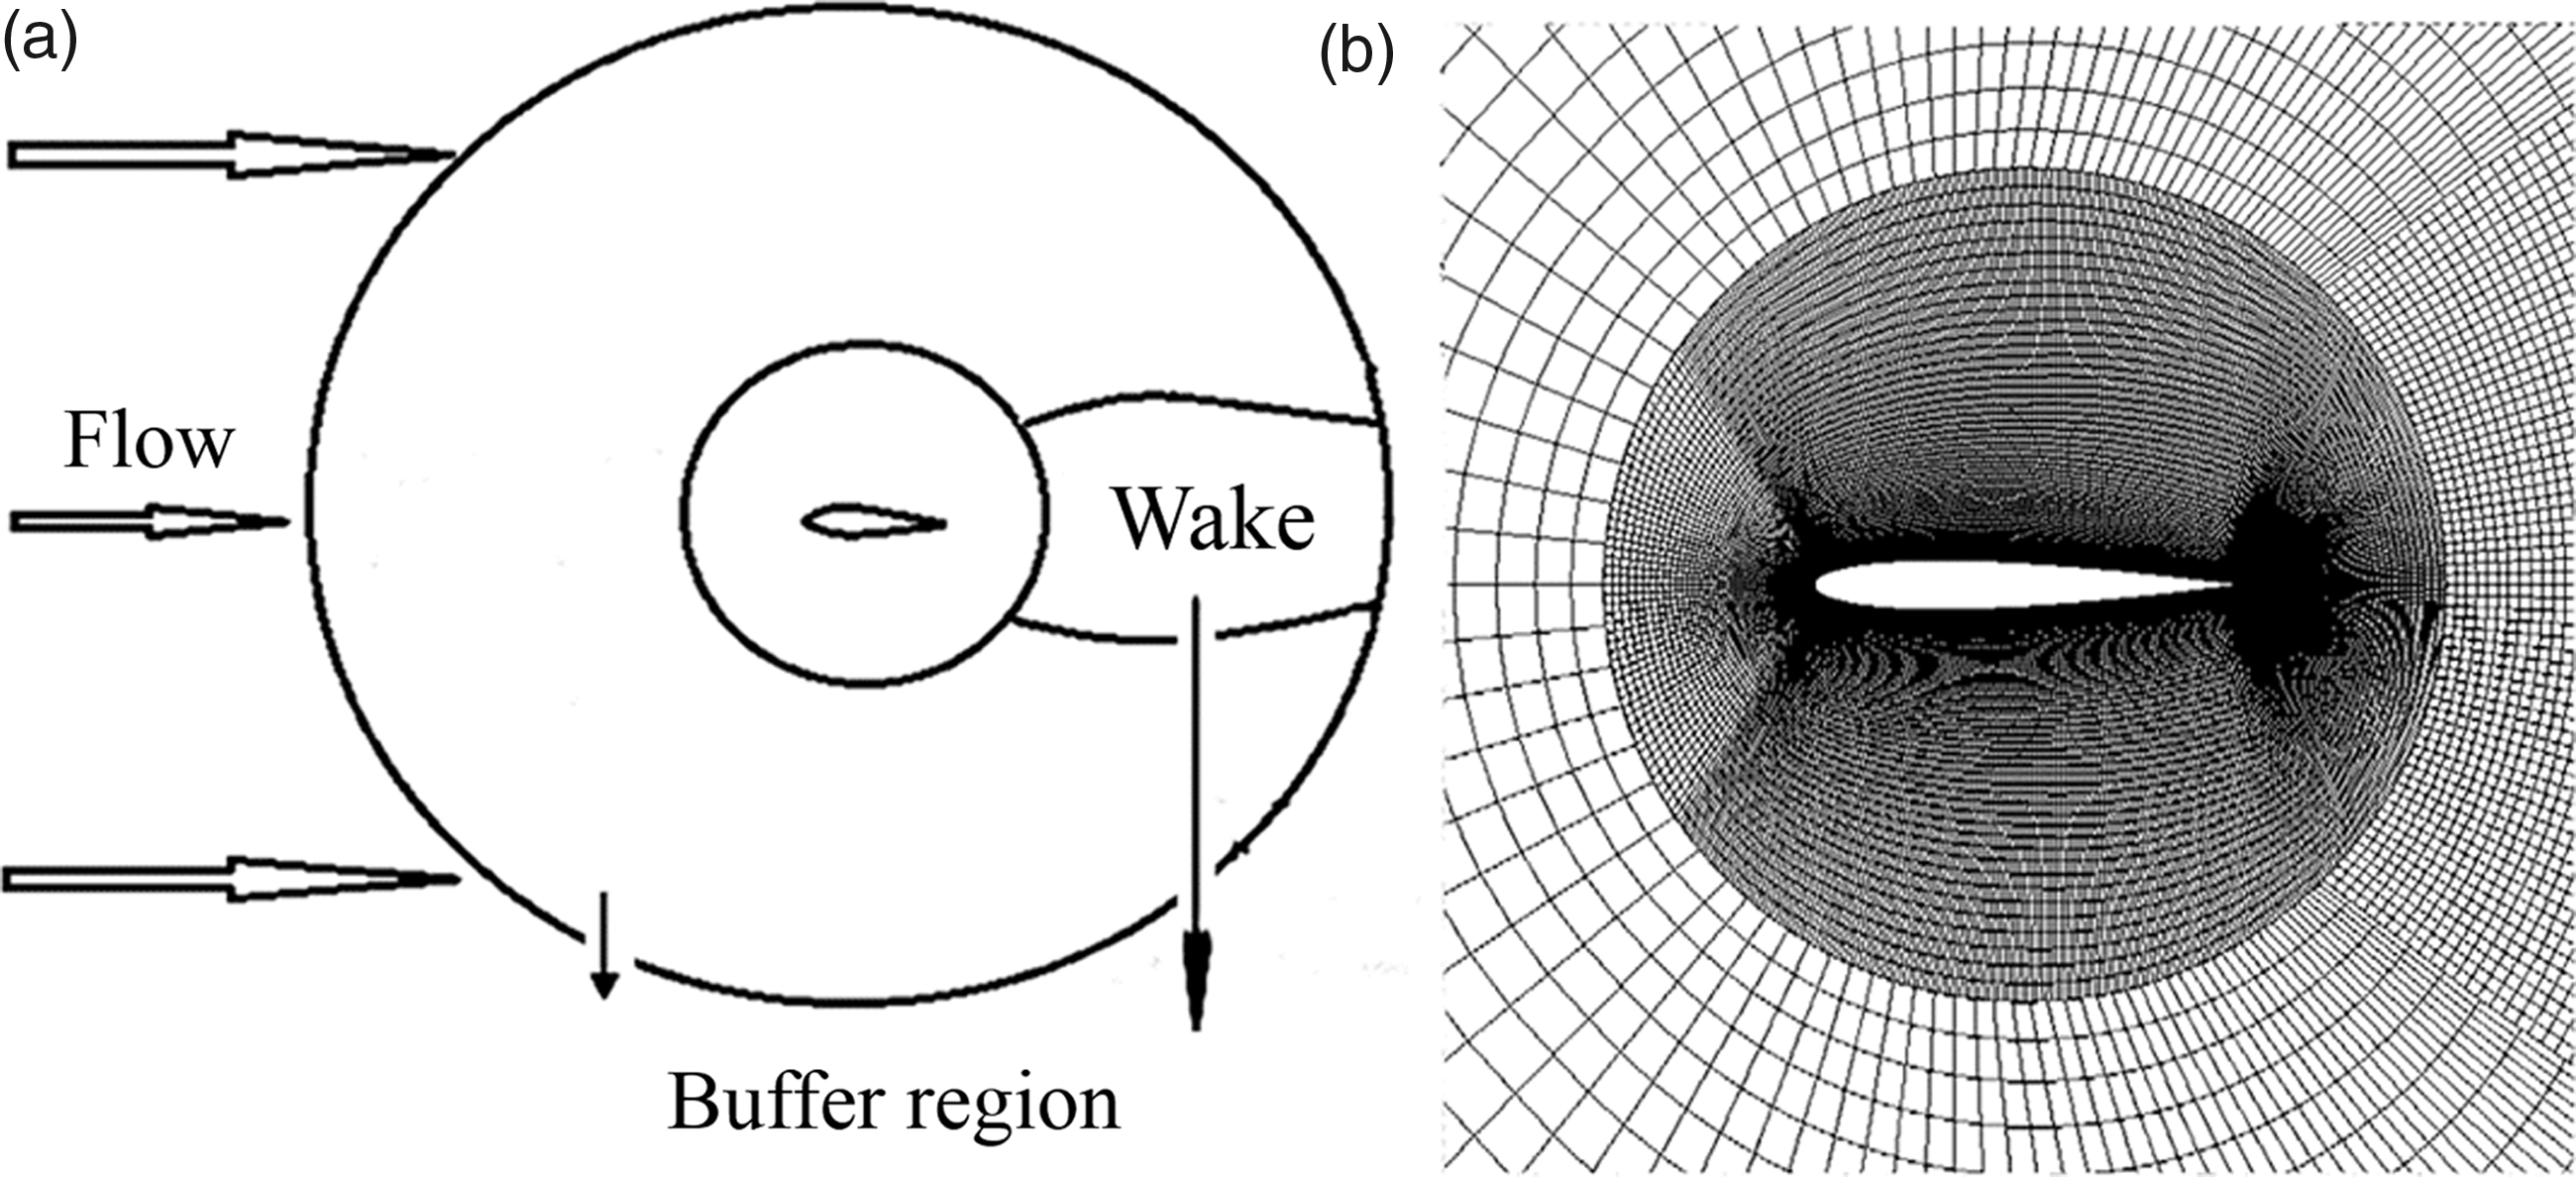
Mesh generation of the airfoil of the proposed wing.
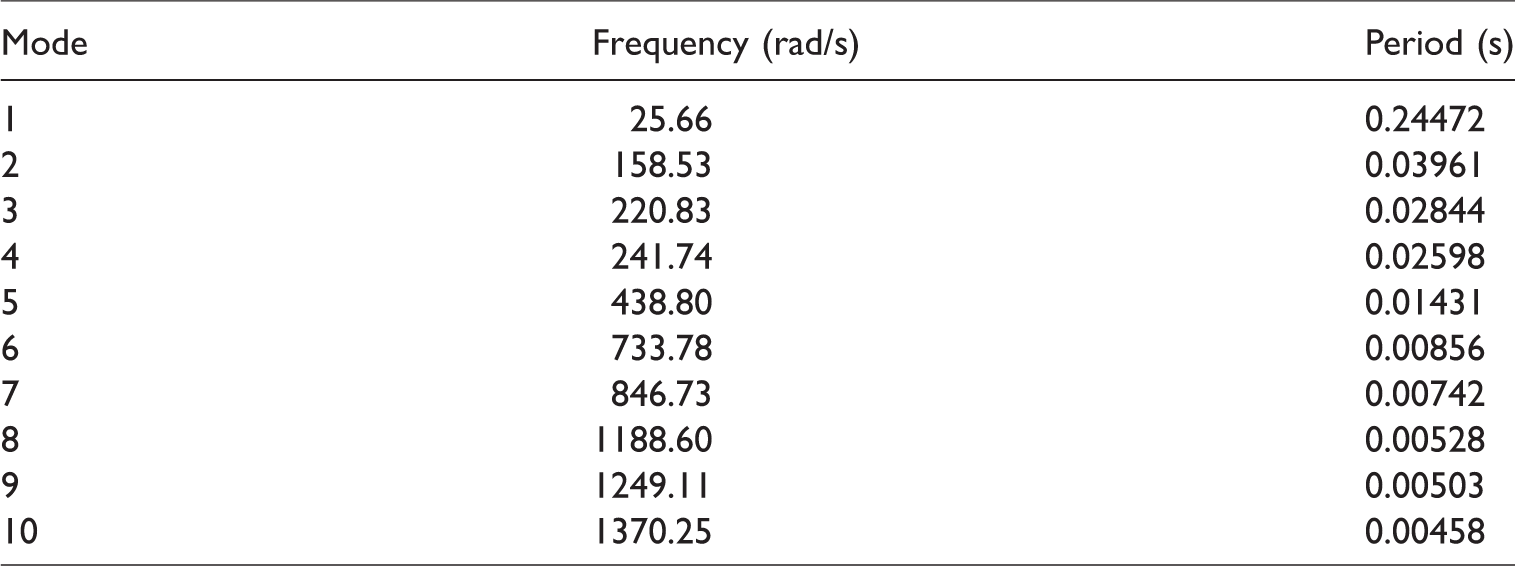
Table 1 gives the first 10 eigenvalues of the wing structure introduced in the beginning of this section. For the computation, the first-order natural vibration frequency was included, the wind velocity U = 10 m/s, the Dryden atmospheric turbulence spectrum was used, the frequency integration range was
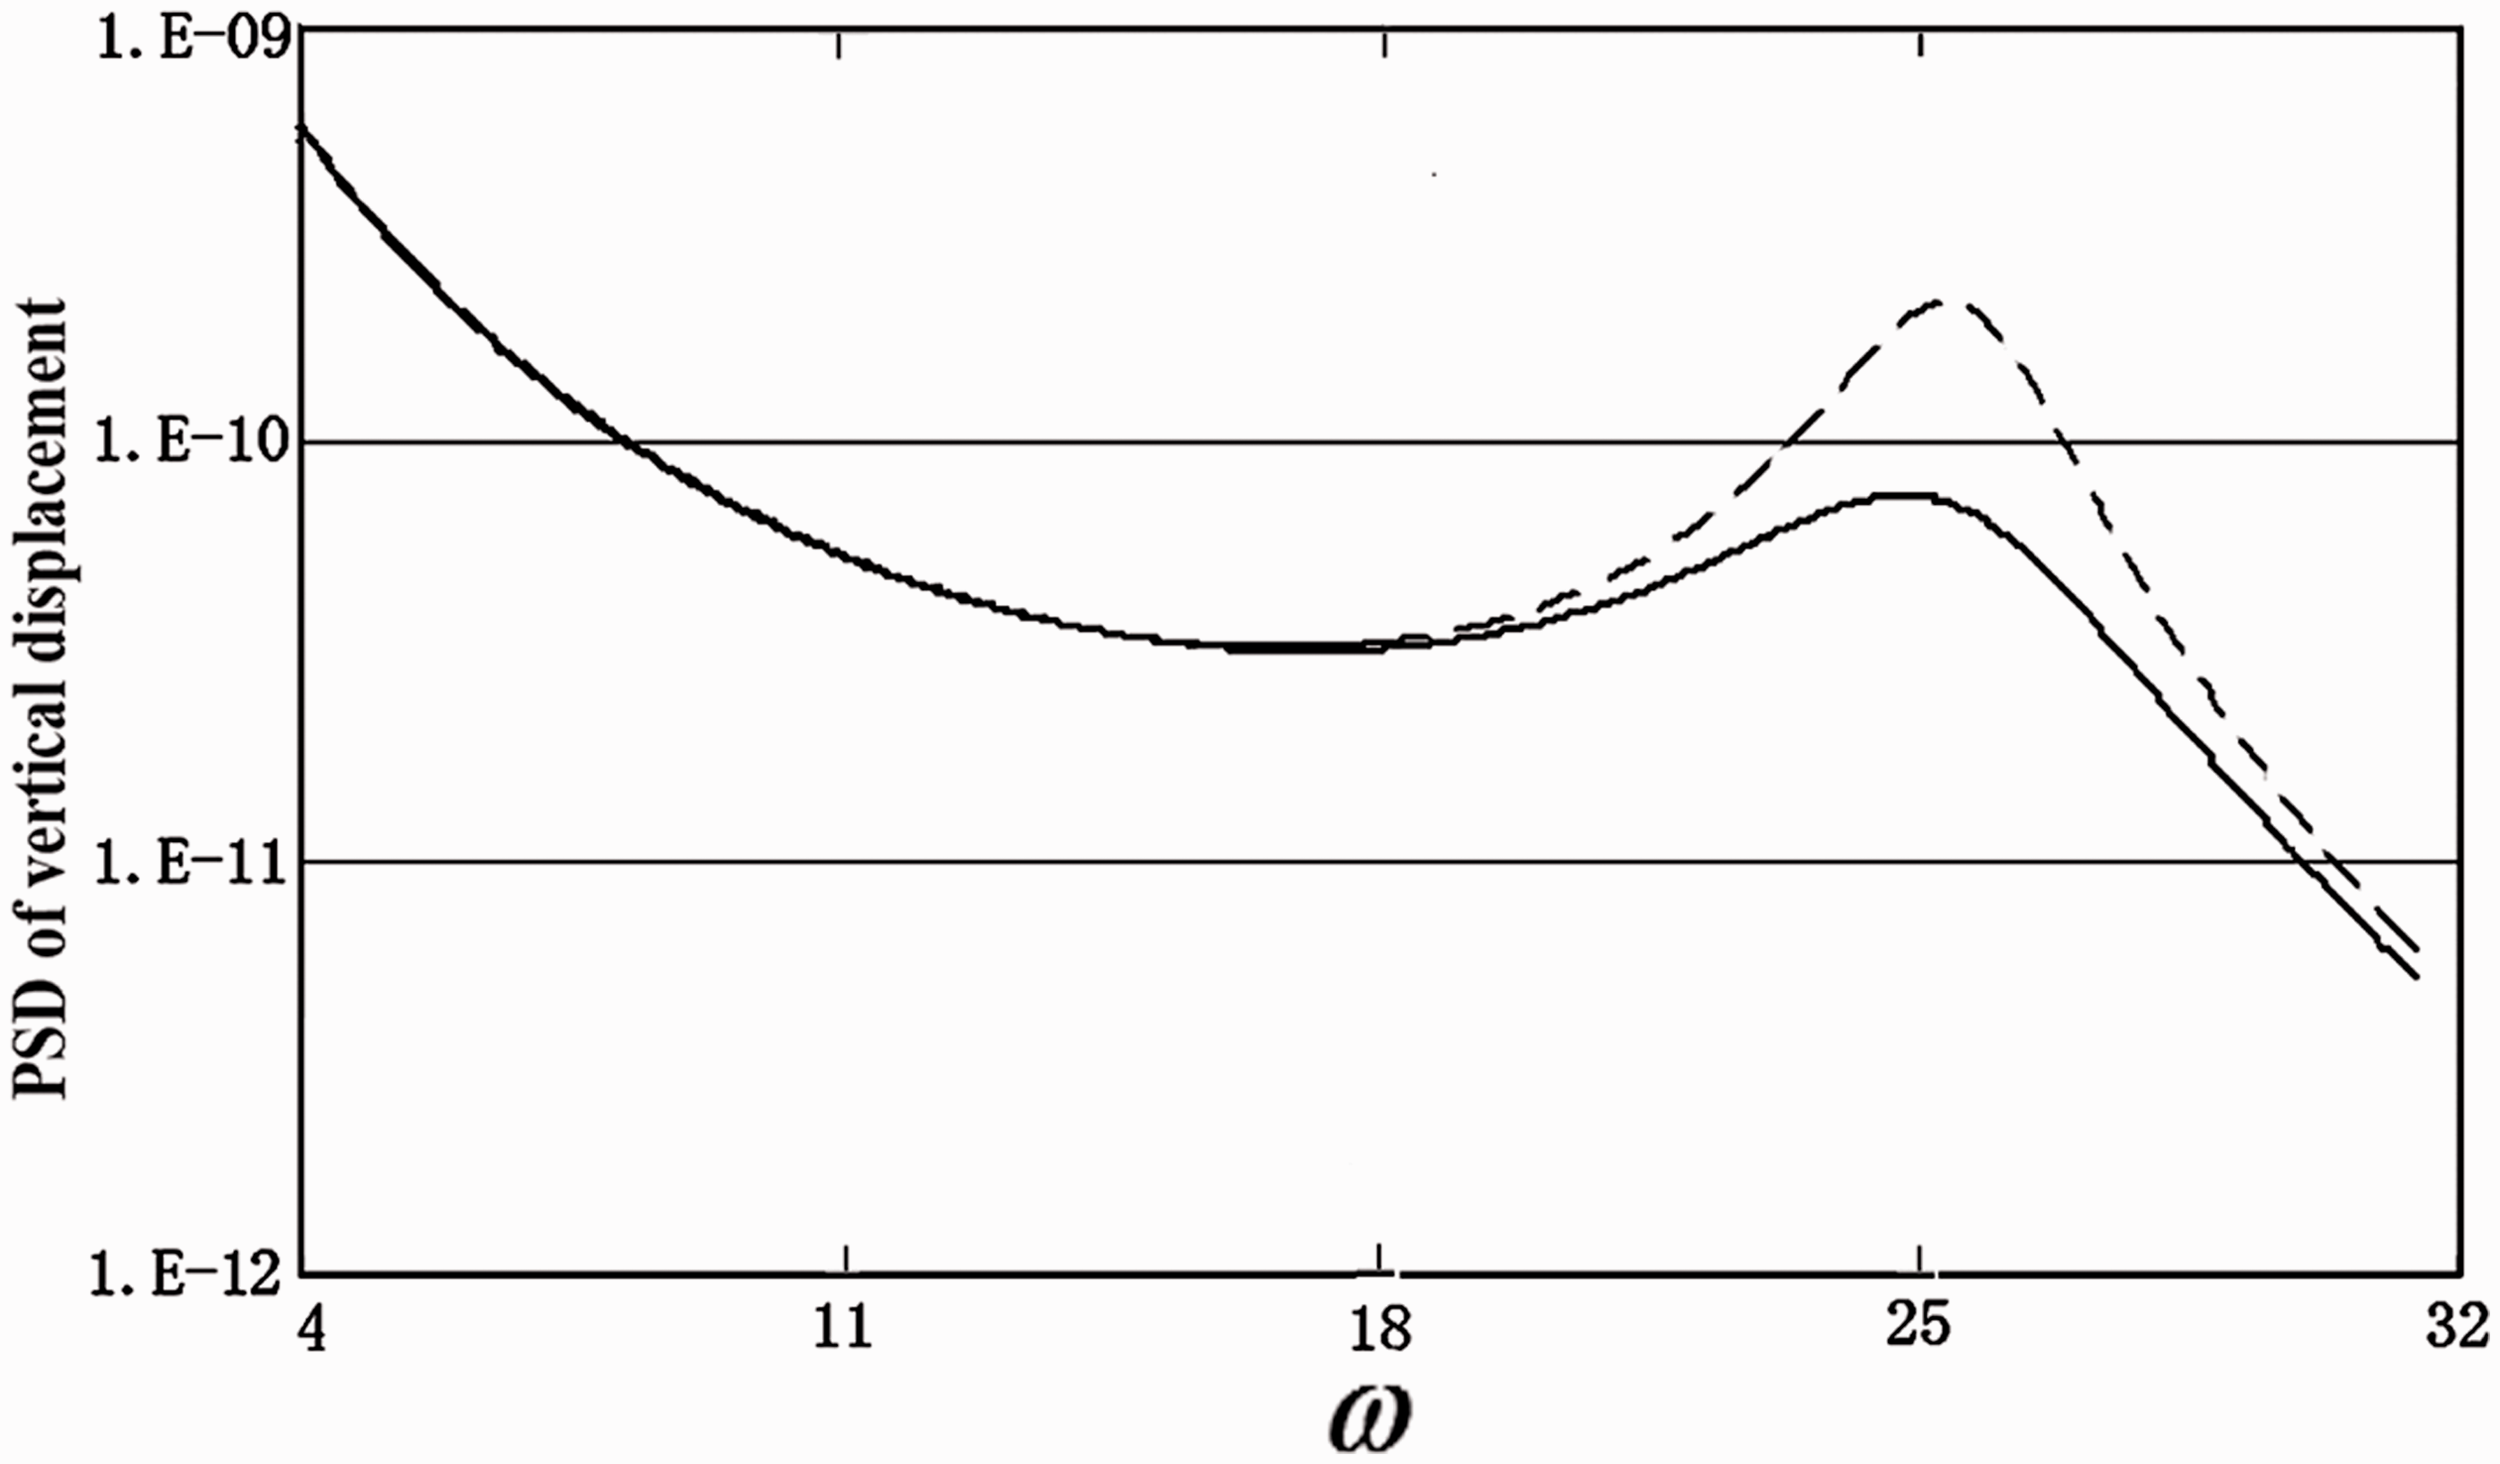
PSD of the vertical displacements of the leading edge of the wingtip. The solid and dashed lines represent the computed results based on CFD and Theodorsen theory, respectively. PSD: power spectrum density.
Natural vibration characteristic of the wing.
Results and discussion for the wing
This section presents gust wind response predictions for the wing based on the proposed method. The first 10 modes were still used for computation and the modal damping ratio of the wing was 0.02, the flow velocity
The computed vertical displacement variances at four locations on the wingtip are shown in Table 2, and Figure 6 shows the related PSD variation across the wingtip for wind velocity 40 m/s. Figure 7 shows how the PSD of the vertical displacement responses varies with velocity for the leading edge (left-hand picture) and midpoint of the wingtip. It is readily seen that the values of PSD fluctuate near the natural vibration frequencies of the structure. The PSD of the response is very small in the high frequency range, due to the velocity spectrum of the gust wind attenuating quickly at high frequencies.
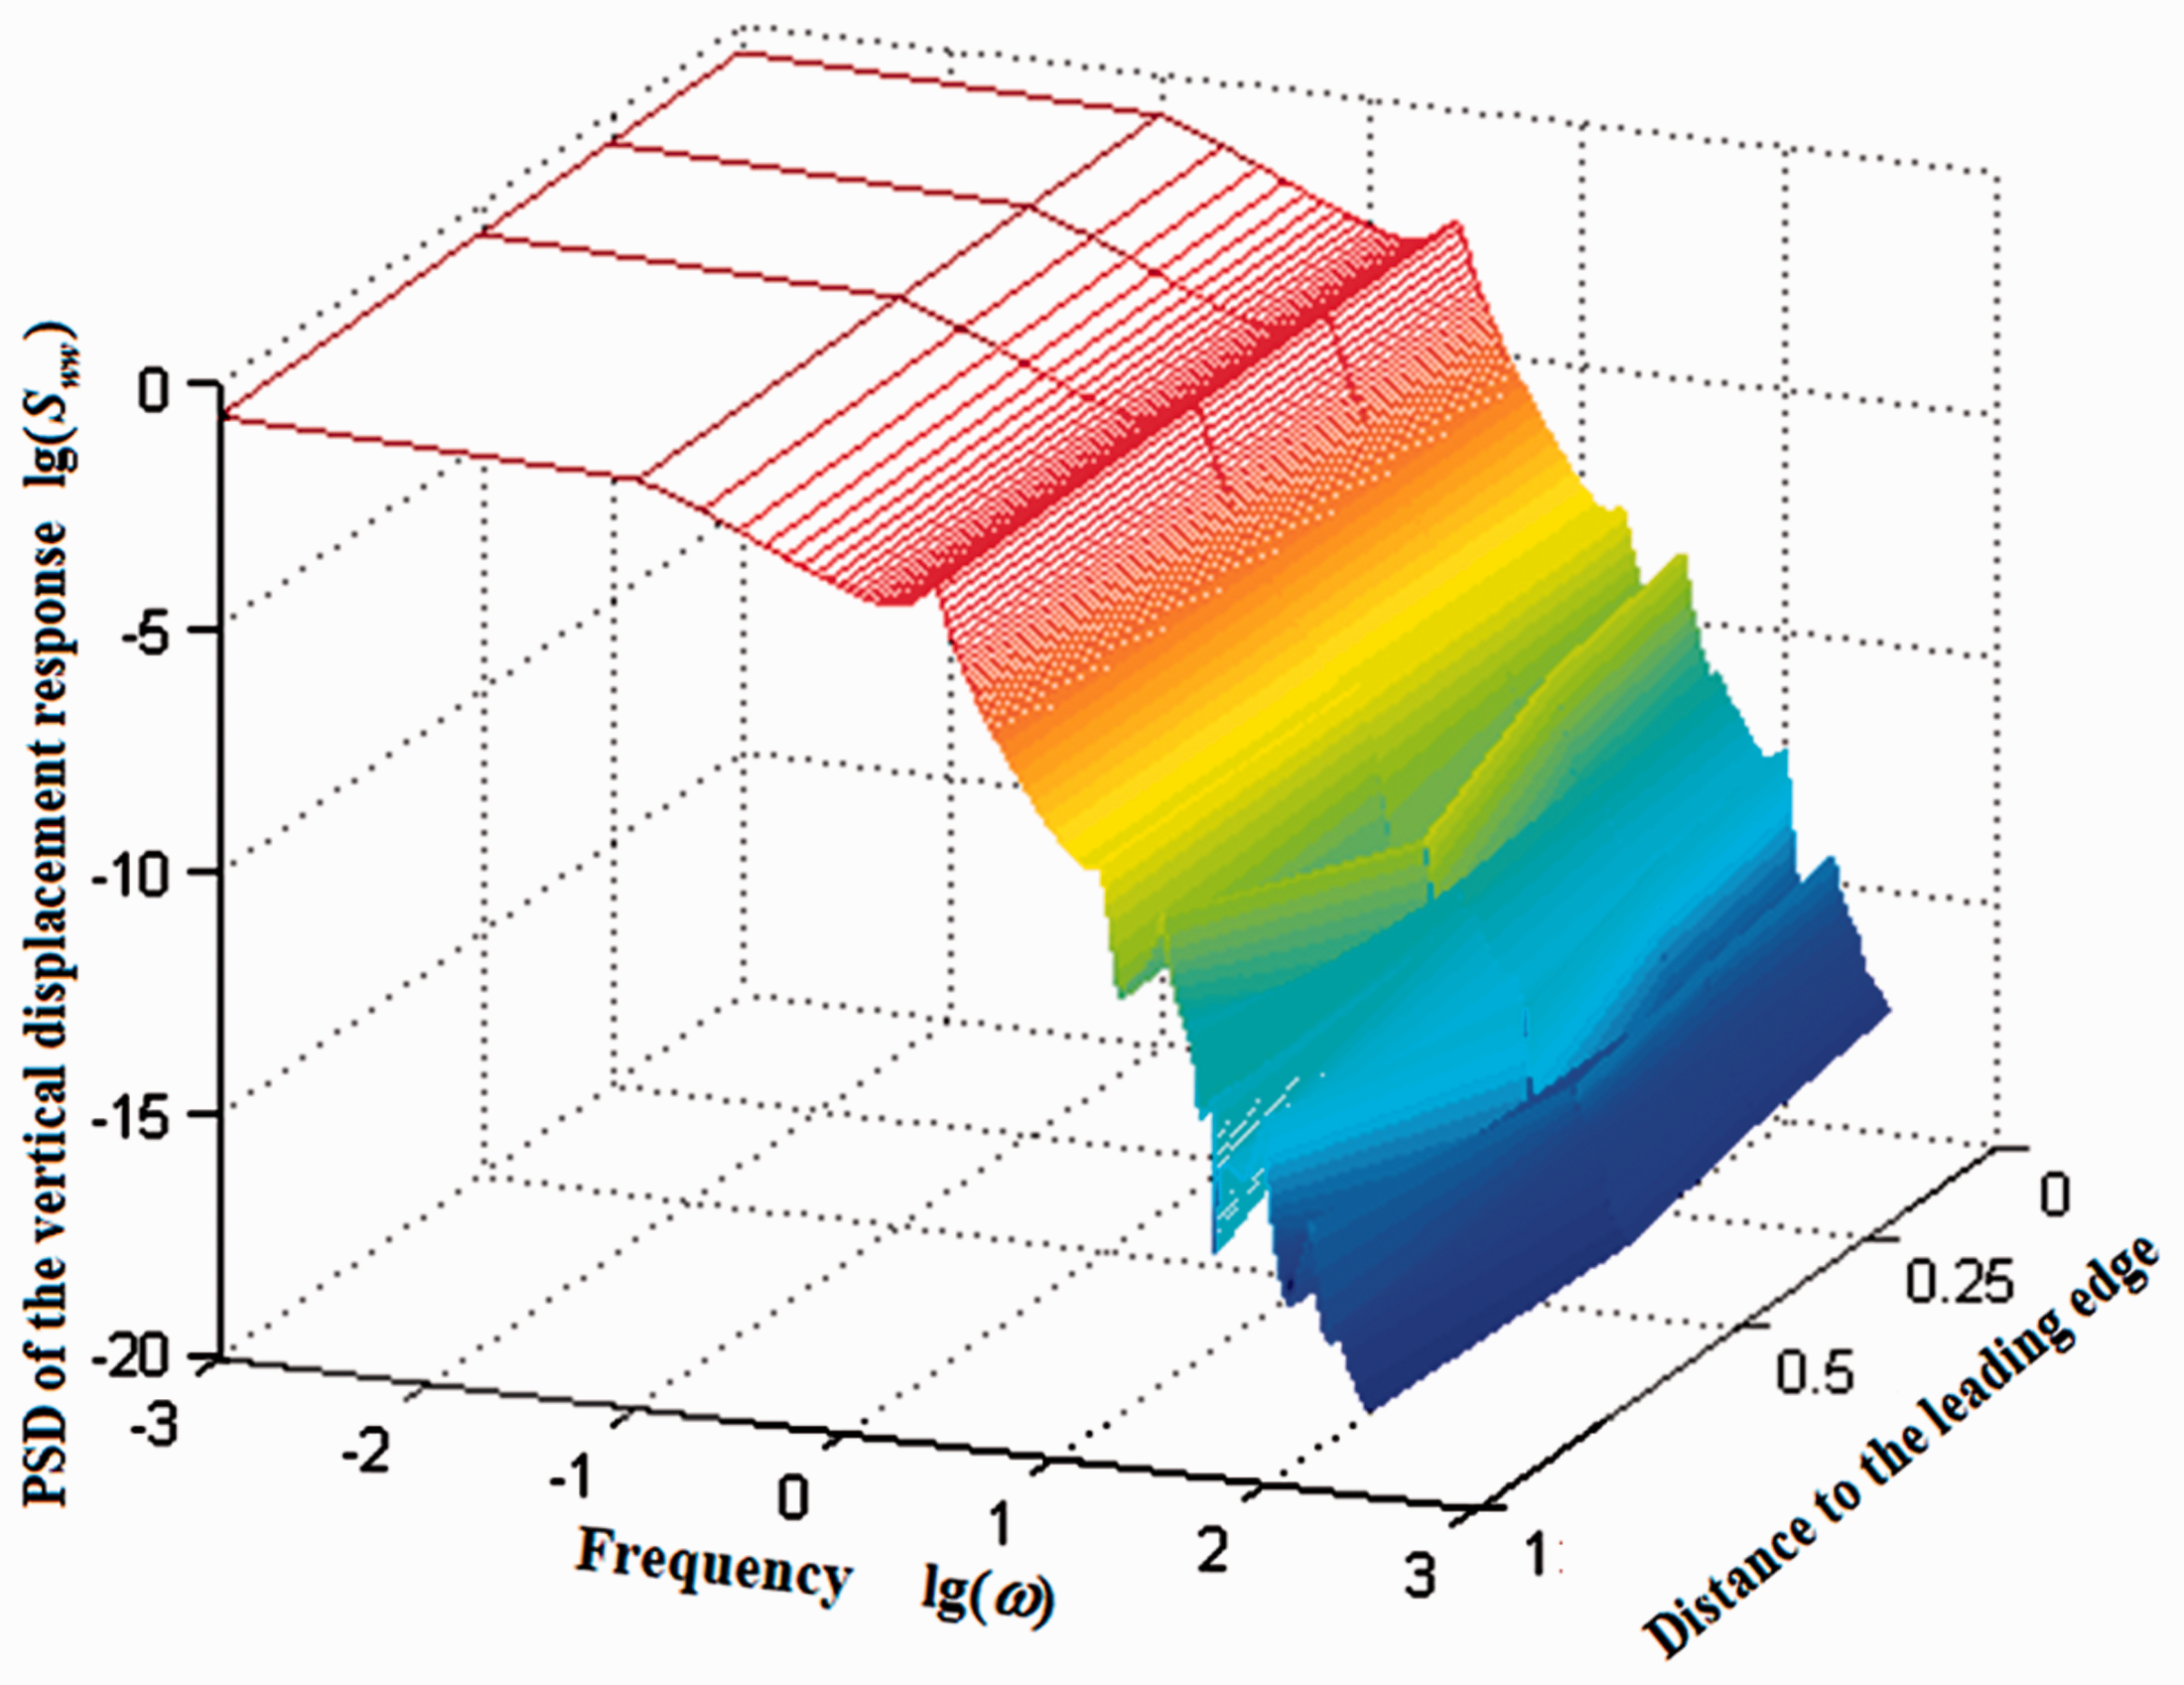
Response of the vertical displacement PSD at different positions on the wingtip when U = 40 m/s. PSD: power spectrum density.
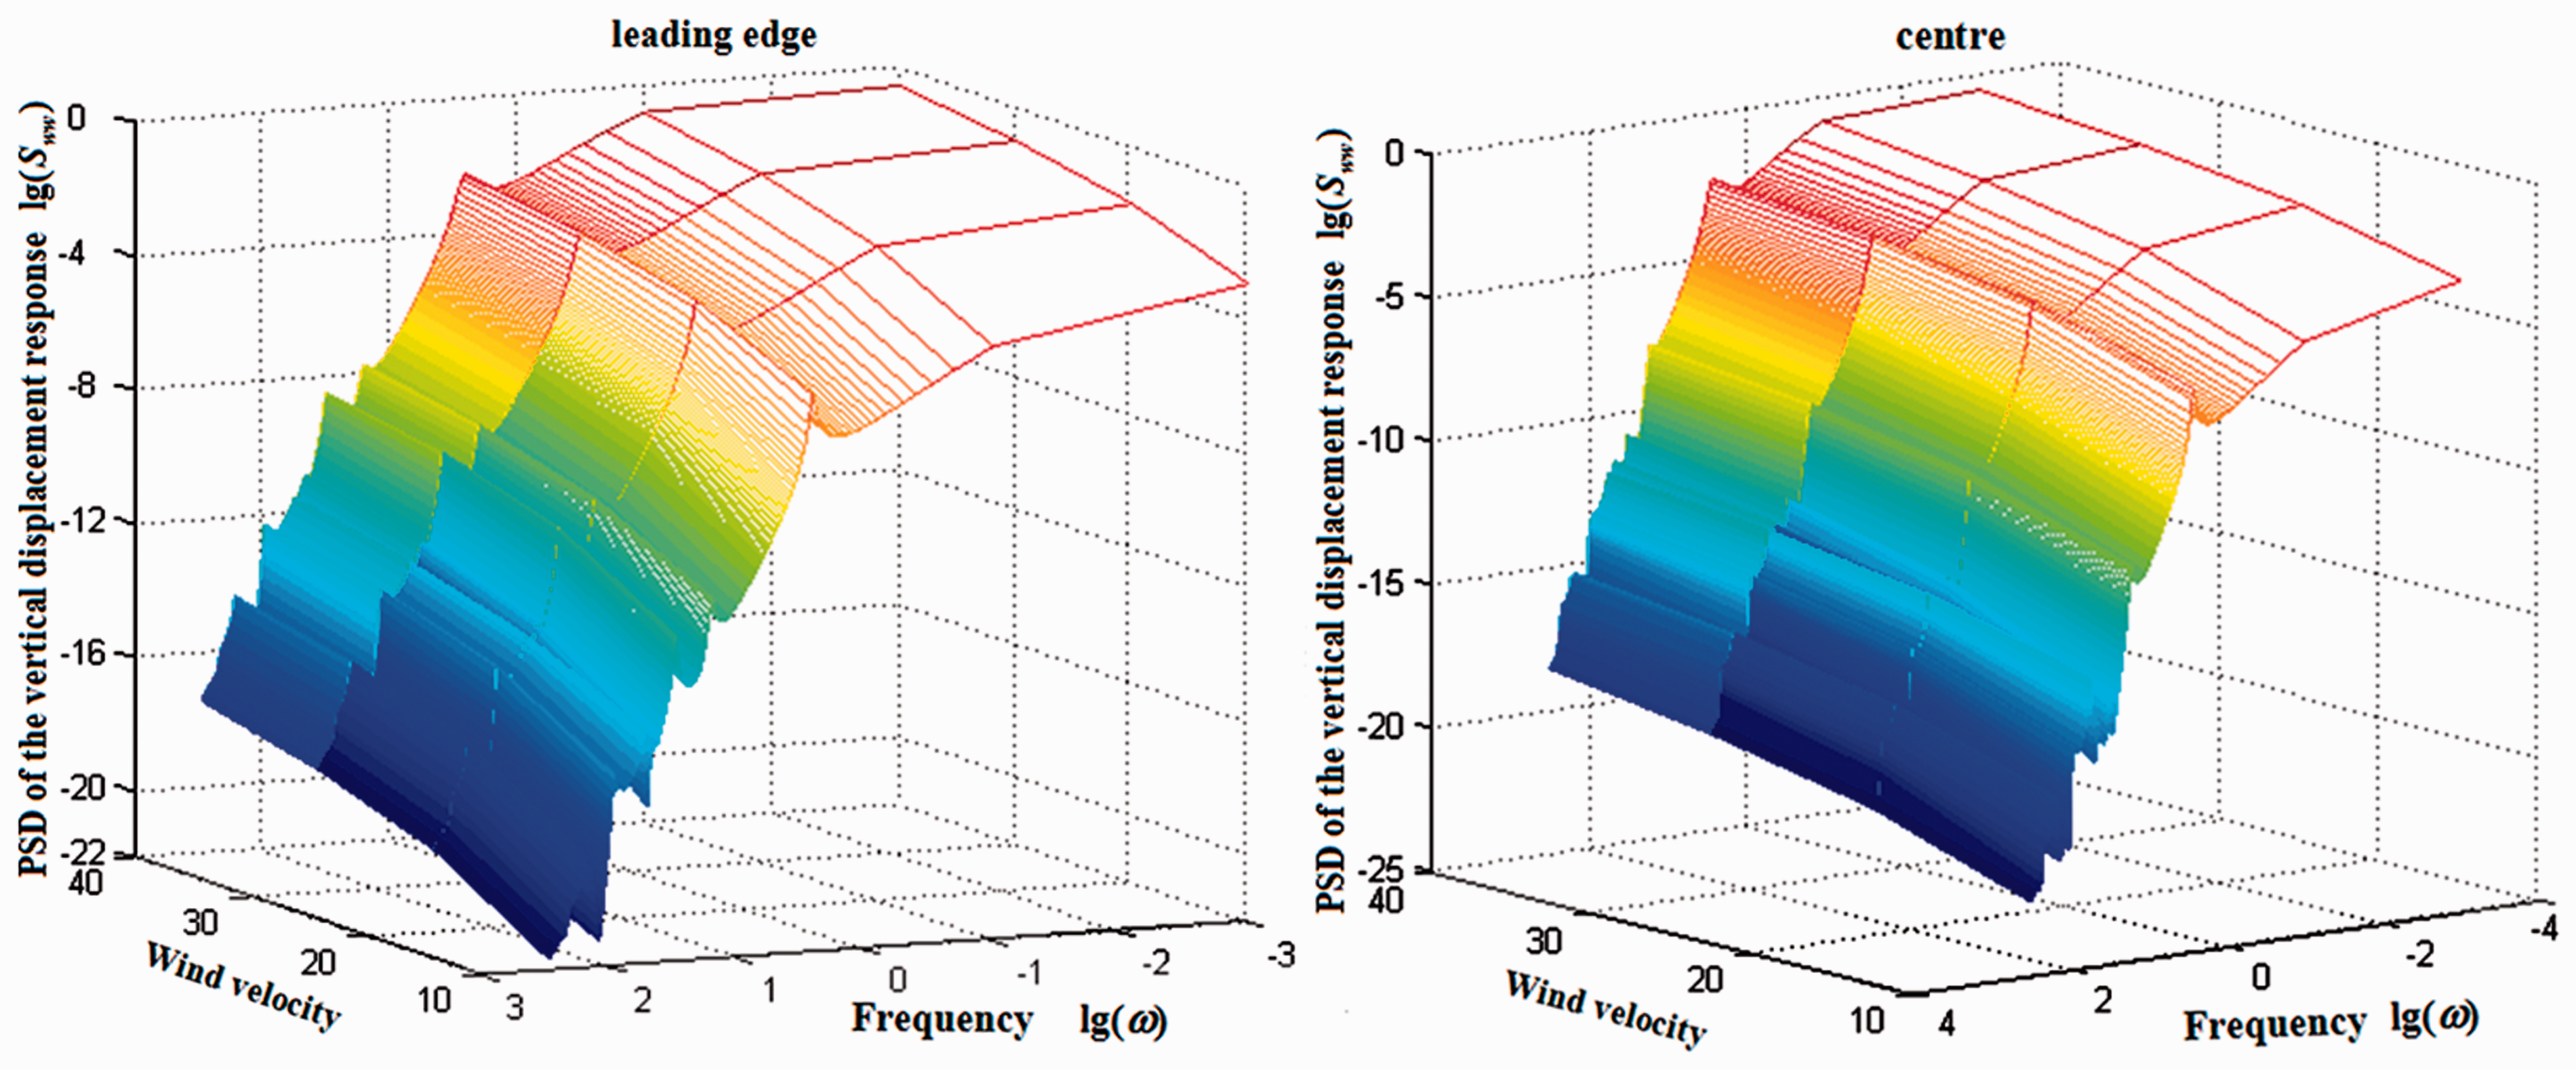
Variation with velocity of the vertical displacement PSD at the leading edge and at the center of the wingtip. PSD: power spectrum density.
Vertical displacement variance at the positions on the wingtip shown.
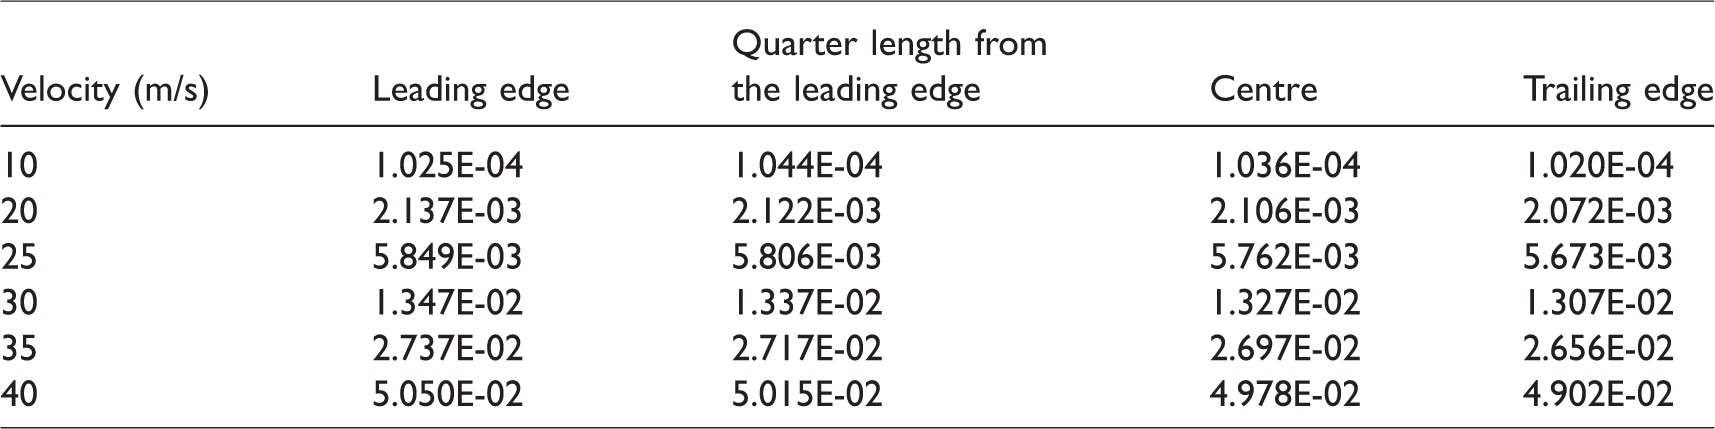
Table 3 compares the computation times needed when using PEM, CQC, and SRSS. Clearly PEM dramatically improves the computational efficiency, even though it retains accuracy.
Efficiency comparison.
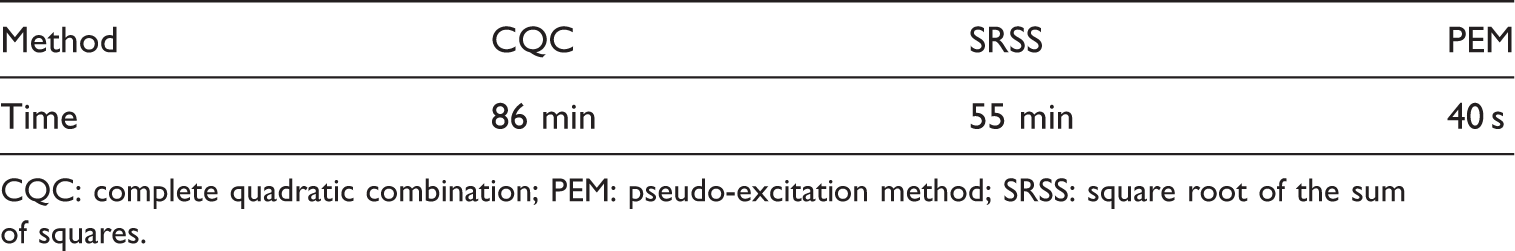
CQC: complete quadratic combination; PEM: pseudo-excitation method; SRSS: square root of the sum of squares.
Buffeting analysis of Tsing Ma Bridge
The structure with FEM information
The Tsing Ma Bridge in Hong Kong is a suspension bridge with a main span of 1377 m between the Tsing Yi tower in the east and the Ma Wan tower in the west (see Figure 8).
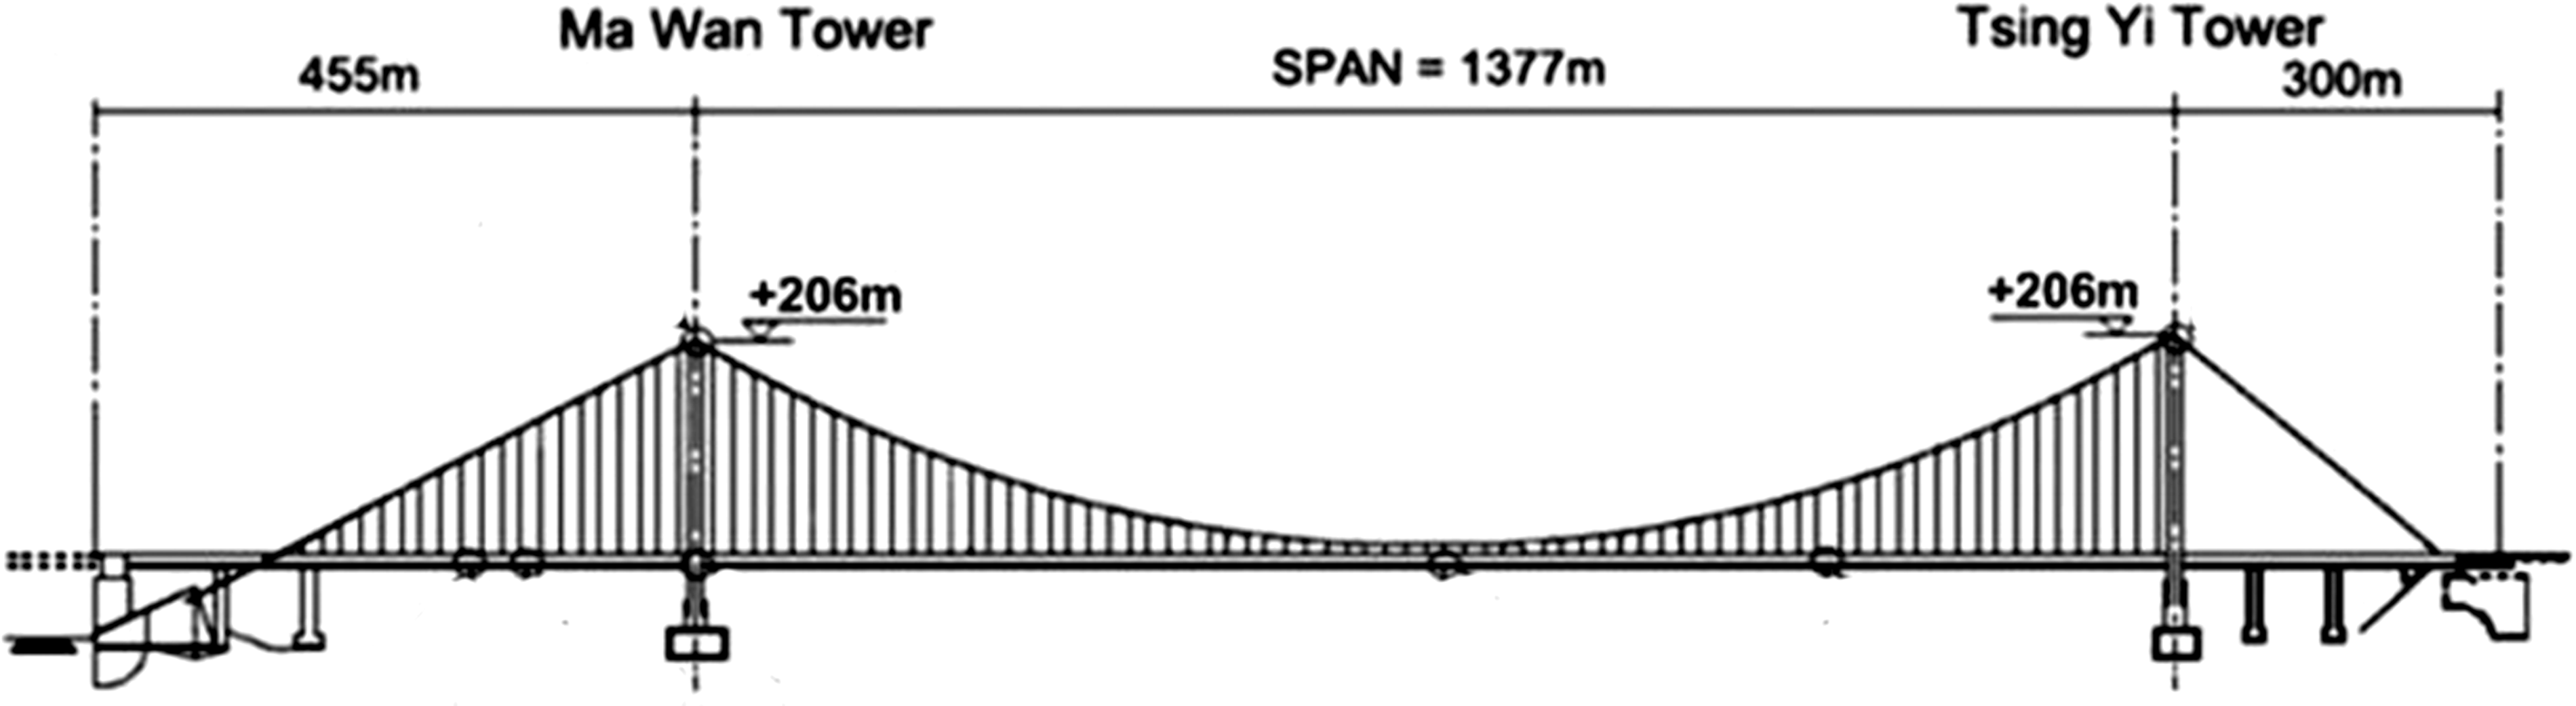
Tsing Ma Bridge in Hong Kong.
The height of the two reinforced concrete towers is 206 m and the two main cables are of 1.1 m diameter, 36 m apart, and supported by saddles located at the top of the four tower legs. The bridge deck is a hybrid steel structure consisting of a series of cross-frames supported on two outer-longitudinal trusses and two inter-longitudinal trusses acting compositely with stiffened steel plates, as shown in Figure 9. The bridge deck is supported by suspenders on the main span and on the Ma Wan side span and by three piers on the Tsing Yi side span. It carries a dual three-lane highway on its upper level and two railway tracks and two carriageways within its lower level. For structural health monitoring, a WASHMS was installed in the bridge by the Highways Department of Hong Kong in 1997. There are nine types of sensor in the WASHMS, including 6 anemometers and 110 strain gauges.
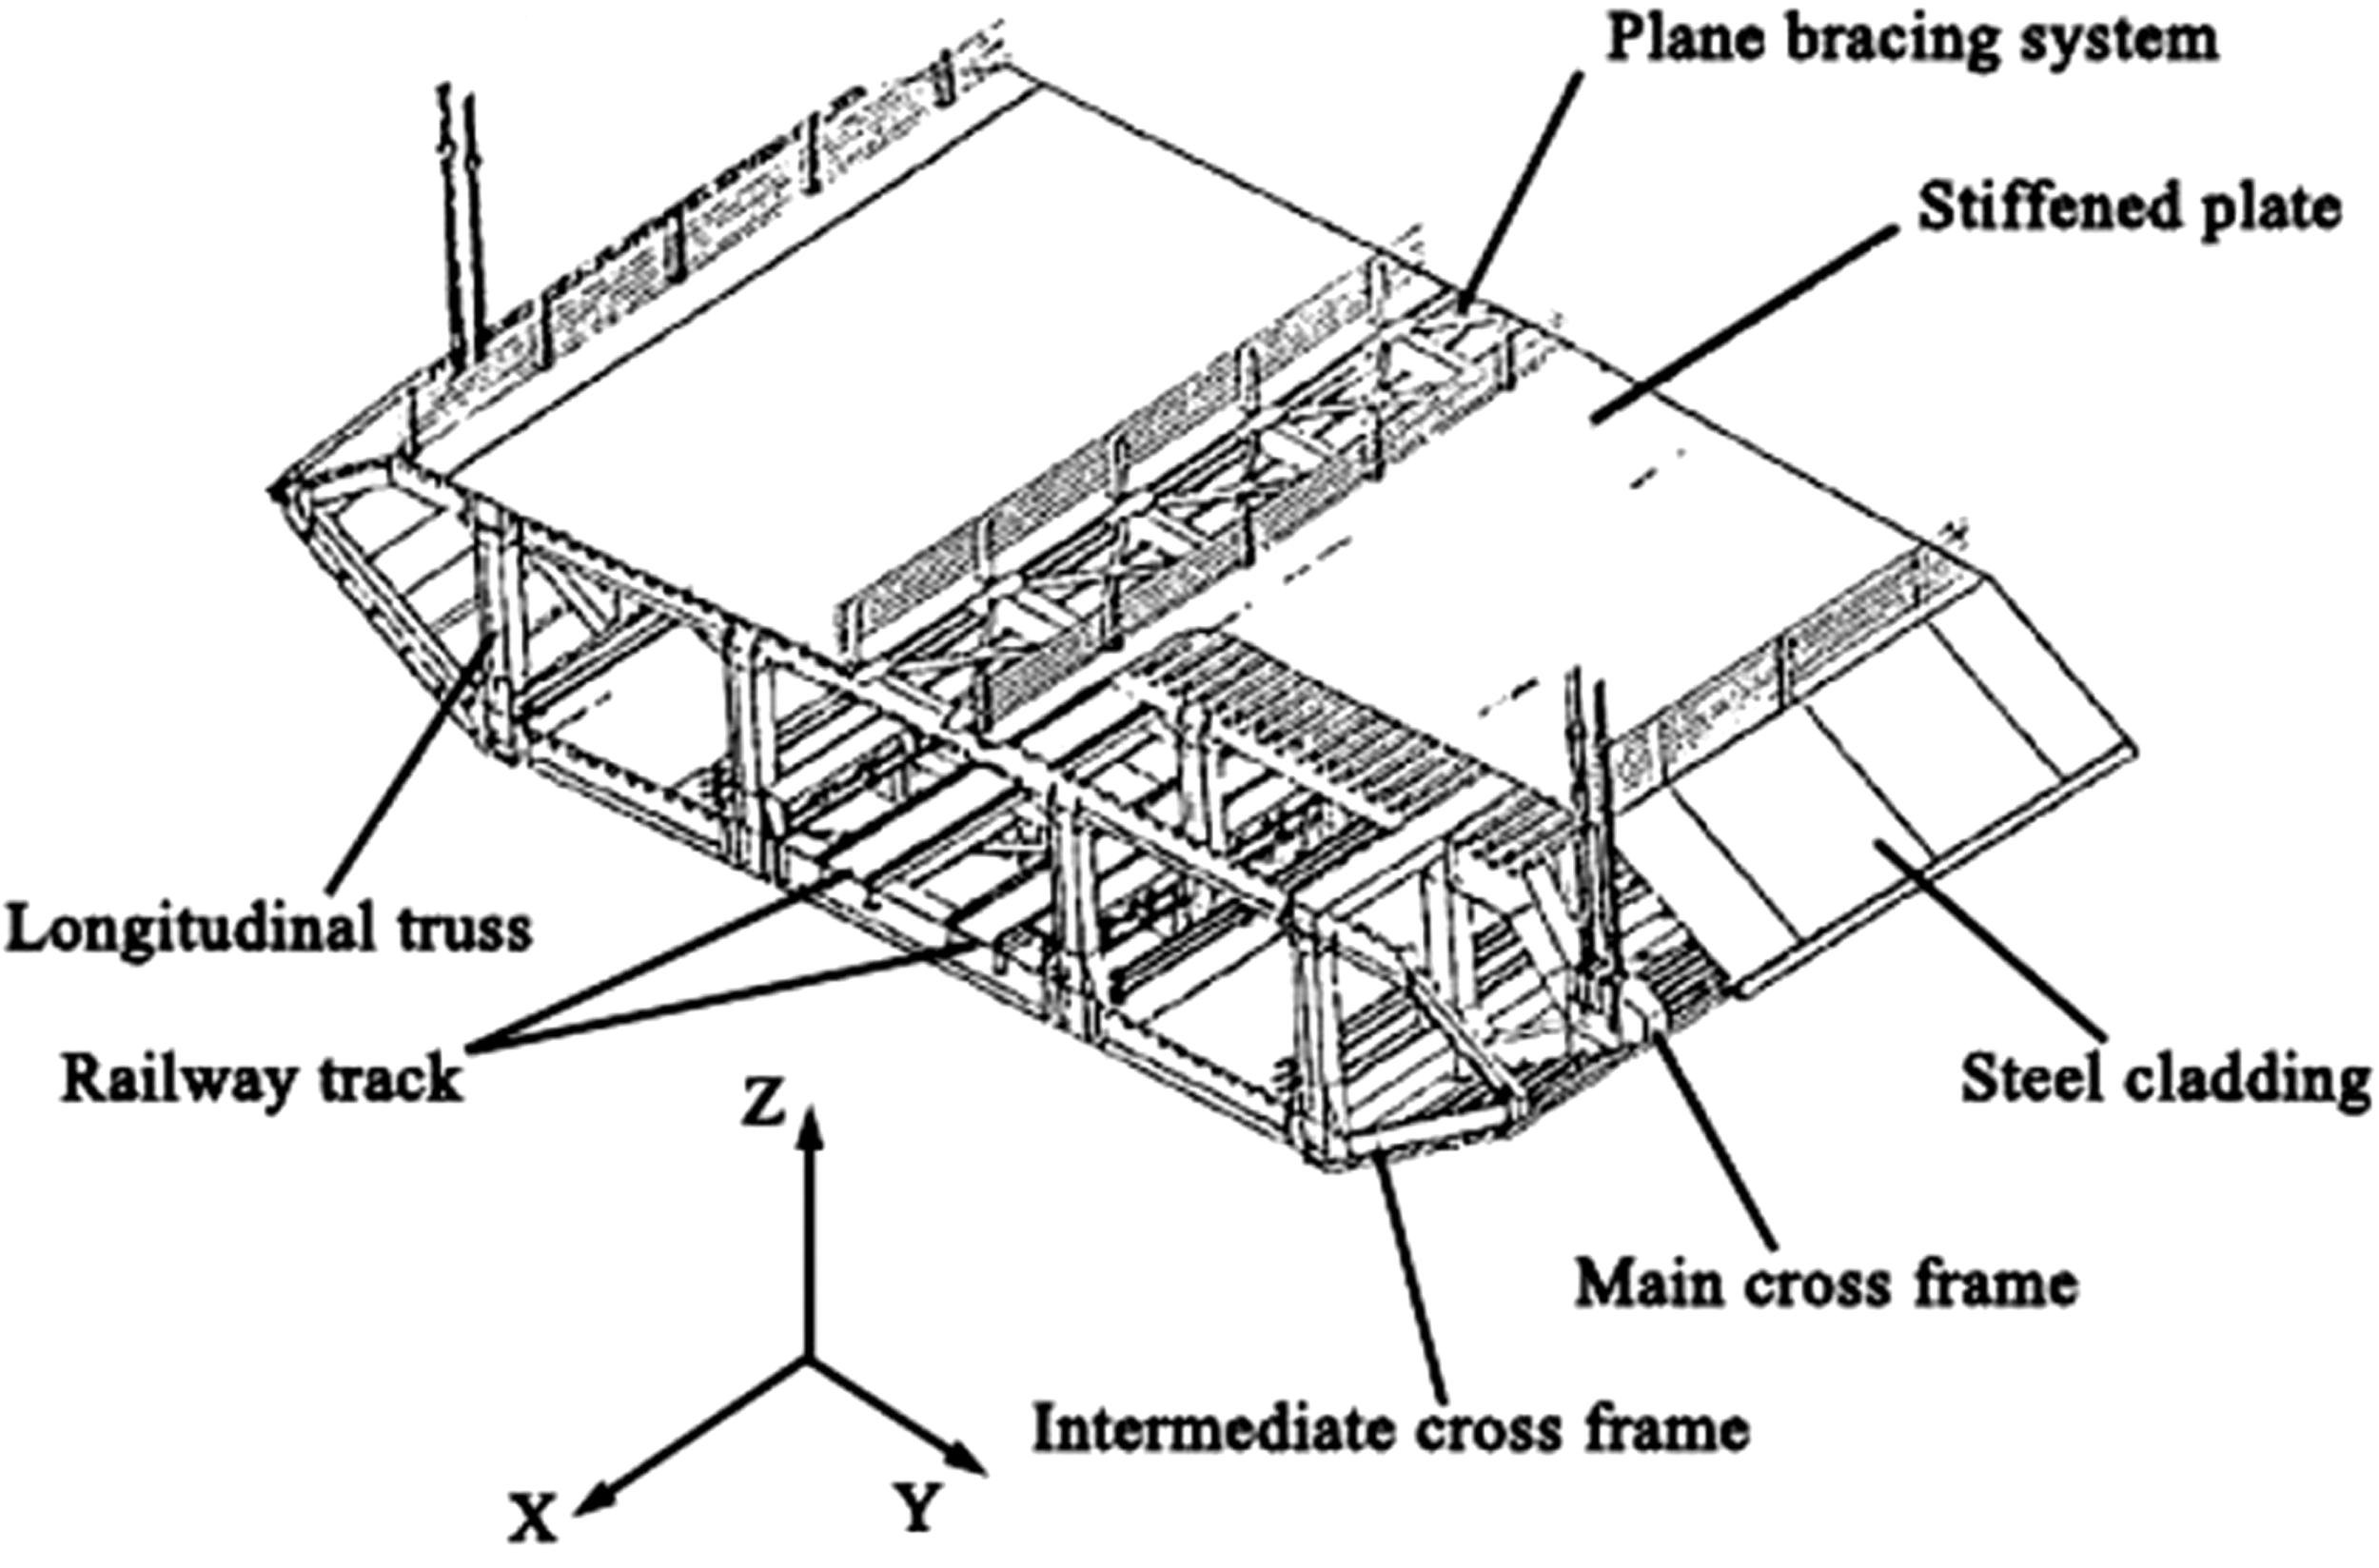
A typical 18 m deck section of the main span of the Tsing Ma Bridge.
The finite element model of the Tsing Ma Bridge was generated based on the following principles: the geometry of the finite element model was consistent with the actual structure, there was a one-to-one correspondence between the structural elements of the model and those of the actual structure, the equivalent treatment was adopted for the simulations of the structural stiffness and density, and the boundary conditions were realistic. The global finite element model indicated in Figure 10 includes 12,898 nodes, 21,946 elements (2906 plate elements and 19,040 beam elements) with 4788 multipoint connection elements.
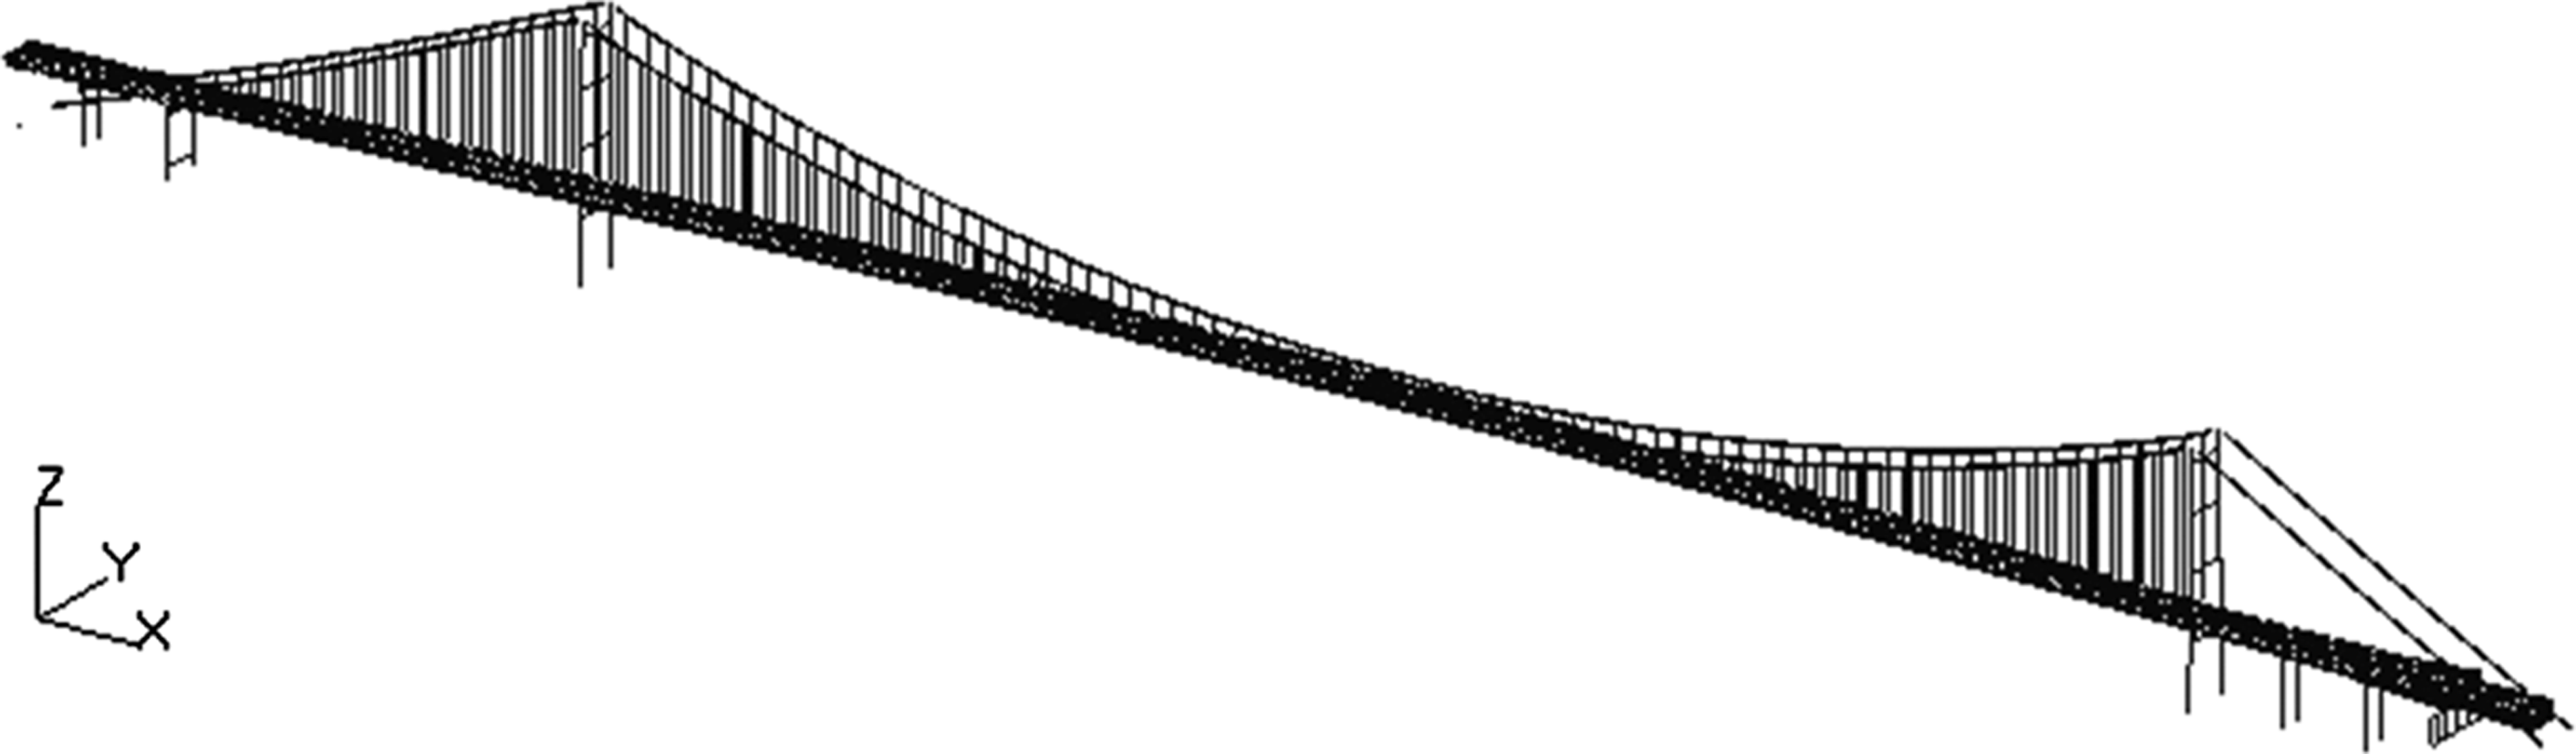
Three-dimensional refined finite element model of the Tsing Ma Bridge.
Buffeting analysis method
The 3D integral equations of motion of the Tsing Ma Bridge can be represented as

In this paper, the power spectral method is adopted to solve the motion equations in the frequency domain and PEM is used with a highly detailed model in order to get solutions accurately and efficiently.
The nodal displacement of the bridge was represented by the generalized displacement vector as


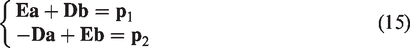
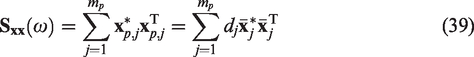
The power spectrum matrix of the motion equations due to random excitation is a nonnegative definite Hermitian matrix, so it can be decomposed with complex
Now using the corresponding column vectors of the diagonal matrix 
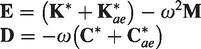
Self-excited forces arise from wind–structure interaction, so the computation of the nodal self-excited force must consider the displacement relationship of each main span section node. Finally, equation (23) becomes

Assuming that the time-history of the fluctuating wind velocity is a stationary random process and based on random vibration theory, the spectrum matrix of the generalized nodal displacement 


For PEM, the deterministic harmonic pseudo excitation applied to the global bridge which corresponds to the sub-spectrum 
Under the action of the 


The pseudo velocity and acceleration response are, respectively


The pseudo element stress determined from the element modal stress was represented as

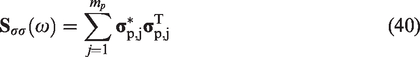
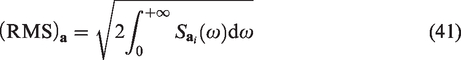
Finally, the standard deviation of the bridge response was found by integrating the response spectrum matrix in the frequency domain
Results and discussions for the Tsing Ma Bridge
First, aerodynamic parameters (i.e. flutter derivative) of the Tsing Ma Bridge were obtained by both the 3D CFD method and wind tunnel experiments. 22 The turbulence of the wind was modeled with DES, which has been proved to be effective for simulating 3D turbulent flow. 14 Mesh generation of 3D modeling is shown in Figure 11. With the similar algorithm of airfoil, total cell number of the deck section of Tsing Ma Bridge is 3,283,496 (i.e. the thicknesses of the 3D model was 1 m). Mesh independence test is shown in Table 7 in Appendix 1.
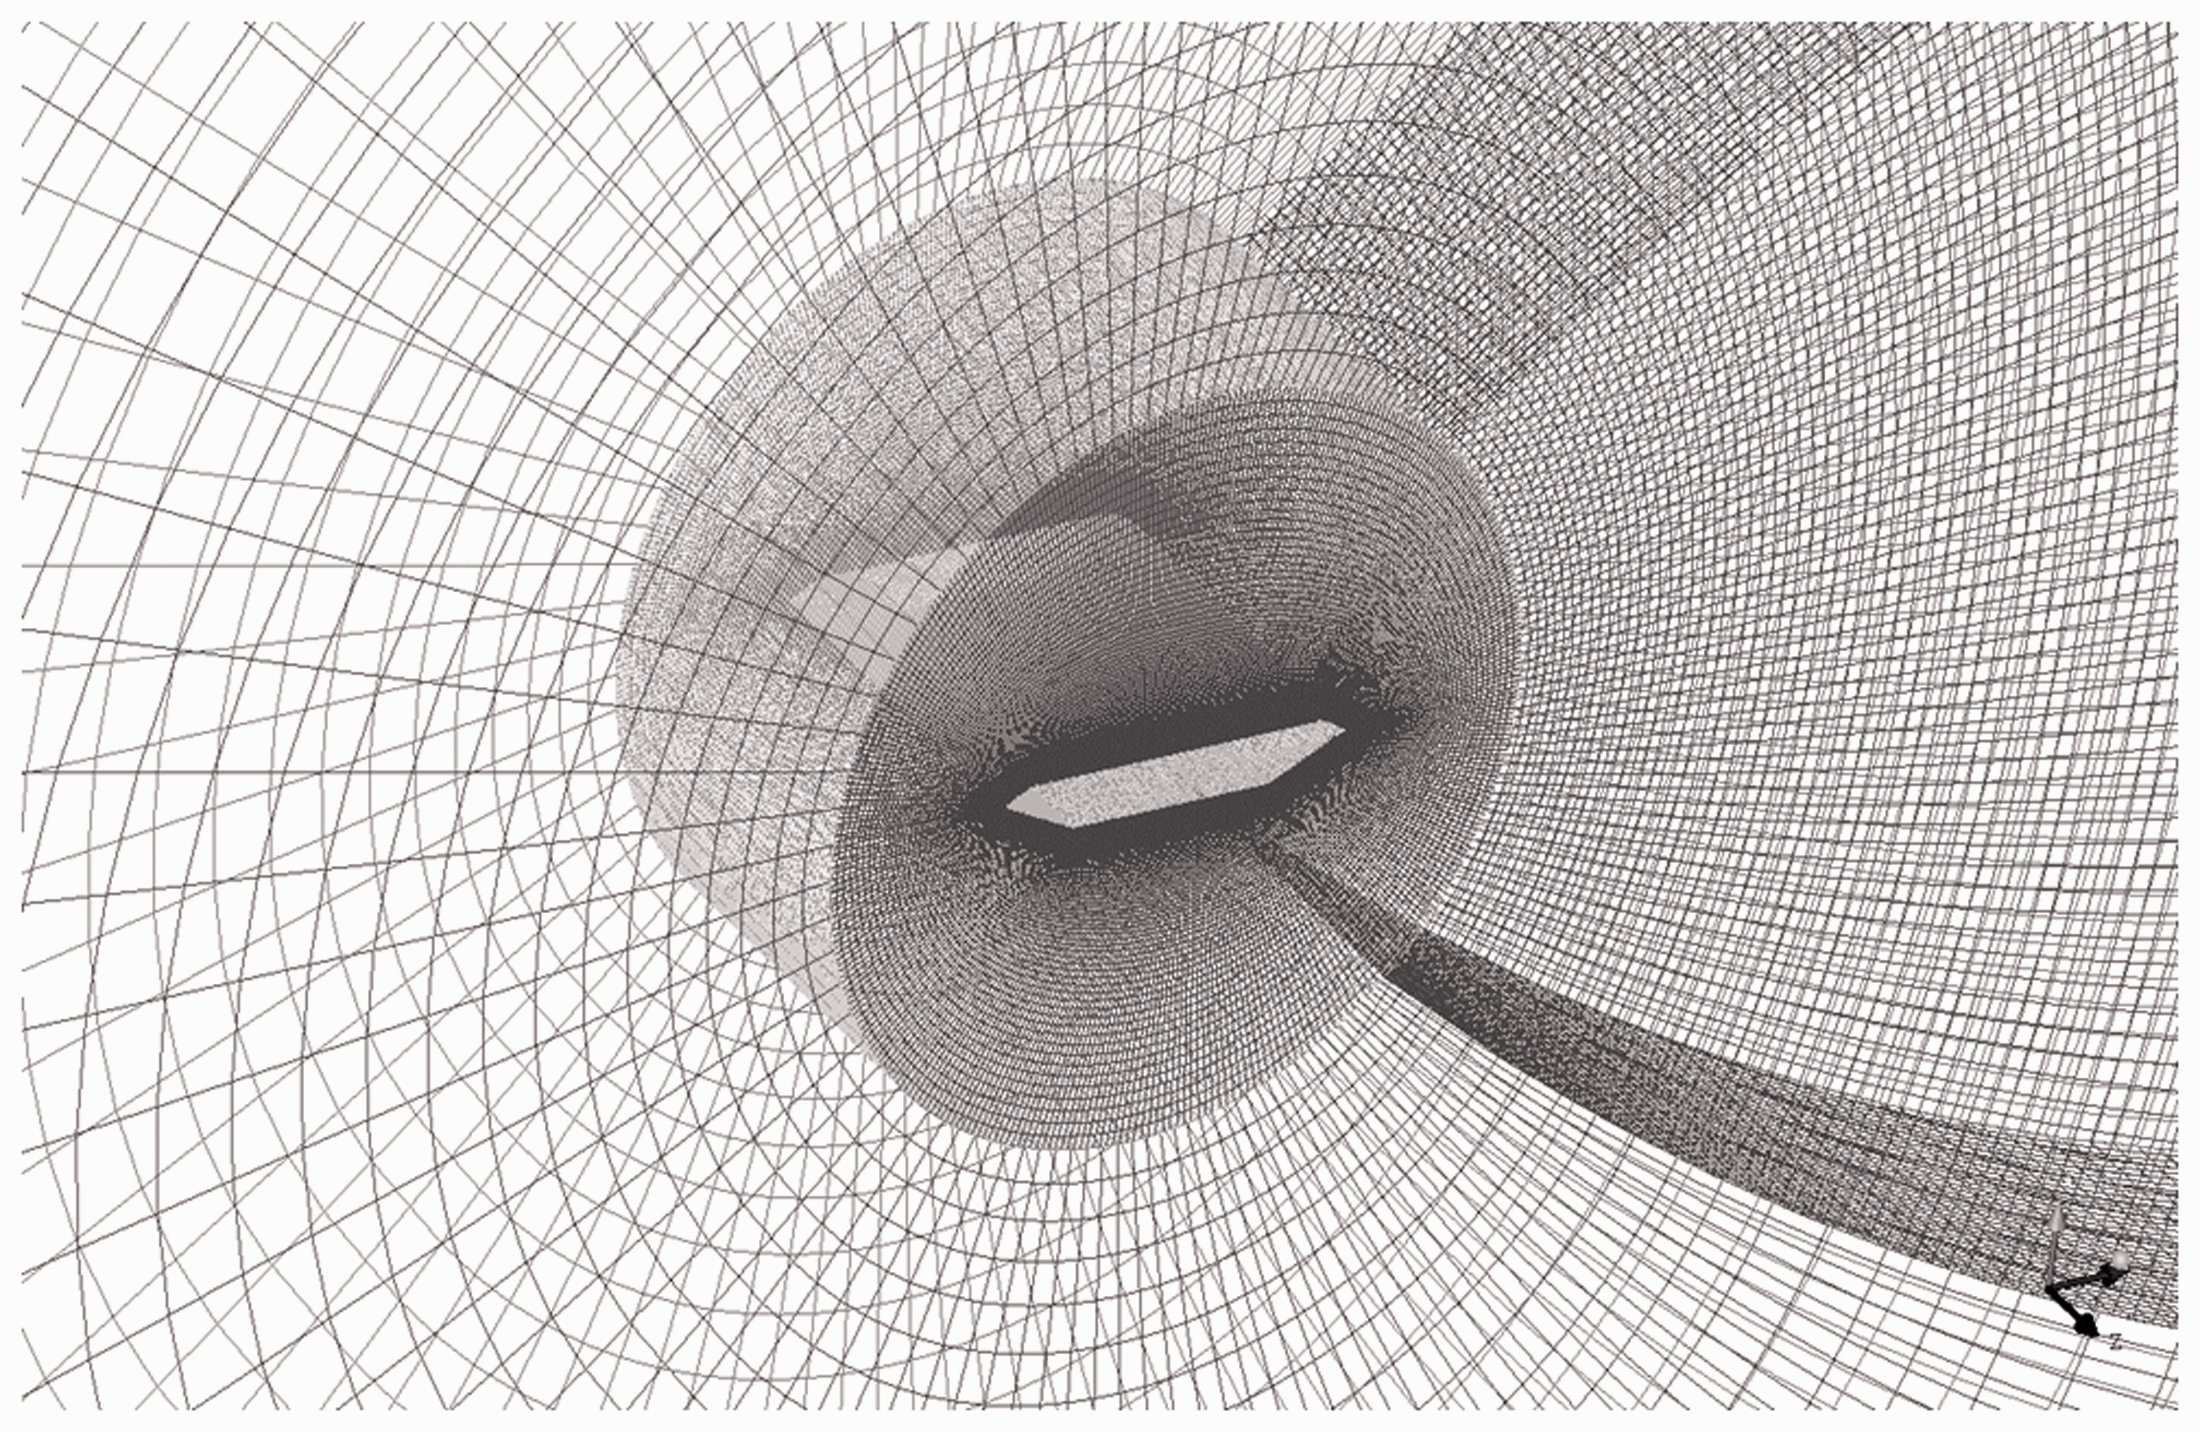
CFD modeling of the deck of Tsing Ma Bridge.
The comparison between the two methods is shown in Figure 12. It can be seen that the computed values of the 3D CFD method are close to those of the wind tunnel experiments.
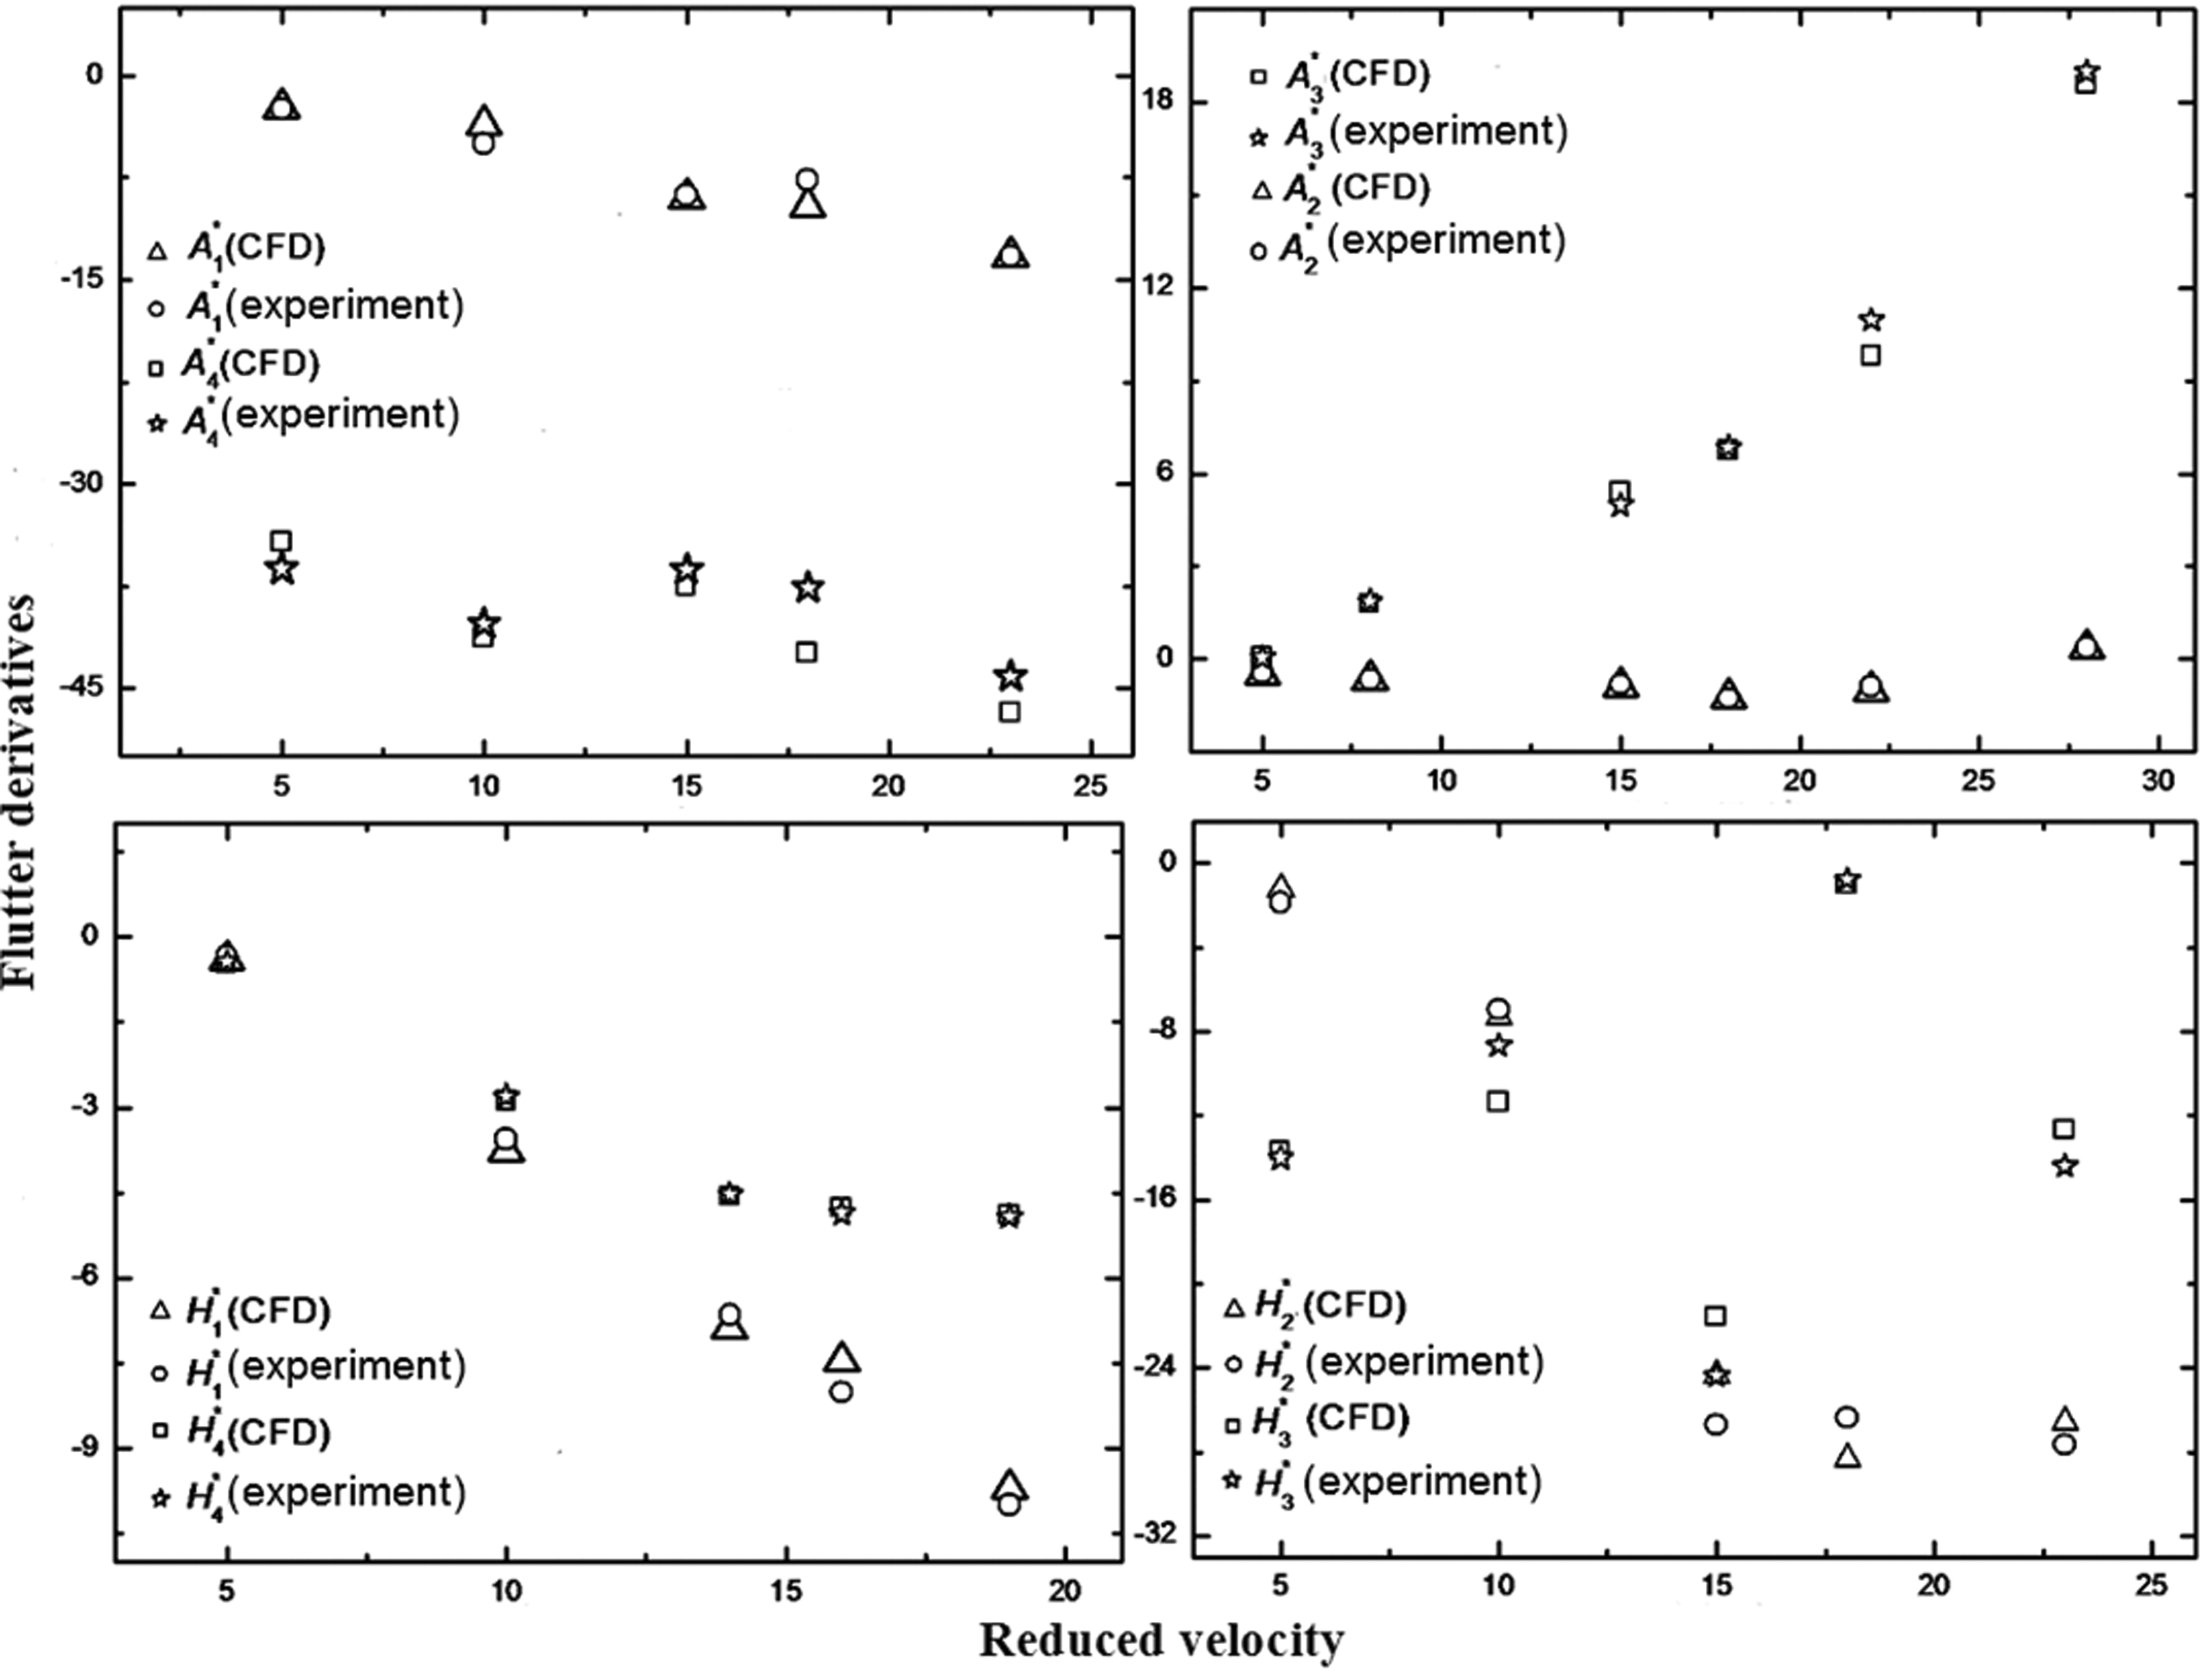
Flutter derivatives of the main span of the Tsing Ma Bridge. CFD: computational fluid dynamics.
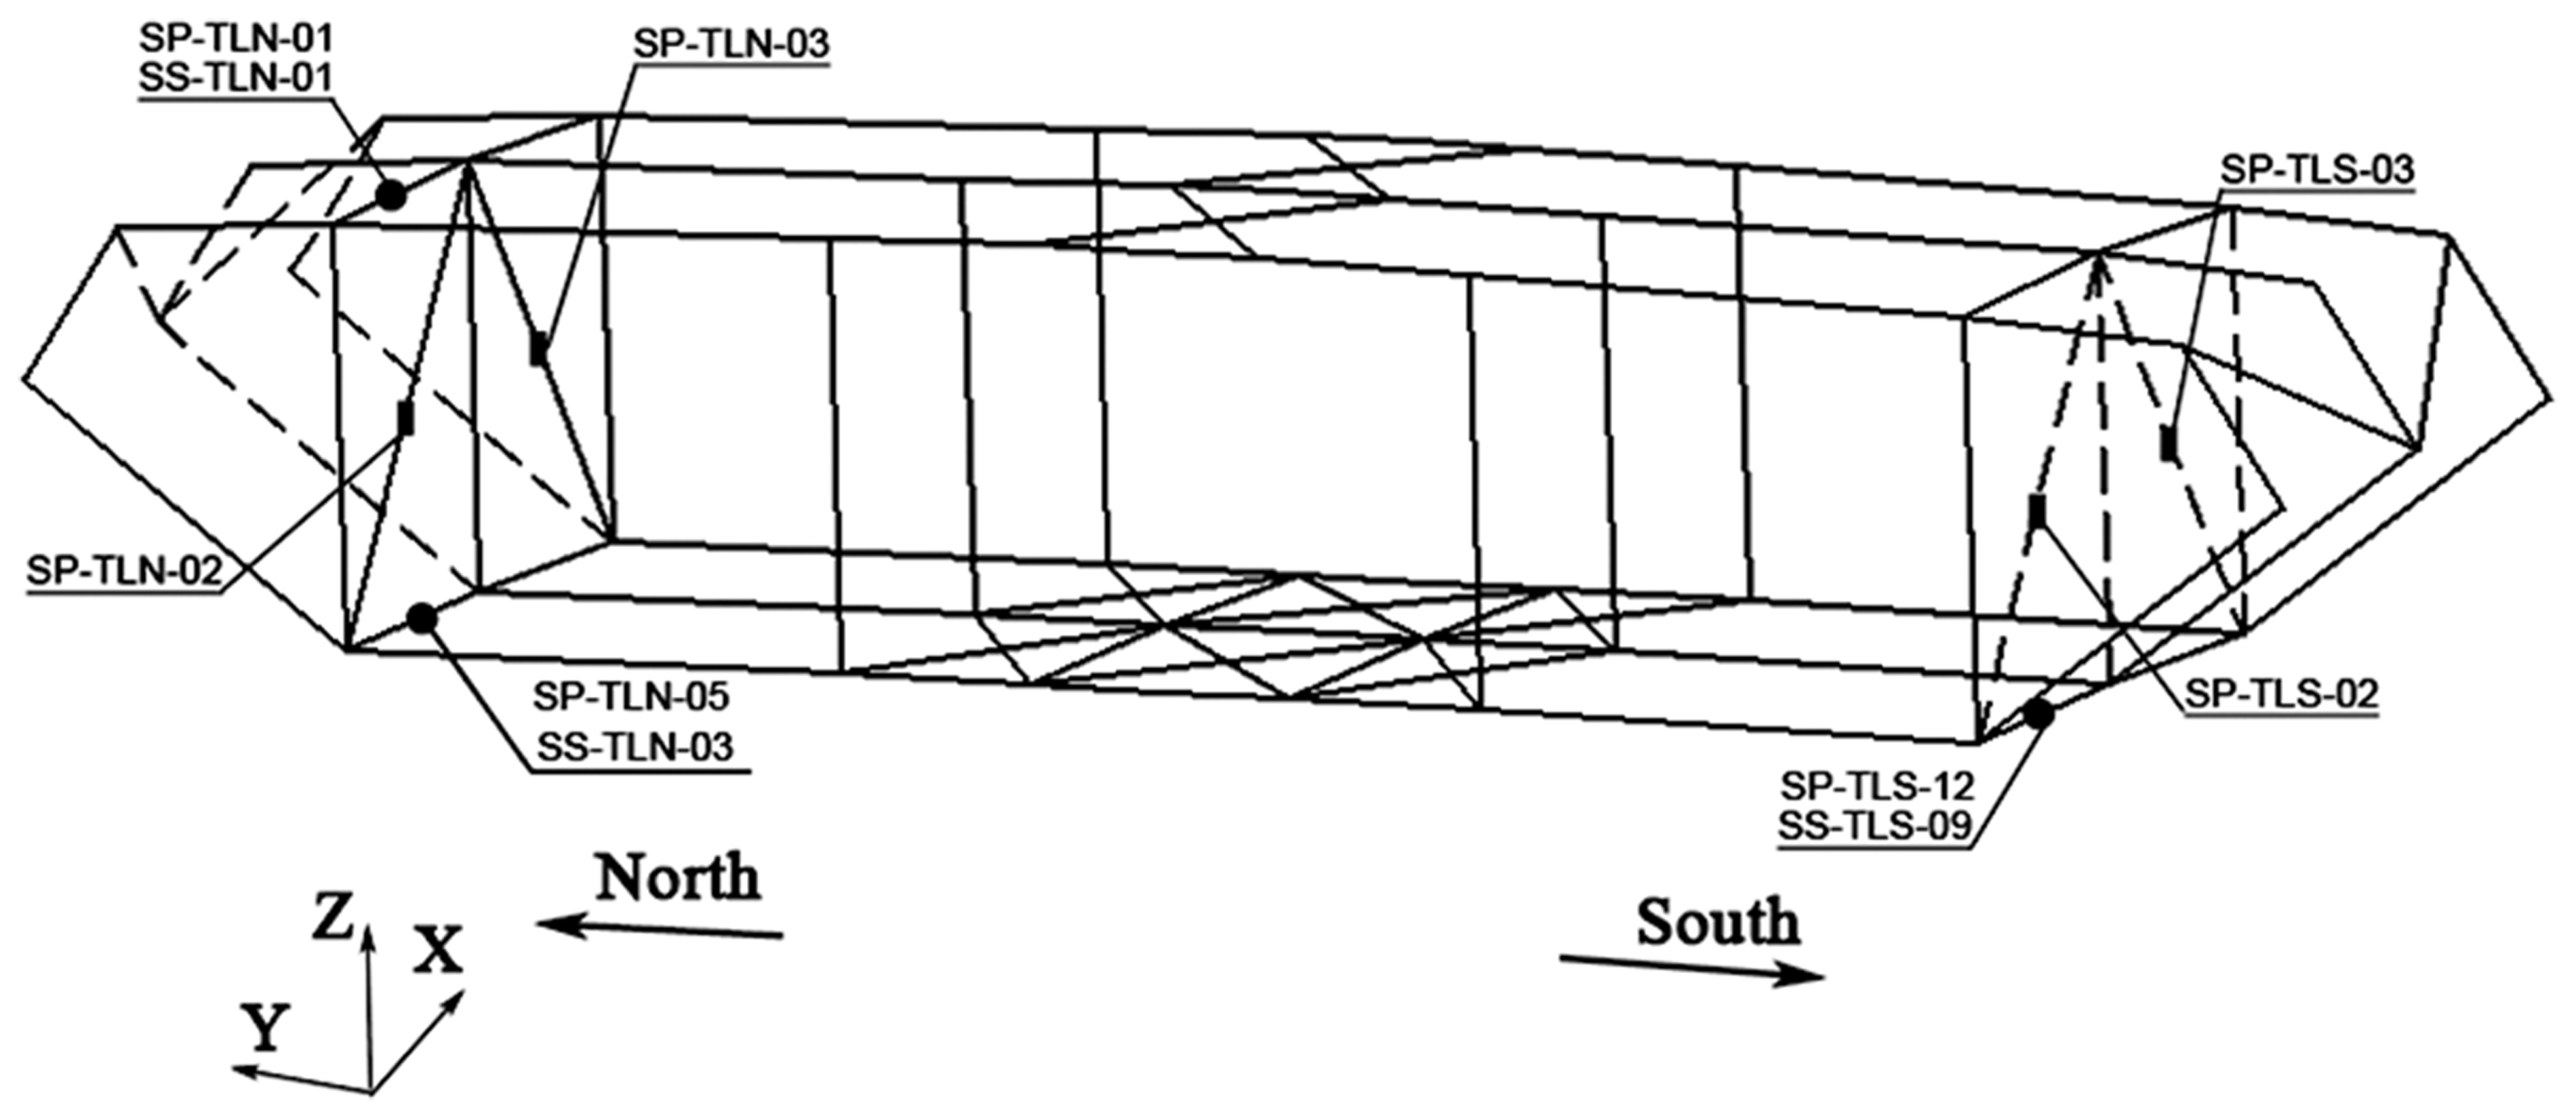
Global positions of 10 strain gauges used by WASHMS.
Then a numerical prediction of the buffeting response of the Tsing Ma Bridge was carried out. The first 80 modes of the structure were used with the highest natural frequency being 1.1 Hz and the modal damping ratio being 0.005, so that the computational range was 0–1.1 Hz. The records of the structural health monitoring system WASHMS when the Tsing Ma Bridge went through the typhoon named York in 1999 were taken as the actual stress data. The record values of 10 strain gages were chosen for comparison with the computed values. Their positions are shown in Figure 13. The notation scheme for the strain gages is as follows: SS-TLN-xx and SS-TLS-xx represent a uniaxial strain gage in the north and south longitudinal trusses of the section L, respectively; and SP-TLN-xx and SP-TLS-xx represent a pair of uniaxial strain gages in the north and south longitudinal trusses of the section L, respectively.
Tables 4 and 5 show the stress response values of the computations based on the aerodynamic parameters from the CFD method and from the wind tunnel experiment. The measured values from WASHMS are also shown for comparison in Table 4. It can be seen that for seven stress responses, the difference between the computed values achieved by the presented method and the measured values is less than 30%; the differences of the other three are in the range of 30–40%. All the computational results were less than the measured values, and the computational results can reveal the buffeting response characteristic of the Tsing Ma Bridge. According to the engineering practice, this difference can be brought due to manufacturing difference between the design model and the actual bridge, local model of the actual bridge, etc. This difference can be acceptable for engineering applications if the relative error can be estimated.
Standard deviation comparison of measured and computed local stresses.
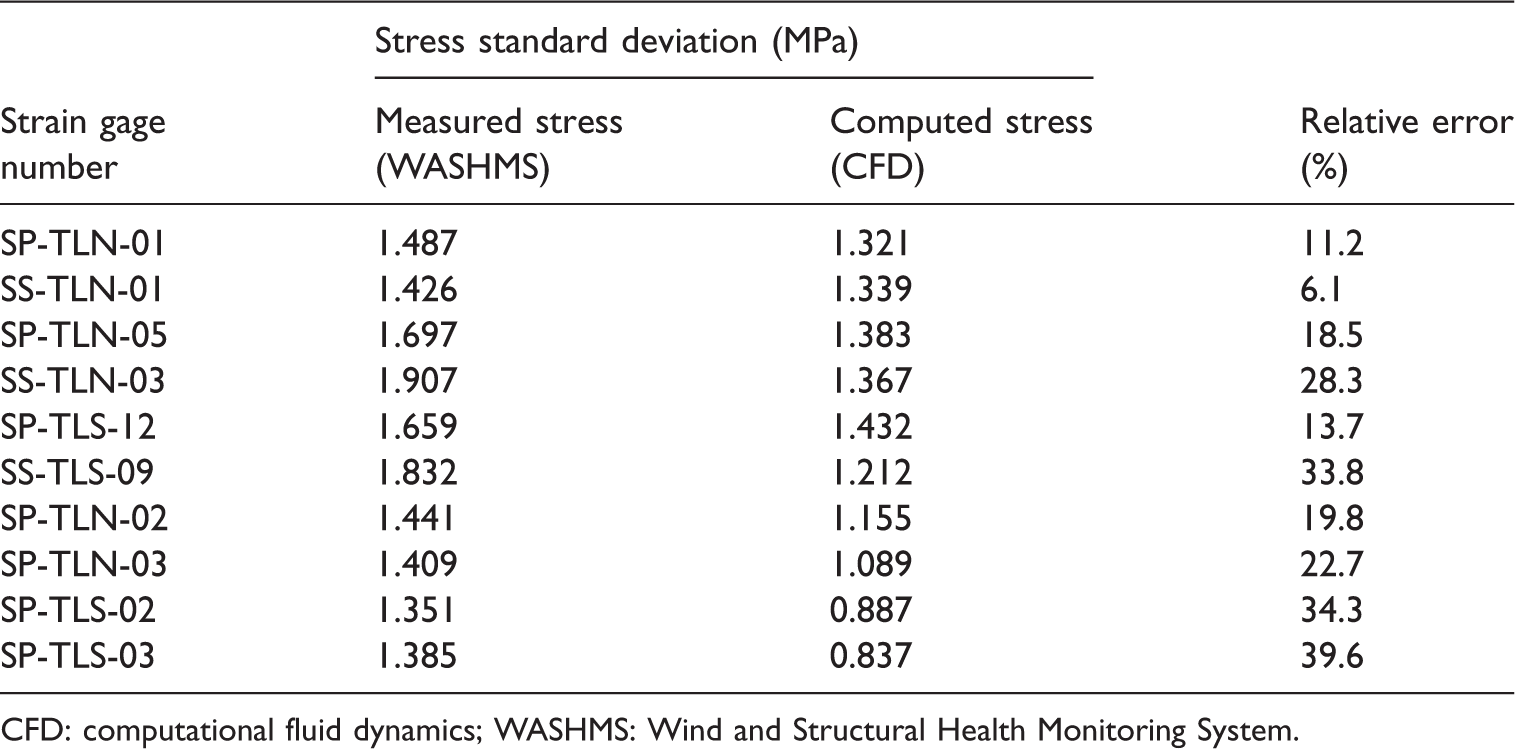
CFD: computational fluid dynamics; WASHMS: Wind and Structural Health Monitoring System.
Standard deviation comparison of local stresses computed using flutter derivatives from the wind tunnel test and CFD numerical simulation.
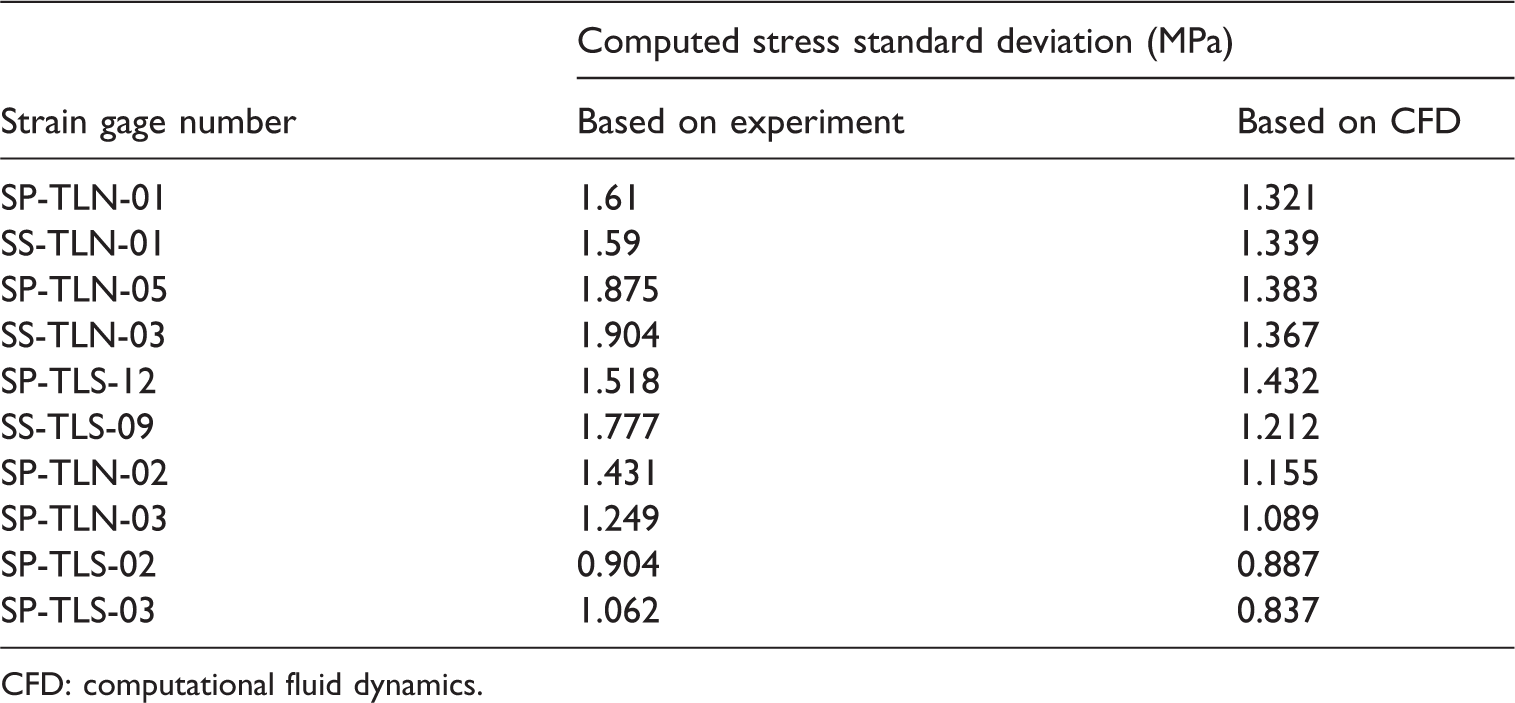
CFD: computational fluid dynamics.
From Table 5, it can also be seen that the difference between the computed stress response values based on the aerodynamic parameters achieved by wind tunnel experiment and the measured values from WASHMS is similar to that between the computed values achieved based on the presented method and the measured values. Hence the usage of the presented method which was developed based on PEM and CFD can certify the efficiency of the complex structural buffeting analysis of the Tsing Ma Bridge.
Conclusions
This paper presents numerical predictions of wind-induced responses for different structures by proposing a developed numerical method based on PEM and CFD. PEM converts the nonuniform random response to dynamic response analysis under deterministic external loads, and CFD computes the aerodynamic parameters accurately. A gust response analysis method for the composite wing and a buffeting response analysis method for the Tsing Ma Bridge are proposed.
For the initial investigation of a composite wing, the computational values based on CFD simulations were less than those based on Theodorsen theory. This occurs because the presented CFD simulations include actual physical phenomena, e.g. aerodynamic viscosity and the thickness of the wing, which can reduce the structure response. Then random response analysis of the composite wing has shown that the changes of the PSD of the wing due to different velocities are similar and exhibit increases near the natural frequencies of the wing. The efficiency was hugely improved without losing accuracy, because the use of PEM and CFD does not cause any approximations or simplifications. Hence the method has significant application value in the field of numerical analysis of wing structures.
Numerical method of buffeting analysis of Tsing Ma Bridge was also developed based on PEM and 3D CFD. The stress response of the Tsing Ma Bridge in Hong Kong was also computed. It was found that the difference between the computed values achieved by the presented method and the measured values from WASHMS can be sufficiently acceptable for engineering applications. Hence the 3D CFD numerical method can be used to replace wind tunnel experiments in order to find aerodynamic parameters effectively. Furthermore, using PEM with the 3D CFD method provides accurate and efficient dynamic response analysis of complex bridge structures.
The simulation results presented demonstrate that the proposed method can provide highly efficient numerical analysis of wind-induced response for structures and so has significant benefits in wind engineering applications.
Footnotes
Declaration of conflicting interests
The author(s) declared no potential conflicts of interest with respect to the research, authorship, and/or publication of this article.
Funding
The author(s) disclosed receipt of the following financial support for the research, authorship, and/or publication of this article: The work was financially supported by the Fundamental Research Funds for the Central Universities (Funding Code DUT16RC(4)29). The authors are also grateful for support from the Cardiff Advanced Chinese Engineering Centre.