
Abstract
In the present study, the noise pollution from different compositions of biodiesel, bioethanol, and diesel fuels in MF285 Tractor was studied in the second and third gears from two positions: driver and bystander, at 1000 and 1600 r/min, and running on 10 different fuel levels. For data analysis, the ANFIS network, neural network, and response surface methodology were applied. Comparing the means of noise pollution at different levels demonstrated that the B25E6D69 fuel, made up of 25% biodiesel and 6% bioethanol, had the lowest noise pollution. The lowest noise pollution was at 1000 r/min. Although the noise pollution emitted in the third gear was a little more than that emitted in the second gear. All the resultant models, laid by response surface methodology, neural network, and ANFIS had excellent results. Considering the statistical criteria, the best models with high correlation coefficients and low mean square errors were ANFIS, response surface methodology, and artificial neural network models, respectively.
Introduction
The source of most noise pollution in tractors ensues from the ignition and structure of the engine itself. On the other hand, ignition depends on the type of fuel and the design of the combustion chamber. It should be noted that two biofuels of biodiesel and bioethanol can be used in diesel engines in pure or mixed forms because of the same features as petrol and diesel fuels. One of the prerequisites for using these biofuels is the analysis of noise pollution in these engines due to fuel changes, which the present study aimed to deal with. Numerous studies have been conducted into the noise pollution emitted by tractors and agricultural machinery. For example, in a study conducted by Celen and Arin into the intensity of noise pollution emitted by tractors, it was concluded that the highest and lowest intensity was near the exhaust and the driver’s seat, respectively. 1
The effects of driving tractors on the hearing loss of Hindi farmers were investigated by Kumar et al., in which 50 farmers with experience of driving tractors and 50 others without the very same experience were studied. Besides, the ability to hear high-frequency sounds was lower among farmers with experience of driving tractors than that among the other group. 2 To predict the intensity of the sound emitted by a 13-HP Tiller, Hassan-Beygi et al. applied the artificial neural networks (ANNs) and found out that the difference between the predicted and real data on the intensity of the sound emitted by the tiller was only two decibels. 3 The results of studies performed by Selim 4 and Andrew et al. 5 indicated that more sound and vibrations are emitted by diesel engines, especially large engines with high ignition pressures and high compression ratios, compared with spark engines that pose adverse effects on their users’ ears and bodies. The results of studies conducted by Yildırım and Eski 6 and Paulraj et al. 7 showed that the neural network (NN) model could be applied to predict the intensity of the noise emitted by cars. Pruvost et al. distinguished between the noise resulting from the combustion and the noise from the mechanical processes in engines, and it was concluded that both the engine revolution and the engine load would influence the intensity of the resultant noise. They also suggested that further research should be conducted in this respect to identify the circumstances, sound pressures, and the scales of the noise that will lead to hearing loss. 8 In a study conducted by Mion et al. on the noise pollution emitted by a tractor pulling a pneumatic planter, the results demonstrated that the noise heard by the driver exceeded the limit set by the occupational safety and health, and it was concluded that the tractor drivers had to use hearing protection equipment. 9 The sound pressure levels and the tractor drivers’ length of exposure to noise were explored in three modes: tractors with and without cabins and the ones with handmade cabins. 10 The effects of different mixtures of petrol and ethanol on the vibrations of cylinder blocks and the noise of spark-ignition engines were investigated. The results showed that with the increase of ethanol in the mixture, the engine’s vibrations and noise increased, particularly within the range of 1500 to 2500 r/min. 11
Artificial intelligence techniques, ANNs, and optimization algorithms are very important for modeling the phenomenon of vibration and noise pollution in the discussion of the relationship between users, machines, and ergonomics. In recent years, the use of these techniques has been expanding.12–15
However, not many studies have been conducted into the effects of biofuels on the noise pollution emitted by tractors. Furthermore, because of the importance of farmers’ health, it seems that conducting some comprehensive research in this respect is of the essence. In the present study, the noise pollution from different compositions of biodiesel, bioethanol, and diesel fuels in the four-cylinder and four-stroke engine of an MF285 Tractor driven in the second and third gears was studied. Further, to predict, evaluate, and describe noise pollution under different circumstances free of charge, some models were proposed with the help of ANFIS, NN, and response surface methodology (RSM), and in the end, the best type of fuel mixture with the least noise pollution was introduced.
Material and methods
In the present study, the noise pollution was measured from two positions, i.e. the driver and the bystander. An unloaded tractor was tested while moving in the second and third gears. According to the standard, the moving tractor should run at a speed of 7.5 km to test the noise pollution. 12 In the case of the MF285 Tractor, this speed is achieved when it is in the second low gear running with 1000 r/min. However, given that the majority of the agricultural operations in this region (Kermanshah) are performed using the second and third gears, these two gears were considered in the experiments.
Various factors were studied in the experiments. For example, using different fuel mixtures was one of the factors. Then, 10 different fuel mixtures were prepared from biodiesel (Bi), bioethanol (Ej), and diesel (Dk). These compounds were as follows: B5E2D93, B5E4D91, B5E6D89, B15E2D83, B15E4D81, B15E6D79, B25E2D73, B25E4D71, B25E6D69, B0E0D100, where the subscripts of each of them represent the volume percent in the fuel mixture.
To conduct the experiment, the single-differential MF285 Tractor, manufactured by the Iranian Tractor Manufacturing Companies, was used.
Two engine speeds of 1000 and 1600 r/min were regarded as the second factor. Moreover, each experiment was repeated three times. The experiments were done in an outdoor flat area with a minimum distance of 2 m between the measurement devices and the tractor under study. In addition, there were no obstacles, such as buildings, metal fences, trees, or vehicles causing remarkable reflection of the noise. The temperature was 15°C, the wind speed was less than 5 m per second at the position where the user was standing, and other climatic conditions did not affect the measurements.
Prior to testing, the environmental conditions as well as the location of the tests were checked to ensure that the conditions were the same. It was ensured that very low and equal background noise was recorded during all tests.
In Figure 1, a 20-m-long track is displayed along which an MF285 Tractor is moving with the specified engine speed and gears. The sound level meter was located in the middle of the track at a height of 1.2 m from the ground and a 2-m distance from the central axis of the tractor, so that the sound level meter was 50 cm away from the front wheels of the tractor.16–20
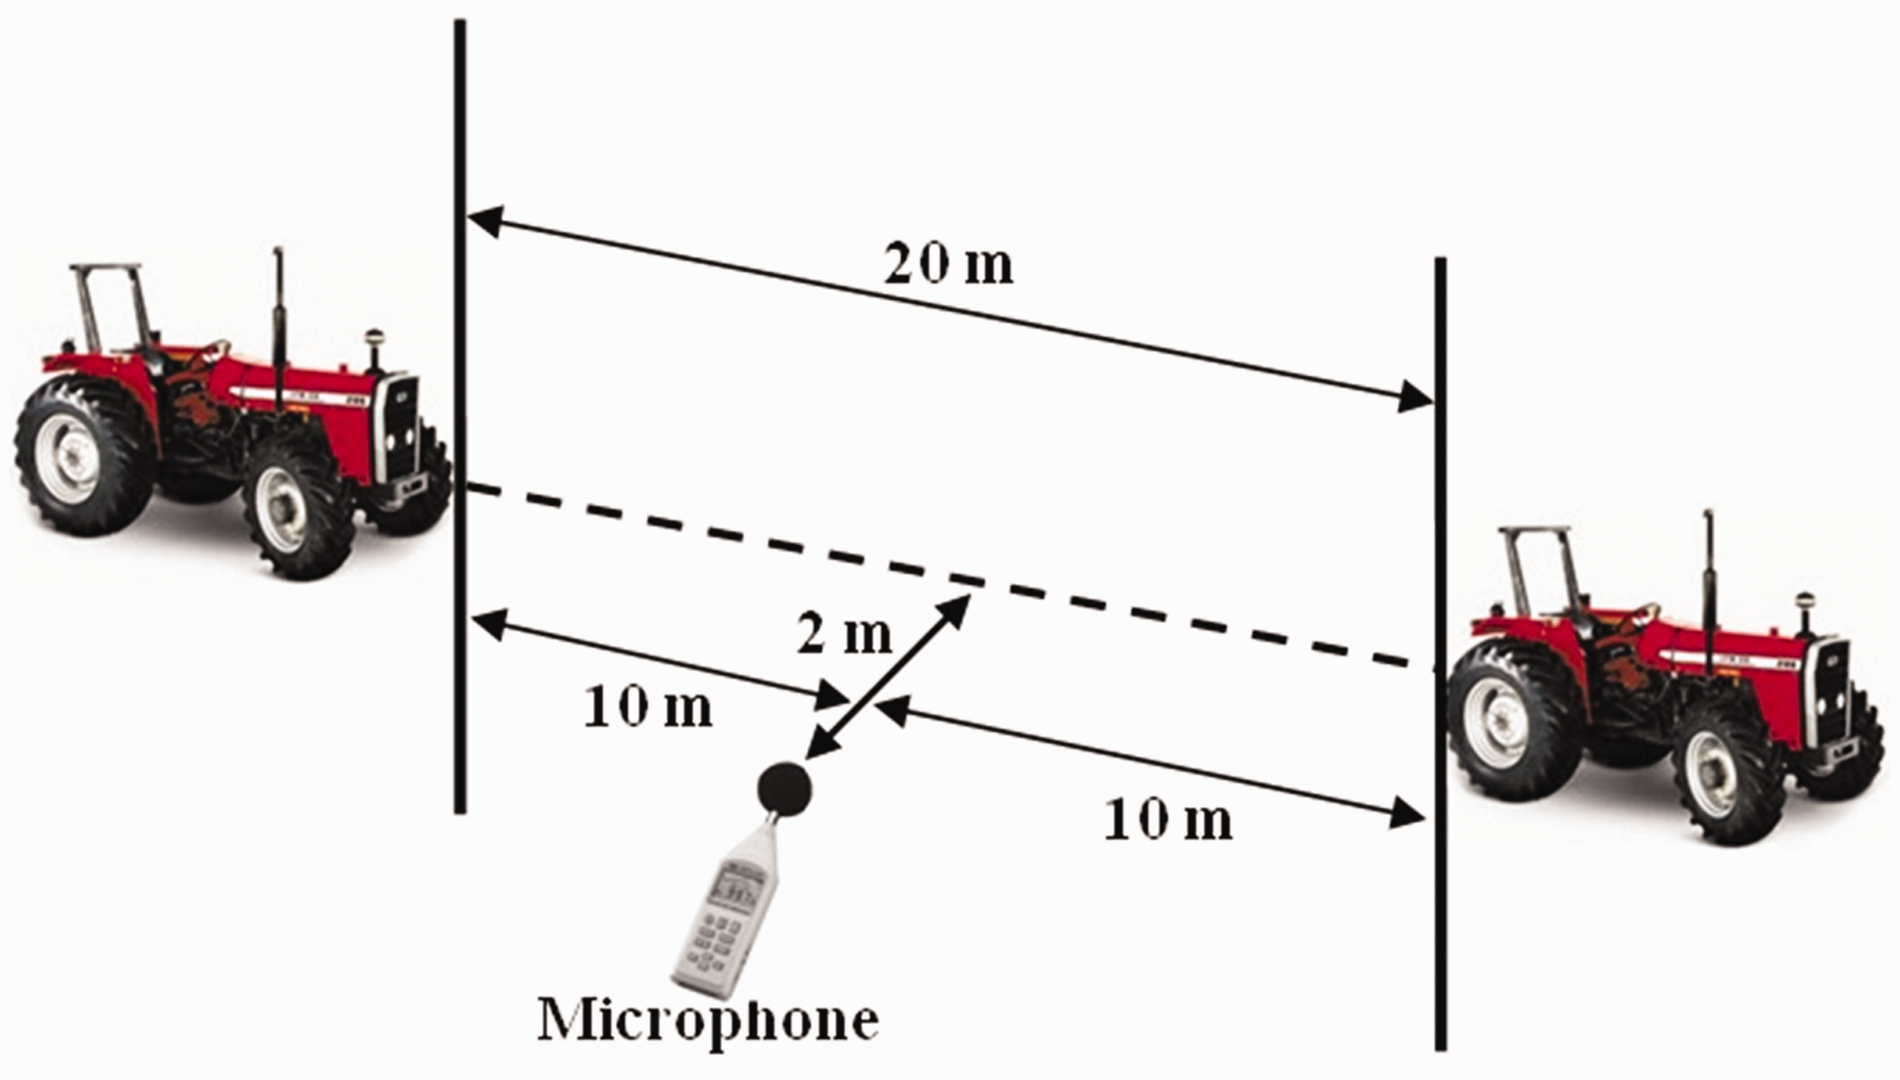
Layout of the test area–microphone positions.
In this study, a collar microphone was attached to the worker’s collar near his right ear. Additionally, to measure the sound level in the bystander’s position, another microphone was horizontally installed at a height of 120 cm during the experiment. At least three measurements were taken for each of the positions of the microphones and each of the operating conditions. The MF285 Tractor, the noise dosimeter attached to the collar of the driver, and the sound level meter sitting on a tripod are displayed in Figure 2.
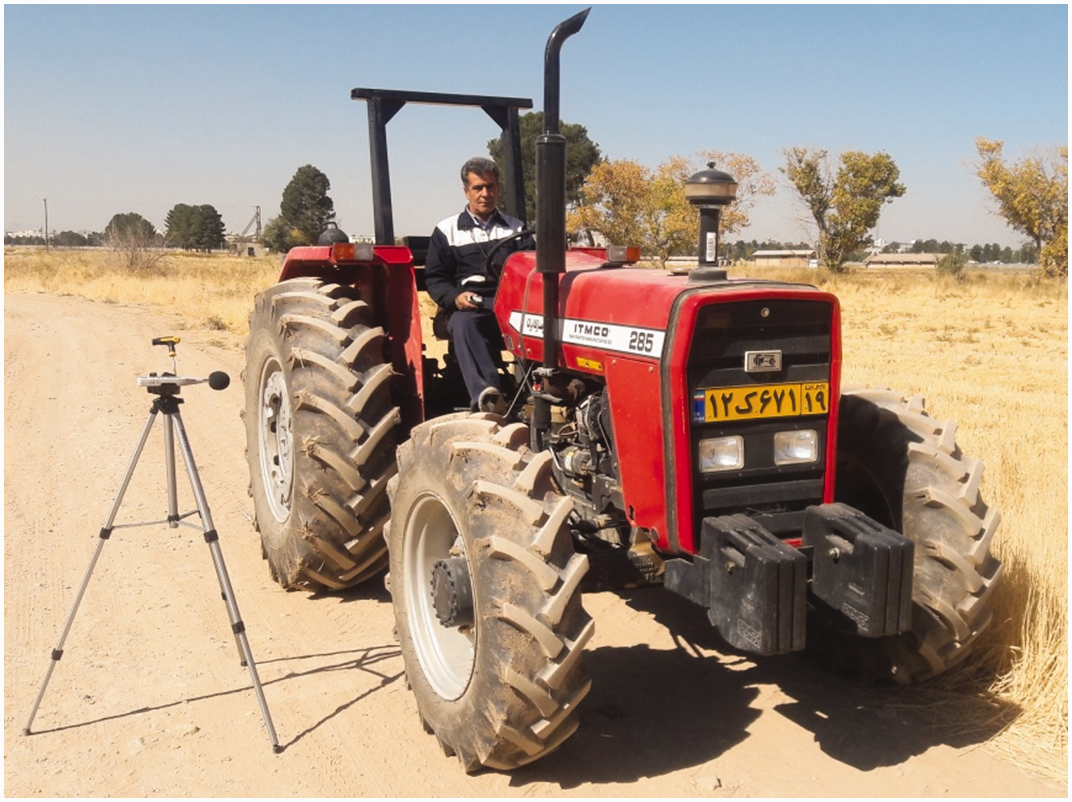
Image of the MF285 Tractor and the microphones.
The measurements were made after the engine was running steadily for 10 s. To measure the sound level in the user’s position, the noise dose meter TES-1354 was used, and to measure the sound level in the bystander’s position, the sound level meter TES-52A was utilized. Besides, the resolution of these Taiwan-made devices was 0.1 dB (see Figure 3). Prior to data acquisition, the aforesaid devices, that is the noise dosimeters and sound level meter were calibrated.
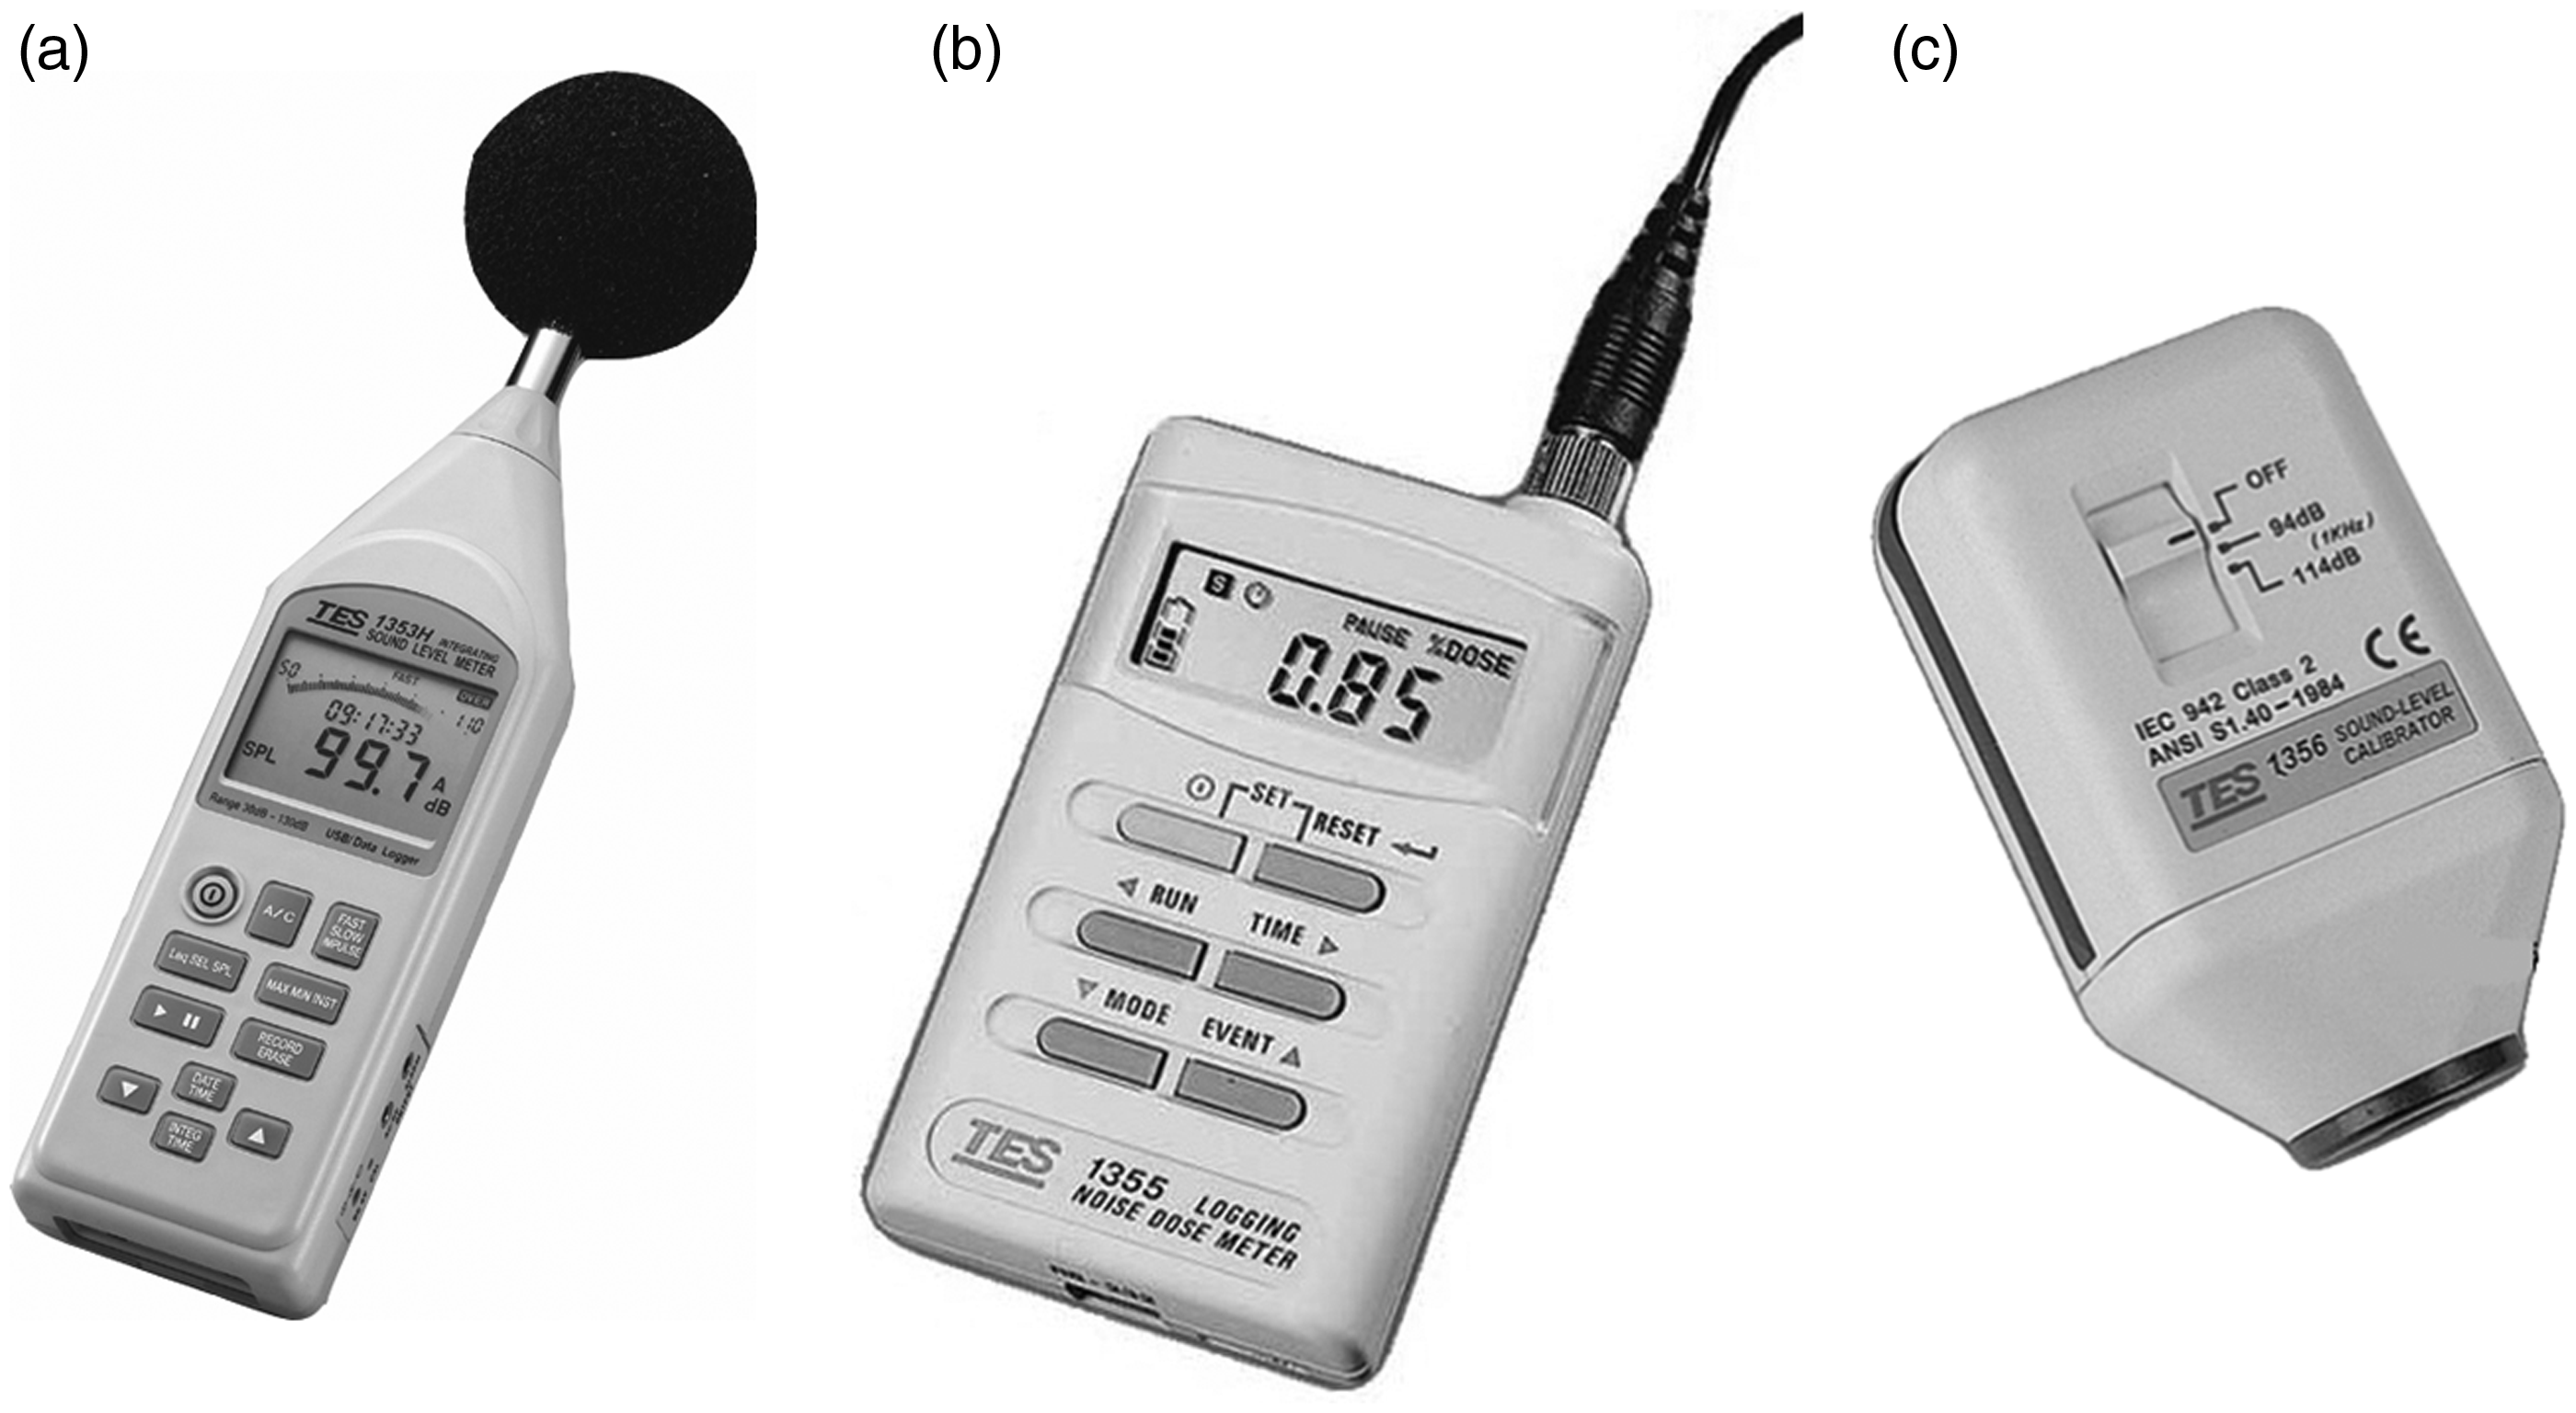
Measuring instruments: (a) sound level meter TES-52A, (b) noise dose meter TES-1354, and (c) sound level calibrator.
Data analysis
Modeling was performed to meet two objectives: (1) to simulate the effects of changes in various parameters on noise pollution emitted by tractors, (2) to develop a model for prediction. All models had three input variables: biodiesel, bioethanol, and engine speed, and the only output were noise pollution in decibels.
In modeling through ANFIS, five major factors were optimized to ensure the best possible model was achieved. These five factors were as follows: the type of input fuzzy sets, the number of input fuzzy sets, the type of output fuzzy sets, the type of the optimization algorithm, and the number of epochs. There were various types of input fuzzy sets: triangular, trapezoidal, Gaussian, Sigmoid, subtracting and multiplying two Sigmoid functions, hybrid Gaussian, generalized bell-shaped, and P. Additionally, there were two kinds of output fuzzy sets: constant and linear, and there were two kinds of optimization algorithms: hybrid and back-propagation. In this method, 30% of the data was used for testing and the remaining 70% of the data was used for training. In NN modeling, the MATLAB R2013a software was used, and in RSM, the design Expert software (version 7.0) was applied.
The evaluation criteria were used for measuring the predictive power of the models. These criteria were correlation coefficient (R) and mean squared error (MSE) as follows
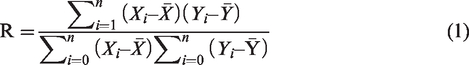

Results and discussion
The sound signals emitted from tractors, generally in the human hearing range, are alternate and have various frequencies. Many researchers have worked on the frequency of sound emitted from engines.21–23 After converting the sound signal to the frequency domain, the changes in the frequency range of the Massey Ferguson Tractor were between 30 and 8000 Hz, with a maximum noise pollution at 1000 r/min and frequencies of 33 and 66 Hz as well as at 1600 r/min and frequencies of 53 and 106 Hz. It should be noted that noise pollution in different fuels is different, but its maximum values are at the said frequencies. It can be expressed that the cause of increased noise pollution at these frequencies is related to the engine. Since the MF285 Tractors have four cylinders and ignitions occur in two cylinders in each revolution. It seems that the engine has 16.66 revolutions per second at 1000 r/min and two ignitions occur in each revolution. As a result, the frequency of 33 Hz can be related to engine ignition, and since the valves are open and closed four times in each round, the frequency of 66 Hz is also related to the valves, which will increase as the engine speed increases.
The overall results of the study are shown in Figures 4 and 5. The changes in noise pollution in proportion to the changes in the percentage of bioethanol in fuel mixtures are shown at an engine speed of 1000 r/min in the second (Figure 4(a)) and third (Figure 5(a)) gears (see Figure 4). Figure 5 shows the engine speed of 1600 r/min. The effects of changing the percentage of bioethanol in fuel mixtures are shown in the driver and bystander’s positions (see Figures 4 and 5). For example, in Figure 4(a), the diagram driver-25 measured the noise pollution in the driver’s position and fuel mixtures were combined with 25% of biodiesel.
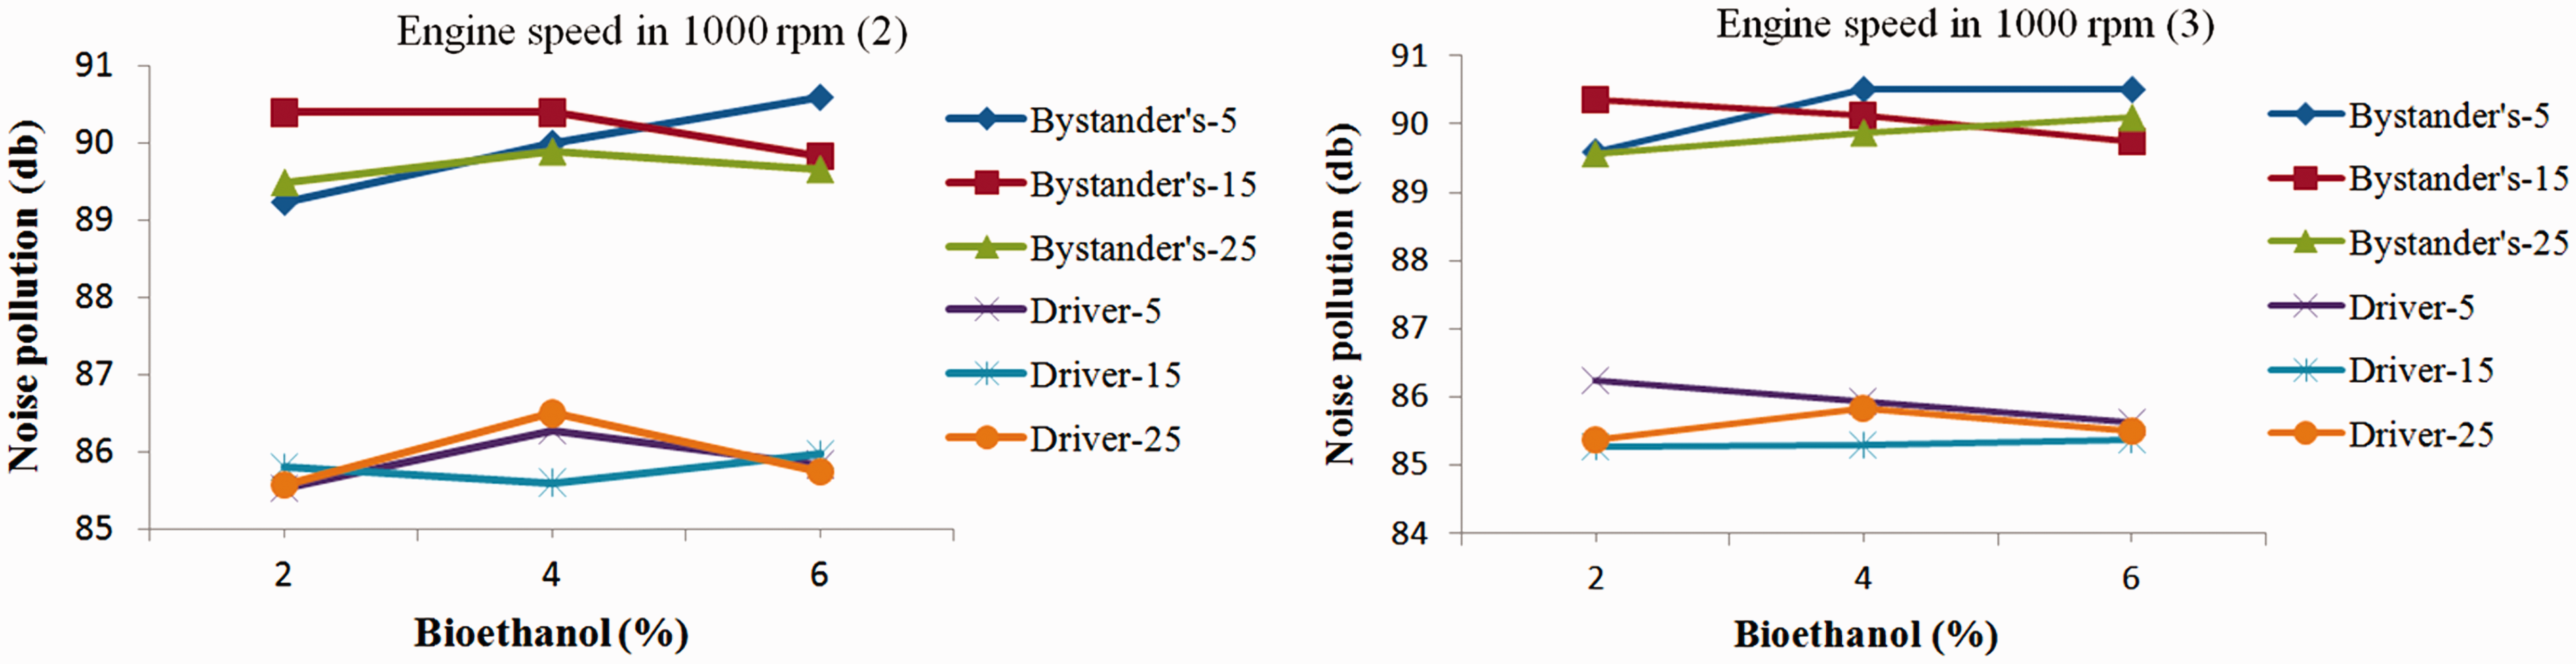
Graphs of noise pollution in proportion to the changes in the percentage of bioethanol at an engine speed of 1000 r/min.
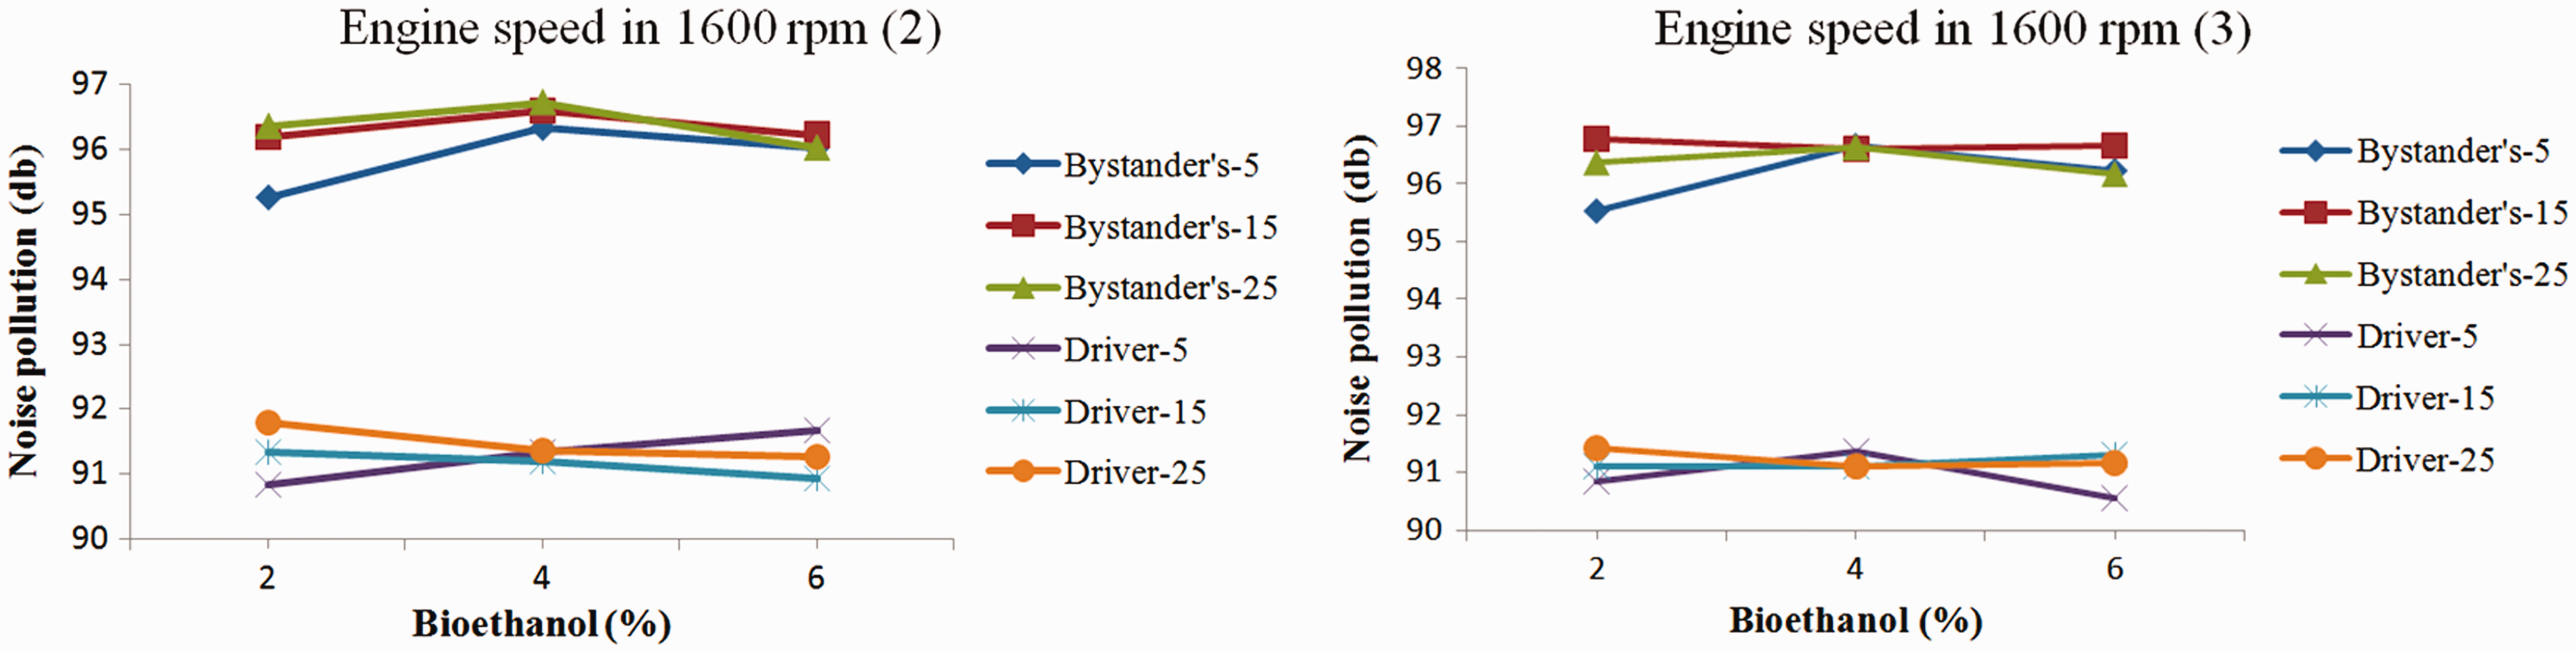
Graphs of noise pollution in proportion to the changes in the percentage of bioethanol at an engine speed of 1600 r/min.
According to the graphs in Figures 4 and 5, it was concluded that the noise pollution was generally less in the driver’s position than that in the bystander’s. The main source of noise in tractor was the engine. As for the reason why there was less noise in the driver’s position, it should be remarked that the distance of the driver from the engine was a little farther than that of the bystander. Based on the acoustic theory, there is less noise pollution in the driver’s position because there are many parts of the tractor that somewhat obstruct the emitted noise, whereas there was nothing between the bystander and the engine acting as obstacles. This fact is perceived through observing the slight changes in the graphs of noise pollution in the driver’s position because of the changes in other decisive parameters. Increasing the percentage of bioethanol in fuel mixtures up to 4% combined with a low percentage of biodiesel resulted in a rise in noise pollution. Similarly, increasing the percentage of bioethanol in fuel mixtures up to 4% combined with a high percentage of biodiesel led to a rise in noise pollution, too. While combined with a high percentage of biodiesel, increasing the percentage of bioethanol more than 4% in fuel mixtures reduced the noise pollution. Adding ethanol to diesel fuel both lessens the Cetane number and increases the delay of ignition, resulting in a rise in the pressure of the cylinder. 24
Since the pressure in the cylinder and the distribution of pressure waves have direct effects on the vibrations of engine blocks, rising the amount of ethanol from 4% to 6% increases the engine vibrations and noise pollution, 25 whereas increasing the amount of ethanol from 2% to 4% leads to a trifling decrease in the engine vibrations and noise pollution, which seems to be due to the interactions of the combined biodiesel.
Other researchers have shown that a rise in ethanol lessens the noise emitted by engines at low engine speeds, whereas the very same case at low engine speeds results in a rise in noise pollution. 26
The combustion noise is correlated with the maximum pressure generated in the cylinder. Accordingly, high pressures in the cylinder emit high levels of combustion noise and vice versa. The maximum pressure can be diminished through reducing the ignition delay to the extent that the engine will run more smoothly. 27
The ignition delay is lengthened with the increase of the ratio of the mass of ethanol in the fuel mixture. The main factors that contribute to increasing the ignition delay are low Cetane number, high latent heat of evaporation, and higher auto-ignition temperatures of ethanol. 28 Increasing the percentage of ethanol in the fuel mixture results in a drop in the Cetane number of the fuel since the Cetane number of ethanol is low.29,30
Ethanol is converted into fine particles due to its lower density and viscosity. It also mixes well with air, burns quickly and generates much heat. The density and surface tension of the fuel are diminished with a rise in the ratio of ethanol in the fuel mixture, and it mixes well with air because of the evaporation of the ethanol particles. As a result, there will be improvements to its microscopic behavior during spray and its function during conversion into fine particles, thereby resulting in burning more fuel in the pre-mixed stage and a drop in the maximum pressure of the cylinder. 25
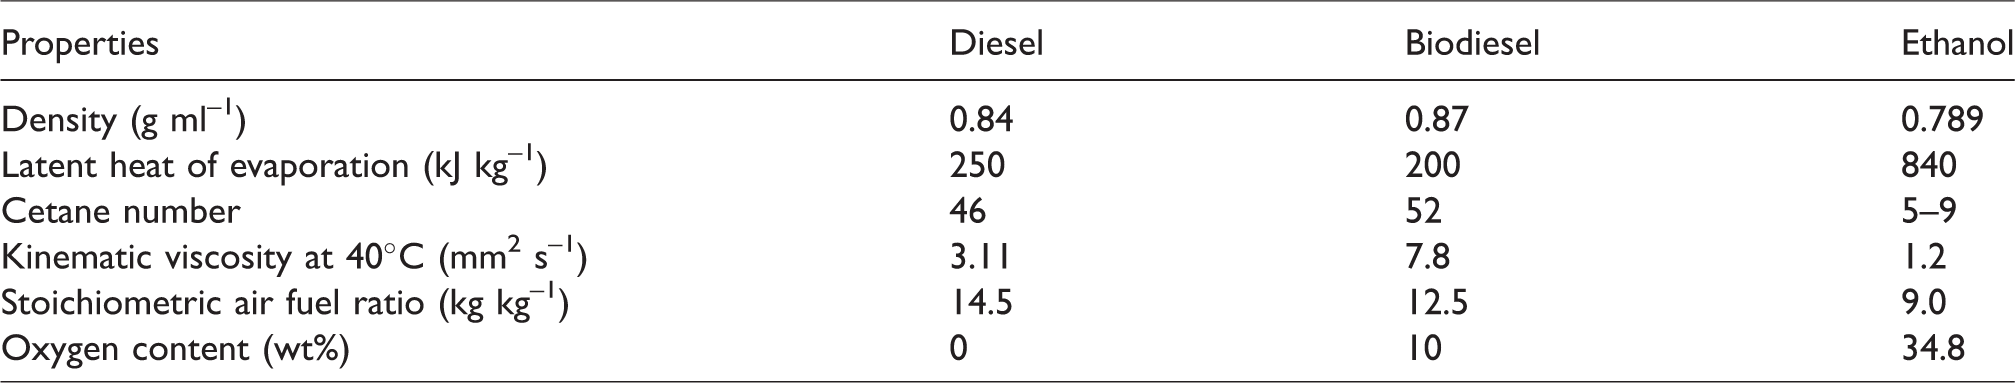
Some of the characteristics of diesel, biodiesel, and ethanol are shown in Table 1.
With regard to biodiesel and blended fuels, shorter ignition delays have been investigated and reported by many researchers.31,32 Research indicates that the sound level drops in all fuel mixtures compared to the pure diesel. The sound level is intensified through increasing the pressure of the cylinder in all tested fuel samples. The lower sound levels compared to that emitted through using the pure diesel may be related to the higher viscosity of the fuel mixtures, thereby resulting in the lubrication and damping of the engine and reducing the sound level. Secondly, higher Cetane numbers in fuel mixtures lessen the ignition delay, cause reductions in the maximum pressure of the cylinder, and diminish the noise emitted by the engine. In addition, it has been shown that the sound of the engine is diminished through increasing the oxygen content in the fuel mixtures because the efficiency of the ignition is improved.
In other words, it can be remarked that ethanol increases the ignition delay due to its low Cetane number, high latent heat of evaporation, and higher auto-ignition temperatures, which expands the maximum pressure of the cylinder and the emitted noise. On the other hand, it lessens the surface tension of the fuel, speeds up the evaporation, mixes well with air, triggers better ignition and cuts the emitted noise down. Not to mention, the high oxygen content of ethanol contributes to increasing the efficiency of the ignition and diminishing the emitted noise.
In contrast, biodiesel lessens the ignition delay due to its high Cetane number, low latent heat of evaporation, and lower auto-ignition temperatures, thereby leading to reductions in the maximum pressure of the cylinder and the emitted noise. Additionally, the high viscosity of biodiesel contributes to the lubrication of the engine parts, thereby causing further reductions in the noise emitted by the engine. Although the oxygen content of biodiesel is less than that in ethanol, it increases the efficiency of the ignition and lessens the emitted noise owing to its higher oxygen content compared to that in diesel.
In general, increasing biodiesel cuts down the emitted noise, but increasing ethanol cannot be analyzed precisely due to its opposite effects on the emitted noise. No comments can be made on the outcome of the effects due to the different amounts of fuel mixtures (biodiesel, ethanol, and diesel) as well as the diversity of their effects.
Consequently, the results of the study were indicative of the fact that the lowest noise pollution was emitted through employing the fuel mixtures compared to pure diesel due to many contributing factors, including the increased content of oxygen, reduction of the ignition delay, high viscosity, lubrication of the engine parts, damping, and so forth. 33 However, the B25E6D69 fuel emitted the lowest noise pollution as opposed to other fuel mixtures.
Given the levels of noise pollution in Figures 4 and 5, it can be inferred that with the increase of engine speed, the noise pollution increases in both the driver and bystander’s positions. In other words, with the increase of engine speed in all fuel mixtures, the frequency of the reciprocating motions of moving parts in engines and piston strokes per unit of time are increased, thereby leading to increasing the working cycles in engines per unit of time. On the other hand, since each working cycle of the engine is accompanied by combustion, the combustion is increased. Thus, with the increase of the number of working cycles and piston strokes per unit of time, the engine vibrations are increased per unit of time, thereby causing more noise pollution. This finding was consistent with the results of studies conducted by Taghi Zadeh-Ali Aaraei et al. 34 and Zoldy 35 (see Figure 6).
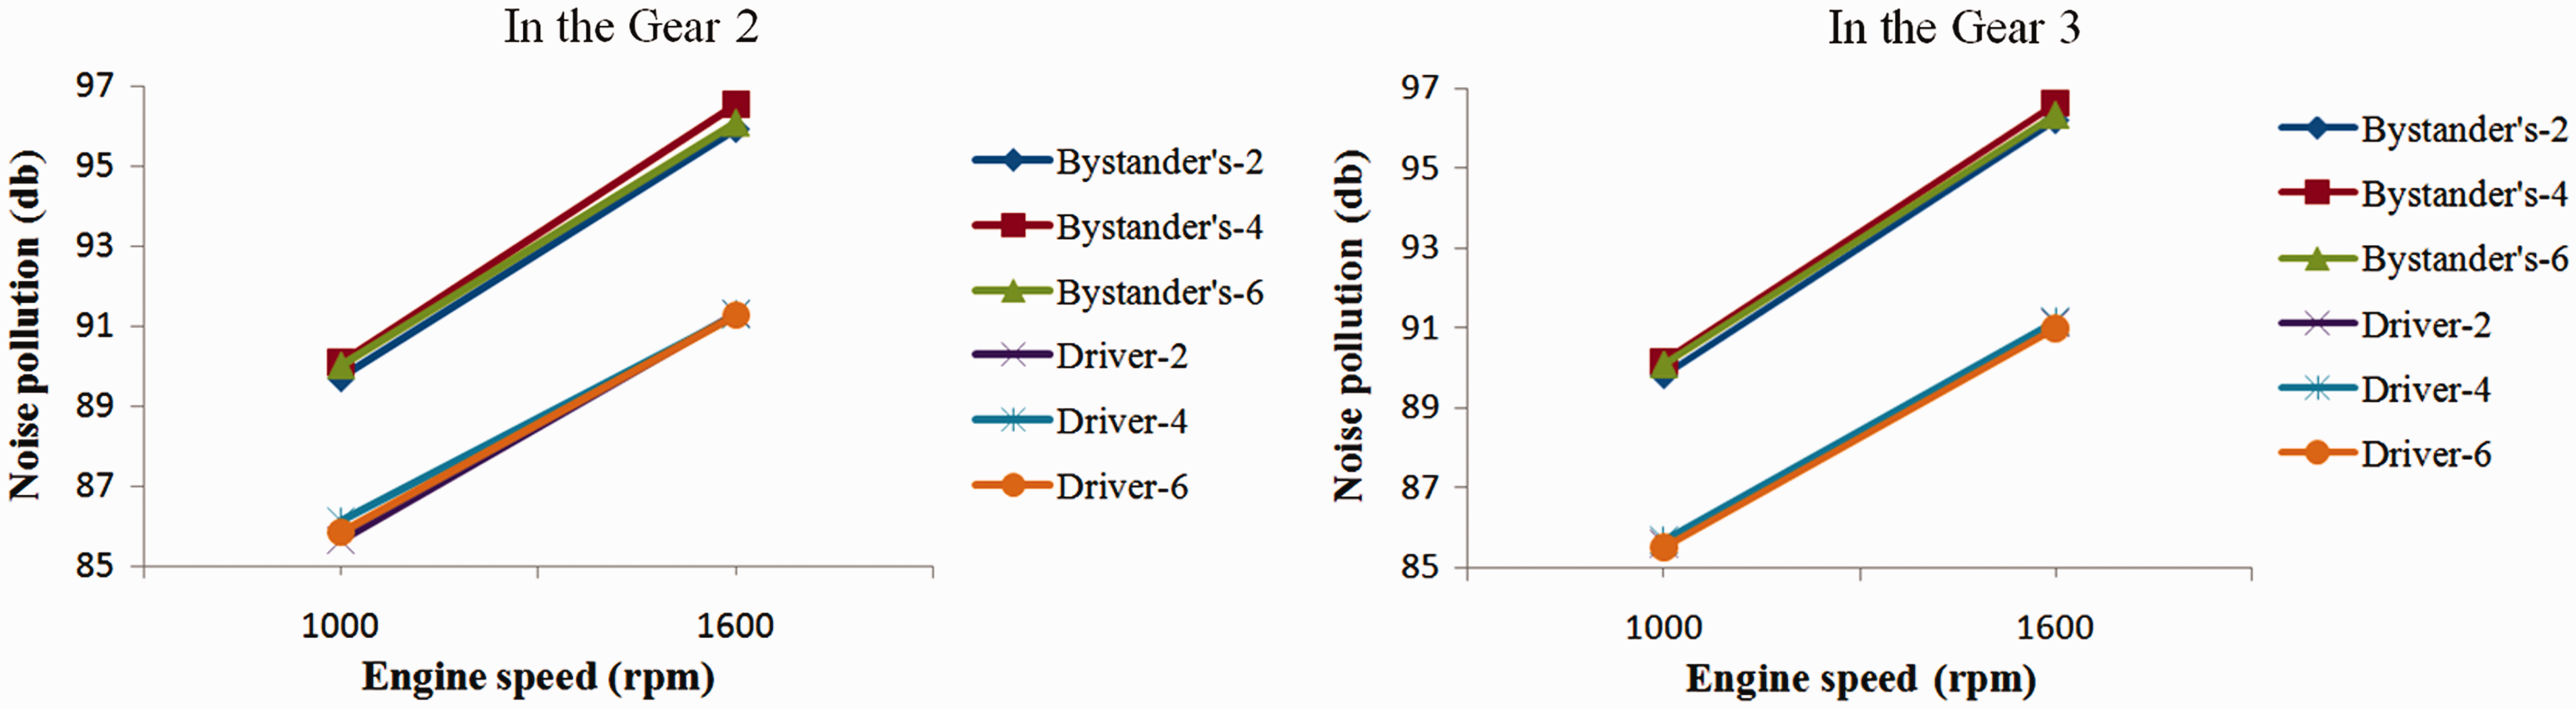
Noise pollution in proportion to the changes in engine speed and the different percentages of biodiesel.
In Figure 6, it is shown that a change in the percentage of bioethanol in fuel mixtures on average led to little change in noise pollution at various revolutions, whereas the noise pollution emitted in the third gear was more than that in the second gear. The increase in noise pollution was trifling, though. However, given the levels of noise pollution in both graphs, it can be inferred that the noise pollution was lower in the driver’s position. Similarly, with the change of the percentage of bioethanol, trifling changes were observed in the noise pollution.
The results of modeling through ANFIS
The ANFIS Models were individually designed and optimized for each of the drivers and the bystander’s positions. All ANFIS Models had three input variables: the percentage of the change of biodiesel, the percentage of the change of bioethanol and engine speed (r/min), and the only output was noise pollution in decibels. The details of the performance of the resultant models are shown in Table 2.
Results of the best models of ANFIS.
The ANFIS Models were optimized using a hybrid method. The input fuzzy sets were Gaussian, and the output fuzzy sets were linear. An example of the three-dimensional graph of ANFIS Model in the driver’s position at 1000 r/min, moving in the third gear, is shown in Figure 7.
Graph of ANFIS Model for noise pollution emitted by a tractor running on the spot at 1000 r/min in the third gear and the driver’s position.
As it can be seen in Figure 7, with the increase of the percentage of biodiesel, the amount of noise pollution lessens to some extent. However, the effects of the changes in bioethanol on noise pollution are a little complicated. In sum, it can be concluded that the noise pollution is decreased through rising the percentage of bioethanol to 3–4%, whereas with its further increase, the noise pollution will intensify.
The results of modeling through NN
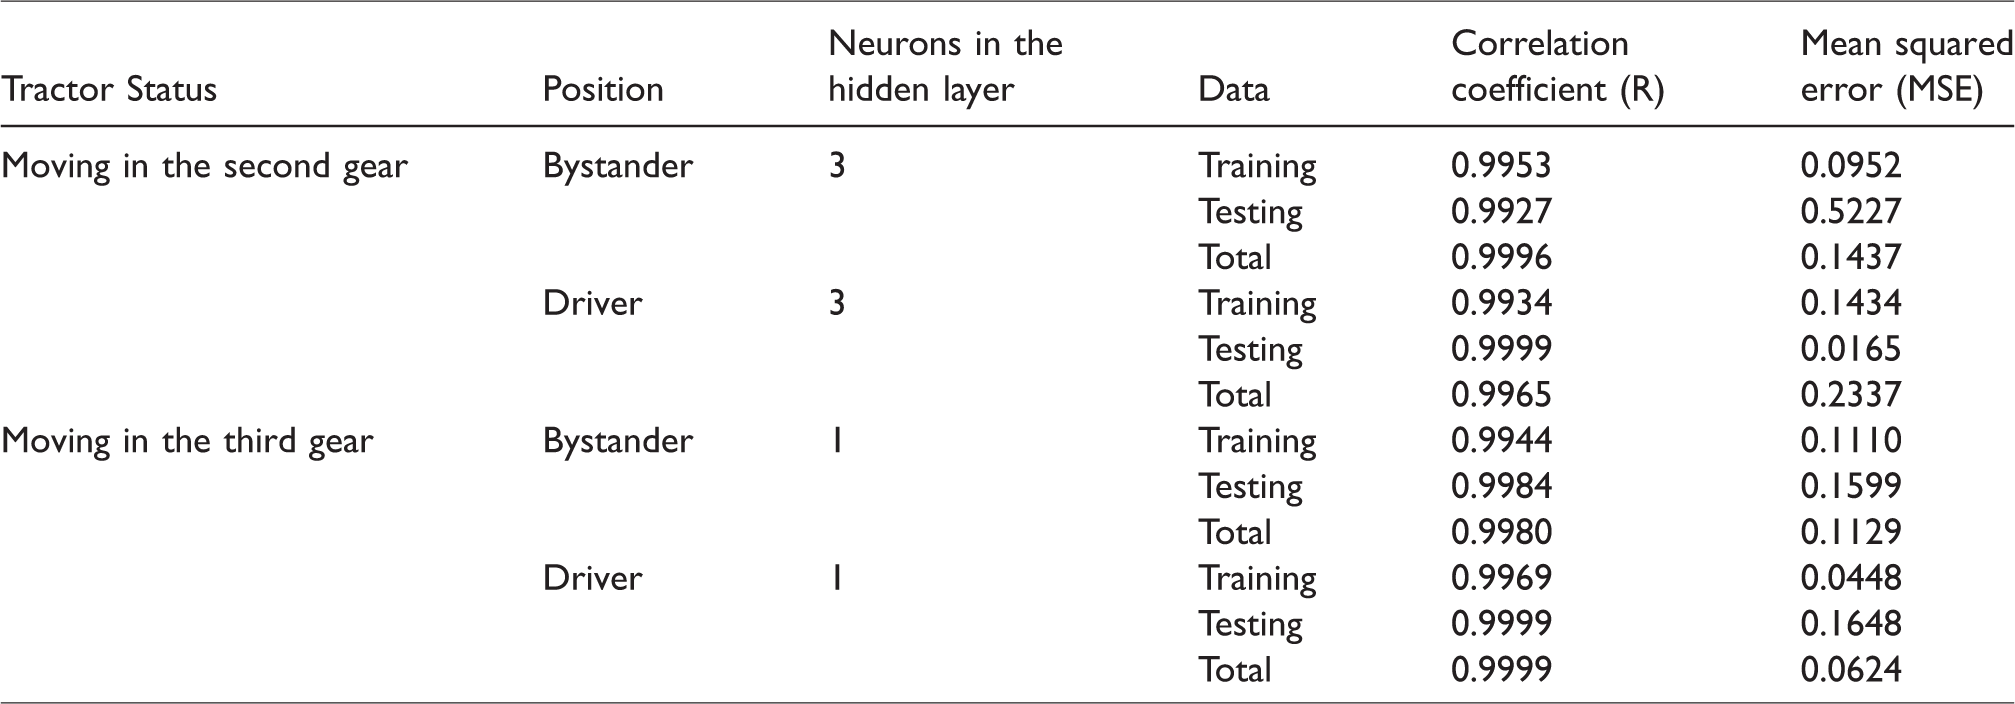
The best resultant NN Models have two layers: output and hidden. The results of modeling through NN are shown in Table 3.
Results of the best models of neural network.
An example of the three-dimensional graphs of the results of the ANN Models in the driver’s position at 1000 r/min, moving in the third gear, is shown in Figure 8. Although the graph trend of the ANN is similar to the three-dimensional graph of ANFIS, the results of both models are alike in that with the increase of the percentage of biodiesel and bioethanol, the noise pollution is decreased. The lowest amount of noise pollution occurs in the combination of six and 25% bioethanol and biodiesel, respectively.
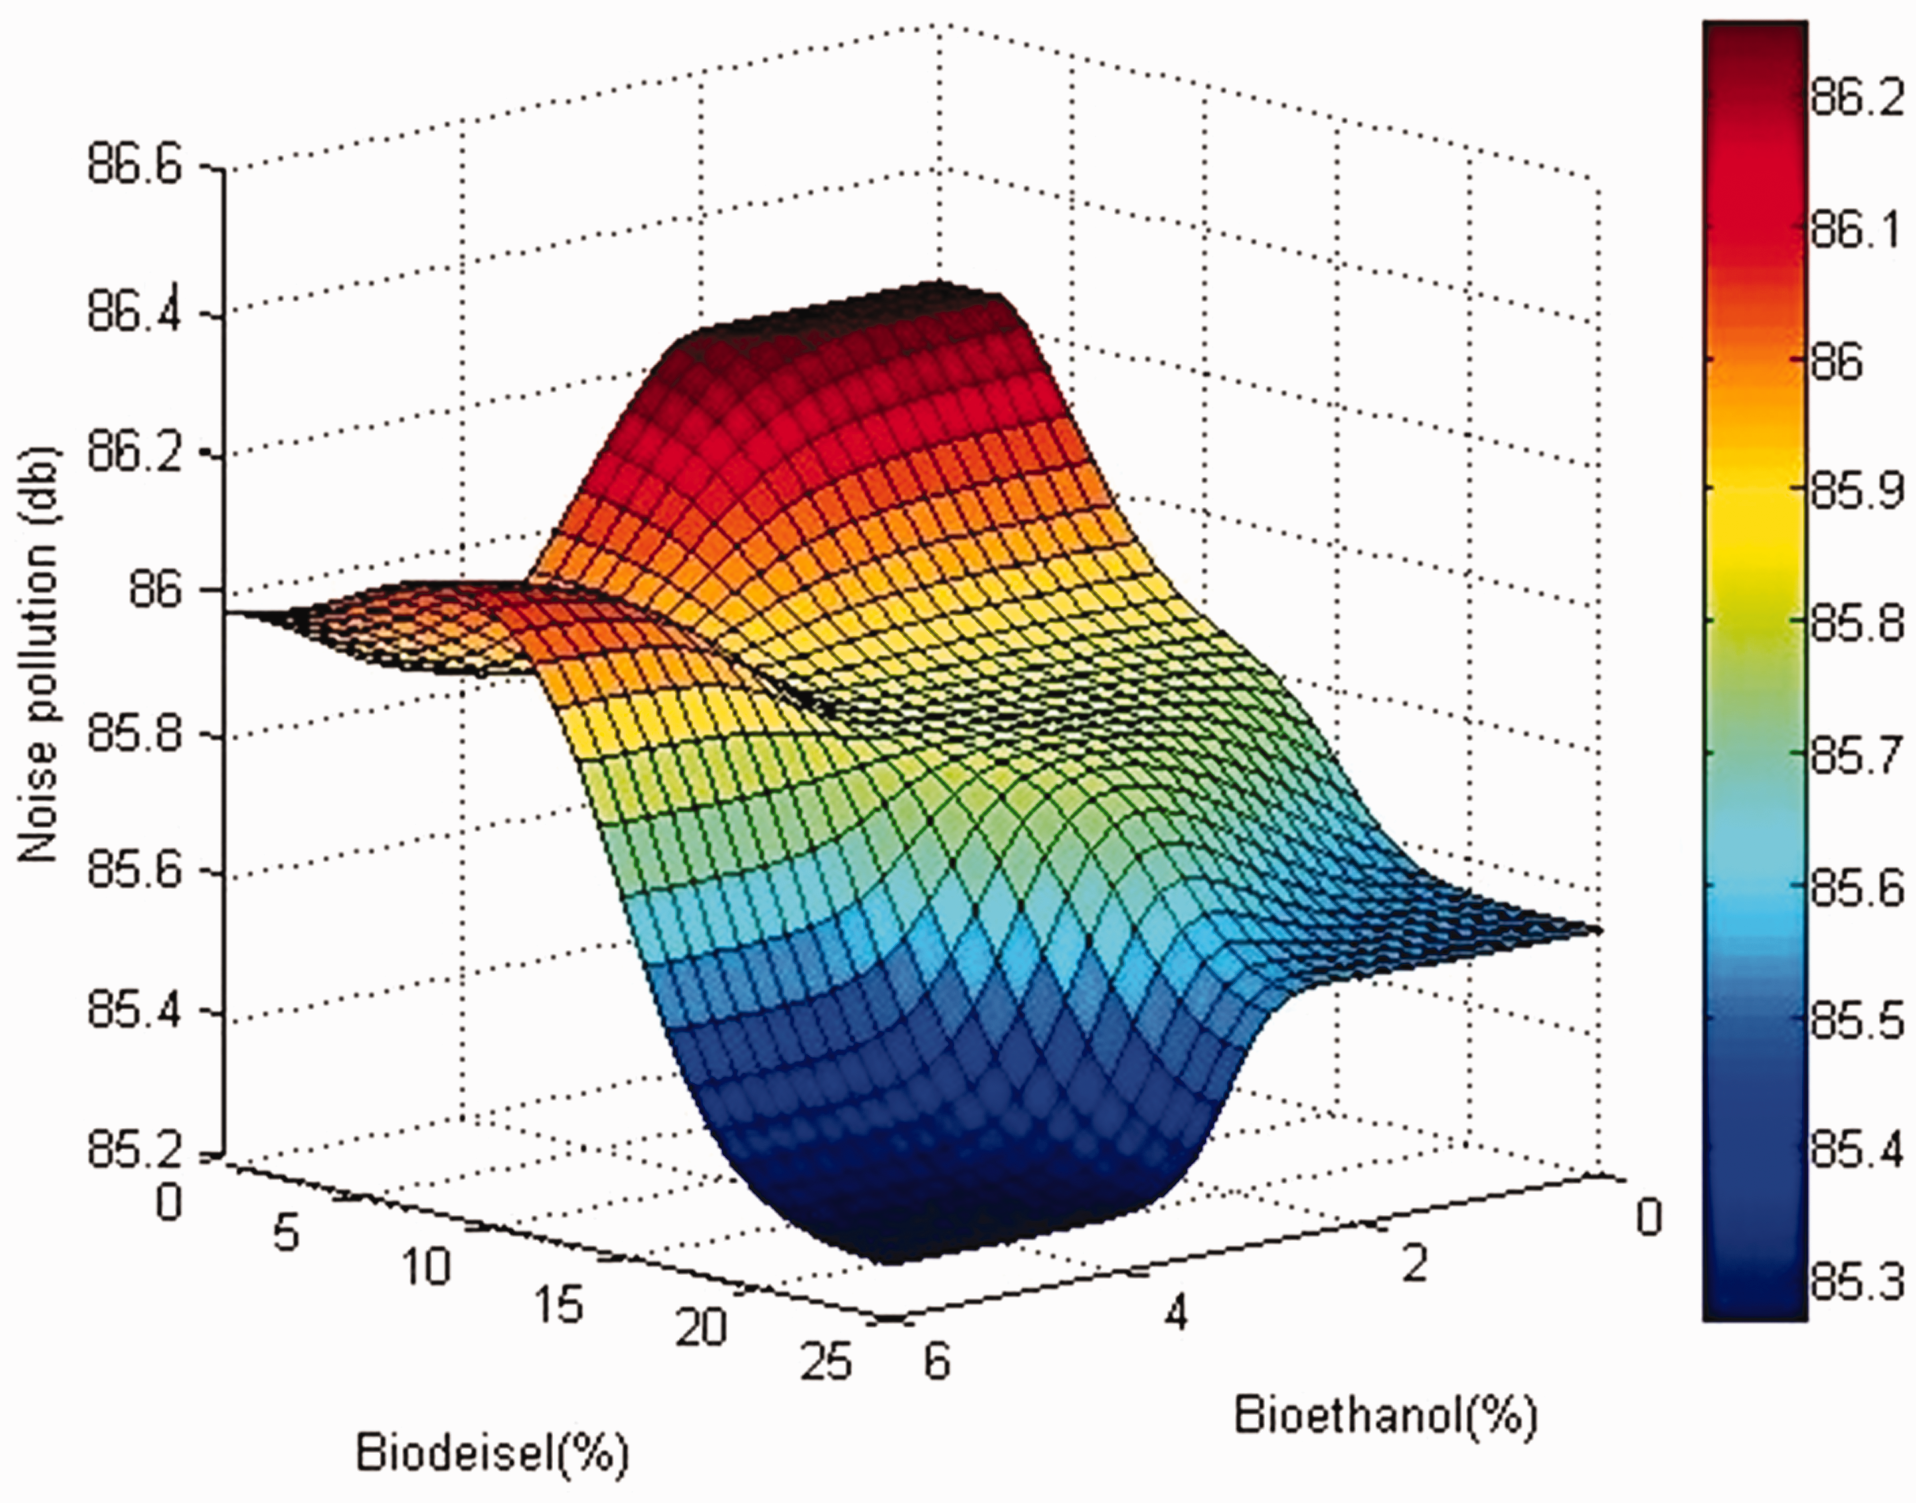
Graph of the ANN Model for noise pollution emitted by a tractor running on the spot at 1000 r/min in the third gear and the driver’s position.
The results of modeling through RSM
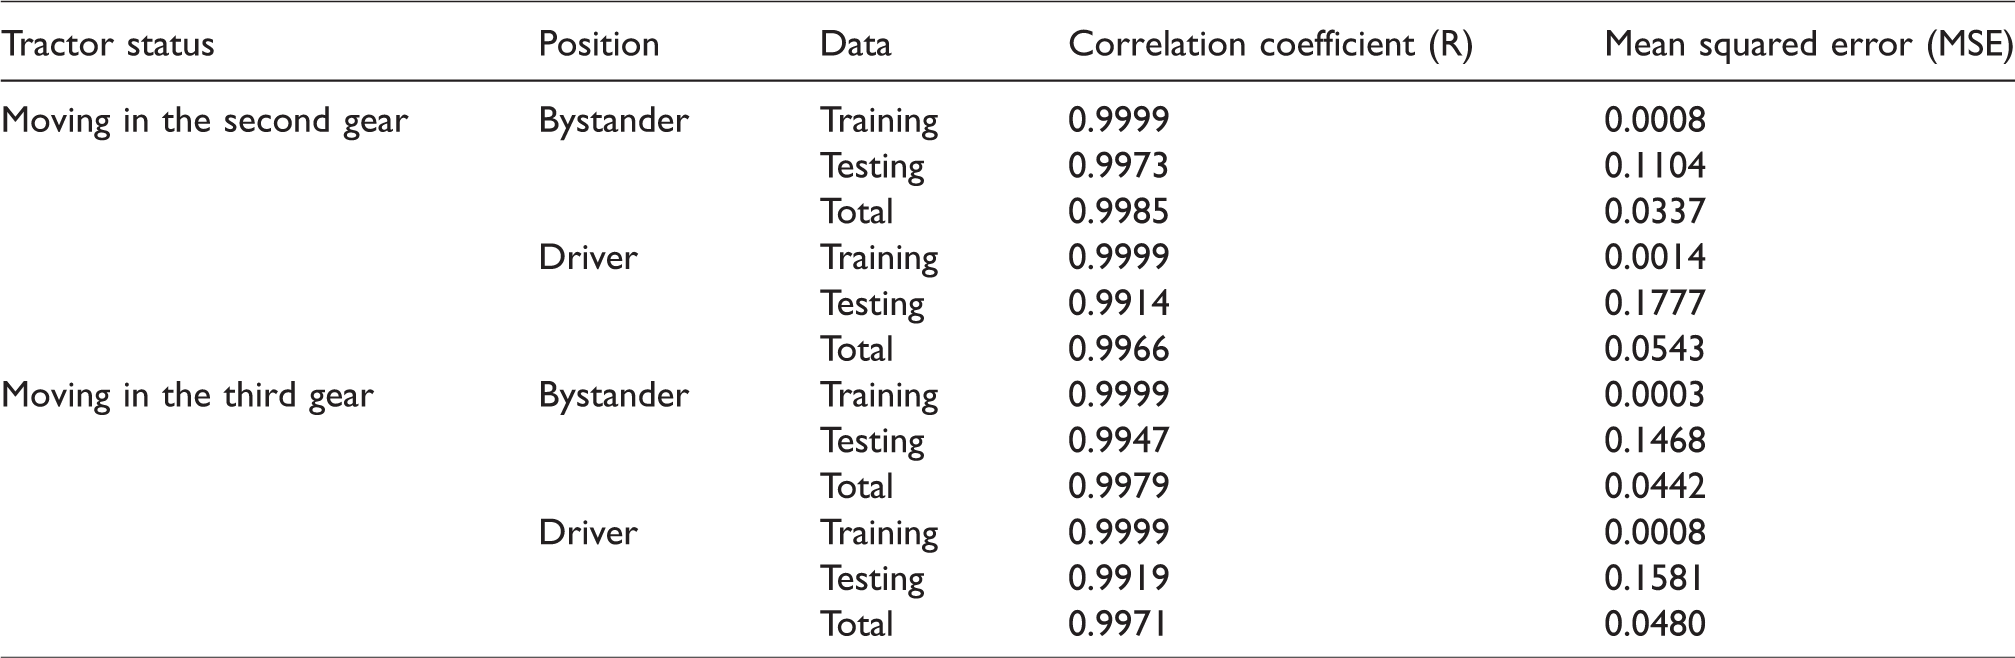
The results of the models of RSM are shown in Table 4. In addition, the correlation coefficients of the models for prediction are shown in Table 4, in which the validation of the models is shown. According to the results of the tables, it can be concluded that the models were well fitted and acceptable.
Fitness indicators of the models of response surface methodology for total data.
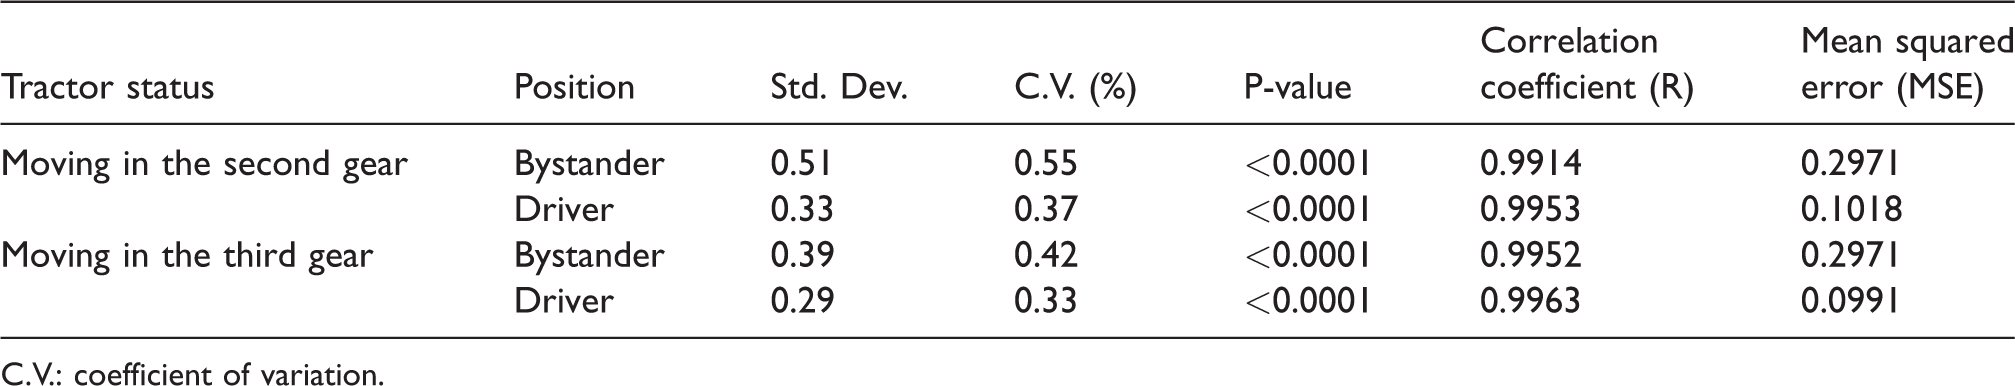
C.V.: coefficient of variation.
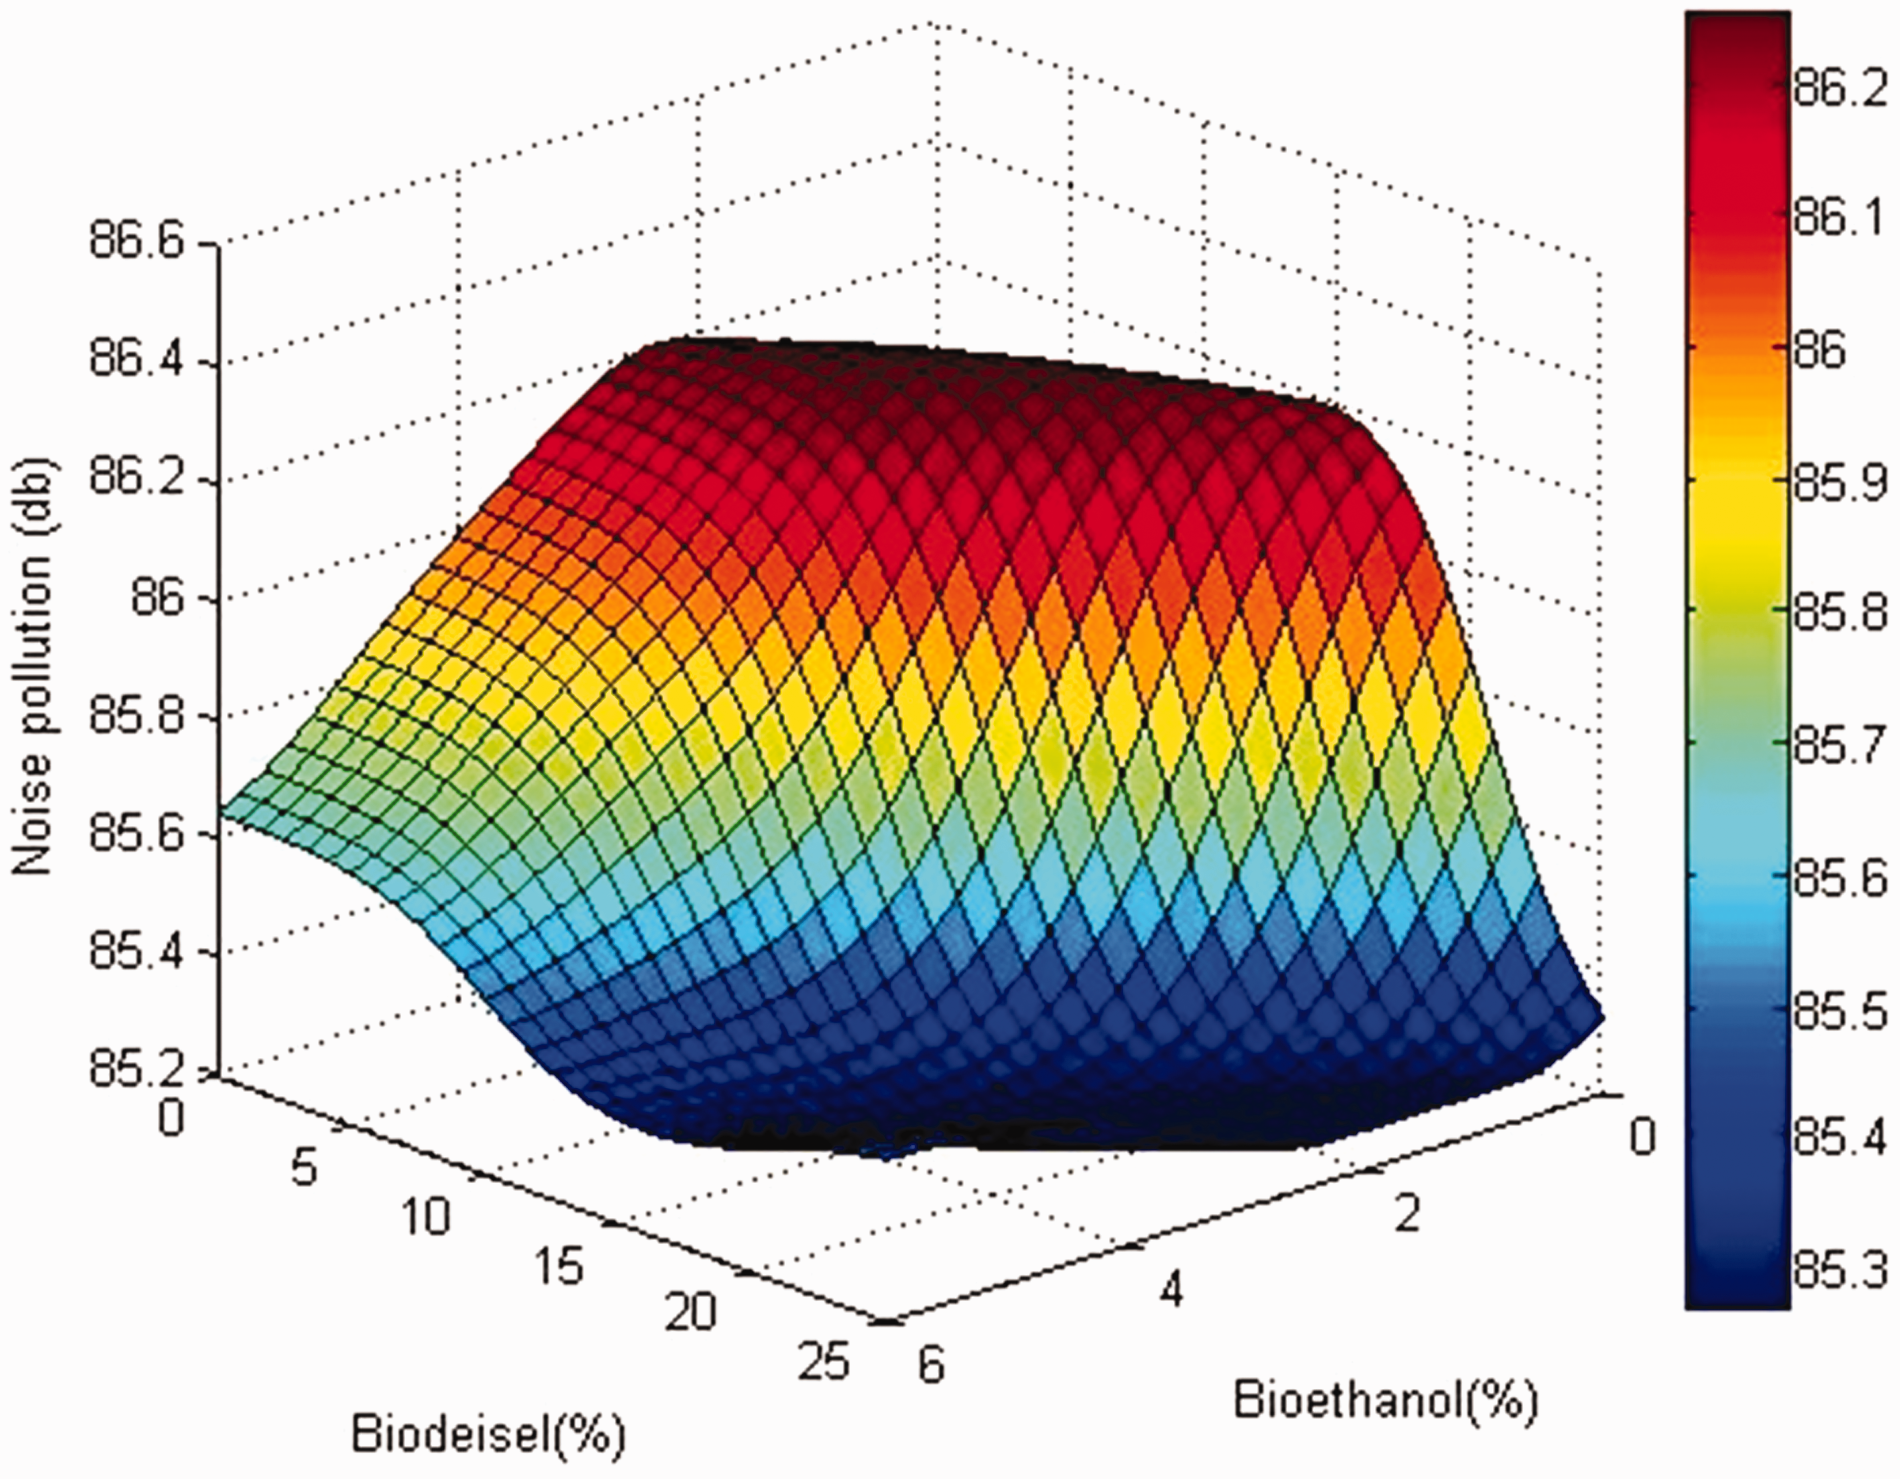
An example of the three-dimensional graphs of the results of the response surface models in the driver’s position at 1000 r/min, moving in the third gear, is shown in Figure 9. Although the three-dimensional graph of the RSM is much different from the three-dimensional graph of ANFIS, the results of both models are alike because the noise pollution is decreased with the increase of the percentage of biodiesel.
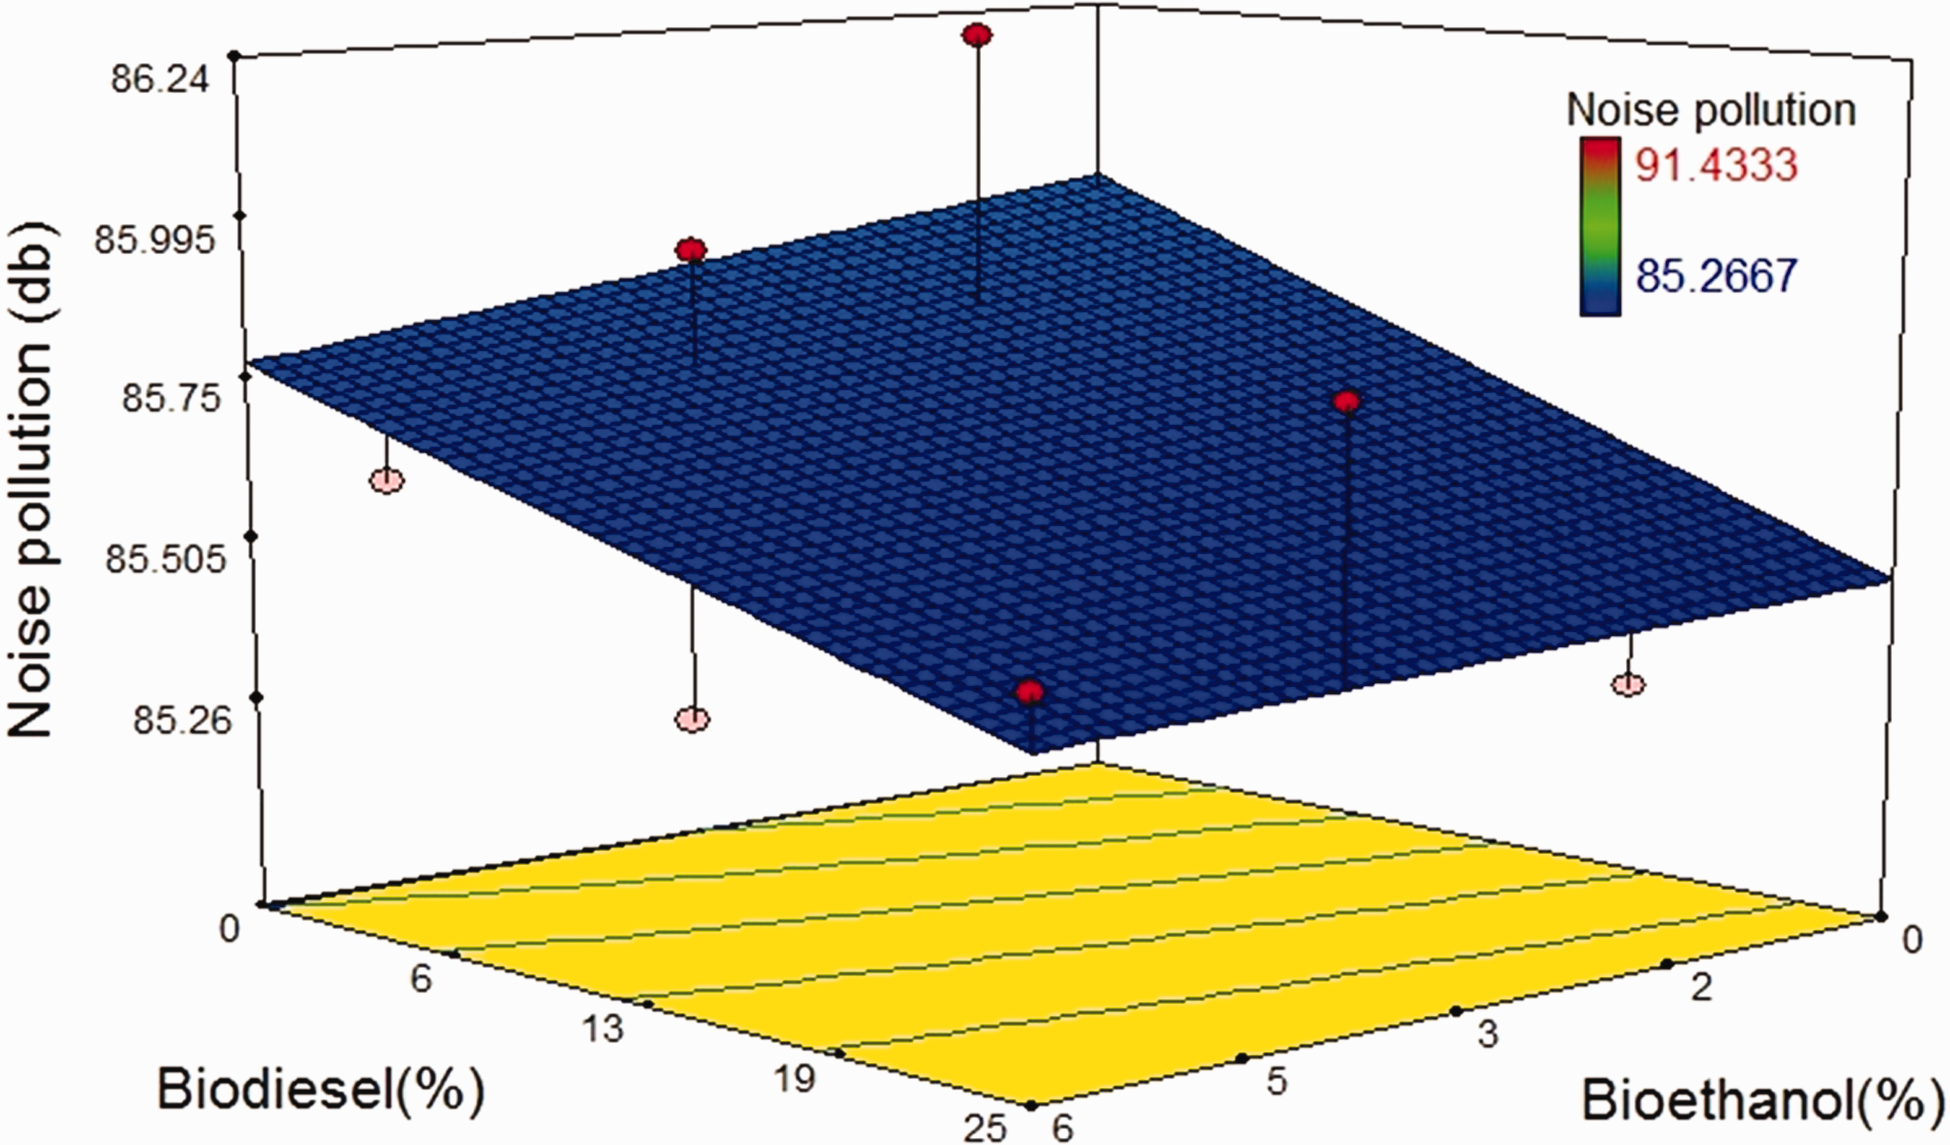
Graph of the RSM Model for noise pollution in the driver’s position at 1000 r/min, moving in the third gear.
Increasing bioethanol in fuel mixtures with a low percentage of biodiesel causes a rise in noise pollution, but the very same case in fuel mixtures with a high percentage of biodiesel decreases the noise pollution, whereas with biodiesel accounting for 15% of fuel mixtures, a rise in bioethanol would decrease the noise pollution or at least has trifling effects. This finding was to some extent consistent with the results of the ANFIS Model, but the response surface model is simpler.
Comparing the performance of the three models
The graph shown in Figure 10 is related to the remaining graph or the mean error of the predicted data with real values by all models in the third gear. In this figure, the lower the volatility of the remaining graph of each model around the horizontal axis or the zero value, i.e. closer to zero, the error function of the model will be better. Having compared the correlation coefficients and the values of MSE (shown in Tables 2 to 4), all models had excellent and desirable values. As a result, the remaining graph can help with choosing better models. As shown in the diagram, the ANFIS Models had more fluctuations compared to other two models. The ranges of these fluctuations were very limited and negligible, though. Thus, it was concluded that all three models had relatively good remaining graphs. Therefore, the simplicity of the model was considered the next index to select the best model. Given that the model presented by RSM was a simple mathematical model, that is to say, a quadratic model or a third grade model; the RSM Model was a better one compared with the other two models. However, considering the statistical criteria mentioned in data analysis, the best models with high correlation coefficient and low mean square errors were ANFIS, RSM, and ANN Models, respectively.
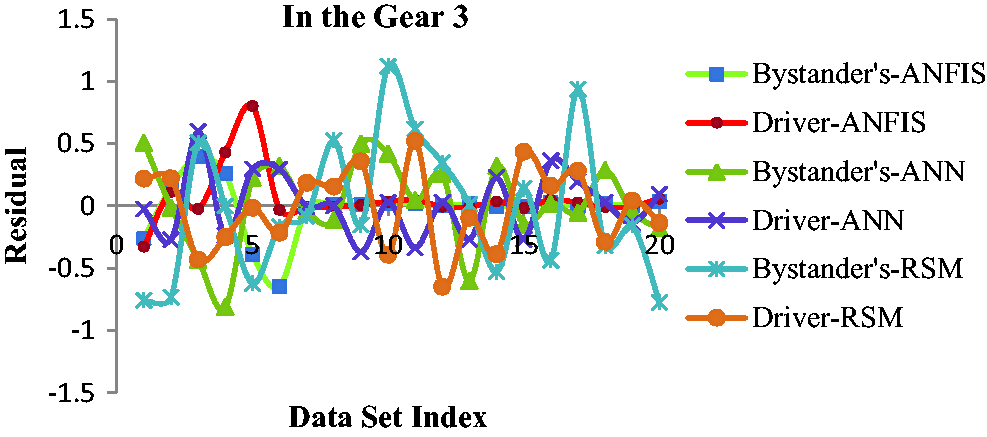
Remaining graphs of models in the third gear.
Optimization of RSM
Having considered the simplicity of the model, the RSM Model was chosen as the best model. Now, to optimize the RSM Model with the aim of identifying the best mixture with the least noise pollution, the conditions explained in Figure 11 were considered. In other words, the aim of optimization was to find suitable fuel mixtures with the least noise pollution, and the results of the present study showed that the B25E6D69 fuel chosen through the RSM caused the least noise pollution. As a result, it can be concluded that replacing diesel with 25% of biodiesel fuel will result in less noise pollution.
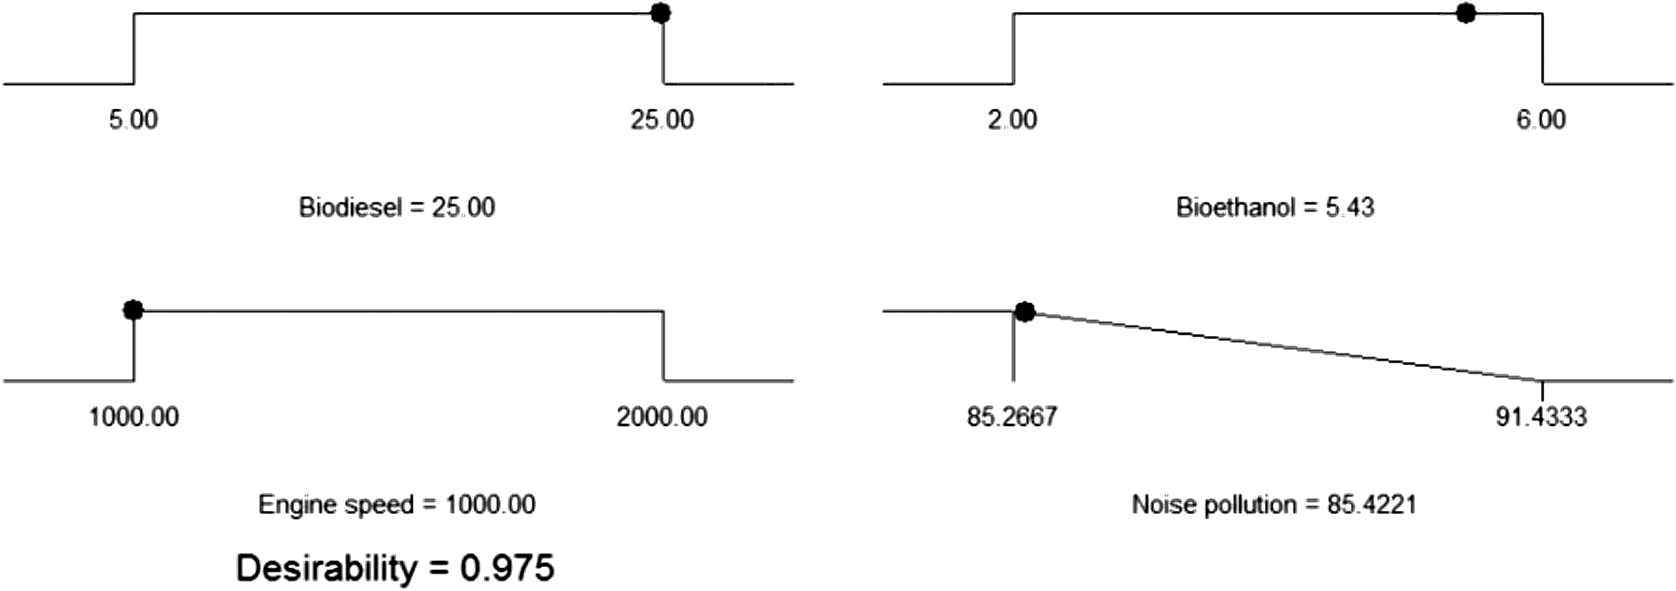
Details of the fuel and engine speed pertaining to the fuel chosen through RSM with the least noise pollution.
Conclusion
In this research, the effects of 10 different types of fuel mixtures and engine speeds on noise pollution emitted by tractor engines were studied, and the noise pollution was considered in the driver and the bystander’s positions. Moreover, the results were analyzed and modeled through three methods of artificial intelligence. The results indicated that the lowest noise pollution was at 1000 r/min in both the driver and the bystander’s positions, and with a rise in engine speed, the noise pollution intensified. Additionally, with the increase of the percentage of biodiesel, the noise pollution lessened. Not to mention, increasing the percentage of bioethanol in fuel mixtures combined with a low percentage of biodiesel resulted in a rise in noise pollution. Similarly, increasing the percentage of bioethanol in fuel mixtures up to 4% combined with a high percentage of biodiesel led to a rise in noise pollution, too. While combined with a high percentage of biodiesel, increasing the percentage of bioethanol more than 4% in fuel mixtures lessened the noise pollution. All models proposed by ANFIS, NN and RSM led to suitable results. Further, having considered the simplicity of the model, the RSM Models were chosen as the best ones from the models under study. Following the optimization of the RSM Model, the fuel mixture with the highest percentage of biodiesel, i.e. 25%, and 6% bioethanol (B25E6D69) was chosen as the best one, thereby causing the least noise pollution.
Footnotes
Declaration of conflicting interests
The author(s) declared no potential conflicts of interest with respect to the research, authorship, and/or publication of this article.
Funding
The author(s) disclosed receipt of the following financial support for the research, authorship, and/or publication of this article: The authors would like to acknowledge the financial support from the Ministry of Science, Research and Technology, Tehran, Iran, and the Vice Chancellery for Research and Technology of Razi University.