
Abstract
To monitor three-dimensional structural displacements in civil engineering, a stereovision displacement measurement method based on structure coordinate system is proposed in the present paper, and the absolute displacements of structure can be obtained through establishing the structure coordinate system and coordinate transformation. The center identification algorithm for circular target is studied to acquire the subpixel coordinates of center by combining Canny algorithm and Zernike algorithm. The epipolar constraint is introduced to conduct stereo matching of initial image pairs, and Kalman filtering and neighborhood searching algorithm are both employed to track circular targets on the left and right sequence images. To validate the effectiveness of the proposed method, a destructive test of concrete beams strengthened with ultraviolet-cured glass fiber reinforced polymer is performed in lab. Results show that the load–displacement curves obtained by the proposed stereovision method and linear variable differential transformer agree with each other; this verifies that the proposed stereovision method is feasible and effective for monitoring structural displacement in a destructive test.
Introduction
Under various factors such as wind, wave, flow, earthquake, and corrosion, 1 some damages such as fracture, crack, instability, and stripping1–3 may occur in components of in-service structure. This affects the overall bearing capacity of structure and causes the potential safety hazard. To ensure the safety of structure, the damaged components must be reinforced. In recent years, the prefabricated fiber reinforced sheet or laminate pasted on surface of concrete beam has become increasingly popular in civil engineering. Engineering studies have found that fiber reinforced plastic (FRP) is effective in the flexural and shear strengthening. However, the bonded layer between FRP and concrete may be destroyed in a harsh environment; this means the reinforcement failure and results in the adverse consequence, even the significant economic loss and casualty. Therefore, it is very necessary to research the performance of concrete beam strengthened with FRP. 4
The destructive test is often used to analyze the elastic properties, plastic properties, ductile properties, and ultimate bearing capacity of structure. Displacement and the strain are the performance indicators of structural component under static load. The traditional methods used to measure displacement and strain mainly include the displacement meter, dial gauge, and resistance strain gauge. In recent years, the fiber grating method has also become a common method for strain measurement. 5 Above methods mostly require more time to install sensors and surface treatment, and the prepared work is rarely complicated.
Different from the above methods, the visual testing is a noncontact optical measurement method. 6 In the last two decades, the visual testing method has been gradually applied in civil engineering. Ye et al. 7 proposed three kinds of image processing algorithms for structural displacement measurement, i.e., the grayscale pattern matching algorithm, the color pattern matching algorithm, and the mean shift tracking algorithm. A vision-based system programmed with the three image processing algorithms was developed for structural displacement measurement. Based on the inverse compositional matching strategy and the auxiliary displacement functions, Bai et al. 8 proposed an inverse compositional Gauss–Newton algorithm with a new second-order shape operator for the nonuniform and large deformation measurements; a rubber tension experiment with a large deformation of 27% was performed by a camera to validate the feasibility of the proposed algorithm. Kong and Li 9 proposed a vision-based noncontact bolt loosening detection method based on a consumer-grade digital camera. The performance and robustness of this approach had been validated through a series of experiments using three laboratory setups. Park proposed a 3D displacement measurement model using a motion capture system (MCS) which included three cameras, 10 a wand was adopted to calibrate MCS and performed the coordinate transformation from the wand coordinate system to the structure coordinate system. The proposed method can measure 3D displacements of markers on two adjacent sides of structure. Yoon et al. 11 proposed a target-free method to measure the vibration response of a six-story building model using the different consumer-grade cameras, and the temporal aliasing problem was discussed. Based on target-free method, Yoon et al. 12 employed an unmanned aerial system with a camera to conduct structural displacement measurement, resolving the influence of nonstationary motion of camera.
Except for above visual measurement methods which employ one camera or three cameras, the stereovision method using two cameras is another 3D displacements measurement method. In recent years, more and more people pay attention to the stereovision measurement method based on DIC. The related 3D DIC system developed quickly and the price is very expensive.13–15 However, the 3D DIC method usually needs to spray speckles or plot grids on the structural surface, and the prepared work is complicated. In terms of image matching algorithm, essentially the DIC method is a kind of area matching algorithm, 16 it is difficult to ensure the uniqueness of any grid or speckle. Therefore, there exists the image mismatch of grids or speckles when the DIC method is used to conduct 3D matching in stereovision measurement.17,18
To deal with the problem of image mismatch, the epipolar constraint is introduced to conduct stereo matching of the initial image pairs in the present paper. The epipolar constraint is a very important constraint relationship in stereo matching, which can give the corresponding relation between point and line and guide the matching of corresponding points. In addition, Kalman filtering and neighborhood searching algorithm are both adopted to complete sequence matching of circular targets. The center identification algorithm of circular target is proposed to achieve the subpixel coordinates of center through Canny–Zernike combination algorithm. Based on above image processing algorithms, a stereovision displacement measurement method based on structure coordinate system is proposed in the present paper, and the absolute displacement of structure can be gained through coordinate transformation. To testify the effectiveness of the proposed method, a destructive test of concrete beams strengthened with ultraviolet (UV)-cured glass fiber reinforced polymer (GFRP) is performed in lab.
Stereovision displacement measurement method based on the structure coordinate system
Stereovision principle
Considering the general case, that is no requirement of two cameras’ position.
19
As shown in Figure 1, assume that the left camera coordinate system
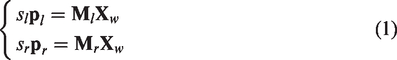
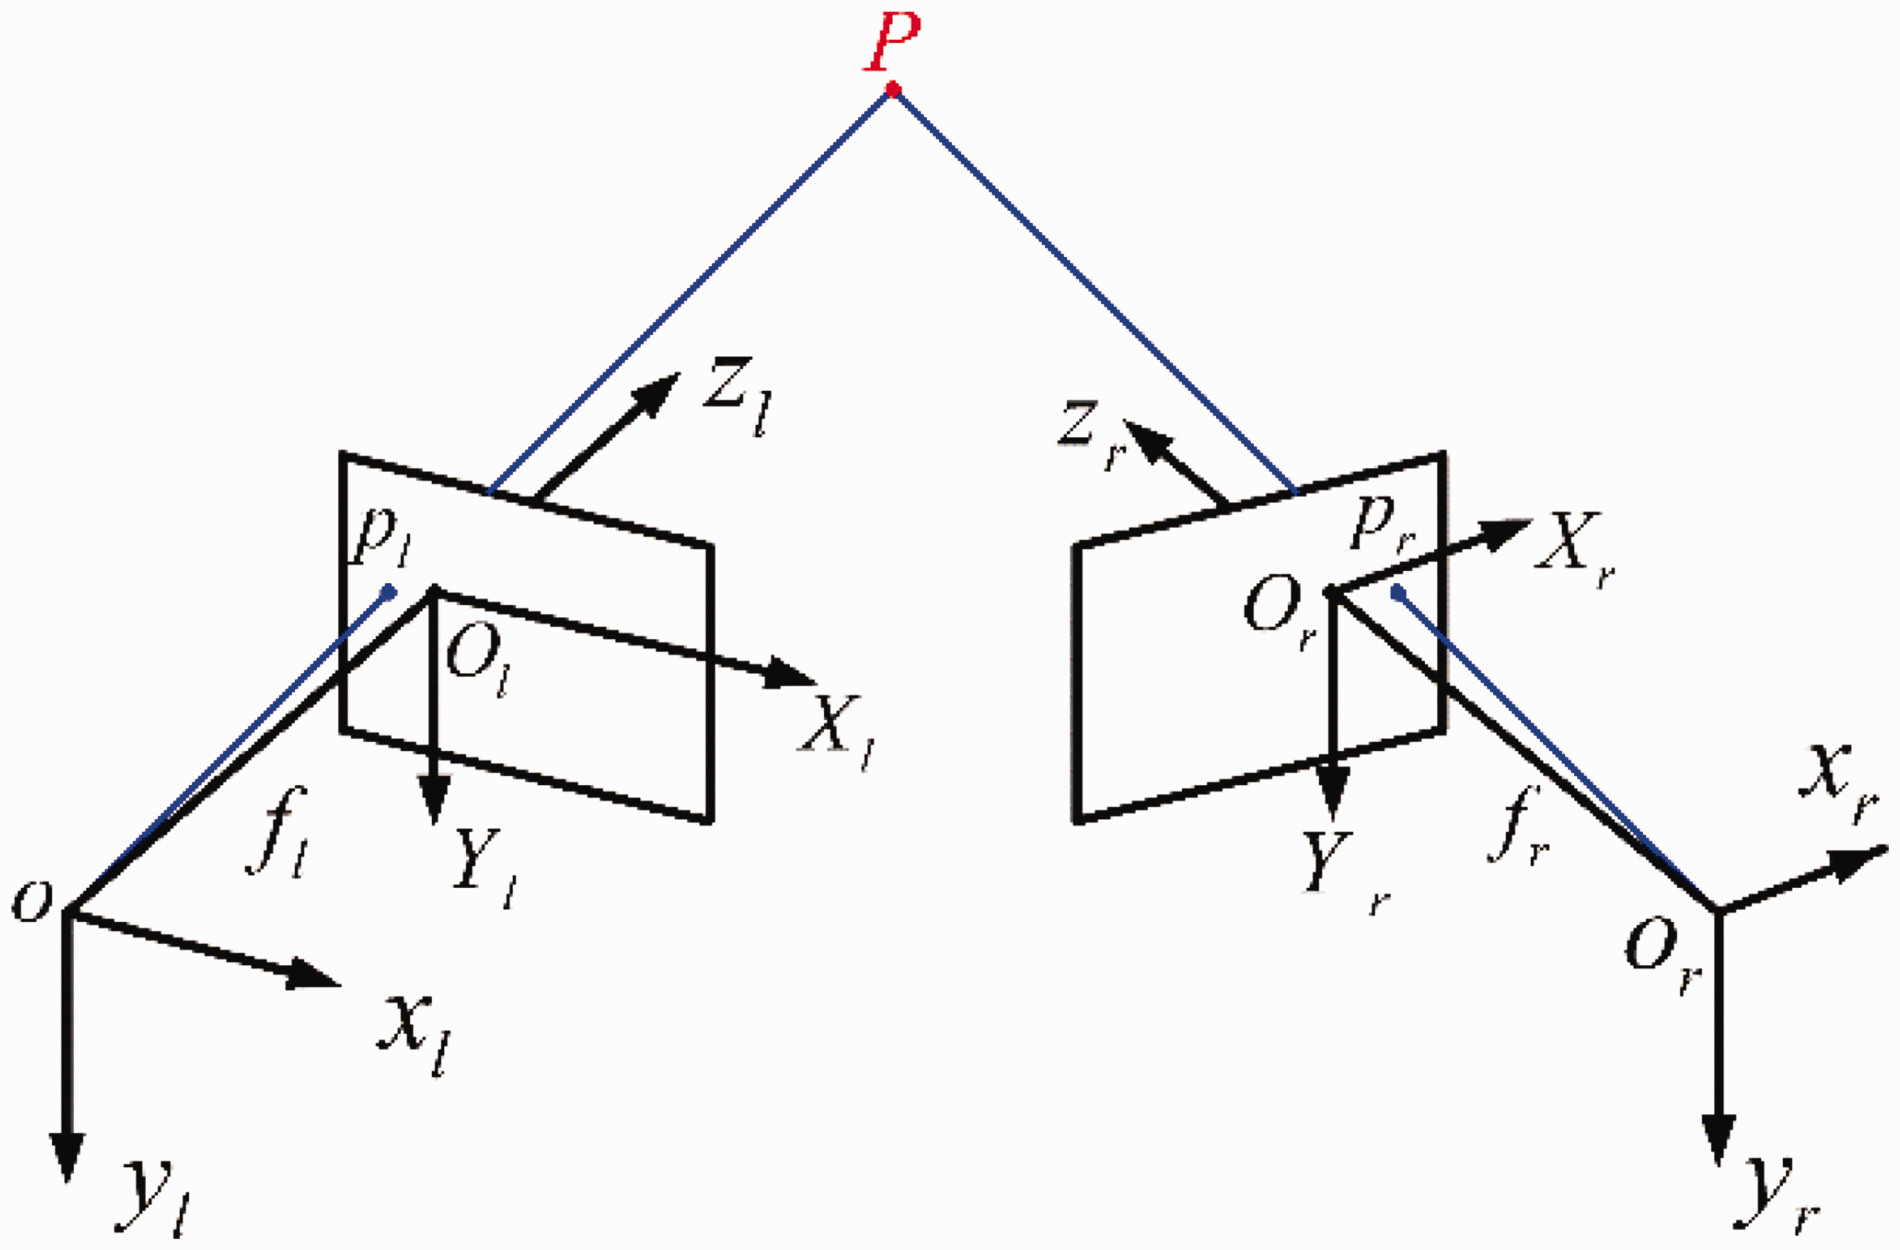
Binocular stereovision model.
The relationship between
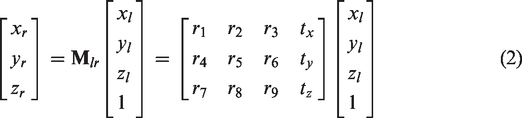
The 3D coordinates of a spatial point
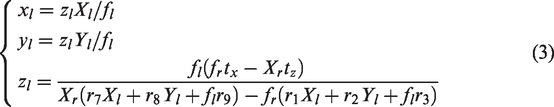
From equation (3), if the scale factors
Establishment of structure coordinate system
To visually express structural displacement, (i) Calibration of stereovision measurement system
The stereovision measurement system is first calibrated by Zhang’s algorithm, and the intrinsic and extrinsic parameters of stereovision system are obtained. The extrinsic parameters include the rotation matrix (ii) Establishing the structure coordinate system
As shown in Figure 2(a), a checkerboard pattern is closely put on the measured structure and is parallel to structural surface. This checkerboard pattern is used to establish a structural reference plane in the present paper, which is
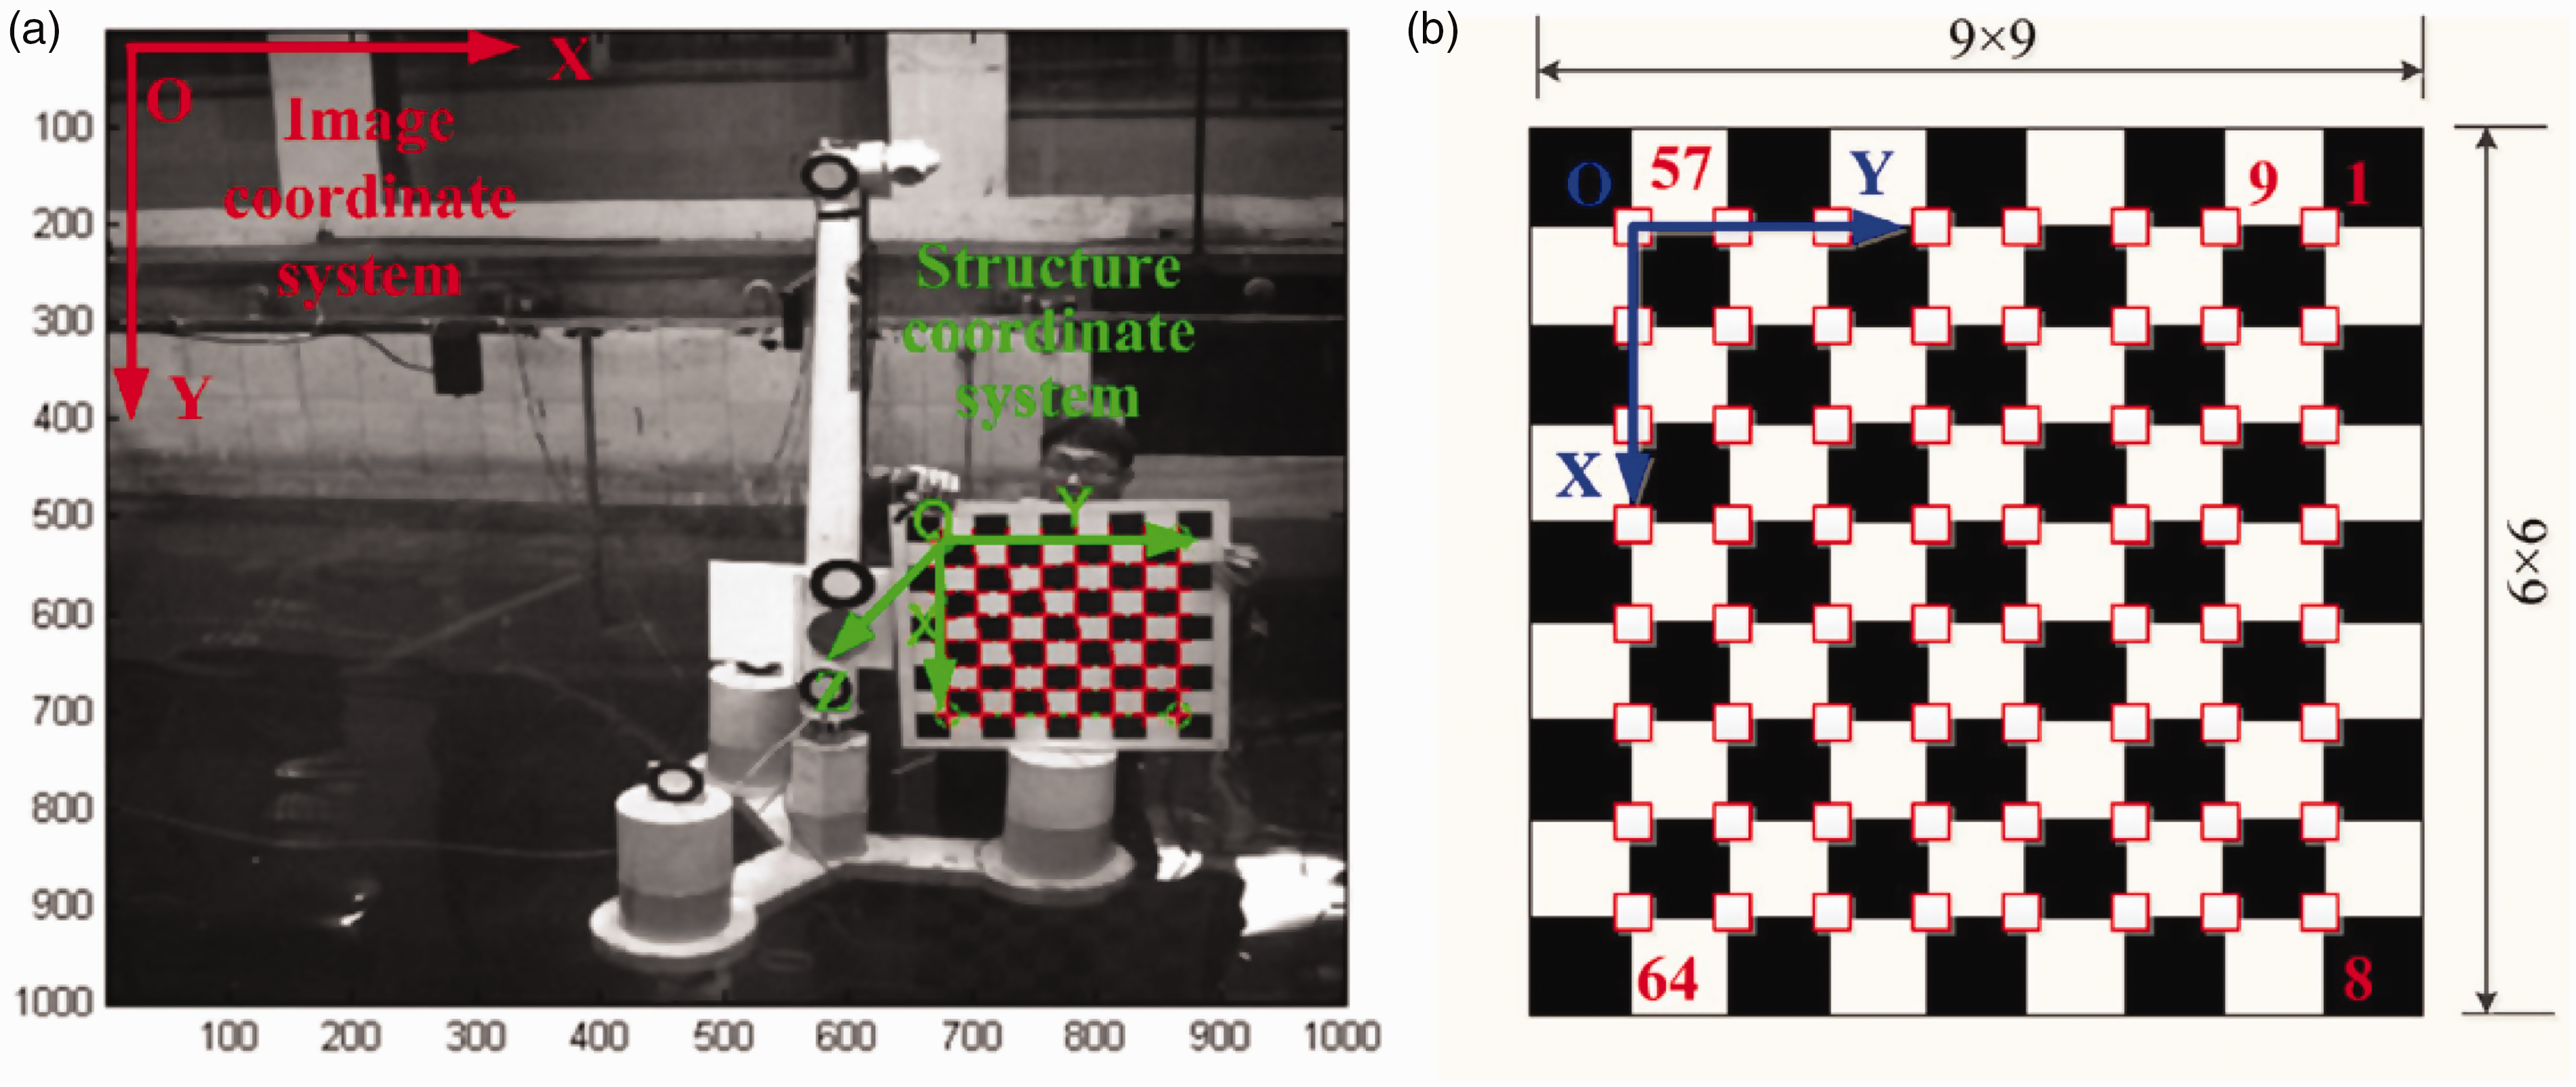
Establishing the structure coordinate system on structural surface. (a) Establishment of structure coordinate system and (b) identification of corner points.
As shown in Figure 2(a), two sides of checkerboard pattern are placed horizontally and vertically, respectively. The origin of the established structure coordinate system (iii) Extracting the image coordinates of each corner point on checkerboard pattern
As shown in Figure 2(b), a checkerboard pattern includes (iv) Defining 3D coordinates of each corner points on checkerboard pattern
Pixel coordinates of corner points in the left image coordinate system.
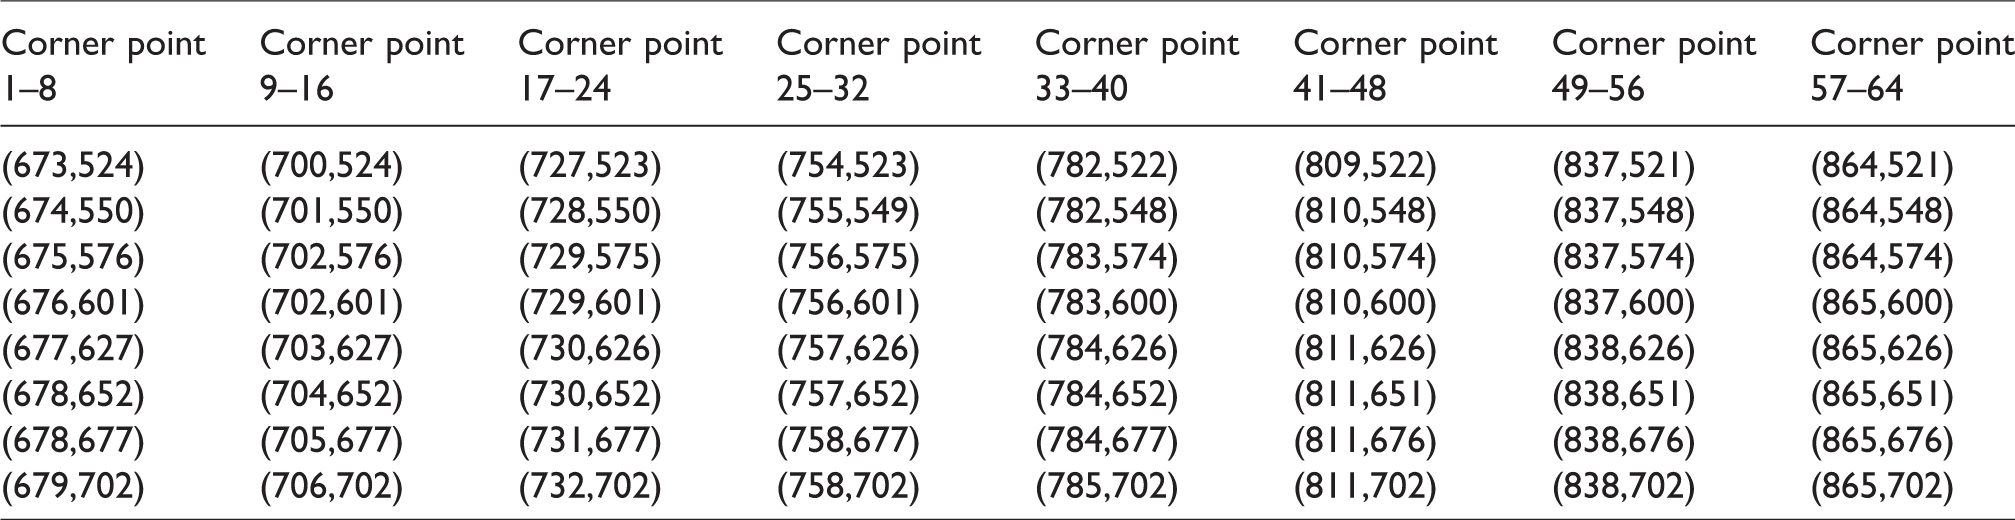
The physical dimensions of checkerboard pattern are known; this means that actual 3D coordinates (v) Solving the transformation matrix
X-coordinates and y-coordinates of corner points in the structure coordinate system (mm).
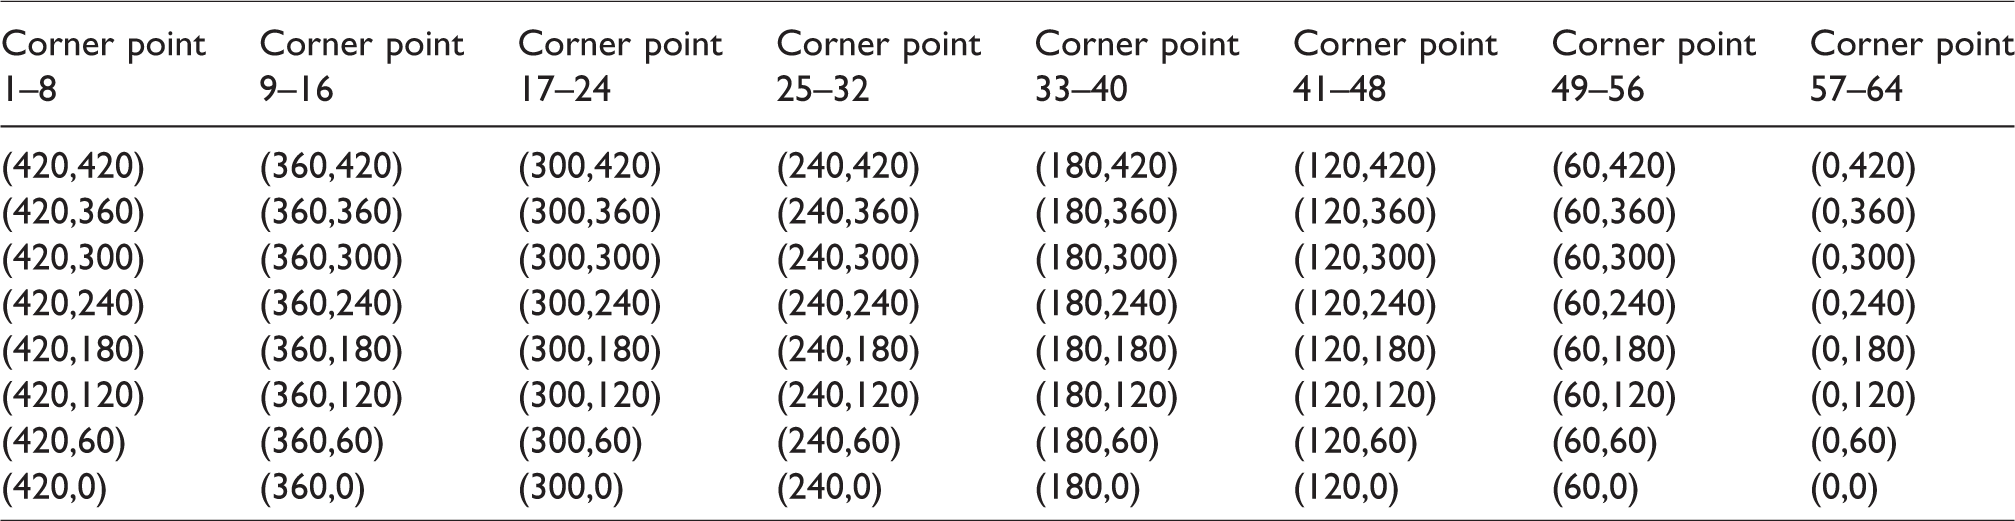
When the 3D coordinate 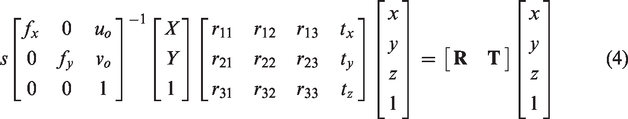
Figure 3 shows the flowchart of establishment of structure coordinate system using a checkerboard pattern. It is noted that only the left image sequences are used to establish the structure coordinate system on structural surface. Only the intrinsic parameters of left camera obtained by Zhang’s calibration algorithm are used to solve the transformation matrix
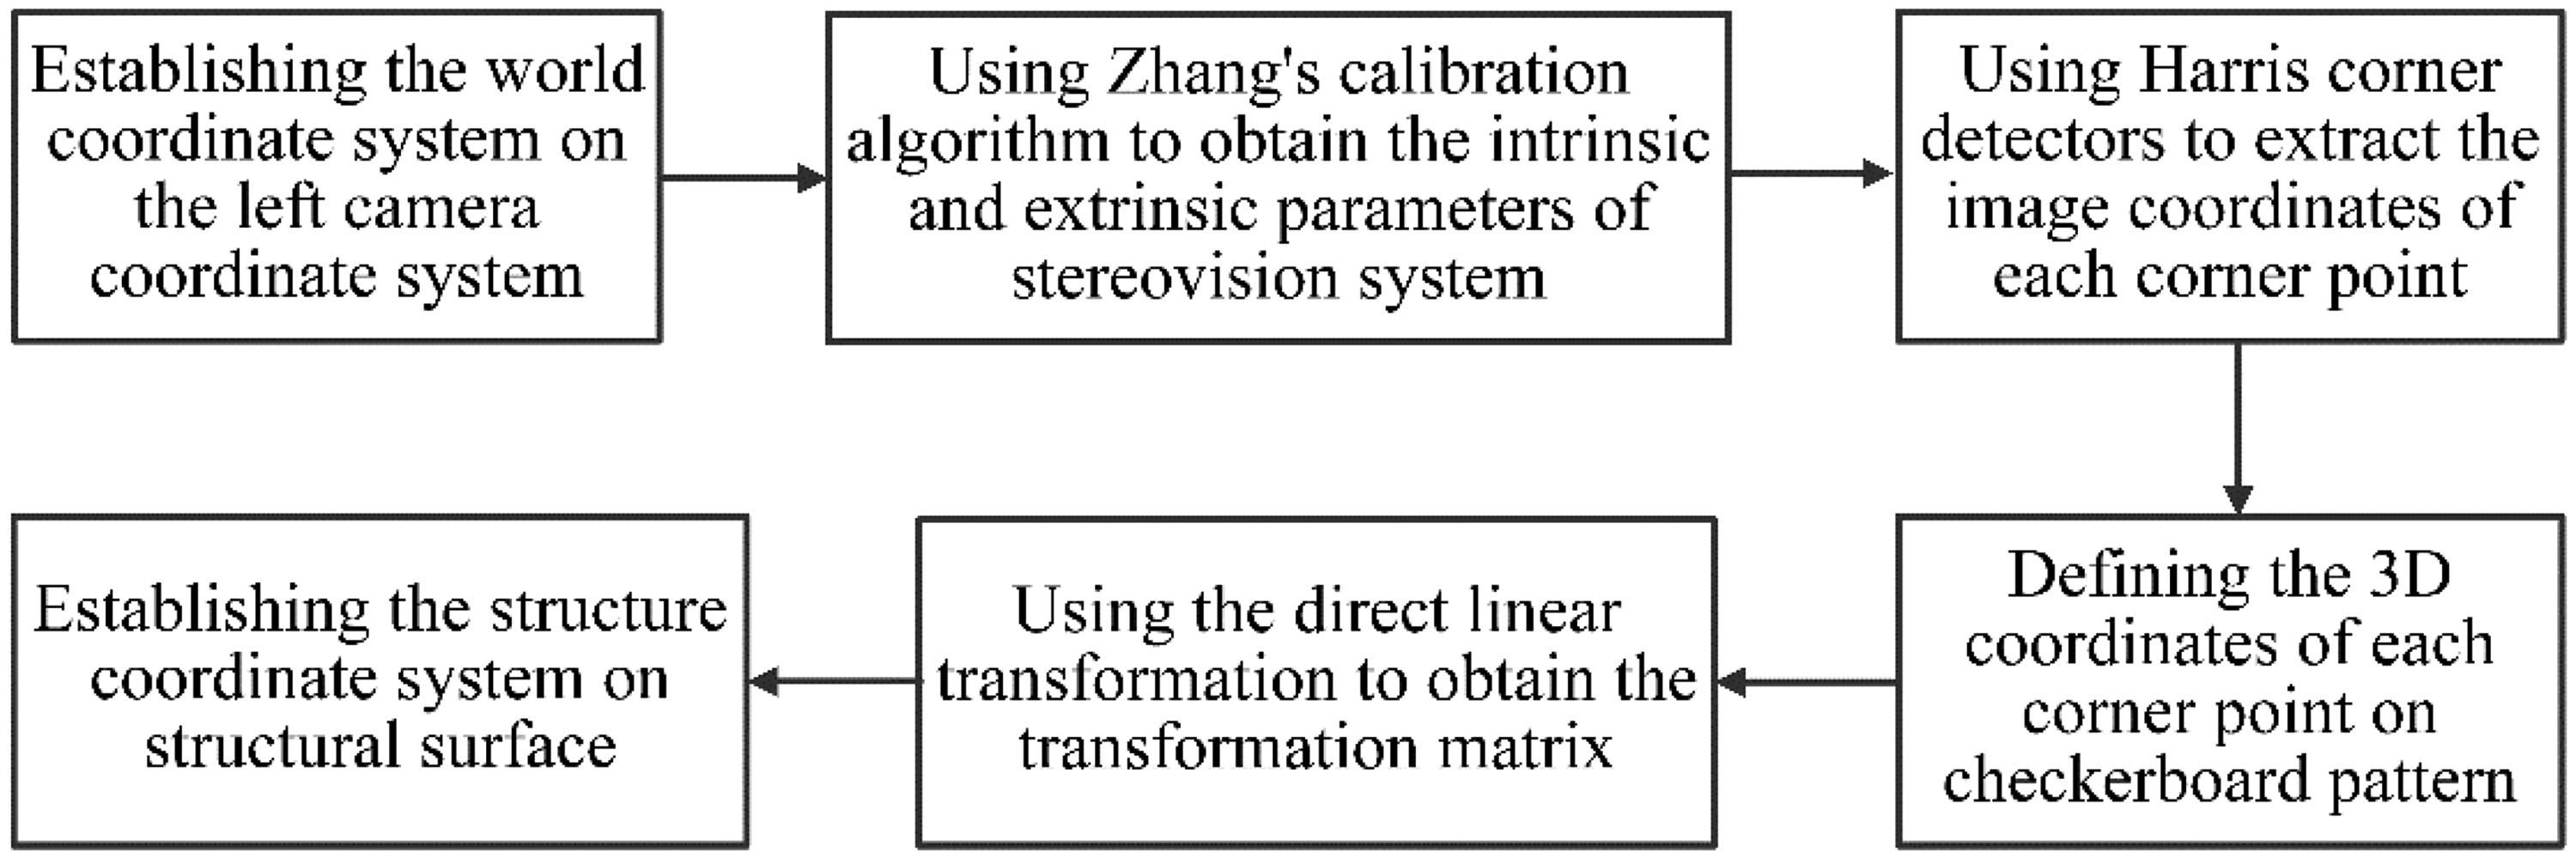
Flowchart of establishment of structure coordinate system using checkerboard pattern.
Calculation of 3D displacements
The 3D coordinates of the measured point in the left camera coordinate system 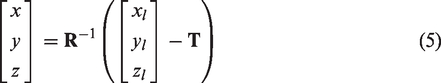
Therefore, the out-of-plane displacement and in-plane displacement of structure at each moment can be acquired by equation (5). Assume that the 3D coordinate of the measured point 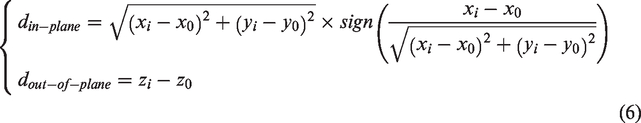
From the above analysis, the key problem of 3D structural displacements measurement is how to identify the same measured point in different fields of view. One of solutions is selecting appropriate image feature to match the measured point in different fields of view. Therefore, identification and matching of image feature is the key in stereovision measurement.
Image processing of circular target
Center identification of circular target
In the present paper, circular target is selected as feature point for image matching. To identify circular target, the center coordinate of circular target needs to be extracted first. To position the center of circular target, a Canny–Zernike combination algorithm is proposed to conduct edge detection of circular target. The flowchart of center identification of circular target is shown in Figure 4, and the detailed process is described as follows.
(i) Image preprocessing
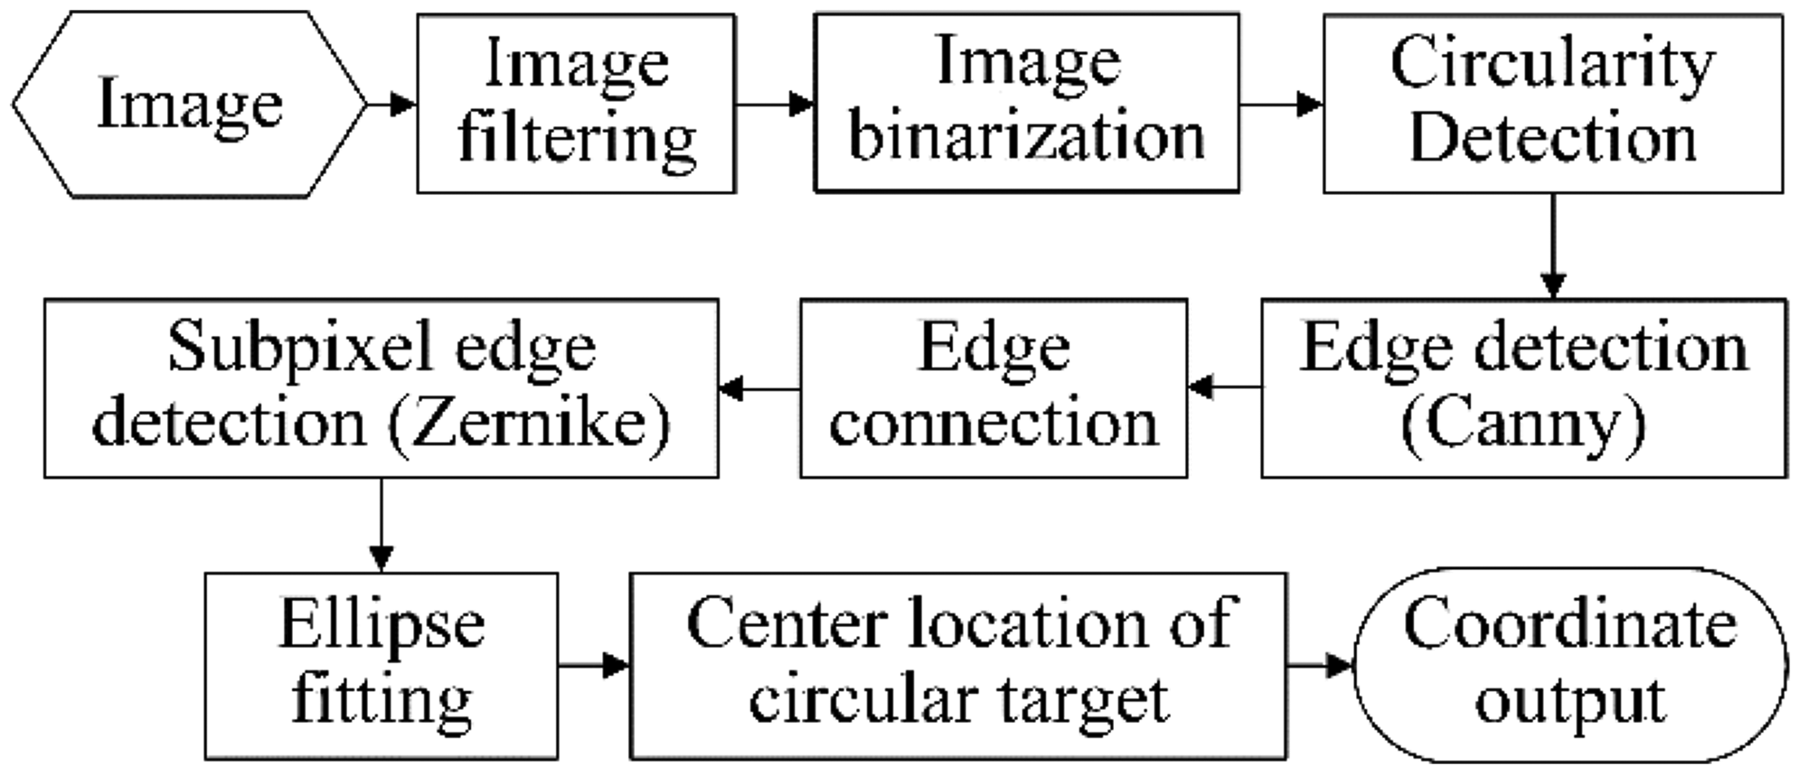
Flowchart of center identification algorithm for circular target.
Due to the influence of some factors such as light, noise, and lens distortion, the image filtering must be conducted first. SUSAN filtering is used to filter image noise in the present paper,25,26 which can preserve the original characteristics of image, sharpen border and corner of image, and improve image quality.
(ii) Extraction of circular target
As shown in Figure 5(b), a rectangular zone which surrounds a circular target is selected to extract the measured circular target and obtain the binarized image; the binarized image of circular target is shown in Figure 5(c).
(iii) Obtaining the geometric parameters of circular target
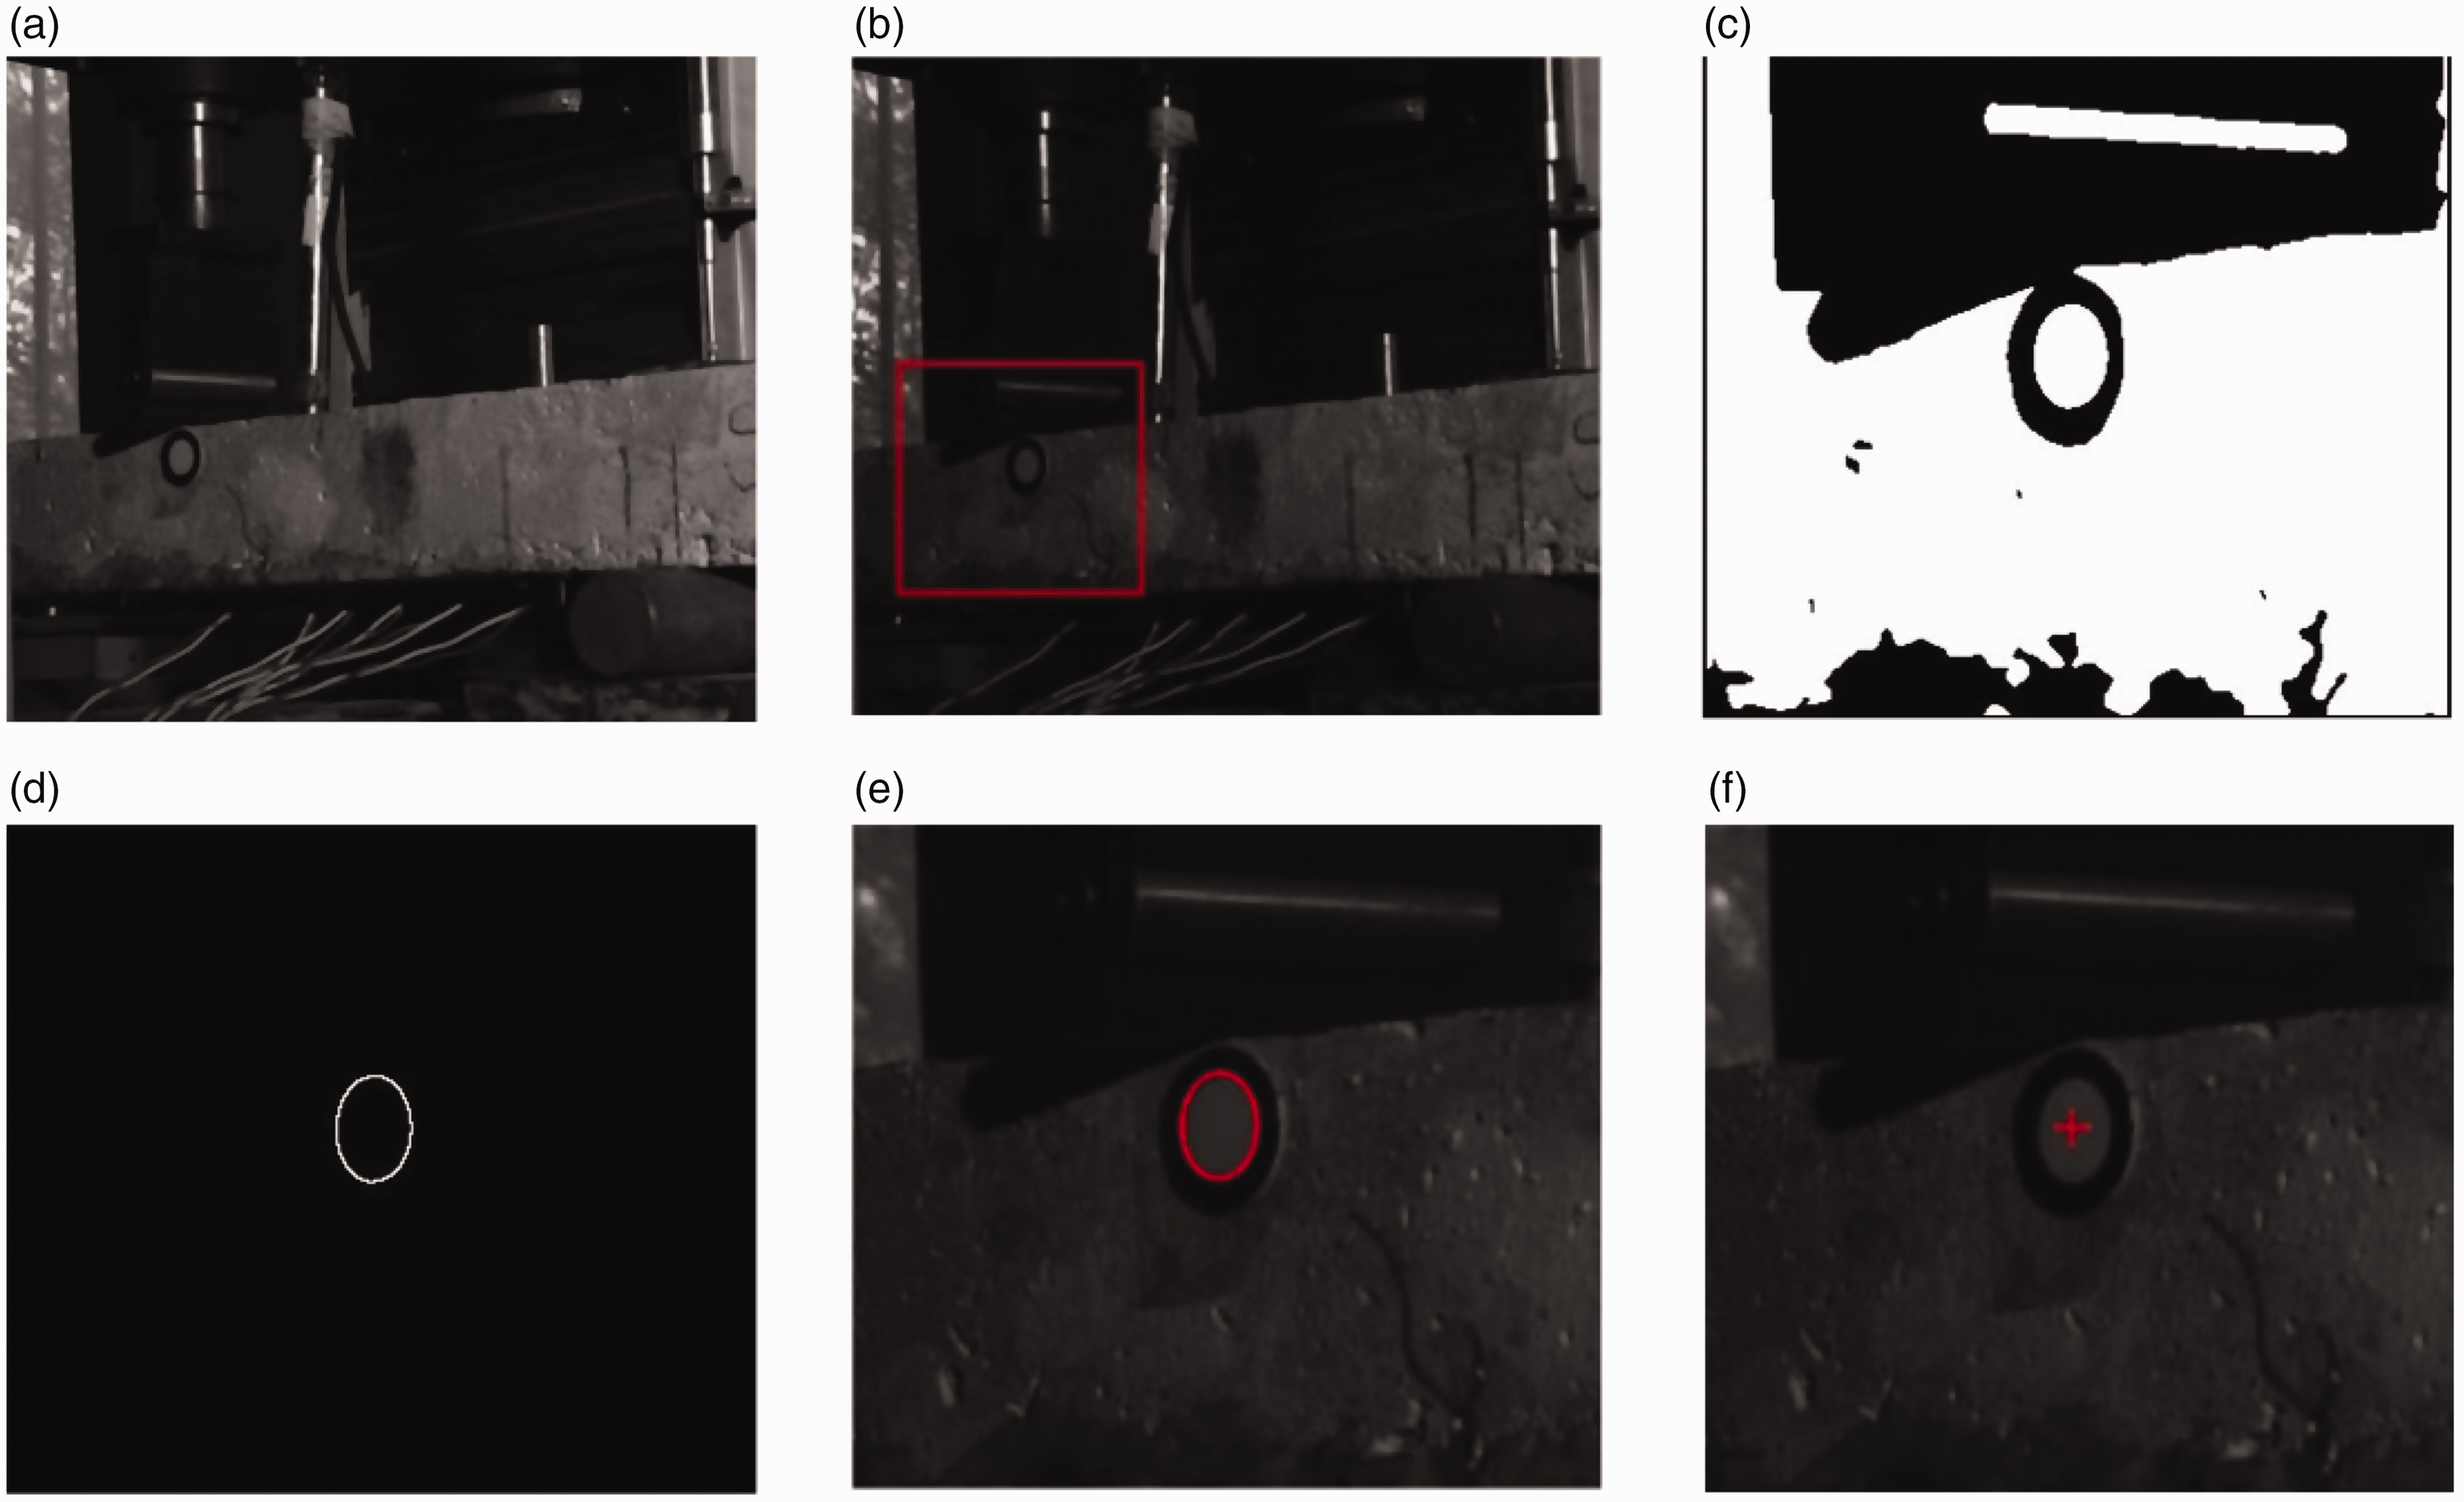
Process of center identification of circular target: (a) original image, (b) extraction of circular target, (c) image binarization, (d) edge detection, (e) subpixel edge detection, and (f) center positioning.
To locate the center of circular target, the geometric parameters of circular target in the binary image need to be acquired, which are the form factor, eccentricity, spherical, circularity and edge length, etc. By calculating the geometric parameters of each zone, the shape threshold is set to remove the noncircular target area.
(iv) Edge detection of circular target using Canny–Zernike combination algorithm
As shown in Figure 5(d), Canny algorithm
27
is used to roughly extract the edge of circular target. The extracted edge is linked together, meanwhile some noncircular target edges are eliminated. Then Zernike moment operator
28
is used to obtain the subpixel edge of circular target, as illustrated in Figure 5(e). The detailed Canny–Zernike algorithm is described in Shan et al.
29
(v) Positioning the center coordinate of circular target
The ellipse fitting method is adopted to position the center of circular target. The least-squares algorithm is utilized to fit the ellipse equation. The threshold of the distance between each edge point and the fitted ellipse center is set adequately, and the position precision of the fitted ellipse is improved through iteration. To improve the fitting precision, every time 5% edge points are removed until the standard deviation of the distance is less than the presupposed threshold. As shown in Figure 5(f), the accuracy of 0.02 subpixel can be achieved finally.
Matching pursuit of circular target
According to equations (3) and (5), the 3D coordinates of center of circular target can be calculated based on stereovision principle. Therefore, the same circular target on the synchronized left and right image pairs needs to match each other. In addition, the same circular target on the left or right sequence images also needs to be tracked. To address this issue, the circular target matching pursuit algorithm is proposed in the present paper and the detailed flowchart of matching pursuit of circular target is given in Figure 6.
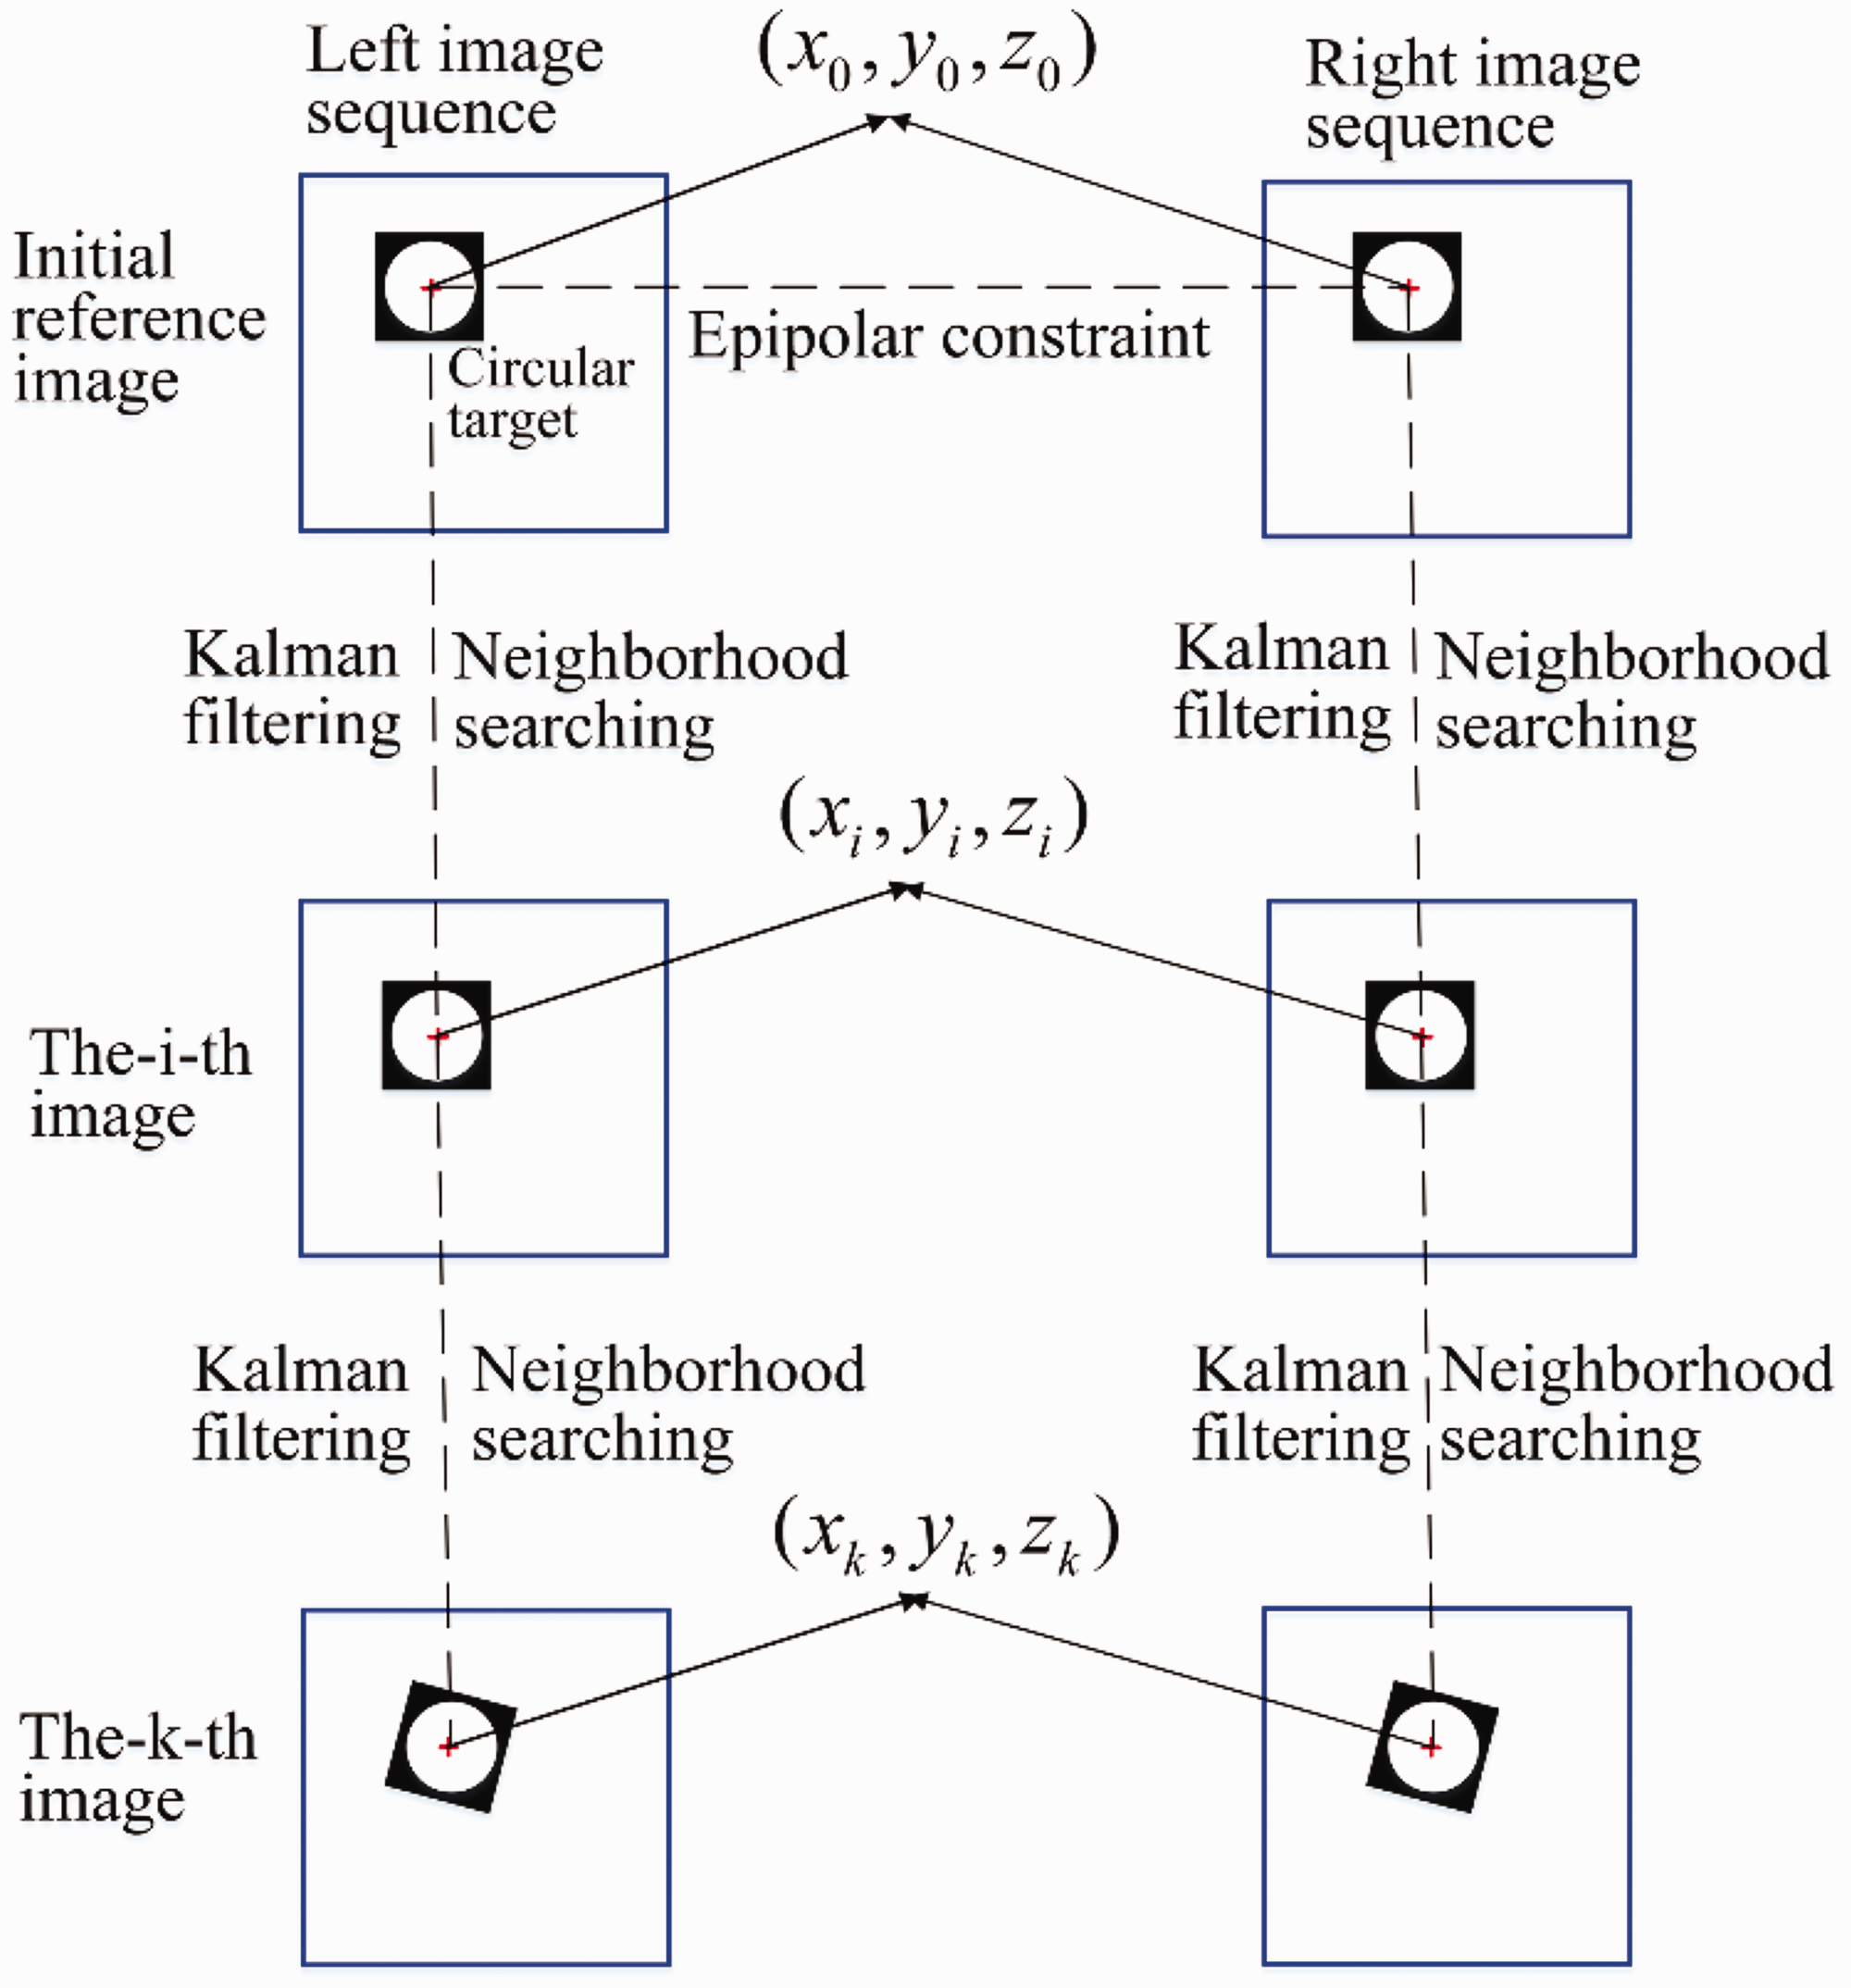
Flowchart of matching pursuit of circular target.
Due to noise disturbance, ray and perspective distortion, etc., there may exist several corresponding candidate points on right image toward an object point on left image. Therefore, some constraint conditions are adopted in image matching. Some constraint conditions, e.g. epipolar constraint, unique constraint, and ordering coherence constraint, are commonly employed in image matching. According to geometric feature of circular target, the epipolar constraint 30 is selected to perform stereo matching of the initial image pairs.
As shown in Figure 7, the projected points of a spatial point 

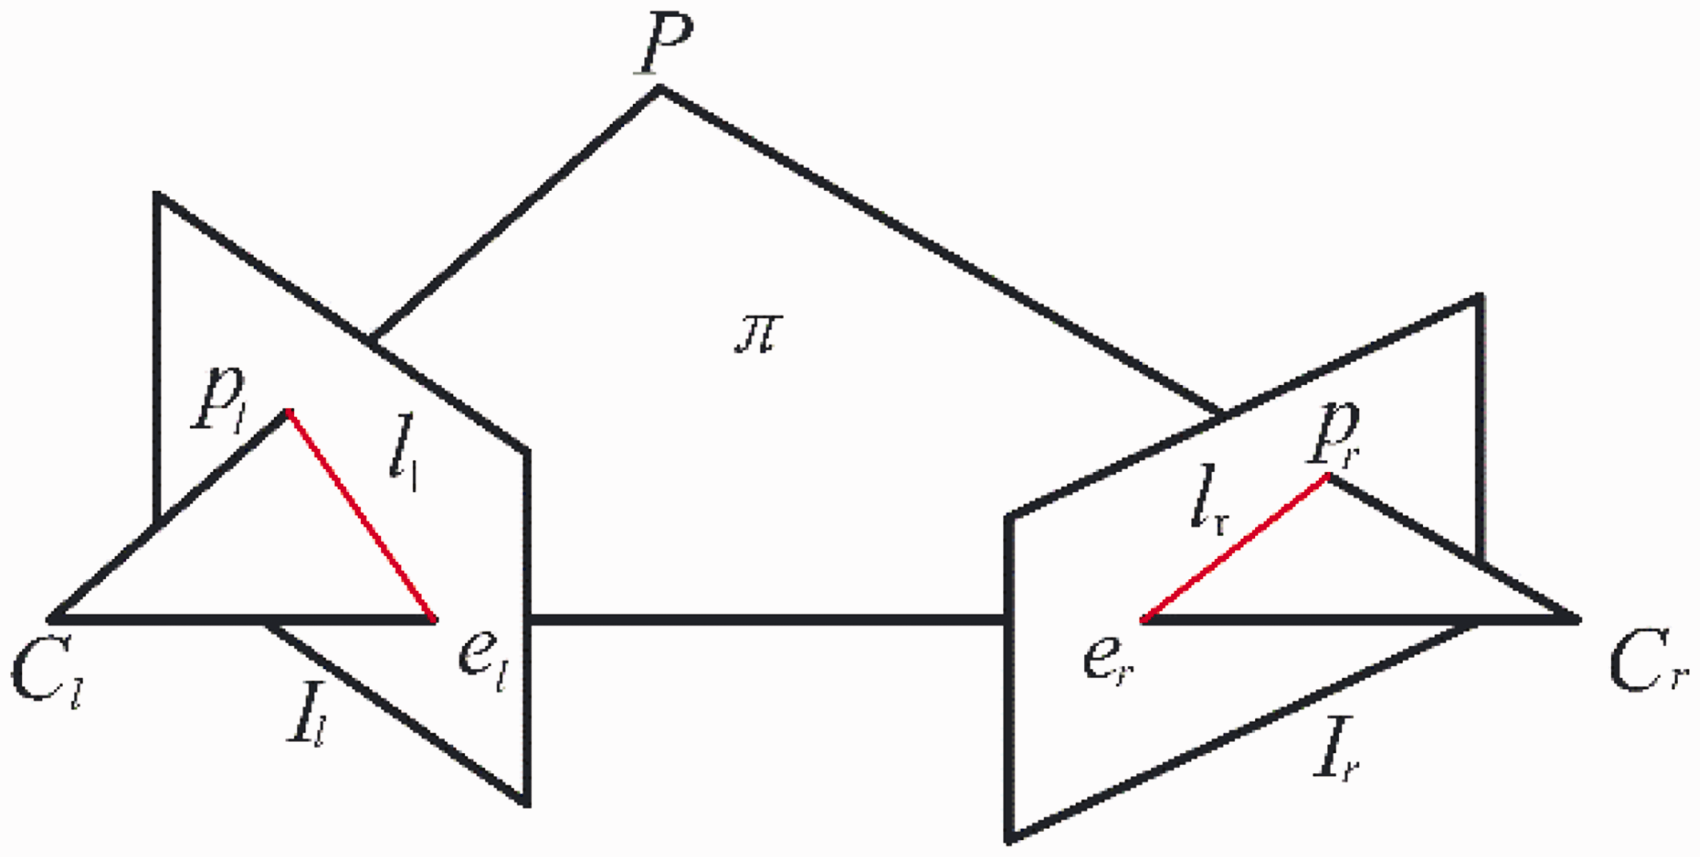
Sketch map of epipolar geometry.
In stereovision field, this mutual corresponding constraint relation expressed by equation (7) is called as the epipolar constraint. 30 The epipolar constraint not only provides the correspondence between point and line, but also guides matching of the corresponding points. Based on this characteristic, as shown in Figure 6, the epipolar constraint is employed to conduct stereo matching of the initial image pairs.
Toward the tracking problem of circular targets on sequence images, the neighborhood searching algorithm is generally used to pursuit feature point. This algorithm is simple and highly efficient. However, the precondition of neighborhood searching algorithm is that the distance between feature points attached on structural surface is larger than the maximum displacement of measured point motion. This precondition limits the number of circular targets and also leads to inconvenience of matching sequence images when the motion of measured structure is unknown.
To deal with this problem, Kalman filtering algorithm 31 is adopted to track circular targets on left and right sequence images in the present paper. As shown in Figure 6, the position of circular target at the next moment is preliminarily located by Kalman filtering algorithm, and then neighborhood searching algorithm is performed. The combination of two algorithms can decrease searching radium and save computation time.
Destructive test of concrete beams strengthened with UV-cured GFRP
Experimental setup
In the destructive test, the section size of concrete beam was
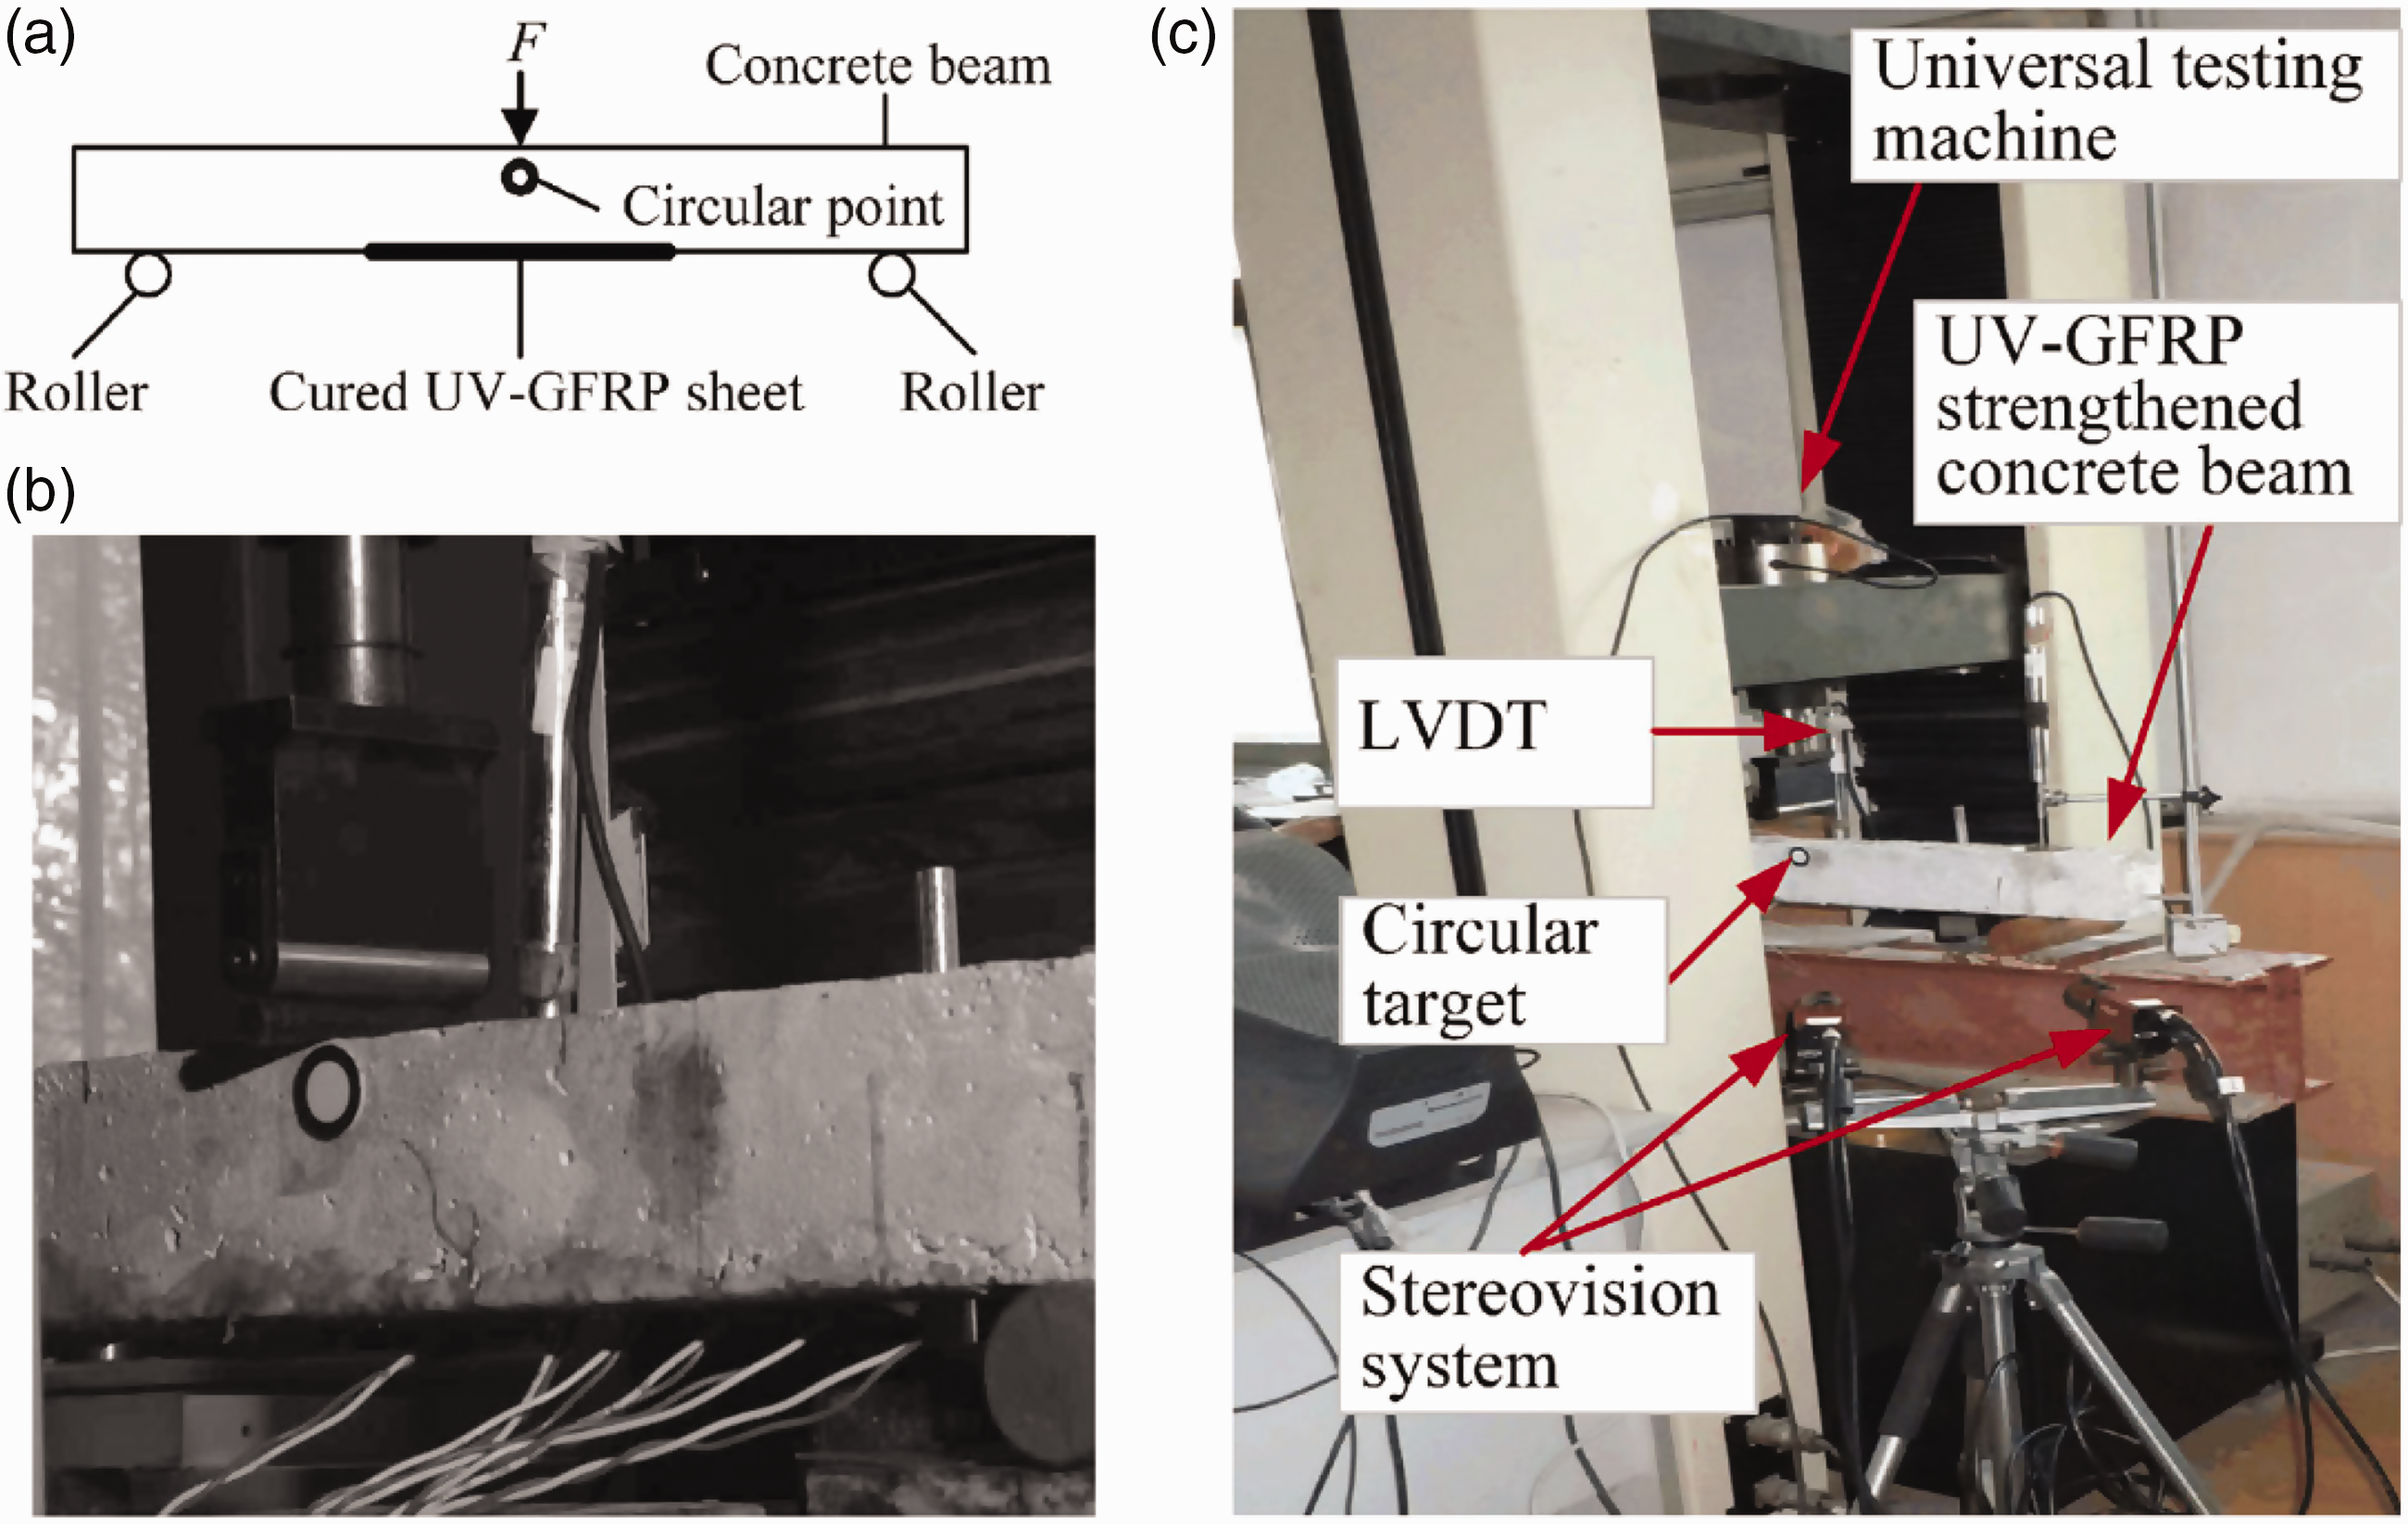
Experimental setup: (a) loading schematic, (b) local photo, and (c) experimental photo. LVDT: linear variable differential transformer; UV-GFRP: ultraviolet-cured glass fiber reinforced polymer.
As shown in Figure 8(c), the destructive test of three concrete beams was sequentially conducted on the universal testing machine whose type was WDW-100D. The universal testing machine can be controlled by two ways which were force loading and displacement. In the present paper, the universal testing machine was controlled by force loading; the step loading of 1 KN was gradually applied to each concrete beam until each concrete beam was destroyed. As shown in Figure 8(b), the loading end of the universal testing machine was imposed on the middle part of concrete beam. A linear variable differential transformer (LVDT) was put on the mid-span of concrete beam and was used to measure the mid-span deflections of concrete beam, which can be compared with the corresponding results of the proposed stereovision method. The measurement range and precision of LVDT were 50.0 and 0.2 mm, respectively.
As shown in Figure 8, a circular target with 15 mm diameter was pasted on one side of concrete beam, which was right under the position where the universal testing machine applied the load. Under each loading, the deformation images of concrete beam at each moment were captured by the stereovision measurement system with the sampling frequency of 1 Hz. Because the destructive test of concrete beam is a static test, and is not a dynamic test. There exist no temporal aliasing during samping, and the sampling frequency of 1 Hz can make sure to synchronously capture left and right images of ecah moment.
As shown in Figure 8(c), the stereovision measurement system was faced to concrete beam with some angle during test. The stereovision measurement system was composed of a computer, two CCD cameras, a tripod, a synchronizer trigger, and the stereovision measurement software. Two Pike F-100c cameras can synchronously capture left and right images with the resolution of 1000 × 1000 at the highest sampling frequency of 60 Hz. Two cameras were equipped with an optical zoom lens of the focal length ranging between 12 and 30 mm. As shown in Figure 9, the stereovision measurement software was comprised of image collection module and image processing module, and had the functions of image capturing, displaying, saving, analyzing, and results output. In the test, a checkerboard pattern was used to calibrate the stereovision measurement system and the intrinsic and extrinsic parameters of stereovision measurement system can be obtained accordingly. In addition, a 1300 W halogen tungsten lamp was selected as a supplemental light source.
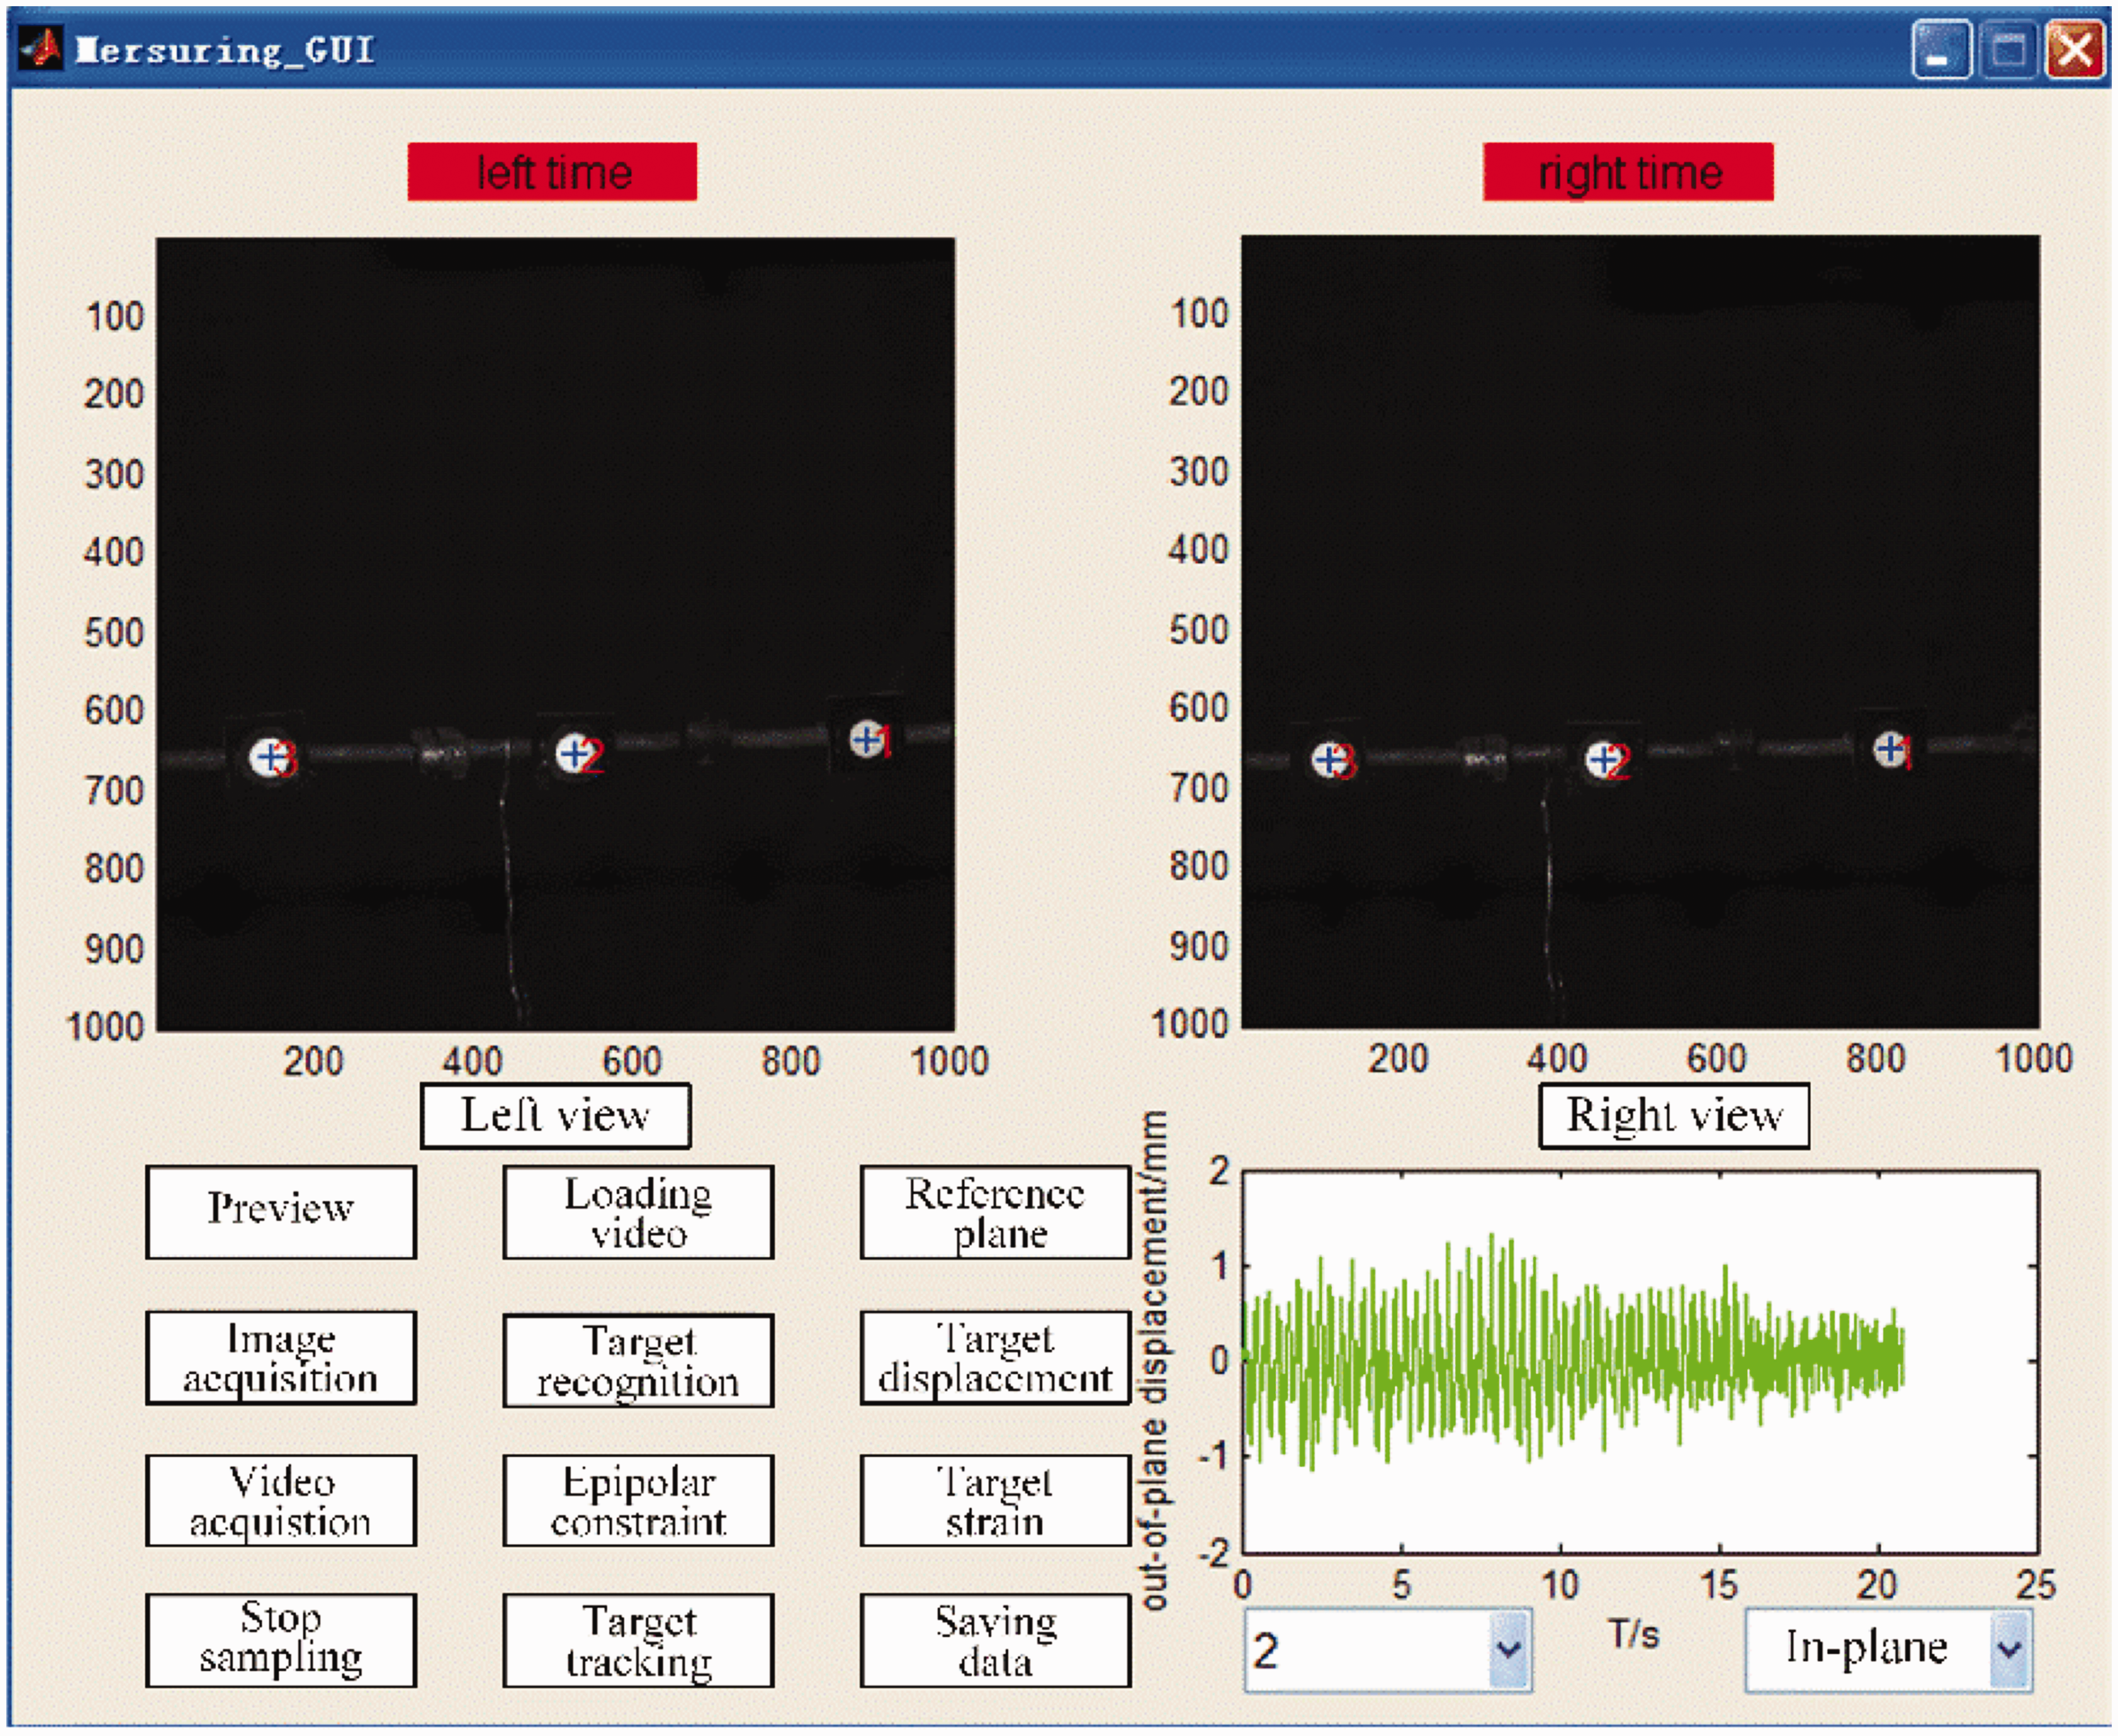
Software interface of stereovision measurement system.
To study the influence of field of view and the inclined angle between stereovision system and specimen on accuracy, for the first UV-GFRP strengthened concrete beam at room temperature, the stereovision system was placed 1.5 m away from concrete beam, the fields of view of two cameras were about
Experimental setting of stereovision system in destructive test.
Note: The inclined angle of the second concrete beam is equal to that of the third concrete beam.
Analysis of experimental results
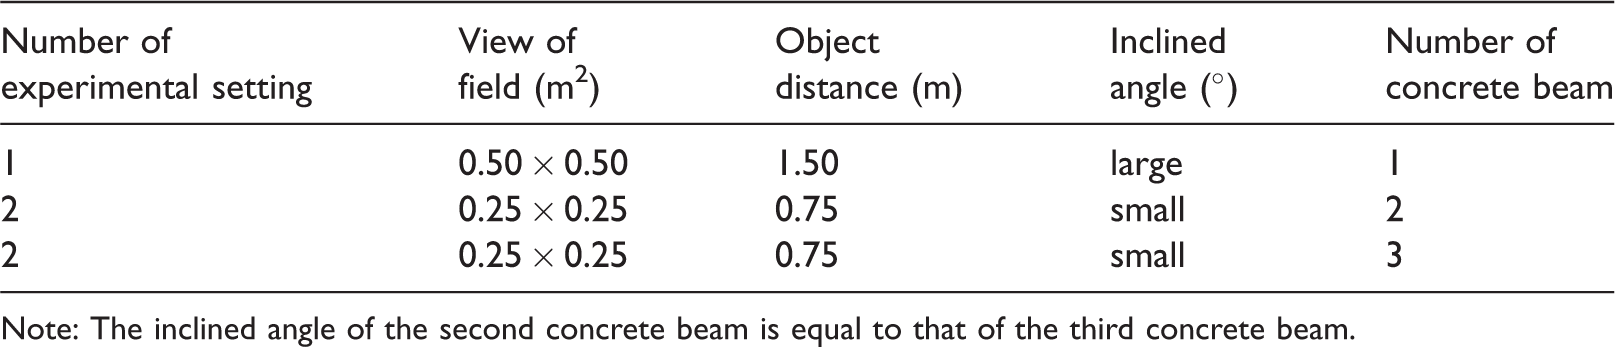
For each concrete beam strengthened with UV-GFRP, before loading, the pictures of three concrete beams which were in static condition were continuously collected for analyzing the sensitivity of stereovision system and the measurement results are given in Figure 10.
Sensitivity of stereovision measurement system: (a) first beam, (b) second beam, and (c) third beam.
As can be seen from Figure 10(a), when the fields of view of two cameras were approximately
For the last two UV-GFRP strengthened concrete beams immersed in alkaline solution, when the fields of view of two cameras were reduced to 0.25 m×0.25 m and the object distances between specimens and stereovision system were decreased to 0.75 m, it can be found from Figure 10(b) and (c) that more than 95% of zero drifts are less than 0.03 mm. In addition, the inclined angles between stereovision system and other two concrete beams soaked in alkaline solution became smaller. This shows that the reduced field of views and the small inclined angle can effectively improve the sensitivity of stereovision system.
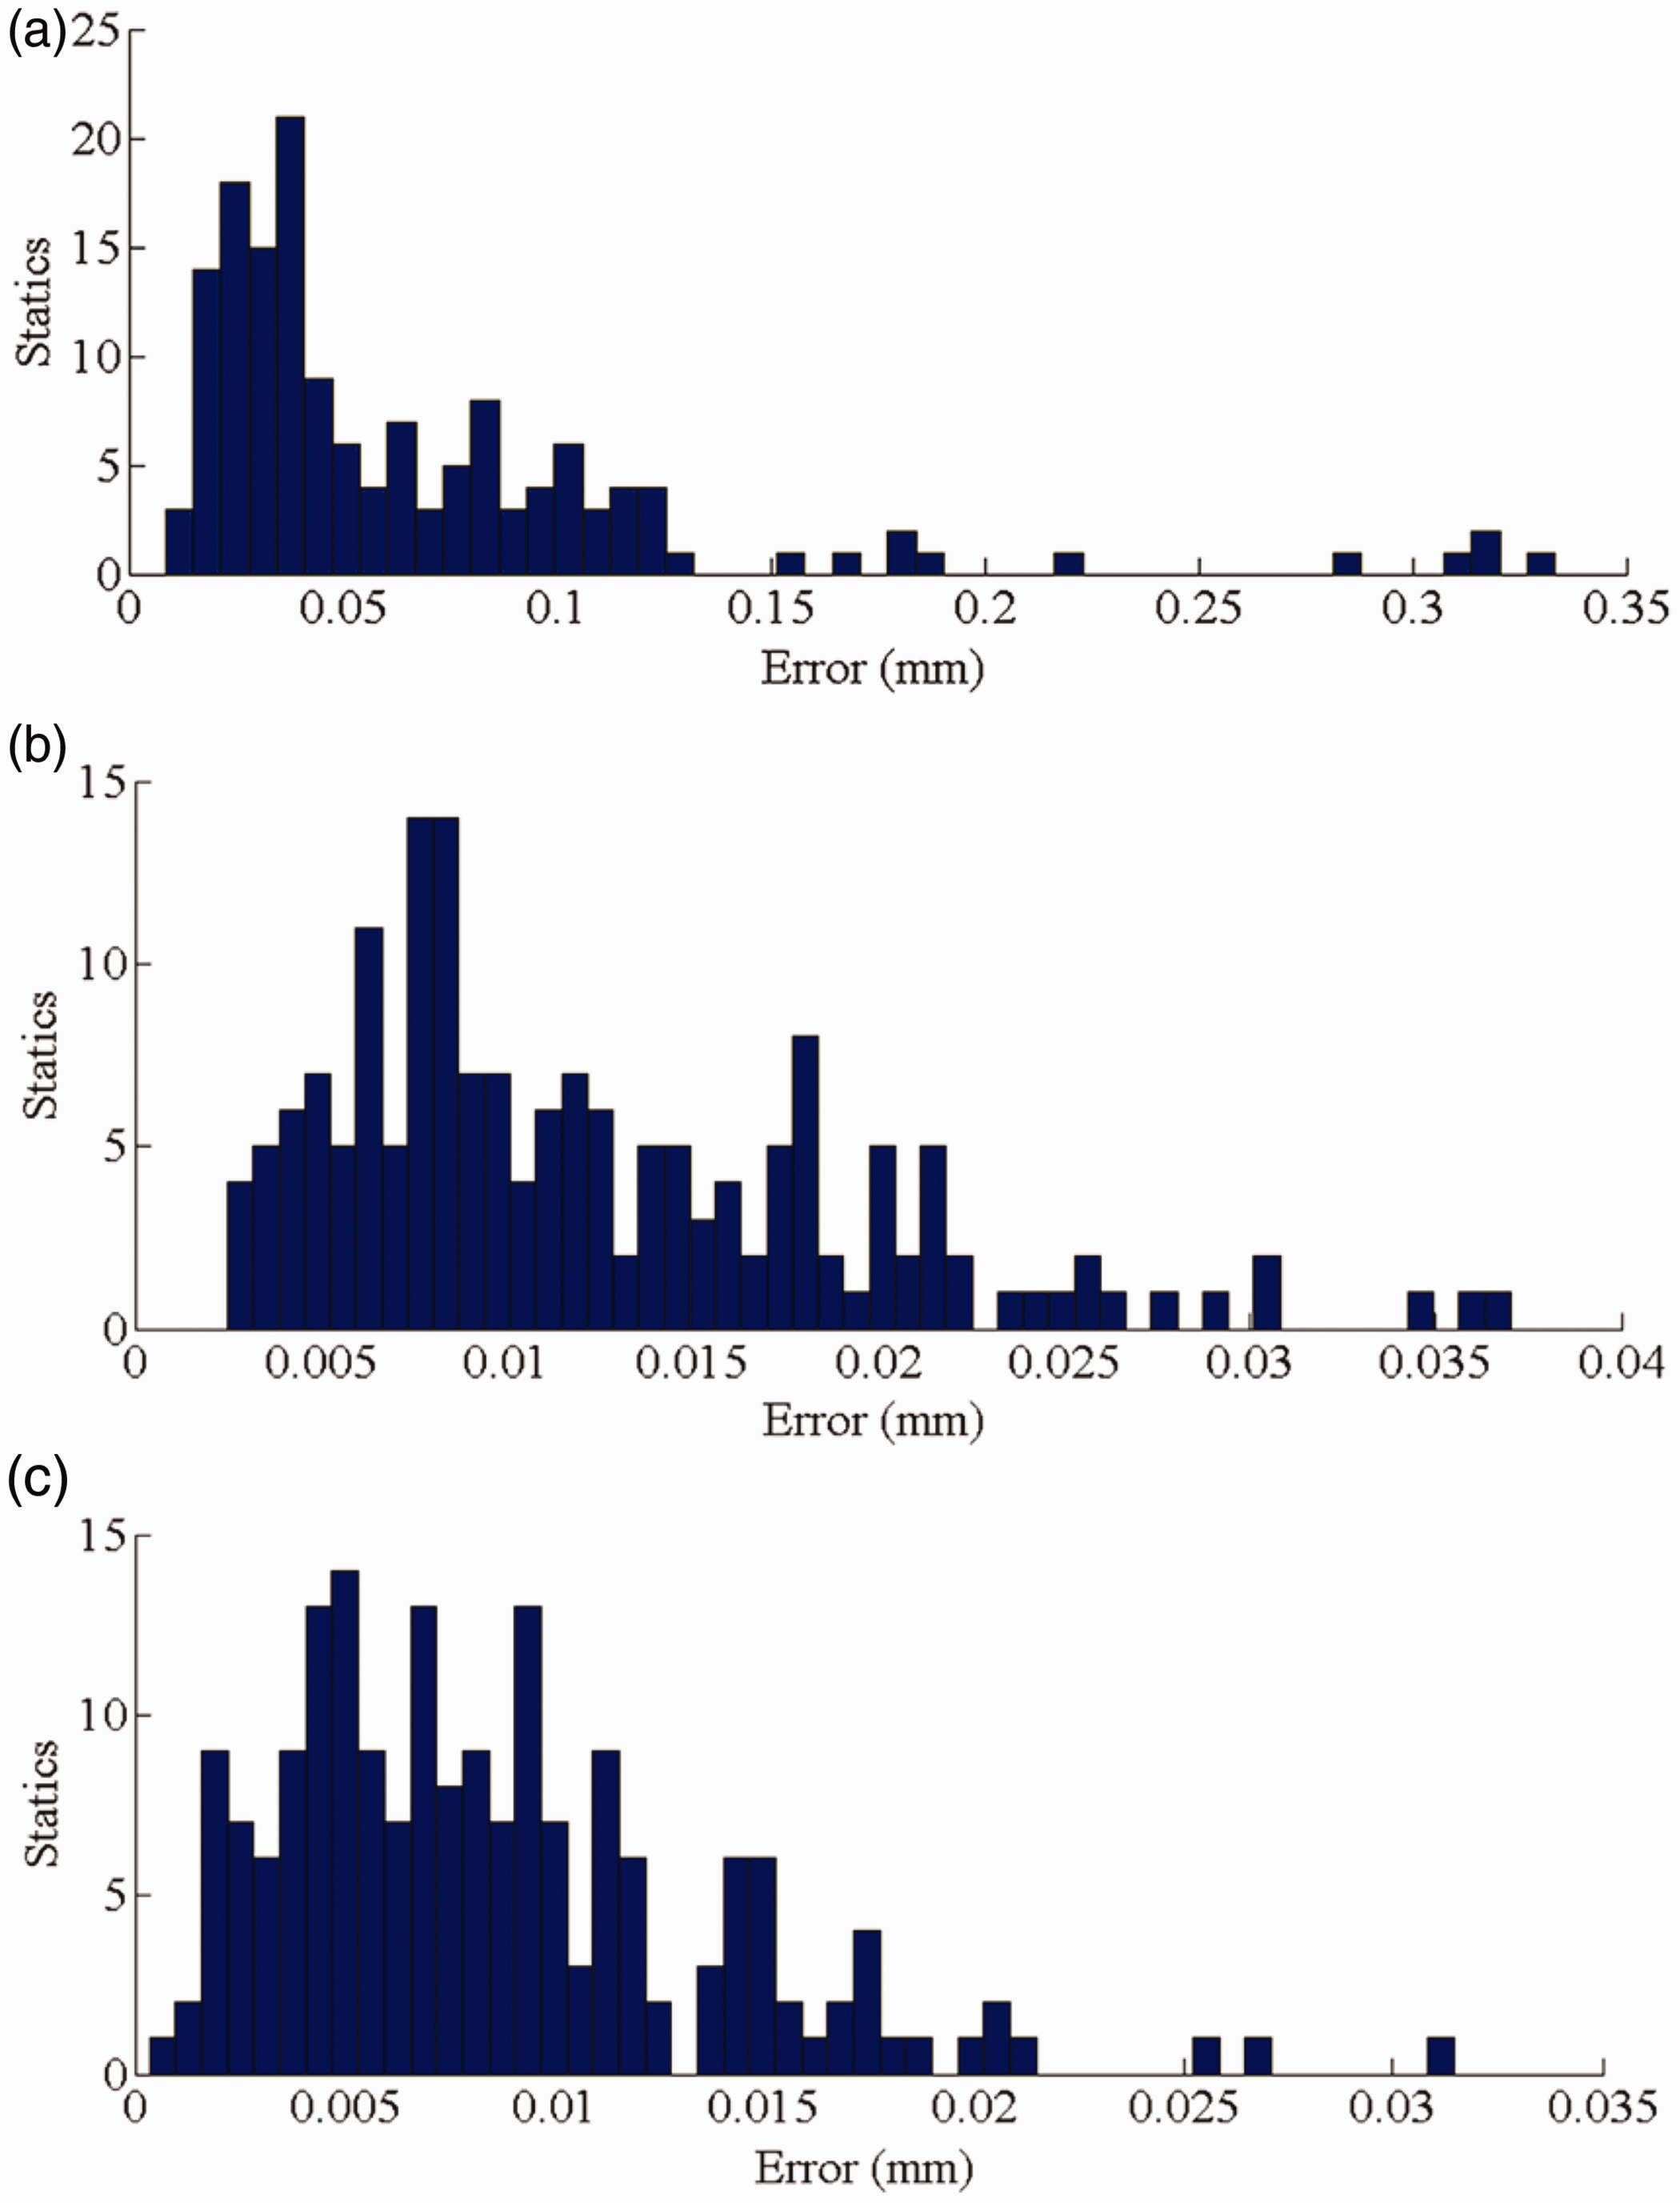
The measurement results of three concrete beams strengthened with UV-cured GFRP are shown in Figure 11. It can be seen from Figure 11 that indoor environment has little effect on the maximum load of concrete beam strengthened with UV-cured GFRP. Compared with the first concrete beam, the maximum loads of the last two concrete beams strengthened with UV-cured GFRP show a downward trend, which were immersed in alkaline solution. Because alkaline solution has the corrosive effect on UV curing resin, the degradation of UV-GFRP sheet was exacerbated, resulting in the decrease of mechanical properties. Therefore, the bonding strength between UV curing resin and concrete beam is reduced through six months’ immersion in alkaline solution.
Load–displacement curves of concrete beams strengthened with UV-cured GFRP: (a) first beam (indoor environment), (b) second beam (alkaline solution), and (c) third beam (alkaline solution). LVDT: linear variable differential transformer.
From Figure 11, the load–displacement curves obtained by the proposed stereovision method and LVDT have the same trend and agree well with each other. It can be seen from Figure 11 that the measurement results obtained by the stereovision method are slightly different from that of LVDT. The reason is the difference in the measurement positions of two methods and the local compression damage of concrete beam. As shown in Figure 8, the distance between the load position applied by the universal testing machine and the position of circular target measured by the stereovision method is about 20 mm. As shown in Figure 12, the local compression damage can be found on the loading positions of concrete beam.
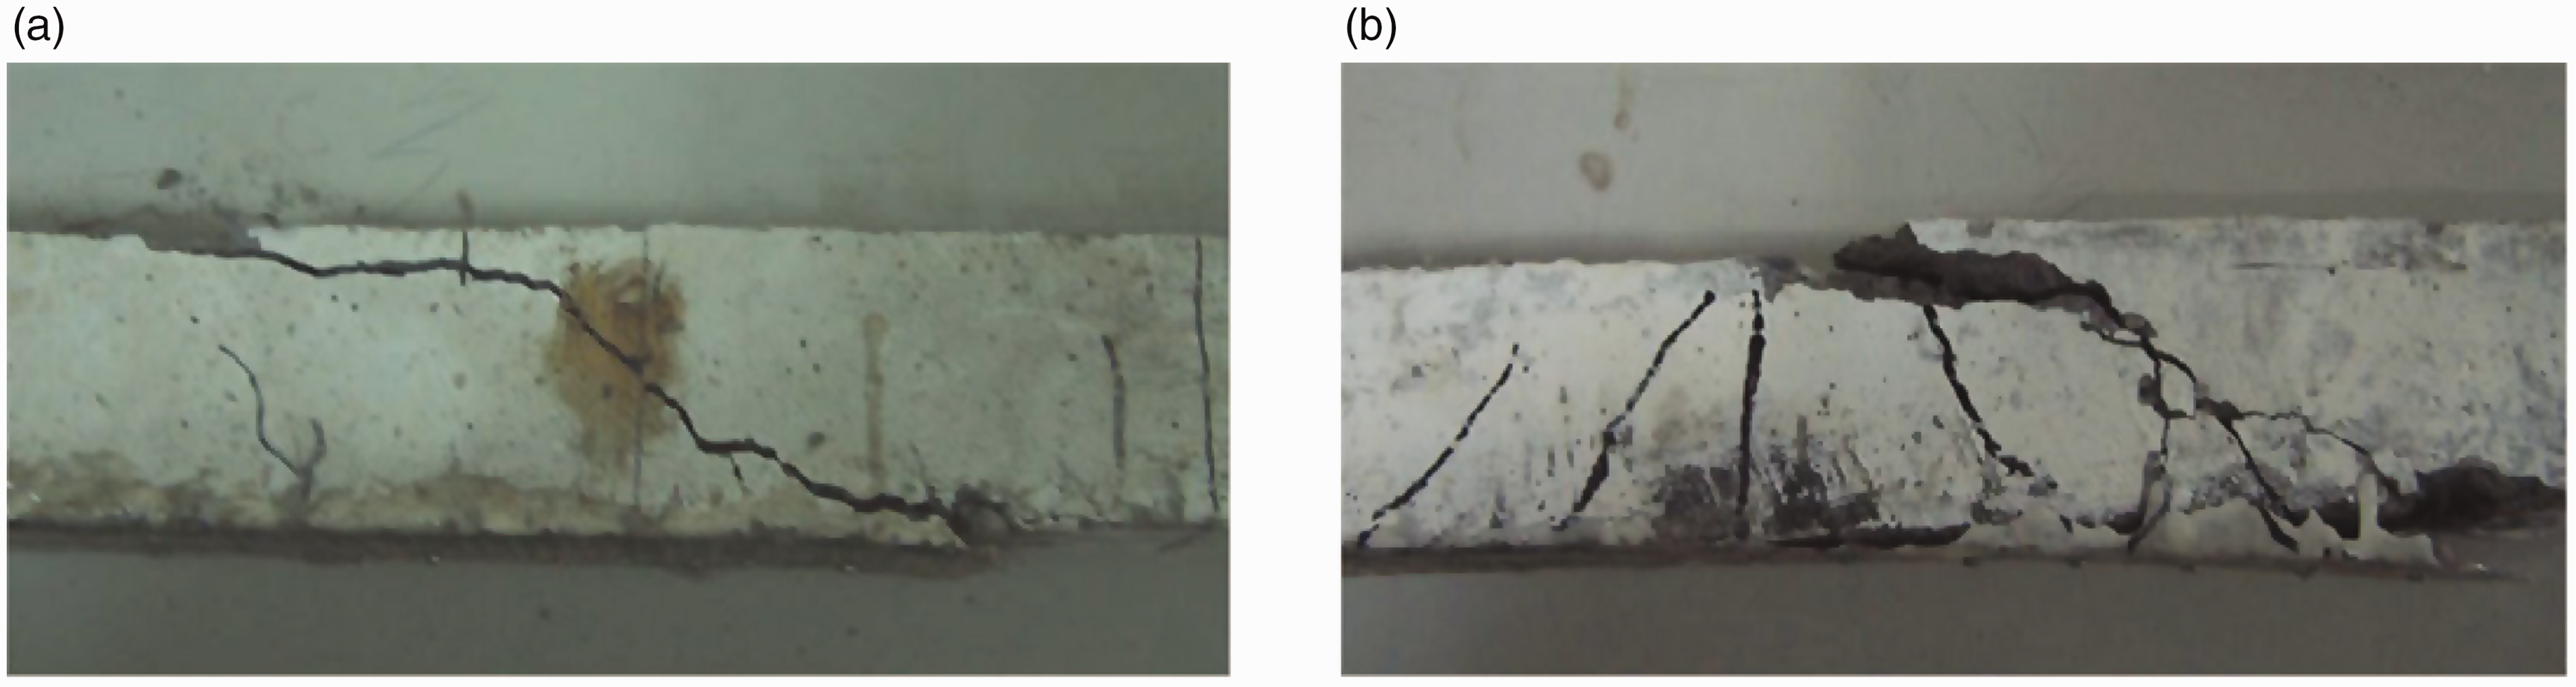
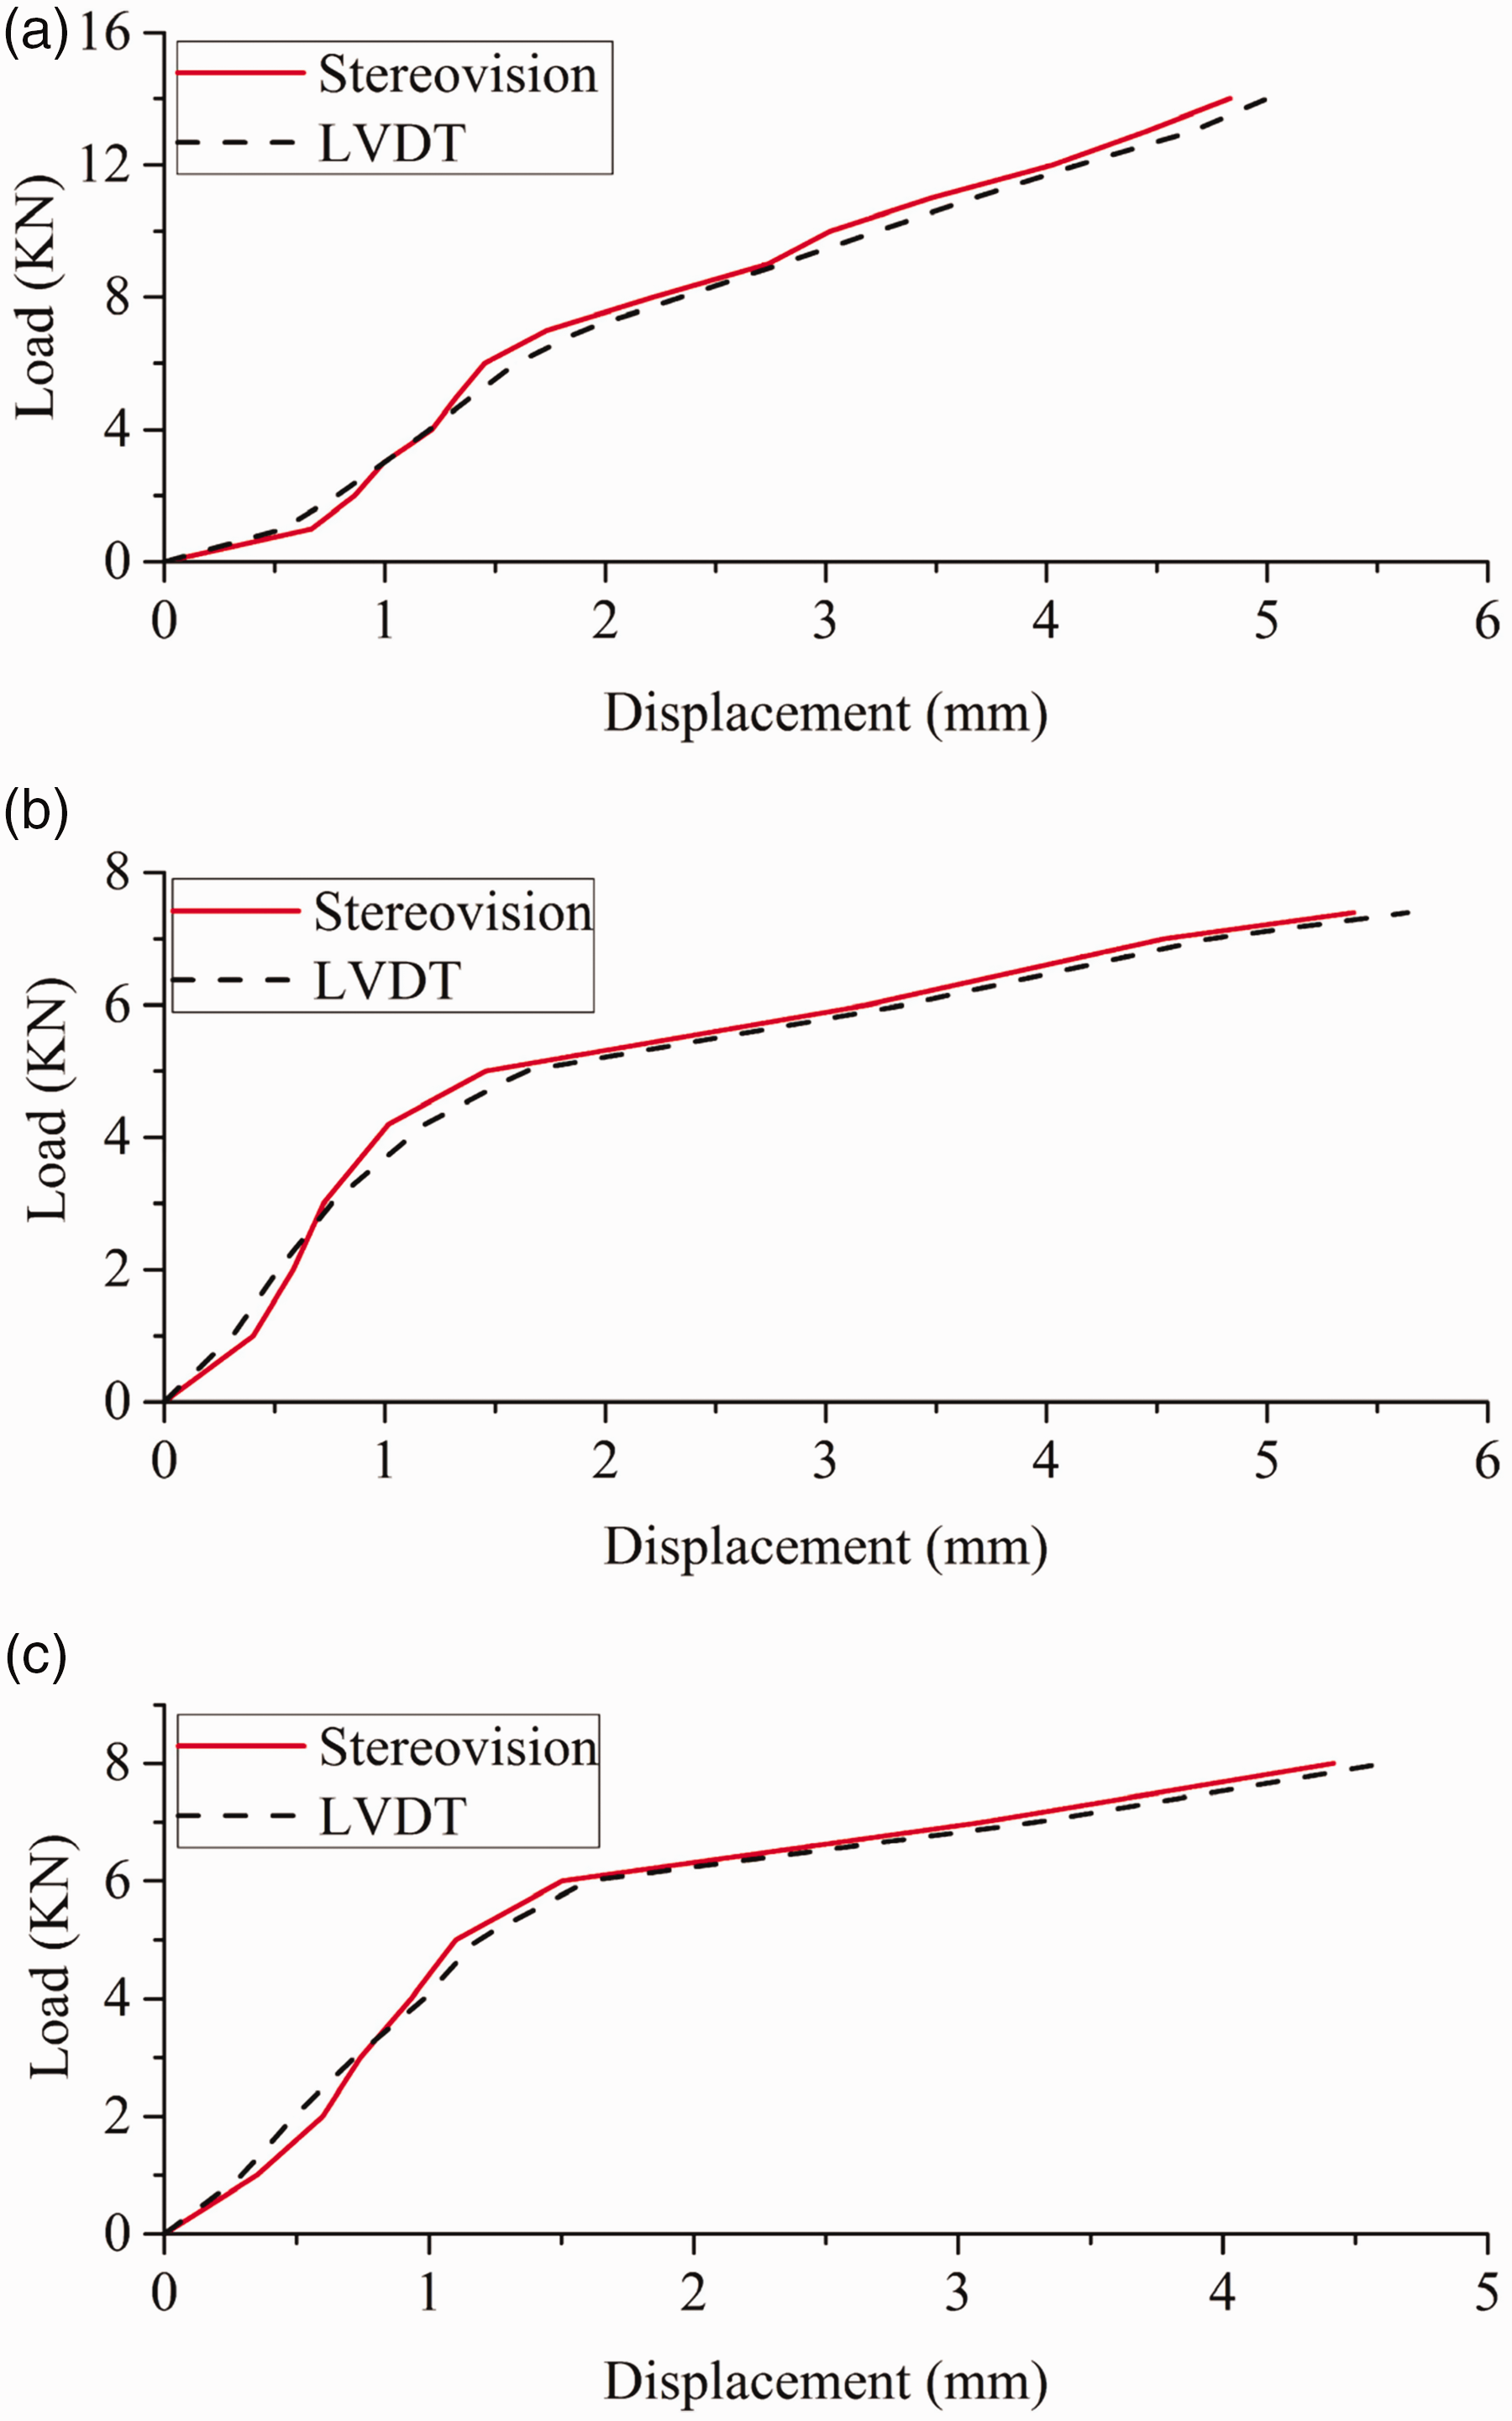
Typical failure modes of concrete beams: (a) indoor environment and (b) alkaline solution.
From Figure 11(a), the load–displacement curves obtained by the stereovision method and LVDT have the same trend. The first concrete beam strengthened with UV-cured GFRP has the characteristic of small plastic deformation and brittle failure. From Figure 11(b) and (c), it can be seen that the displacement curves obtained by two methods can accurately describe the static performance of concrete beams strengthened with UV-cured GFRP. The curves have the obvious elasticity and plastic stages, and the last two concrete beams strengthened with UV-GFRP bring forth the ductility damage.
As shown in Figure 12, the failure mode of concrete beam changed from the shear failure to the bending-shear failure, indicating that the UV-cured GFRP sheet has lost its reinforcing effect. This shows that bond failure between UV curing resin and concrete beam occurs in alkaline solution.
Conclusions
Based on the binocular stereovision model, a 3D displacements measurement method based on structure coordinate system is proposed in the present paper, and the absolute displacements of structure can be acquired by establishing the structure coordinate system and coordinate transformation. The center identification algorithm for circular targets can access the subpixel coordinates of centers, and the matching pursuit algorithm accomplishes 3D matching of circular targets. The mid-span deflections of concrete beams strengthened with UV-cured GFRP in a destructive test are monitored by the proposed stereovision method. Stereovision measurement results are compared with the corresponding results obtained by LVDT, and the following conclusions are drawn:
The load–displacement curves obtained by the proposed stereovision method and LVDT have the same trends, and the load–displacement curves of two methods agree well with each other, this verifies the effectiveness of the proposed stereovision measurement method. Experimental results show that the inclined angle between specimen and cameras and the view of field have a significant influence on the sensitivity of stereovision measurement system. Results indicate that the sensitivity of stereovision measurement system is significantly improved by reducing the field of view and the inclined angle between cameras and concrete beam. Results show that the proposed stereovision method can be used for monitoring the entire destructive test. One thing needs to be noted that the measurement precision of the proposed stereovision method decreases with the increase of object distance. Therefore, when the proposed method is used to measure actual structure in outdoor field, the object distance should be controlled within the appropriate range between several hundreds of centimeters and several meters.
Footnotes
Declaration of conflicting interests
The author(s) declared no potential conflicts of interest with respect to the research, authorship, and/or publication of this article.
Funding
The author(s) disclosed receipt of the following financial support for the research, authorship, and/or publication of this article: This paper is supported by the National Natural Science Foundation of China under Grant No. 51478148, the Natural Science Foundation of Heilongjiang Province under Grant No. E201434, and the Technological Innovation Talent Foundation of Harbin City under Grant No. 2015RAQXJ028.