
Abstract
To provide a comprehensive understanding of the pressure fluctuation–vortex interaction in non-cavitation and cavitation flow, in this article, the unsteady flow in an ultra-low specific-speed centrifugal pump was investigated by numerical simulation. The uncertainty of the numerical framework with three sets of successively refined mesh was verified and validated by a level of 1% of the experimental results. Then, the unsteady results indicate that the features of the internal flow and the pressure fluctuation were accurately captured in accordance with the closed-loop experimental results. The detailed pressure fluctuation at 16 monitoring points and the monitoring of the vorticity suggest that some inconsistent transient phenomena in frequency spectrums show strong correlation with the evolution of vortex, such as abnormal increasing amplitudes at the monitoring points near to the leading edge on the suction surface and the trailing edge on the pressure surface in the case of lower pressurization capacity of impeller after cavitation. Further analysis applies the relative vortex transport equation to intuitionally illustrate the pressure fluctuation–vortex interaction by the contribution of baroclinic torque, viscous diffusion and vortex convection terms. It reveals that the effect of viscous diffusion is weak when the Reynolds number is much greater than 1. Pressure fluctuation amplitude enlarges on the suction side of blade near to the leading edge due to the baroclinic torque in cavitation regions, whereas the abnormal increase of pressure fluctuation after cavitation on the pressure surface of blade approaching the trailing edge results from the vortex convection during vortices moving downstream with the decrease of available net positive suction head at the same instance.
Keywords
Introduction
The specific speed, ns, of an ultra-low specific-speed centrifugal pump is less than 30, and thus impeller passages are typically designed to be narrow and long to satisfy low flow rate and high head requirements. However, there are certain operating problems, namely, low-capacity performance, 1 hump under partial flow rate, 2 overloaded likelihood 3 and cavitation, 4 which are difficult to deal with. Moreover, there is typically a large adverse pressure gradient accompanied by separation vortices in impeller passages.
The monitoring of complex inner flow phenomena in the hydraulic machinery has been a hot topic.5,6 The detection and diagnosis of the inception and the severity of cavitation provide means for preventing accidents. When severe cavitation occurs, it is usually accompanied by significant noise. However, sometimes no audible noise will be heard at the cavitation inception. In order to clarify the relationship between cavitation evolution and pressure fluctuation, Seol 7 and Chen et al. 8 launched the experimental and computational work on a propeller and in a convergent–divergent channel. The results showed that the evolution of cavitation can be predicted by the variation of pressure fluctuation. Ji et al. 9 also tried to confirm the mechanisms between the two mentioned above. Through analyzing the synchronous variation between cavity volume and pressure fluctuation in cavitation zone, they came to the conclusion that the acceleration of cavity volume was the dominant source of the excited pressure, which in turn explained that pressure fluctuation could be employed to describe the development of cavitation. Jia et al. 10 carried out dynamic pressure tests in a centrifugal pump to investigate the pressure distribution on volute and front shroud. The results showed that pressure fluctuation was sensitive to the flow rate, and therefore they presented the asymmetry in the pressure distribution as a function of the flow rate afterwards. Liu et al. 11 studied the characteristics of pressure fluctuation at the impeller outlet. The results presented that the main component of the impeller–volute interaction was the blade passing frequency, and the harmonic interference was due to the unsteady flow. Tan et al. 12 investigated the unsteady cavitation flow in a centrifugal pump under off-design conditions. The research indicated that cavitation has more influence on pressure fluctuation in the impeller under partial discharge than large discharge owing to the more intense disturbances caused by cavitation shedding and explosion under partial discharge. Zhang et al. 13 investigated the frequency domain characteristics of pressure fluctuation with a wide range of the low-load conditions in a prototype reversible pump turbine. The results revealed that the propagation of pressure fluctuation at vaneless space led to a significant amplitude to the upstream and a smaller one to the downstream areas, which reflected the influence mechanism of rotor–stator interactions. The research of Zhang et al. 14 in our research group took the form of large eddy simulation to calculate the pressure pulsation in the volute of a low specific-speed centrifugal pump. It helped to understand the variation of pressure pulsation with different flow rates, radial distance, circumferential angles and axial distance. In light of the effect of the inlet guide vane number on hydraulic stability, Hou et al. 15 selected the inlet guide vane with six vanes for engineering application after analyzing pressure fluctuation amplitude and power spectrum density.
In previous studies, many scholars have found that the evolution of cavitation had a close relationship with the change of the vortex field. Arndt 16 pointed out that vortex cavitation had a dominant effect on the inception process in a broad range of turbulent flow, and vortex instability was associated with sheet/cloud cavitation. Le et al. 17 researched the characteristics of flow under partial cavitation. The results indicated that the instability of cavitation had an intimate contact with the thickness of the cavity and the reentrant jet, which further led to vortices production. Kimura and Yoshida 18 conducted an unsteady simulation in a turbopump inducer under non-cavitation conditions to study the vortex structure with different flow rates. They found that the change regulation of the vortex structure was analogous to that of rotating cavitation, which strongly demonstrated that the vortex was responsible for the occurrence of rotating cavitation. Using different twisted hydrofoils, Ji et al. 19 and Huang et al. 20 investigated the cavitation–vortex interaction. They found that cavitation could strengthen vortex production and increase the boundary layer thickness with local separation and flow unsteadiness. Furthermore, they revealed the influence of cavitation on the vorticity field by employing the vortex transport equation. Subsequently, Huang et al. 21 studied the structure of cavitation flow in a mixed-flow waterjet pump. Considering the rotation effect, they used the relative transport equation to improve the understanding of mechanisms of the cavitation–vortex interaction, and then he drew conclusions that vortex dilation and stretching terms were the main contributors as cavitation occurred and diffused.
Although great progress has been made on the instability flow in fluid machinery by numerical and experimental methods, previous researches often focused on the analysis of pressure fluctuation or the investigation of internal flow field. There is less attention that was paid to the interaction between the acoustic signal (pressure fluctuation) and the vortex structure (the internal flow field). Indeed, some special pressure pulsation phenomena are closely related to the evolution of the vorticity field, so the pressure fluctuation–vortex interaction is a worthwhile topic. Anup et al. 22 utilized a numerical analysis to investigate the pressure oscillation owing to the vortex shedding under partial discharge in a Francis turbine. Gao et al. 23 and Gu et al. 24 carried out experiments of pressure fluctuation measurements to get further insight into dynamic properties of the vortex in different cyclone separators. Luo et al. 25 studied the variation of pressure fluctuation caused by vortex rope under different gas injection, and the air occupation at the draft tube center for the stable operation was proposed. However, certain unusual characteristics of pressure fluctuation induced by vortices are still to be solved urgently in the ultra-low specific-speed centrifugal pump with a complex vorticity field. Gao et al. 26 demonstrated the effect of different blade trailing edge profiles on the performance and unsteady pressure fluctuation in a low specific-speed centrifugal pump. Through the vorticity distributions with different blade trailing edge profiles, they concluded that the vortex shedding intensity from the blade trailing edge was the dominated factor for the change of the performance and pressure fluctuation amplitude. Unfortunately, the effect of the vortex evolution over time on the pressure fluctuation could not be captured owing to the mesh resolution at the blade trailing edge region. However, the vortex transport equation is a powerful and available mean to quantitatively analyze characteristics and rules of the vortex distribution in the viscous flow. Branlard 27 systematically derived the vortex transport equation, and then he applied the vortex-based model to the wind turbine aerodynamics. Thereafter, the vortex transport equation has been widely applied for better understanding the variation of the vortex field.18–20,28,29 As a result, the vortex transport equation can be used to combine pressure fluctuation with vortex dynamics, which provides a better insight of the excitation effect of cavitation on pressure fluctuation.
In this paper, a three dimensional (3D) unsteady simulation for non-cavitation and cavitation flow in the whole flow passage of an ultra-low specific-speed centrifugal pump was implemented, and the pressure fluctuation was analyzed via fast Fourier transform (FFT). Further analysis put emphasis on some special phenomena in the evolution of pressure fluctuation, such as the abnormal increase of pressure fluctuation amplitudes at certain monitoring points after cavitation, by using the derived relative vortex transport equation to clearly explain the mechanism of the pressure fluctuation–vortex interaction in an ultra-low specific-speed centrifugal pump for the first time.
Experimental tests and numerical method
Experimental tests
Hydraulic tests were carried out to validate the accuracy of the simulation. As shown in Figure 1, an electric motor was employed to drive the centrifugal pump system with a constant rotating speed. The water supplied from a tank was returned to the same tank, namely, a closed loop. A water ring vacuum pump was installed under the tank to adjust the inlet pressure, and an electromagnetic flowmeter and two differential pressure transmitters were aiming at recording the flow and pressure conditions. The data collector was responsible for acquiring the acoustic signals of pressure fluctuation with 180 sample points per revolution and the dynamic data process program performed the FFT to obtain the information of the frequency domain. Main parameters of measuring instruments used in the experiment are listed in Table 1. Two major experiments, including cavitation performance experiments and pressure fluctuation experiments, have been done on this system.
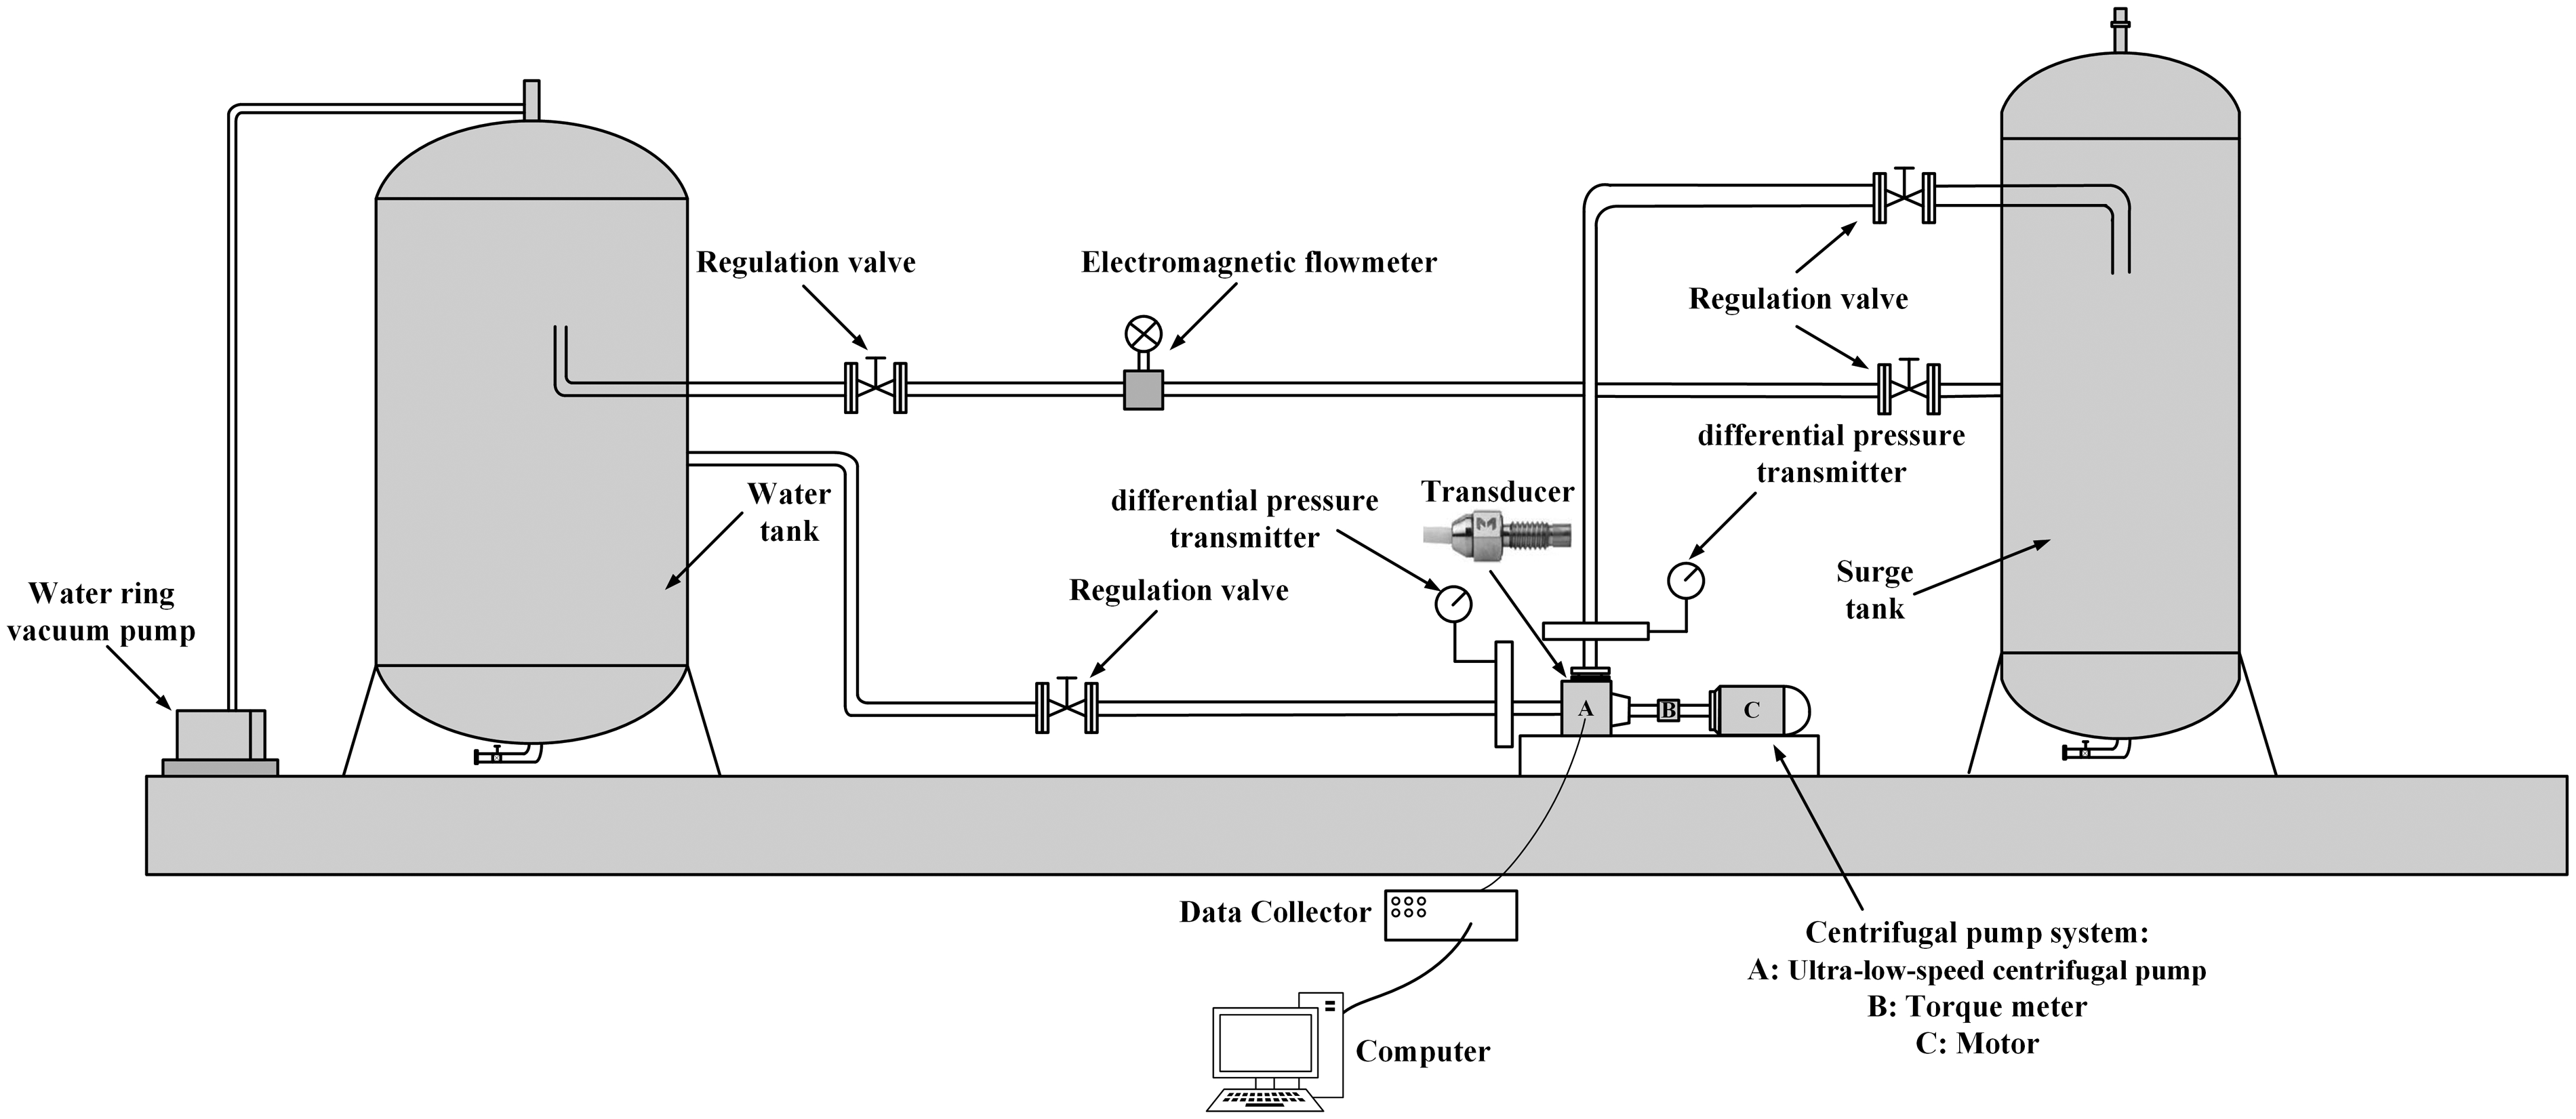
Schematic diagram of the hydraulic test set-up.
Main parameters of the measuring instruments.
Physical model
The ultra-low specific-speed centrifugal pump applied in the research is shown in Figure 2. It consists of a suction, a four-blade impeller, a volute and a draft tube. Considering inlet effect, the suction length is extended to five times as long as the diameter of the impeller eye, whereas the draft tube with a length five times longer than the outlet diameter of the volute is installed to prevent backflow. The specific speed,
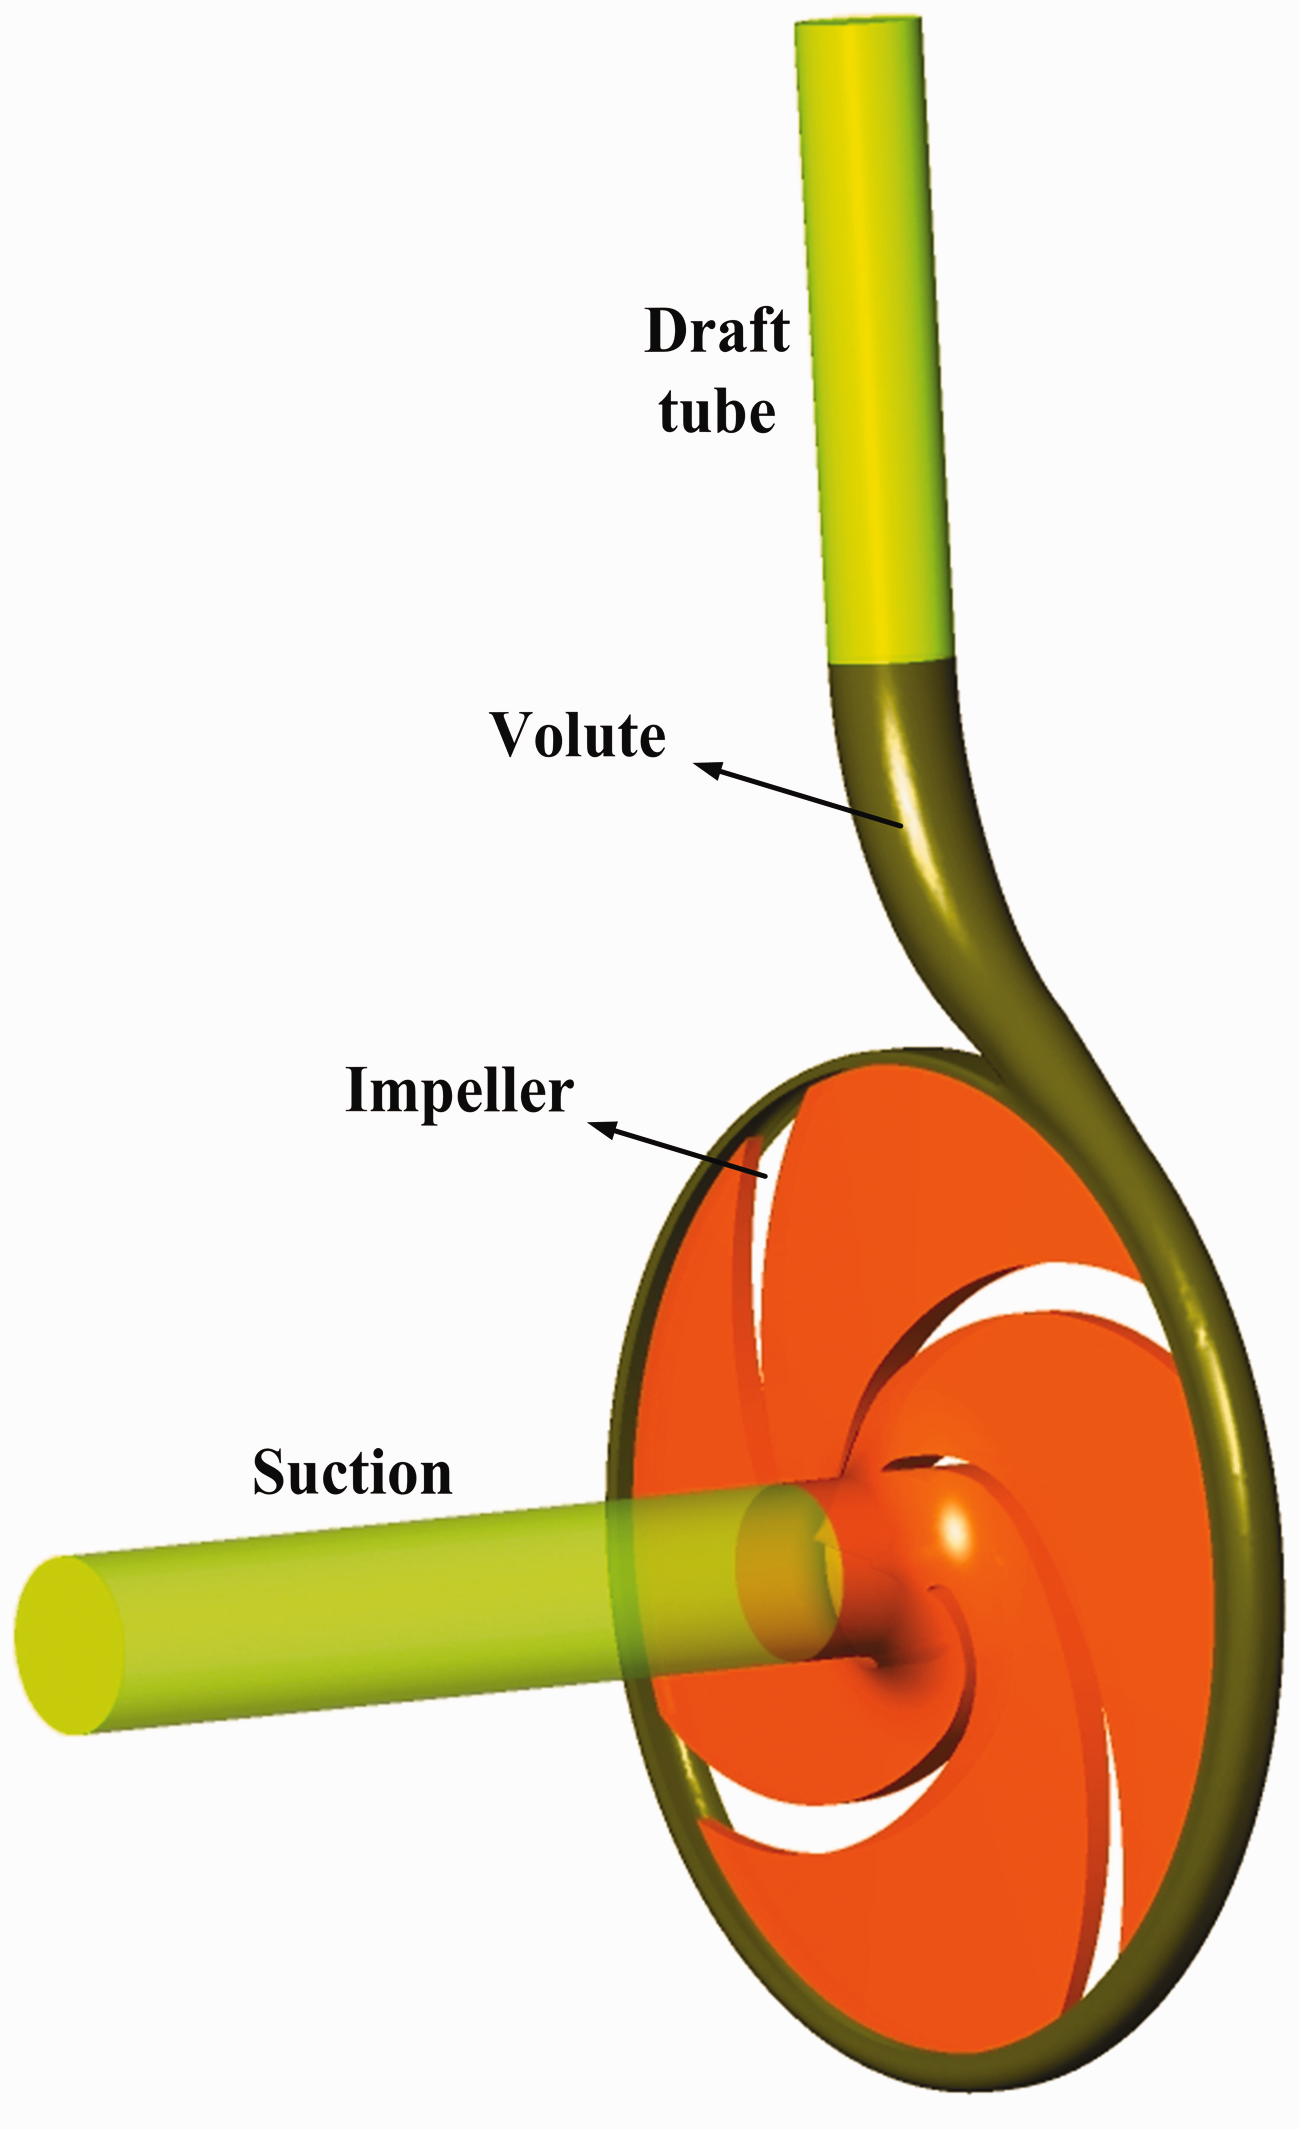
The structure of the pump.
Main geometrical parameters of the pump.
Mesh generation
The full passage simulation from the inlet extension to the outlet extension was carried out with structured grids except the volute tongue (as shown in Figure 3). Considering the complex shape of cut-water, multi-block hybrid grid and refined work around the cut-water were utilized in the volute. Consequently, there are three pairs of interfaces between the cut-water and other parts of the volute. The volume average values of y+ were 51 and 68 for the above two regions, which both met the requirements of the simulation in the near-wall regions. 30
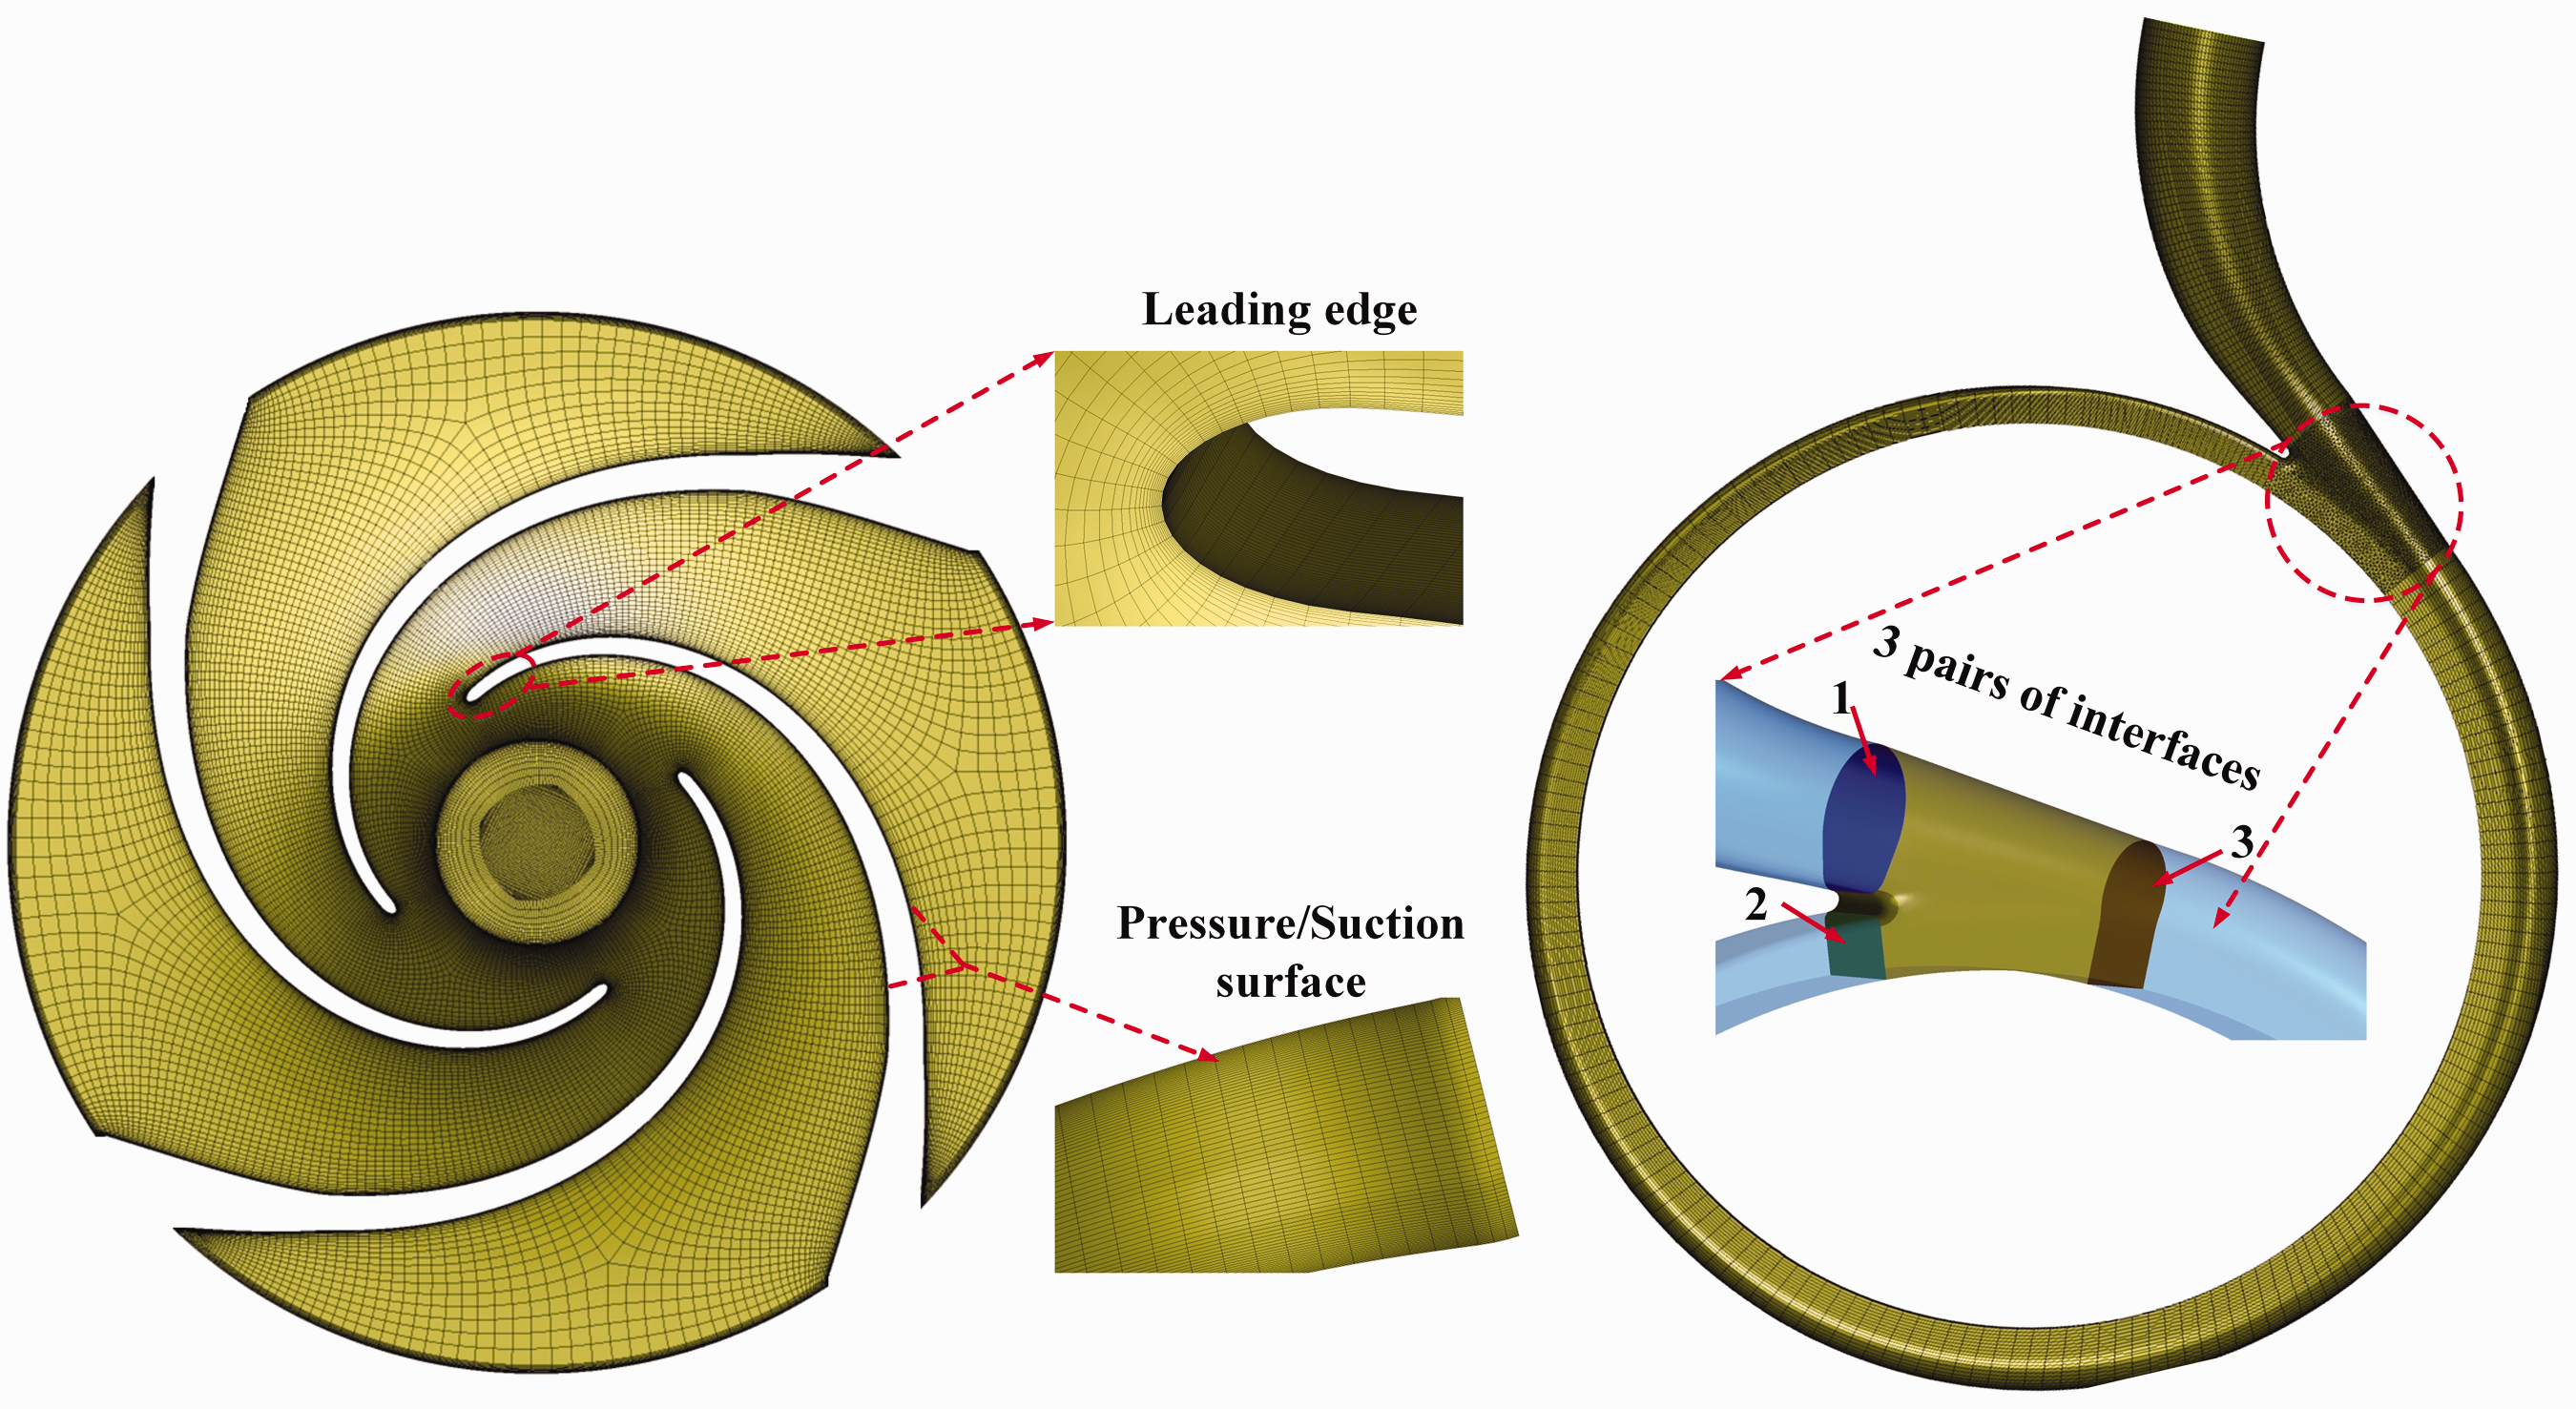
Mesh profile of the centrifugal pump.
Numerical model and parameter setting
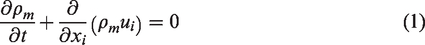
After cavitation, the vapor/liquid two-phase flow is supposed to be homogeneous, that is, two phases along the interface share the same velocity and pressure. The governing equations based on Reynolds-averaged Navier–Stokes method consist of mass continuity (equation (1)) and momentum (equation (2)) equations. Simulations were carried out by the commercial software ANSYS-CFX. Prior to performing a case, the re-normalization group (RNG) k–ε turbulence model with scalable wall functions was applied (see Hou et al.
15
for details). For obtaining the cavitation performance, the Zwart-Gerber-Belamri model (see Ji et al.
9
) was chosen. Based on the assumption of homogeneous mixture model, vapor area is relatively stable and shares the same velocity with the liquid. As the common velocity in the centrifugal pump is much lower than the local sound velocity (Mach number is less than 0.3, local sound velocity of vapor at 298 K is about 426.52 m/s), it can still be treated as an incompressible fluid


The inlet static pressure and outlet mass flow conditions were set at first, whereas all physical walls were considered as no-slip boundary conditions. The flow in impeller domain was simulated in a rotational frame, whereas the other domains were based on a stationary frame. The rotational and stationary domains were connected by the general grid interface where the grid on either side of the two connected surfaces permits non-matching.31–33 Then, the interfaces between the rotating and stationary components were set as frozen rotor for the steady calculation, yet transient rotor stator was set for the unsteady calculation.34,35 Finally, the calculation was regarded as convergence when the root mean square residual was below 1.0 × 10⁻⁴. The results of the steady calculation were taken as the initial flow field in the transient flow calculation. As introduced in ANSYS CFX tutorials, the time-step size in the rotating machinery is calculated by
As shown in Figure 4, 16 monitoring points were set at the middle, the pressure and the suction sides of the blade and the outlet of the volute to record pressure fluctuation in the pump.
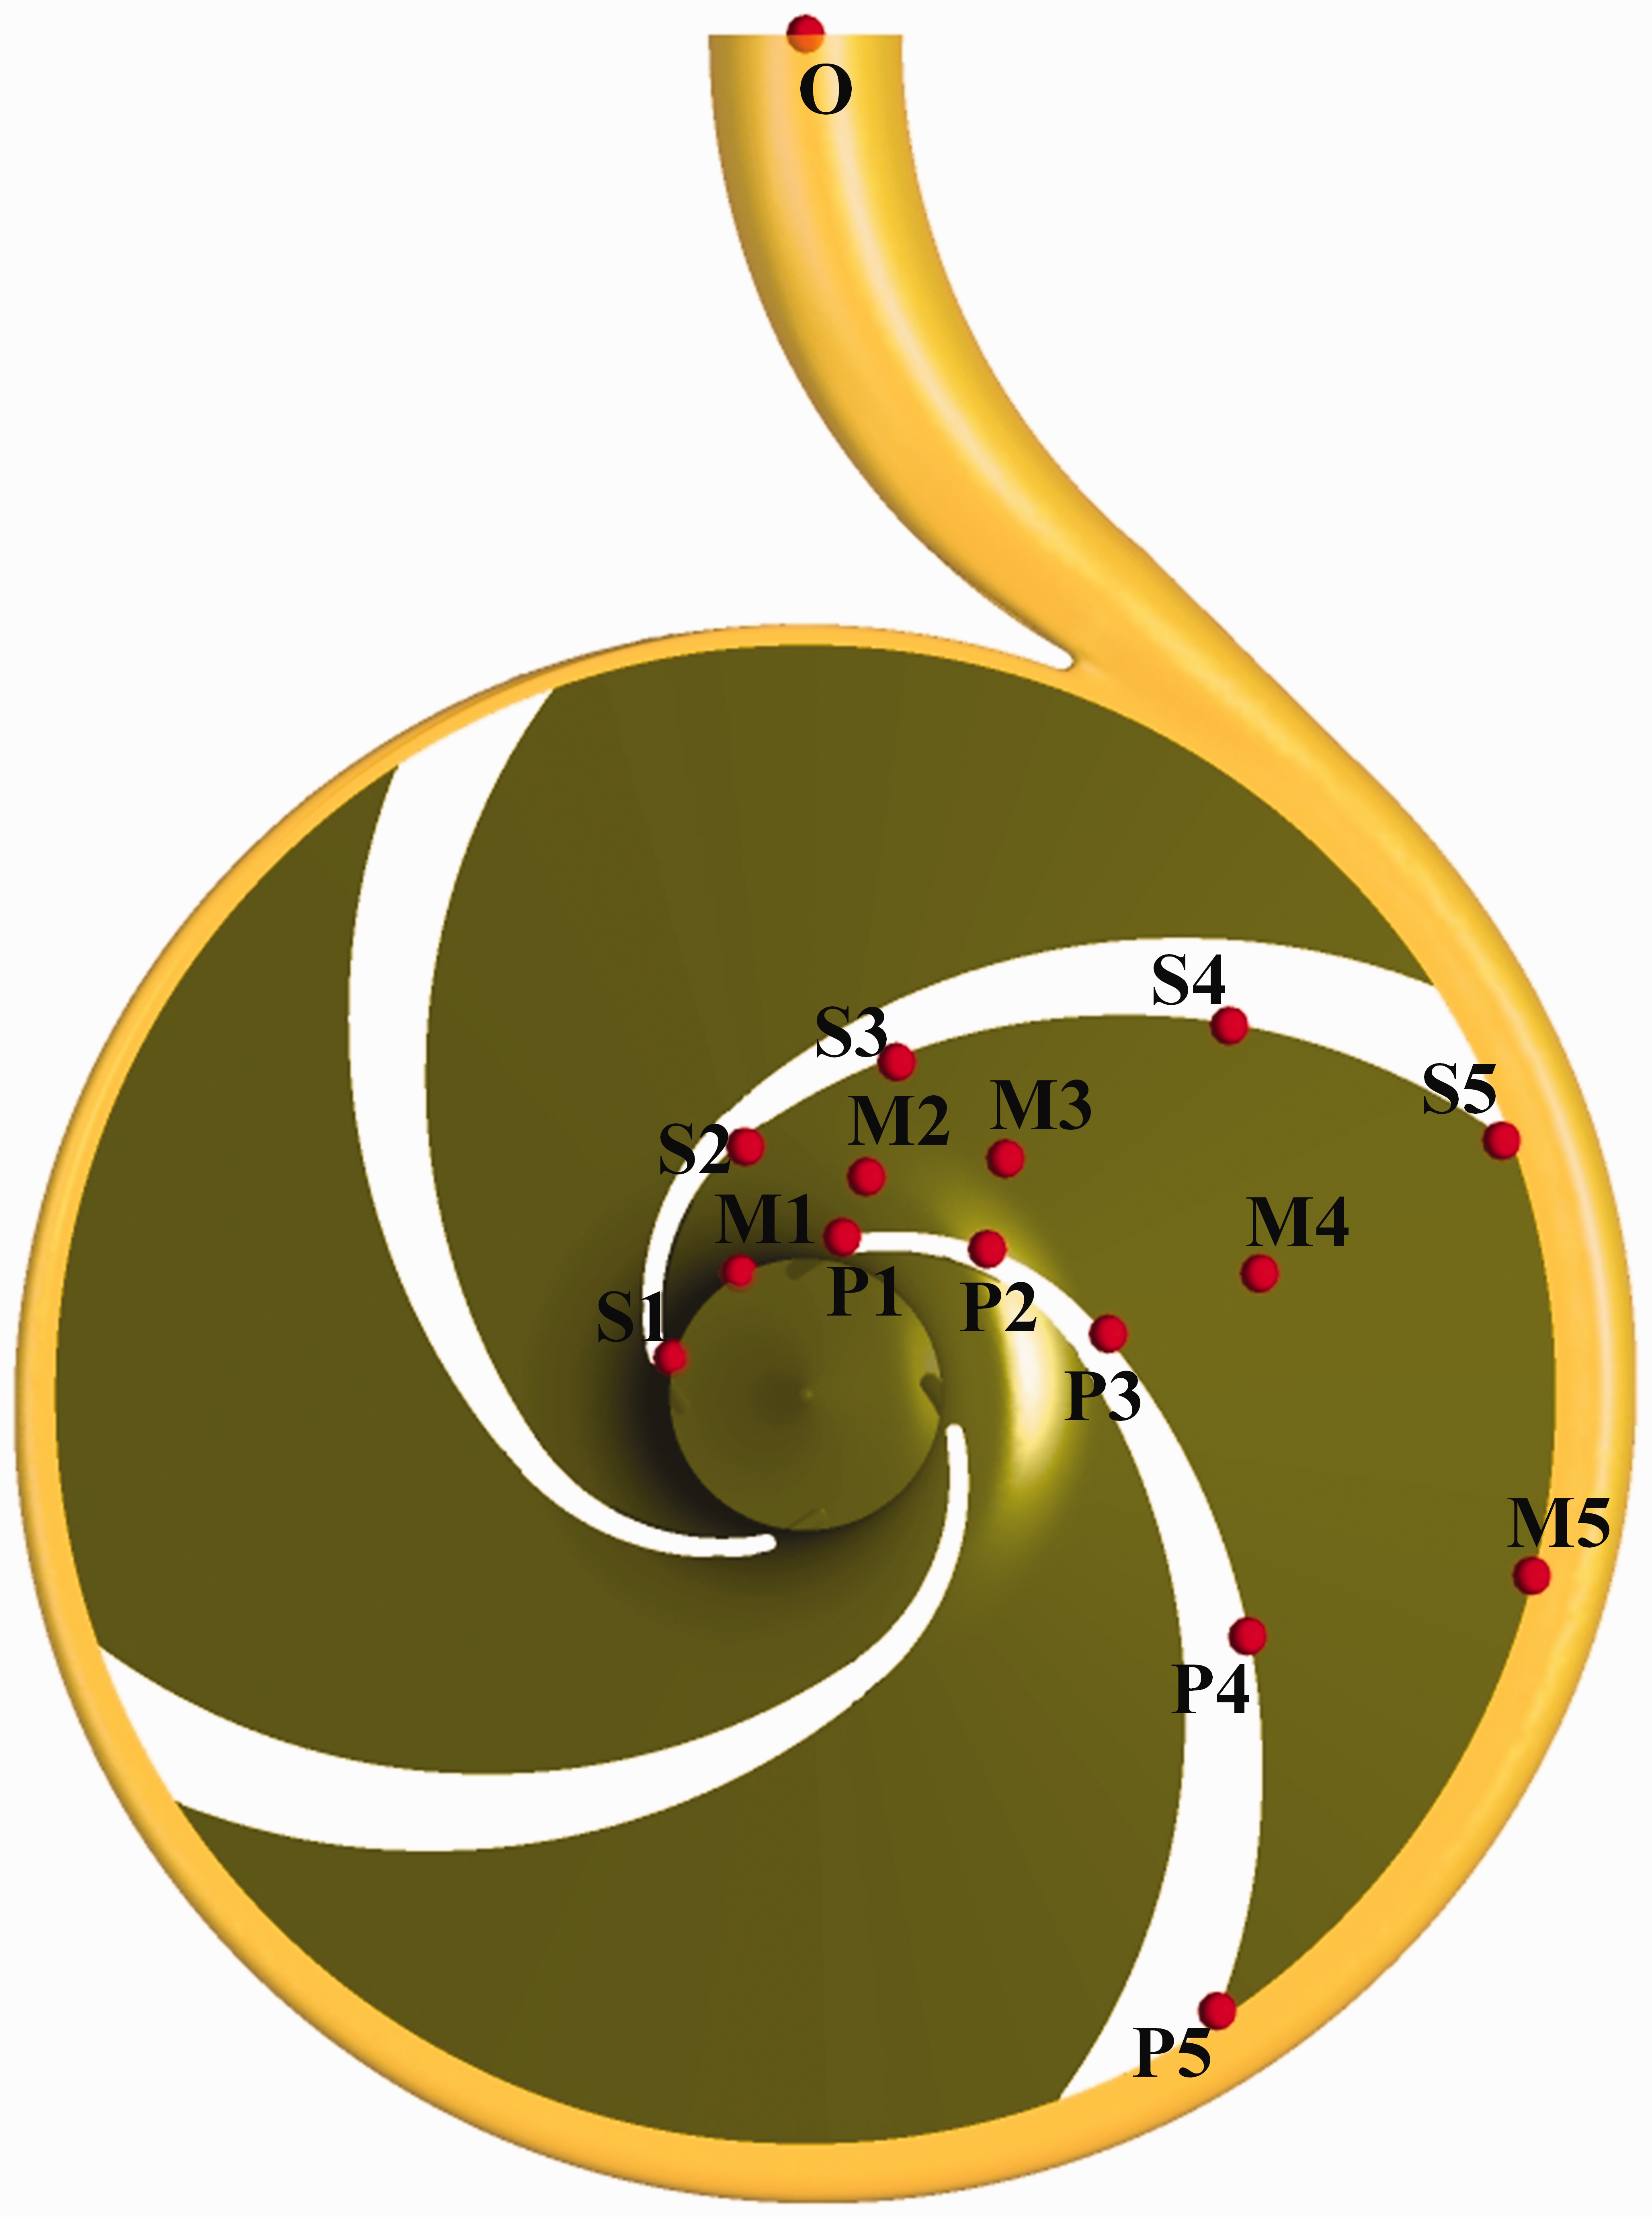
Positions of monitoring points in the pump.
Mesh sensitivity analysis: Verification and Validation
Three sets of successively refined meshes has been generated with a uniform grid refinement ratio, rG=mi+1/mi=
Head H and efficiency η versus mesh elements.
Note: H2=81.15 m and η2=49.81% are the pump head and hydraulic efficiency calculated by using Scheme 2, respectively.
The numerical uncertainty is expressed as


Take the oscillatory convergence of the head of Scheme 2 as an example, UI is defined as
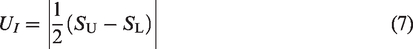
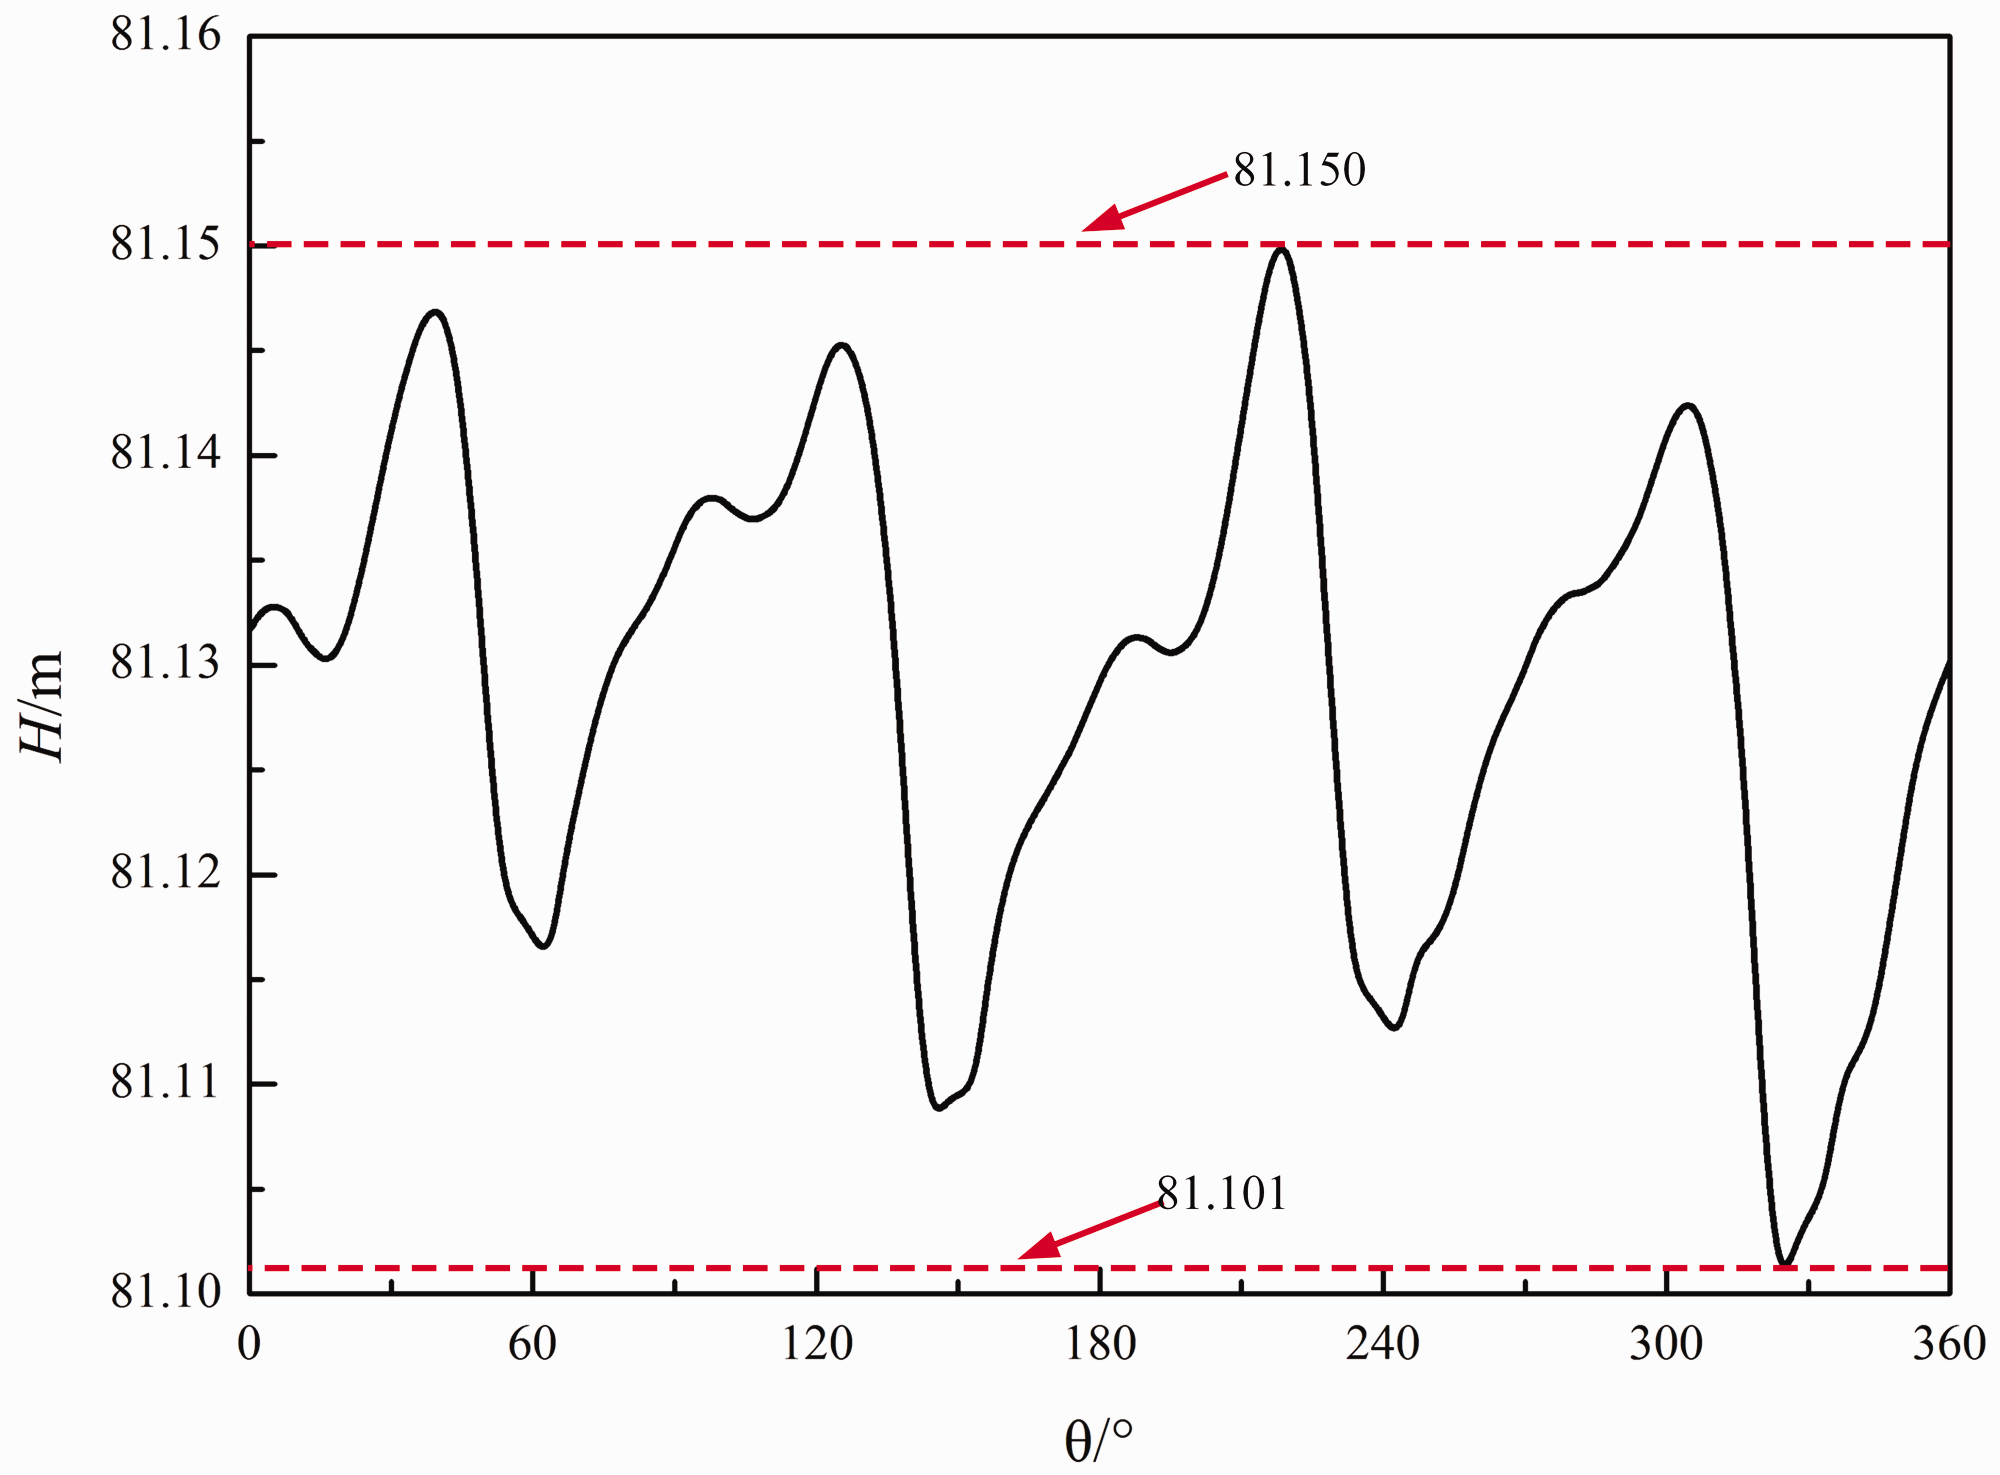
The oscillatory convergence of the head of Scheme 2 in the last period. The abscissa θ indicates the angular position of a blade, and the ordinate H expresses the instantaneous head.
Iteration uncertainties of the head and efficiency in the simulation.
From Tables 4 and 5, the iteration uncertainties are negligibly smaller than mesh-density uncertainties, and hence USN ≈ UM.
Mesh-density uncertainties of the head and efficiency in the simulation. 41
The comparison error E was evaluated by the experimental results D, and the simulated results were based on Scheme 3. The experimental uncertainty UD is assumed to be 0.81%D by summing up the system accuracies of the pressure transducer, torque meter and electromagnetic flowmeter (as shown in Table 1). The results in Table 6 indicate that the validation is successfully achieved using the level of validation uncertainty UV within 1%D. In conclusions, the simulation results are convincing by three sets of successively refined meshes. Considering the precision and the cost of calculation, Scheme 2 with 1,521,785 elements was employed in the following calculation.
The comparison error E and validation uncertainty UV.
Research on the characteristics of the transient pressure fluctuation
Comparisons between experimental data and numerical results
The available net positive suction head (NPSHa) that corresponds to a 3% drop in the head is the critical cavitation point of the pump, namely NPSH3%. The comparison of the cavitation performance and the pressure fluctuation at the outlet of the volute at NPSH3% is shown in Figure 6, in which the trend of the cavitation performance curve and the amplitude of the dominant frequency exhibit a good correspondence. As the value of NPSHa decreases from 8 m to 1 m, calculation errors are lower than 2%; besides, the difference of NPSH3% between experiment and simulation is 0.133 m (as shown in Figure 6(a)). As observed from Figure 6(b), the abscissa represents the ratio of a certain frequency to the rotation frequency, fi, of the impeller, whereas 4fi indicates the blade frequency; the ordinate indicates the pressure fluctuation coefficient, cp=p/0.5ρlu2in, where uin illustrates the inlet velocity. The calculation error at the dominant frequency is lower than 2.5%, which is regarded as a fairly good result for the pulsation pressure prediction.42,43 Meanwhile, the simulation and the experiment both capture an obvious peak in the vicinity of 1/6fi. It proves that excitation sources originate from internal perturbation, which is what the research wants to reveal. Although there is a considerable deviation in high frequency regions owing to the regardless of the environment disturbance in the simulation, it is not the research focus. According to the comparisons between experimental data and numerical results, the accuracy of the numerical method can be convincing.
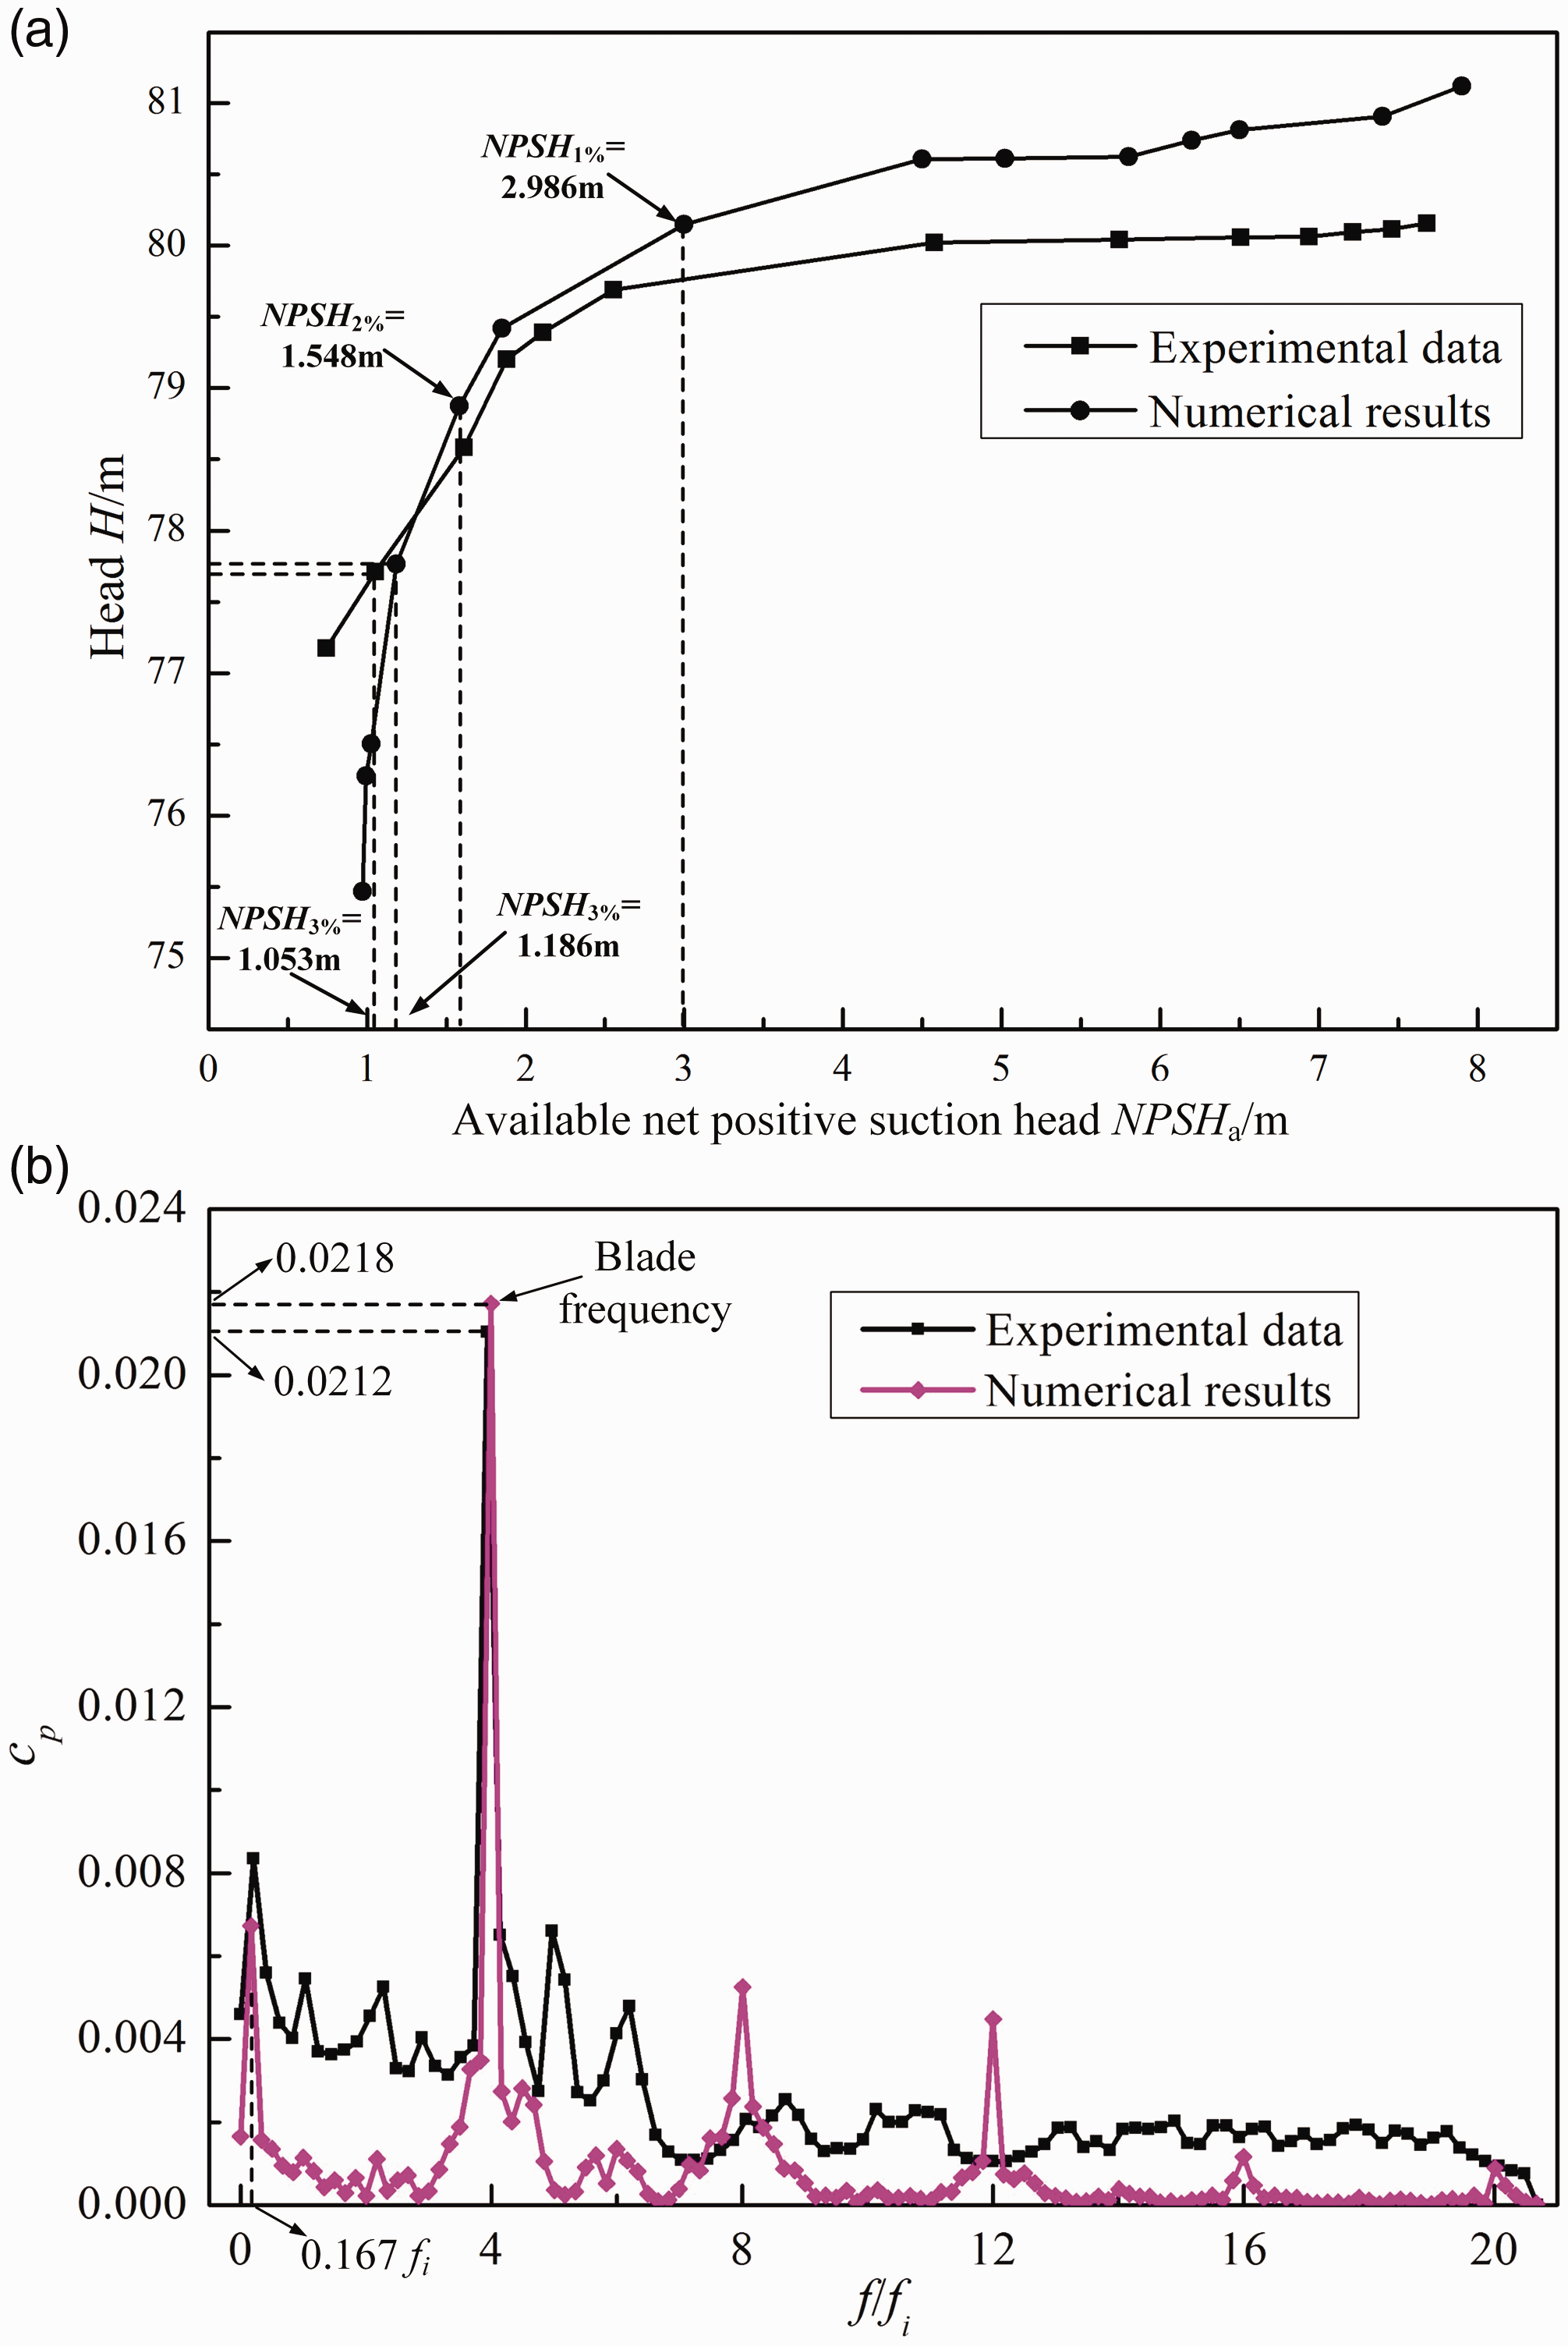
Comparisons between experimental data and numerical results: (a) cavitation performance; (b) pressure fluctuation at the outlet of the volute at NPSH3%.
Analyses on the unsteady pressure characteristics under different cavitation degrees
The drop in head can reflect the degree of cavitation development, so three points in Figure 6(a) with approximate head drop of 1%, 2% and 3%, respectively (NPSH1% = 2.986 m, NPSH2%=1.584 m and NPSH3%=1.186 m), are selected as the typical ones to describe the influence of cavitation development on pressure fluctuation. For simplicity, the frequency values were normalized by the rotation frequency, fi, which was 48.333 Hz. And the harmonic frequencies were represented as 2fi, 3fi, etc.
Figures 7 and 8 show frequency domain characteristics and maximum amplitudes of pressure fluctuation at the monitoring points under different cavitation degrees. It is obvious to find that there are some interlinked phenomena at a majority of monitoring points in diagrams below, for example, the energy of pulsation pressure is concentrated mainly in low-frequency regions, the dominant frequency is the rotation frequency fi or its harmonic frequencies, the maximum amplitudes of pressure fluctuation gradually increase from inlet to outlet and from the suction side to the pressure side, whereas maximum amplitudes gradually decrease with the evolution of cavitation. However, there are some special phenomena due to the complex internal flow field. With the development of cavitation, there are more fluctuation components appearing in the region below fi and the amplitude gradually increases at the monitoring point S2, which lies in the vicinity of the blade leading edge. As observed in Figure 7(c), when critical cavitation occurs, 1/6fi becomes the dominant frequency and the amplitude increases at S2. It makes S2 the only point on the suction surface where the amplitude increases with the decrease of NPSHa. It is no doubt that the occurrence of cavitation will reduce the supercharging capacity of the impeller, but there are two points (P4 and P5) on the pressure surface that amplitudes increase like S2 (see in Figure 8(c)). At NPSHa=1.186 m, the amplitude of pressure fluctuation at the monitoring S1 becomes 0, which means that point lies in the cavity and the pressure remains constant.
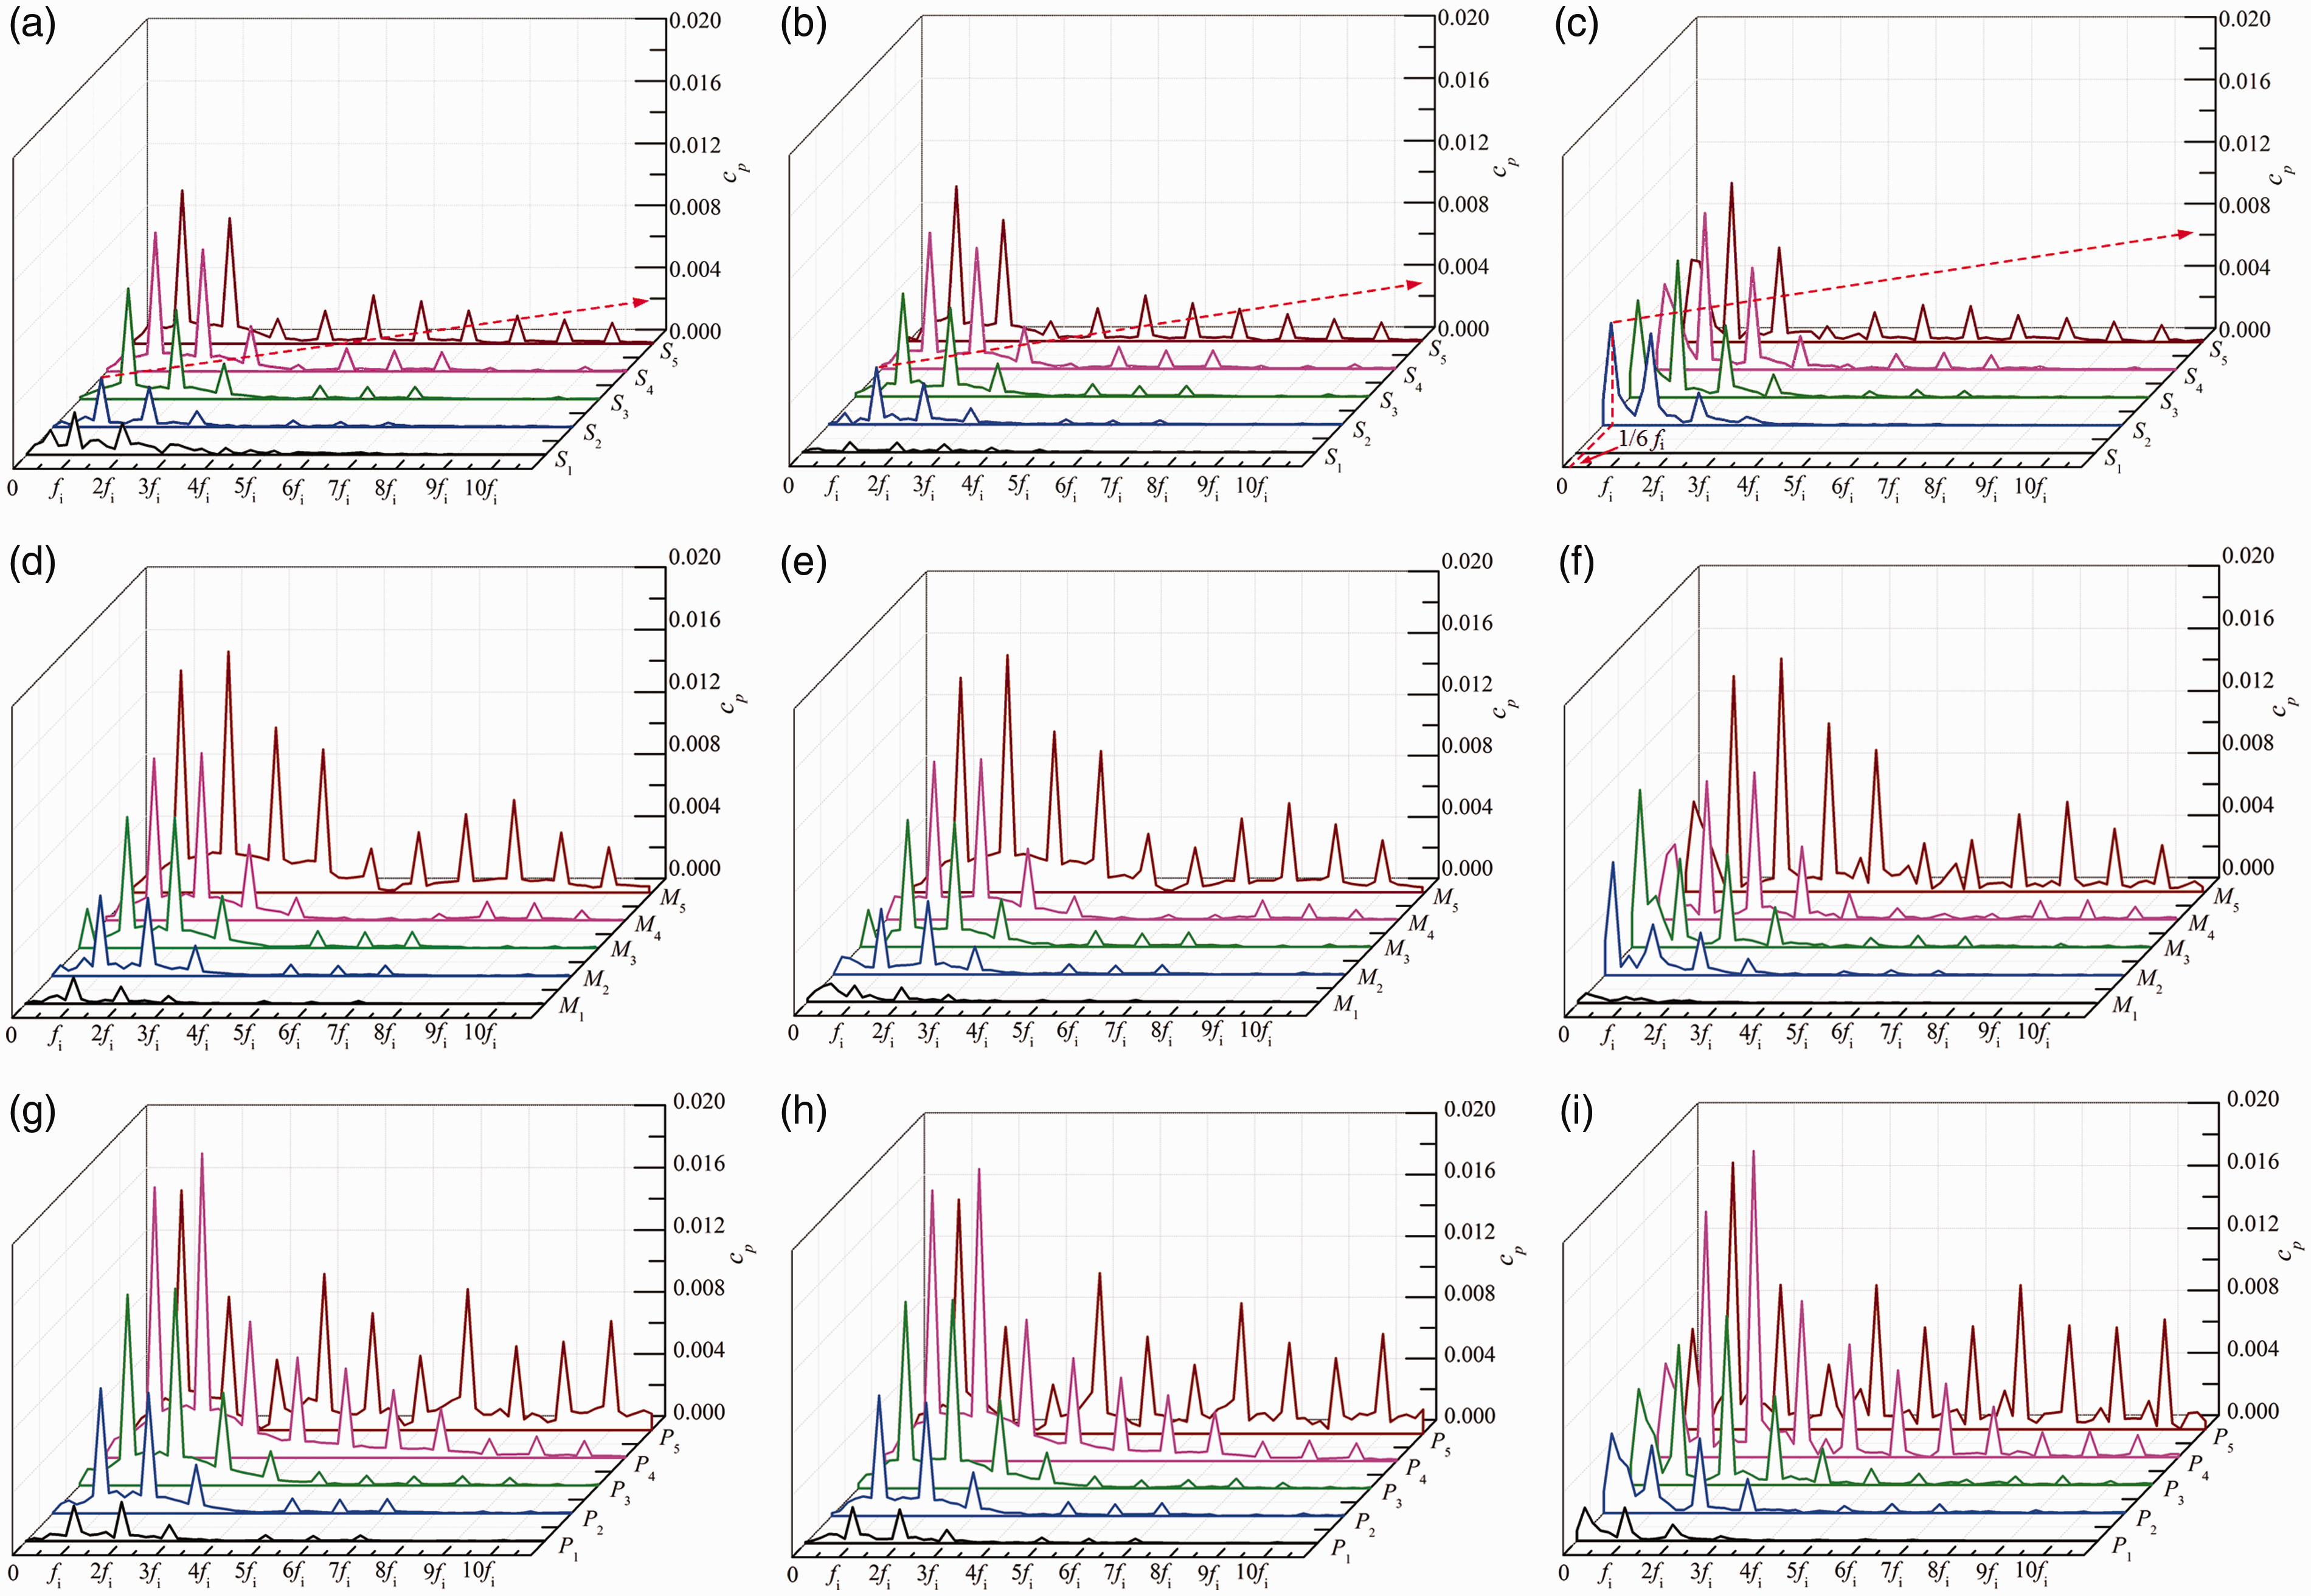
Frequency domain charts of different monitoring points under different cavitation conditions. (a) Frequency spectrogram on the suction surface under NPSHa=2.986 m. (b) Frequency spectrogram on the suction surface under NPSHa=1.548 m. (c) Frequency spectrogram on the suction surface under NPSHa=1.186 m. (d) Frequency spectrogram on the middle surface under NPSHa=2.986 m. (e) Frequency spectrogram on the middle surface under NPSHa=1.548 m. (f) Frequency spectrogram on the middle surface under NPSHa=1.186 m. (g) Frequency spectrogram on the pressure surface under NPSHa=2.986 m. (h) Frequency spectrogram on the pressure surface under NPSHa=1.548 m. (i) Frequency spectrogram on the pressure surface under NPSHa=1.186 m.
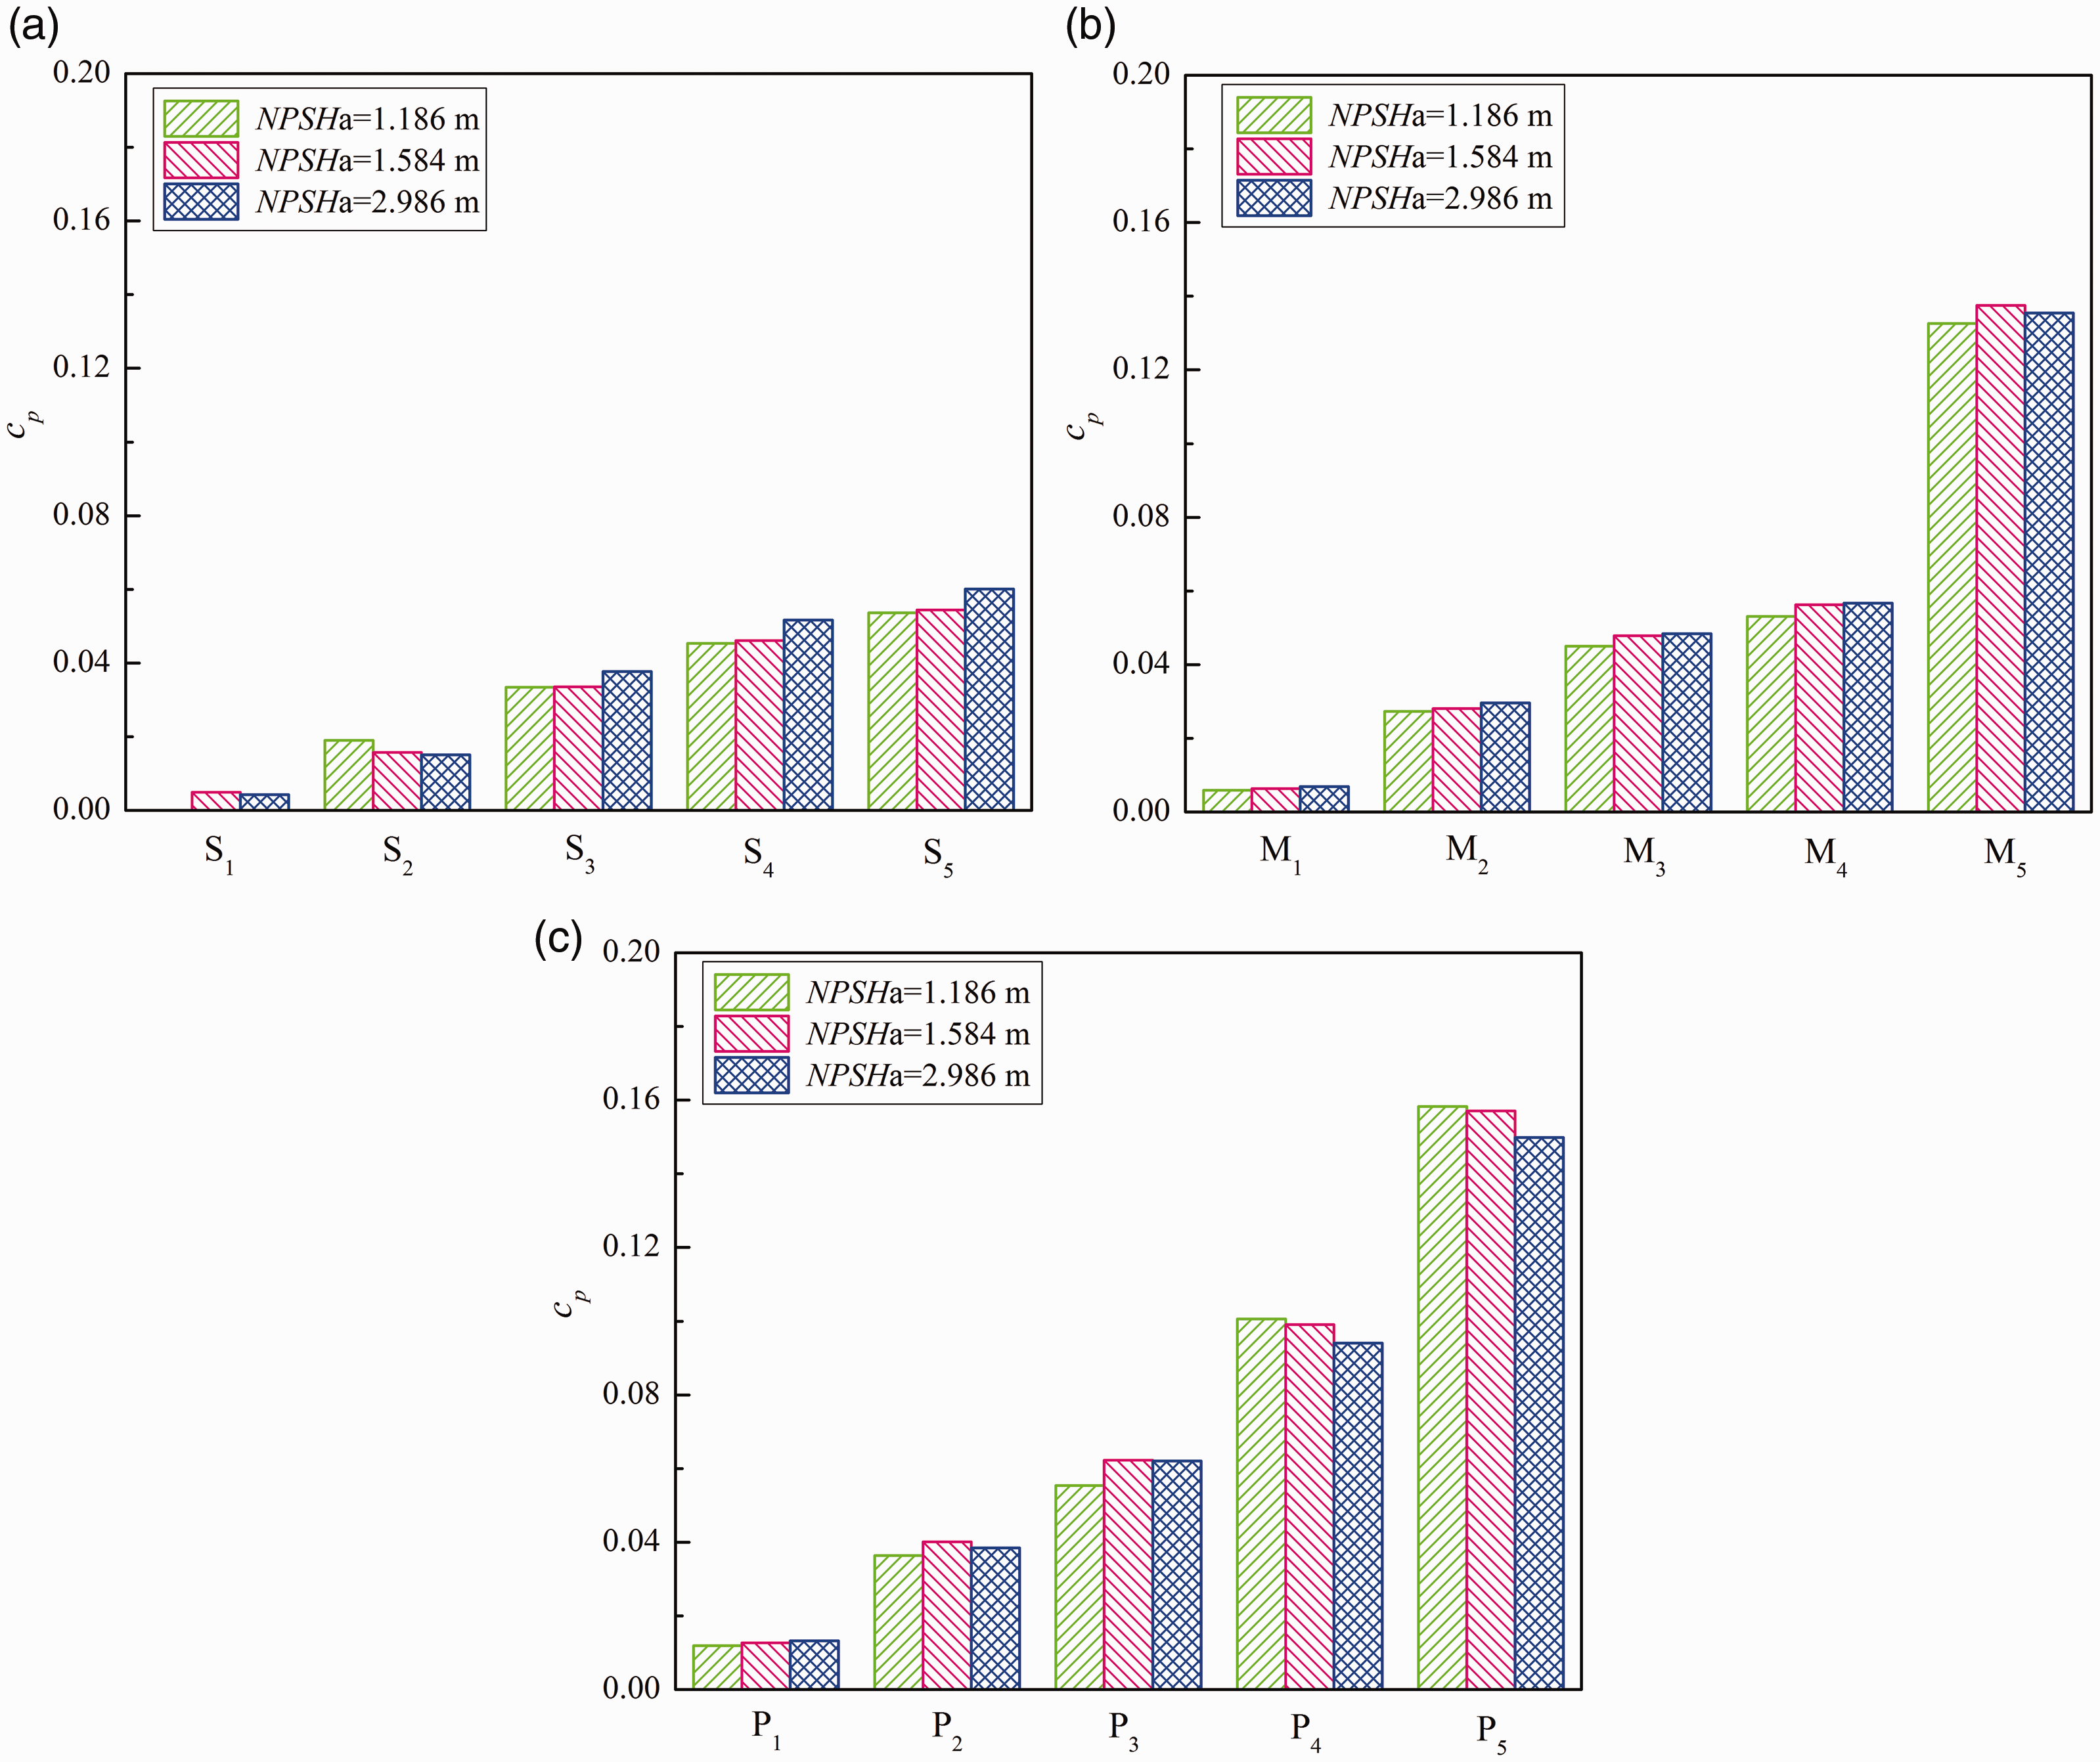
Maximum amplitudes of pressure fluctuation at different monitoring points: (a) the suction surfaces, (b) the middle surfaces and (c) the pressure surfaces.
Figure 9(a) demonstrates the distribution of the vortex near to S2 at NPSHa=1.186 m at three typical instants, where t in the figure is the beginning of the third period. In the six periods, the vortex affecting S2 undergo a quasi-periodic variation from downstream to adjacent S2 and finally moves downstream, while the quasi-periodic variation of the vortex corresponds to about 1/6fi. Validation of the vortex frequency at S2 is illustrated in Figure 9(b). It can be seen that the frequency domain characteristics of the vortex are similar to pressure fluctuation except for the difference in magnitude. When NPSHa is lower than 1.584 m, the peak of vorticity is at 1/6fi approximately and gradually increases. Thus, it is believed that the special phenomena mentioned above in the pressure spectrum are inextricably linked to the change of the vortex field. Consequently, it is appropriate to introduce the vortex transport equation to get a better understanding of mechanisms of the pressure fluctuation–vortex interaction in the ultra-low specific-speed centrifugal pump.
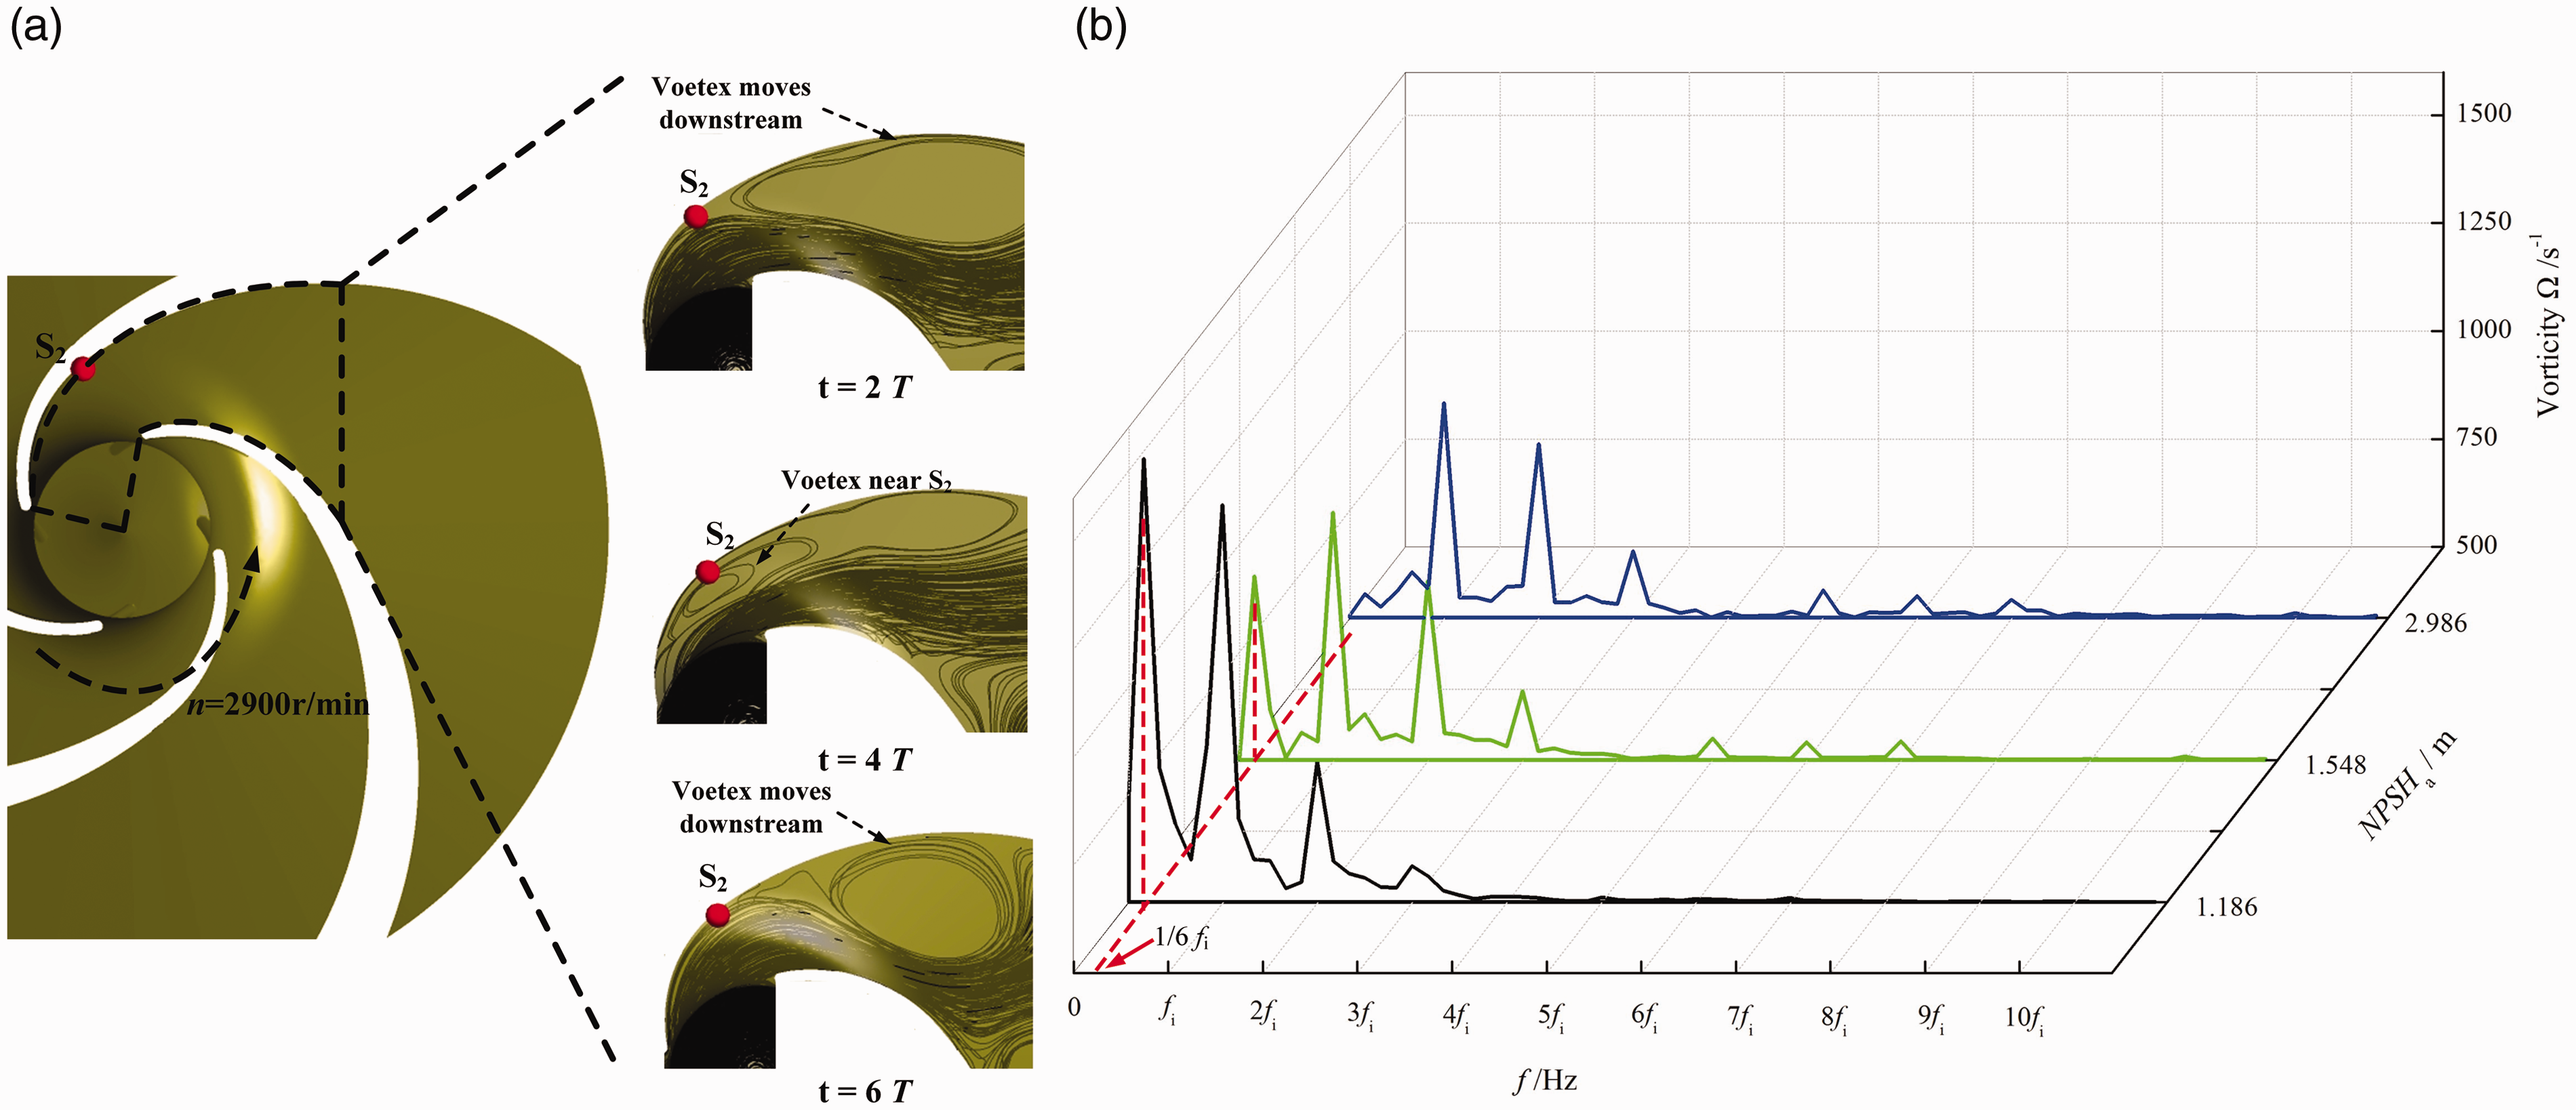
(a) Streamline in the passages of the impeller at NPSHa=1.186 m at three typical instants. (b) Monitoring of the vorticity at S2.
The relative vortex transport equation and the pressure fluctuation–vortex interaction
As for vortex transport equation in the rotational frame, considering the Coriolis force, the equation can be written as follows

Since the impeller revolves around Z axis, the results are mainly discussed in the XY plane. The relative vortex transport equation is given as

Streamlined profile is a simple method for vortex identification and the spiraling or closed streamlines are intuitional to depict the pattern of a vortex. 45 Figure 10 shows streamlines in passages of the impeller with the evolution of cavitation at the beginning of the last period, while magnitude of radial velocity vr implies the trend of vortex motion.
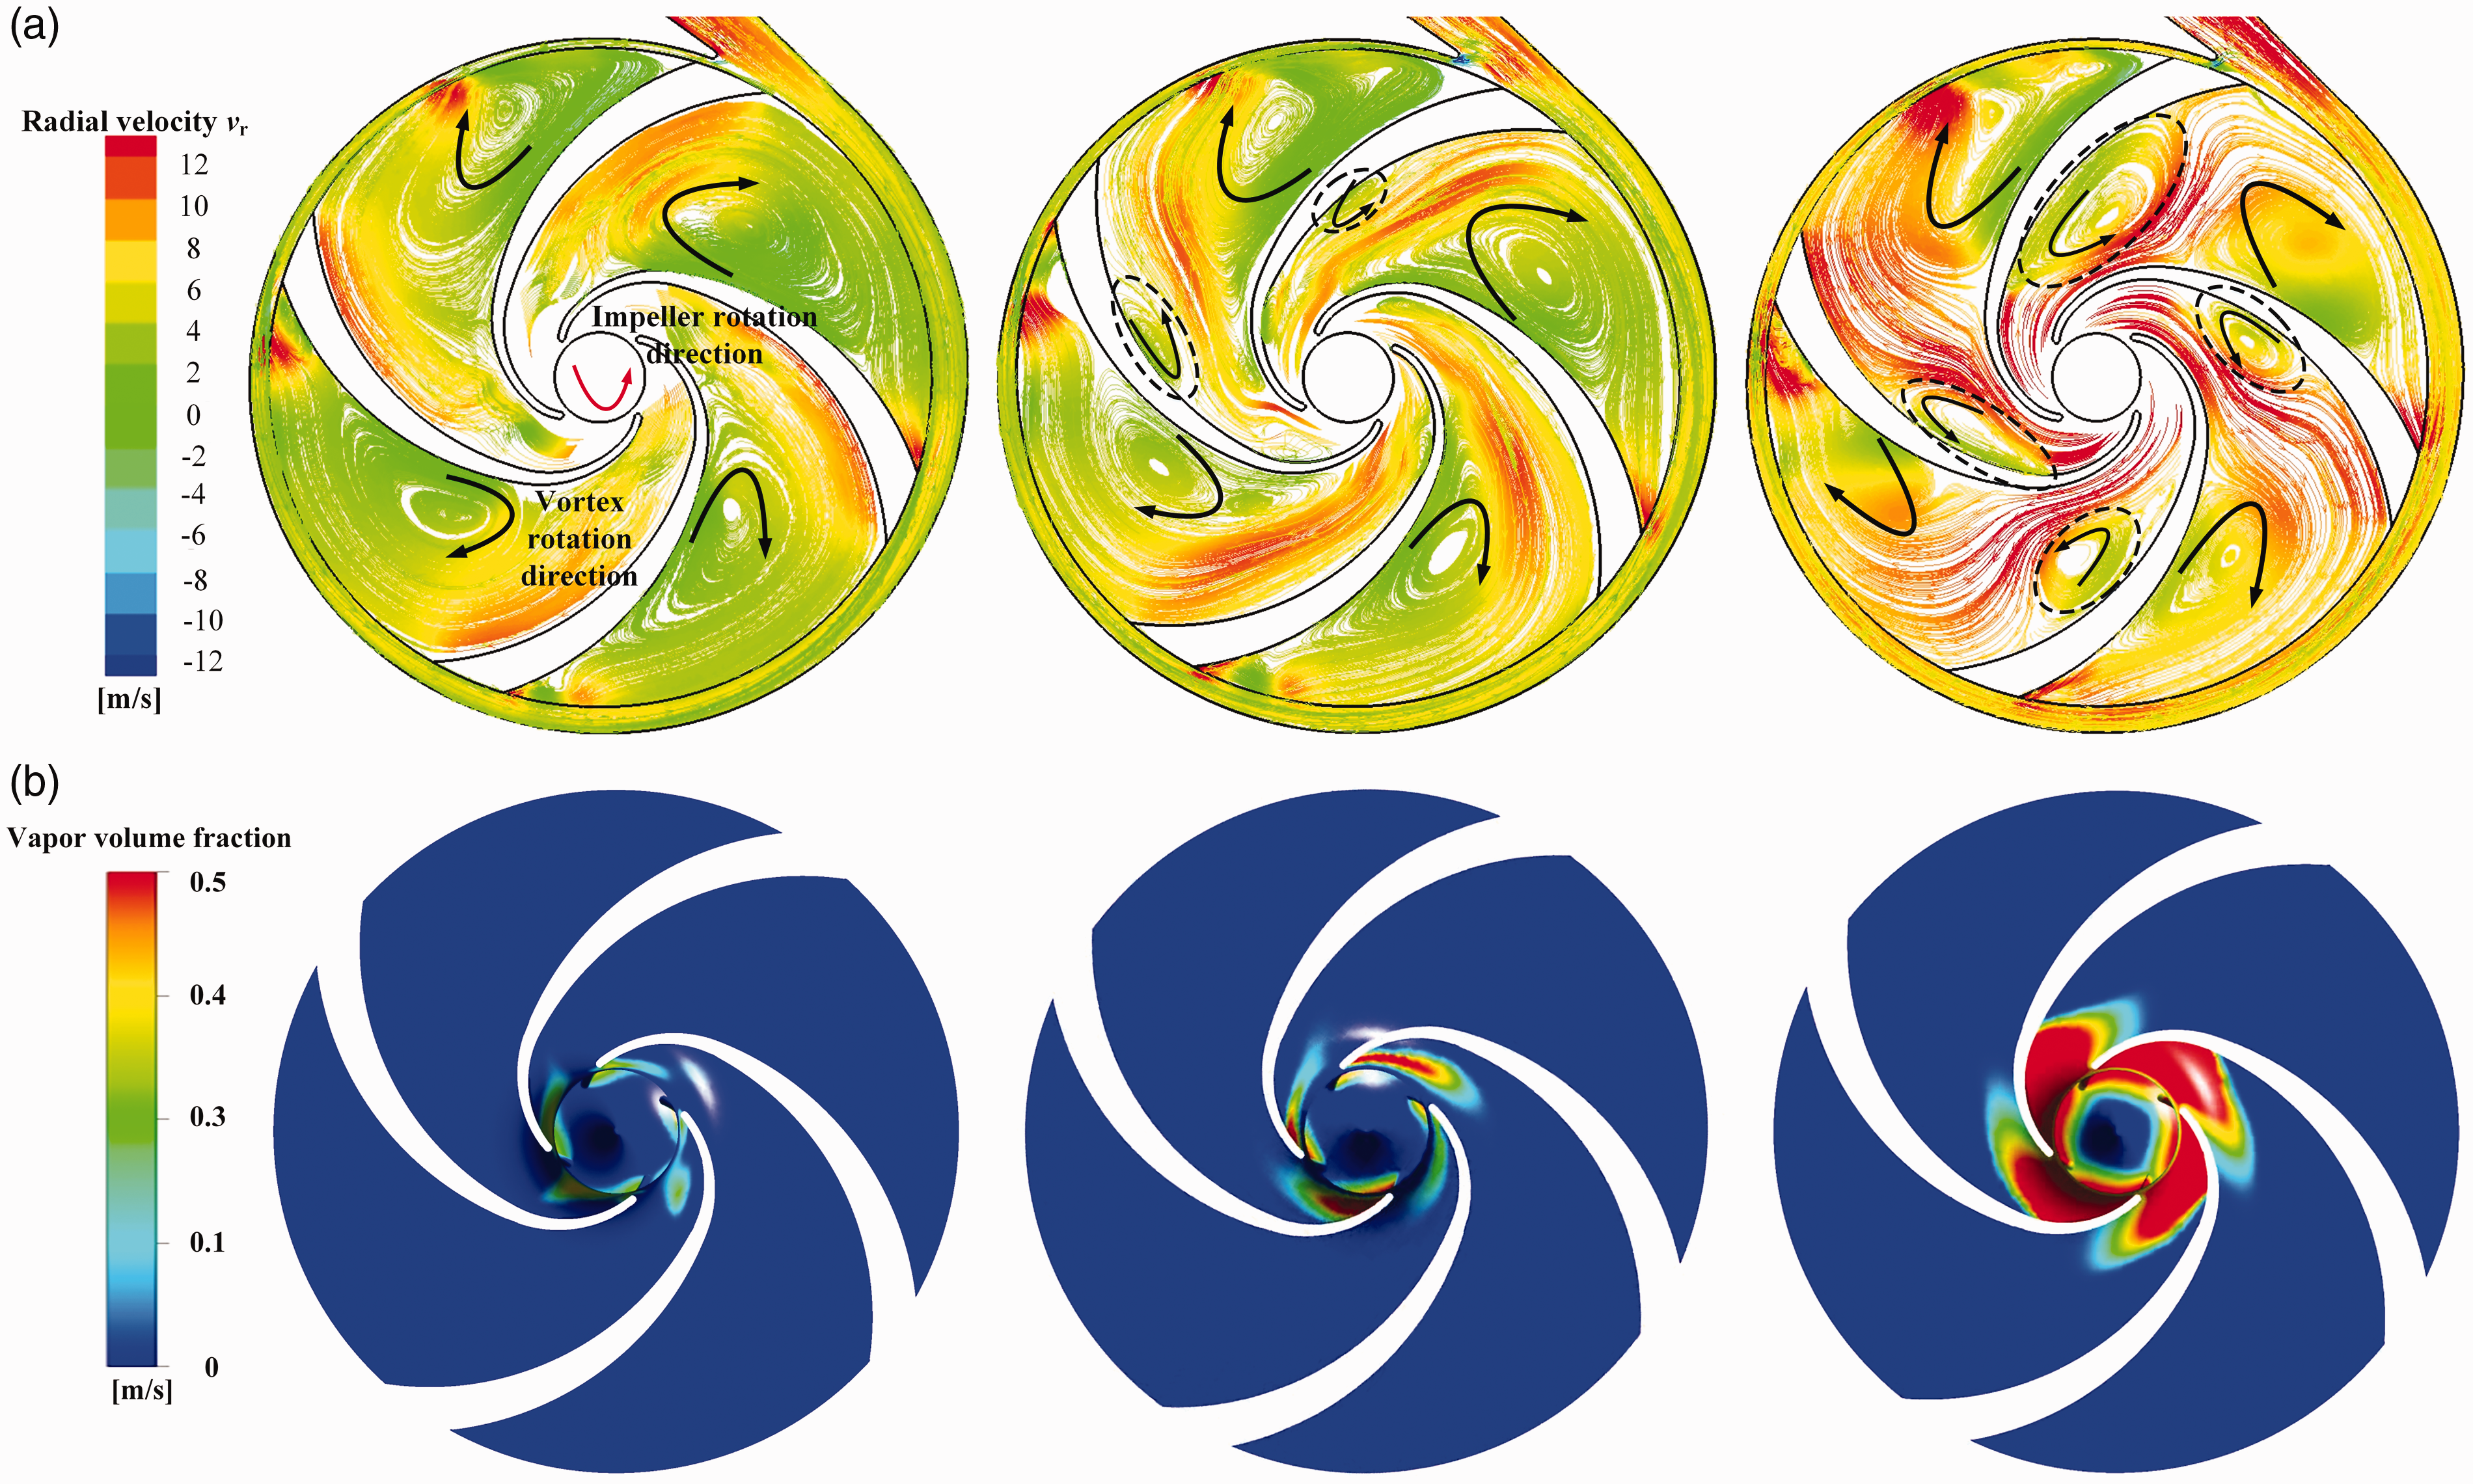
Streamlines in passages of the impeller with the evolution of cavitation at the beginning of the last period. (a) NPSHa=2.986 m, (b) NPSHa=1.548 m, (c) NPSHa=1.186 m, (d) NPSHa=2.986 m, (e) NPSHa=1.548 m and (f) NPSHa=1.186 m.
At NPSHa=2.986 m in Figure 10(a), vortices are relatively symmetrical in four channels. During this process, all vortices are generated by flow separation when the boundary layer travels far enough against an adverse pressure gradient that the speed of the boundary layer relative to the object falls almost to zero, and hence the rotation direction of them is just opposite to that of the impeller. And at NPSHa=1.548 m, there are certain smaller-scale vortices on the suction surface of the blade. Comparing the position of the separated vortices, the emerging vortices are located upstream of the flow channel. From Figure 10(e), it can be observed that the emerging vortices that have the same rotating direction as the impeller are closely associated with the cavitation, which are called cavitating vortices. When compared with the condition of non-cavitation, the radial velocity increases obviously. Then at NPSHa=1.186 m, namely the critical cavitation point, the vapor region has developed from the suction surface of the blade to the pressure surface. More and larger-scale cavitating vortices are formed at the upstream of the channels affected by the expansion of the cavitation region. From Figure 10(f), cavitating vortices makes the channels narrower and the radial velocity higher, which makes the separation vortices move downstream. Therefore, the process greatly promotes the vorticity transport in space.
Figure 11 shows the distribution for all terms with the evolution of cavitation on the RHS of equation (9). The baroclinic torque is significant for cavitating vortices generation during the evolution of cavitation because pressure gradients are not in parallel with density gradients after cavitation, whereas it is zero under non-cavitation conditions owing to the density remain constant. In Figure 11(a), when NPSHa drops to 1.186 m, S2 is located near the interface between vapor and liquid, whereas P4 and P5 lie away from the cavity region. Therefore, the baroclinic torque is an engine for the obvious growth of the pressure fluctuation amplitude at S2, yet it does not affect P4 and P5. As is shown in Figure 11(b), the effect of viscous diffusion term is neglected when compared with the other two terms. According to the fundamentals of vorticity dynamics illustrated in Wu et al., 46 vorticity diffusion flux will be weak when the Reynolds number is much greater than 1. Due to the Reynolds number exceeds 106 in this research, it is appropriate to neglect the process of viscous diffusion. Although the baroclinic torque is crucial, the main contributor to the change of fluctuation amplitude is the vortex convection. As is shown in Figure 11(c), although the value of the vortex convection at S2 is high, there is no significant change with cavitation development. In contrast, P4 and P5 have a rapid increase because of the downstream movement of the vortices (see Figure 10). Besides, the baroclinic torque and the vortex convection that mainly cause the change of the relative vorticity value both decrease or keep unchanged with the deterioration of cavitation at the remaining monitoring points, which correspond to the principle of pressure fluctuation. Based on above description and discussion, it can be concluded that the vortex transport equation can intuitionally illustrate the fluctuation amplitude variation at S2, P4/P5 other monitoring points.
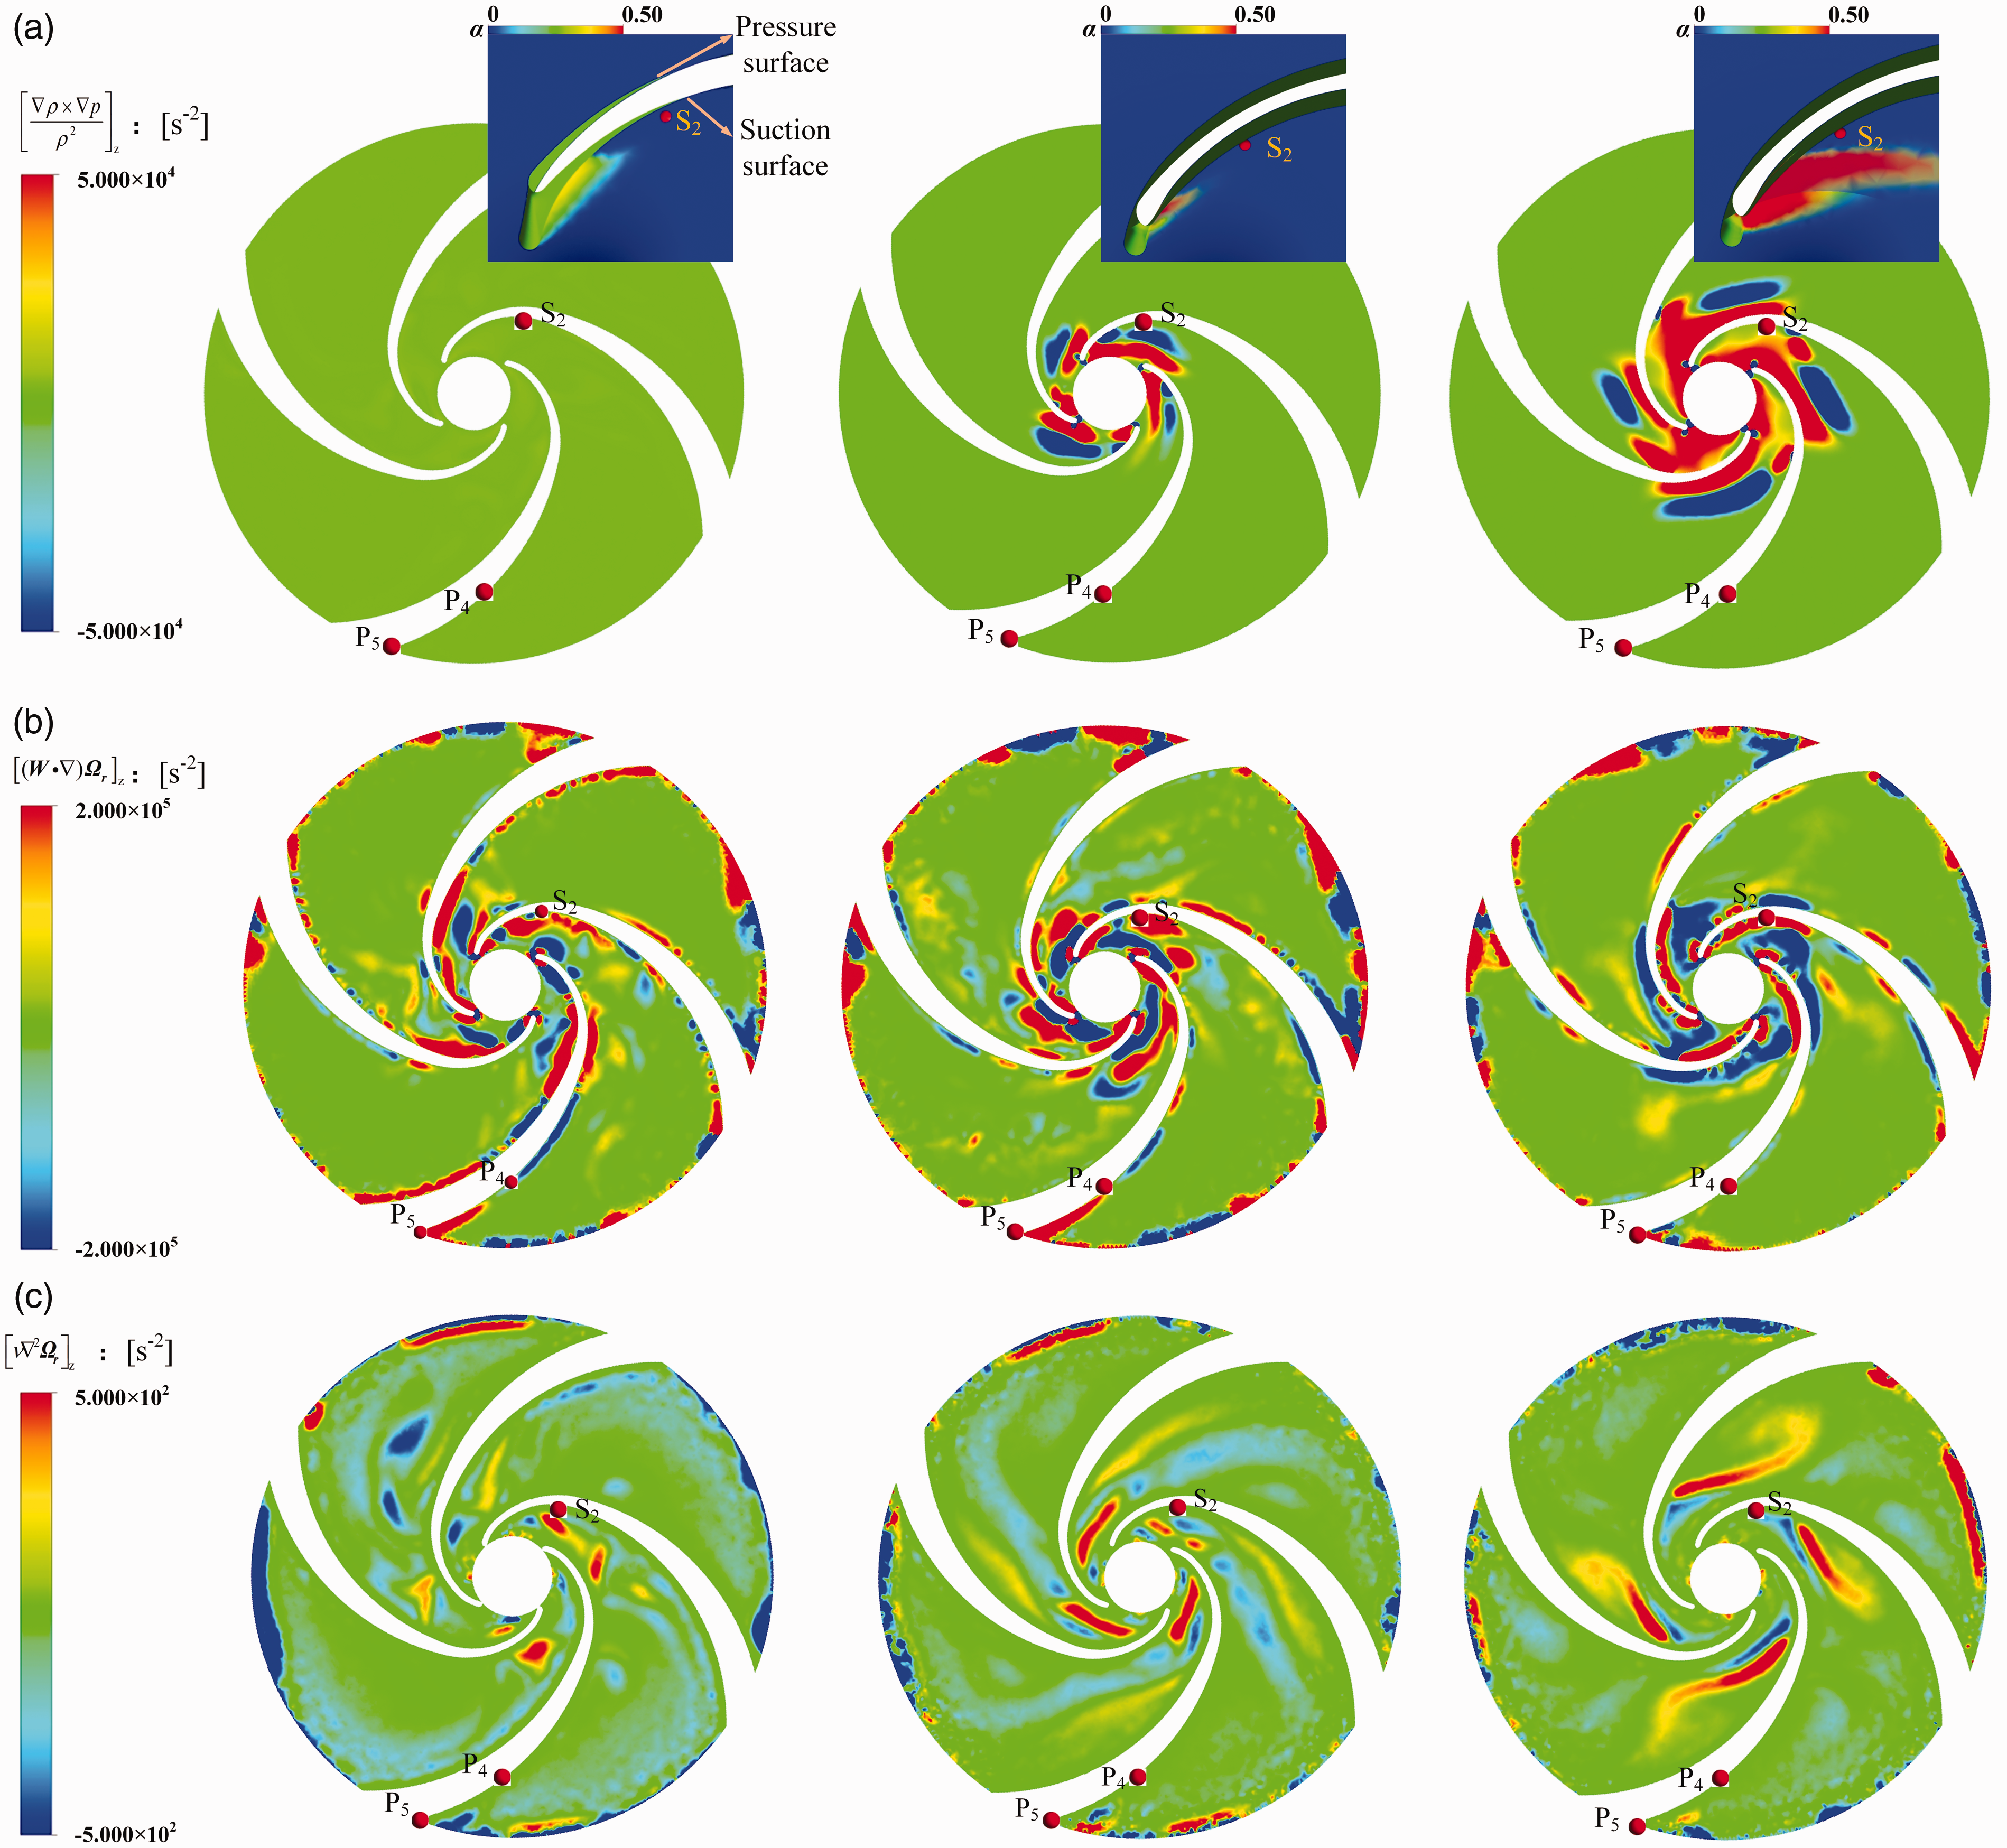
Comparison for all terms on the RHF of equation (2) (first column: NPSHa=2.986 m; second column: NPSHa=1.584 m; third column: NPSHa=1.186 m). (a) Comparison of baroclinic torque contours. (b) Comparison of viscous diffusion contours. (c) Comparison of vortex convection contours.
Meanwhile, it can be concluded that the change of pressure fluctuation amplitude at P4/P5 remains far from clear when the cavitation effect is merely concerned. Whereas the cavitation effect as well as the vortex convection/diffusion via the relative vortex transport equation can blend together and clarify the abnormal phenomena in frequency spectrum intuitionally.
It is not difficult to find that there is an inherent relation between pressure fluctuation and vortex field. Pressure fluctuation is the acoustic expression of vortex field, whereas the change of vortex field becomes the excitation source of pressure fluctuation. Since the typical characteristics of pressure fluctuation can be analyzed intuitively by the vortex transport equation, even with different pumps, the study of the pressure fluctuation–vortex interaction will enrich the research of the instability in the dynamic machinery.
Conclusions
In this paper, the unsteady flow in an ultra-low specific-speed centrifugal pump was simulated by applying the RNG k–ε turbulence model and the transport equation-based cavitation model to provide a better insight in the pressure fluctuation–vortex interaction. The following conclusions can be drawn based on the present investigation.
The uncertainty of the pump head and efficiency from the numerical simulations with three sets of successively refined mesh were verified and validated by a level of 1% of the experimental results. Then, using the validated numerical framework, the calculation of the cavitation performance and pressure fluctuation at the outlet of the volute at NPSH3% agrees reasonably well with the experimental results.
Vortex development induces flow unsteadiness, which is manifested in some transient phenomena that happen in pressure spectrum. The phenomena are believed to have inextricable links with the vorticity field, including abnormal increasing amplitudes at the monitoring points S2 on the suction surface and P4/P5 on the pressure surface in the case of lower pressurization capacity of impeller after cavitation.
By the contribution of baroclinic torque, viscous diffusion and vortex convection terms, further analyses based on the relative vortex transport equation illustrate that vorticity diffusion is weak when the Reynolds number is much greater than 1, which is neglected when compared with the other two terms. Pressure fluctuation amplitude enlarges at S2 due to the baroclinic torque in cavitation regions, which makes S2 the only point on the suction surface where the amplitude increases with the development of cavitation, whereas the abnormal increase of pressure fluctuation after cavitation at P4 and P5 results from the vortex convection during vortices moving downstream with the decrease of NPSHa.
When it concerns merely the cavitation effect, the abnormal increasing of pressure fluctuation amplitude at P4/P5 cannot be explained reasonably. However, through the relative vortex transport equation, the cavitation effect as well as the vortex convection/diffusion can blend together and clarify the abnormal phenomena in frequency spectrum intuitionally. Briefly, it can be said that pressure fluctuation is the acoustic expression of vortex field, whereas the change of vortex field becomes the excitation source of pressure fluctuation.
Finally, since the typical characteristics of pressure fluctuation can be analyzed intuitively by the relative vortex transport equation, the study of the pressure fluctuation–vortex interaction for the first time is supposed to pave the way for further research of the instability in the ultra-low specific-speed centrifugal pump.
Footnotes
Declaration of conflicting interests
The author(s) declared no potential conflicts of interest with respect to the research, authorship, and/or publication of this article.
Funding
The author(s) disclosed receipt of the following financial support for the research, authorship, and/ or publication of this article: This work was supported by the National Natural Science Foundation of China (Grant Nos. 51209217 and 51876220).