
Abstract
Underwater reverberation is a main limitation of the sonar performance and thereby the reverberation level estimation becomes crucial. In this study, based on the Lambert law and ray theory, a model for predicting 3D bistatic reverberation performance by interface scattering at linear sound speed profile is established and then verified through the underwater explosion experiments. The Influences of source and receiver positions, and relative sound speed gradient on reverberation performance are further investigated. The results indicate that: (1) the proposed model can predict the short-range mean reverberation level effectively, with the deviation 2–4 dB and describe the whole reverberation level distribution in some details; (2) at the early reverberation phase, the interference effects between the interface scattering sounds are considerable and a dominating interface exists; the counterbalance between the losses by scattering, spreading and medium absorption results in the local high-intensity zones close to corresponding interfaces, respectively; (3) as the sound source moves towards some interface, associated local high-intensity zone gradually expands, while the other one shrinks; if the sound speed approaches are constant, an extra local high-intensity zone will appear between the previous two but with a lower magnitude.
Keywords
Introduction
Compared to the monostatic sonar, the bistatic type has demonstrated pronounced advantages on the detection range, invisibility, configuration and anti-jamming capability and thereby been more widely applied from the last century. 1 However, the sonar operation range is largely limited by various ambient disturbances, like the ocean and ship noises and reverberation effects. 2 Many evidences have told that underwater reverberation is dominating to decrease the echo-signal-to-noise ratio, especially for those small targets with relatively low-reflection properties. Hence, the effective reverberation level (RL) estimation and higher quality sound source design are required in order to improve the bistatic sonar performance.
Interface scattering and reverberation
Interface scattering plays as a main role for the reverberation generation and associated modeling has been extensively carried out. By combining the E/B model 3 and Lambert law, Ellis and Crowe 4 took the lead to propose a 3D seabed scattering model and validated it experimentally. Then it was improved by Bourgeois and Caruthers 5 as the bistatic scattering intensity model (BISSM) where the scattering angle influence was included. After a few years, Caruthers and Novarini 6 further modified the BISSM through employing a factor which reflected the coherency loss induced by the seabed roughness. Early developed models on the sea surface scattering have also been improved via considering influences of the wind speed, roughness, bubble layer and so on.7,8 Those experiment-corrected interface scattering relations supply significant pavements to subsequent modeling on underwater reverberation.
Many bistatic reverberation models are formulated under the empirical scattering function and it is widely pointed out that the ray, ray-mode and normal mode theories are mainly applicable to the short (0.1–1 km), intermediate (1–10 km) and long-distance (10–100 km) propagation cases, respectively.9–11 Under the intermediate-distance propagation condition in the shallow ocean, Zhang et al. 12 proposed multiple reverberation models by combining the generalized phase-integral method (WKBZ) and ray-mode theory, and studied the influences of different environmental factors. In Jackson’s work, 13 the influences of the frequency and interface characteristics were further taken into account in the bistatic reverberation modeling. Harrison14,15 and Hui et al. 16 focused on the short-distance propagation situation and established associated prediction models based on the ray theory and Lambert scattering law. How the base-array depth, baseline length and pulse width affected the bistatic reverberation intensity was investigated as well. Through employing linear approximation on the sound channel and normal-mode theory, Gao et al. 17 established a reverberation model which could take the irregularity of the seabed and investigated the influences of the seabed slope. Those models frequently consider no depth difference between the sound source and receiver, constant sound speed and single-interface scattering. Hence, their effectiveness may be largely limited under more general conditions.
Underwater explosion (sounds)
Underwater explosion is well known as a sort of powerful source, which can generate high-pressure shock waves and pulsing bubbles, accompanied by high temperature as well. Early works on underwater explosion carried out in England, Canada and the United States have been thoroughly surveyed by Cole, 18 like the pressure empirical formulas of the shock wave and bubble pulsation and followed by a few specific modifications to enable more accurate estimation. 19 Benefits from fast development of the computers and various numerical techniques, like the boundary element method (BEM), 20 doubly asymptotic approximation (DAA), 21 spectral element method (SEM) 22 and smoothed particle hydrodynamics (SPH), 23 recent studies on underwater explosion have been promoted to a wider space. For instance, free pulsation of the bubbles, 24 reflection and transmission of the shock waves near boundaries, 25 interaction between the bubble and boundaries 26 and damage of the shock waves and bubbles towards marine structures. 27 Those investigations demonstrate considerable potentials of the underwater explosion in many applications.
A series of advantages of the explosion-induced sounds have been noticed early, like the non-directionality, high intensity and broad frequency band, implying the significant potentials of underwater explosion for application as the powerful sound source. 28 Vadov29,30 implemented large numbers of experimental investigations on reverberation characteristics of the single-source explosion sounds in the super far field (80–120 km) under various depths. Sheng et al. 31 and Li et al. 32 studied the reverberation phenomena during the sequential explosion and pyrotechnic combustion, respectively. Nevertheless, the current exploration on reverberation performance of the underwater explosion sounds is still limited.
This contribution aims at developing a more general bistatic reverberation model where the inclined baseline, variable sound speed profile and interface scattering interference are all considered (see ‘Bistatic reverberation modeling’ section). Multiple underwater explosion experiments under different configurations are implemented to confirm the effectiveness and limitations of the proposed model (see ‘Experiments verification’ section). Furthermore, influences of the interference effects, source-receiver relative position and sound speed gradient are investigated in the ‘Discussion’ section. Significant remarks on this work are given in the ‘Conclusions’ section.
Bistatic reverberation modeling
Assumptions
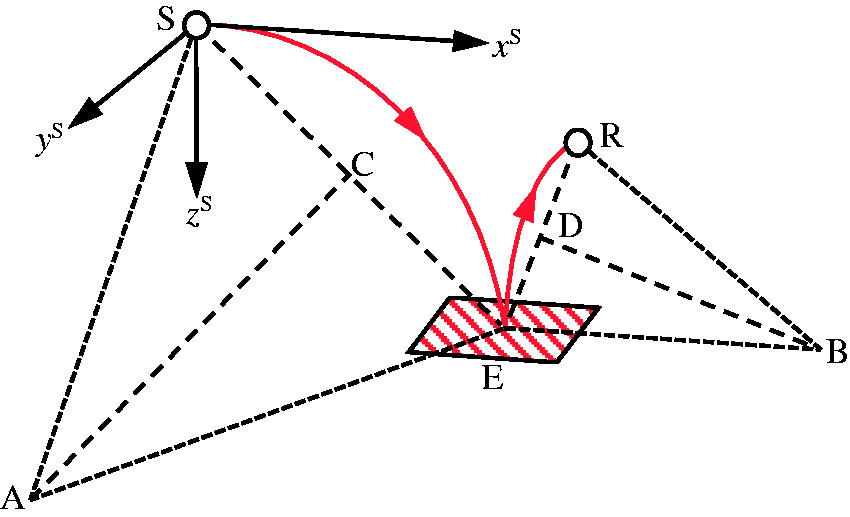
If the sound propagation distance is far longer than the baseline, the source and receiver can be regarded as approximately overlapped and thereby a 2D simplification will be applicable. More generally, like in the shallow ocean, the 3D reverberation has to be considered anyway, as shown in Figure 1. One can see that the scattering sounds by the seabed or surface have multiple paths from the source of the receiver, with the same arrival time. Since the sound pulse has a certain width, associated scattering bands appear. Besides, it must be noticed that the sound speed usually varies along the depth and thereby the sound ray may not always be approximated as a line form, especially in the case with large depth span.
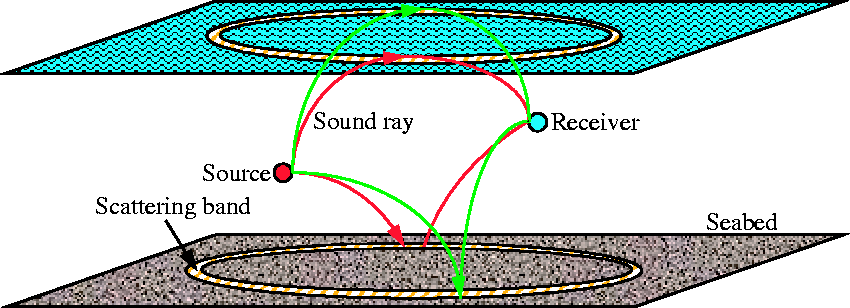
The generalized 3D bistatic reverberation process induced by the interface scattering. Note: A negative sound speed gradient is assumed.
The practical ocean is extremely complicated so for simplification, a series modeling hypotheses are listed and will be examined later.
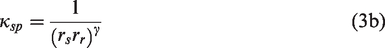
Each scattering interface (seabed or surface) is a uniform rough plane with the scattering coefficient obeying the Lambert law.
2
Those Intensity losses besides the medium absorption, spreading and interface scattering and the indirectly induced scattering sound are neglected. The seawater is homogeneous with the constant sound absorption coefficient.
A basic 3D reverberation model
According to Figure 1, each scattering band domain


Making use of the assumptions (1) to (3) yields the contribution by an infinitesimal scattering element on the total received reverberation intensity as


By integrating equation (2) on the scattering band determined by equation (1), the received reverberation intensity contributed by a single interface can be generally expressed as
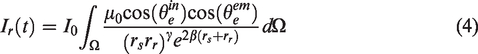
Transparently, two main issues exist to complete the integral above, determinations of the scattering band domain and associated sound tracks. They are dominated by the positions of the sound source and receiver and sound speed profile. In addition, it should be remarked that both seabed and surface can generate scattering bands and need consideration together.
In the following discussion, the short-distance propagation is always assumed which enables the ray theory.
2
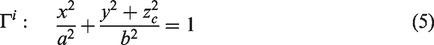
We start from the simplest case where the source and receiver are configured at the same depth level and the sound speed is constant. Therefore, the sound ray is regarded as a line form and it implies that all spacial points with the same total arrival time locate on an ellipsoidal surface, as shown in Figure 2(a). Furthermore, equation (1) actually reflects the intersections by inner and outer ellipsoids and interface. They can be immediately expressed in an explicit way, reading

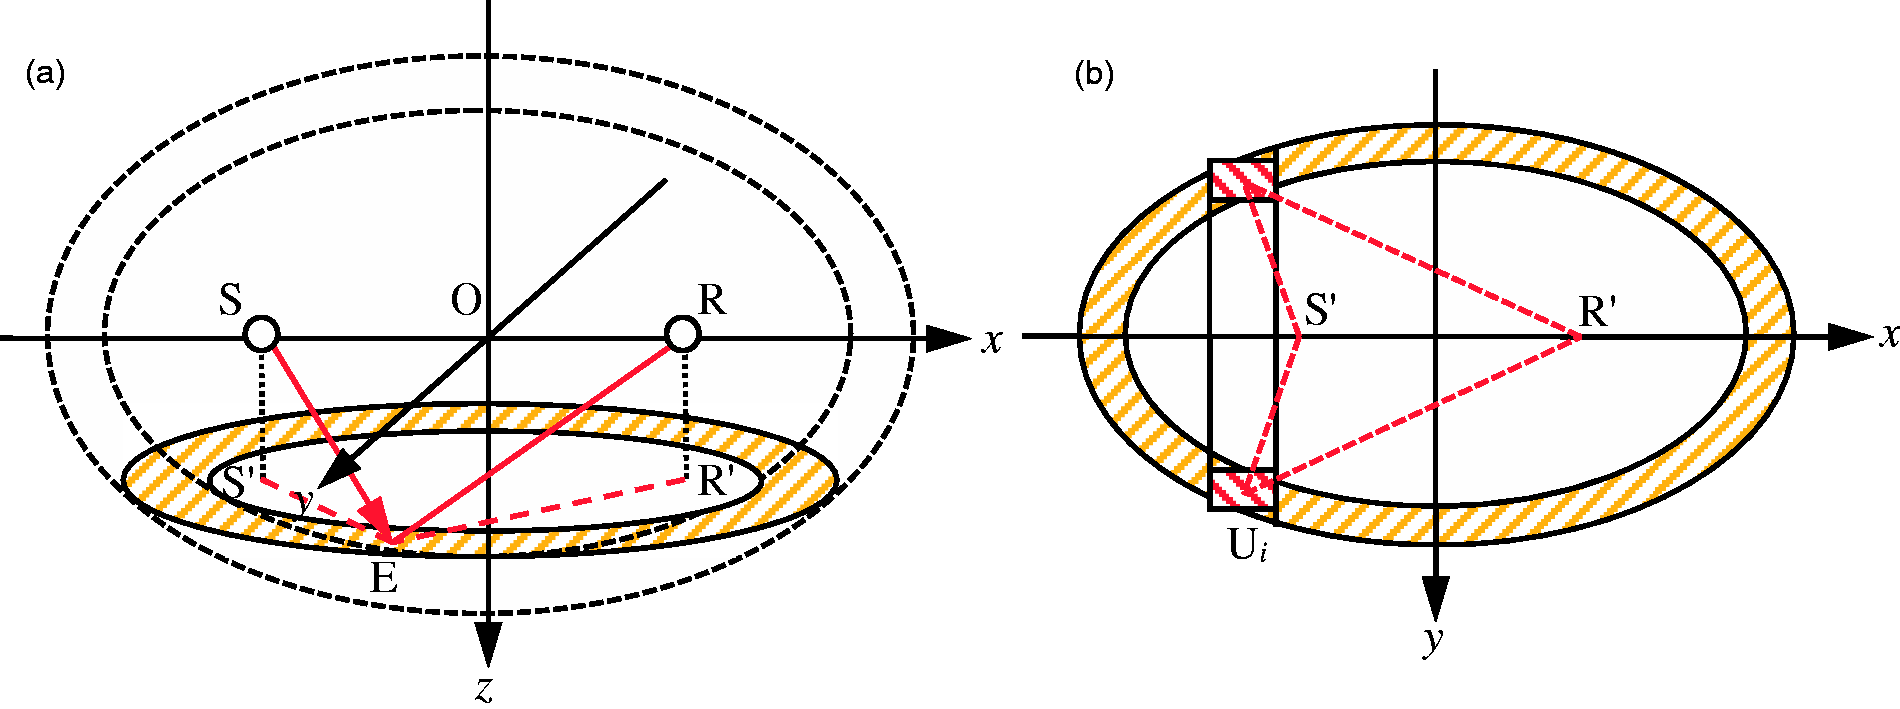
(a) Scattering band on a single interface in the basic model; and (b) discrete scattering elements along the semi-major axial direction.
Here,
In order to calculate the whole reverberation intensity given by equation (4), the half scattering band is discretized and each scattering element
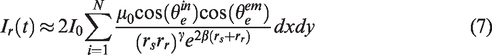


Here dx (depends on the discretization) and dy denote the approximate sizes of the scattering element. Through equation (7), the received reverberation intensity in this basic model can be estimated in a forward way.
Modification under the inclined baseline
The previously simple model can be upgraded by considering an inclined baseline, as shown in Figure 3. Clearly, both inner and outer ellipsoids are now rotated by an angle,

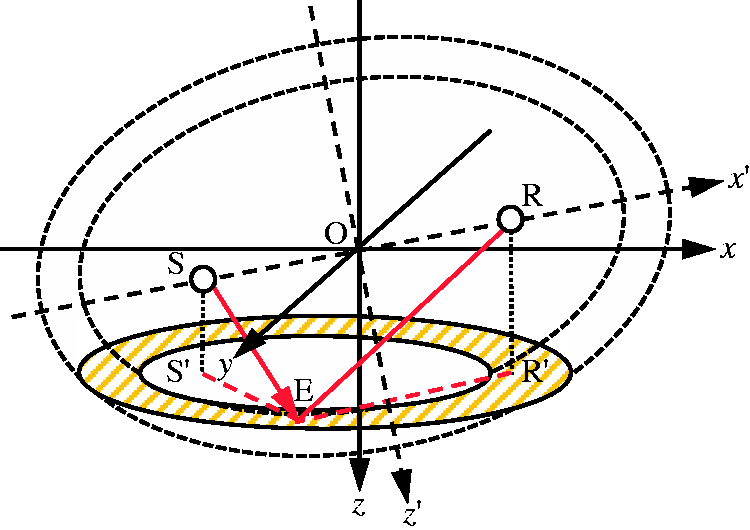
The scattering band on a single interface in the case of an inclined baseline.
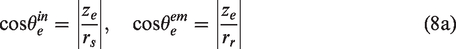
With the similar discretization method to that in the basic model, equation (7) is still applicable here, but the scattering angles given in equation (8) need adjustments, reading

Using equation (7), the influence of the baseline slope with respect to the interface on the received reverberation intensity can be investigated.
Modification under the constant sound speed gradient
In this part, a variable sound speed profile is further taken into account so that the sound track may bend during the propagation. Although the practical sound speed profile is quite complicated but always approximable by a few linear profile intervals. For convenience, we temporarily confine the discussion under a single-gradient sound speed profile, without losing the generality significantly.
Previous modeling process tells that the key for predicting reverberation intensity is to find the scattering bands, in other words to extract the relation between the total arrival time and scattering position. In the ray theory, the sound propagation obeys Snell law and thereby each sound ray is geometrically a circular arc under the constant sound speed gradient,
33
as shown in Figure 4. Here a new coordinate system is defined at the source position and the axis
The sound ray under a linear sound speed profile. A negative gradient is assumed and scattering band on the sea surface is unshown.
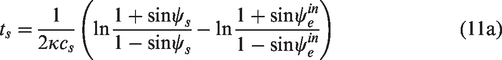
In this case, the sound propagation times from a scattering element to the source and receiver respectively can be explicitly derived as
33
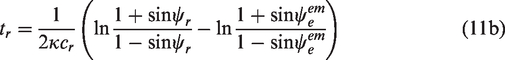
According to Figure 4, the radius of the arc
With associated center as
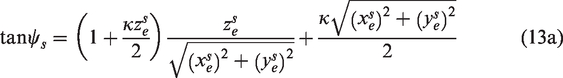
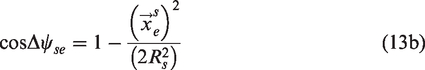

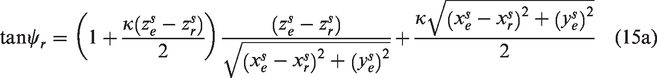

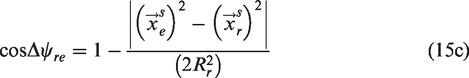
Substituting equations (13), (14) and (15) to equation (1) formulates the implicit boundary equations of a scattering band, reading


For a given total arrival time t, it must be noted that the component
Experiments verification
Measurement configuration
As argued previously, the energetic material can be used as a powerful underwater sound source for long range propagation. Hence, a series of underwater explosion experiments are employed for model examination.
Detailed measurement configuration is shown in Figure 5(a). The real-time wind speed is 4-5m/s; the averaged lake depth is 140m; the lakebed is mainly consisting ofpebbles, gravels and muds; the ship-ship distance is calibrated through GPS (GlobalPositioning System); the spherical explosion unit contains 24g charge JO-9 (density 1.831 g/cm3, detonation speed 8333m/s and detonation heat 5755kJ/kg), with 1mm-thick Makrolon shell; the hydrophone BK8106 is employed as the sound receiver, with the sensitivity −172±3dB and efficient frequency acceptance interval 1-50kHz; the tape recorder LTT186/16 is employed to store signal data.
Measuring conditions.
The sound speed empirical formula for the Fuxian Lake is given by
10

Explosion sound experiments in the Fuxian Lake testing field (Kunming, China):(a) measurement layout; (b) temperature and sound speed proles.
Such an approximate profile indeed dissatisfies the constant sound gradient assumption rigorously. Hence, for enabling the model verification procedure, the following measurement conditions are designed in Table 1.
Here
Results and comparison
Due to the ray theory assumption, it must be verified that whether the sound frequency can be considered as over 500 Hz. 2 The Hilbert Huang Transform (HHT) is performed on the sound pressure histories for identifying the frequency distributions. A time interval 0–0.05 s is selected to avoid the disturbance of the following reverberation sounds and representative analysis results are shown in Figure 6.
Direct sound analysis: (a) typical sound pressure histories; and (b) marginal frequency spectra. The time shifting operation has been implemented for convenience of comparison.
Figure 6(a) demonstrates that each sound pressure profile first increases skippingly but then decreases rapidly, obeying the exponential damping law during a few ms. The Positive and negative peaks appear in pairs and magnitudes of the negative ones are often higher compared to the others. Besides the well-known direct shock (the first pair) and bubble pulsation (the second pair), the remaining vibration components also exhibit significant contributions. They may come from multiple bubble pulsation, reflection, scattering and other effects. As the propagation distance increases, more vibration components appear, leading to visually slower pressure attenuation.
It can be confirmed from Figure 6(b) that the explosion sounds contain large numbers of frequency components. The frequency spectra obtained at different positions are similar, with central frequency close to 0.3 kHz and dominating frequency band around 0.1–10 kHz. Hence, we can regard assumption (1) as satisfied roughly.
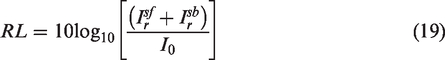
For the convenience of investigation, we employ the sound pressure level (SPL) as the measure in the subsequent discussion, reading
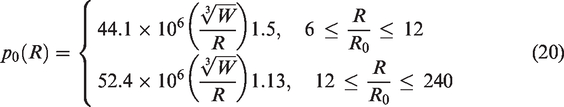
Based on large amount of experimental data, the pressure peak empirical formulas
18
for spherical charges (TNT, Trinitrotoluene, detonation heat 4227 kJ/kg) are concluded as
The empirical formula of the scattering coefficient limit on the sea surface is given by
2

Next the process coefficient due to medium absorption is calibrated. According to the assumptions (2) and (3), the transmission loss level (TL) can be expressed as
2

The SPL histories can now be predicted by the established model versus the measured results, as shown in Figure 7. It can be confirmed that the reverberation sounds attenuate to the ambient sounds fast but under the longer propagation distance, the attenuation rate decreases. For the short range propagation cases, the established model always provide acceptable predictions to the averaged SPL no matter under the double-surface (No.1) or single-surface (Nos.3 and 4) scattering situations, with deviations 2–4 dB. For the intermediate-distance propagation cases, the prediction results contain large deviations 3–9 dB and attenuate lower than the piratical ones. It may be understood by that in addition to the losses by spreading, medium absorption and interface scattering, many other losses exist, such as scattering by fish maw and bubbles. Their influences can exhibit obviously when the propagation distance becomes relatively long. In addition, the ray theory itself has some limitations under the intermediate distance or even long-distance propagation conditions. Nevertheless, some details are treated coarsely, the last established model is overall efficient to predict the averaged reverberation intensity, with about 3 dB higher accuracy than that under the constant sound speed assumption. Hence, the influences of the sound speed gradient may not be simply neglected in many cases.
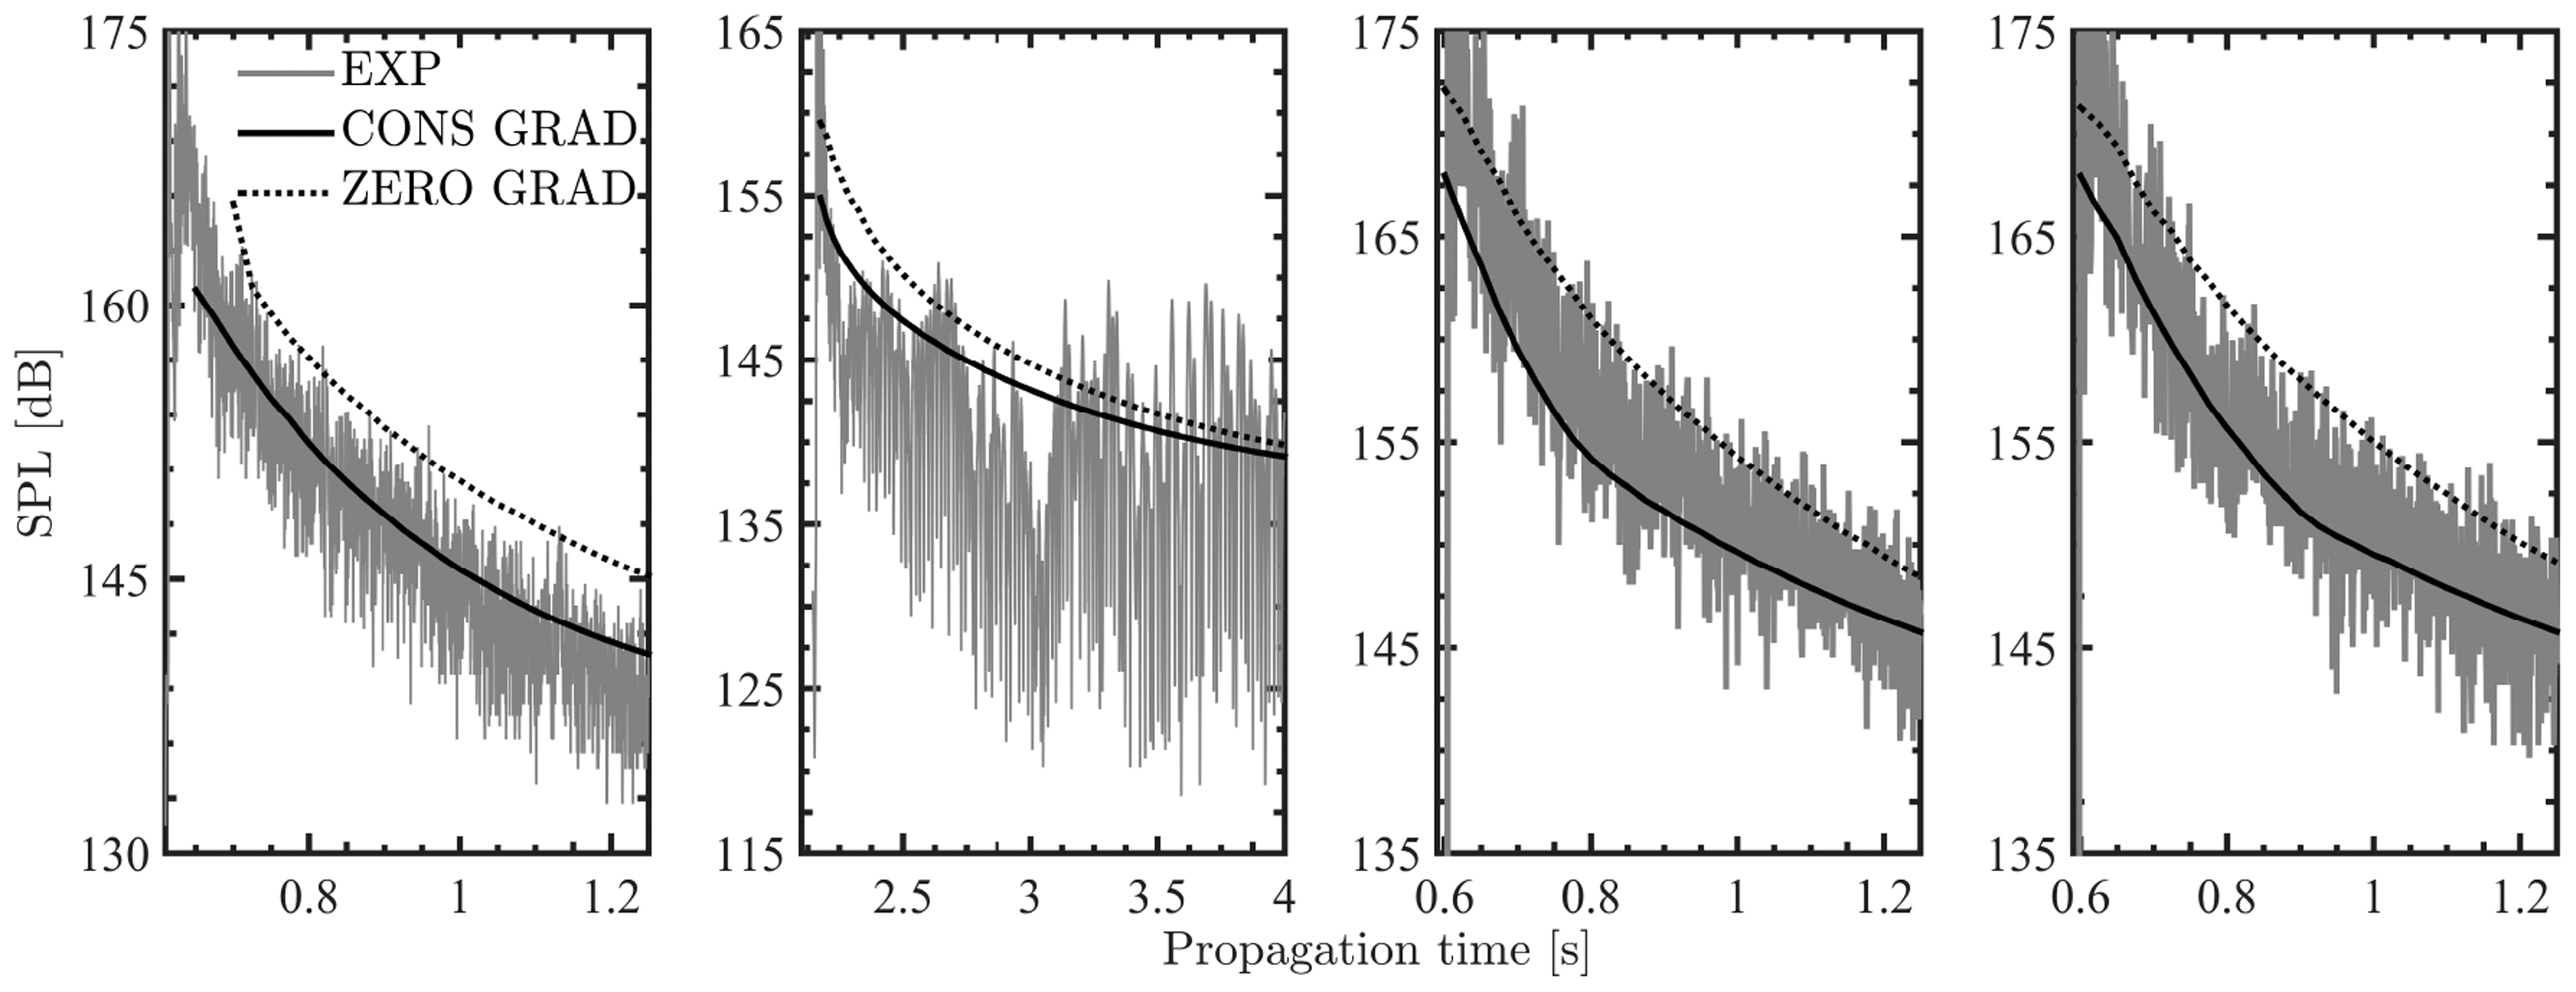
SPL histories under different conditions through experimental measurement and model prediction. The prediction results under the constant sound speed assumption are provided as references as well. From left to right: No. 1–4.
Discussion
To achieve more general conclusions, the interference effects between interface scattering sounds and influences of the source position, receiver position and sound speed gradient are further explored. Some unchanged parameter settings are given first.
The distance between seabed and surface is 500 m. The mean process coefficient due to medium absorption is 1 dB/km. The scattering coefficient limits on the sea surface and seabed are −40 dB and −30 dB, respectively. The source intensity is the unit intensity, where pressure is 1 μPa. The sound speed in the surface is 1500 m/s. Sound field spreads spherically.
Interference effects
The bistatic results by the single seabed scattering, single sea surface scattering and double-interface scattering are compared in Figure 8. We can find that during the early reverberation phase, the interference effects are non-negligible, while as the time passes, some interface can take the dominating role gradually, such as seabed under the negative gradient and sea surface under the positive gradient. The attenuation rate of the RL induced by such an interface is also far lower than the other one and thereby the interference effects are nearly hidden. This is because for the early reverberation, the angles of incidence and emergence on both seabed and sea surface approach 0° and associated scattering coefficients are almost their limits. Hence, the spreading and medium absorption losses are leading factors in this case. In the subsequent phase, the glazing angles on both interfaces keep decreasing fast and thereby the scattering loss becomes more pronounced. In addition, due to the sound speed gradient, the attenuation rates of the glazing angles on the dominating interface are far lower compared to the other one, leading to a higher RL component.
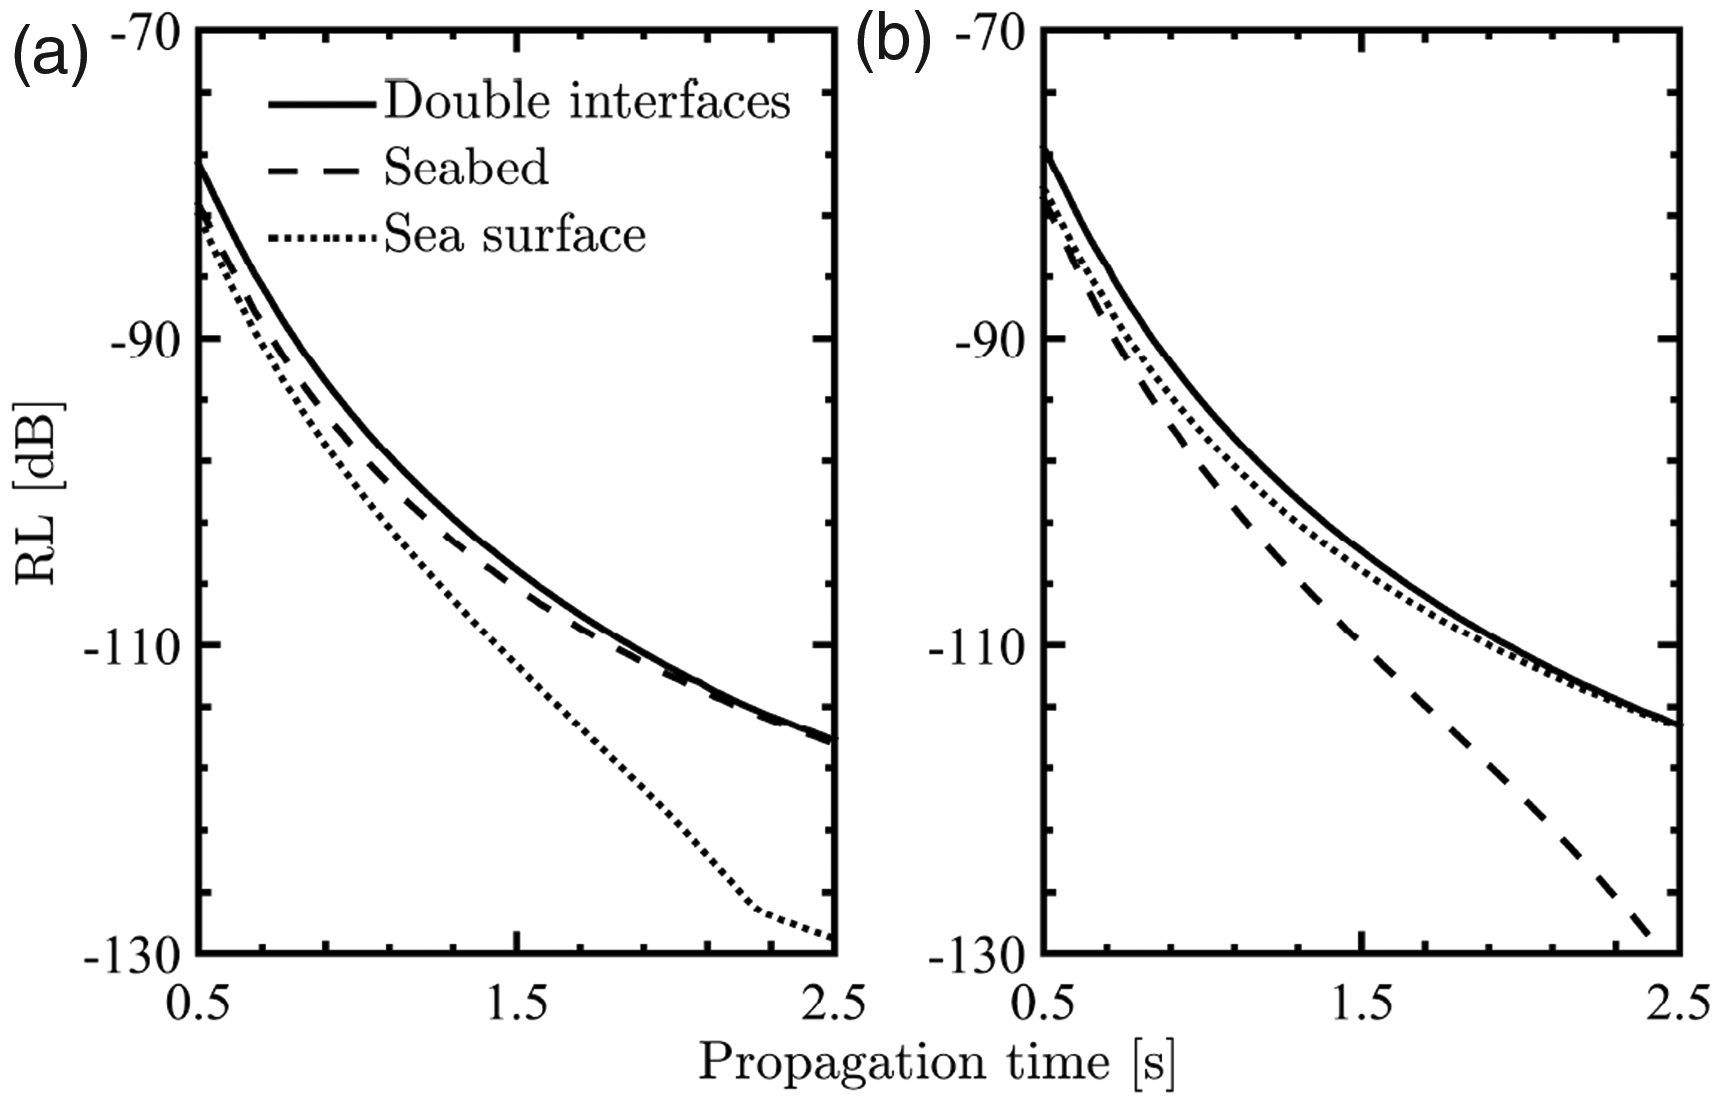
Bistatic RL of different interface scattering cases under the (a) negative and (b) positive sound speed gradients, respectively. Both source and receiver are configured with same depth 250 m and horizontal distance 500 m. The relative sound speed gradient has a magnitude 10−4/s.
Source–receiver position
The receiver RL distributions under different source positions are demonstrated in Figure 9. Here horizontal coordinate of the source is default as 0 m. It can be confirmed that considerable interference phenomena exist in each RL distribution. For a given source depth, as the receiver depth increases, the peak RL tends to increase rapidly and then decreases slowly but after that increases slowly again and eventually decreases rapidly again. At a fixed receiver horizontal position, two local maxima and one local minimum appear along the depth direction. As the horizontal source–receiver distance increases, each local maximum always locates close to the interface, while the local minimum gradually moves towards the zone with the higher sound speed. Also, the RL keeps decreasing at the same depth level.
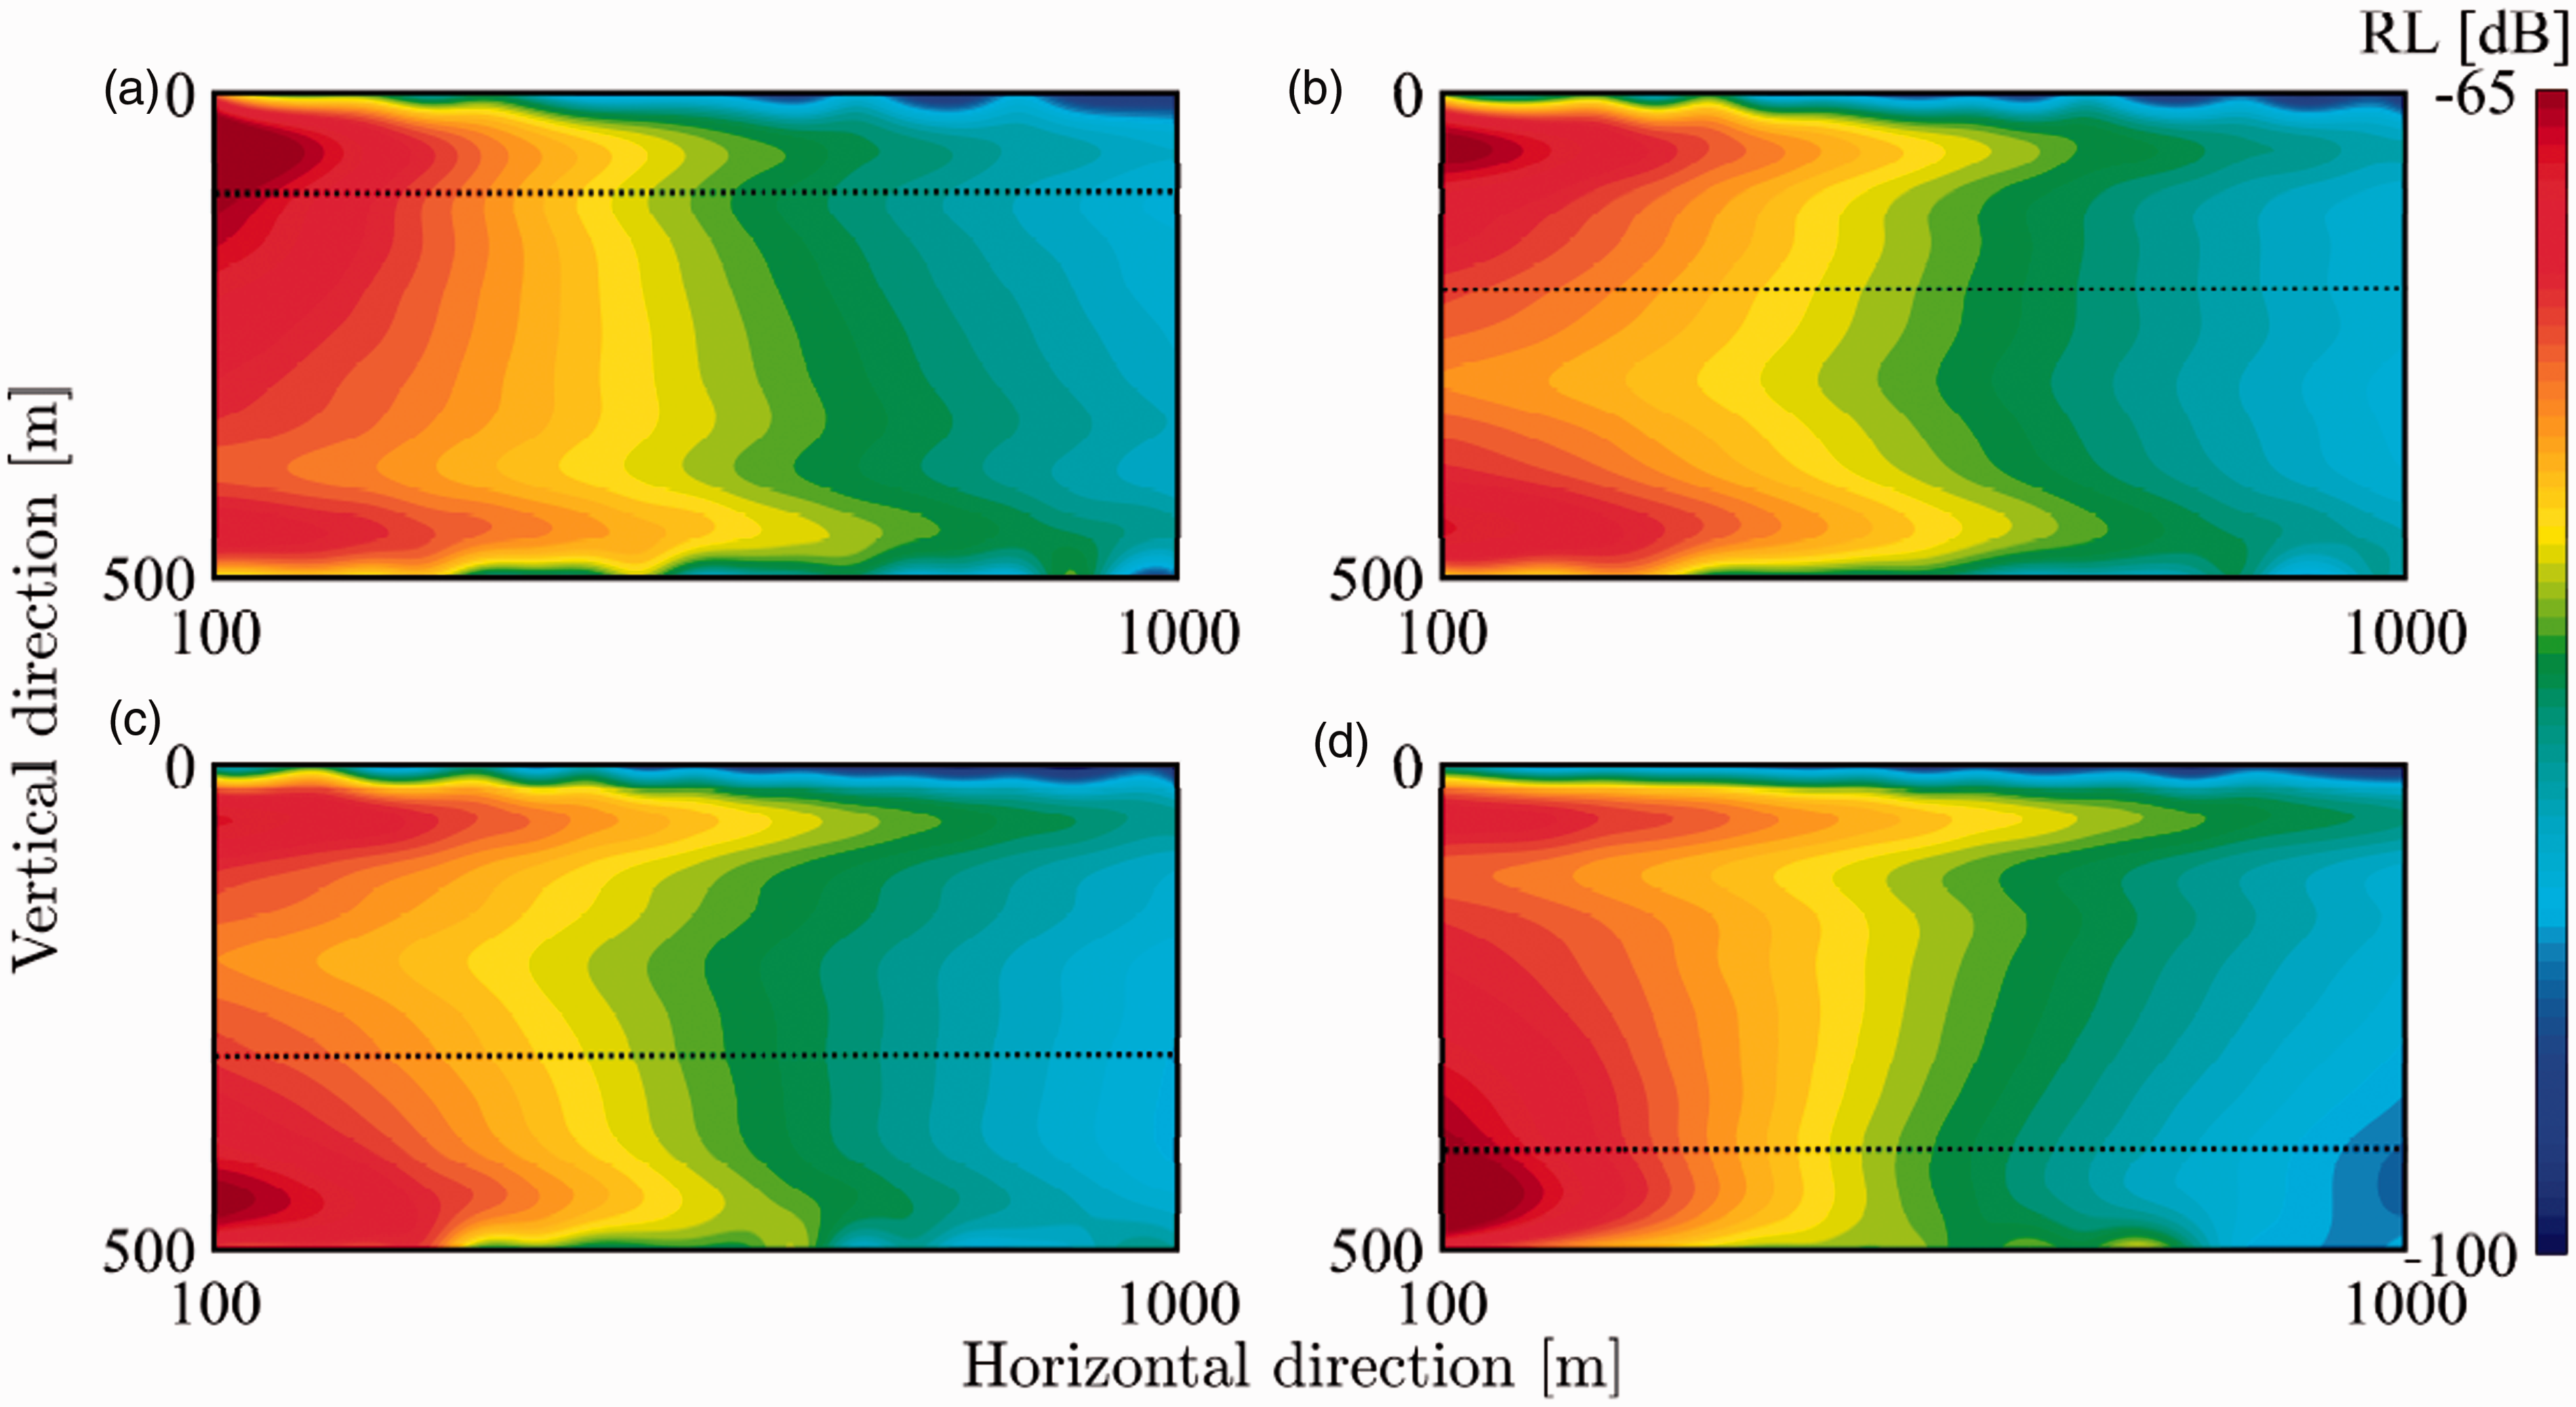
The peak reverberation level distribution versus the sound source position: (a) 100 m, (b) 200 m, (c) 300 m and (d) 400 m. The relative sound speed gradient is taken as 10−4/m.
Those investigations can be understood as follows. When the receiver locates close to some interface, the angles of incidence and emergence on most scattering elements approach 90° and thereby significant scattering loss is exhibited. However, as the receiver start to move away from some interface, the angles of incidence and emergence on most scattering elements decrease rapidly and thereby more sound energy can arrive at the receiver. Furthermore, since the propagation distance is relatively shorter, the decrease of the scattering loss is dominating compared to the increase of the spreading or medium absorption loss and thereby the overall RL tends to grow. When the receiver continues to move away, the spreading and medium absorption losses then take the leading roles, resulting in decreasing RL and until the local minimum. As the source–receiver horizontal distance increases, the RL keeps decreasing to the increasing propagation distance and influences of the sound speed gradient become more important, leading to local minimum towards the zone with the higher sound speed.
In addition, one may note that when the source approaches some interface, such an interface tends to become the dominating one. Consequently, the local minimum gradually moves towards the other interface and the local high intensity domain close to the dominating interface expands while the other one shrinks.
Sound speed gradient
The receiver RL distributions under different sound speed gradients are investigated in Figure 10. One can see that with a small gradient (k < 1 × 10⁻⁵), the whole RL field demonstrates symmetry in some degree. For a fixed horizontal position, three local maxima appear along the depth direction where the central one is relatively weak. As the gradient increases, the central local maximum and associated high-intensity zone tend to shrink and even disappear and the RL field symmetry decreases as well. It can be explained by that when the sound speed gradient approaches zero, the sound propagates almost along a line. Therefore, the scattering sounds from different interfaces are similar and simultaneously arrive at the intermediate depth level, with notable interference enhancement. In contrast under the large gradient, the sound ray bends towards the zone with low sound speed and so that it is relatively difficult to achieve interference enhancement, leading to annihilation of the central local maximum.
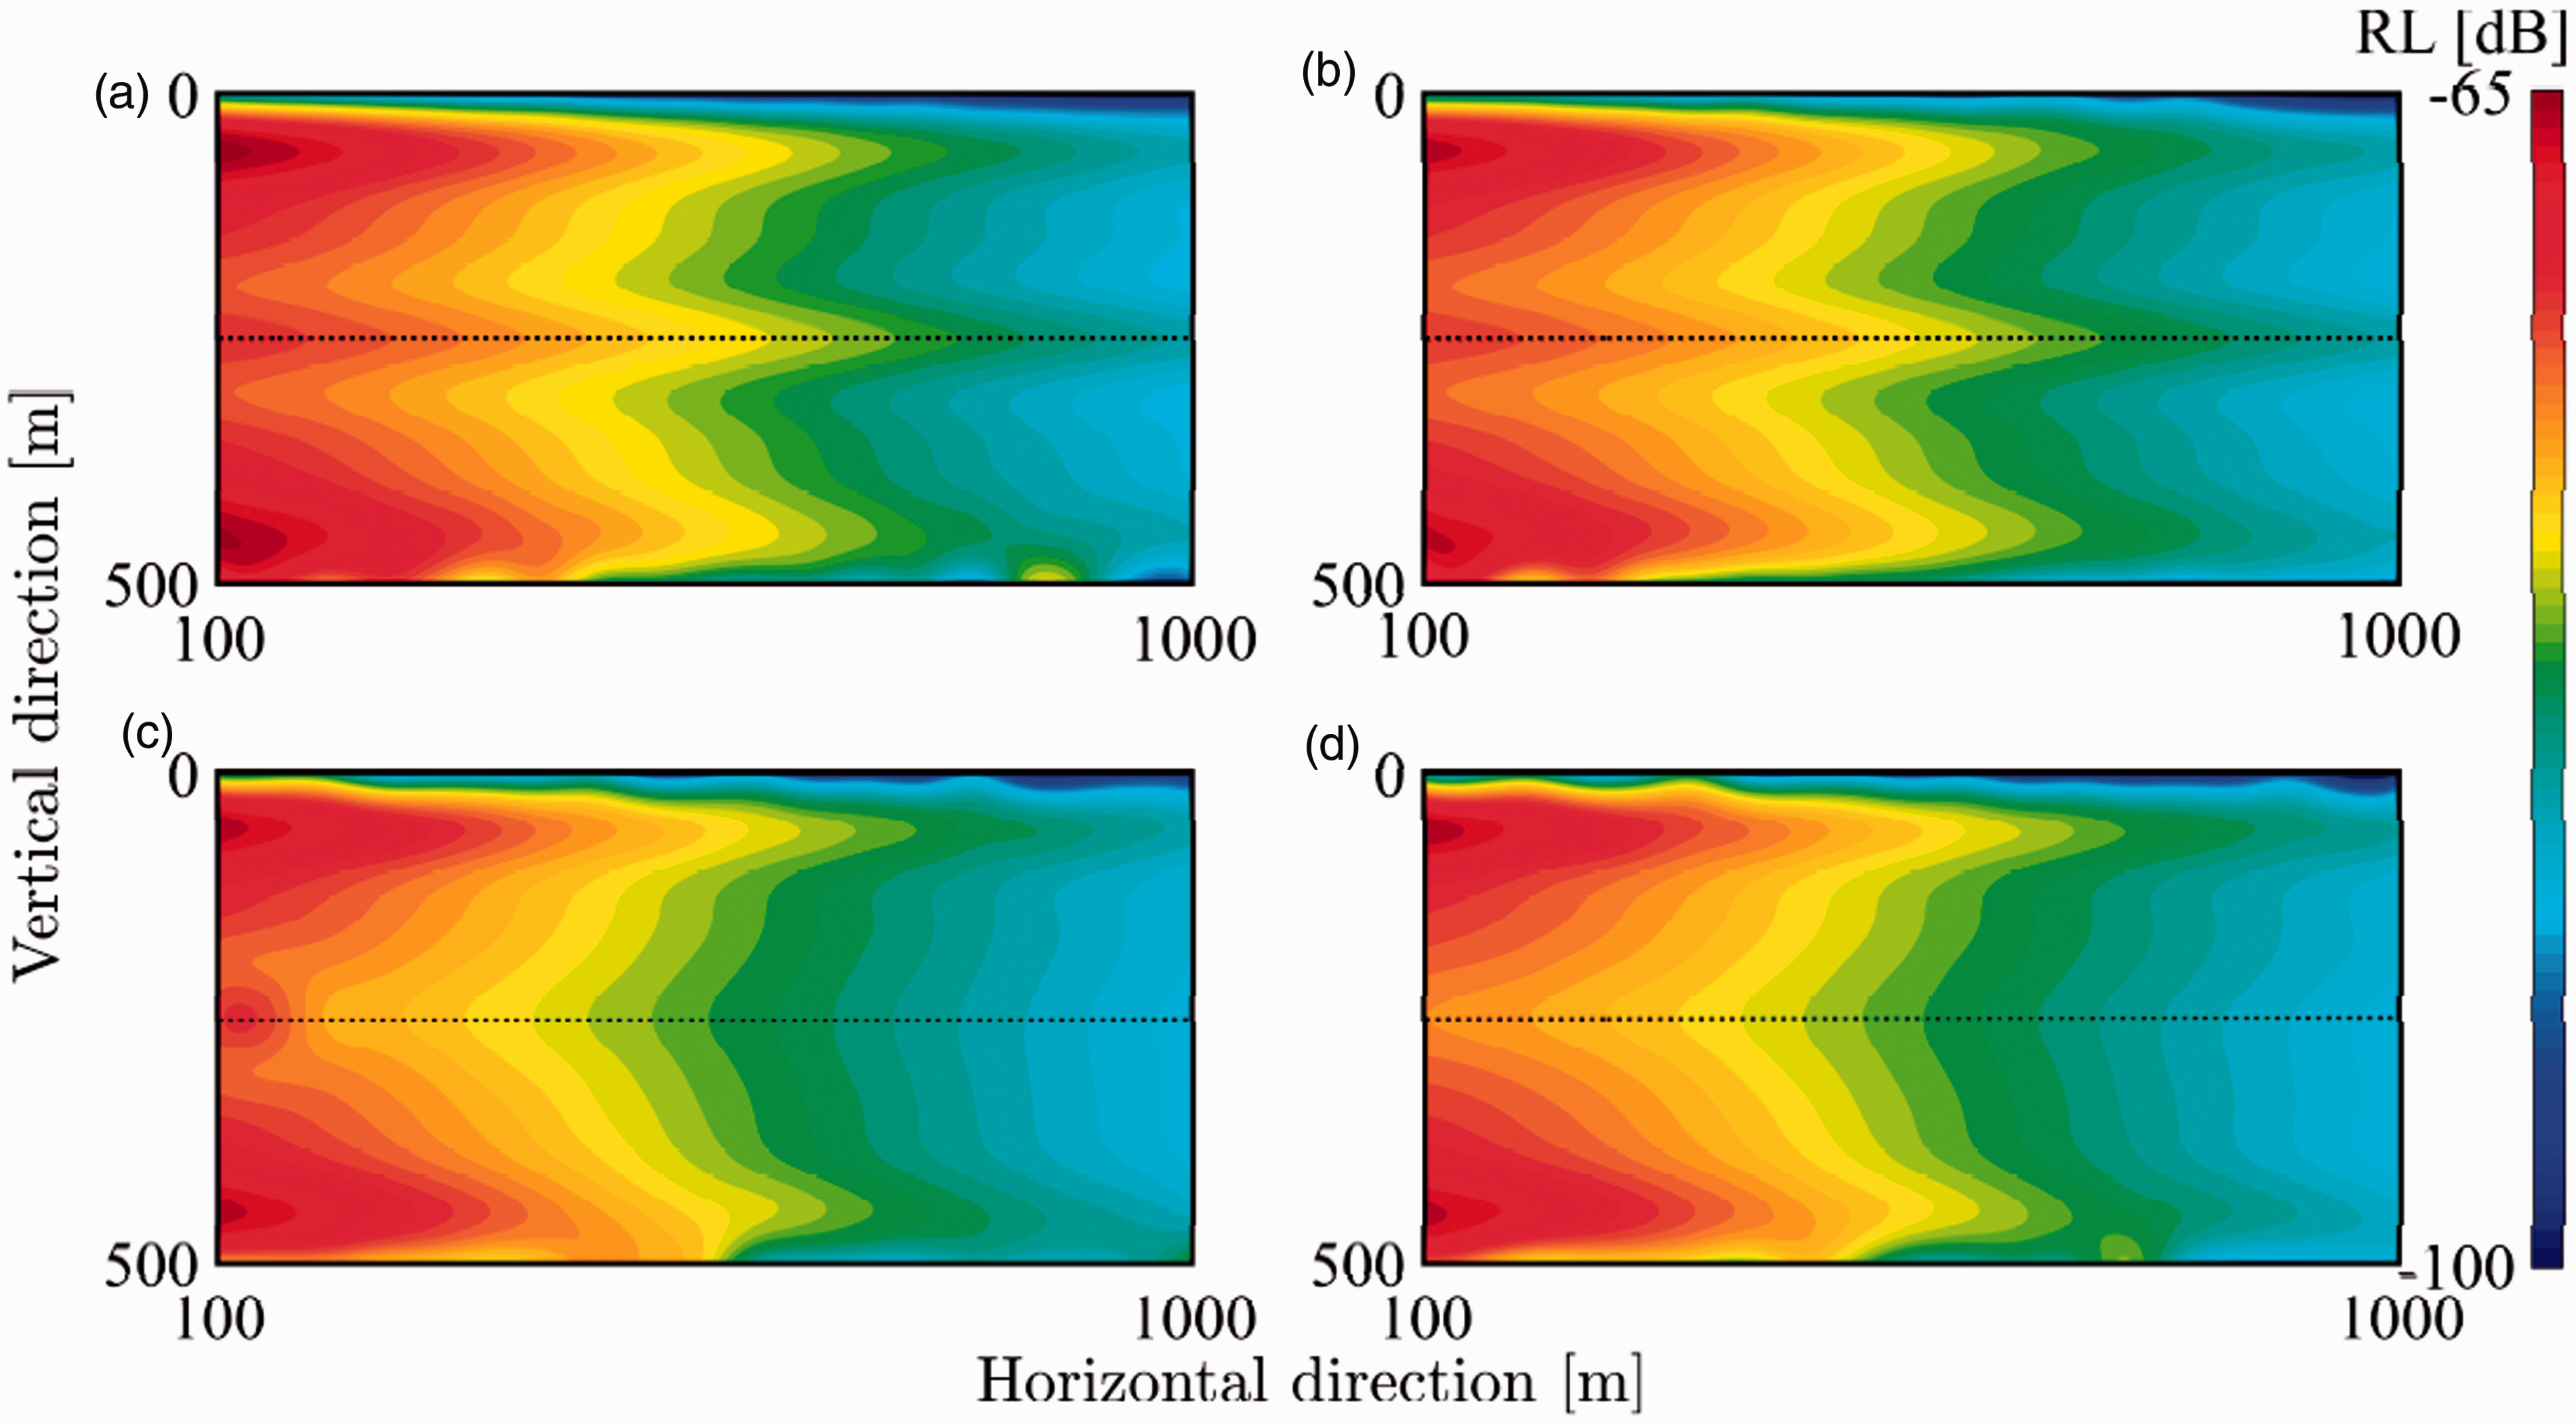
The peak reverberation level distribution versus the relative sound speed position: (a) 5 × 10⁻⁶/m, (b) 1 × 10⁻⁵/m, (c) 5 × 10⁻⁵/m and (d) 1 × 10⁻⁴/m. The sound source depth is fixed at 250 m.
Conclusions
A mathematical model to predicting 3D bistatic reverberation by interface scattering under constant sound speed gradient is established and verified by experiments, and detailed model discussion is also performed. The principal results obtained are summarized as follows.
Although some physical details are dealt with roughly, the established model can provide acceptable prediction for the short-range averaged reverberation intensity, with the deviation 2–4 dB. Associated estimation accuracy is about 3 dB than that under the constant sound speed assumption. During the initial reverberation phase, the interference effects among different interface scattering sounds are non-negligible but after a sufficiently long time, the total reverberation intensity can be approximated by that from the single dominating interface. When the relative sound speed gradient is relatively large (k>1 × 10⁻⁵), the competition between the spreading, medium absorption and scattering losses yields the local high-intensity zones close to two interfaces, respectively. As the source move towards some interface, associated local high-intensity zone tends to expand while the other one shrink. In the case that the gradient approaches zero, the significant interference enhancement of the scattering sounds from two interfaces is formed among the intermediate depth level and a newborn local high-intensity zone accompanies, but with relatively weak magnitude.
Footnotes
Acknowledgements
The authors would like to express gratitude to everyone who has participated in the experimental process.
Declaration of conflicting interests
The author(s) declared no potential conflicts of interest with respect to the research, authorship, and/or publication of this article.
Funding
The author(s) disclosed receipt of the following financial support for the research, authorship, and/ or publication of this article: This study has been supported by National Natural Science Foundation of China (Grant No. 11102088), Fundamental Research Funds for the Central Universities (Grant No. 30915118821), and Specialized Research Fund for the Doctoral Program of Higher Education of China (Grant No.20133219110019), to which we are also grateful.