
Abstract
Large-eddy simulation (LES) and Detached-eddy simulation (DES) were applied to a simple cavity model to calculate the wind buffeting noise respectively. The results were verified by wind tunnel experiments. The results show that LES is more suitable for wind buffeting noise calculation. LES method was employed to calculate automobile side-window buffeting noise. The correctness of results was validated by a road test. In this paper, the acoustically calculated sound pressure level (SPL) spectral curve is used as the initial signal of the acoustic post-processing. Four psychoacoustic objective parameters namely: loudness, sharpness, roughness and fluctuation were obtained by using Matlab R2016a to compile the calculation process. Sound quality evaluation (SQE) of the vehicle is performed via most frequently used SPL and four calculated vehicle comfort index. It can be concluded that with the increase of driving velocity, SPL and loudness show an increasing trend, while roughness, sharpness and fluctuation present a decreasing trend. It can be also summarised that with the increase of window opening degree, SPL and loudness show an increasing trend, sharpness presents a decreasing trend, and roughness and fluctuation display the trend of ups and downs. The main original contribution of this paper is the accurate calculation of wind buffeting noise and the summary of the changing rule of SPL, loudness, roughness, sharpness and fluctuation with the variation of velocity and window opening degree.
Introduction
Sound quality evaluation (SQE) of the vehicle which is a broad subject owing to our reasonably complex interaction with the vehicle has become a significant focus of acoustics research. 1 Considerable effort has been expended on the SQE and improvement of vehicle noise in the past few decades.2–7 Car manufacturers have also plainly put lots of effort into specific attributes of their product to better meet customer expectation. Many noise sources must be taken into account to improve the sound quality in passenger cars. 5 However, a significant number of studies about SQE are aimed at traditional mechanical or road noise. Less attention is paid to wind buffeting noise under the condition of different window opening degree.8–11 Wind buffeting noise can be interpreted as the aerodynamic acoustical response of air inside the passenger compartment to unsteady flow outside the car. The vortex streets with a certain propagation velocity are generated by airstreams via vehicle body openings. 12 With the repeated and intensified process of vortex movement, development, inevitable collision and dispersion, the pressure pulsations are getting higher and more unstable, resulting in the high-intensity low-frequency wind buffeting noise. 13 Buffeting is a kind of Helmholtz resonator noise which is caused by the energy exchange between vortex streets and cavity modal. 12 The better vortex evolvement coincides with cavity modal, the higher wind buffeting SPL will be.
The subject of wind buffeting noise has been studied by many investigators; however, these studies based upon traditional SPL mainly focus on the calculation accuracy and efficiency at a certain fixed window opening size, as well as its related experimental analysis.12–15 A comprehensive study of the buffeting has been undertaken by Zhu and Gleason. They introduced a process of prediction of side-window buffeting which includes CFD simulation, a full-scale aero-acoustic buck and vehicle wind tunnel tests. 14 The compared results show that CFD simulation can be used for side window buffeting predictions at early stages of the program. Several attempts have been made to find possible solutions for buffeting reduction by An et al. 15 Some of them are quite promising which has been validated by wind tunnel experiments. Besides, optimisation of mirror angle concerning the front side glass was adopted by Walker and Wei 16 to minimise buffeting noise through experimental methods. Moreover, Wang et al. proposed a hybrid LES-LAA simulation method based on the theories of CFD and aeroacoustics for predicting the wind buffeting noises. 13 The obtained results have good accuracy in predicting the wind noise compared with experimental data.
The aforementioned studies have common characteristics and problems. According to those studies, SPL is the only indicator of wind buffeting noise evaluation. It is generally considered that reducing SPL can improve auditory comfort. However, the validity of hypothesis has not been proved. It is becoming apparent that it is not just SPL that counts, but also the quality of sound. 5 All the physical characteristics of wind buffeting noise cannot be reflected entirely by SPL. SPL or the A-W SPL can only reveal the general effect in the entire frequency band. 17 This single evaluation index is too insufficient to evaluate and analyse the noise which has the same sound power level or the A-W SPL but different spectral components. To overcome the shortcomings above, a few researchers have made some beneficial exploration. For example, Otto and Feng examine the affiliation between the properties and the human perception of wind noise. 8 They find that a particular loudness measurement is the predominant characteristic to govern the customer perception. A paper relevant to this research was published by Guillaume Lemaitre. He proposes an indicator of the unpleasantness of wind buffeting based on fluctuation strength in several frequency bands as well as other descriptors of the spectral balance of the sounds. 9 However, the other objective indicators were omitted, which is inadequate and inaccurate. Conversely, a subjective jury listening evaluation experiment was conducted through paired comparison method by Amman et al. 10 The binaural sounds applied to evaluation were recorded inside an aeroacoustic wind tunnel. However, the results can only subjectively account for the impact of wind buffeting on the human annoyance which lack objective analysis. The objective evaluation indexes were too few to make a full reflection of all physical sound characteristics of buffeting.8,9 The subjective evaluation of buffeting are too perceptual and not absolute enough. In summary, the research on wind buffeting noise sound quality evaluation is far from adequate and in-depth.
The sound quality (SQ) is the adaptability of the sound in a particular technical goal or mission. 18 The main original contribution of this paper is the accurate calculation of wind buffeting noise and the summary of the changing rule of SPL, loudness, roughness, sharpness and fluctuation with the variation of velocity and window opening degree. The sound quality metrics utilised in this paper is commonly used to evaluate vehicle comfort index, namely: loudness, sharpness, roughness and fluctuation. 19 Performing sound quality studies based on these metrics can avoid time-consuming jury testing. In this paper, numerical calculation of buffeting noise was combined with the SQE. In the stage of car design and development, each objective parameters of sound quality should be comprehensively considered to reduce the noise subjectively perceived by car occupants and improve the product level as well as driving comfort.
The structure of this paper is shown in Figure 1. First, the methodology and validity of CFD simulation were demonstrated by applying two simulation methods to a simple cavity model and verified by wind tunnel experiment. Second, the better method which was compared in the first step is chosen and utilised to a full-scale vehicle to obtain the pulsating pressure of monitor point. The data were checked by road test. In the final step, the data obtained in the previous step were adopted as an initial signal to perform sound quality evaluation by commercial software Matlab R2016a.
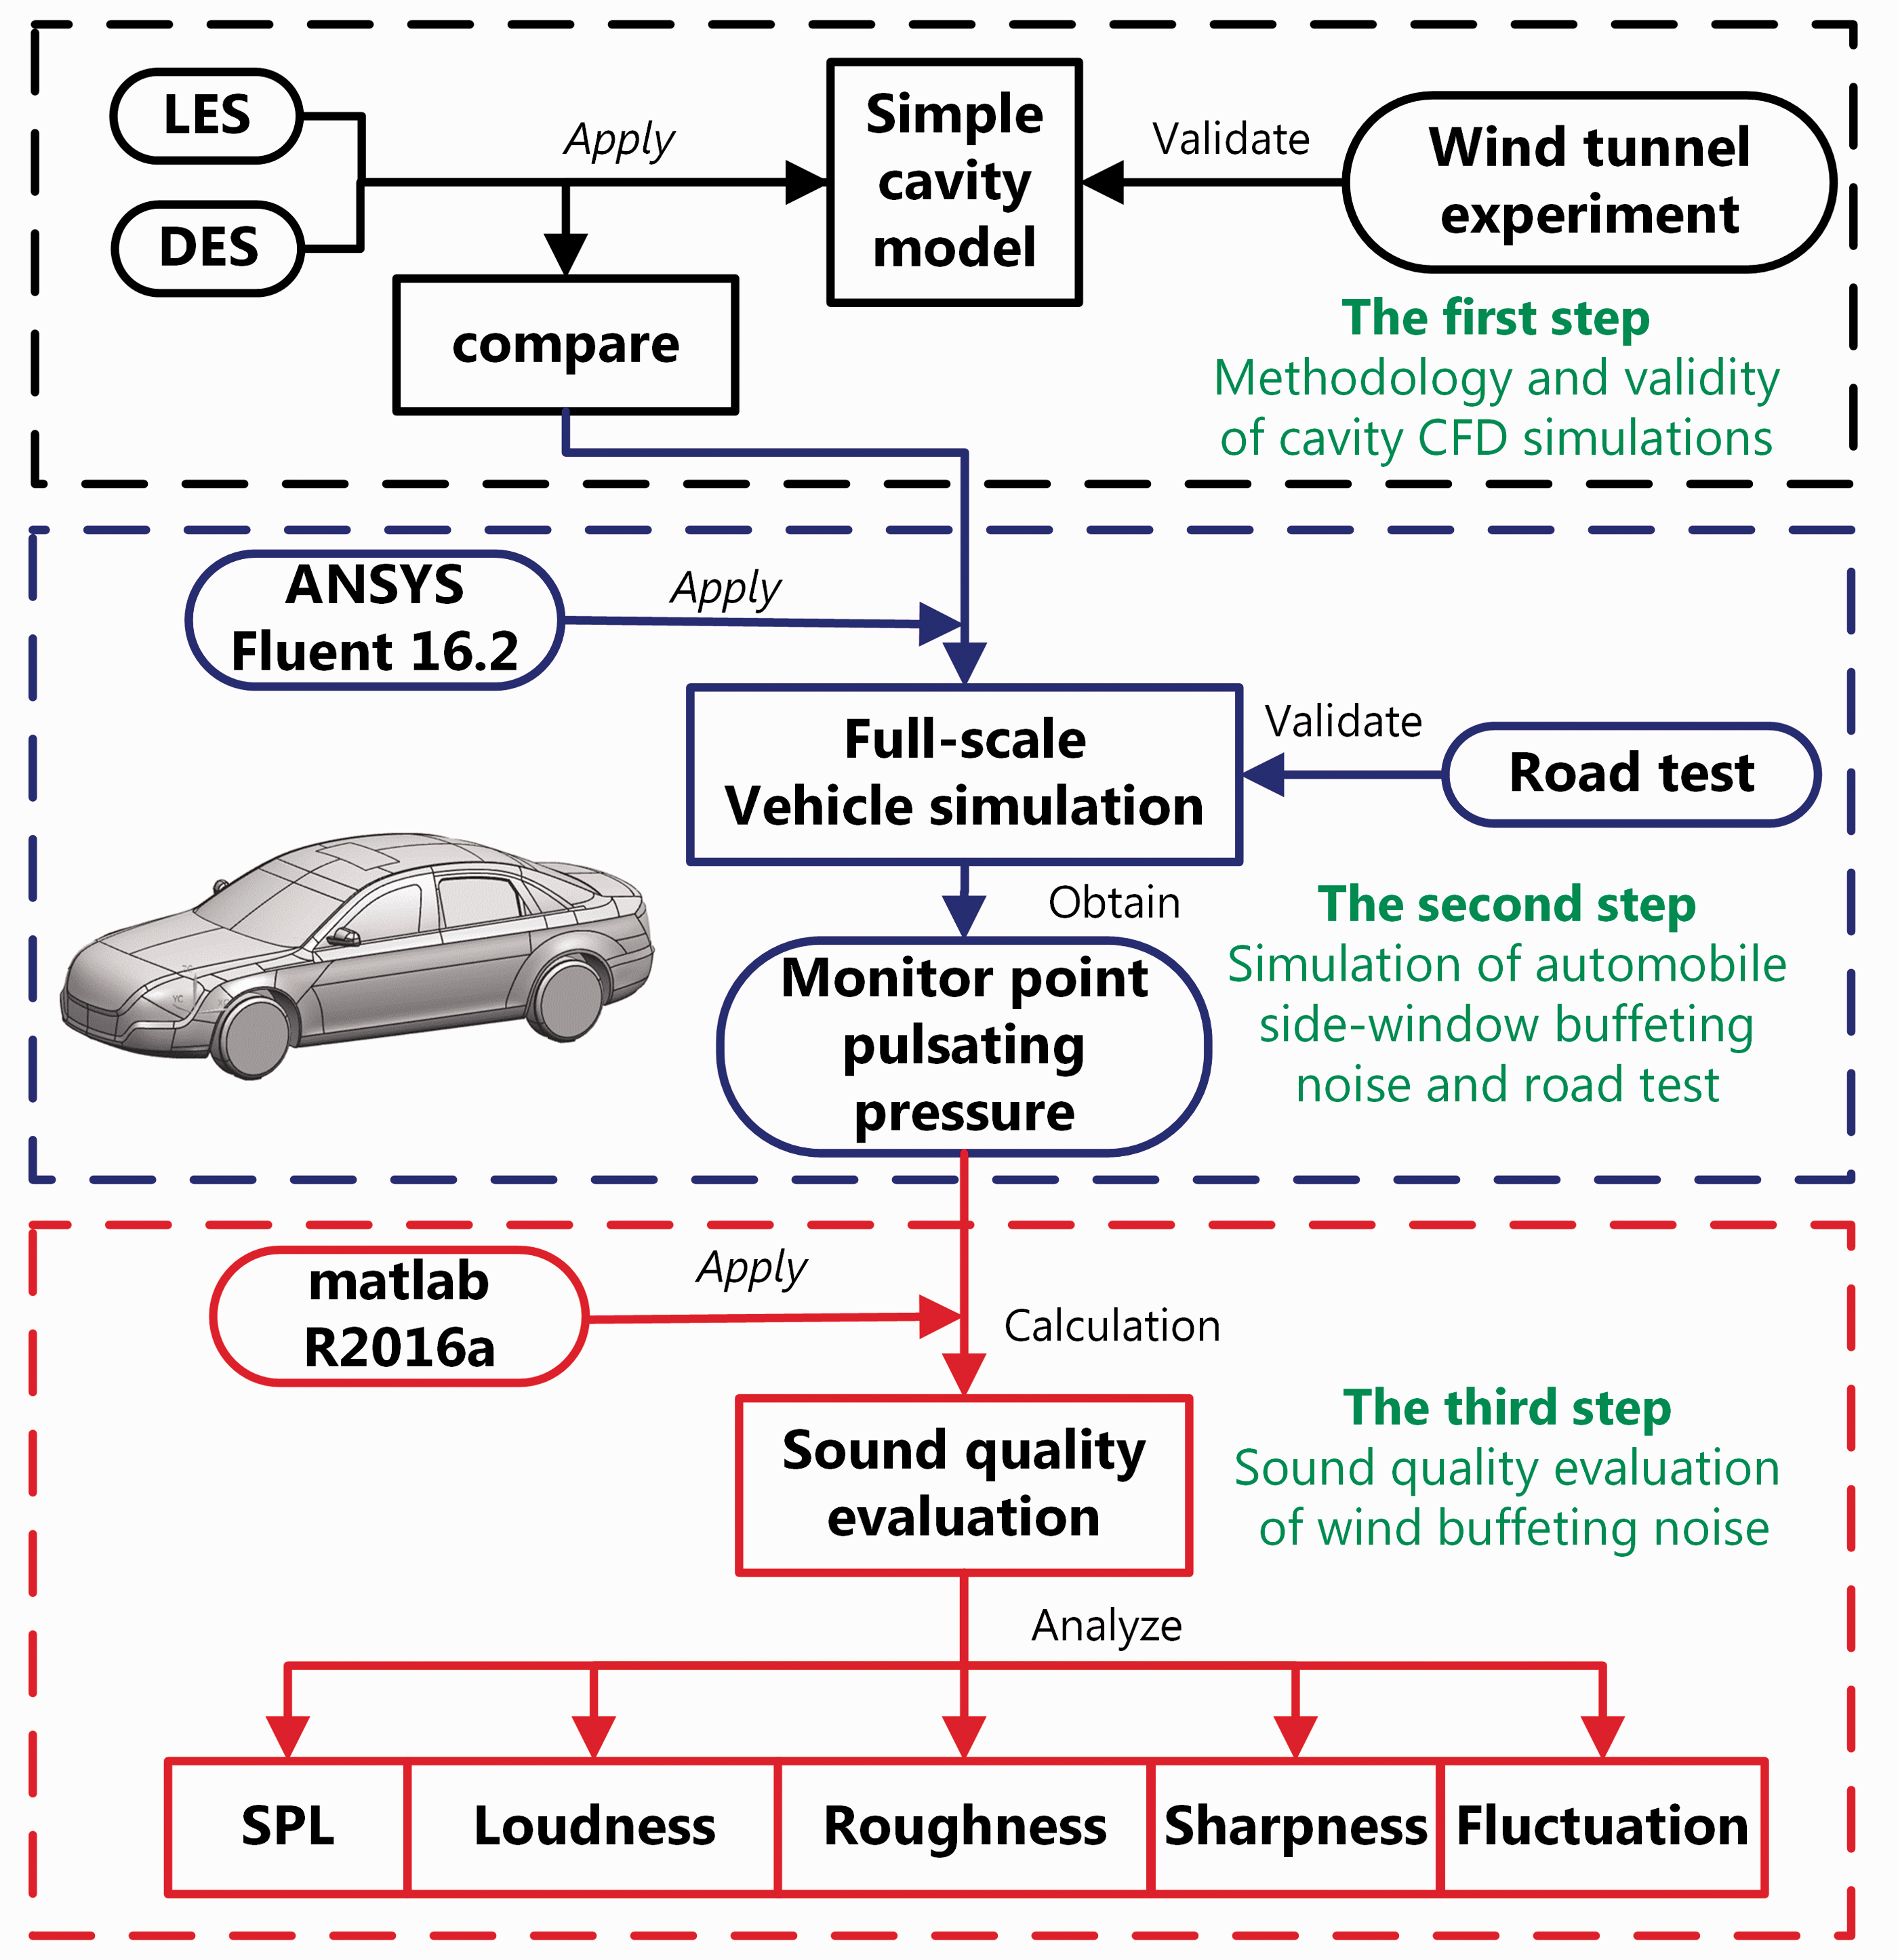
Flow diagram of SQE of wind buffeting noise based on Large-eddy simulation.
Methodology and validity of cavity CFD simulations
In order to study the car aerodynamic characteristics, experiments are adopted as a conventional research method, yet it is unmet because it is time consuming and expensive. Currently, CFD simulation is widely used and proved to be right. The mechanism of wind buffeting noise has been studied and elaborated in detail. 12 The core content of this paper is the accurate simulation and the comprehensive SQE of wind buffeting noise. As the two most commonly used models in numerical simulation,20–23 LES and DES were applied to carry out cavity noise calculation, respectively, and compared with the results of wind tunnel experiment in this context.
Computation details
A simple cavity model is chosen to predict the buffeting noise for saving computing resources as shown in Figure 2. The cavity model can act as an automotive compartment with the open side-window. The length, width and height of the model are 0.4 m, 0.3 m and 0.29 m, respectively. The cavity owns an opening in the middle of the top side and geometric parameters are: 0.1 m × 0.24 m × 0.015 m. Polyhedral cells significantly reduce the number of cells and better conform to the geometry surface and flow. Polyhedral cells also reduce interpolation errors and false numerical diffusion. 24 Furthermore, polyhedron cells have superior convergence and less grid dependency, which dramatically reduces hardware resource requirements and computing time. 25 Due to the above merits, the polyhedral mesh is utilised for subsequent numerical simulation in this paper. The mesh size of cavity surface is defined as 2 mm. The rest surfaces are defined as 32 mm. The total number of grids is 2 million. The mesh distribution of the longitudinal cross section of symmetry is shown in Figure 3.
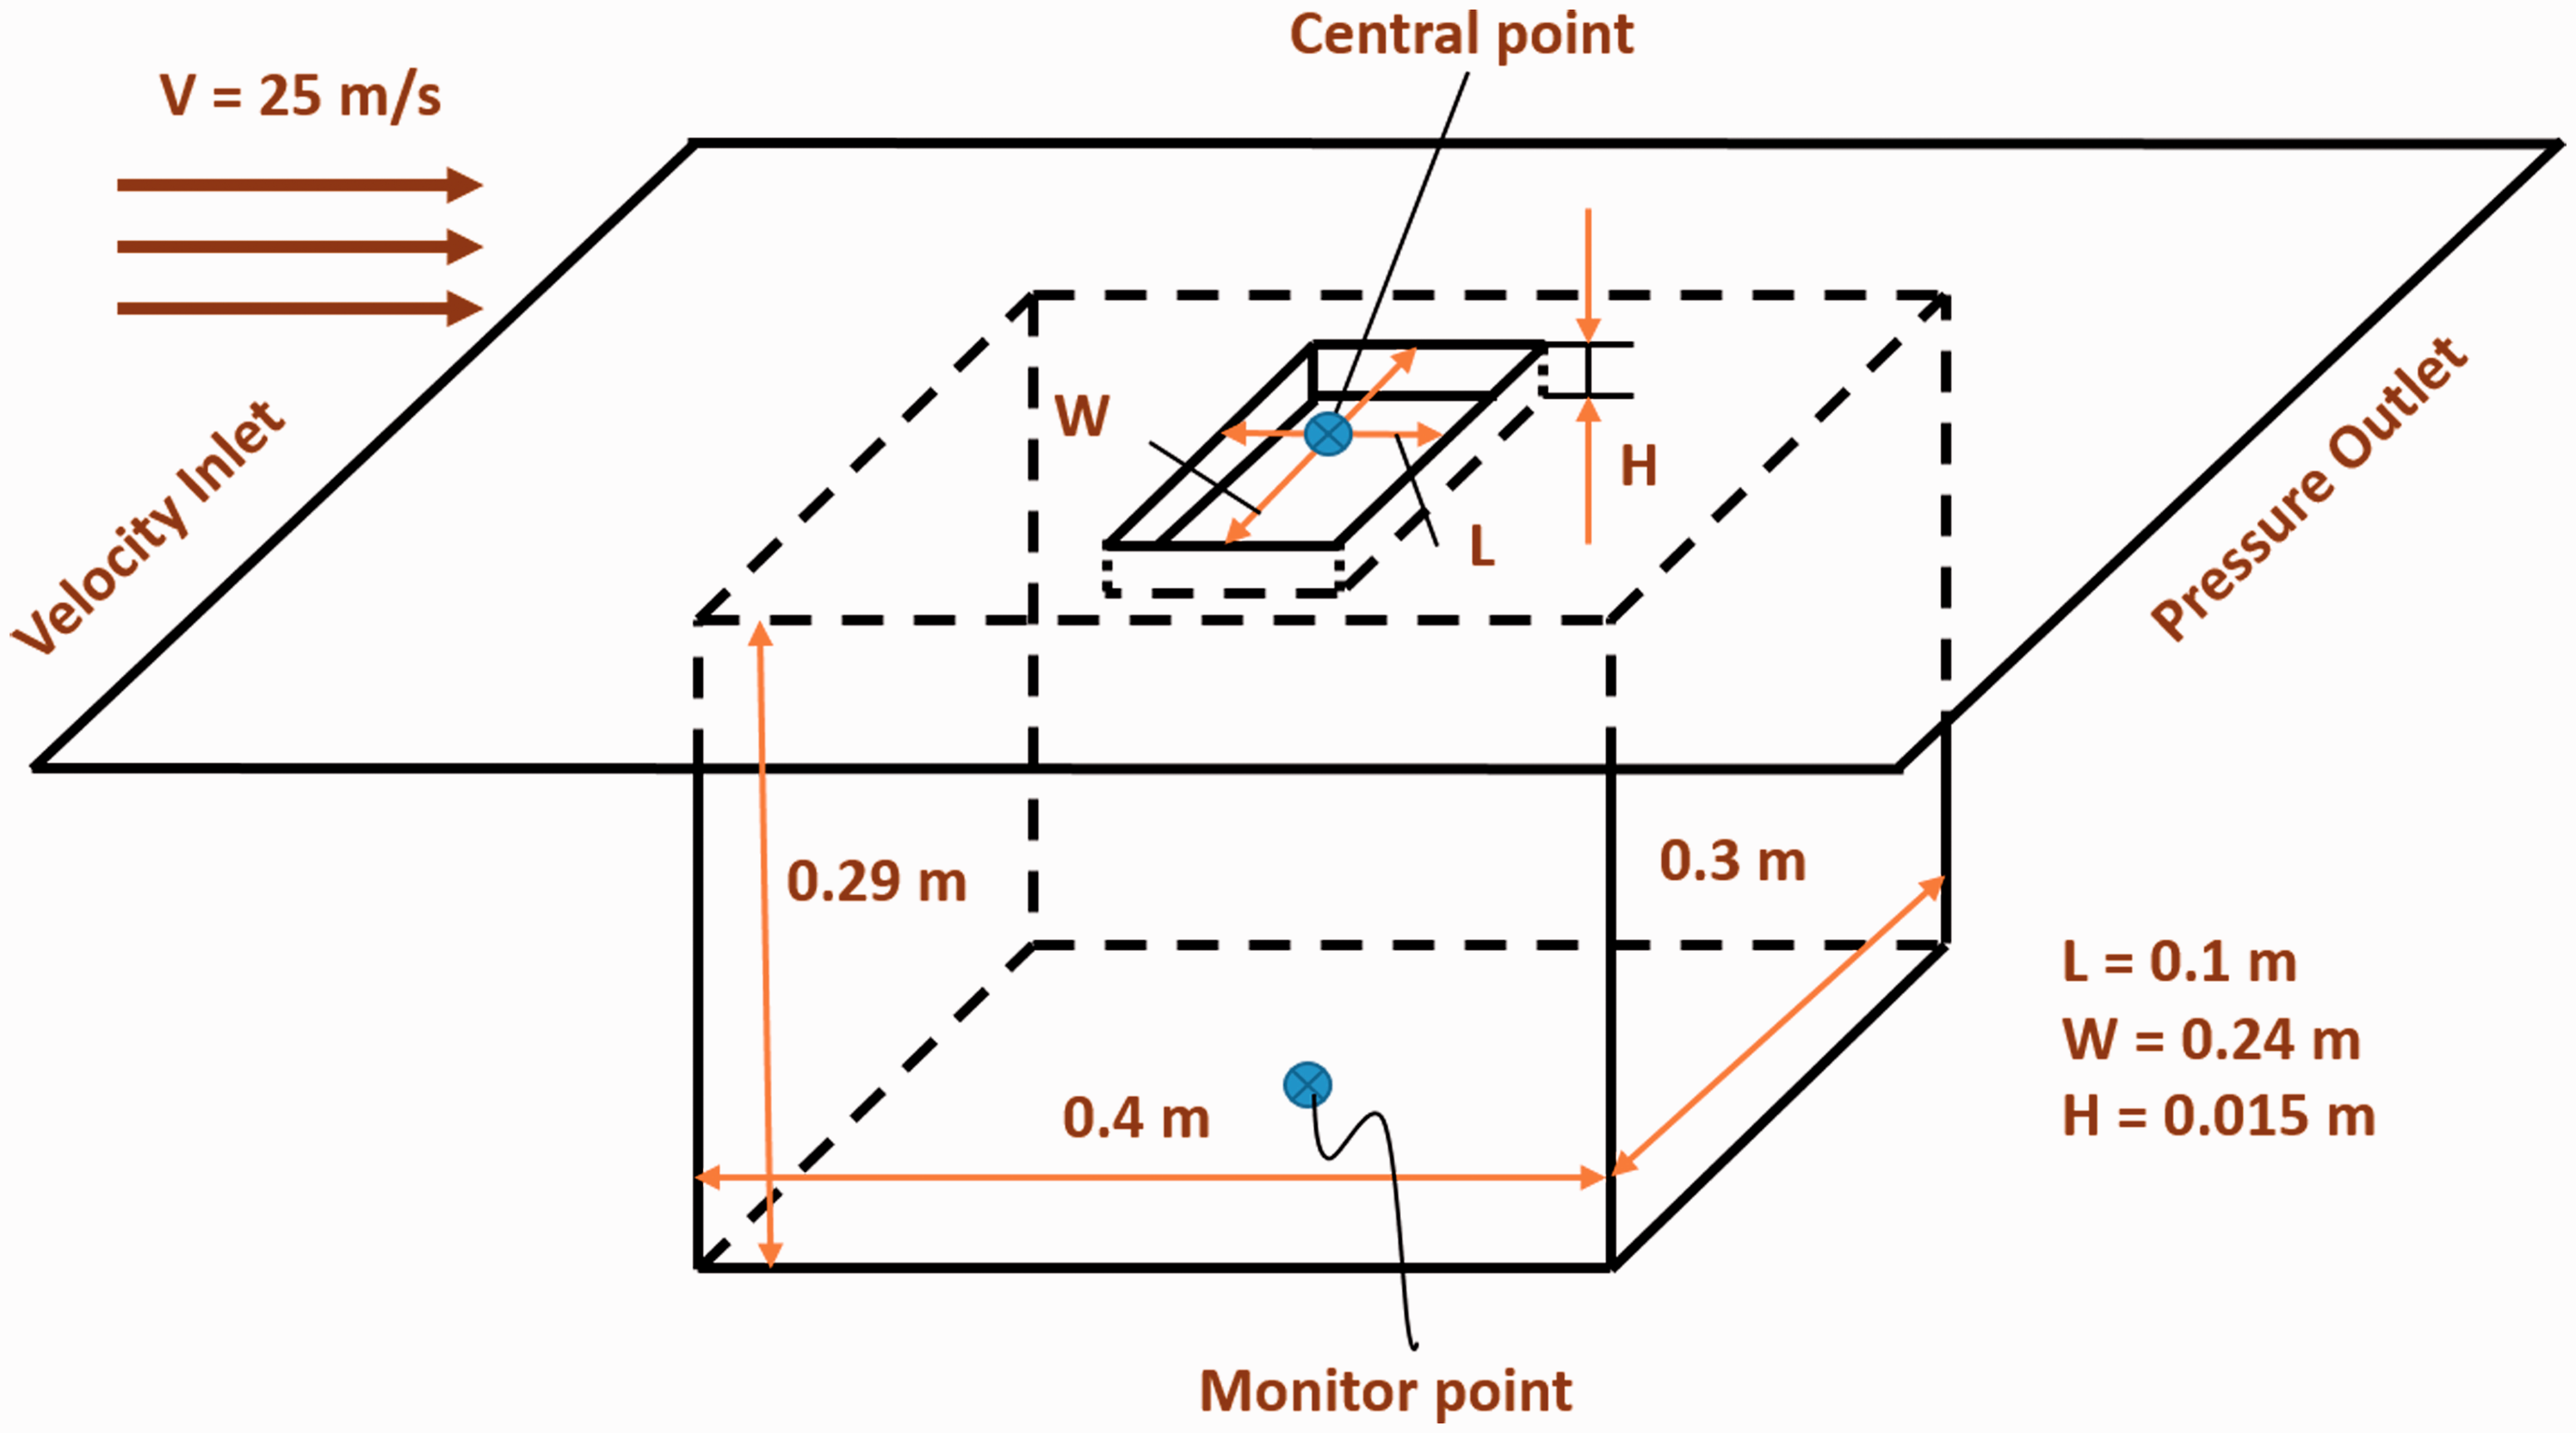
Geometric model of the simple cavity and receiver location.
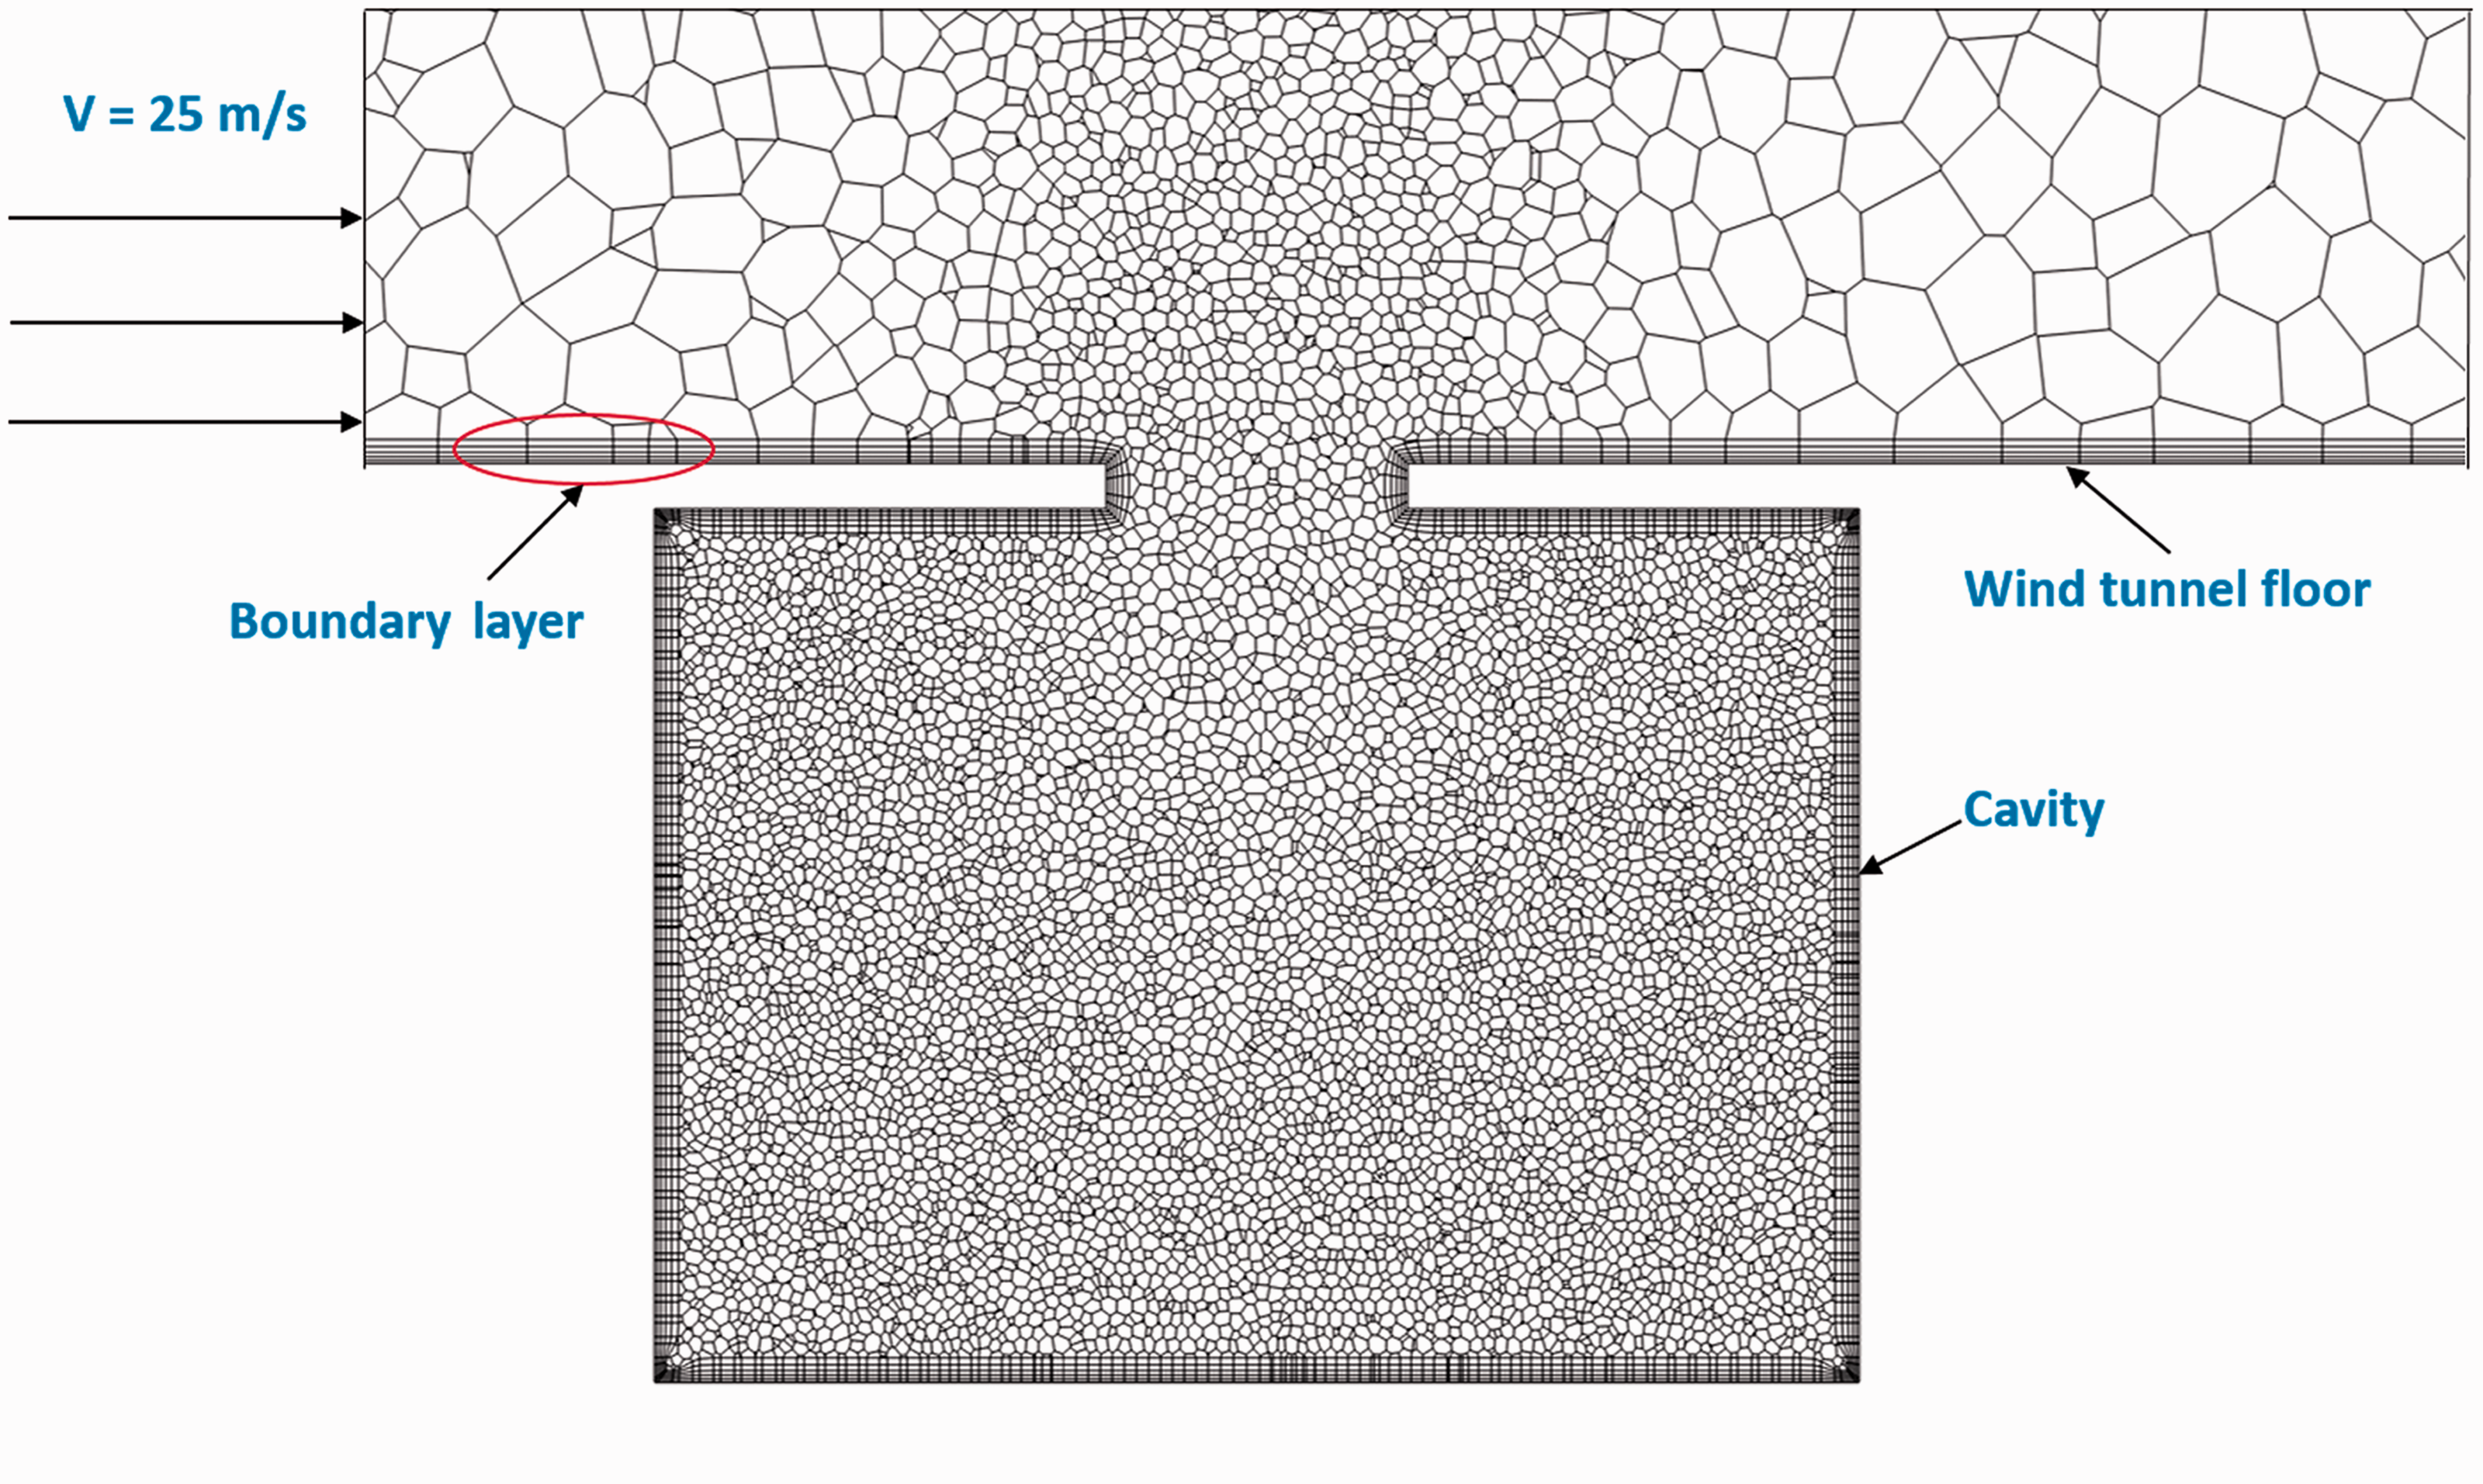
Grids along longitudinal symmetry plane and prism layer.
The steady-state calculation of the flow field is carried out first of all. After the residuals are converged, the transient calculation continues. Realisable
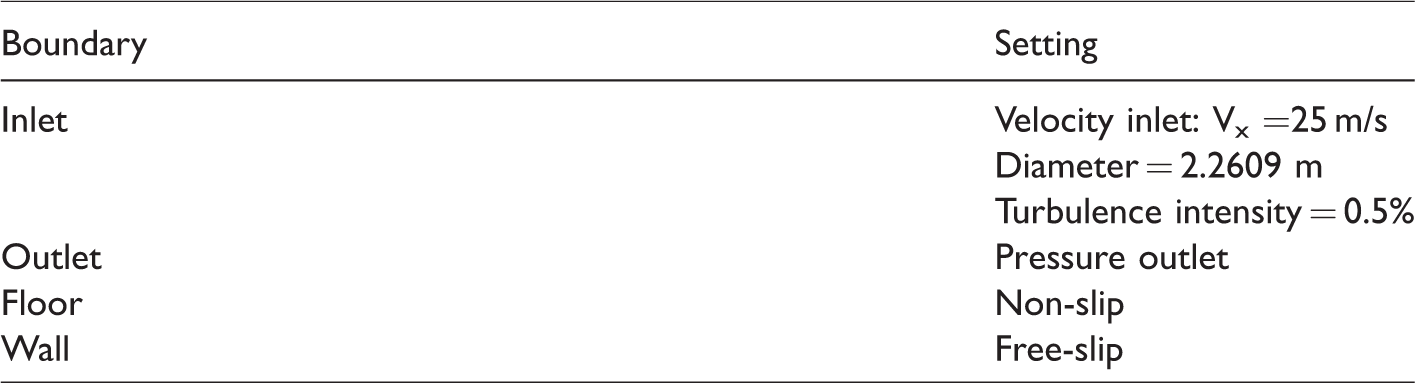
Boundary conditions.
Solver setting.
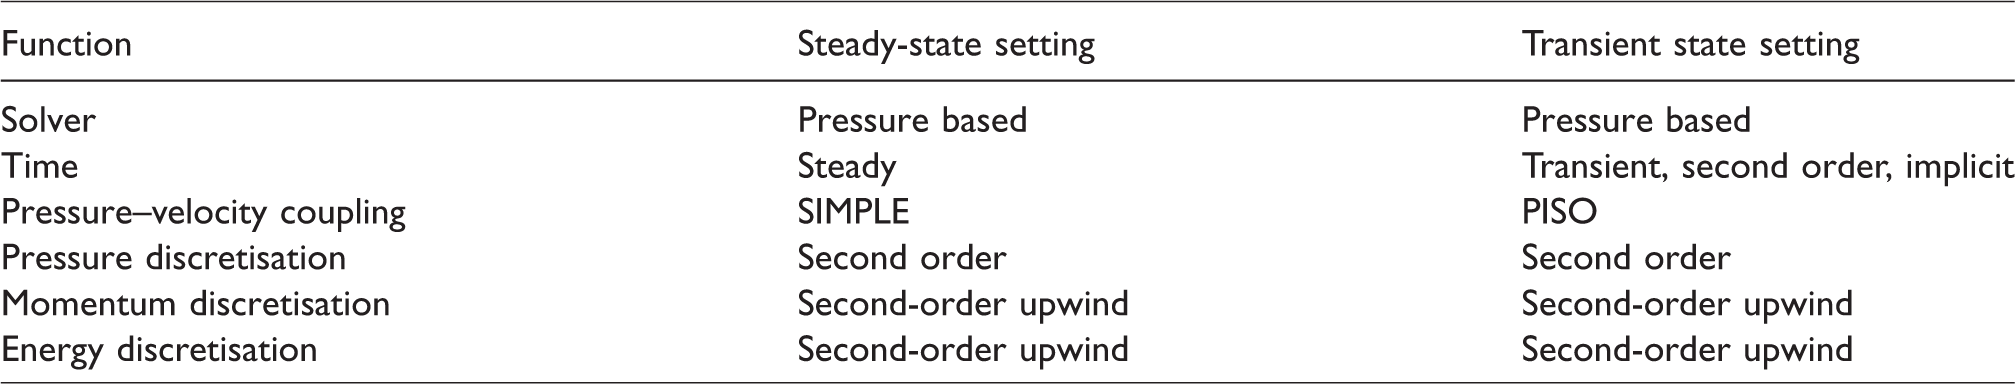
The total time duration is set to 2 s. The time-step of the calculation is set to 0.0001 s thereupon the maximum resolution of 5000 Hz noise signal can be obtained. Because pressure is not stable at the beginning of the simulation, the results between 1 s and 2 s are chosen in the analysis process.
Experiment details
The cavity acoustic wind tunnel experiment was first carried out by Inagaki at a wind speed of 10–42 m/s. 26 In this paper, a test was conducted in an acoustically treated small-scale blown-down wind tunnel located at Ray W. Herrick Laboratories of Purdue University at a speed of 25 m/s. 12 The front and rear ends of the Herrick wind tunnel power section were subjected to corresponding acoustic noise reduction scheme. Corresponding acoustic noise reduction was performed on both the front and the back of the Herrick wind tunnel's power section. As shown in Figure 4, one monitor point at the centre of cavity bottom is considered to validate frequency spectrum with simulation results.
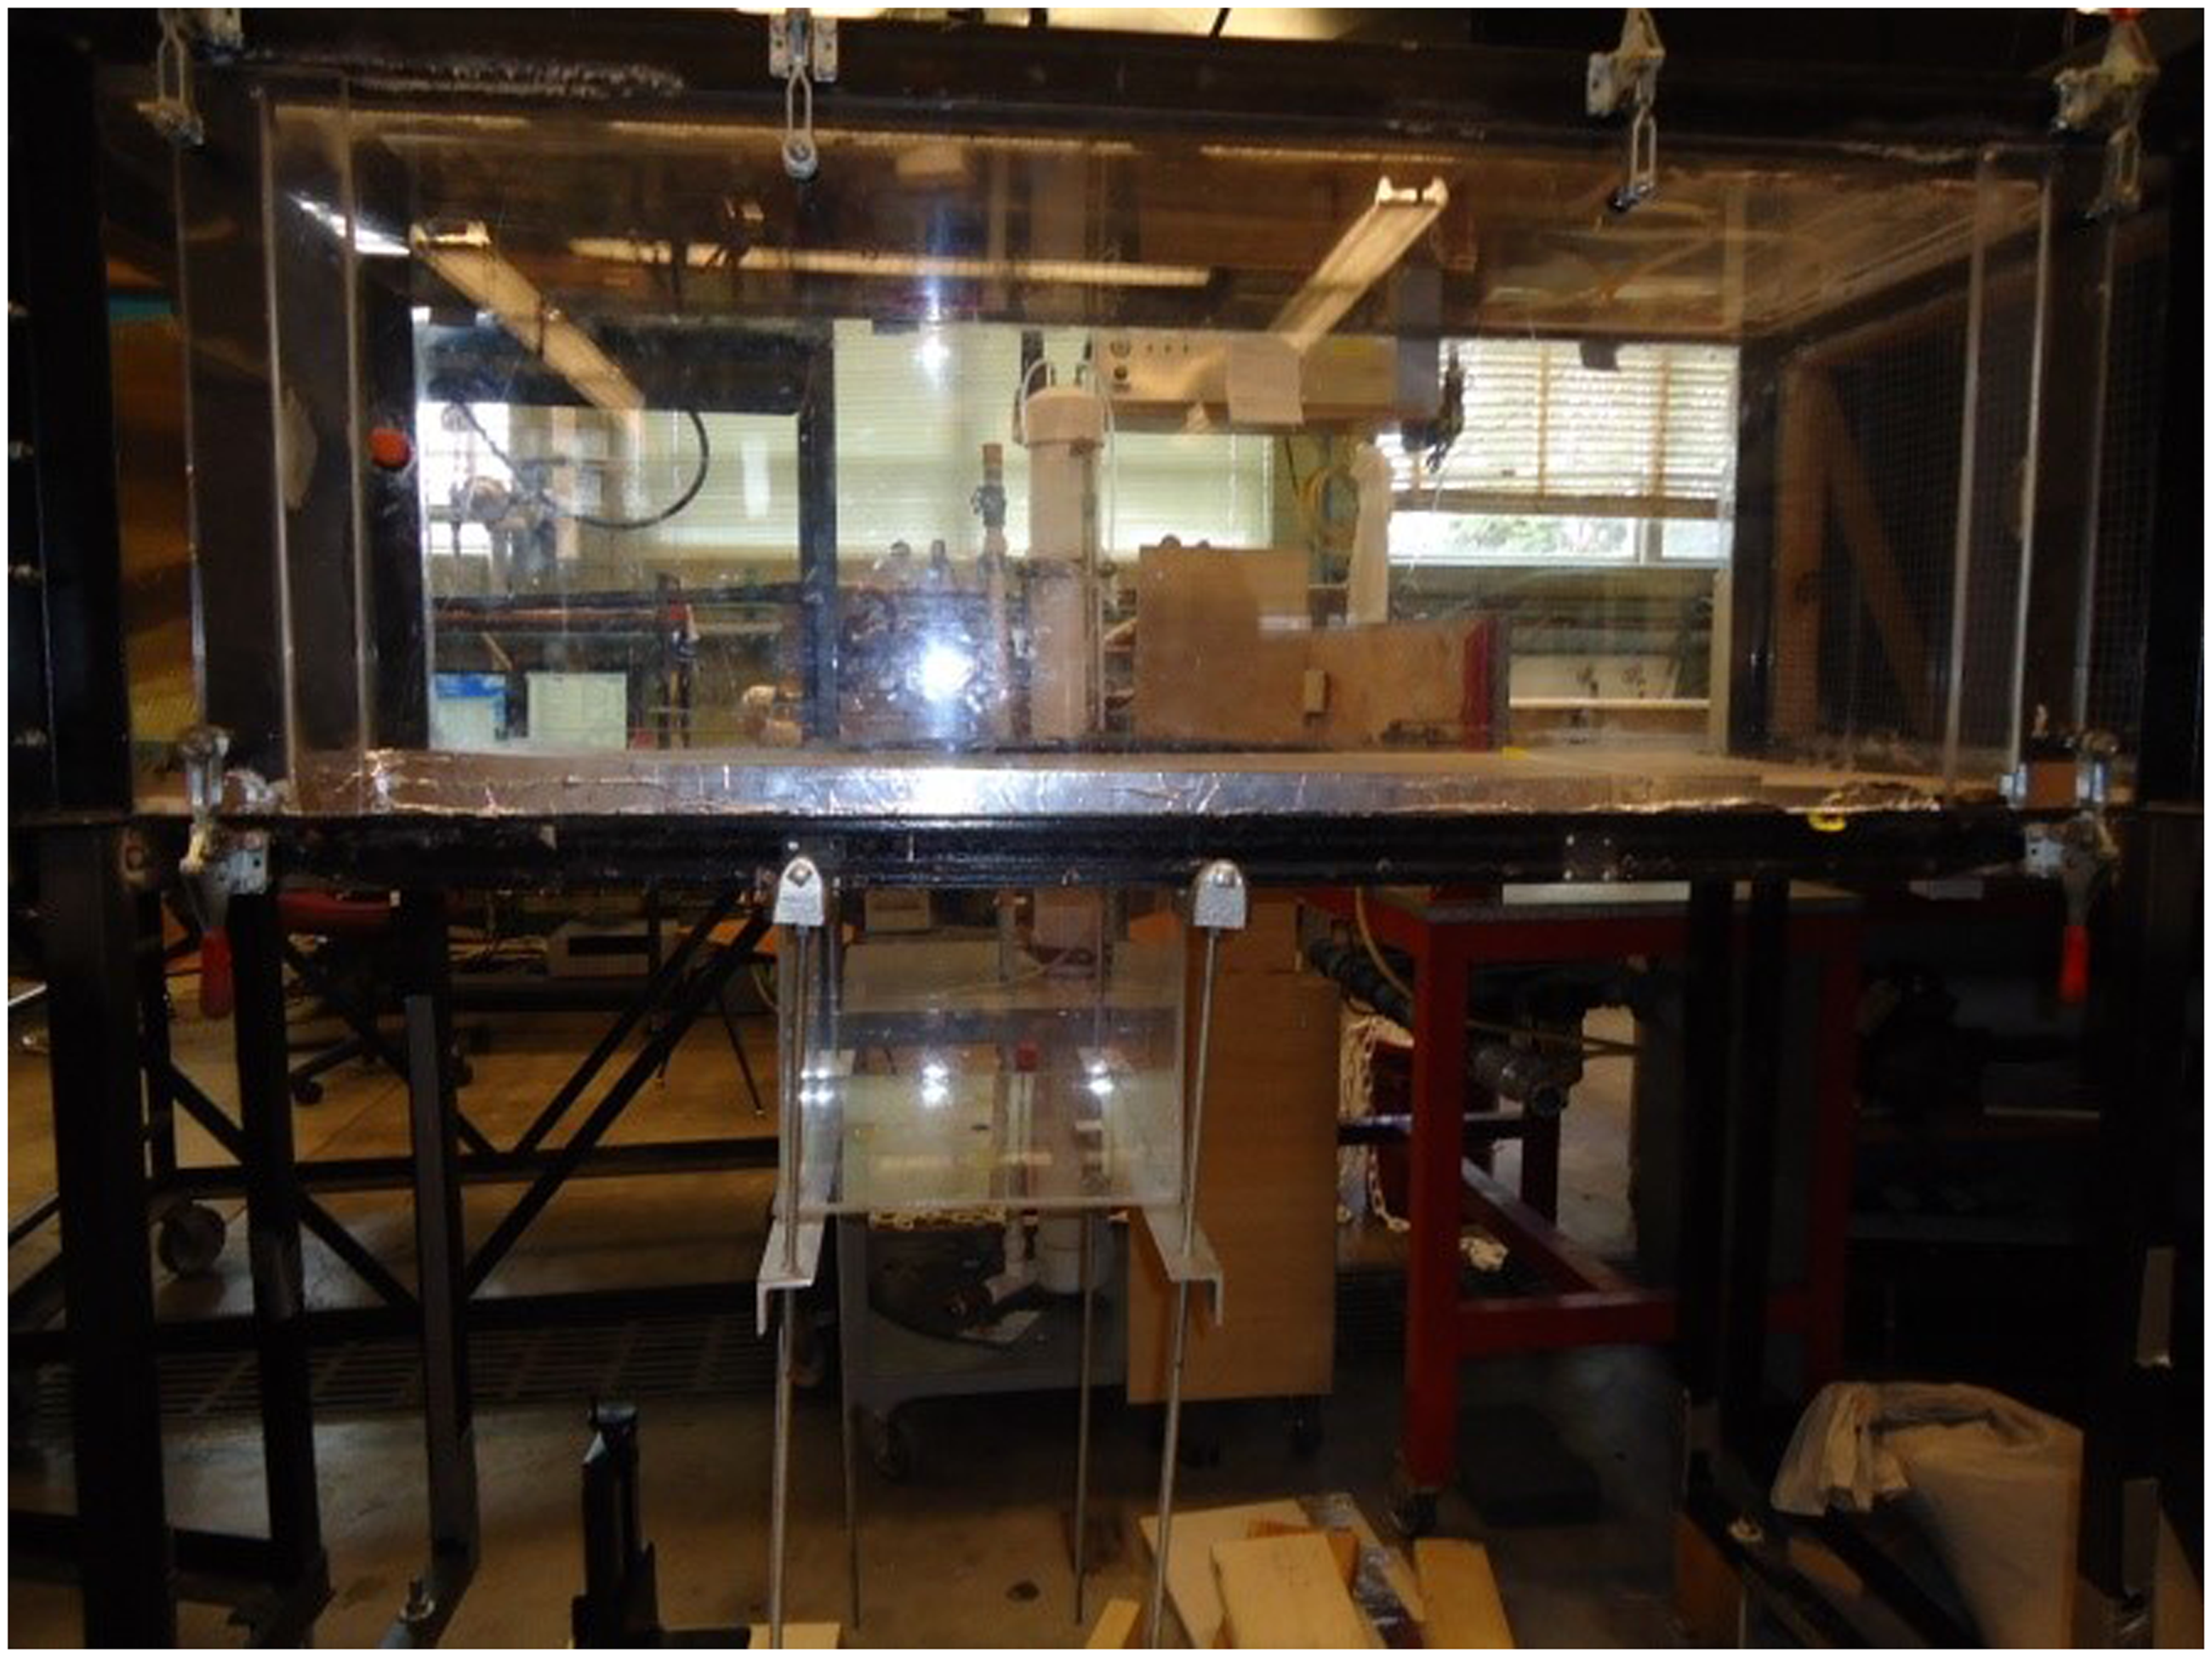
The installation of the cavity in the wind tunnel.
Results and discussion
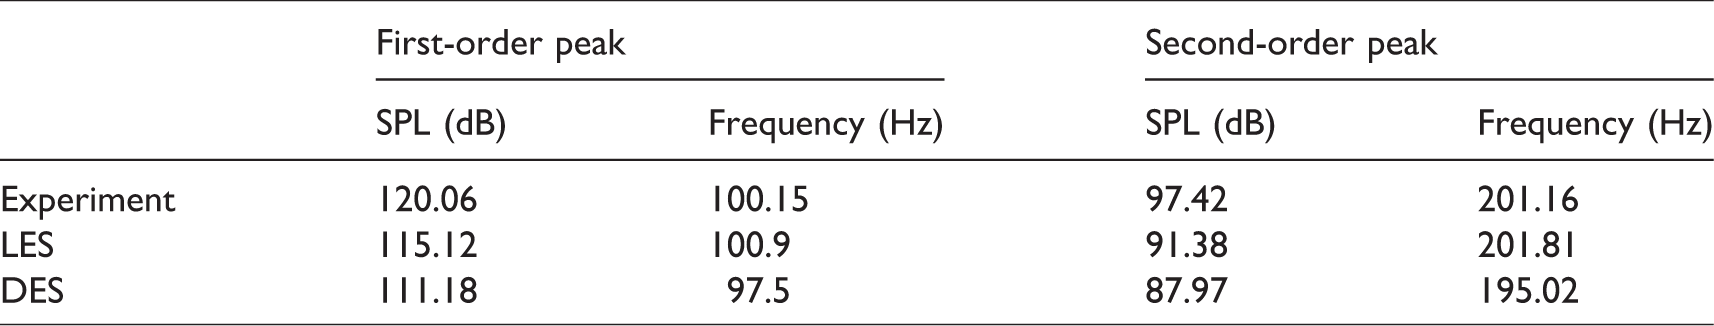
The SPL results within 500 Hz obtained from LES, DES and wind tunnel experiment are shown in Figure 5. Testing velocity is set to 25 m/s. The first-order and second-order peak value of SPL and resonant frequency are summarised in Table 3. From Table 3 and Figure 5, LES methods are apparently more accurate than DES regarding SPL peak value or resonant frequency. The gap between LES and experiment can be explained by the wind tunnel background noise. In conclusion, the good agreement indicates that the application of LES method is valid. Hence, LES method is selected to calculate vehicle side-window buffeting noise in the following research.
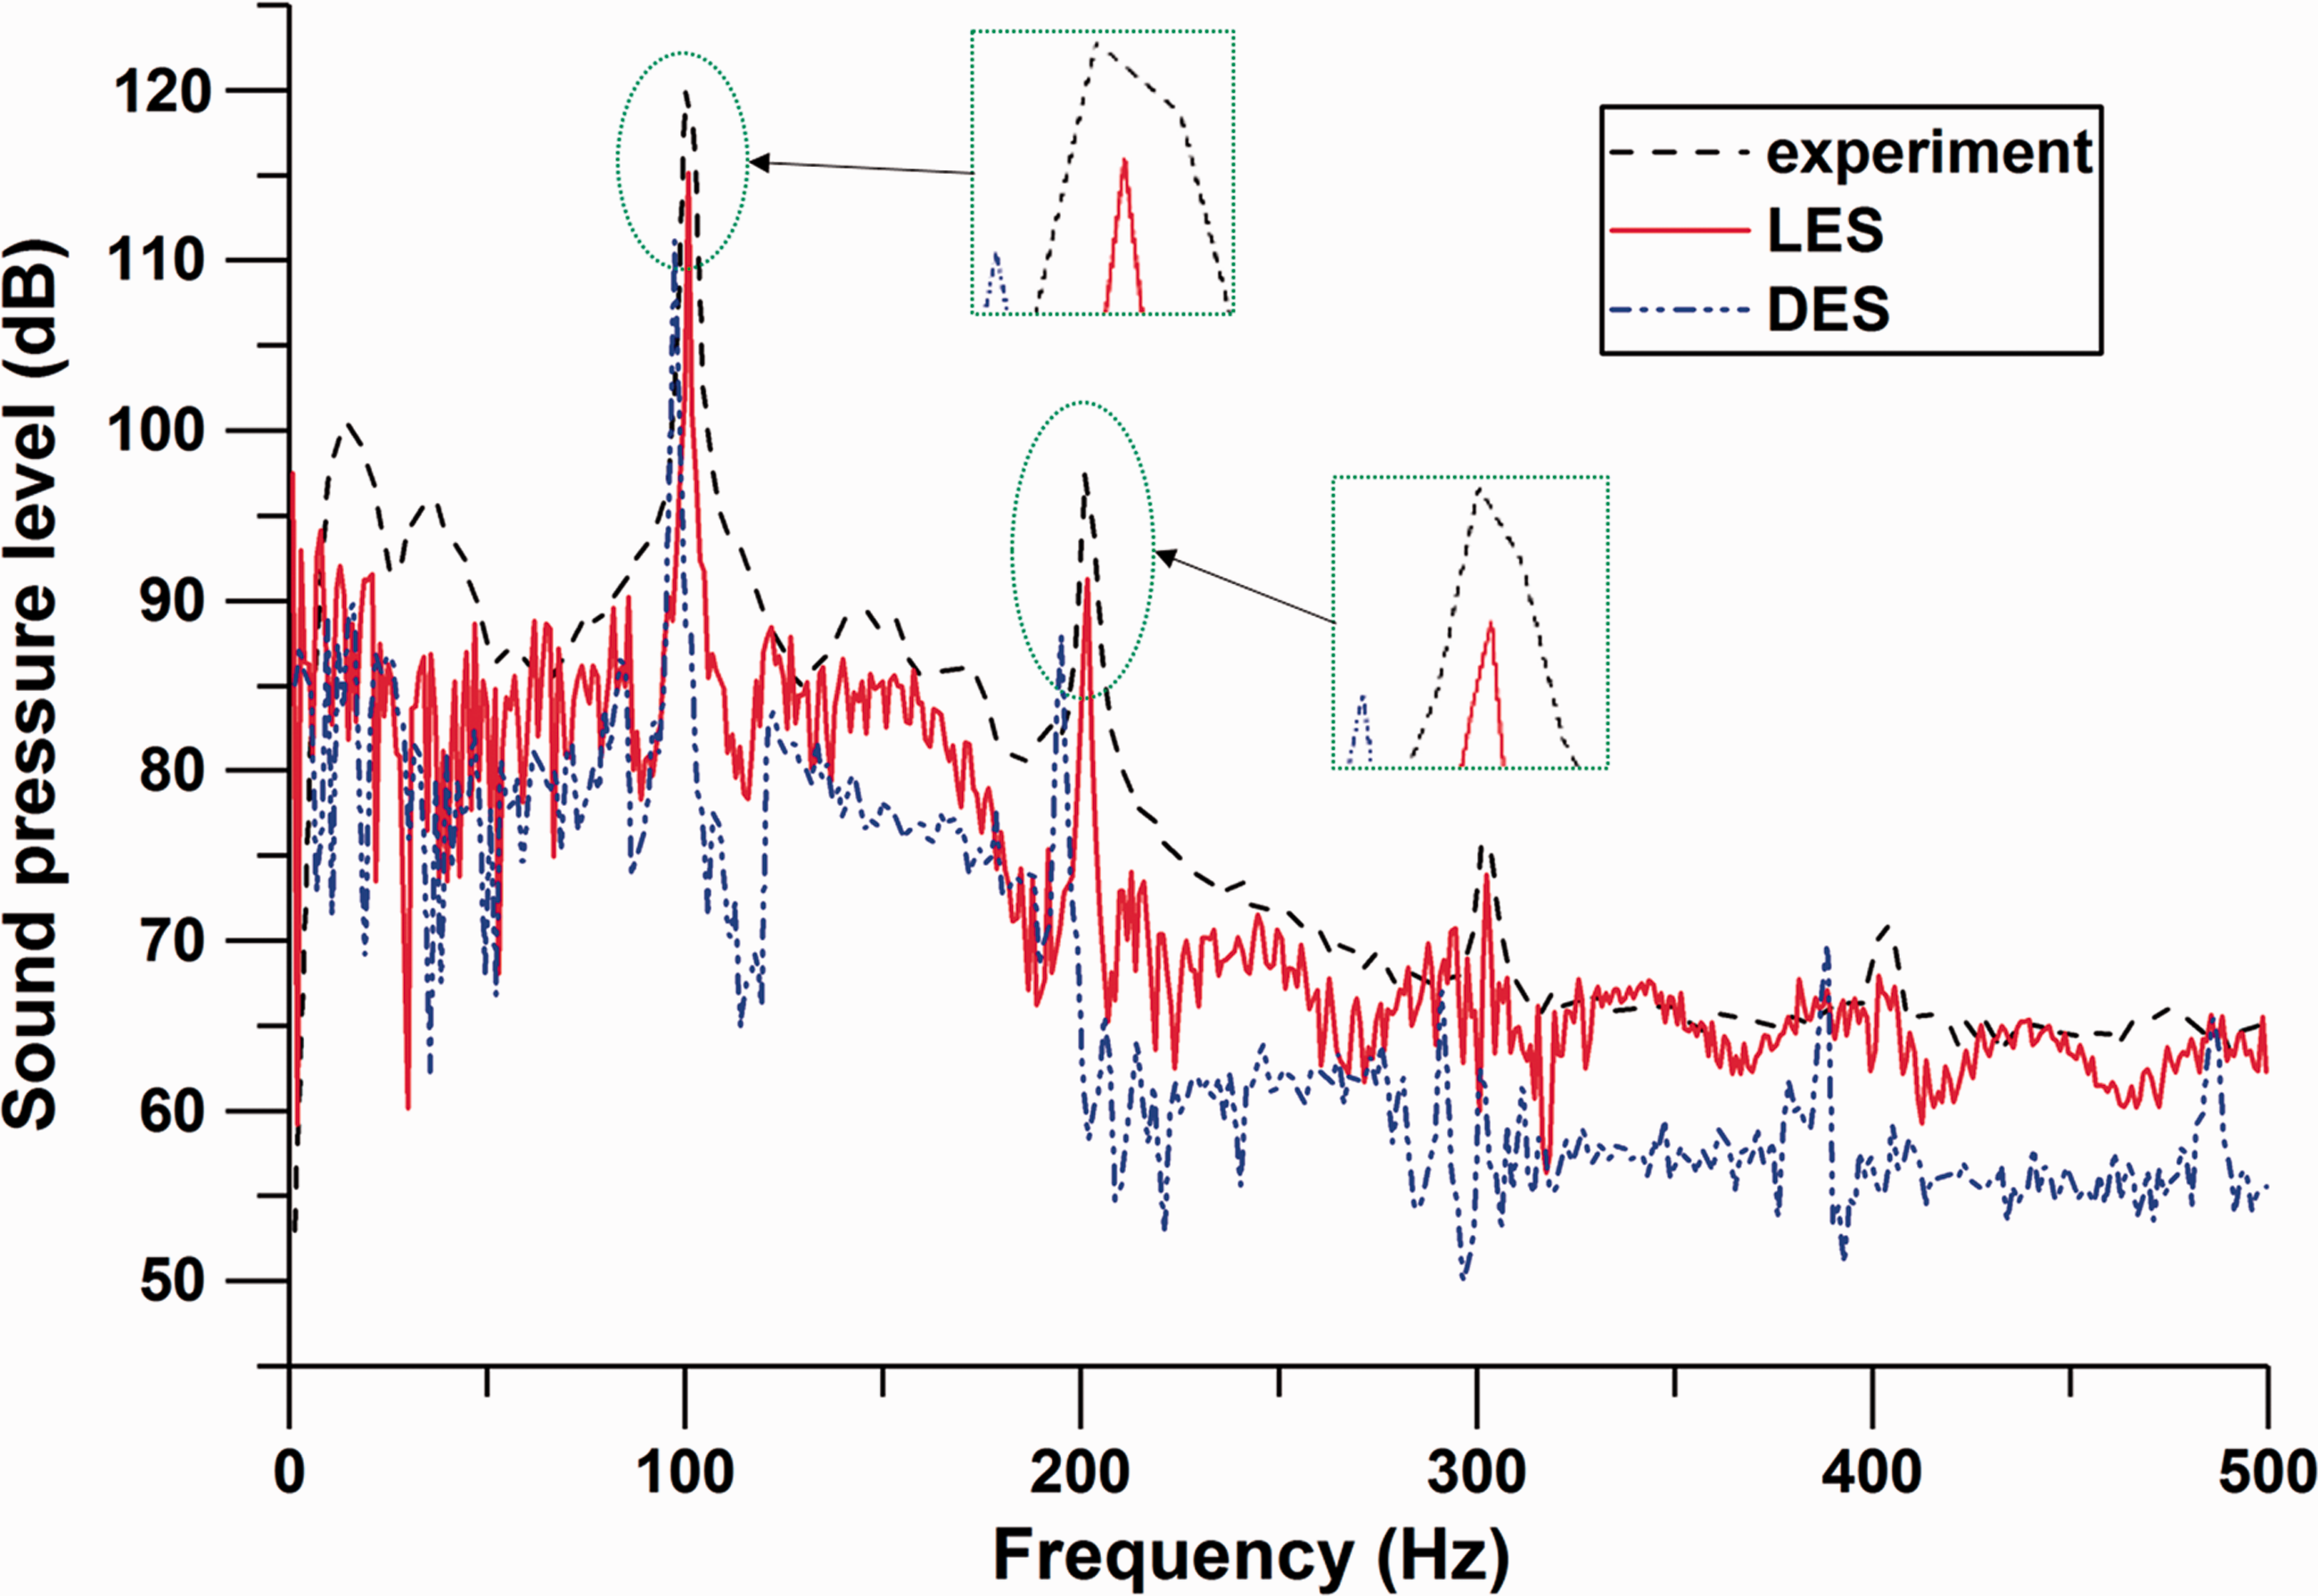
Sound pressure level at receiver location (25 m/s).
Comparison of SPL peak value and resonant frequency.
Simulation of automobile side-window buffeting noise
Geometry and grid details
Accurate numerical simulation of wind buffeting noise is the premise and basis for calculating the objective parameters of SQE. The shape, interior and driver model of the properly simplified vehicle which was selected in the simulation can be seen in Figure 6(a) to (c), respectively. Due to the complexity of the actual vehicle model, the vehicle model omits the details of the grille, wheel hub, door handle, lamp group and exhaust pipe, keeping the remaining features. The length, width, and height of the vehicle are 5 m, 1.8 m, 1.7 m, respectively. In order to ensure the complete development of the flow field and the accuracy of the calculation, the size of calculation domain should be reasonably designed. 27 In this paper, the size of calculation domain is 55 m × 13 m × 8.5 m. Vehicle position in the computational domain is shown in Figure 6(d). In the CFD simulation, the inlet and outlet are set as velocity-inlet and pressure-outlet, respectively. The solver setting of steady state and transient state is shown in Table 2. The mesh size of the sensitive areas such as the A-pillar and the rear-view mirror, rest surfaces of the vehicle and boundary surfaces are set to 4 mm, 16 mm and 128 mm, respectively. The total polyhedron grid meshes utilised for the computational domain is roughly 3 million. Since the calculation is affected by boundary layers, 13 five layers of prism grid attached to the car body are constructed with the total thickness of 8 mm and the first layer of 1 mm. Mesh distribution of the longitudinal section and vehicle surface mesh with the front window opened is shown in Figure 7.
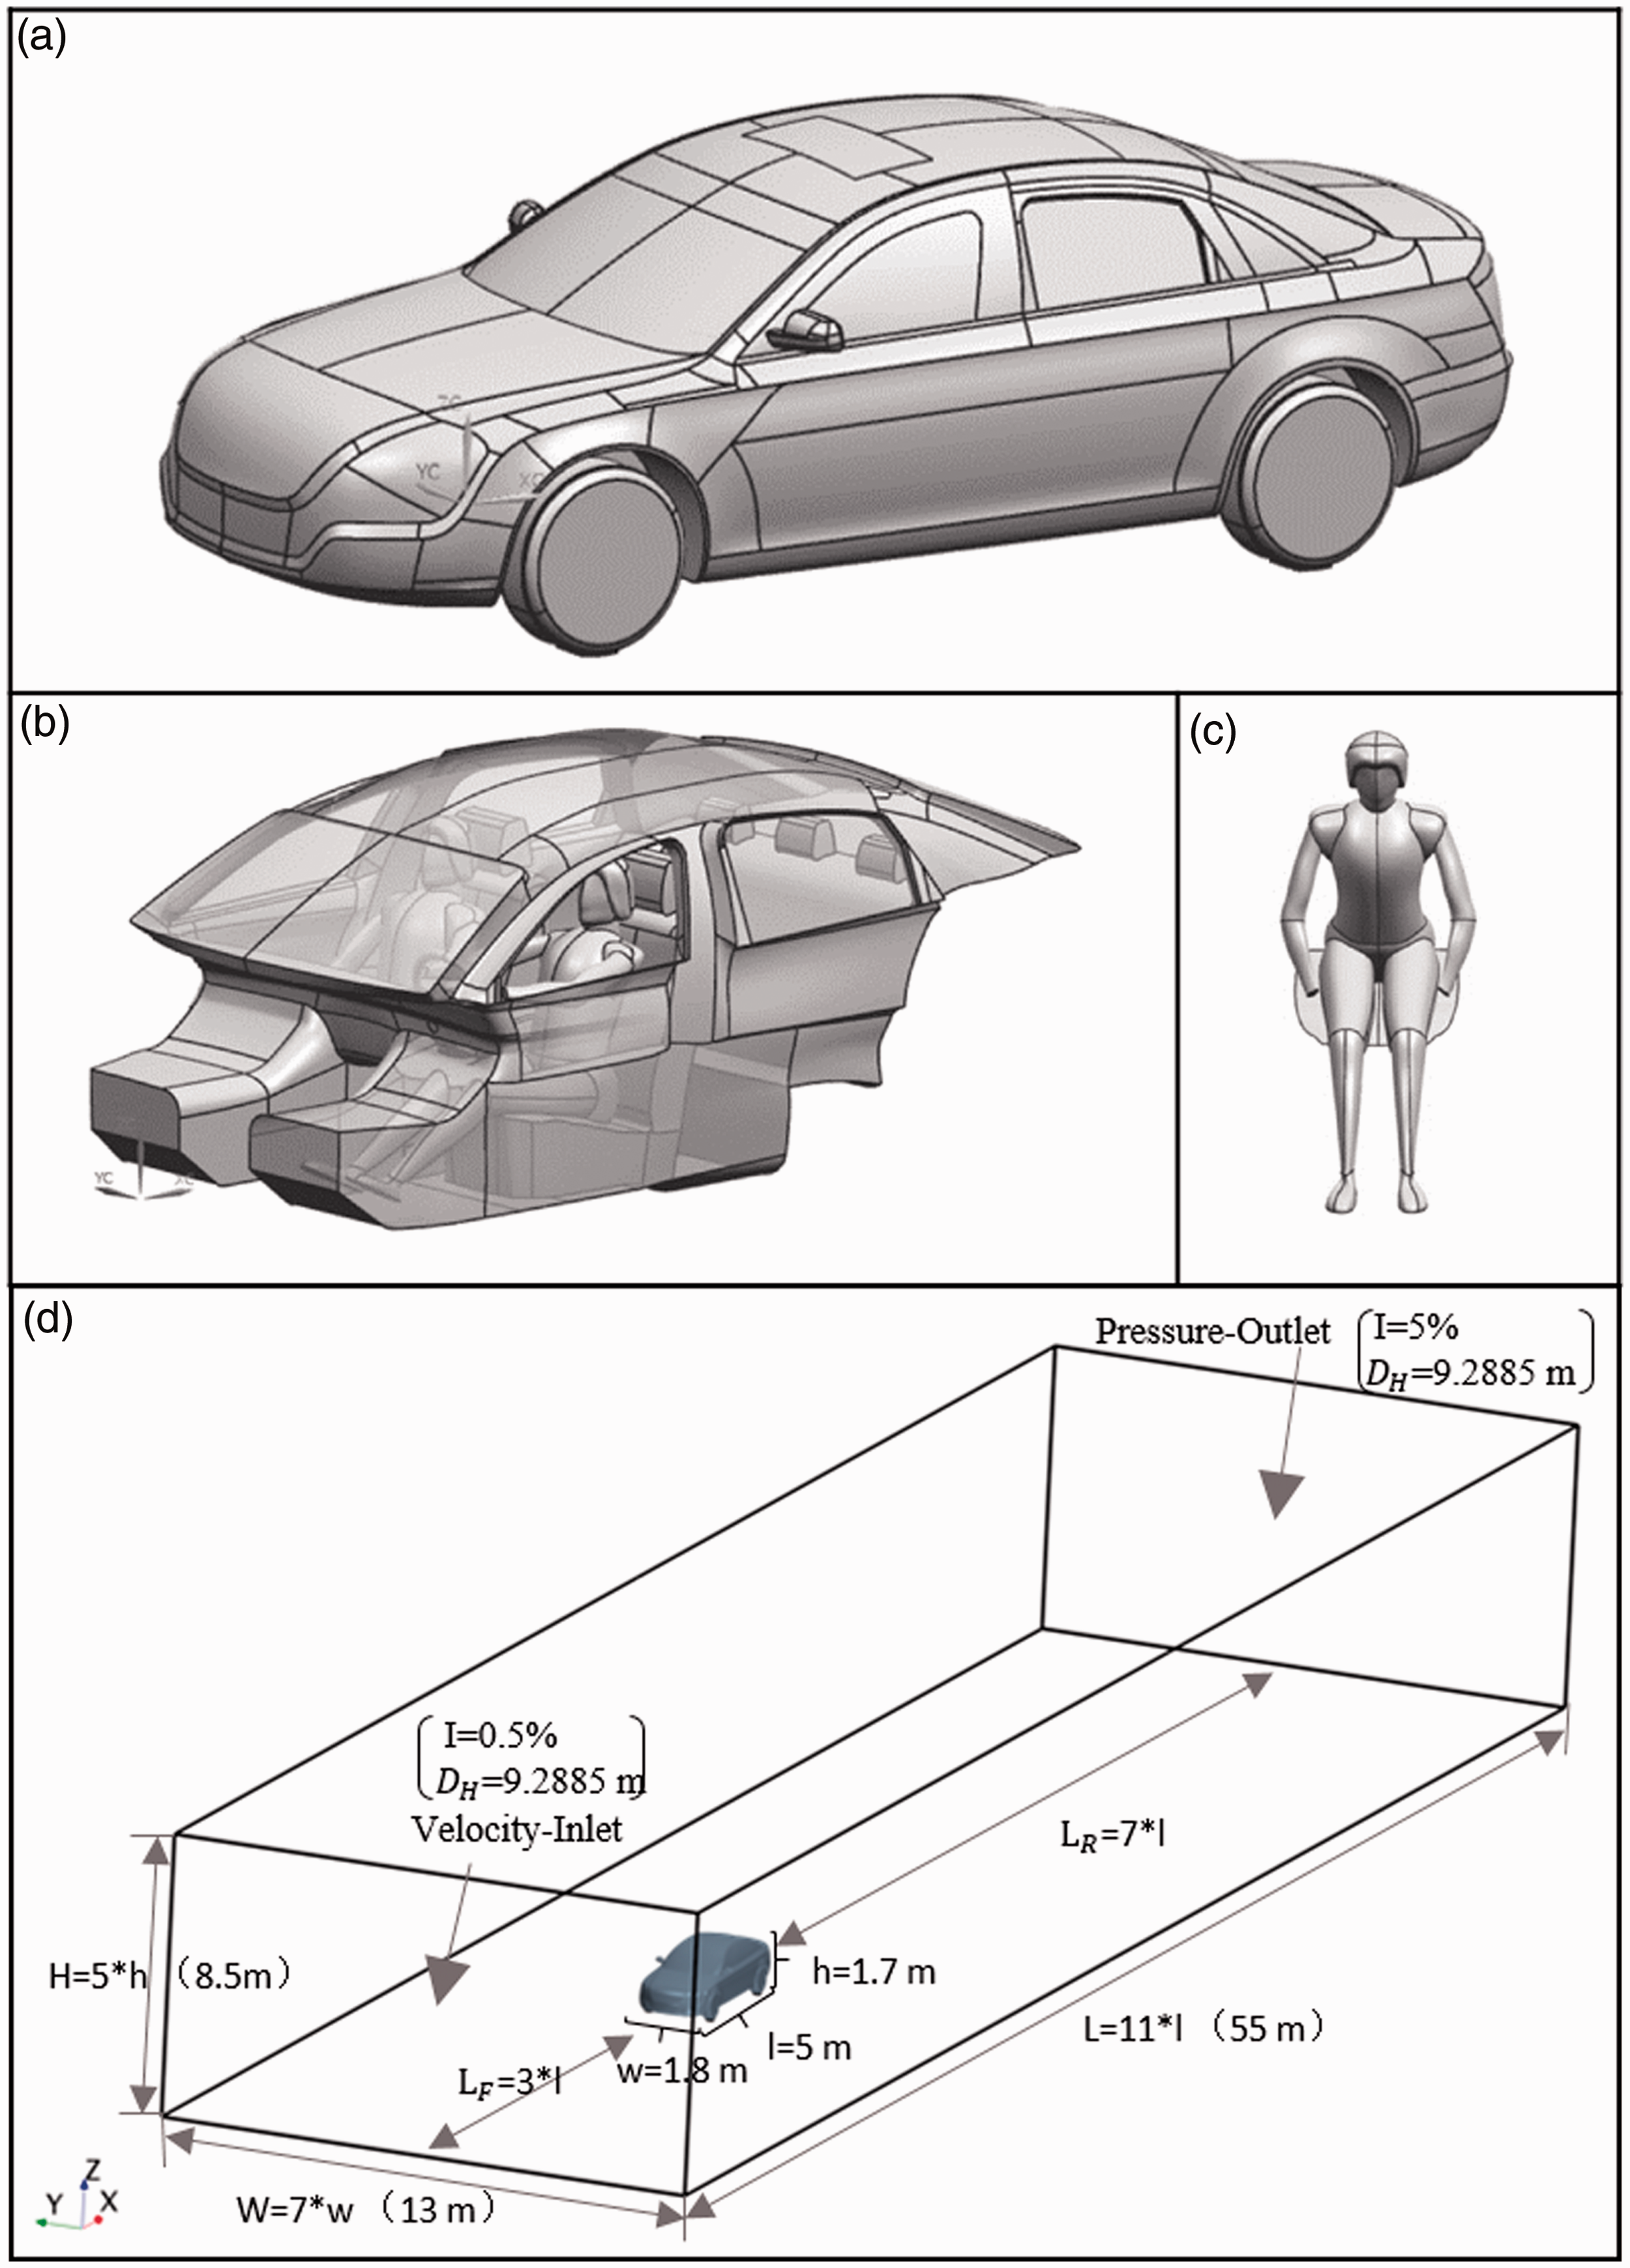
Shape (a), interior (b), and driver model (c) of the vehicle and vehicle position in the calculation domain (d).
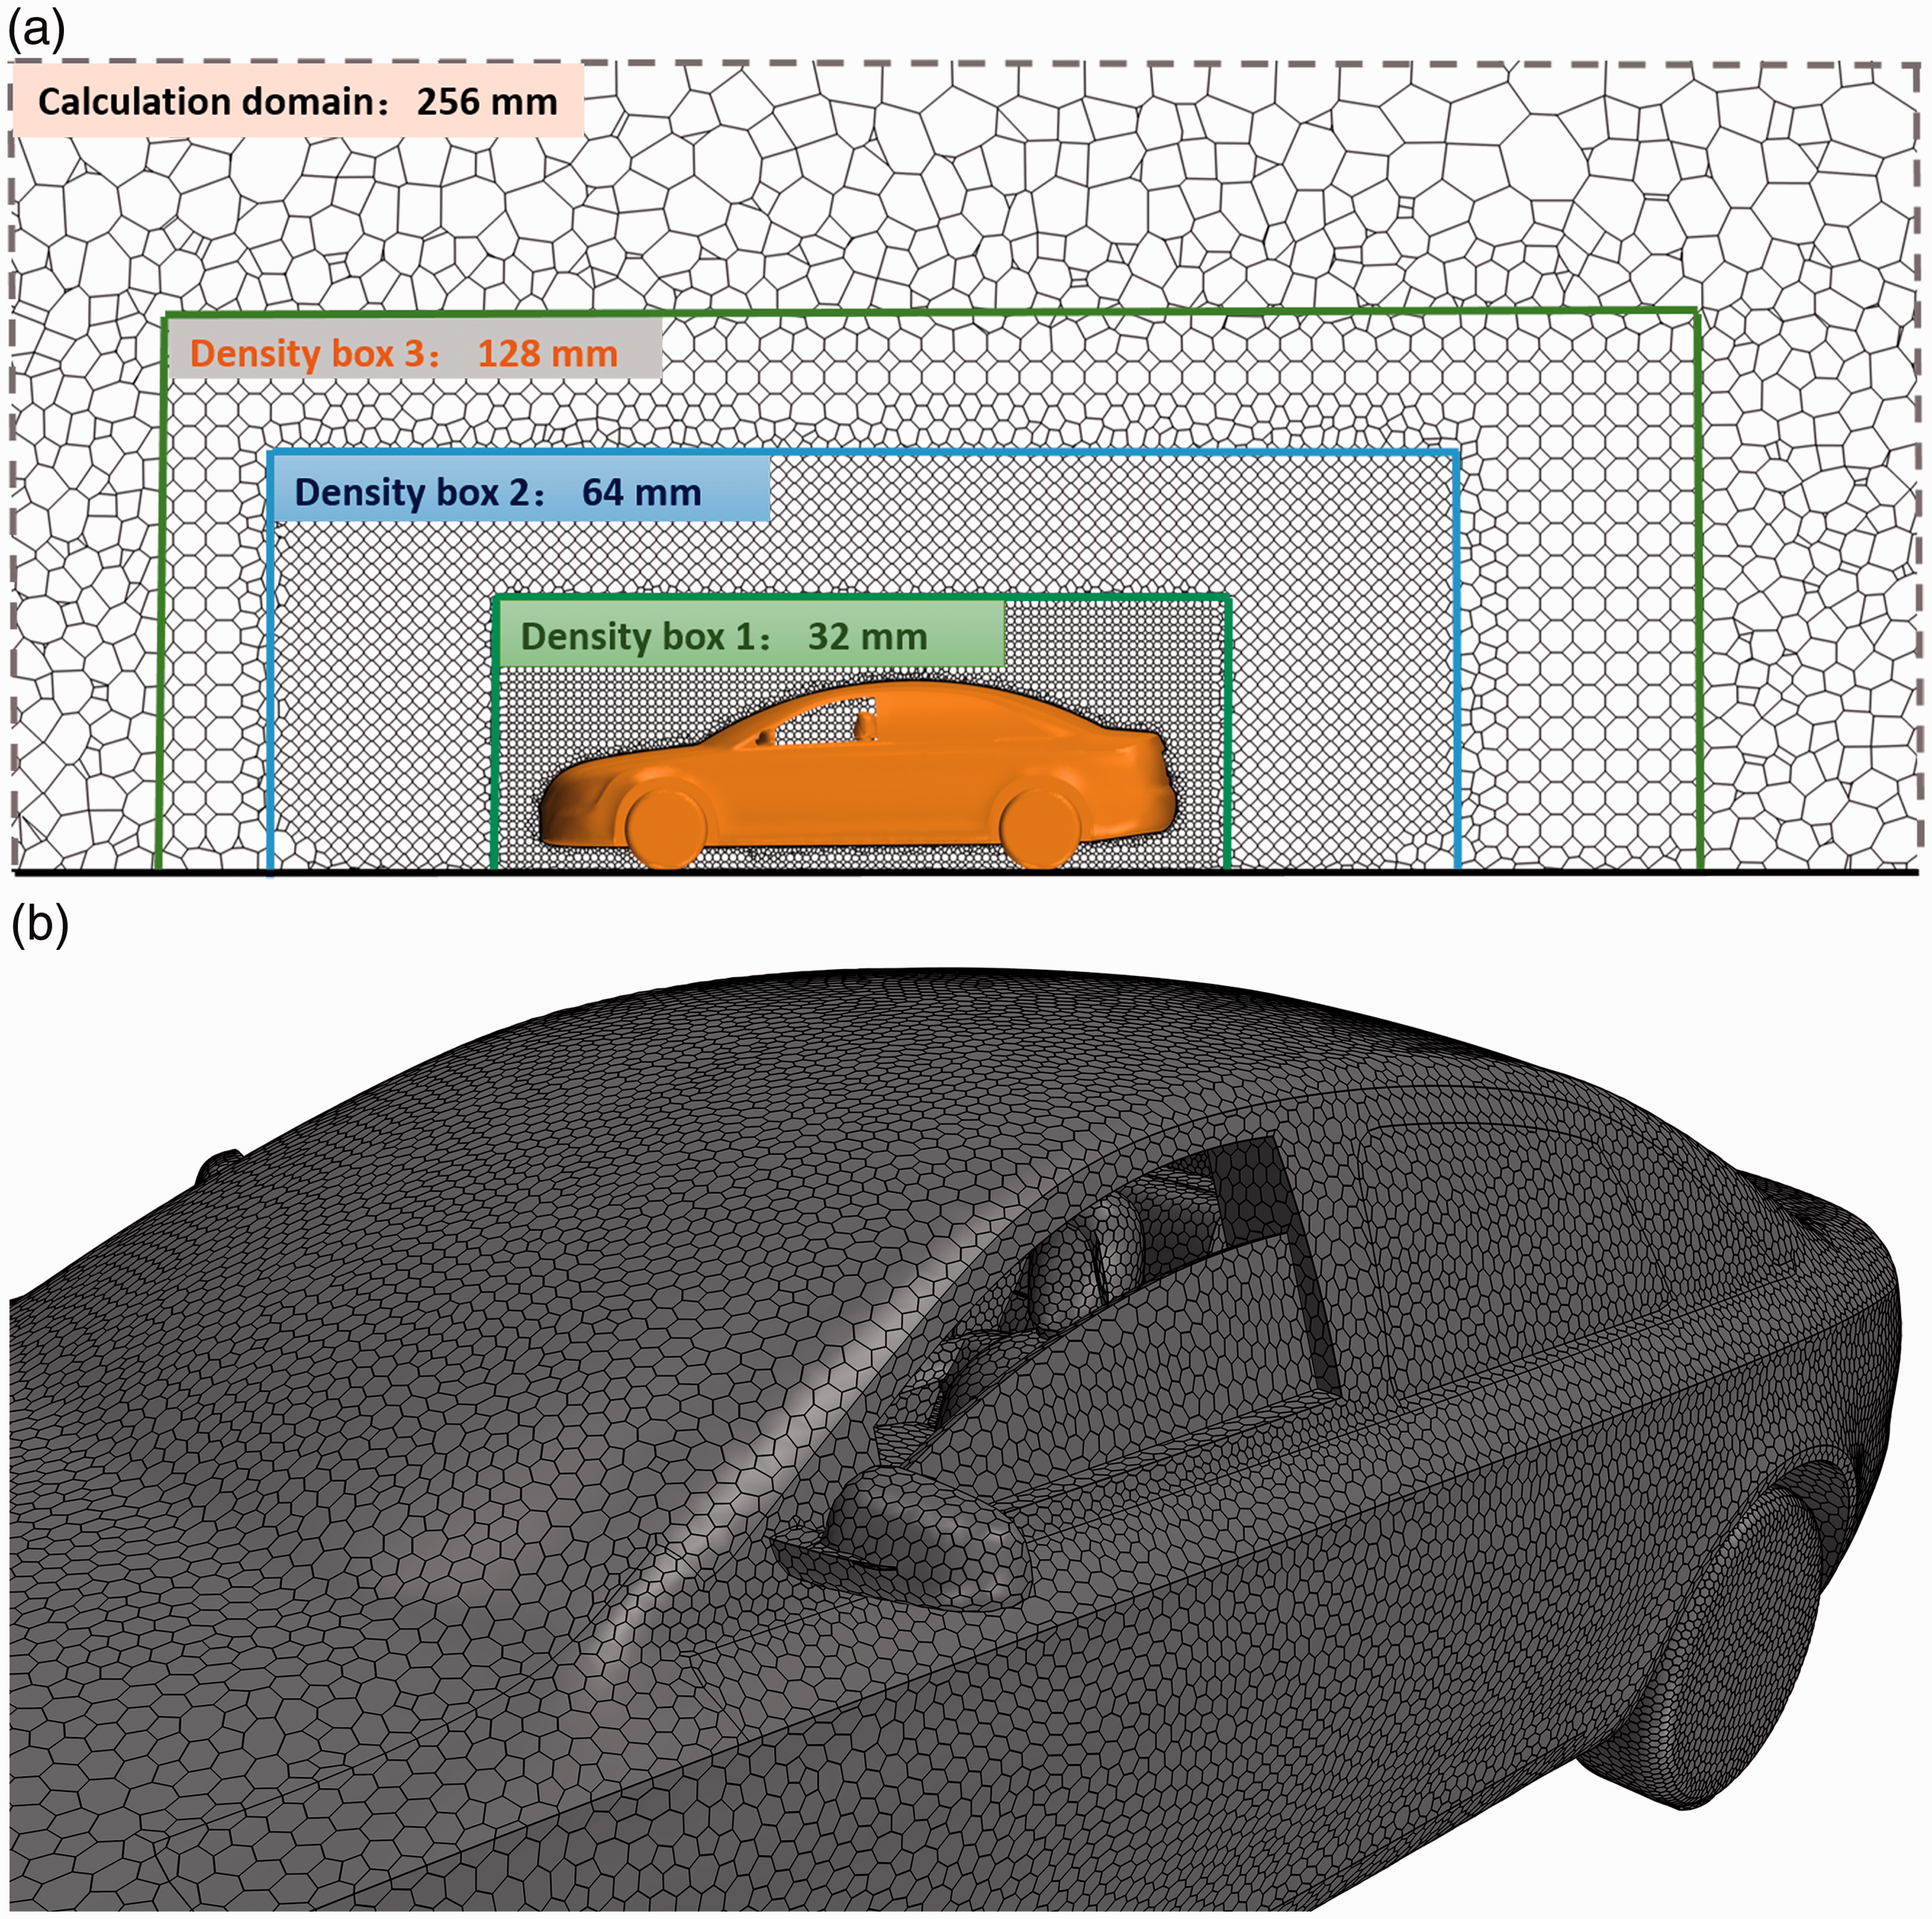
Mesh distribution of the longitudinal section (a) and surface mesh with the left front window partially opened (b).
According to the previous study, the wind buffeting noise is more noticeable when the left front or left rear side-window is opened. Hence this research focuses on these two windows. Test vehicle window along the B-column height is 400 mm. The left front window is set to five opening conditions. The left rear window can only be opened 80% in the road test, and four opening conditions are set. Under the conditions of each window opening degree, simulation was conducted at 70 km/h, 80 km/h, 90 km/h, 100 km/h, 110 km/h, respectively. So a total of 45 simulations will be done.
Road test details
The vehicle road test method is to accelerate the vehicle to the test velocity, then shut down the engine and measure the aerodynamic noise inside the vehicle while off-taxiing.
28
Road tests were performed to verify the accuracy of the simulation results. In order to reduce the impact of the environment on the test accuracy, the following requirements should be satisfied:
Sunny weather, no wind or breeze. Straight, flat, dry and long enough road surface. The background noise level should be at least 10 dB lower than the noise of the vehicle under test.
The necessary test devices and microphone arrangement can be observed in Figure 8. The test Lab equipment of LMS company in Belgium integrates Test Lab 7A software analysis system and Scadas mobile data collector equipment with 16 channels (Figure 8(a)). The position of microphone measuring points is arranged as shown in Figure 8(b). The ruler was stuck on the window to facilitate the quick adjustment of the side window to the corresponding opening condition during driving.
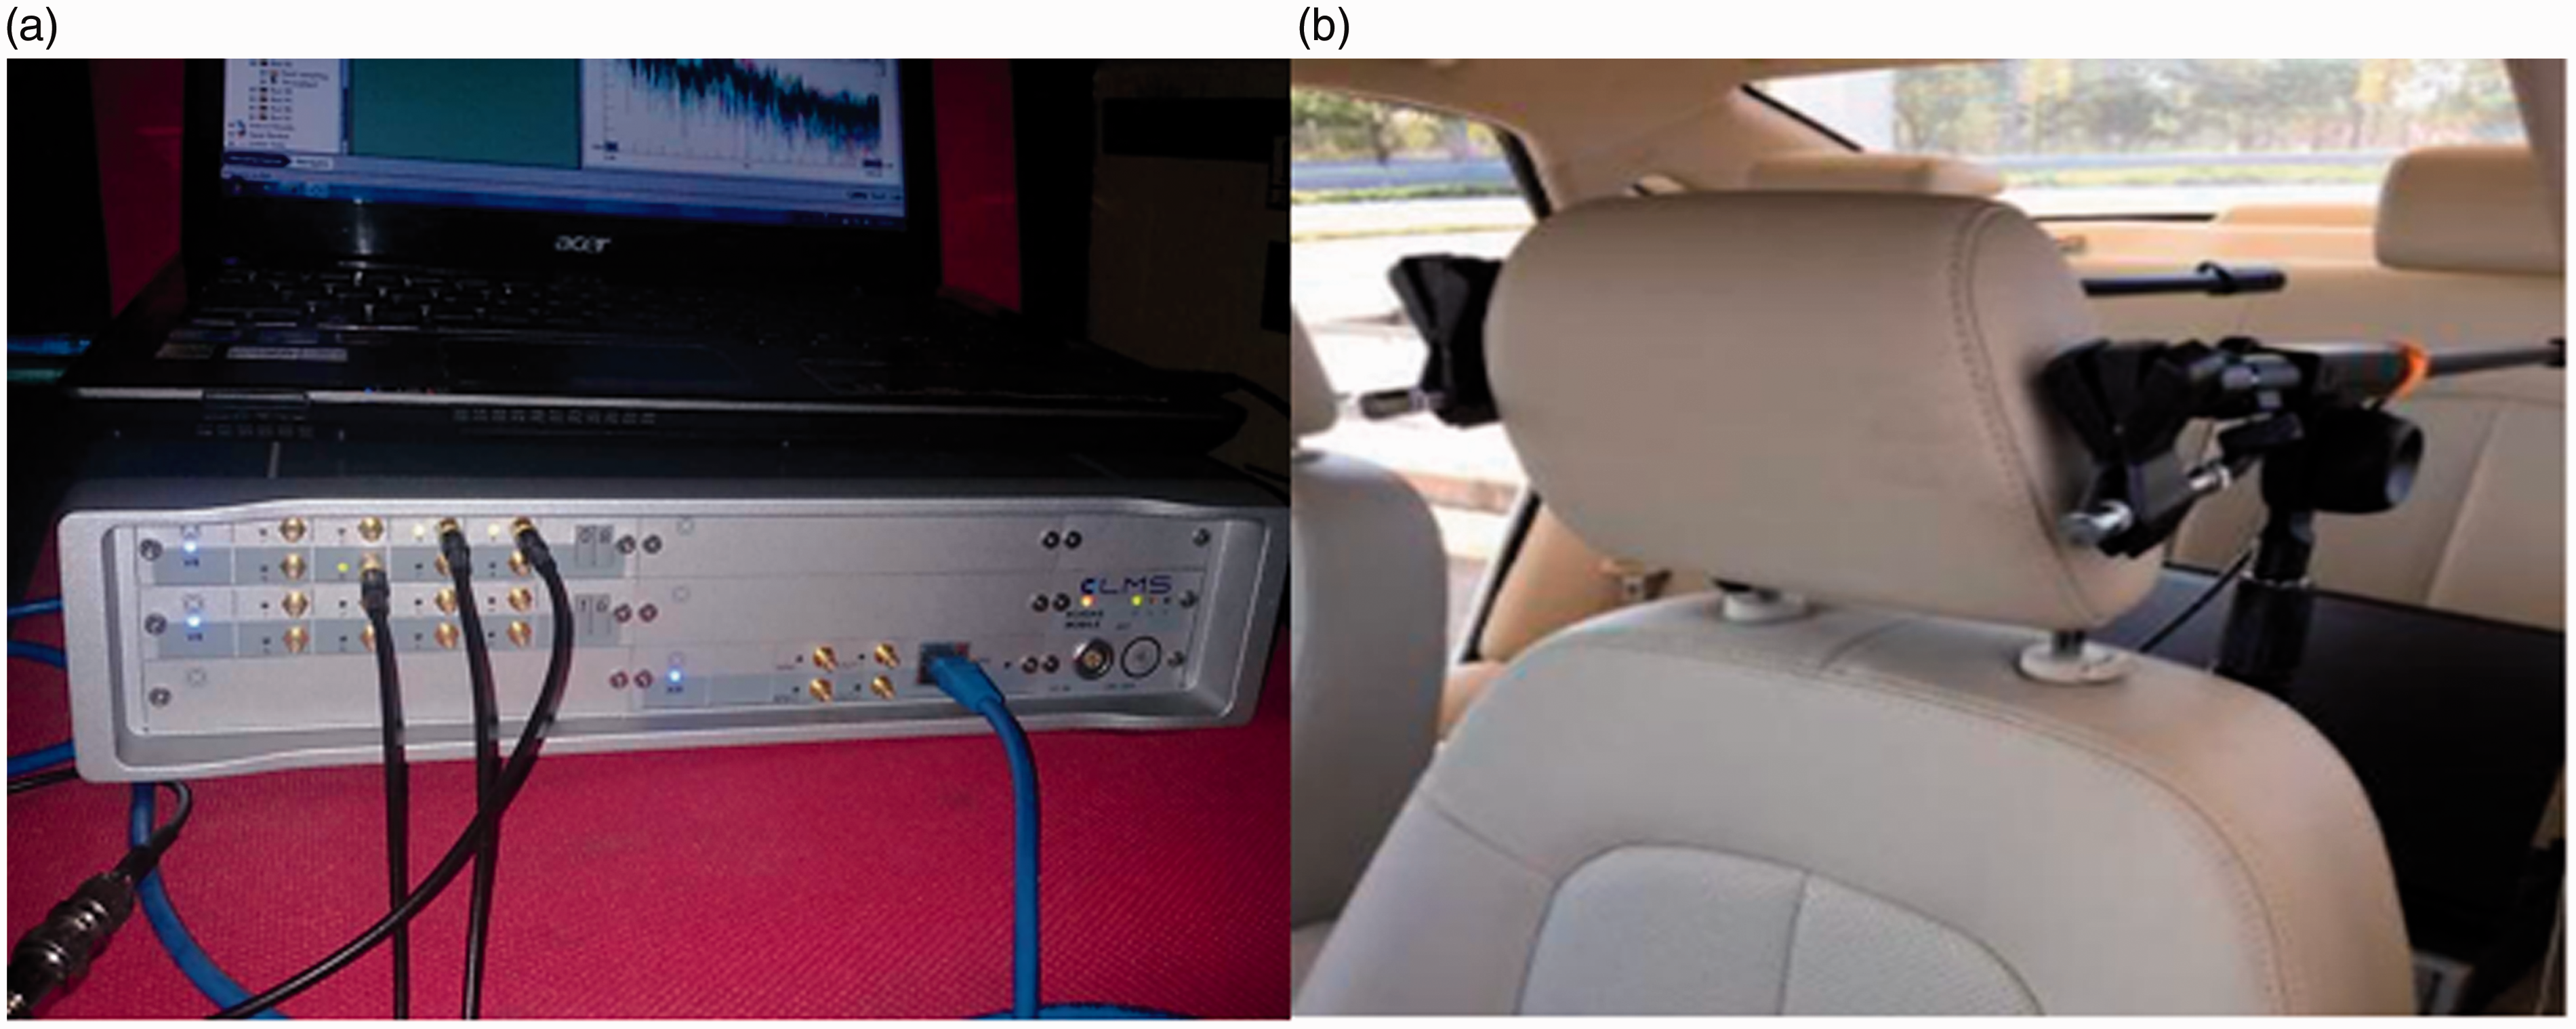
Road test devices (a) and the fixation of microphones in the car (b).
Results and discussion
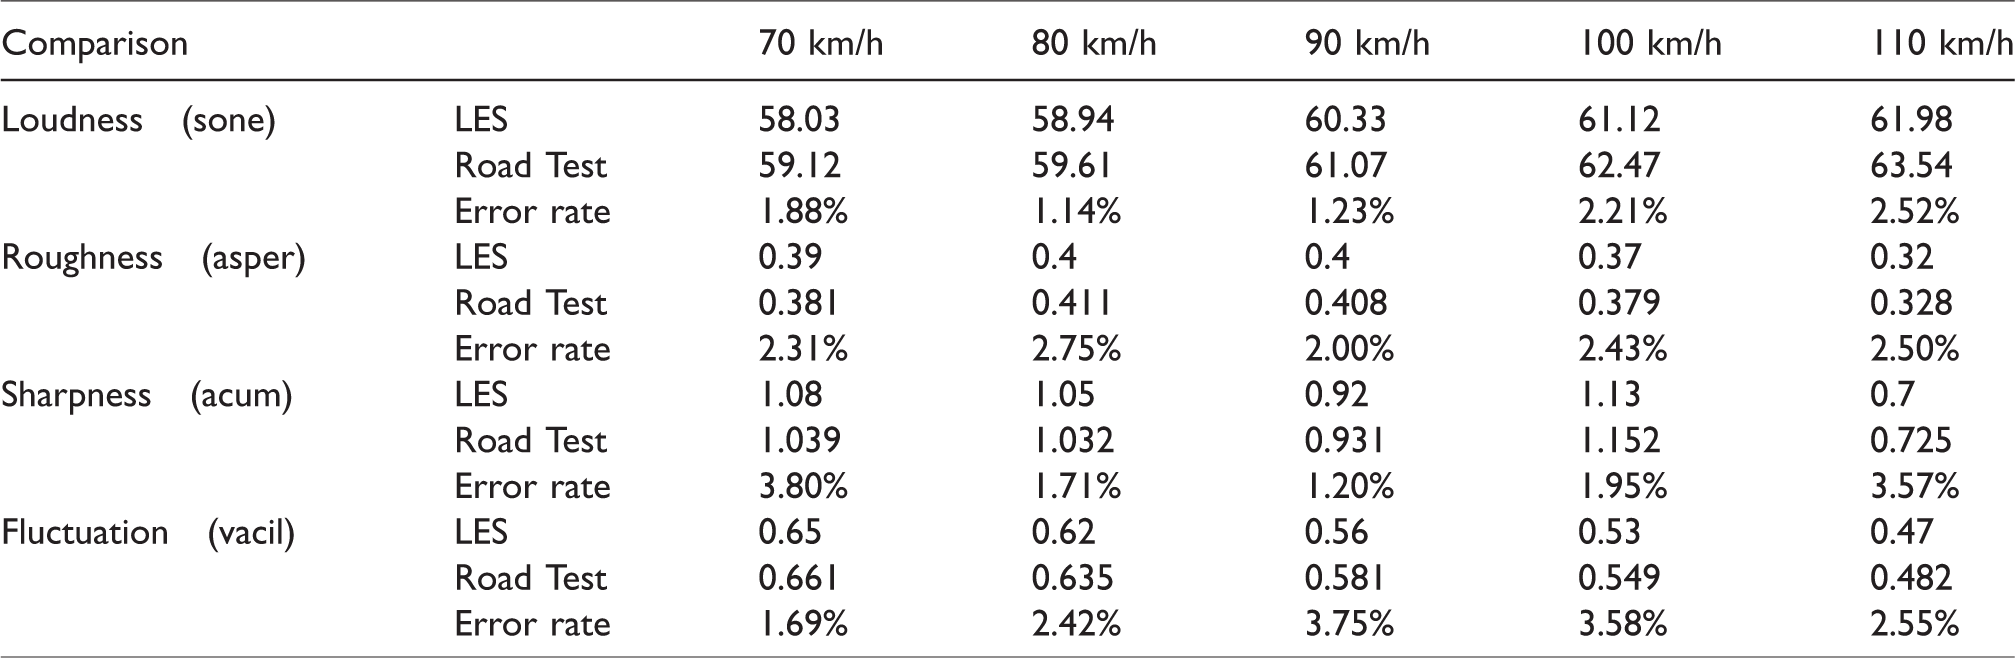
The monitoring point is set at the driver's left and right ear in the simulation to receive pressure fluctuations. However, the SPL of the left ear and right ear are not much different. Thus the analysis is only executed on the left ear in the following research. Figure 9 and Table 4 shows the comparison of SPL, loudness, roughness, sharpness, fluctuation between simulation and road test when the left rear window is 80% opened. From Figure 9, it can be seen that the SPL of wind buffeting noise is much higher below 50 Hz which also shows that the energy of side-window buffeting mainly concentrates on the low frequency. The results of LES also demonstrate that the first-order peak value of SPL reaches 115.64 dB at 16.9 Hz (resonant frequency). The road test results reveal that the first-order peak frequency of SPL reaches 119.5 dB at 18.8 Hz. From Table 4, it can be found that the error rate of all comparisons is within 4%. The contrast indicates that the calculation error between road test and simulation is within the allowable range, which manifests the accuracy and credibility of LES again.
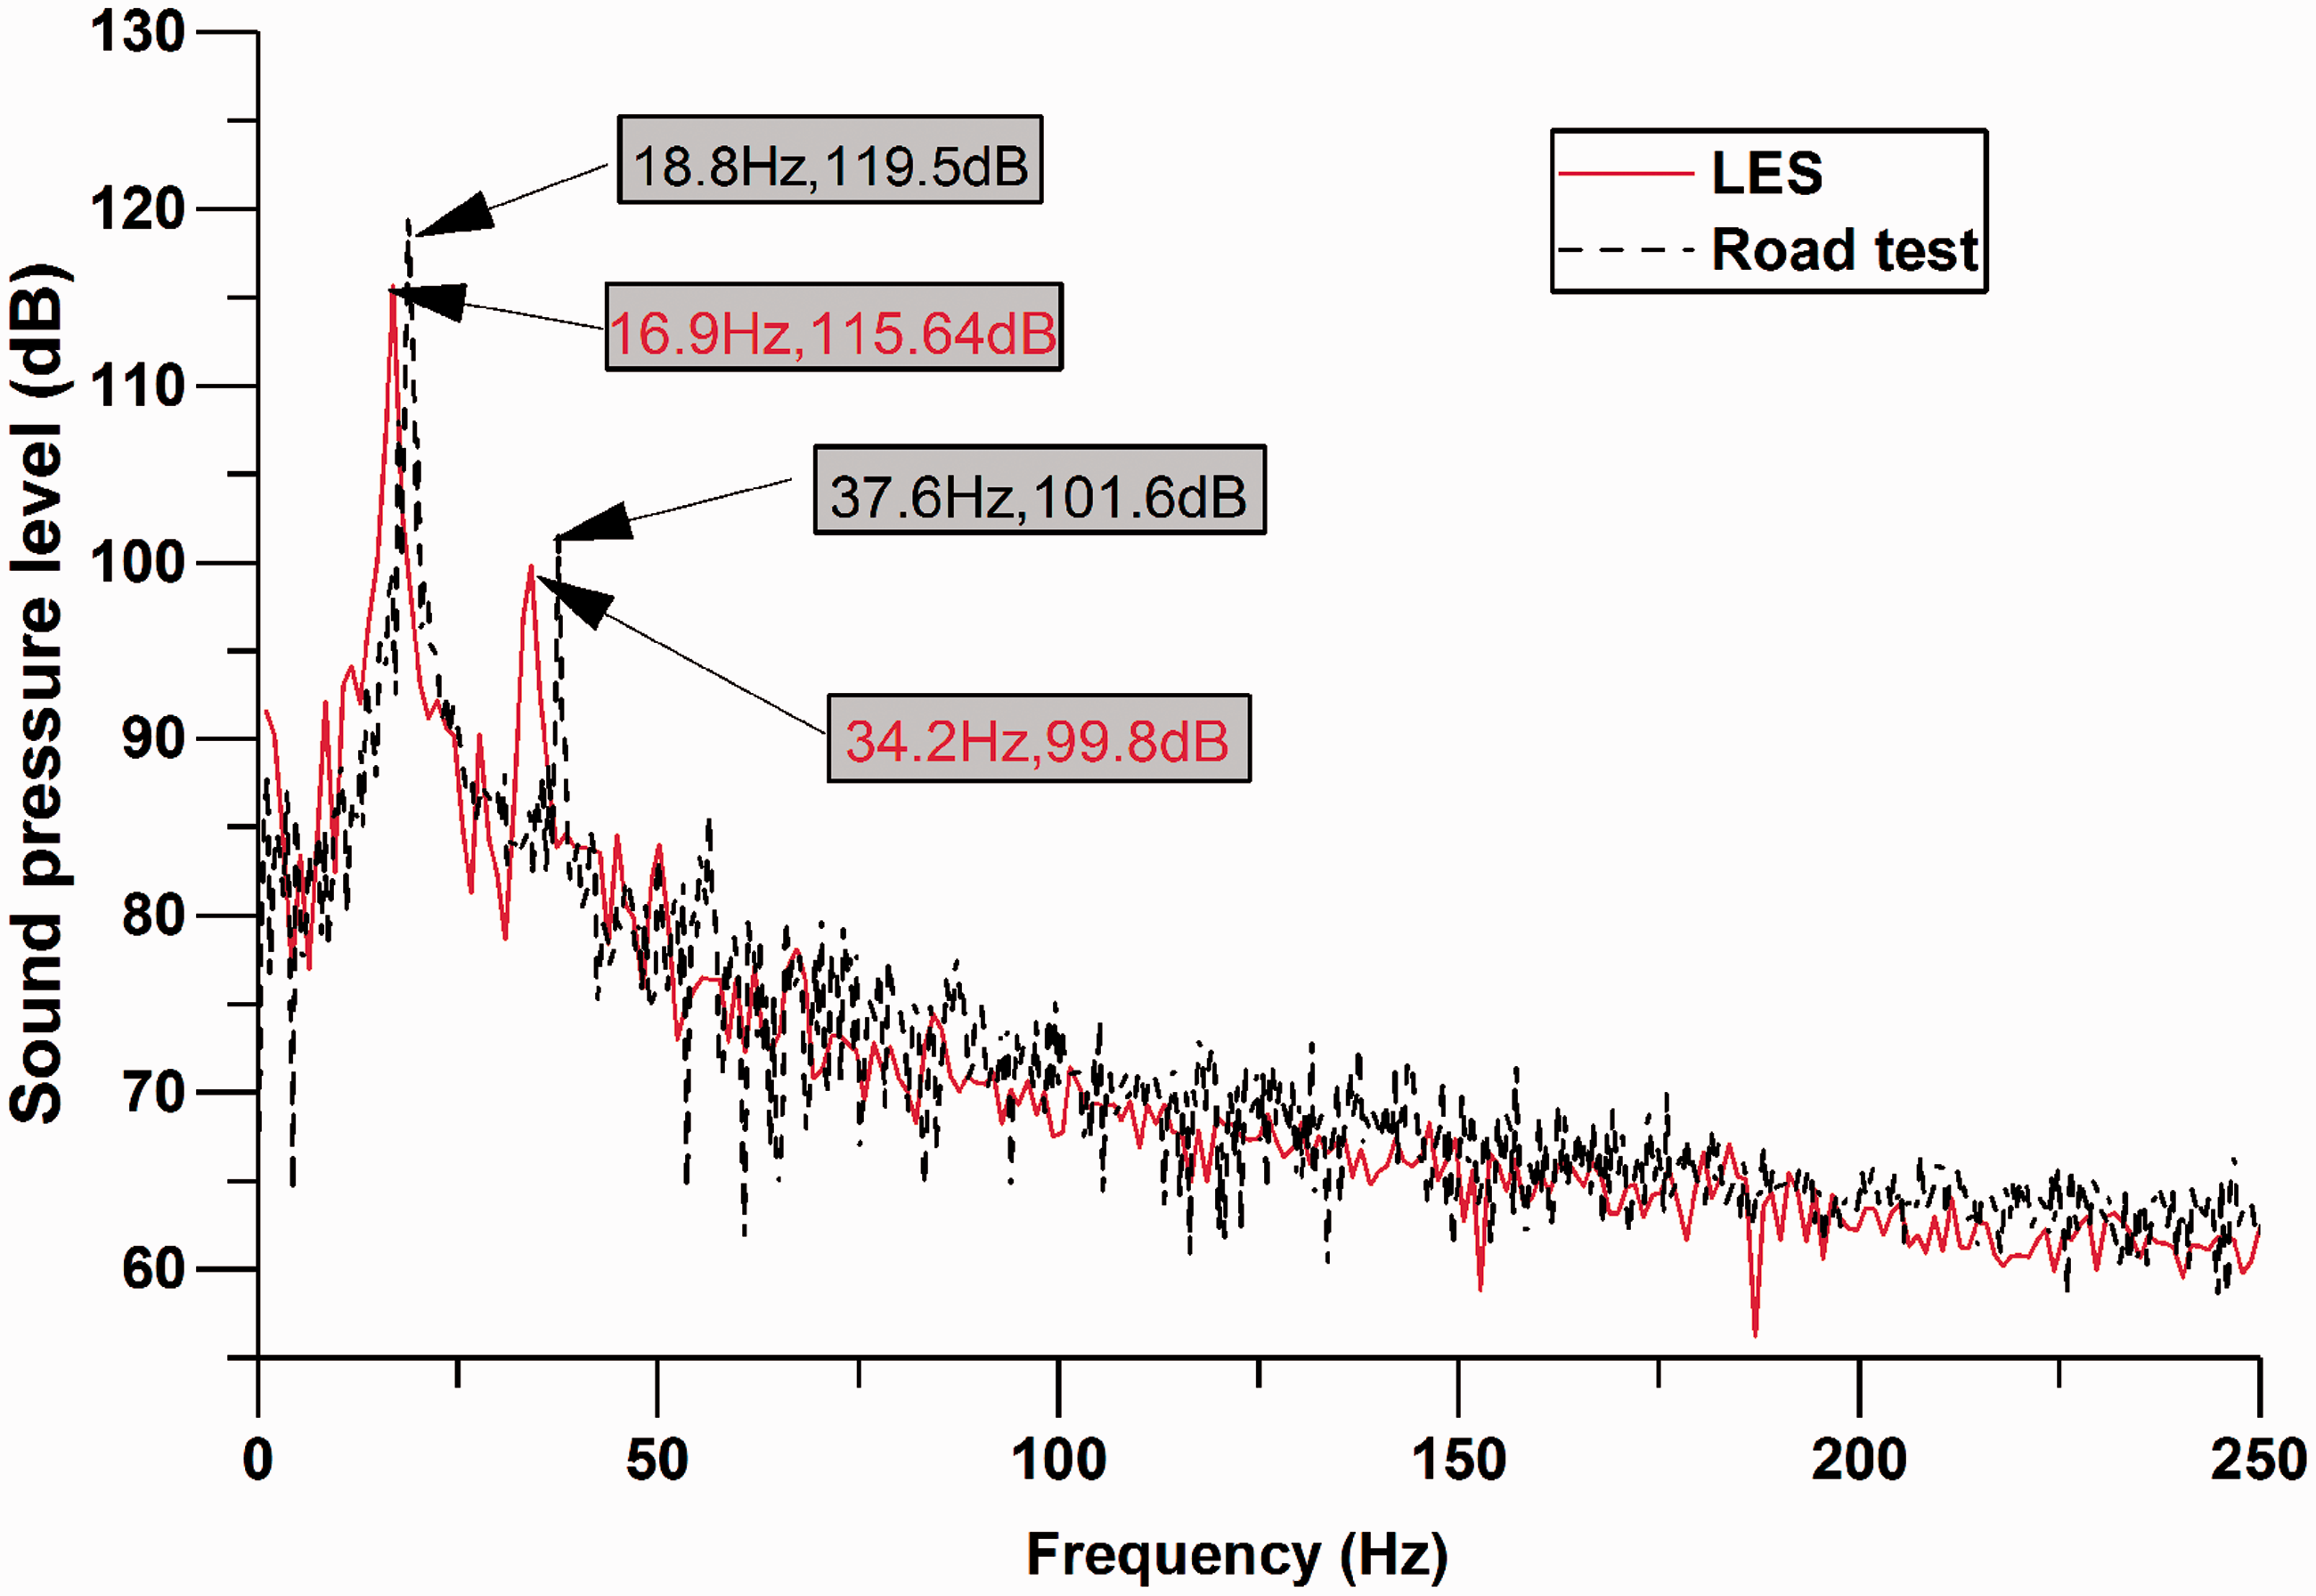
Comparison of SPL with 80% opening degree of the left rear window.
Comparison of SQE objective parameters with 80% opening degree of the left rear window.
Sound quality evaluation of side-window buffeting noise
The sound quality of the car needs to be quantified through evaluation. The methods mainly cover subjective evaluation and objective evaluation. Subjective evaluation is based on different groups of people as the main body and conducted through the method of evaluation by the hearing jury. The objective evaluation method is based on objective physical metrics and automatically conducted by using testing instruments with high reliability. However, repeatability and consistency are weak due to the significant requirement of workforce and time for subjective evaluation methods. In order to circumvent these shortcomings, some objective SQE parameters were developed which can be obtained through testing and calculation based on the understanding of the human ear hearing mechanism. Therefore, this paper studies the sound quality characteristics of wind buffeting noise from an objective perspective. The SPL, loudness, roughness, sharpness and fluctuation are employed as the objective physical metrics to the evaluation. The reason why these four parameters were chosen is because they are the most classic and most commonly used in mechanical noise sound quality evaluation.
The obtained pulsating pressure data by numerical simulation are utilised as an initial signal to calculate the objective parameters. Four psychoacoustic objective parameters namely: loudness, sharpness, roughness and fluctuation were obtained by using Matlab R2016a to compile the calculation process. SPL result is obtained by ANSYS FLUENT 16.2.
SPL of wind buffeting noise
The sound pressure level is the traditional single evaluation metric of buffeting noise. The pulsating pressure on the driver’s ear is obtained by LES method, and the sound pressure level (SPL) was finally converted to dB units using the formula

According to equation (1), the sound pressure level of buffeting noise in the driver’s left ear with different velocities and the window opening degree are calculated. At the same time, the corresponding frequency can also be obtained. Variation of SPL with the change of velocity and window opening degree is shown in Figure 10. It can be seen that the buffeting noise induced by the left rear window is greater than the left front window at the driver's left ear. This phenomenon can be explained as a result of airflow separation under the obstruction of the rearview mirror, the turbulence intensity formed near the front side window is stronger than the rear window. The sound intensity caused by the turbulent boundary layer is weaker than the laminar boundary layer. Under the same aerodynamic environment, turbulence outside the car will reduce the intensity of aerodynamic noise inside the car. It can also be found that the SPL shows a significant upward trend with the increase of velocity and window opening range. The fact reveals that velocity and window opening degree has an obvious contribution to SPL of buffeting noise. However, there are some unusual phenomena. When the left rear window opening degree was 60%, the SPL was 115.19 dB at 110 km/h lower than the vehicle velocity of 100 km/h at 116.24 dB. The same phenomenon can be observed in the left front window. It indicates that the sound pressure level does not increase monotonically as the velocity increases. Similarly, with the increase of the window opening degree under the fixed velocity, the SPL of the side window does not increase continuously. The maximum SPL appears around the 80% opening degree. Those conclusions illustrate that full-scale vehicle buffeting noise cannot be generalised with that of simple cavity noise because of the complex diversity under different operating conditions. Therefore the characteristics of side-window buffeting noise under various velocity and window opening degree need to be fully analysed.
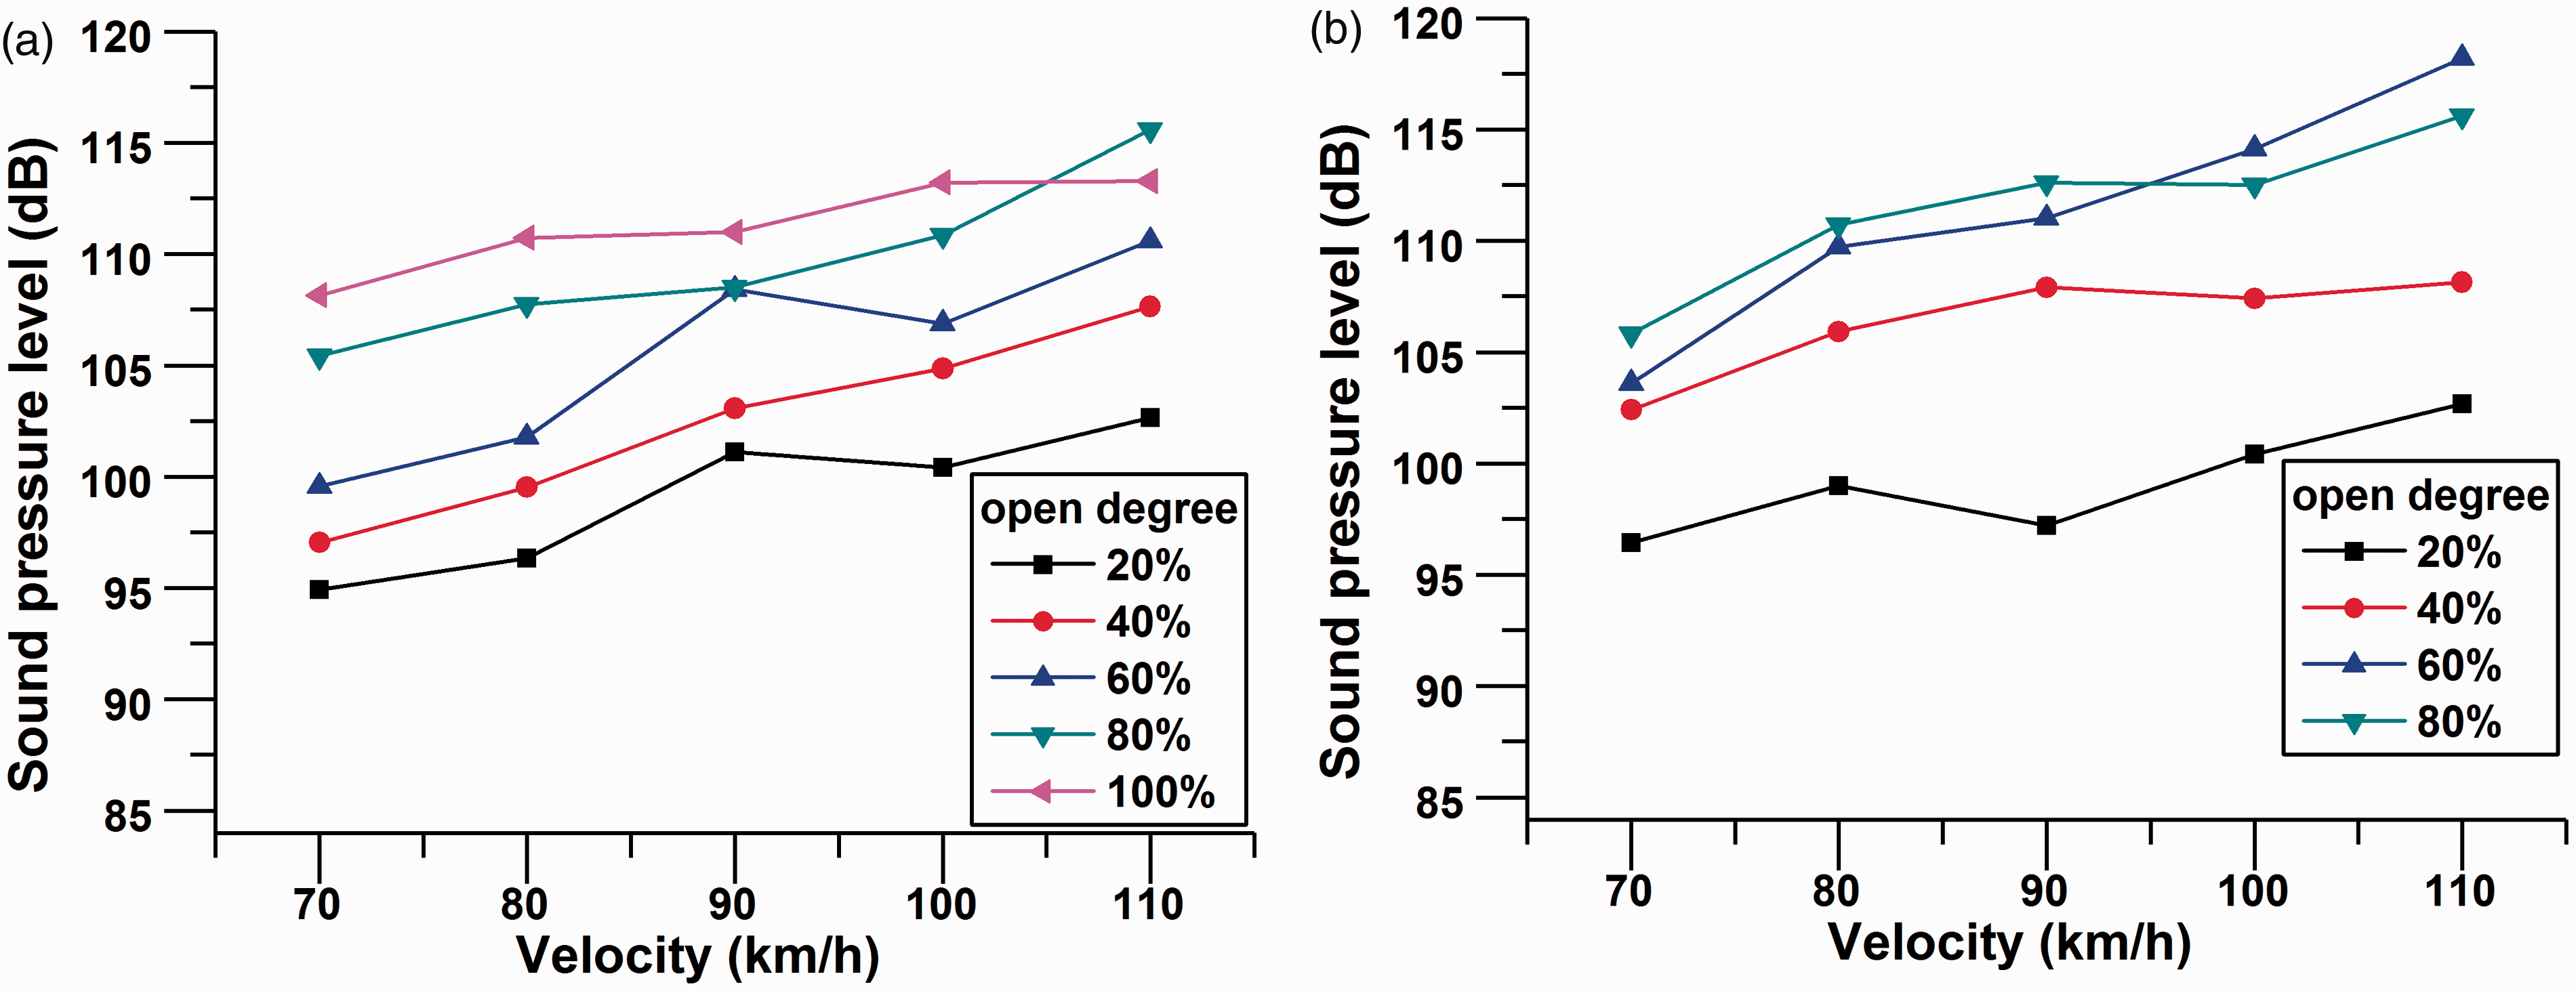
Variation of SPL with the change of velocity and opening degree for the case of left front (a) and rear (b) window opened.
Loudness of wind buffeting noise
The loudness is defined as a psychoacoustic parameter that represents the degree of subjective perception of the human ear to sound intensity.
29
According to standard IS0532B,
30
the transfer function of the outer ear and the middle ear is determined at first. Then, the excitation level of each critical band is filtered by the auditory filter. According to the human ear theory proposed by Zwicker, the generation of critical band excitation depends on the mode in which the narrow-band noise masks pure tone. Subsequently, the characteristic loudness of each critical band is calculated according to the excitation level, which can be obtained as follows29,30
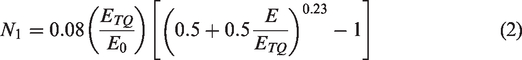
The total loudness N is obtained by integrating characteristic loudness in the critical band rate
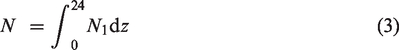
According to equations (2) and (3), the loudness of buffeting noise with various velocities and window opening degree is obtained. Variation of loudness with the change of velocity and opening degree is shown in Figure 11. It can be concluded that the loudness increases with the increase of the left front side-window opening degree under the fixed velocity. Merely, the left rear window loudness slightly decreases as the opening degree increased from 60% to 80% when velocity is up to 100 km/h and 110 km/h. The overall loudness shows an upward trend with the increase of velocity under the same opening degree of side-window, yet there still exists slight inconsistency. The latter increase rate is slightly lower than the former. On the average, the loudness of the left rear side-window is slightly higher than the left front side-window, which corresponds to the higher traditional sound pressure level of left rear side-window. Regardless of velocity and window opening degree, the loudness is maintained at 50 sones or more, which signifies that hearing damage would be caused if staying in this environment continuously. Therefore, attention should be paid to the loudness rather than just the traditional SPL of wind buffeting noise.
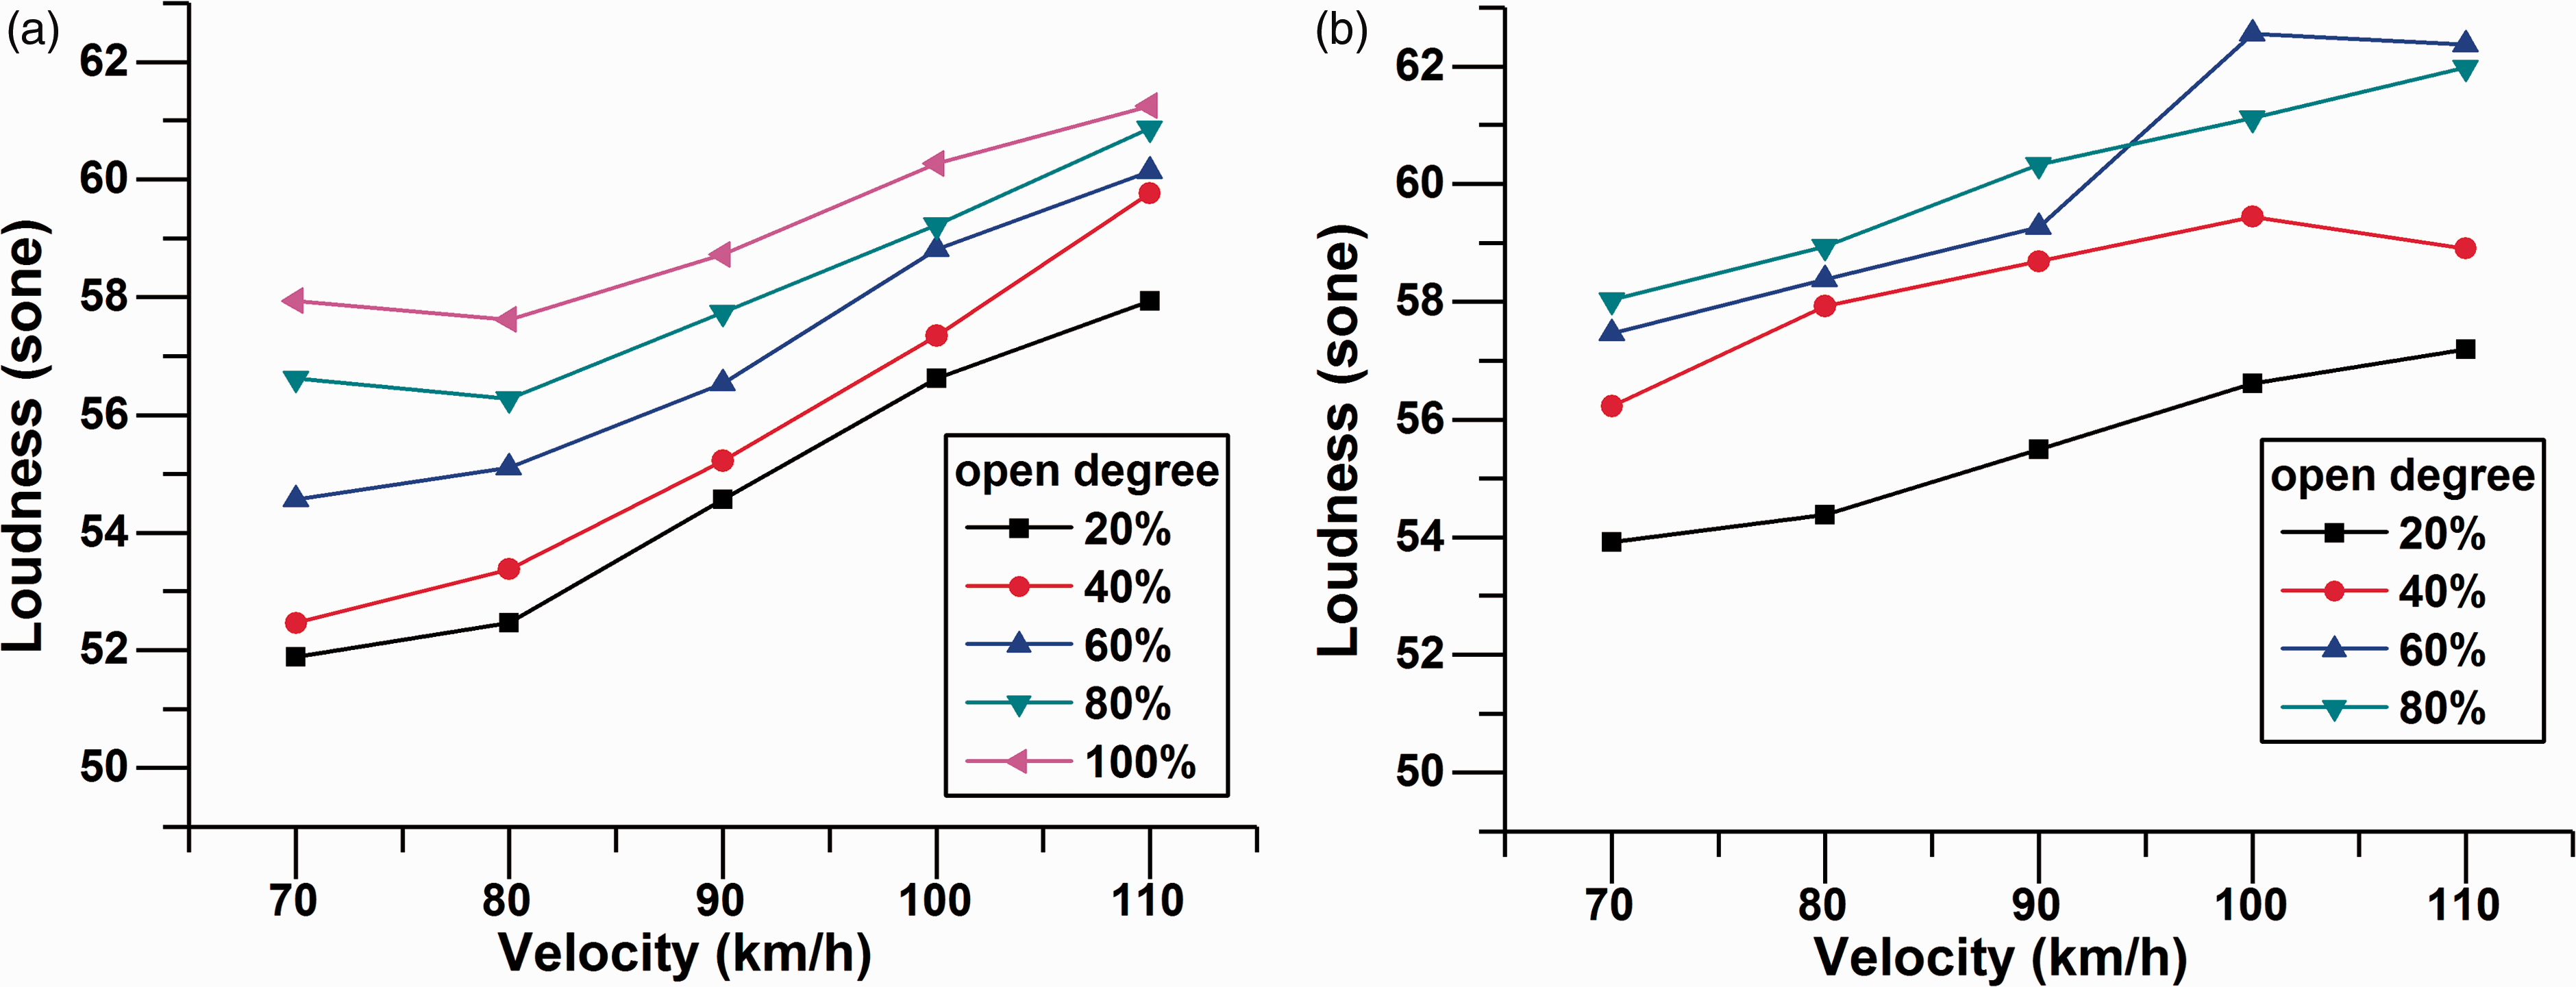
Variation of loudness with the change of velocity and opening degree for the case of left front (a) and rear (b) window opened.
Roughness of wind buffeting noise
Roughness is an indicator used to quantify the subjective perception of the human ear to noise amplitude modulation (modulation frequency range from 20 to 300 Hz) and describe people’s perception of transient changes in sound signals.
Zwicker and Fastl made some improvements in the computational method proposed by Aures. 29 They used the modulation frequency of noise and the excitation-level difference (depth of sound occlusion) in each characteristic band to calculate the roughness.
The mathematical model of the roughness can be expressed as
29
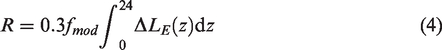
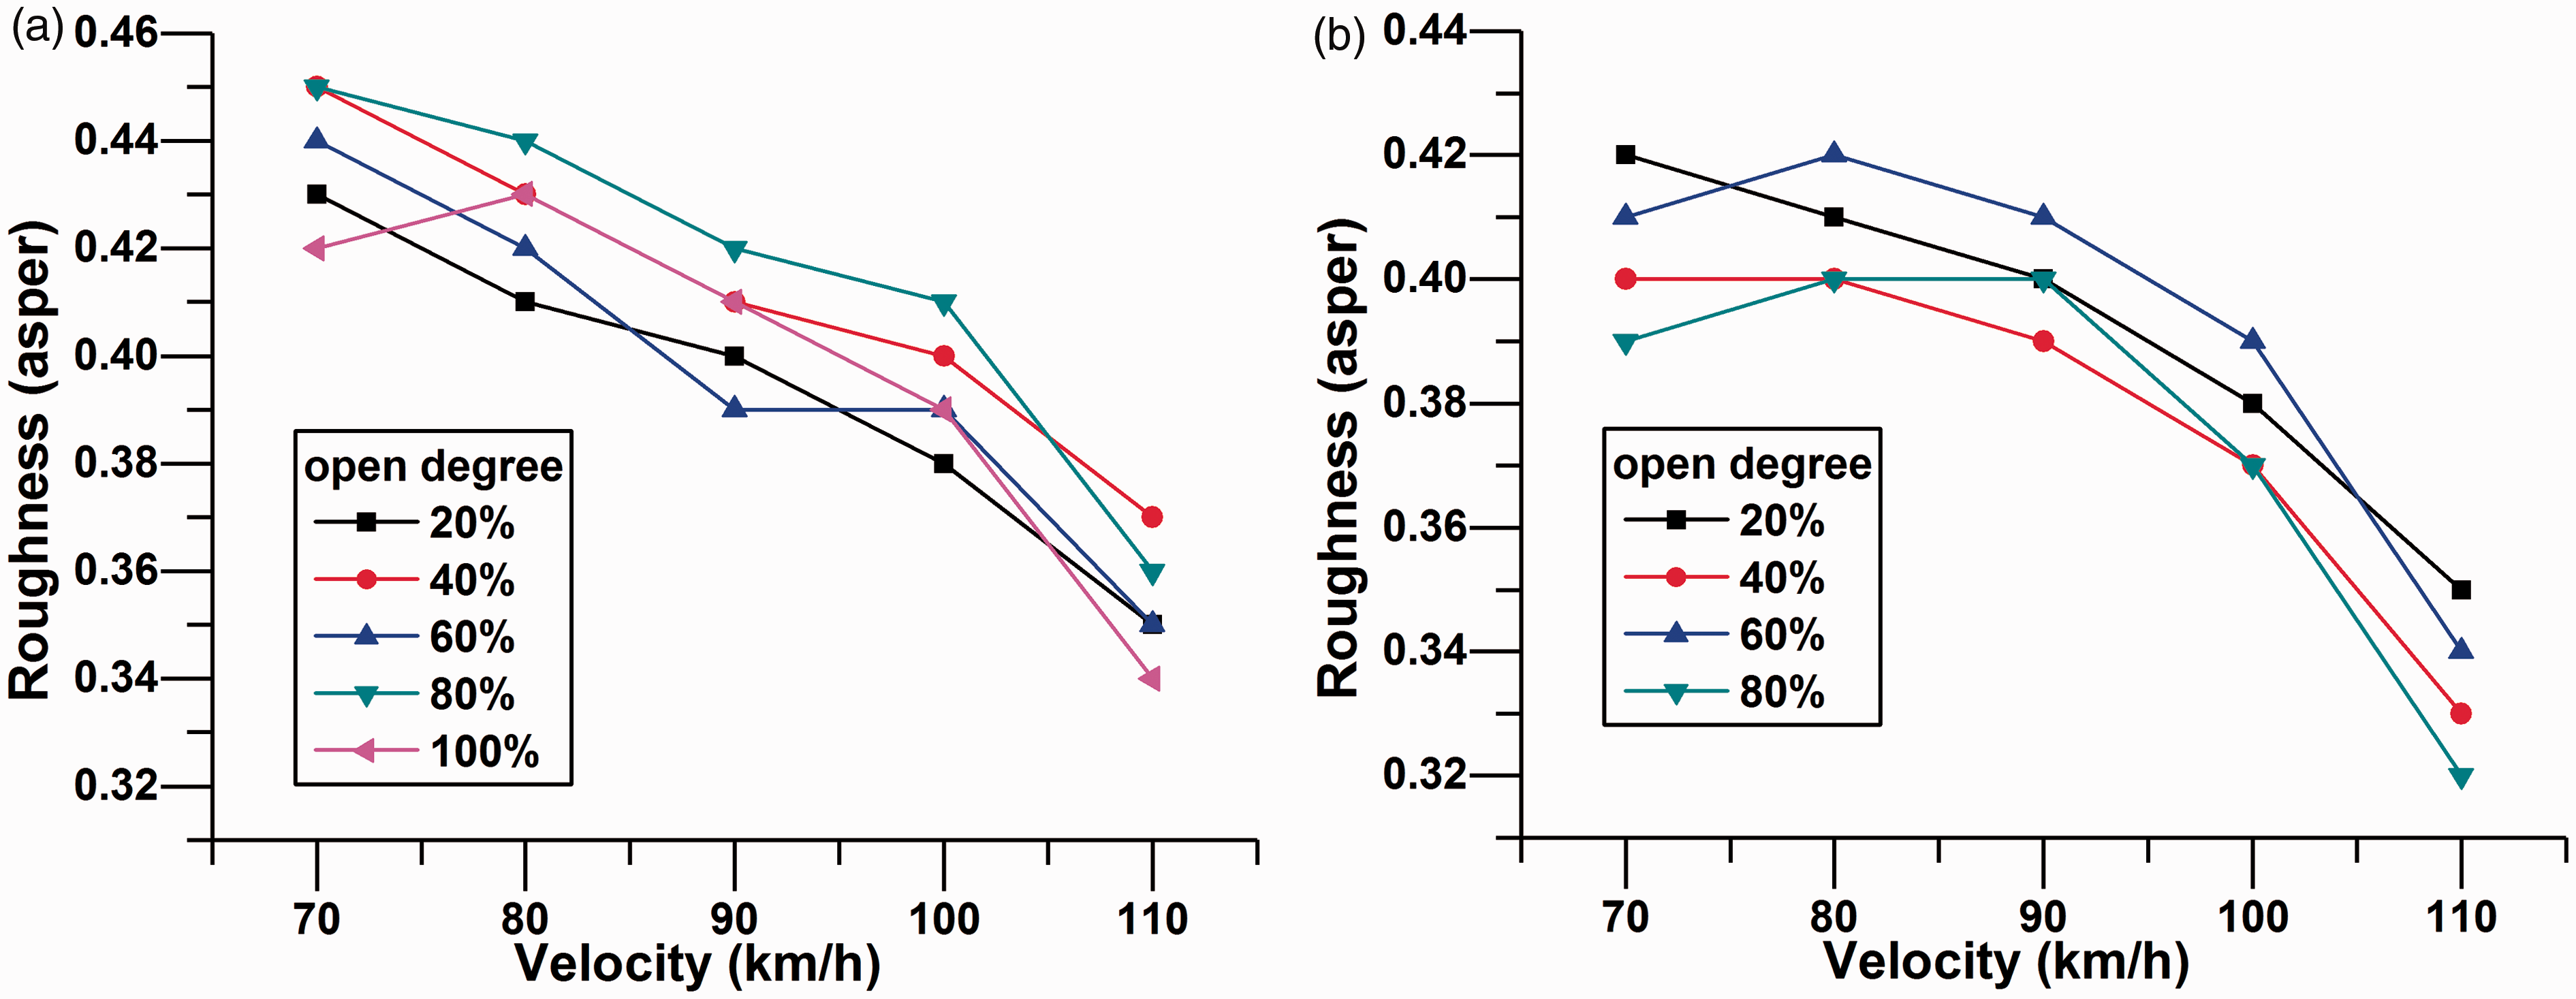
According to equation (4), the roughness of buffeting noise in the driver’s left ear with different velocity and the window opening degree is obtained. Variation of roughness with the change of velocity and opening degree is shown in Figure 12. It can be found that the roughness decreases with the increase of vehicle velocity under the same opening degree of side-windows. When the velocity increases from 70 km/h to 110 km/h under arbitrary fixed side-window opening degree, the corresponding average roughness decreases by approximately 0.1 asper. In order to intuitively analyse the results and find out the regularity of roughness changes, the results are fitted into continuous data by interp2 interpolation method, then 3D contour is generated as shown in Figure 13. It shows that roughness ups and downs with the increase of window opening degree due to different window opening change the fundamental frequency of wind buffeting noise. Hence the energy distribution changes, which in turn affects the roughness. Furthermore, the roughness of the wind buffeting noise of the left front side-window is symmetrically distributed along 60% opening degree. For the left rear side-window opening condition, roughness was anti-symmetrically distributed roughly along the 50% window opening degree.
Variation of roughness with the change of velocity and opening degree for the case of left front (a) and rear (b) window opened.
Contour of variation of roughness with the change of velocity and opening degree for the case of left front (a) and rear (b) window opened.
Sharpness of wind buffeting noise
Sharpness reflects the frequency characteristics of the sound. 17 The higher the proportion of high-frequency sound, the higher the sound sharpness will be. Sharpness also reveals the harsh degree of the sound signal. In general, the sharper the sound and higher the sharpness, the more irritated will be the sound and the worse will be the sound quality. The unit of sharpness is acum. The level of sharpness is usually affected by the following parameters: centre frequency of noise, bandwidth, sound pressure level and spectral envelope.
The mathematical model of the sharpness can be expressed as
29
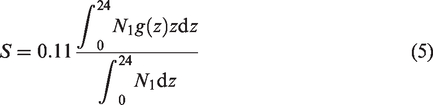
According to equation (5), the sharpness of buffeting noise changes with the velocity and the window opening degree is computed. As shown in Figure 14, it can be told that the sharpness decreases with the increase of the vehicle velocity under the same range of side-window opening, which also verifies that there is a large negative correlation between sharpness and loudness. The sharpness tends to decrease with the increase of the side-window opening degree at the fixed velocity. From the perspective of flow field simulation, this can be explained by the fact that the suction effect inside the passenger compartment decreases with the increase of window opening degree and the development of internal turbulent flow tends to be stable. Because when the window is opened, the flow field in the car undergoes dramatic changes. As the opening degree gradually increases, the flow field tends to be stable. 31
Variation of sharpness with the change of velocity and opening degree for the case of left front (a) and rear (b) window opened.
Fluctuation of wind buffeting noise
Fluctuation is the subjective perception of the human ear’s modulation of sound, which represents the degree of oscillation of the sound loudness. The main influence parameters of fluctuation are time domain structure of sound, SPL, bandwidth, and modulation frequency. Fluctuation is utilised for modulation frequencies below 20 Hz in which the human ear can directly follow the sound pressure level changes.
The mathematical model of the fluctuation strength can be obtained as
29
According to equation (6), the fluctuation of buffeting noise changes with the velocity and the window opening degree is calculated and shown in Figure 15. It can be seen that under the same side-window opening, the fluctuation value monotonous decreases with the increase of velocity. Either the left front or the left rear window is opened, and the average reduction of fluctuation value is 0.15 vacil when the vehicle velocity increases from 70 km/h to 110 km/h under all window opening conditions. Also, the fluctuation reached the minimum value when the vehicle velocity was 110 km/h, and the opening degree was 20%. Similar to roughness, 3D contour is generated as shown in Figure 16. It manifests that fluctuation increases first, then decreases and finally increases again with the increase of the window opening which similarly to a periodic change. It manifests that as the window opening increases, the value of the fluctuation first increases, then decreases and eventually increases again, which is similar to the periodic variation. The regular pattern can be interpreted as the air flow inside the passenger compartment becomes violent, and wind buffeting occurs when the side-window opened initially. The frequency of the wind buffeting is concentrated on a lower frequency. Sinc the fluctuation degree represents the instantaneous change of the low frequency, the fluctuation increases at first. According to Kinsler’s research,
32
the resonant frequency has the following expression
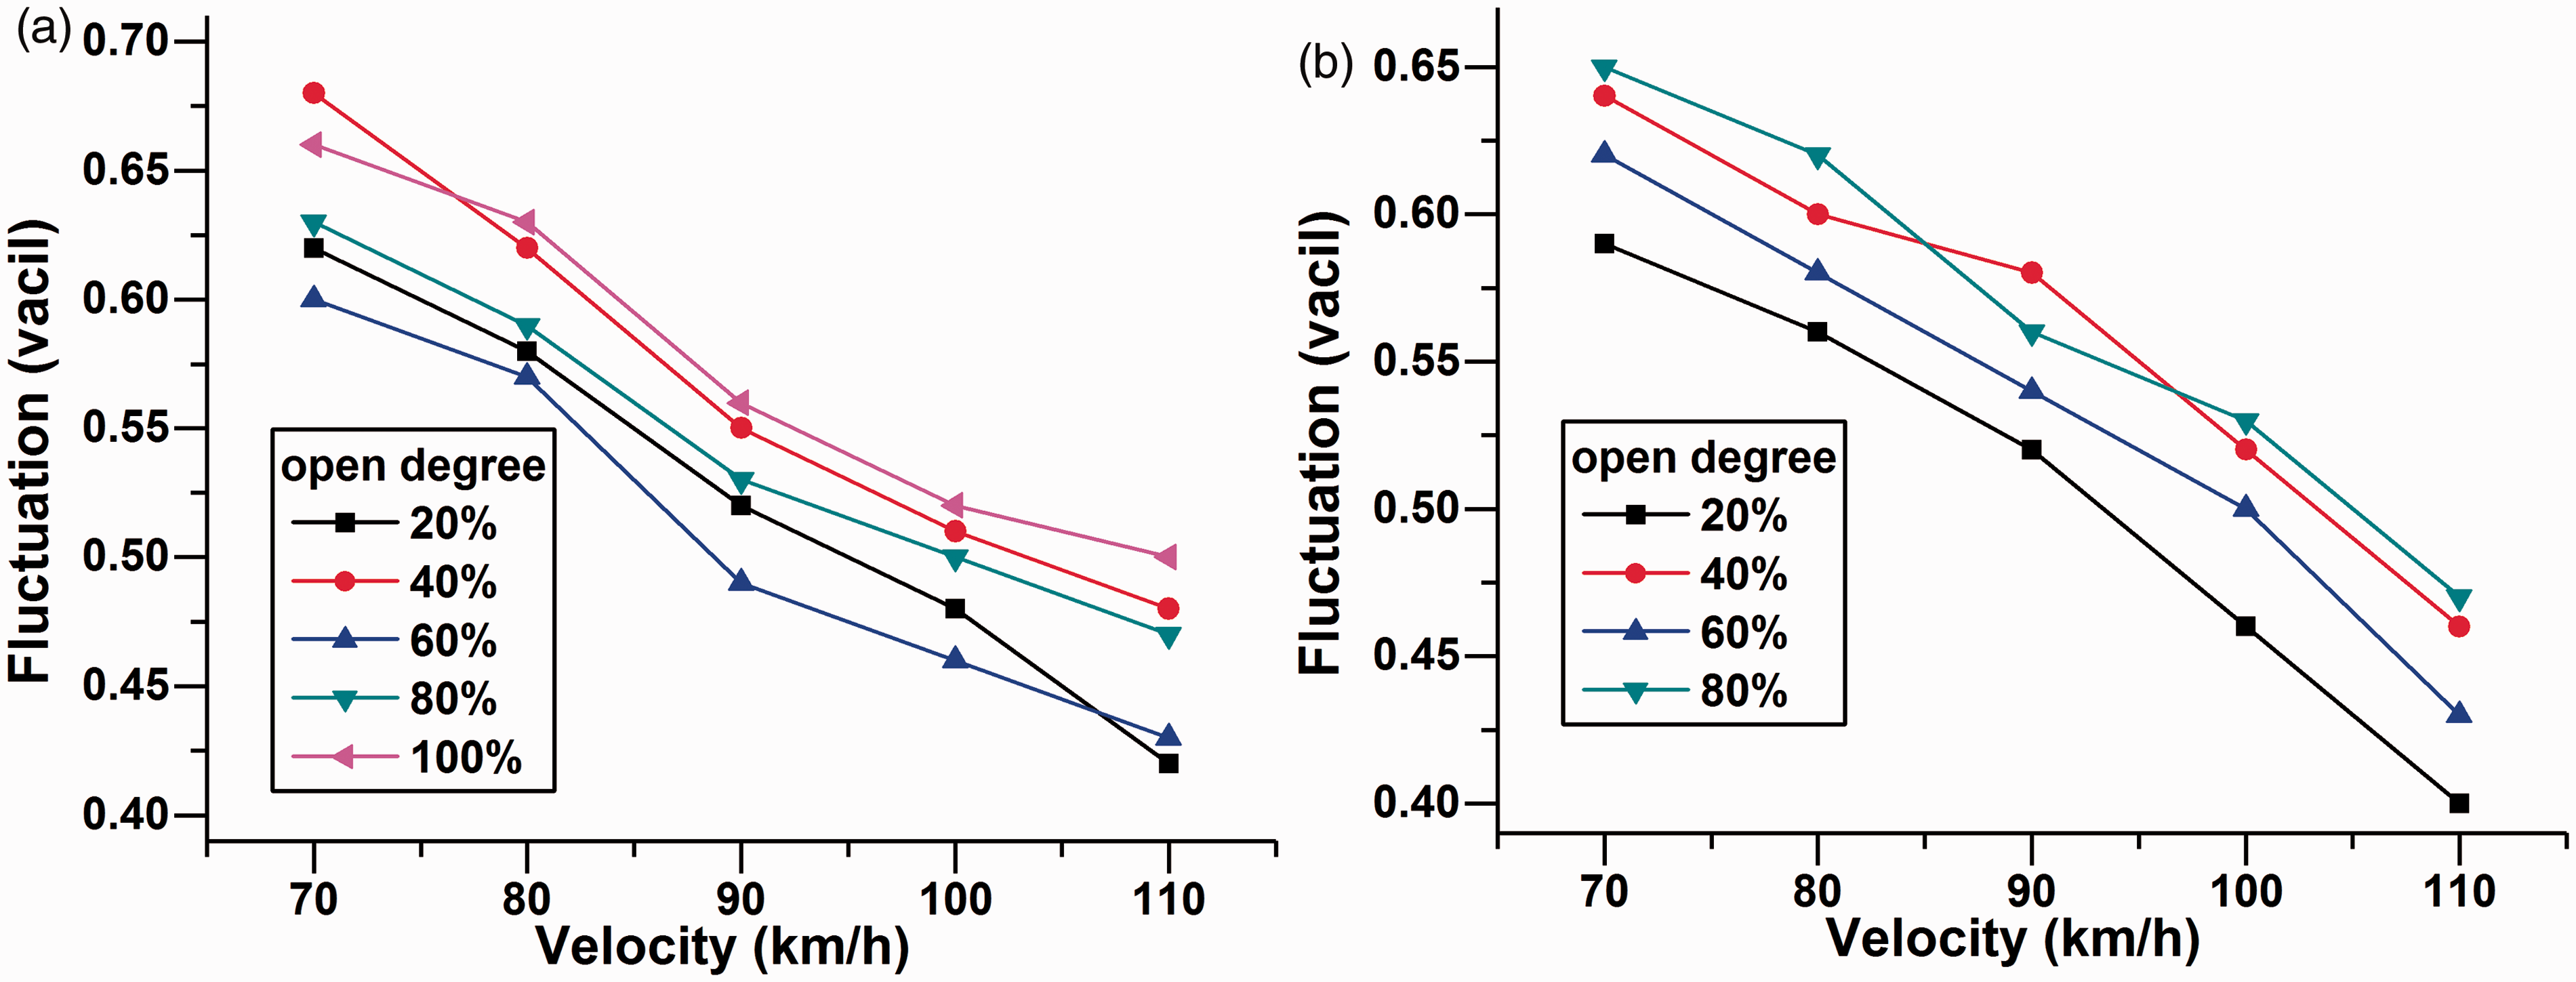
Variation of fluctuation with the change of velocity and opening degree for the case of left front (a) and rear (b) window opened.
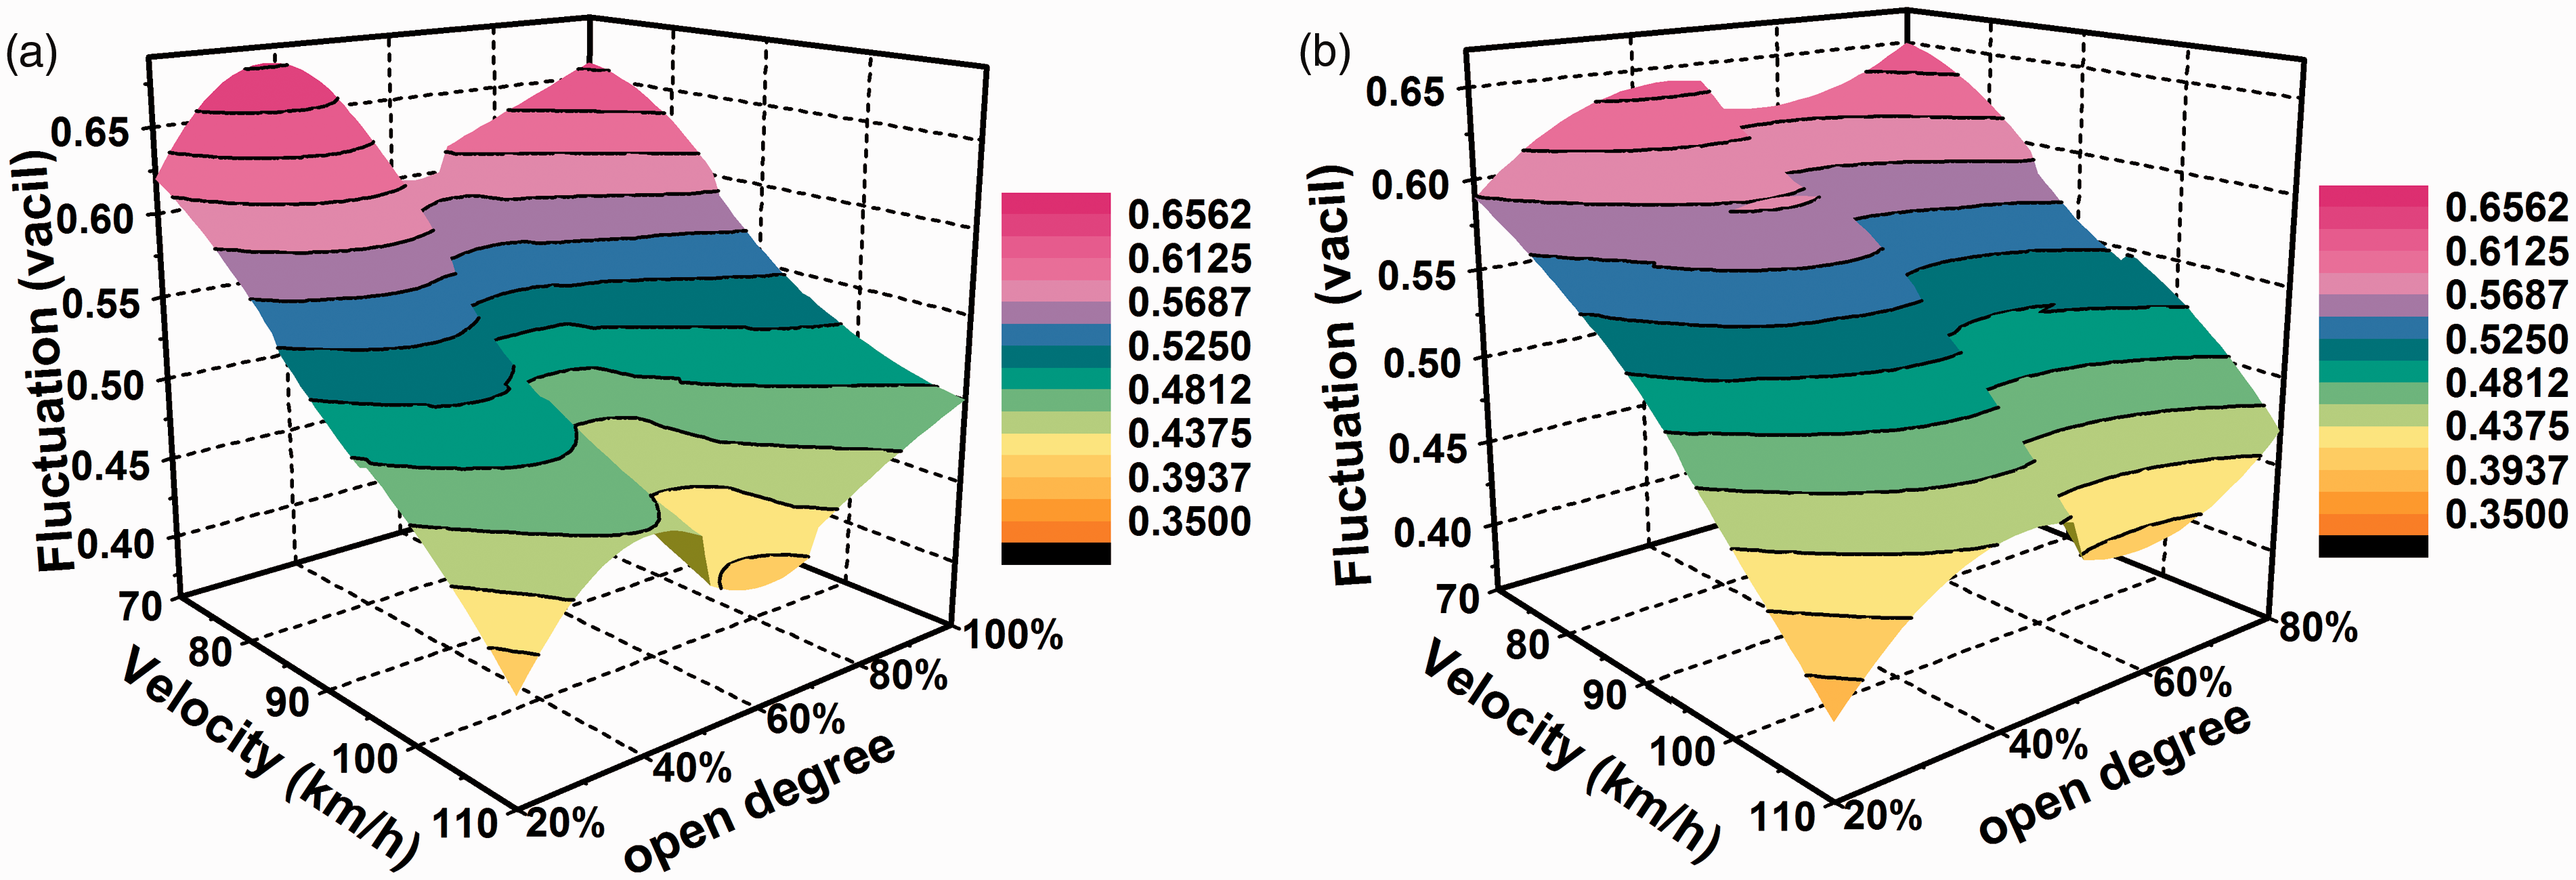
Contour of variation of fluctuation with the change of velocity and opening degree for the case of left front (a) and rear (b) window opened.
The objective of this part is to study the change law of the objective parameters of the sound quality parameters under different window opening size and vehicle speeds, and comprehensively consider the influence of each parameter on the human hearing experience to find an auditory comfortable window opening size and vehicle speed. In summary, it can be concluded that with the increase of driving velocity, SPL and loudness show an increasing trend, while roughness, sharpness and fluctuation present a decreasing trend. It can also be summarised that with the increase of window opening degree, SPL and loudness show an increasing trend, sharpness presents a decreasing trend, and roughness and fluctuation display the trend of ups and downs. Low velocity causes high roughness, sharpness and fluctuation values, while high velocity makes the traditional SPL and loudness at a high level. Based on a multi-parameter equalisation consideration, 90 km/h is the relatively reasonable velocity to improve annoyance perceived by passengers. Similarly, it is suggested that the opening degree of the left front side window should be kept at 60–80% and the left rear window to 50–60% to maintain window opening degree when ventilating. Otherwise, roughness and fluctuation value will be at a high level, affecting riding comfort.9,33
Conclusion
The comparison of LES, DES and wind tunnel experiment results demonstrate the correctness and superiority of LES method for computing the cavity noise. The peak of the sound pressure level appears in the low frequency range. LES method is applied to calculate automobile side-window buffeting noise for 45 conditions respectively. In the case of the single window opened, the left rear window buffeting noise with a sharp tone character is apparently more severe than the left front window buffeting noise. The road test was conducted to validate the correctness of LES. When the left rear window was 80% opened, the SPL value of the first-order peak near the driver’s left ear is 115.64 dB (test data is 119.5 dB), and the corresponding frequency is 16.9 Hz (test data is 18.8 Hz). The obtained pulsating pressure data via LES is utilised as an initial signal to calculate the objective parameters. The numerical calculation and road test results have been compared and analysed. Variation of loudness, roughness, sharpness and fluctuation with the change of velocity and opening degree is summarised. The influence factors and mechanism of objective sound quality parameters are analysed. Some reasonable suggestions to improve the sound quality have been proposed. This paper elaborates the variation rules of objective SQE parameters of side-window buffeting noise with the change of vehicle velocity and window opening degree in detail. It can be concluded that with the increase of driving velocity, SPL and loudness show an increasing trend, while roughness, sharpness and fluctuation present a decreasing trend. It can also be summarised that with the increase of window opening degree, SPL and loudness show an increasing trend, sharpness presents a decreasing trend, and roughness and fluctuation display the trend of ups and downs.
Footnotes
Authors' note
Zhengqi Gu is also affiliated with Hunan Province Cooperative Innovation Center for the Construction & Development of Dongting Lake Ecological Economic Zone, Changde, Hunan, China.Zhendong Yang is also affiliated with College of Mechanical Engineering, Hunan International Economics University, Changsha.Taiming Huang is now affiliated with Hunan Province Cooperative Innovation Center for the Construction & Development of Dongting Lake Ecological Economic Zone, Changde, Hunan, China.
Declaration of conflicting interests
The author(s) declared no potential conflicts of interest with respect to the research, authorship, and/or publication of this article.
Funding
The author(s) disclosed receipt of the following financial support for the research, authorship, and/or publication of this article: This work was supported by Major Science and Technology Projects of Changde (grant no. CD201701), Independent Subject of State Key Laboratory of China (grant no. 734215002), Innovation Team of Ministry of Finance of China (grant no. 04200036017), Key Research and Development Program of Hunan Province (grant no. 2017GK2203), National Natural Science Foundation of China (grant no. 51875186), and the Science Research Foundation from the Education Department of Hunan Province, China (grant no. 16b148).