
Abstract
Structural health monitoring has been utilized in numerous ways to investigate the performance and integrity of highway bridges. This paper highlights the use of six structural health monitoring systems, which were deployed to monitor distinct behaviors on six bridges in Kentucky. The structural health monitoring systems are as follows: (1) Over-height truck impact detection and monitoring on the I-64 over US 60 bridge, (2) Barge impact detection and monitoring on northbound US 41 over the Ohio River, (3) effectiveness of carbon fiber-reinforced polymer retrofit evaluation based on prestressed concrete I-girder crack movement on the I-65 elevated expressway in Louisville, (4) effect of thermal loads on bridge substructure evaluation on KY 100 over Trammel Creek, (5) thermal movement of expansion joints evaluation on eastbound I-24 over the Tennessee River, and (6) crack growth monitoring on steel floor beam on I-275 over the Ohio River. The deployment of the different structural health monitoring systems on Kentucky bridges has provided valuable insights on their planning, implementation, and maintenance, which can be applied on future structural health monitoring projects. While several of the projects have proved immensely successful, with some still being continuously monitored, others, due to numerous complications, have met with only limited success. The best return on investment was realized from structural health monitoring instrumentation that was focused and limited in scope. The successful structural health monitoring systems had continuous communication between all stakeholders during planning, implementation, and monitoring phases of the projects. Following implementation, the availability of contingency funds through the funding source, to replace/upgrade sensors and networking equipment and costs for reprogramming and reinstallation outside of regular maintenance costs, was also important for the structural health monitoring to be successful.
Introduction
Structural health monitoring (SHM) of bridges is an important tool in asset management that has become extremely popular throughout the past decade. Monitoring helps engineers identify damages to bridge structures which could be material and/or geometrical. With the current advances in sensor, data acquisition, and networking technology, SHM provides tools that can swiftly pinpoint defects and damages in bridge components, which can lead to safer and more reliable structures. Recent technological advances facilitate the usage of more complex and accurate systems for evaluating the performance of existing and newly constructed bridges. The rapid development of SHM technology is expected to promote a more cost-effective condition-based maintenance philosophy and a shift away from the time-based philosophy utilized presently. 1
The current National Bridge Inspection Standards in the United States require that all bridges on public roads be inspected at regular intervals that do not exceed 24 months. 2 While advances in SHM have not yet evolved sufficiently for it to cost effectively replace routine visual inspections, there are numerous ways SHM can be utilized efficiently to detect damage or deterioration in older bridges as well as facilitate the design and construction of new bridges. SHM of bridges can be categorized in several different ways. Depending on the desired final outcome, bridge monitoring falls into three main categories: (i) short-term monitoring, (ii) long-term monitoring, and (iii) extreme event monitoring. Short-term monitoring is usually carried out on bridges with suspected damage or deterioration to evaluate the degree of damage and possibly identify a practical retrofit measure. The same monitoring can be performed following repairs to evaluate the effectiveness of the selected repair technique. Long-term monitoring is carried out to identify behavior, loading patterns, and deterioration rates; obtain data for possible future repairs and maintenance; evaluate operational safety; research and improve bridge designs; and identify possible damages following extreme events such as earthquakes. Unlike the other two categories, extreme event monitoring may or may not result in the collection of information at regular time intervals. This type of monitoring is specially designed to identify events such as collisions or blasts at critical locations and severe movements instigated by phenomena such as earthquakes or hurricanes.
While numerous research studies have been carried out on different SHM projects, significantly, there have been very few studies outlining the lessons learnt from the difficulties and problems faced by researchers when deploying monitoring systems. Many of the state-of-the-art3–5 and review papers6,7 on SHM provide valuable insights on new technological advances. Ko and Ni 3 discuss the current status, innovative sensing and data acquisition systems, and advanced computational techniques used in SHM of large-scale bridges. Li et al. 4 discuss the use of SHM in large civil infrastructure, outlining synchronization of data acquisition from different types of sensors as a primary challenge. Li and Ou 5 discuss challenges and future trends in SHM of cable-stayed bridges, with one of the primary challenges being the identification of the exact damaged structure model. The review on vibration-based and strain-based SHM of highway bridges for damage detection, load-carrying capacity evaluation and remaining life estimation by Seo et al. 6 identified the gaps in research under each type of monitoring. The review paper by Chang et al. 7 identified some challenges in implementing SHM in civil structures, including the effect of environmental noise, dependence on baseline data, and complexity of infrastructure systems. They also detailed the need of such sensors to be able to robust to withstand environmental effects while also being cost-effective. Research by Spencer et al. 8 and Pakzad et al. 9 details advances in SHM with the use of novel wireless sensor networks with integrated hardware and software systems. Research by Aktan et al. 10 identifies many of the issues in SHM from a management standpoint. The need for adequate resources; integrated multi-disciplinary teams; and a true partnership of academic, government, and industry are highlighted. But many research articles contain little information on the overall project implementation and maintenance issues faced by the researchers. Field deployment of SHM, especially on bridge structures, often encounter practical difficulties due to environmental, logistical, technological, and even financial drawbacks that were never identified at inception of the project. One reason for this lack of reported information on issues faced is possibly due to the fact that failed SHM projects may not be readily publicized. Another could be that as most SHM research-related publications deal with a single instrumentation or a certain type of monitoring that any problems faced may be not valued as relevant when the overall project was a success.
This paper presents six case studies of SHM carried out by the authors for bridges on routes maintained by the Kentucky Transportation Cabinet (KYTC). The projects include short-term, long-term, and extreme event monitoring systems. Several of the projects combine long-term and extreme event monitoring systems. The different SHM systems are as follows: (1) over-height truck impact detection and monitoring on I-64 over the US 60 bridge, (2) barge impact detection and monitoring on northbound US 41 (NB US 41) over the Ohio River, (3) effectiveness of carbon fiber-reinforced polymer (CFRP) retrofit evaluation based on prestressed concrete (PC) I-girder crack movement on the I-65 elevated expressway in Louisville, (4) effect of thermal loads on bridge substructure evaluation on KY 100 over Trammel Creek, (5) thermal movement of expansion joints assessment on eastbound I-24 over the Tennessee River, and (6) crack growth monitoring on steel floor beam on I-275 over the Ohio River. Table 1 provides additional information about the six projects.
SHM Bridge projects in Kentucky.
LVDT: linear variable displacement transducer.
The six projects span a period of more than 12 years and were funded by grants from KYTC and the Federal Highway Administration. While several of the projects have proven immensely successful, with some still being continuously monitored, others have achieved only limited success due to numerous complications. The Kentucky Transportation Center (KTC), based at the University of Kentucky, carried out the instrumentation and monitoring of the acquired data for nearly all the bridges. For five of the six bridges, acquired data were remotely transmitted to the KTC’s data servers. The data were accessible in real time to the stake holders through a website. The location of the bridges and the type of monitoring are identified in Figure 1. This manuscript discusses the projects and identifies difficulties the authors encountered in the planning, implementation, and maintenance of each SHM system. Recommendations based on the lessons learned from the six studies are also presented for consideration, which could potentially be integrated into future SHM projects.
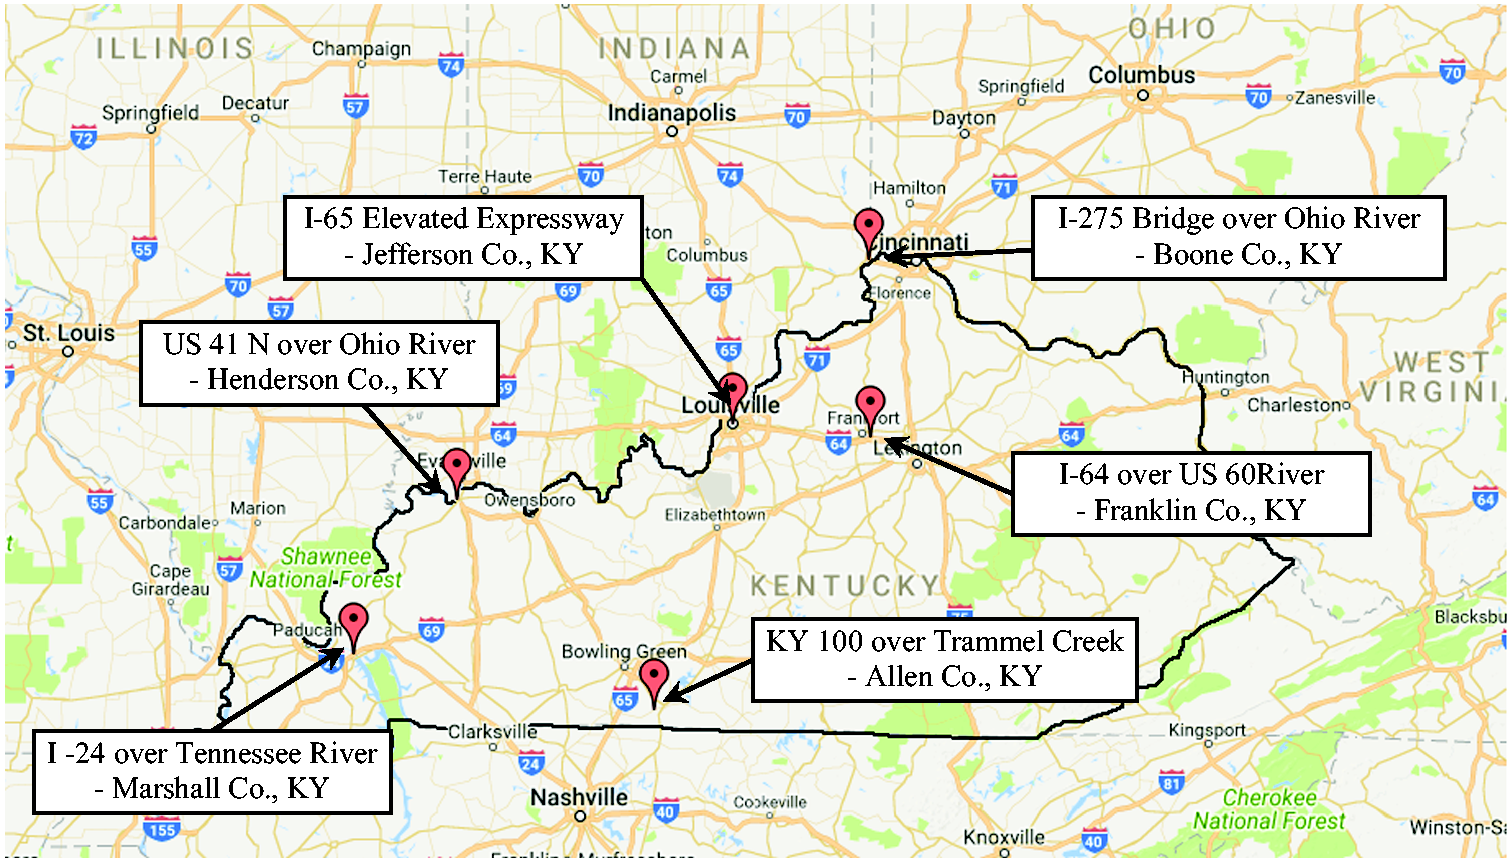
Location of SHM bridges in Kentucky.
Over-height truck impact detection
Bridges on I-64 over US60 (2005–2011)
A combination of long-term and extreme event monitoring is in place on the bridges on I-64 over US 60, in Franklin County, Kentucky. 11 Monitoring was undertaken to distribute information on truck impacts to selected state and other transportation officials as they occur as well as to identify trucks over the posted height limit. Instrumentation continuously monitors the bridge for possible impacts to the girders resulting from trucks that exceed the posted height limit. The three-span parallel eastbound and westbound bridges (Figure 2) are composite steel-concrete with overall lengths of 90 m. Their 190 mm-thick concrete decks are supported by six continuous plate girders of varying-and-constant depth type. The underside of an exterior girder—which has the least height-to-ground distance—of the eastbound bridge has exhibited signs of impact. It is suspected that impacts are caused by certain truck types traversing on the eastbound route of US 60 beneath the bridge. Remote sensing technology, which monitors the behavior and response of the I-64 bridges over US 60 for potential impacts, was installed at various locations. The data are transmitted to a computer at KTC, where they are analyzed, compared, and viewed, in elapsed or real time. The parallel bridges over US 60, along with the impact location, are shown in Figure 2.
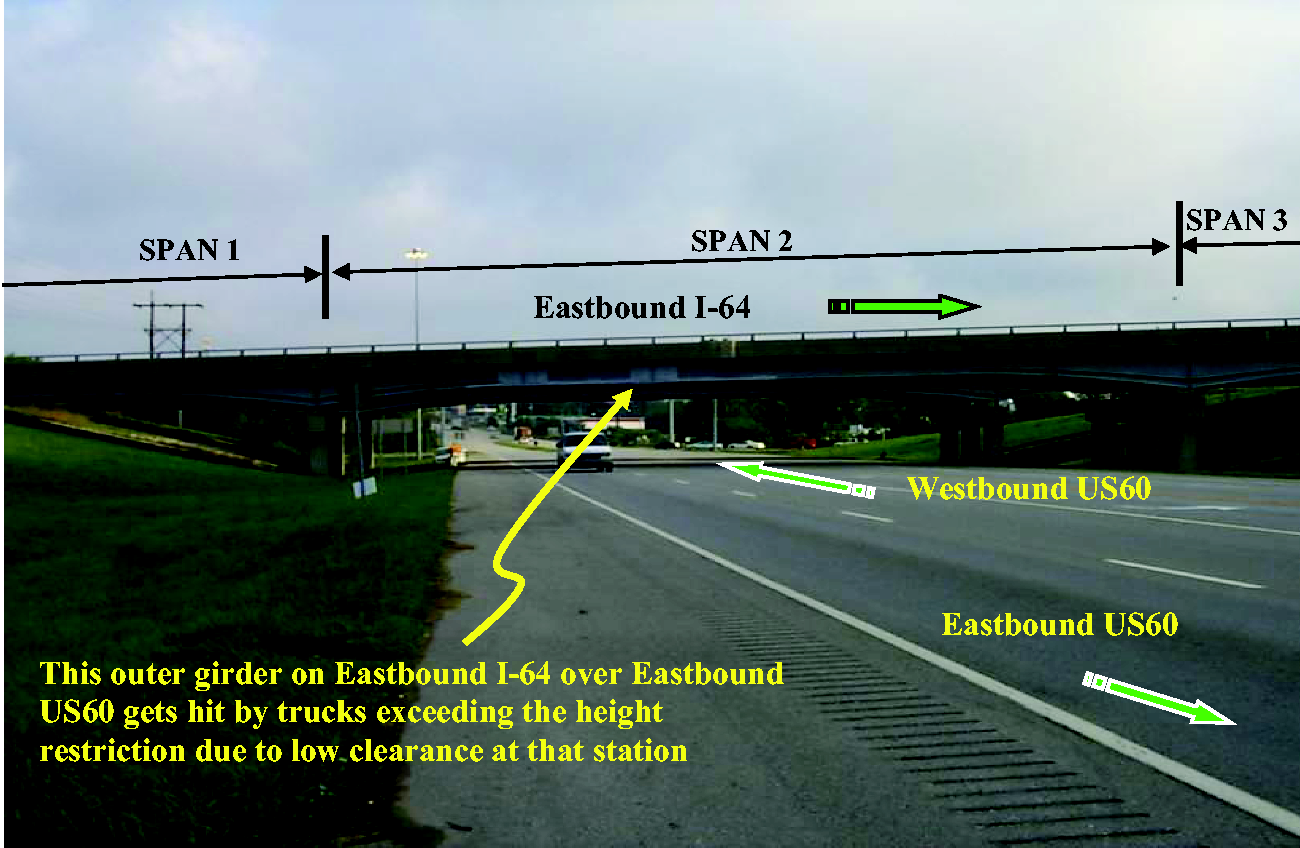
I-64 over US 60 parallel bridges.
Since the bridges are similar in terms of dimensions and expected loading, the effects from the potential impact on the eastbound bridge (i.e., the subject) can therefore be compared to the westbound bridge (i.e., the base). Figure 3 indicates the locations on the bridges of various devices employed in this project. Included among the devices are strain gauges (SG), temperature gauges, infrared sensors, ultrasonic height (UH) detectors, accelerometers, and video cameras (VCs). Strain gauges are installed at 11 locations (indicated as SG-1 to SG-11).
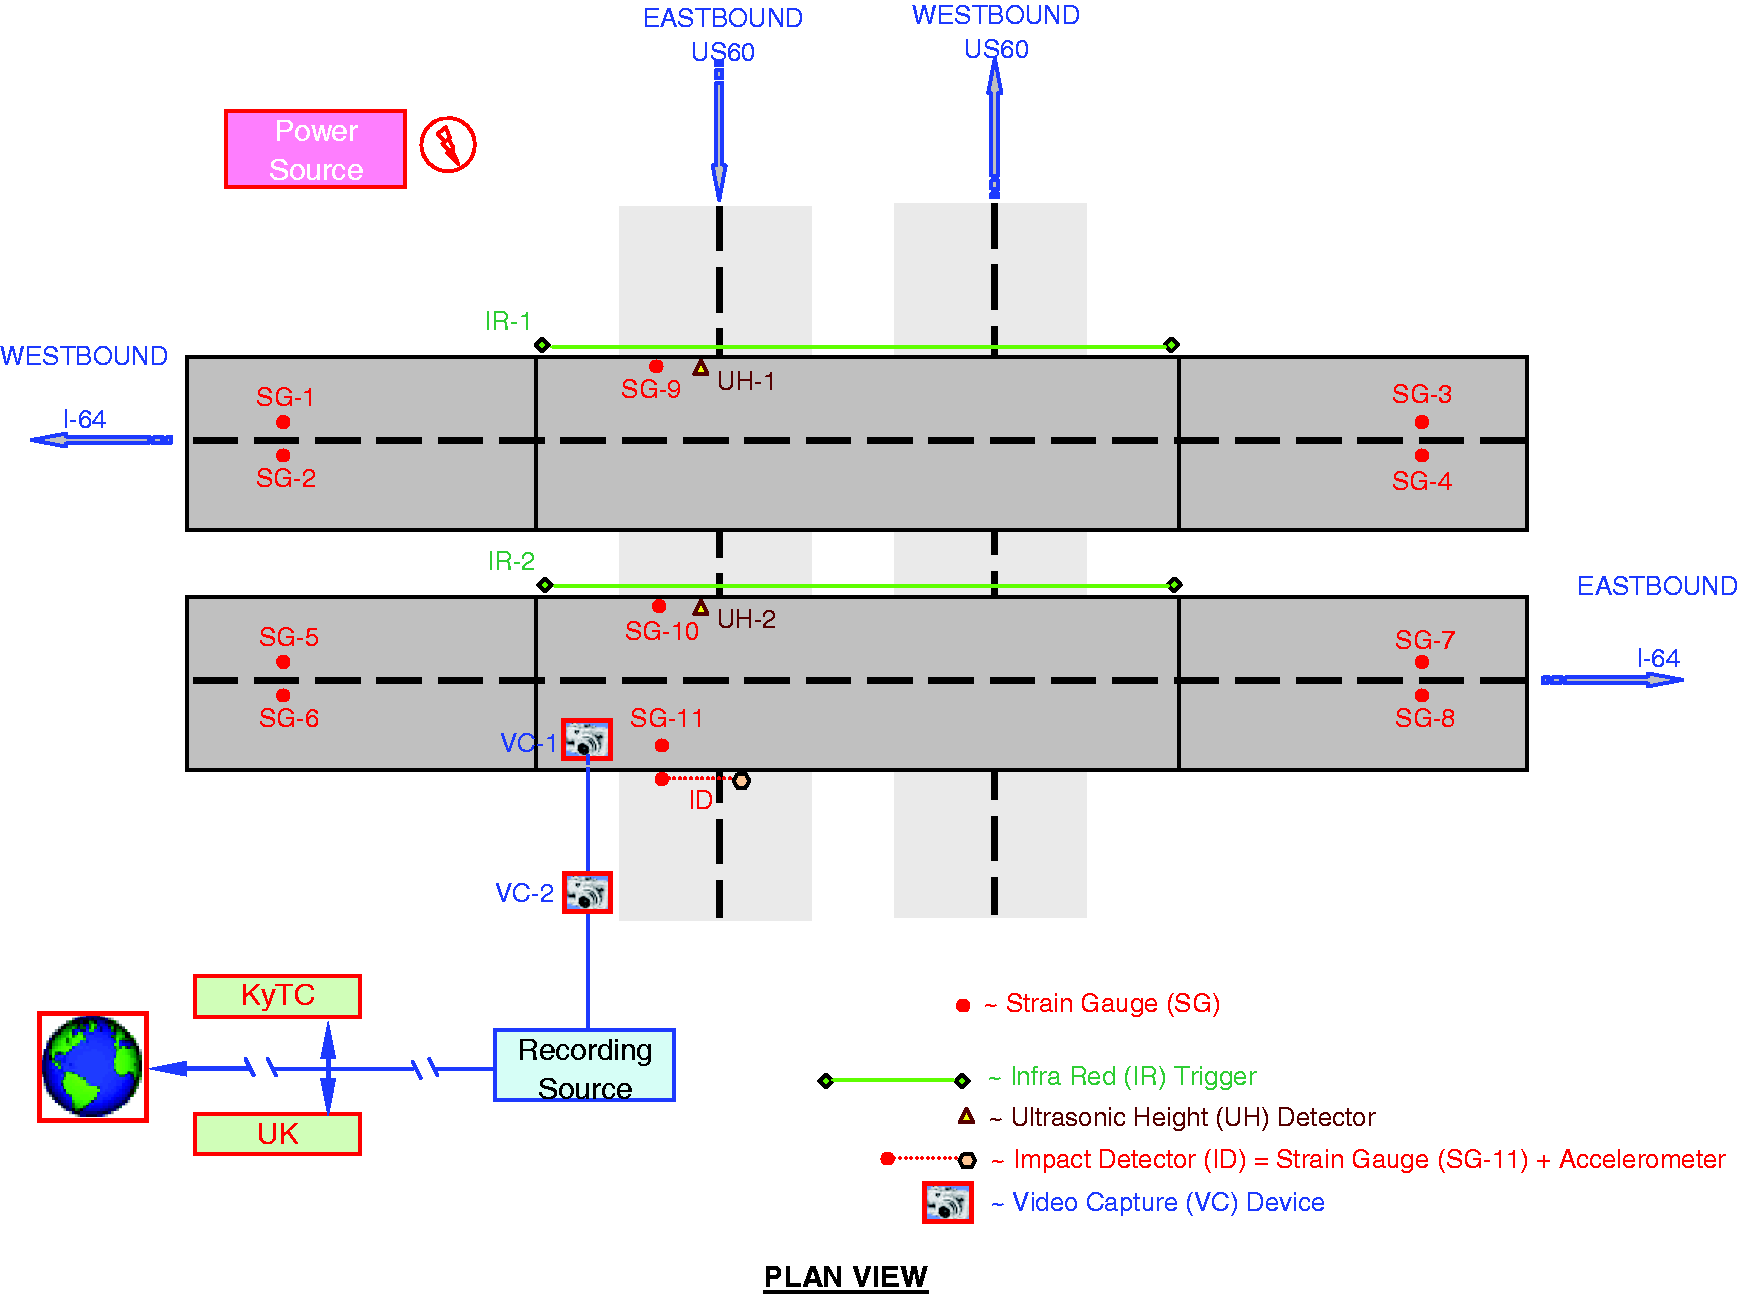
Sensor layout on I-64 parallel bridges.
Five strain gauges are in the westbound I-64 bridge, and the remaining ones are in the eastbound bridge. SG-1, SG-2, SG-3, and SG-4 on the westbound bridge and SG-5, SG-6, SG-7, and SG-8 are placed on the vertical face of the bottom flange of the two interior girders of the six plate girders. Each pair of gages (SG-1/SG-2, SG-3/SG-4, SG-5/SG-6, and SG-7/SG-8) is placed on the two girders facing each other. SG-1 to SG-8 study the strain effects under ambient conditions and compare the differences between the two ends of each bridge. The strain effects due to potential impacts are studied through SG-9 to SG-11. SG-9 and SG-10 are on the vertical face of the bottom flange on the inside of the first exterior girder facing traffic within the center span of westbound and eastbound bridges, respectively. SG-11 is on the vertical face of the bottom flange on the inside of other exterior girder on the eastbound bridge. The mounting tabs for the strain gauges were adhesively bonded to the steel beams. The wires were standard sheathed wires provided by the sensor manufacturer. These were bundled and run through a polyvinyl chloride (PVC) conduit leading to the data acquisition system.
The infrared sensors (IR-1 and IR-2) detect trucks that would impact Girder 1 on the eastbound I-64 bridge. Each sensor unit consists of an emitter and receiver mounted on a cross frame erected between the first two girders facing oncoming traffic within the center span of each bridge. When the infrared mechanism is interrupted—presumably due to a truck—the sensor simultaneously triggers its adjacent UH detector and VC to measure the truck height and capture images of the truck, respectively. A UH detector functions by sending a pulse-wave of specific frequency. When the pulse-wave encounters a solid surface (e.g., hood of a truck), the wave will reflect and return to the source. A single triaxial accelerometer is also employed on this project, with one axis oriented along the centerline of the eastbound bridge. The triaxial accelerometer has the capability of measuring acceleration in three perpendicular directions. The accelerometer unit is coupled with SG-11 to form impact detector (see Figure 3). The detection of both sudden horizontal and vertical movement by the accelerometer allowed the researchers to identify, as well as determine, the severity of an impact. The unit is continuously operational, letting it measure acceleration and vibration, whether Girder 1 of the eastbound I-64 bridge is impacted or not. The two VCs—VC-1 and VC-2—employed in this project operate as surveillance devices capable of transmitting live feeds from the bridge site. IR-1and UH-1 combined to form Detector 1, while Detector 2 is comprised of IR-2, UH-2, VC-1, and VC-2. The accelerometers, infrared sensors, ultra-sonic height detectors, and VCs were mechanically fastened on to the structure. Additional information regarding the instruments and their setup can be found in Harik et al. 11
The primary advantage of the system, if it had been continuously operational, was the ability to proactively monitor over-height impact damage to the bridge while also providing the ability to identify the vehicles causing the damage. Before SHM was implemented on the I-64 over US 60 bridges, truck impacts went undetected unless the public reported them, or they were recognized by a transportation official. The implemented setup provides an effective alternative where damage can be quickly identified and repaired. The disadvantages of the system were the continuous power requirement and the need for wired internet. One of the main challenges of instrumenting bridges, since most are in remote locations, is having access to a power supply. When the instrumentation for the I-64 bridges was set up in 2005, the available sensors and VCs required a large amount of uninterrupted direct current (DC) power. As there was no power supply near the bridge, the local power company was contacted to set up an alternating current outlet for the research team, from which the required DC power was acquired using specialized equipment. As mobile data communication was not available at the time, a wired internet connection was also established and connected to the onsite computer via a cable modem. While the system was set up successfully, it was never operational due to successive damage to the data acquisition system. The data acquisition equipment required replacement twice, once following vandalism and a second time after a lightning strike near the power supply unit. The replacement cost of the data acquisition equipment, as well as the time intervals the system was down, while funding was appropriated for replacement, was one of the drawbacks of the project that led to its decommissioning in 2011.
Barge impact detection
Bridge on NB US 41 over Ohio River (2006–2015)
Kentucky has over 1600 km (1000 miles) of navigable waterways. The Ohio River accounts for close to 70% those. Barges are the primary means of transporting goods on the Ohio River. With the amount of waterways traffic, accidents caused by barge impacts at times are inevitable. While barges travel at a slow speeds (<3.09 m/s or 6.91 mile/h), their size can be enormous (31 m (100 ft) in width by 366 m (1200 ft) in length), making maneuvering oftentimes challenging. The NB US 41 bridge over the Ohio River in Henderson County, Kentucky, is a cantilever through-truss bridge. The total length of the bridge including approach spans is 1950 m (5395 ft). The NB US 41 bridge was instrumented with sensing technology to monitor the piers from afar for impacts from a barge or barge flotilla. The implemented SHM was expected to quantify impacts and transmit information regarding their severity to the Transportation Operation Center at KYTC, the US Coast Guard, and other selected personnel. Triaxial accelerometers were mounted on the top of Piers B, C, and D to detect and measure impacts. In addition, linear variable displacement transducers (LVDTs) were mounted on the expansion bearings atop Pier B. Figure 4 depicts the bridge and indicates where instruments are located. The SHM is also equipped with video equipment to record visual evidence of vessels, barges, or flotilla, impacting the pier during any ambient condition (e.g., day, night, rain, and fog).
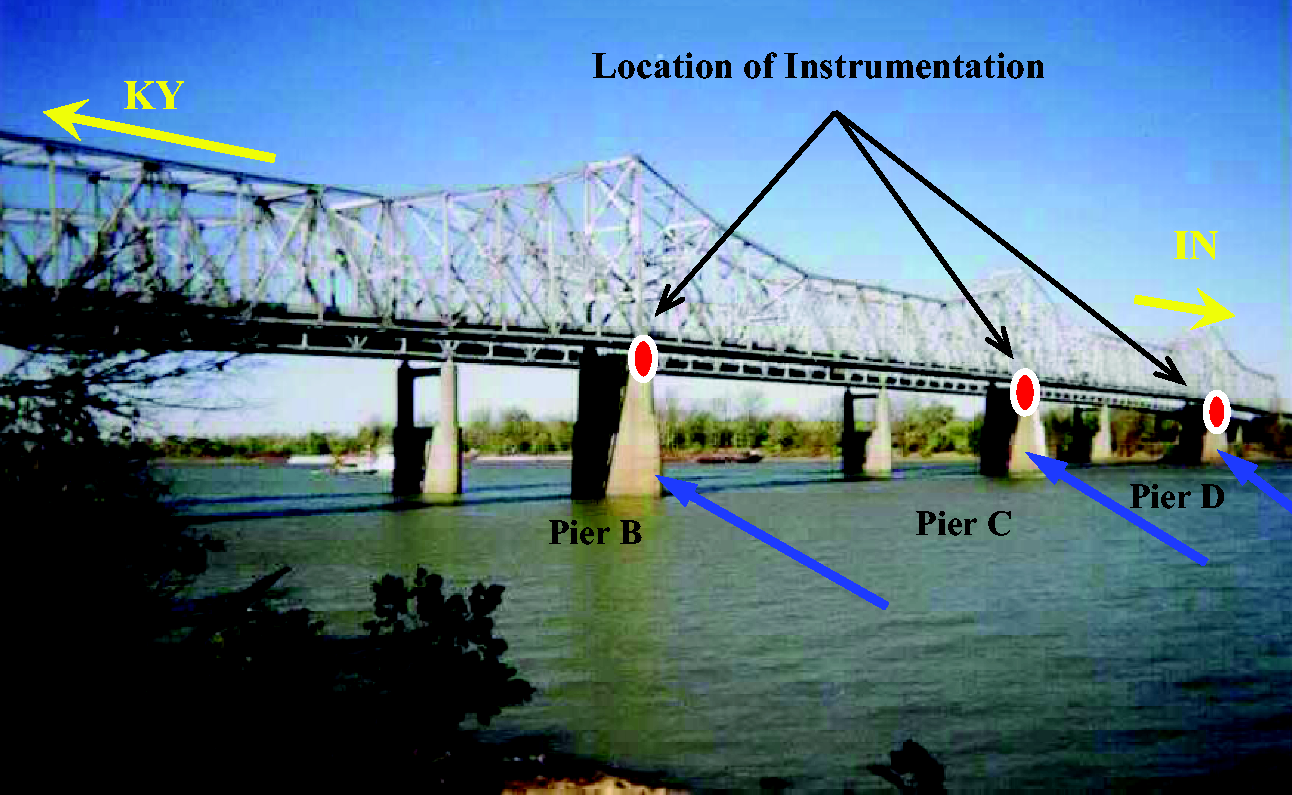
Instrumentation locations on NB US 41 bridge over the Ohio River.
Typical data collected include acceleration, displacement, and visual (video and still) records. A plot of the time history for the accelerations and displacements immediately prior to (≈2 to 5 s) and following impacts (≈15 to 30 s), as well as maximum hourly acceleration and displacement data, is accessible through the project website. Video and photographic records are stored for 10 min prior to an event and 10 min following an event. Due to the need to store a large amount of data, including video files, separate data acquisition systems were set up on each pier. The three systems operated independently when detecting impacts on any of the three piers. Each had its own cellular data connection for information transmission. The power required to operate the equipment was obtained via a large array of solar panels set up on the steel trusses. Various acceleration and displacement limits or thresholds were set to identify severe and/or critical impacts. The threshold limits in the longitudinal, transverse, and vertical directions relative to the axis of the bridge were selected based on a previous study of multi-barge flotilla impact forces on bridges. 12 An impact causing an acceleration over 0.2g was considered as severe, only an acceleration exceeding 0.05g was required to activate the system data storage prior to and immediately following an impact. A severe impact is defined as the limit or threshold of impact that would cause possible damage to the piers in question. A critical impact is defined as the limit or threshold of impact that damages the pier, an impact whose magnitude would also require closing the bridge for further inspection. Critical and severe impacts are defined for each structure based on limits for displacement at expansion joints and/or acceleration and/or strain measurements.
KYTC is required to investigate each incident where a barge impacts a bridge on the Ohio River. Most often, this requires lane closures and sometimes bridge closure. Once impacts have been identified, the system automatically notifies related personnel in the Transportation Operation Center at KYTC, the US Coast Guard, and other selected individuals. Information on the degree of impact is transmitted via text message, email, and internet uploads. Details on the impacted pier, date and time of impact, and type of impact (severe or critical) are sent, while the notified personnel can visit the website to view in real time the two expansion supports at top of Pier B; the eastern faces of Piers B, C, and D; and the surrounding areas of Piers B, C, and D. Video and/or photographic records are stored for at least 10 min prior to the event and 10 min following the event. With the aid of the SHM system, only major impacts need to be investigated. The system was designed so that it could also be expanded in the future with the capability of closing the bridge automatically if a critical impact is detected.
The SHM system was installed by a private company following a bidding process and then transferred over to KTC research team following a three-year maintenance period. Following the transfer, communication with the data acquisition system via remote access through the cell modem was found to be sporadic. This was identified as being due to differences in communication protocols following a change in the cellular data service provider. Due to the available funding limits, following the three-year implementation period, upgrades to the system were not feasible. In addition, the system’s effectiveness in detecting barge impacts was thrown into doubt following a barge impact that occurred on 10 April 2008. The magnitude of the accelerations produced by the barge impact on 10 April 2008, reported by the US Army Corp of Engineers, and the Southern Illinois Earthquake on 18 April 2008, was less than 0.05g in all three directions. Consequently, since the trigger for data capture and storage is 0.05g, only the maximum hourly acceleration is saved. Had either one of the events triggered the threshold acceleration in any direction; the event history would have been saved in place of the hourly maximum acceleration. As seen in Figure 5, the maximum hourly accelerations were less than the trigger acceleration of 0.05g.
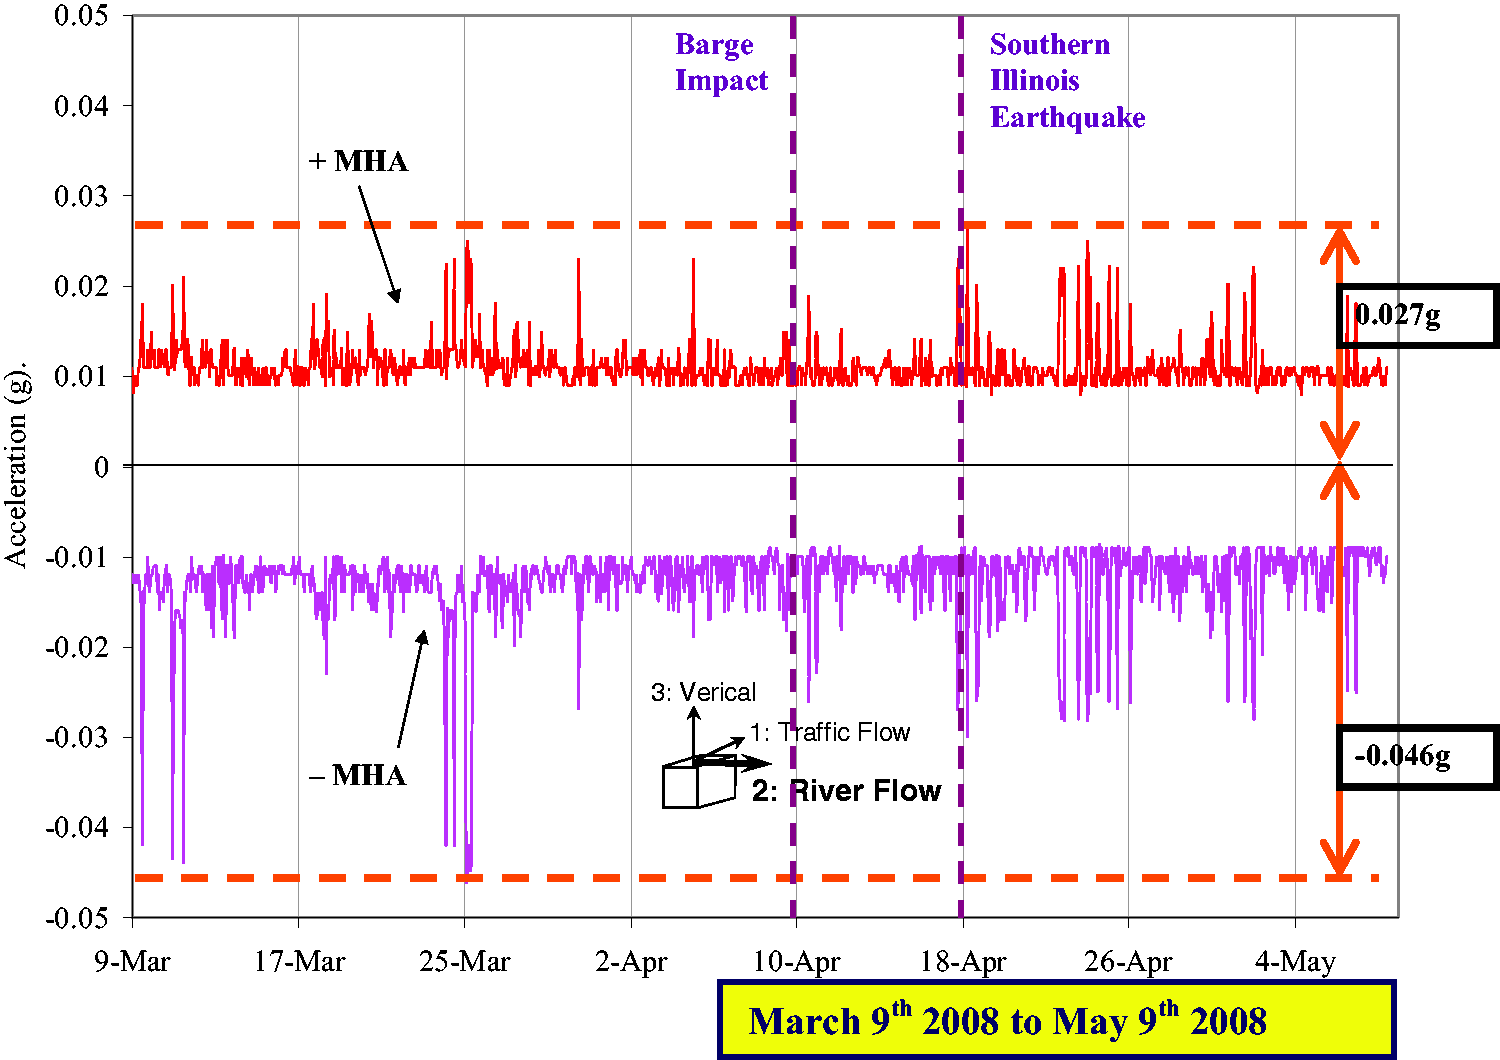
Maximum hourly acceleration at Pier D in direction 2 (River Flow) MHA: Maximum Hourly Acceleration.
Effectiveness of CFRP retrofit
Bridge on I-65 elevated expressway in Louisville (2004–2009)
The I-65 bridge in Louisville utilized short-term monitoring where instrumentation, which continuously monitored the bridge, permitted the design of an economical retrofit. 13 The bridge is on an elevated section of I-65, which travels in a north–south direction through the city of Louisville, Kentucky. The damaged section of I-65 is a parallel bridge. Each bridge carries three lanes of traffic in the northbound or southbound directions. The continuous precast PC girder spans support a reinforced concrete bridge deck of varying thickness, ranging from 200 mm to 270 mm (8 in to 10.5 in). Several elevated spans of the expressway displayed cracking in some of the precast PC girders. A total of 95 PC I-girder ends exhibited cracks. Cracking was especially prevalent near or at fixed end locations where translational movement in the bridge direction is restricted. The project aimed to repair, strengthen, and restore the capacity of the damaged PC girders using CFRP fabric.
To investigate the liveliness of the cracks, two girders (Girders designated as Beams 6 and 7) were instrumented with LVDTs in the horizontal and vertical directions to measure their respective movements. Figure 6 shows the LVDTs mounted over the cracks before and after they were strengthened with CFRP. Instrumentation was installed on 16 February 2004 and the maximum daily movement and temperature measured until 27 June 2005. Data collected over this period were used to design the retrofit measures, and once the repair was complete the LVDTs were reattached at the same locations to assess the retrofit’s effectiveness. Prior to the retrofit, the SHM indicated that the cracks, though active, were within acceptable limits. This permitted the use of CFRP fabric to strengthen the girders, avoiding the more expensive alternatives of extending the pier cap support or construction of new piers. Monitoring following the retrofit confirmed that a significant reduction in horizontal movement attributable to the retrofit (Figure 7), while in the vertical direction, the retrofit prevented the further increase of vertical movement. It should be noted that the crack measurement following the retrofit, starting on 3 September 2006, was initiated at the final measurement recorded prior to the retrofit (27 June 2005).
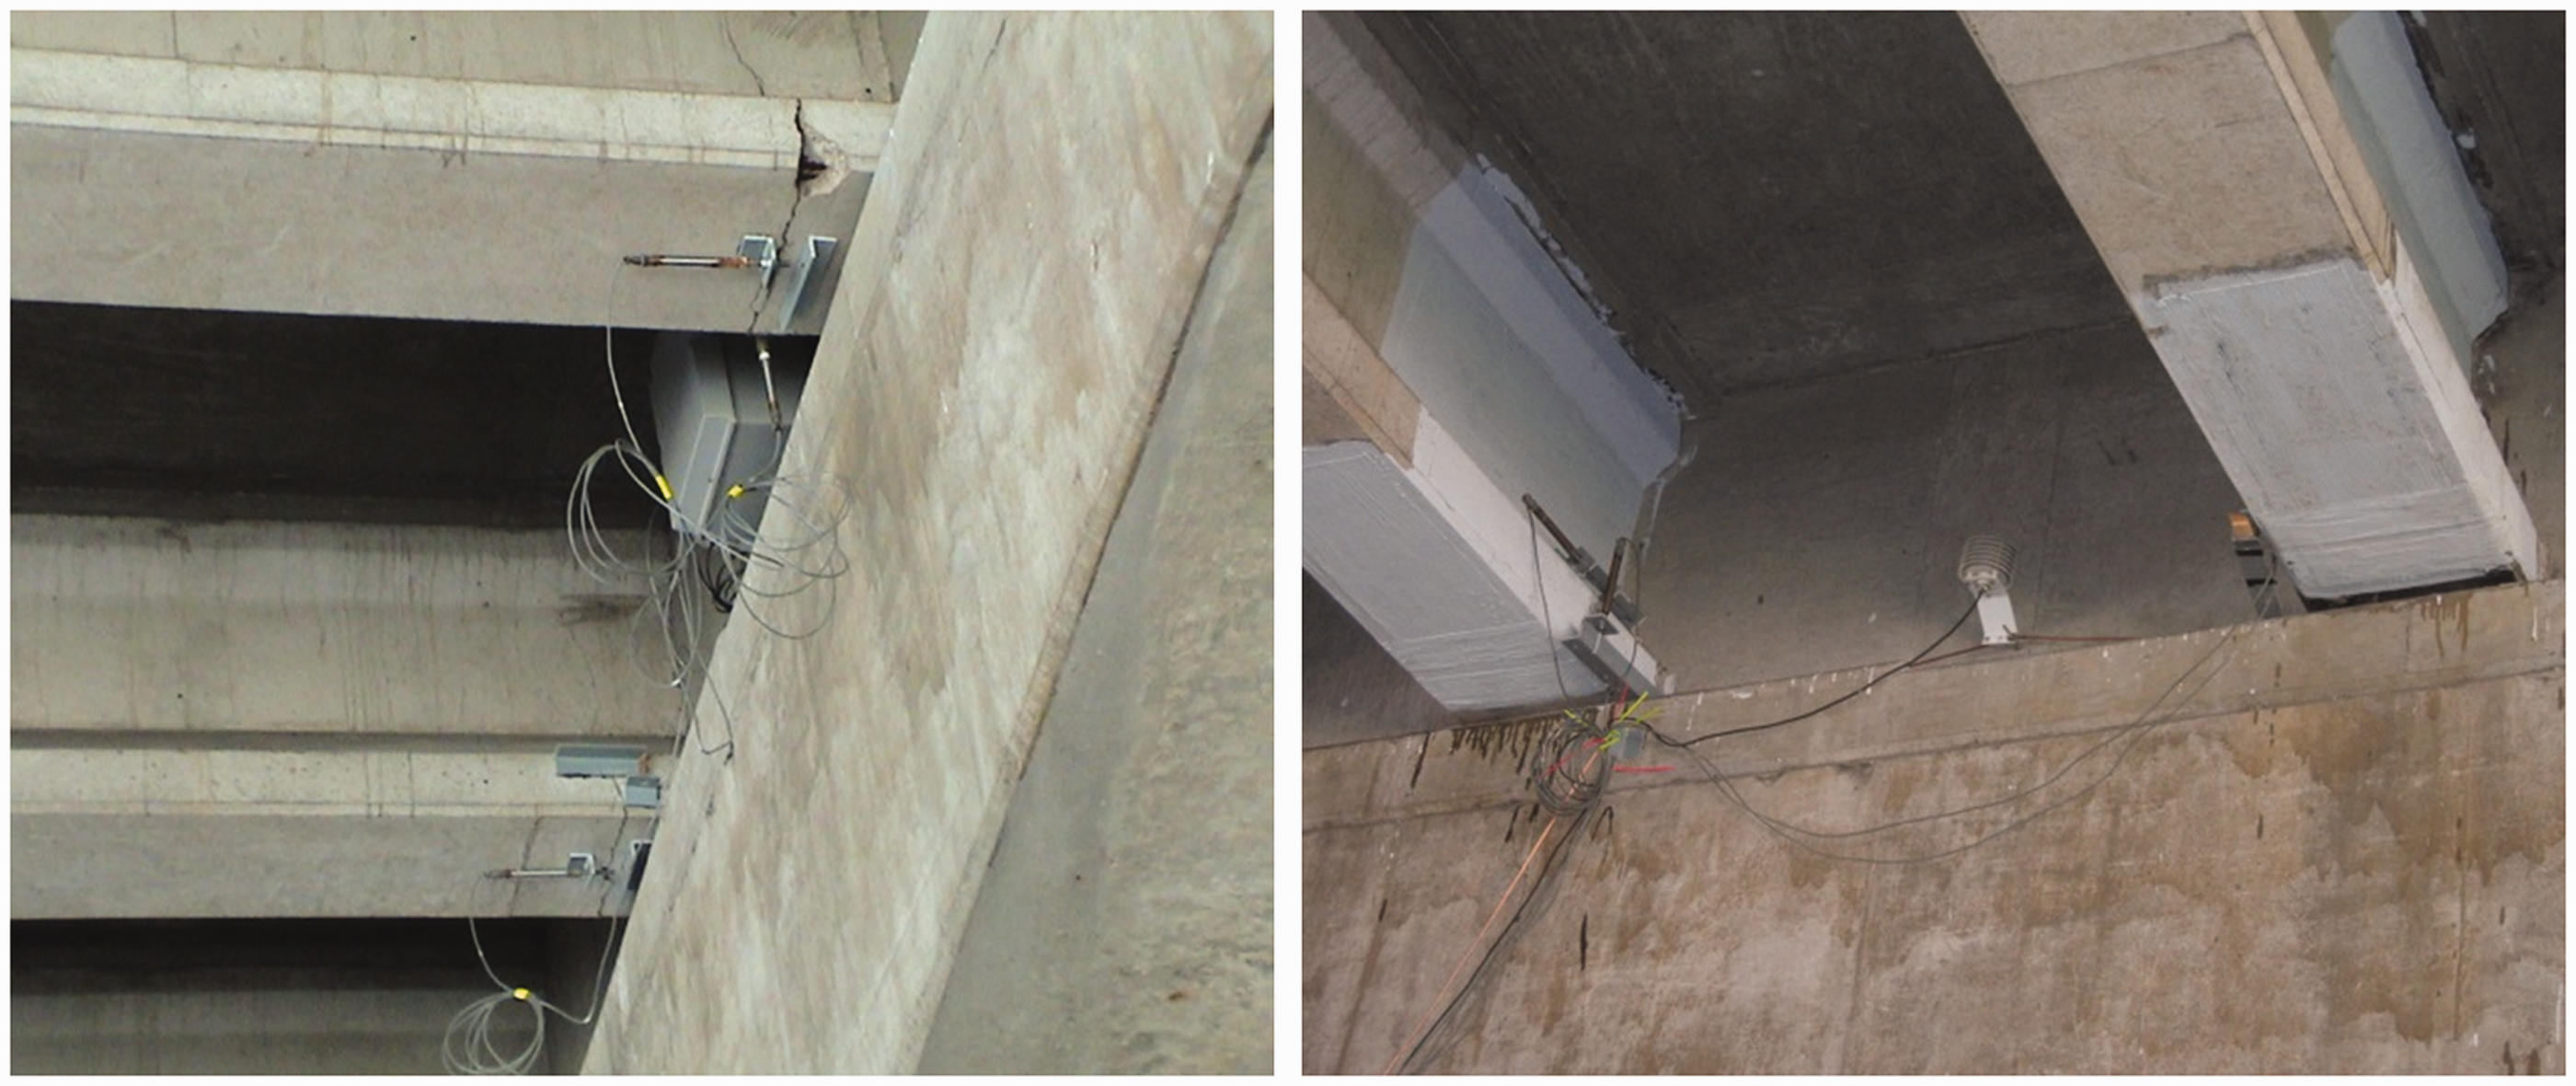
Instrumentation on Beams 6 and 7 before and after strengthening with CFRP sheets/fabric.
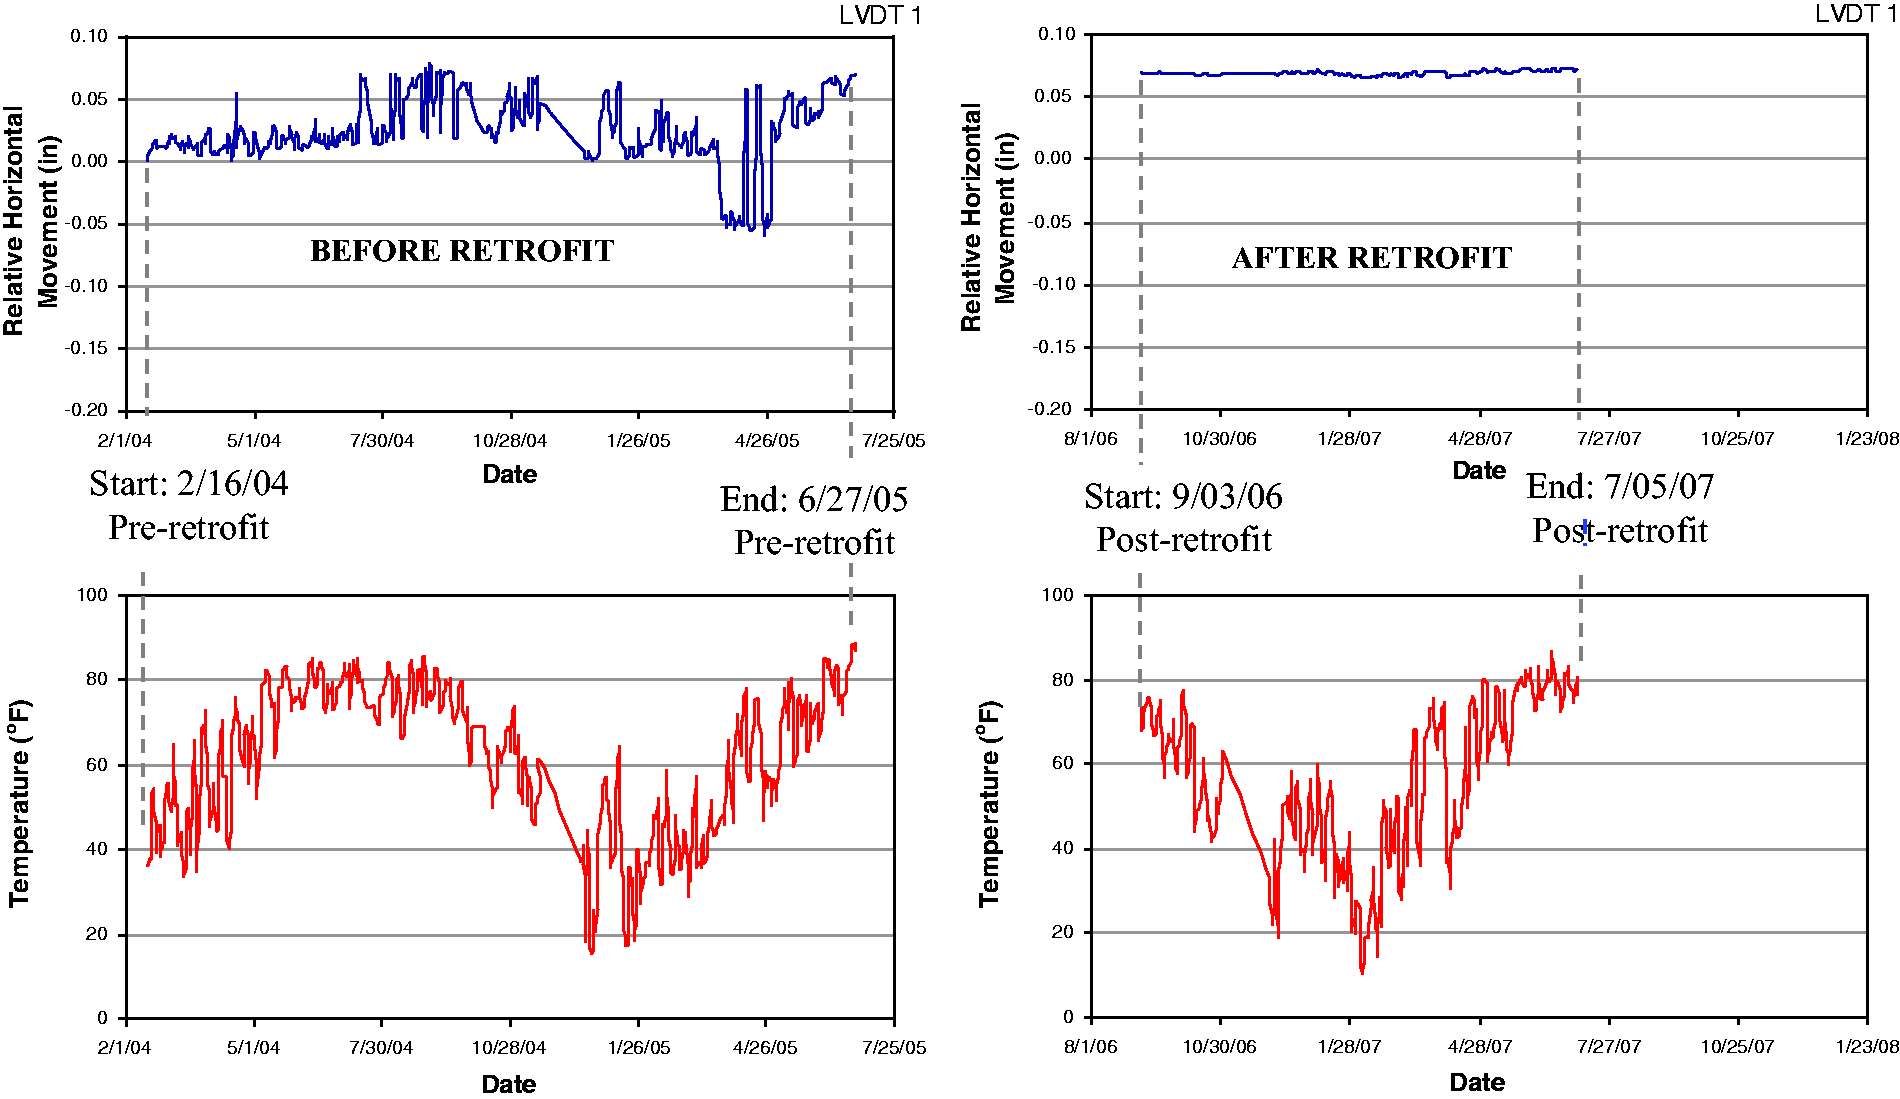
Relative horizontal movement measured at Beam 6. LVDT: linear variable displacement transducer.
Considering the number of PC beam ends that required strengthening and the expensive alternative repair methods, the I-65 project offers a great example of SHM providing information that facilitated selection of a lower cost option.
Effect of thermal loads on bridge substructure
Bridge on KY 100 over Trammel Creek (2011–present)
Temperature-induced internal stress development in superstructure members has prompted the American Association of State Highway and Transportation Officials (AASHTO) to establish provisions for determining superstructure temperature load effects on overall bridge design. 14 Furthermore, for construction types such as integral abutment bridges, the design of intermediate piers can be strongly influenced or even primarily controlled by the AASHTO thermal load requirements (depending on pier height). The New Trammel Creek Bridge was instrumented with temperature and bridge response monitoring devices to compare measurements of temperature-induced soil pressures to pressures derived from the AASHTO design provisions and bridge finite element analysis (FEA). 15 Of the three techniques available in the AASHTO provisions to determine temperature-load effects on bridges, AASHTO Procedure B was used in the design of the New Trammel Creek Bridge. The bridge is a four-span (two-lane) integral abutment bridge with span lengths ranging from 24.4 m to 36.6 m . The bridge spans are supported at the bridge’s far ends by integral end bents consisting of reinforced concrete wing walls, wall stems, and steel h-piles. Three evenly spaced (at 36.6 m or 120 ft) reinforced concrete bridge piers support the intermediate spans of the integral abutment bridge, where each pier contains a large shear wall and three pier columns. Each pier column span terminates below on thick reinforced concrete spread footings. To achieve the research objective, the bridge was fitted with pressure cells at select foundation locations (Figure 8).
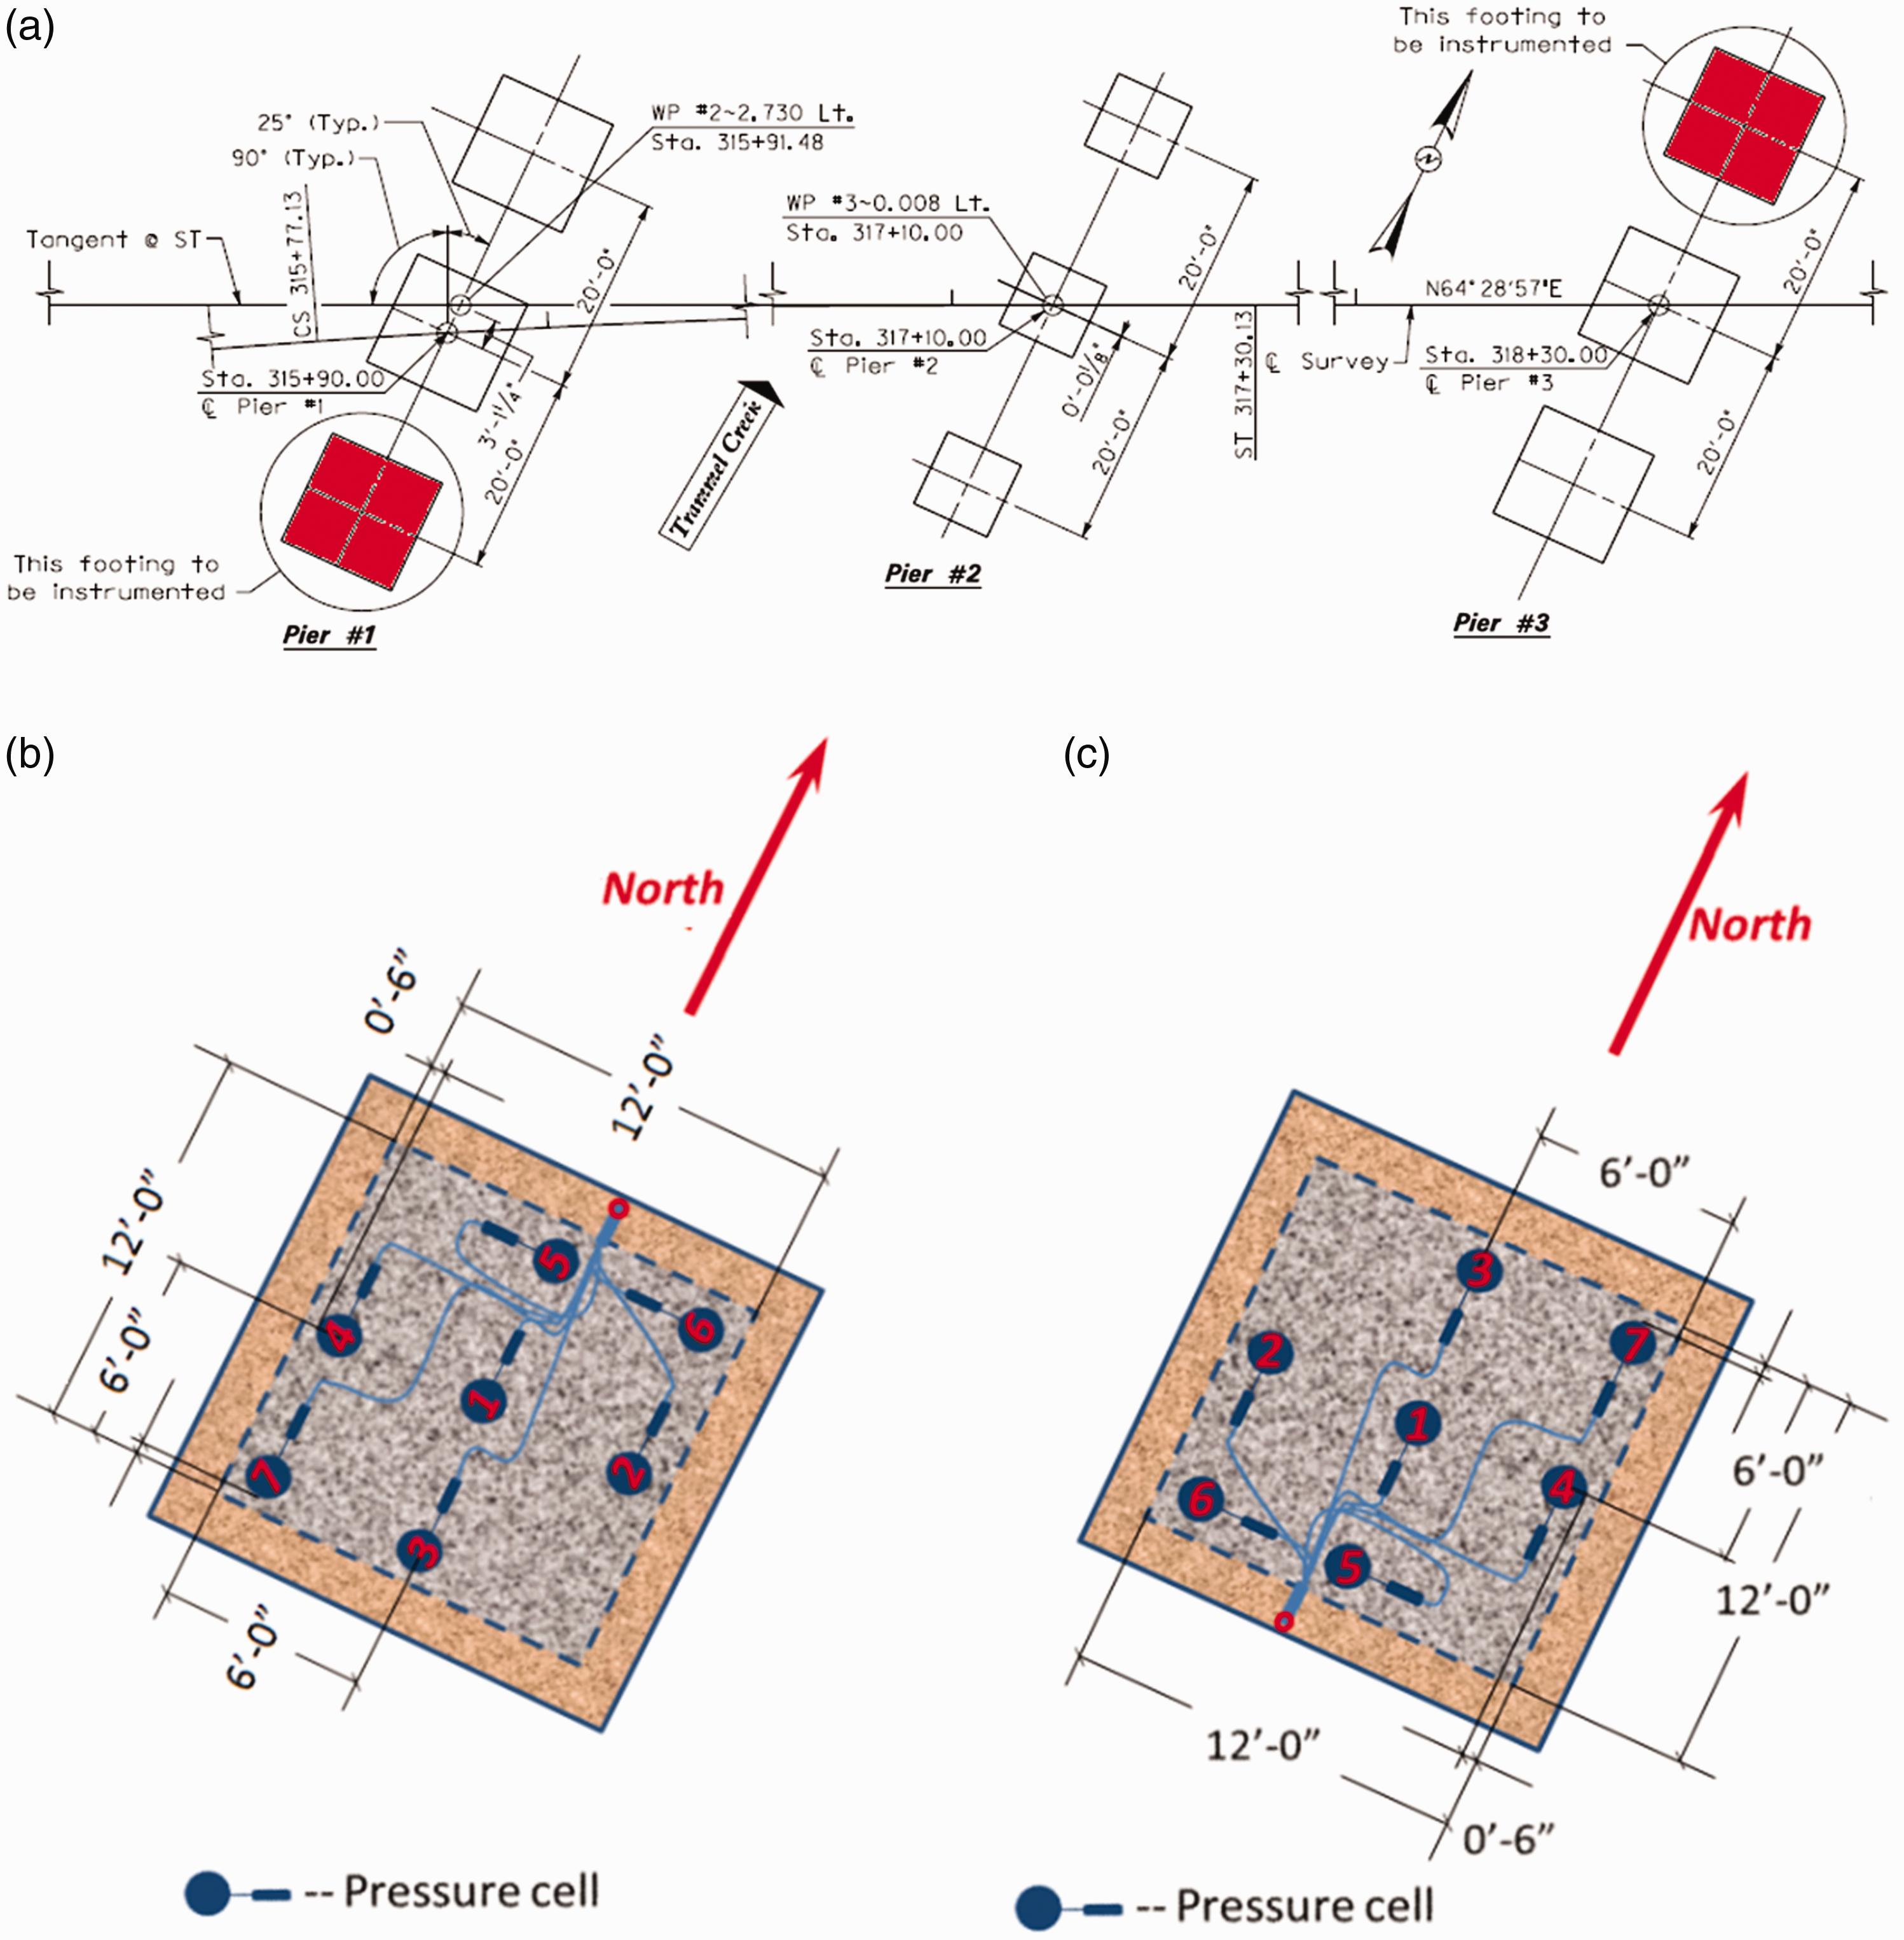
Pressure cell instrumentation: (a) Plan view of pier foundations showing instrumented footings, (b) pressure cell layout beneath Pier 1, and (c) pressure cell layout beneath Pier 3.
Tiltmeters were installed on the outermost faces of pier caps. After the PC superstructure girders were installed and reinforced concrete diaphragms poured atop each pier, thermocouples were affixed to the south face of the superstructure rails, where placement locations lie directly above Piers 1 and 3. Continuous data collection began in May 2011 and continues today.
Finite element (FE) modeling and analysis of temperature loadings on the bridge were used to estimate the bridge pier motion and foundation pressures using methodologies provided in AASHTO design provisions. Estimates were compared to physical measurements obtained at the bridge site. This established a foundation to assess the merit of current AASHTO provisions related to temperature-induced response for the study site. Data records for Pier 1 (Figure 9) indicated that the pier footings were designed to limit pressures to approximately one-half of the allowable bearing capacity for the bridge site (450 kPa or 65 psi). Comparing the FEA-derived pressures generated by introducing extreme temperature values specified in the AASHTO provisions and field data indicates that the AASHTO design provisions produce conservative estimates of foundation design pressures.
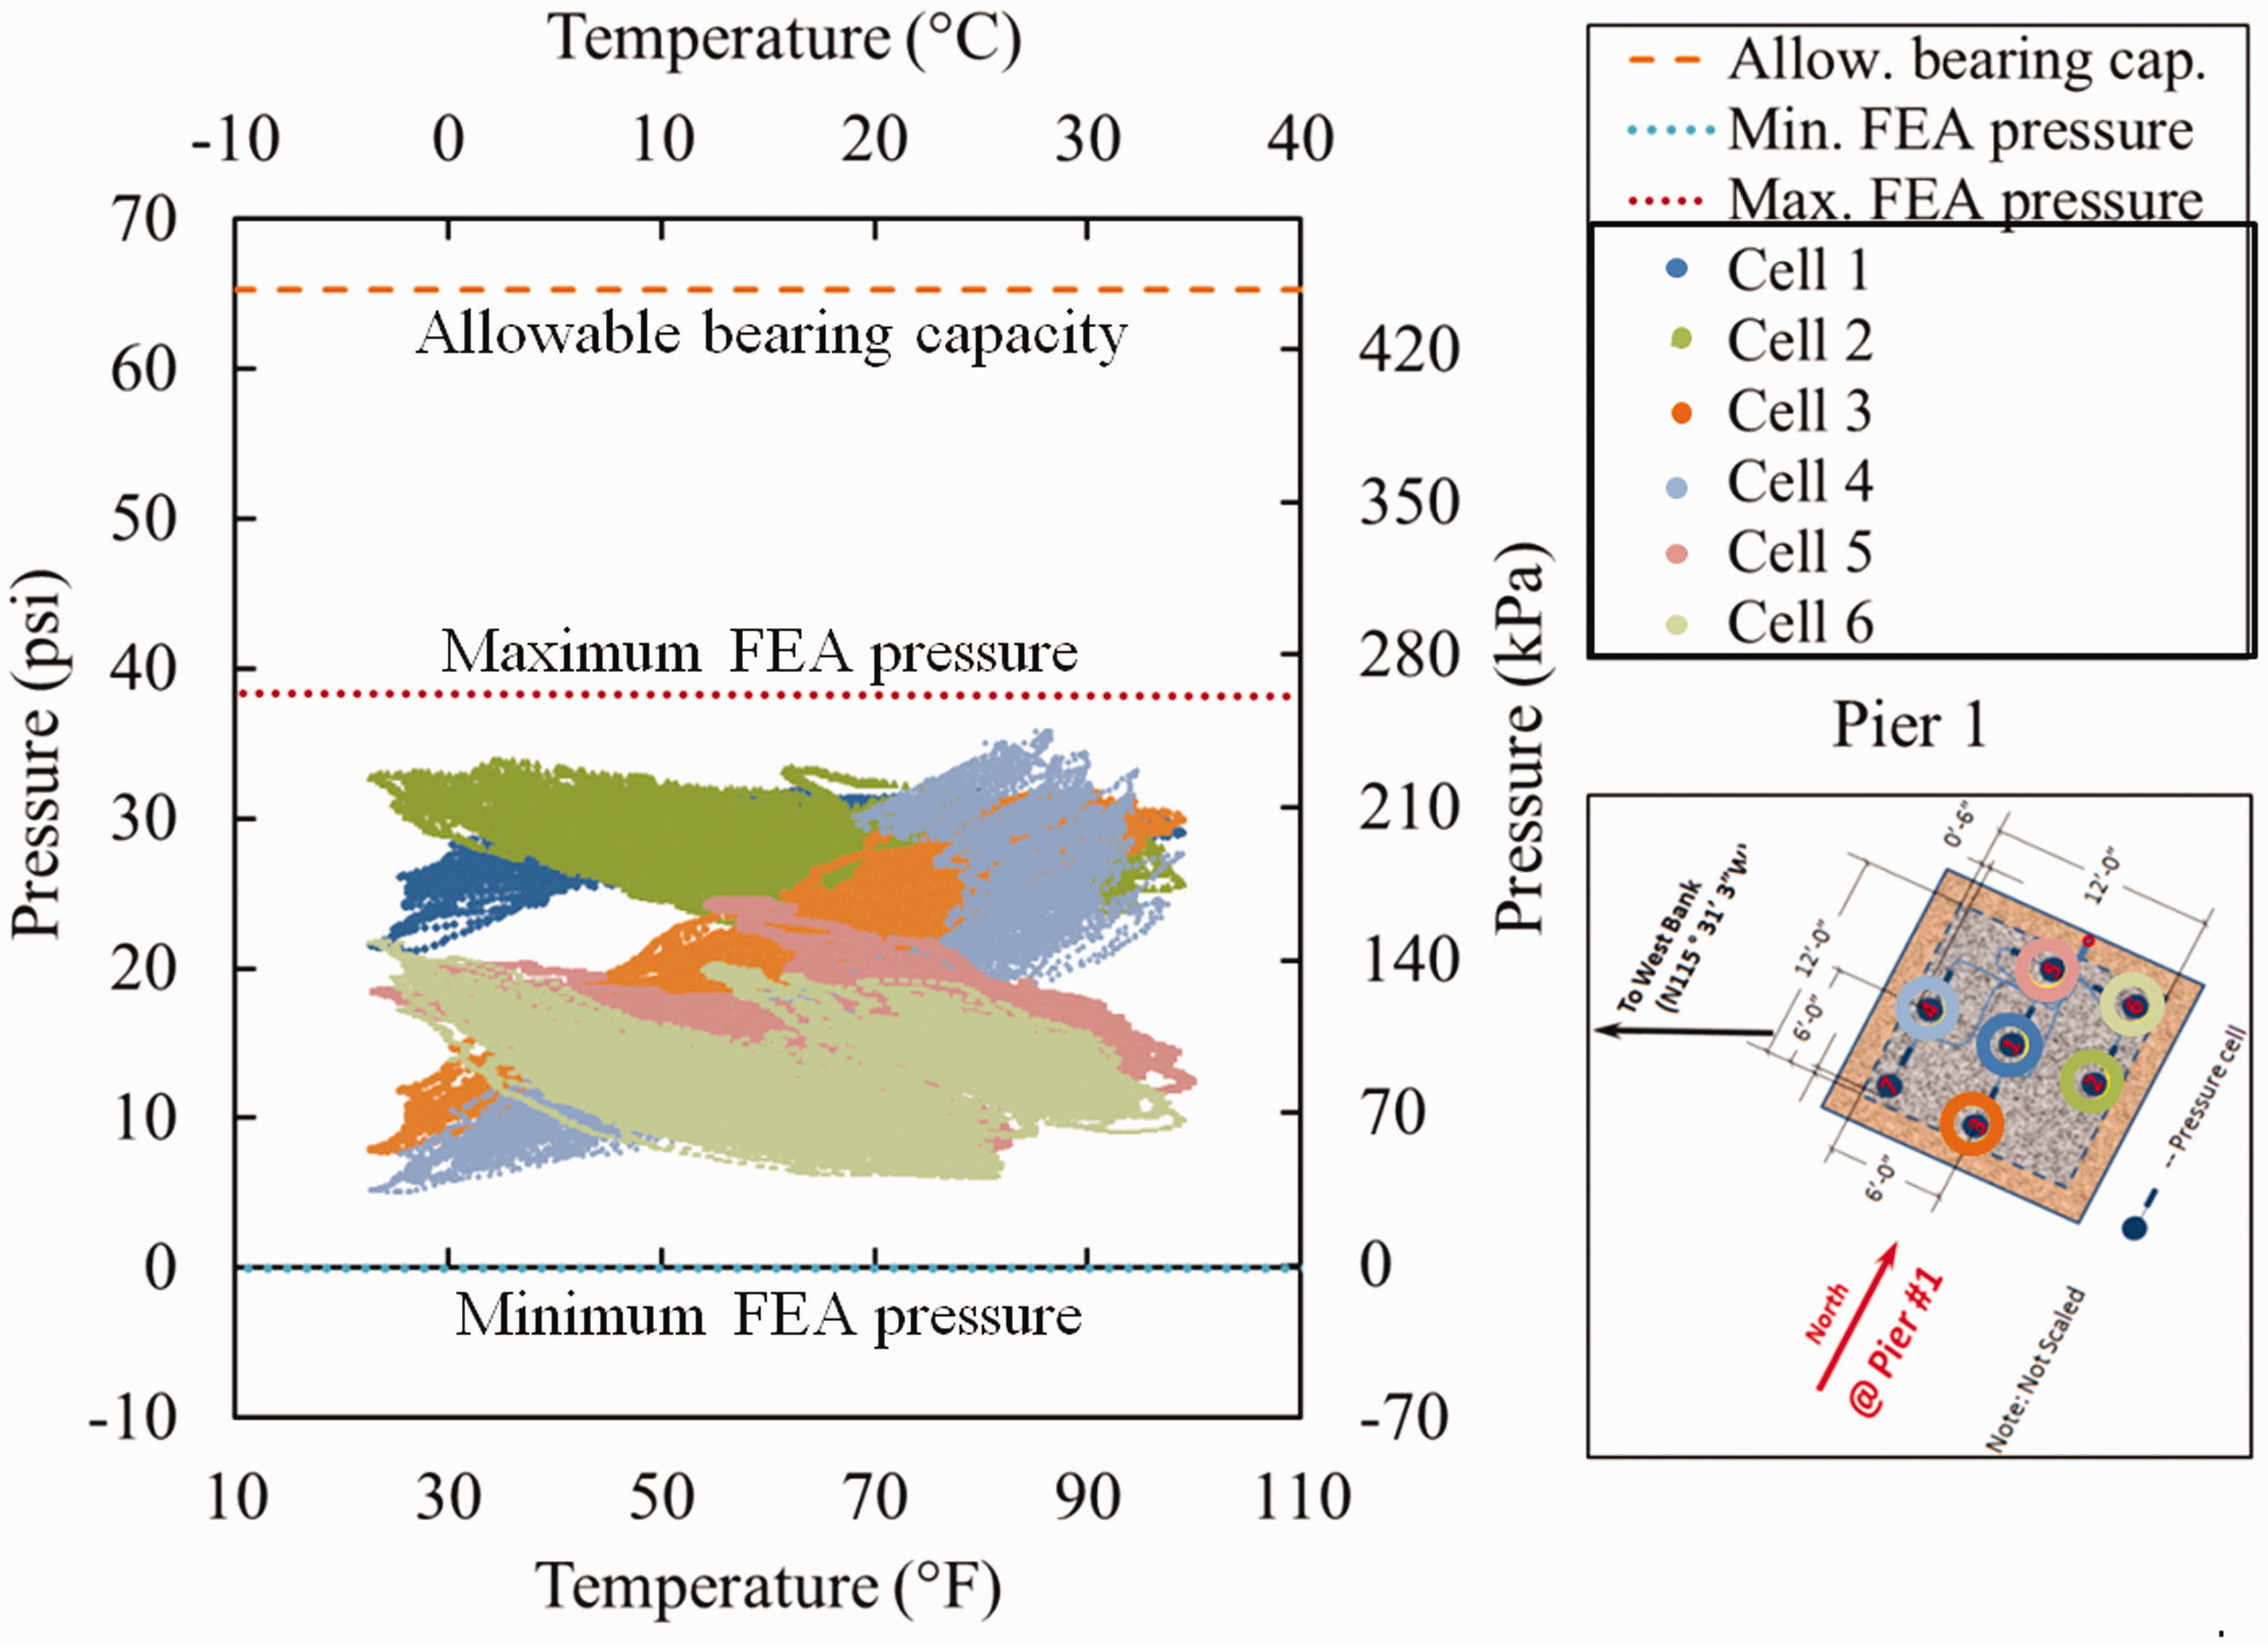
Pier 1 foundation bearing pressures versus temperature. Note that Cell 7 is defective. FEA: finite element analysis.
Because this study involved placing instruments on a new bridge, ensuring sound communication among the design engineers, contractor, KYTC district engineers, and the research team was of paramount importance. The pressure cells needed to be placed within a layer of crushed stone underneath the spread footings of the piers. Once the pressure cells were placed over a compacted layer of crushed stone, the layer covering it had to be leveled and compacted using non-vibratory equipment to prevent damage to the pressure cells. Constant monitoring of the sensor reading during this period is also important as replacing the pressure cells is not an option once the footings are cast. Pressure Cell 7 beneath the Pier 1 footing and pressure Cell 5 beneath Pier 3 footing were found to be defective after concrete was placed on the footing. However, the remaining sensors provided sufficient data for the SHM to successfully evaluate the AASHTO design provisions.
Thermal movement of expansion joints
Bridge on Eastbound I-24 over Tennessee River (2000–2017)
Steel bridge deflection varies with bridge temperature and temperature gradient. Bridge expansion joints move periodically throughout the day (short period) and year (long period) in harmony with temperature fluctuations. The length of an expansion joint is crucial to avoid secondary stresses on the superstructure and also to maintain smooth movement of vehicular traffic. The SHM study was undertaken to further illuminate thermal loading response of steel bridge superstructures and to assess the robustness of extant AASHTO temperature loading provisions 14 for a full-scale in-service bridge.
The parallel Tennessee River Bridges on I-24 in western Kentucky are steel plate-girder bridges. Each bridge consists of nine spans symmetrically located on either side of the tied-arch main span and has a total length of 643 m (2109 ft 10 in). The main spans of each bridge are a single span steel-girder tied-arch with a span length of 163 m (534 ft 4 in). Five locations that were free to move were instrumented along the length of the eastbound bridge (Figure 10). Two of these locations (Locations 1 and 5) were the abutment ends of the two approach spans. Locations 2 and 4 were the other ends of the approach spans, where they meet the main span, over Piers 4 and 5. The final place instruments were installed (Location 3) was the free end of the main span over Pier 5. The SHM setup on the eastbound I-24 Bridge was designed to collect data on temperature and displacement. Parameters measured by the instruments include the expansion and contraction as well as the inclinations of instrumented bridge ends. The temperature of the bridge girders is also monitored. The instrumentation included LVDTs to measure longitudinal displacements of the girders in the approach and main spans. A total of nine LVDTs were installed. Eleven temperature sensors recorded the temperature of the steel girders and concrete deck. Eight tilt meters recorded the inclination of the steel girders in the two approach spans as well as the main span. The layout of the locations and the type of instrumentation used at each location are provided in Figure 10. Data loggers were installed at each abutment and the two piers to gather data on displacement, tilt, and temperature. Additional instrumentation was set up for remote monitoring and periodic data backup. The instrumentation readings at each location are transmitted wirelessly to a transmitter at one location, from where the data are periodically uploaded to the KTC servers using a phone modem via a cellular data connection.
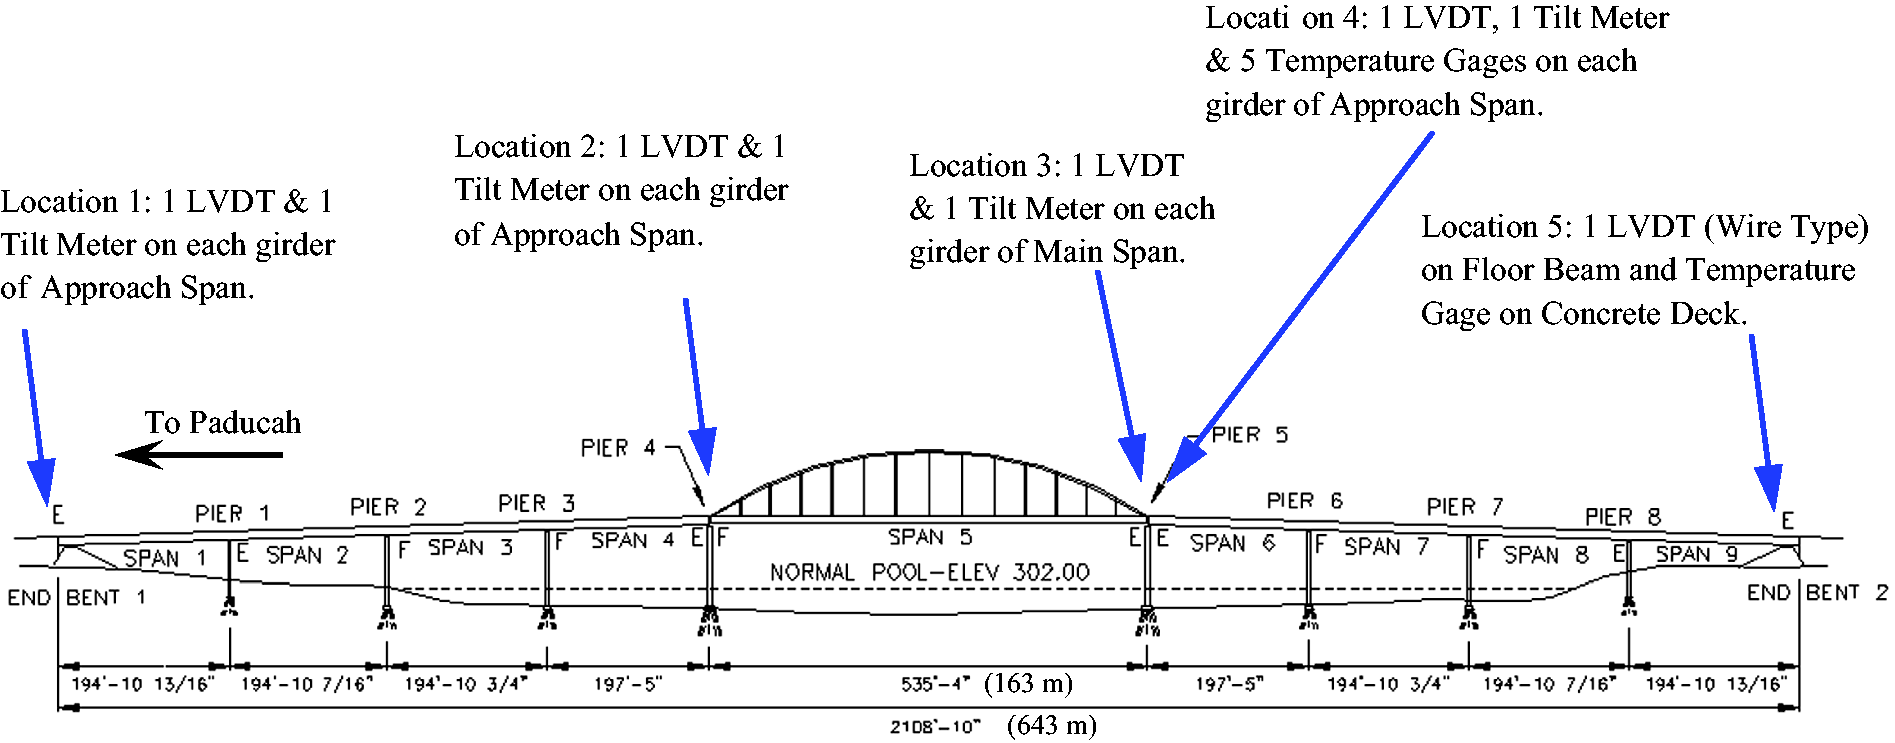
Instrumentation locations of Eastbound I-24 Bridge. LVDT: linear variable displacement transducer.
The maximum diurnal temperature difference, within one year, occurred on 9 October 2010. The data for the 24 h period from the five temperature sensors on the north girder of the approach span are shown in Figure 11. The temperature data show that, under direct solar radiation, the diurnal temperature difference in the steel girder is 18°C (32°F). The bottom of the concrete deck had a smaller temperature variation, with the maximum temperature difference being 9°C (16°F). The temperature variation for the south side showed a similar variation for the 24 h period shown in Figure 11. Due to the bridge alignment and its geographic location, the temperature gradients at the north appear milder, while the temperature gradient at the south is more prominent. Studying long-term temperature variations shows that temperature difference of the steel girders varies more in winter than in summer in this part of Kentucky.
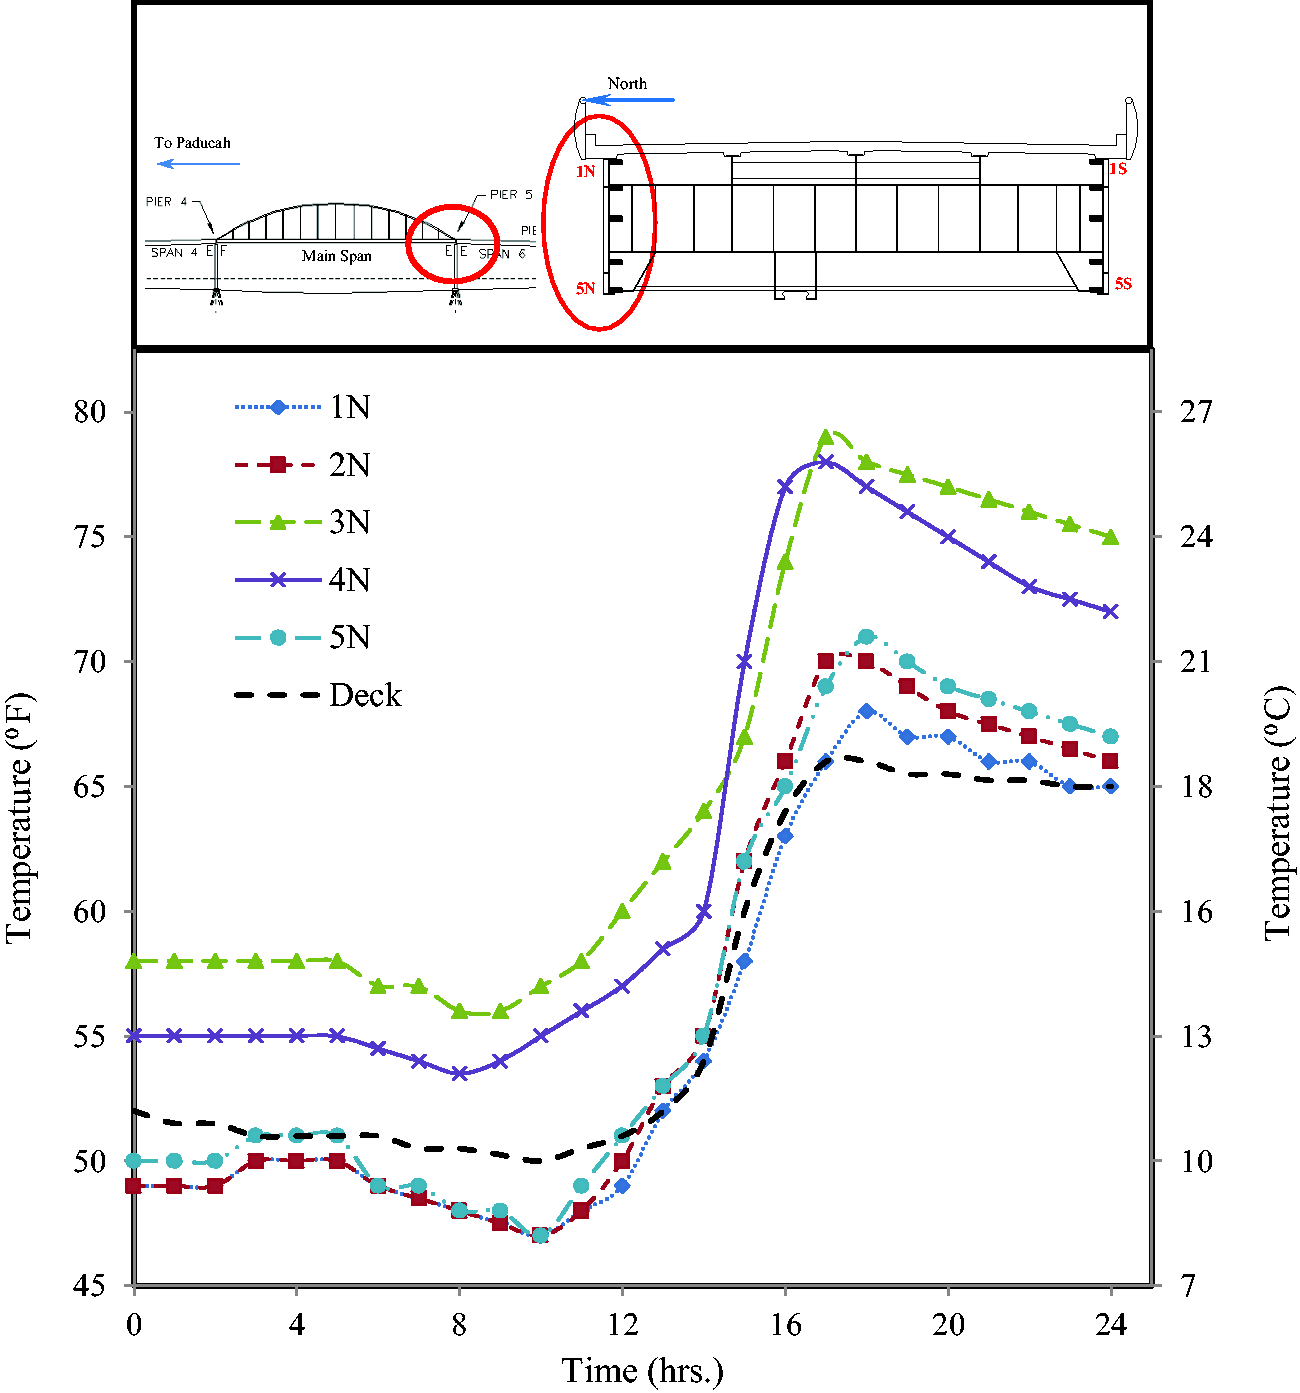
Temperature variation with time on the north girder on February 20, 2011.
A detailed FE model of the bridge was expected to be developed and calibrated using field data. Making its representations of the actual structural behavior as accurate as possible would enable prediction of the expansion joints’ maximum thermal movements under extreme temperatures. These can then be compared with the corresponding design values for verification. Predicting movement at the expansion joint would require that the LVDT and tilt meter on both girders on either side of the joint perform continuously and error free. For overall bridge model calibration, these data were required at all monitored locations. Due to periodic failure of several gauges and communication errors with the cell modem, data could not be gathered continuously for extended periods of time. Due to the fracture critical nature of the bridge, the research team could not drill or weld on to the steel girders in order to attach the gauges. All tilt meters were adhesively bonded to the girders, which were found to be unreliable. The communication errors were due to failure of the vibrating-wire analyzer modules which were utilized to wirelessly communicate between two of the instrumentation locations and the base station housing the data logger and cellular modem. The data acquisition system was not built to store long periods of data onsite. With the bridge being located 400 km (249 miles) away from the researchers, along with lane closures being needed for access to rectify the gauges and communication errors meant large gaps in collected data, it was not possible to quickly remedy problems. Additionally, the expansion joints on either side of the main span were replaced without the research team’s knowledge during the monitoring period. Insufficient communication between the research team and KYTC maintenance engineers resulted in a large amount of data loss. Due to the unavailability of accurate displacement and tilt data that were continuously gathered, and funding to upgrade the instrumentation falling outside the initial grant period, the SHM was decommissioned without much success.
Crack growth monitoring
Bridge on I-275 over Ohio River (2012–present)
A routine KYTC inspection of the I-275 Bridge over the Ohio River revealed cracks in similar locations on the webs of several floor beams in the main span. The 1235 m (4051 ft) bridge is a continuous steel arch-shaped truss, with a main span of 229 m (750 ft). The cracks were near the top of the web, at the end of the floor beam. Holes were drilled at the crack tips with the expectation of arresting crack growth. Prior to repair work, it was deemed necessary to evaluate if the cracks were widening over time. A vibrating wire micro crack meter was placed across a selected crack and the movement measured in real time (Figure 12). The data acquisition system transmits the crack data to a server by cell modem every 10 min. Crack opening thresholds were established; once threshold values were exceeded, stakeholders received an immediate email notification.
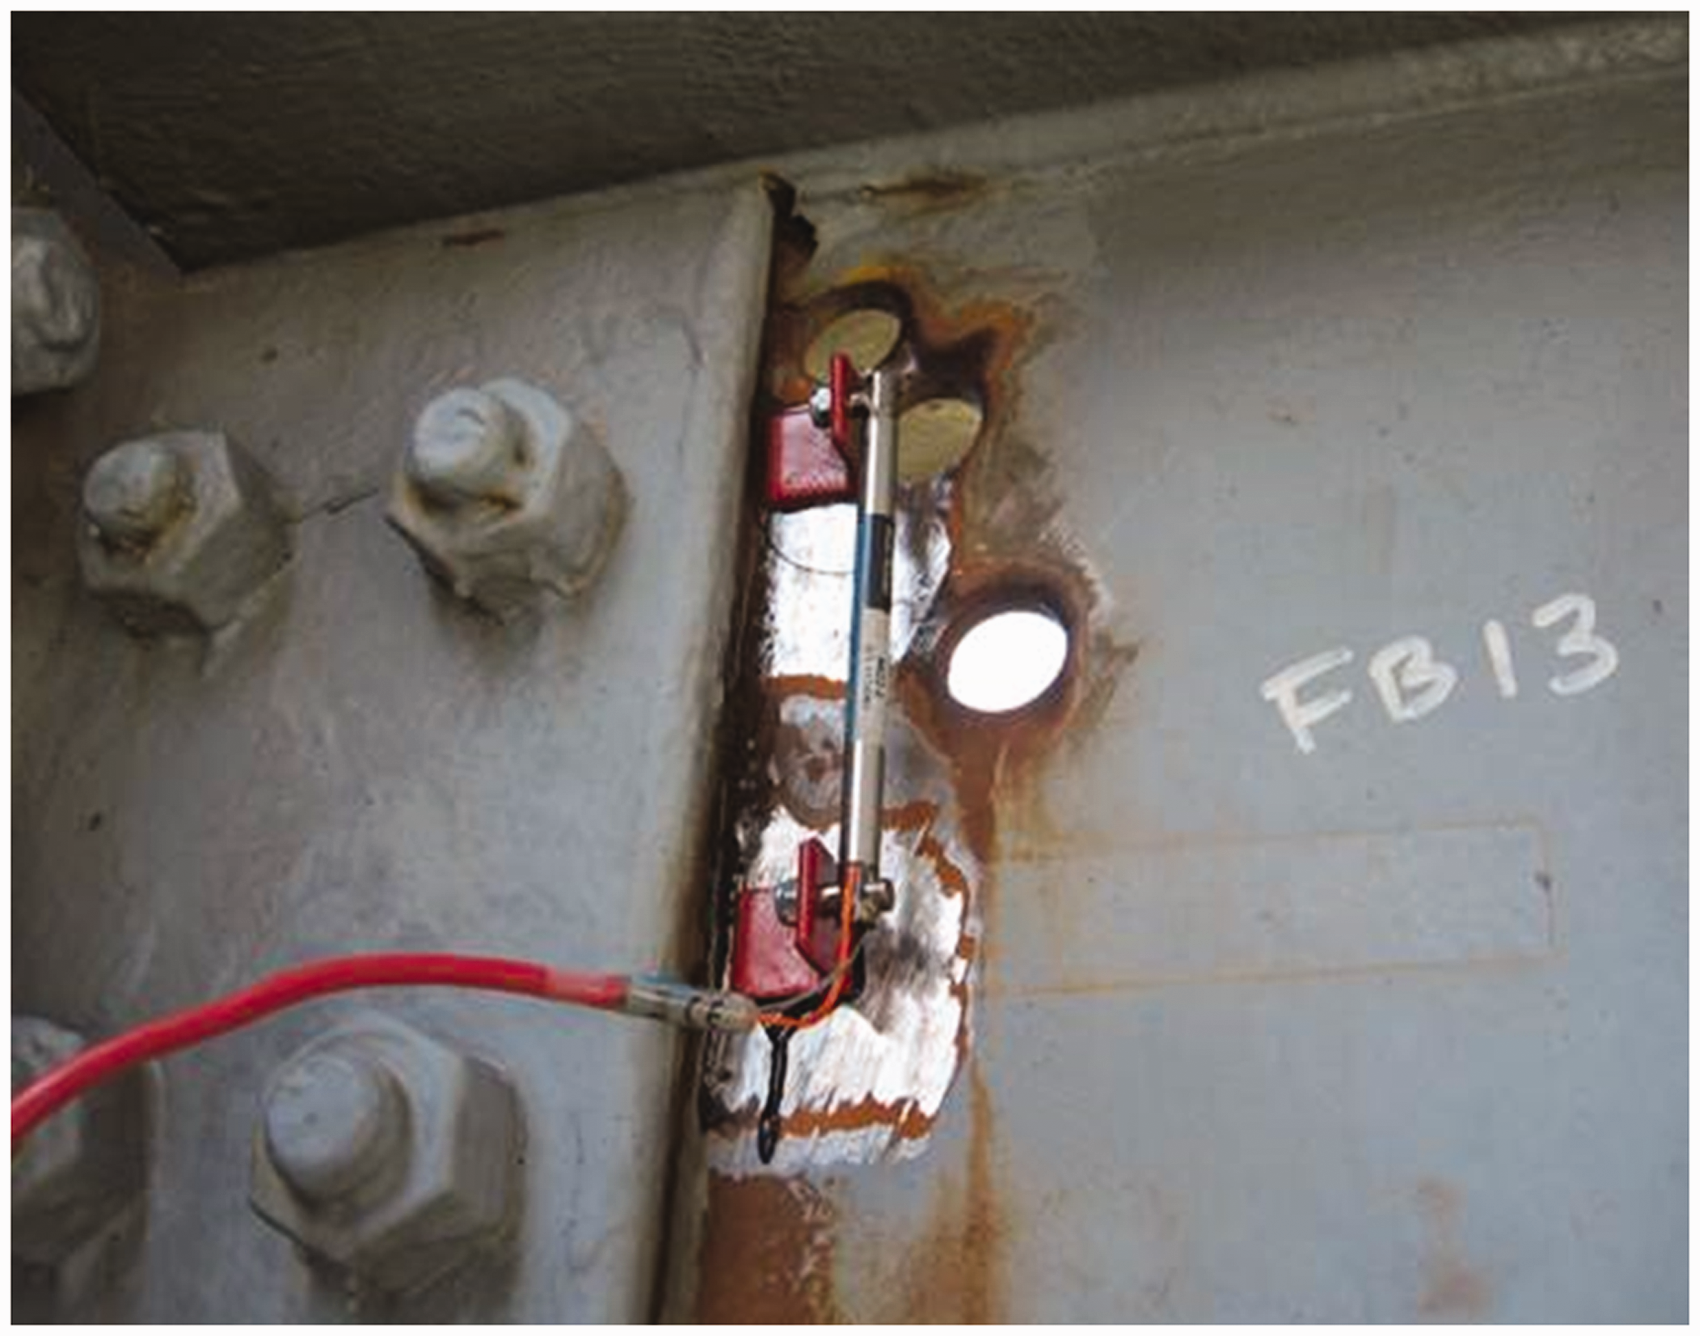
Crack gauge setup.
The simple SHM, set up in 2012, has been continuously operational and verified that the crack growth has been arrested. With cracks not progressively growing, additional costly repairs were deemed unnecessary. The crack displacement and temperature data can be retrieved for a given period via the KTC Remote Bridge Monitoring website. Figure 13 shows data for 2017, with a displacements data interval of 30 min. The maximum and minimum crack openings, as well as temperatures and the corresponding dates, are also tabulated by the website for the chosen duration.
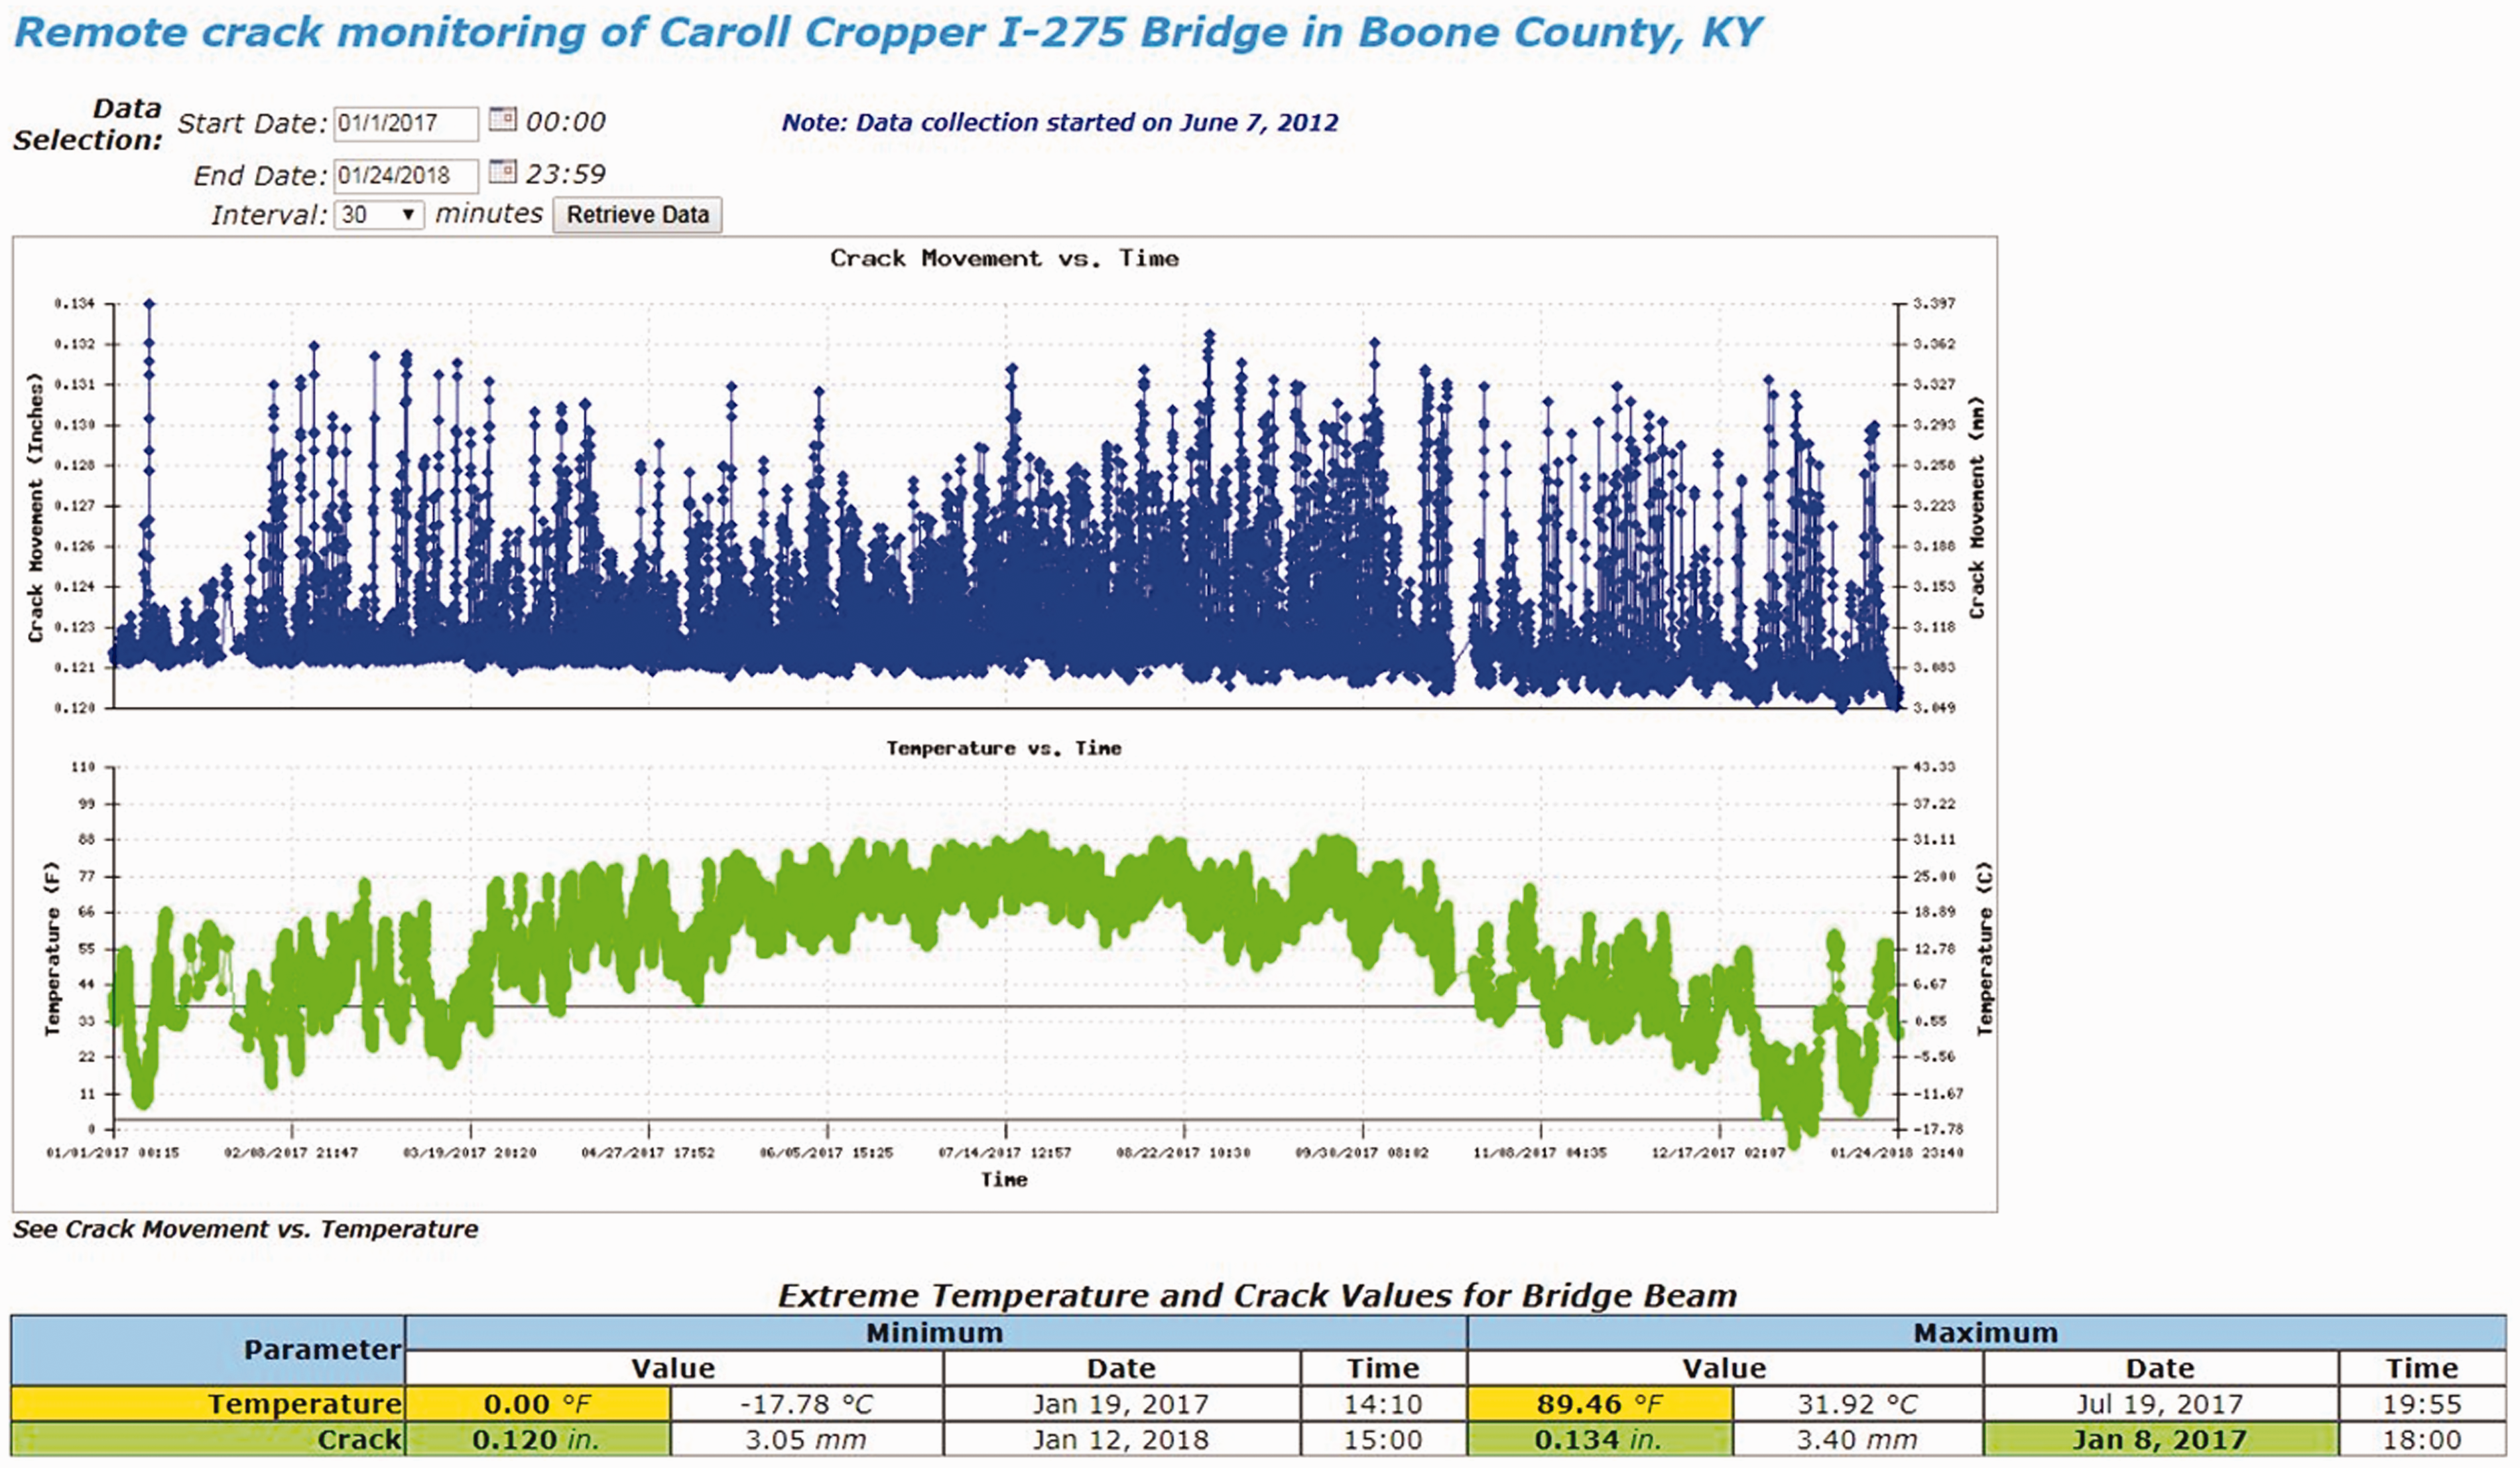
Crack gauge setup.
Conclusions
This paper highlighted the performance of SHM systems used to evaluate the condition of six Kentucky bridges. Installing different SHM systems has provided valuable insights on the planning, implementation, and maintenance of SHM systems, which could be applied to future projects.
Of the six projects, the best return on investment was realized from the focused and limited scope of the SHM instrumentation. Short-term monitoring of the I-65 elevated expressway in Louisville produced valuable data that let researchers quantify the degree of movement in damaged spans, which aided in determining the best retrofit measure. Monitoring conducted following the repair was useful for assessing the effectiveness of the retrofit. The system used to monitor cracks on the I-275 bridge, which remotely notified stakeholders once crack threshold values were exceeded, helped preserve public safety and eliminated the need for any retrofit measures after several years of monitoring. Both projects used a minimal number of sensors while providing very cost-effective solutions for bridge maintenance.
Communication between all stakeholders during planning, implementation, and monitoring phases of a SHM is of paramount importance. The KY 100 Bridge over Trammel Creek SHM succeeded because of the excellent coordination among multiple groups, including the researchers, contractors, and design and construction engineers. Conversely, poor communication between the research team and bridge maintenance engineers resulted in loss of data during the replacement of expansion joints on the I-24 bridge over Tennessee River bridge SHM project.
Contingency funding is necessary for successful long-term SHM, the availability of which may depend on the funding agency and fund/grant type. Many of the instruments used to collect bridge monitoring data are exposed to the elements and may require periodic replacements. As in the case of bridge monitoring conducted on the I-64 over US 60 bridge, an entire data acquisition system may need to be replaced if it is exposed to lightning or other disruptive natural phenomena. While large equipment replacement purchases may not be possible in all cases, KYTC has established an annual funding source that is used to maintain all long-term bridge monitoring projects.
Extreme event SHM increases safety and, when properly implemented, provides cost-effective maintenance options. A successful implementation of SHM on the I-64 Bridge over US 60 and NB US 41 bridge over the Ohio River would have prevented damage from impacts going unnoticed until periodic bridge inspections. The crack threshold limits identified for the I-275 bridge over the Ohio River also gave KYTC personnel an effective tool that replaced periodic inspections. Identifying and quantifying damage in real time significantly increase the likelihood of avoiding catastrophic failures.
The SHM carried out on bridges in Kentucky has proven an economical and effective method for extending the life of bridges and providing the tools for immediate response and decision-making. The extension of service life results directly from being able to immediately respond to events and spotting any damage requiring a retrofit.
Footnotes
Declaration of conflicting interests
The author(s) declared no potential conflicts of interest with respect to the research, authorship, and/or publication of this article.
Funding
The author(s) disclosed receipt of the following financial support for the research, authorship and/or publication of this article: Funding for the SHM projects highlighted in the manuscript were through multiple grants received from the Federal Highway Administration (FHWA) and the Kentucky Transportation Cabinet (KYTC).