
Abstract
Suspension bridges are supported by main cables that continue beyond the pillars to deck-level supports and must be anchored at each end of the bridge. The dynamic characteristics of the main cables are key indicators used to assess the structural health status of a bridge. In situ real-time health monitoring is an effective way to assess the dynamic characteristics. This paper presents a case study using vibration-based wireless smart sensors deployed on the main cables of a large-scale three-pylon suspension bridge to obtain its dynamic features. The methods of anti-aliasing filtering, statistical analysis and main cable tension force estimation were proposed and embedded into wireless smart sensors to provide autonomous data processing. According to the analysis of the vibration data from the main cables, the results demonstrate that the main cables have been in a stable state over time, and wireless smart sensors are promising for autonomous main-cable monitoring of large-scale three-pylon suspension bridges.
Keywords
Introduction
The main cables of suspension bridges are used to support the entire system and loadings, and these types of bridges have been widely applied in many practical engineering situations. The main cables bear static and dynamic loads induced by the decks, vehicles, and wind and transfer the tension into the anchorage system at each end of the bridge. As the main cables cannot be replaced and suffer from various types of vibration-induced damage, long-term structural health monitoring of the dynamic characteristic of the main cables is helpful to rapidly identify structural damage. Finite element (FE) modeling is commonly used to monitor the main cables under operational conditions, and the structural parameters are included in the model to simulate the vibration mode and natural frequency. Kim et al. 1 combined shape-finding theory and the configuration of the main cable to modify the static FE model of a suspension bridge and demonstrated that the current configuration of the in-service bridge conforms to the design shape. Moreover, mass components were added to the analysis model to demonstrate the reproducibility of the dominant natural frequencies. However, the effectiveness of manual modification should be considered at low levels of vibrations. Ubertini 2 proposed an improved continuum model based on the previous study on the effects of damage on the vertical modal properties of suspension bridges. They discussed the effects of main-cable damage on both the vertical and torsional eigenproperties of suspension bridges. Damage was introduced to only one main cable, and the girder was modeled as a Timoshenko thin-walled beam. Although the FE methods for damage detection are convenient and inexpensive, inaccuracy in the modeling and determination of the modal parameters are unavoidable; thus, the effectiveness of the evaluation is a widely considered issue. Furthermore, the structural characteristics are also affected by changes in environmental conditions, such as temperature and humidity, which are not sufficiently considered in FE modeling. The uncertainty and environmental conditions impact the assessment of the simulation results.
In situ structural health monitoring (SHM) provides an accurate and effective method to solve the problem of the influence of environmental changes.3,4 Increasing numbers of suspension bridges have installed SHM systems. Typical examples include the Tsing Ma Bridge in Hong Kong, 5 the Runyang Bridge in China, 6 the Tamar Suspension Bridge in England, 7 and the Bosphorus Suspension Bridge in Turkey. 8 A variety of sensors, such as accelerometers, strain gauges, and displacement meters, are deployed on bridges to collect raw signals that are transferred directly to the signal conditioner. Signal aliasing may occur as high-frequency signals are mixed in with the signal. In addition, sensor and cable installation is expensive and extremely difficult, especially on the main cables of suspension bridges after the completion of bridge construction. Deng et al. 9 proposed an alternative method to measure the tension forces of a series of strands in the anchor span to obtain the total force of the entire main cable rather than directly measuring the tension force of the entire main cable. The proposed method was proven on a prototype long-span suspension bridge.
Wireless smart sensors (WSSs) provide a flexible and inexpensive method for intelligent SHM. Studies using WSSs for bridge SHM have been intensive in recent years.10,11 Chae et al. 12 developed a prototype wireless-sensor-based bridge health-monitoring system and proved the viability of the wireless sensor network (WSN) by testing implementation in a test bed. Nagayama et al. 13 developed a WSN system employing a multi-hop communication protocol to measure the structural vibrations of a suspension bridge. They demonstrated that the monitoring campaign has the advantages of quick installation and good performance in capturing the dynamic characteristics of the bridge. Pakzad and Fenves 14 designed and developed a spatially dense WSN to record the ambient acceleration of a long-span suspension bridge. They demonstrated that high spatial and temporal monitoring using a WSN ensured high resolution in the identified vibration modes. Kurata et al. 15 installed an Internet-enabled wireless structural monitoring system consisting of 28 wireless sensor nodes on the underside of the main girder and towers of the New Carquinez Bridge. The scalability and stability of the system were demonstrated over long-term use. Jang et al. 16 deployed a state-of-the-art wireless smart sensor network on a cable-stayed bridge with a main span of 344 m in length.
Along with the improvement of measurement and communication technologies, the theoretical methods for bridge damage detection have also been improved. Specifically, the vibration-based damage detection methods involving complicated environmental factors have been investigated and implemented in the past decades due to convenience and low cost. Hui et al. 17 used a nonlinear principal component analysis method and the artificial neural network technique to investigate the relationship between environmental factors and dynamic characteristics. Deraemaeker et al. 18 proposed output-only vibration measurements for vibration-based structural health monitoring. Materazzi et al. 19 used a continuum formulation to study the vertical vibration of a suspension bridge with damage in the main cables. Comanducci et al. 20 applied natural frequencies tracking and multivariate statistical analysis to monitor the structural health status of the main cables by removing the non-linear aeroelastic correlations between wind speed and natural frequencies.
At present, most studies focus on theoretical calculation and experimental validation of WSSs for bridge SHM. To the best of the authors' knowledge, the implementation of structural health assessment of the main cables of large-scale multiple-tower suspension bridges using WSSs has seldom been studied and reported. Because accelerometers are easily integrated in the WSSs, this paper uses vibration-based methods to assess the structural health status of the main cables of the Taizhou Bridge. The assessment results demonstrate the feasibility of the wireless main-cable monitoring method and provide a scientific reference for bridge inspection and management.
Design of WSSs and wireless monitoring system
WSSs design
In this specific application, WSSs consist of three main modules: the data acquisition module (DAM), data pre-processing module (DPM), and data transmission conditioner (DTC). Figure 1 illustrates that three printed circuit boards are attached to form the WSS. The DAM integrates a triaxial analog acceleration sensor and a 16-bit programmable ADC for data collection and digitization. The DPM is a wireless control unit for signal processing and command control. The DTC can adjust the output power of the radio frequency module for a reliable wireless communication.
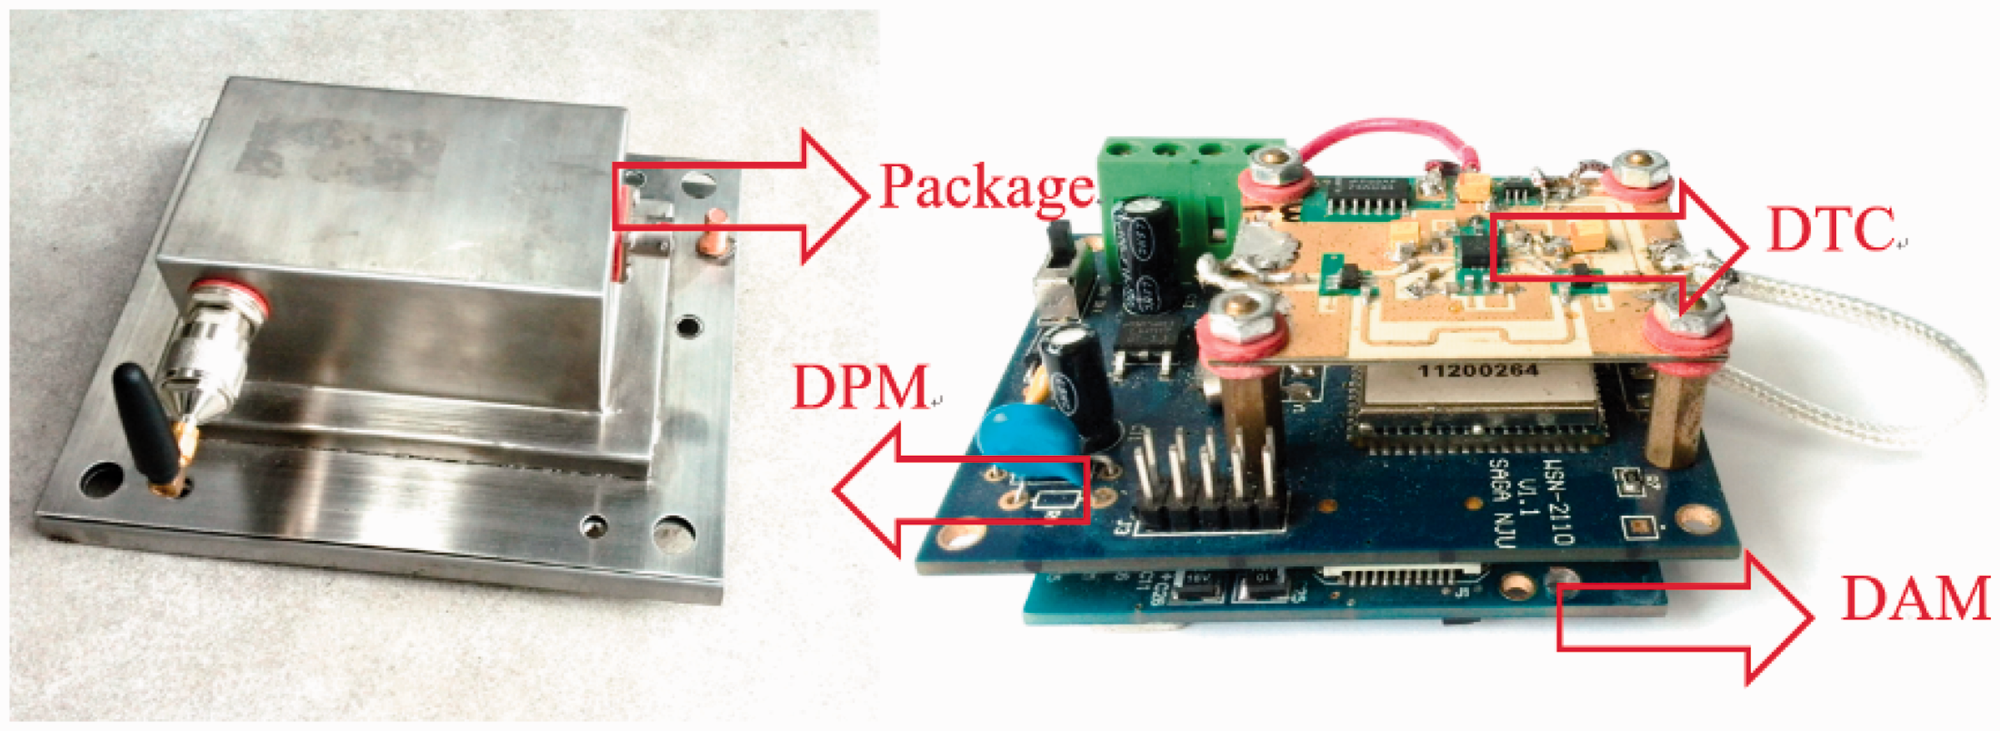
Photograph of a WSS and its package. WSS: Wireless smart sensor.
The vibration frequency components are complex, with a combination of multi-order natural frequencies and dynamic-load-induced frequencies and noise. The raw signal cannot have significant energy above the Nyquist frequency. Therefore, anti-aliasing filters must be used in the dynamic measurements of the main cables to preserve signal integrity. The sample rate of a WSS is 50 Hz in this application, so the cut-off frequency is set at 20 Hz for anti-aliasing. The filter is designed using the filter design and analysis tool in Matlab. A low-pass filter with a rectangular window is selected. Figure 2 shows the magnitude and phase response of the filter.
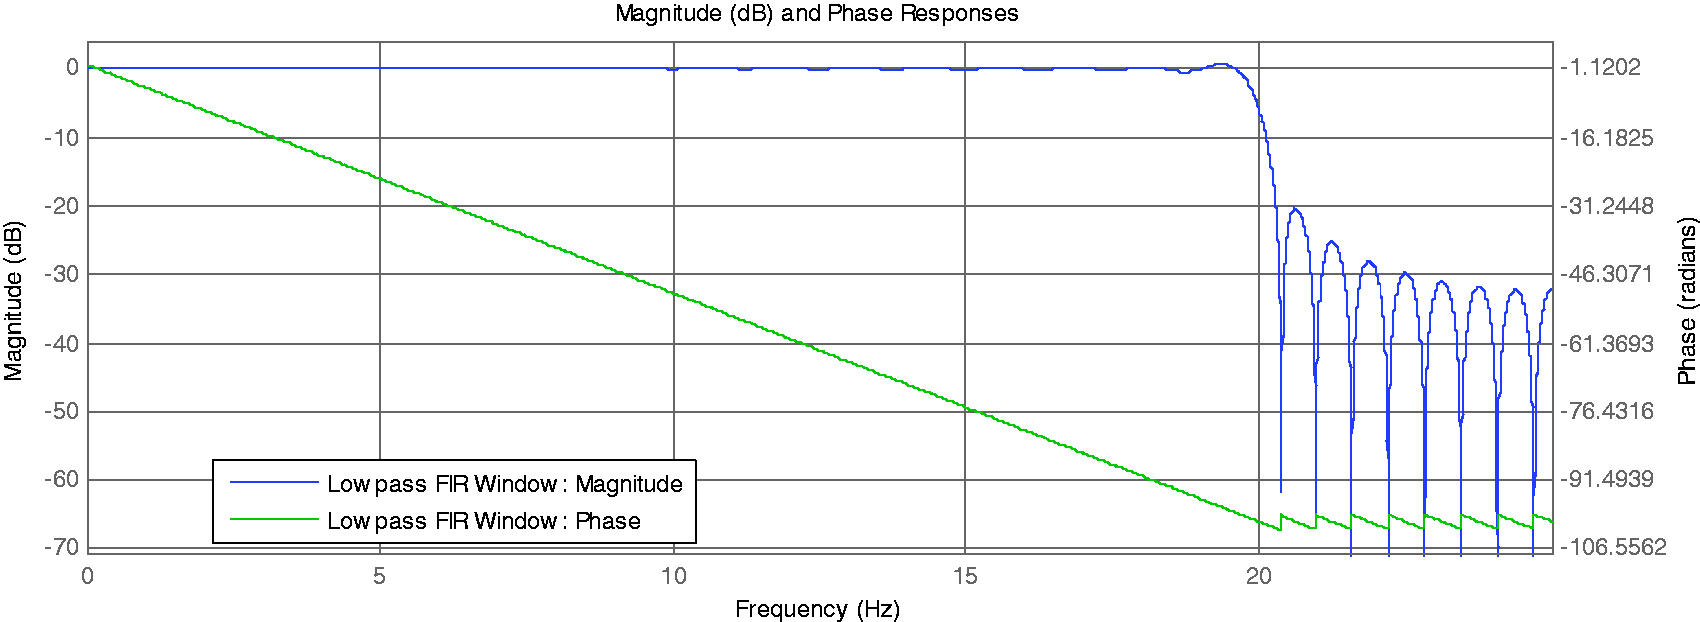
Magnitude and phase response of the anti-aliasing filter.
The impulse response is shown in Figure 3. As a linear time-invariant system, the anti-aliasing filter satisfies the superposition principle and has time-invariant features. Hence, the output signal can be obtained by convolution between the input signal and impulse response of the filter. According to the convolution theorem, convolution in the time domain is equivalent to point-wise multiplication in the frequency domain. Therefore, the output after convolution between the raw data and impulse response is the filtered signal, as shown in equation (1), which can be efficiently embedded into the WSSs for anti-aliasing

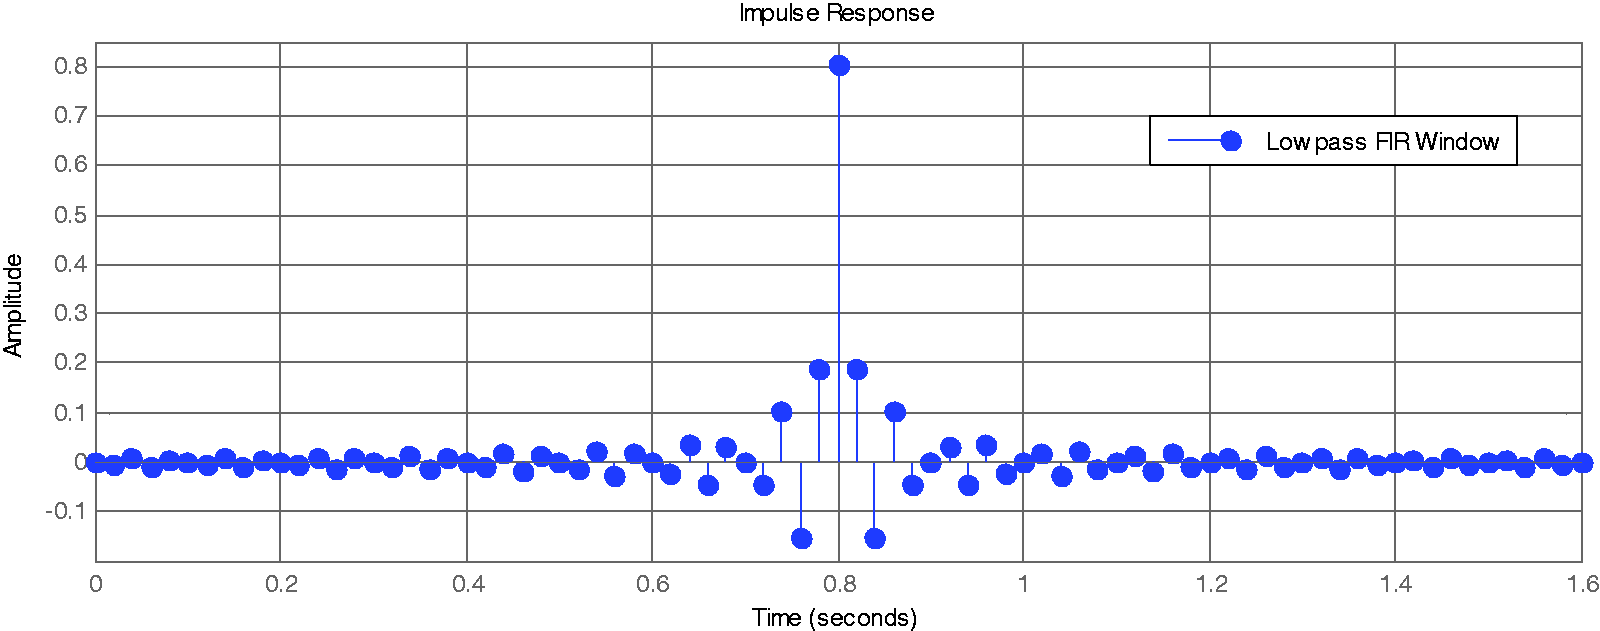
Impulse response of the anti-aliasing filter.
In the equation,
Table 1 shows the detailed characteristics of the designed WSS.
Characteristics of the WSS.
WSS: Wireless smart sensor.
Wireless monitoring system
Figure 4 shows a schematic view of the wireless monitoring system. The remote nodes (WSSs), which perform anti-aliasing processing, statistical analysis, and tension force estimation of the main cables, send the processed data to the gateway nodes, which transfer the results to the monitoring center. The gateway nodes are based on MEMSIC’s Imote2 platform, which has been adopted in many bridge SHM applications.21–23 The gateway nodes are capable of processing parameter setting, time synchronization, and data acquisition commands.
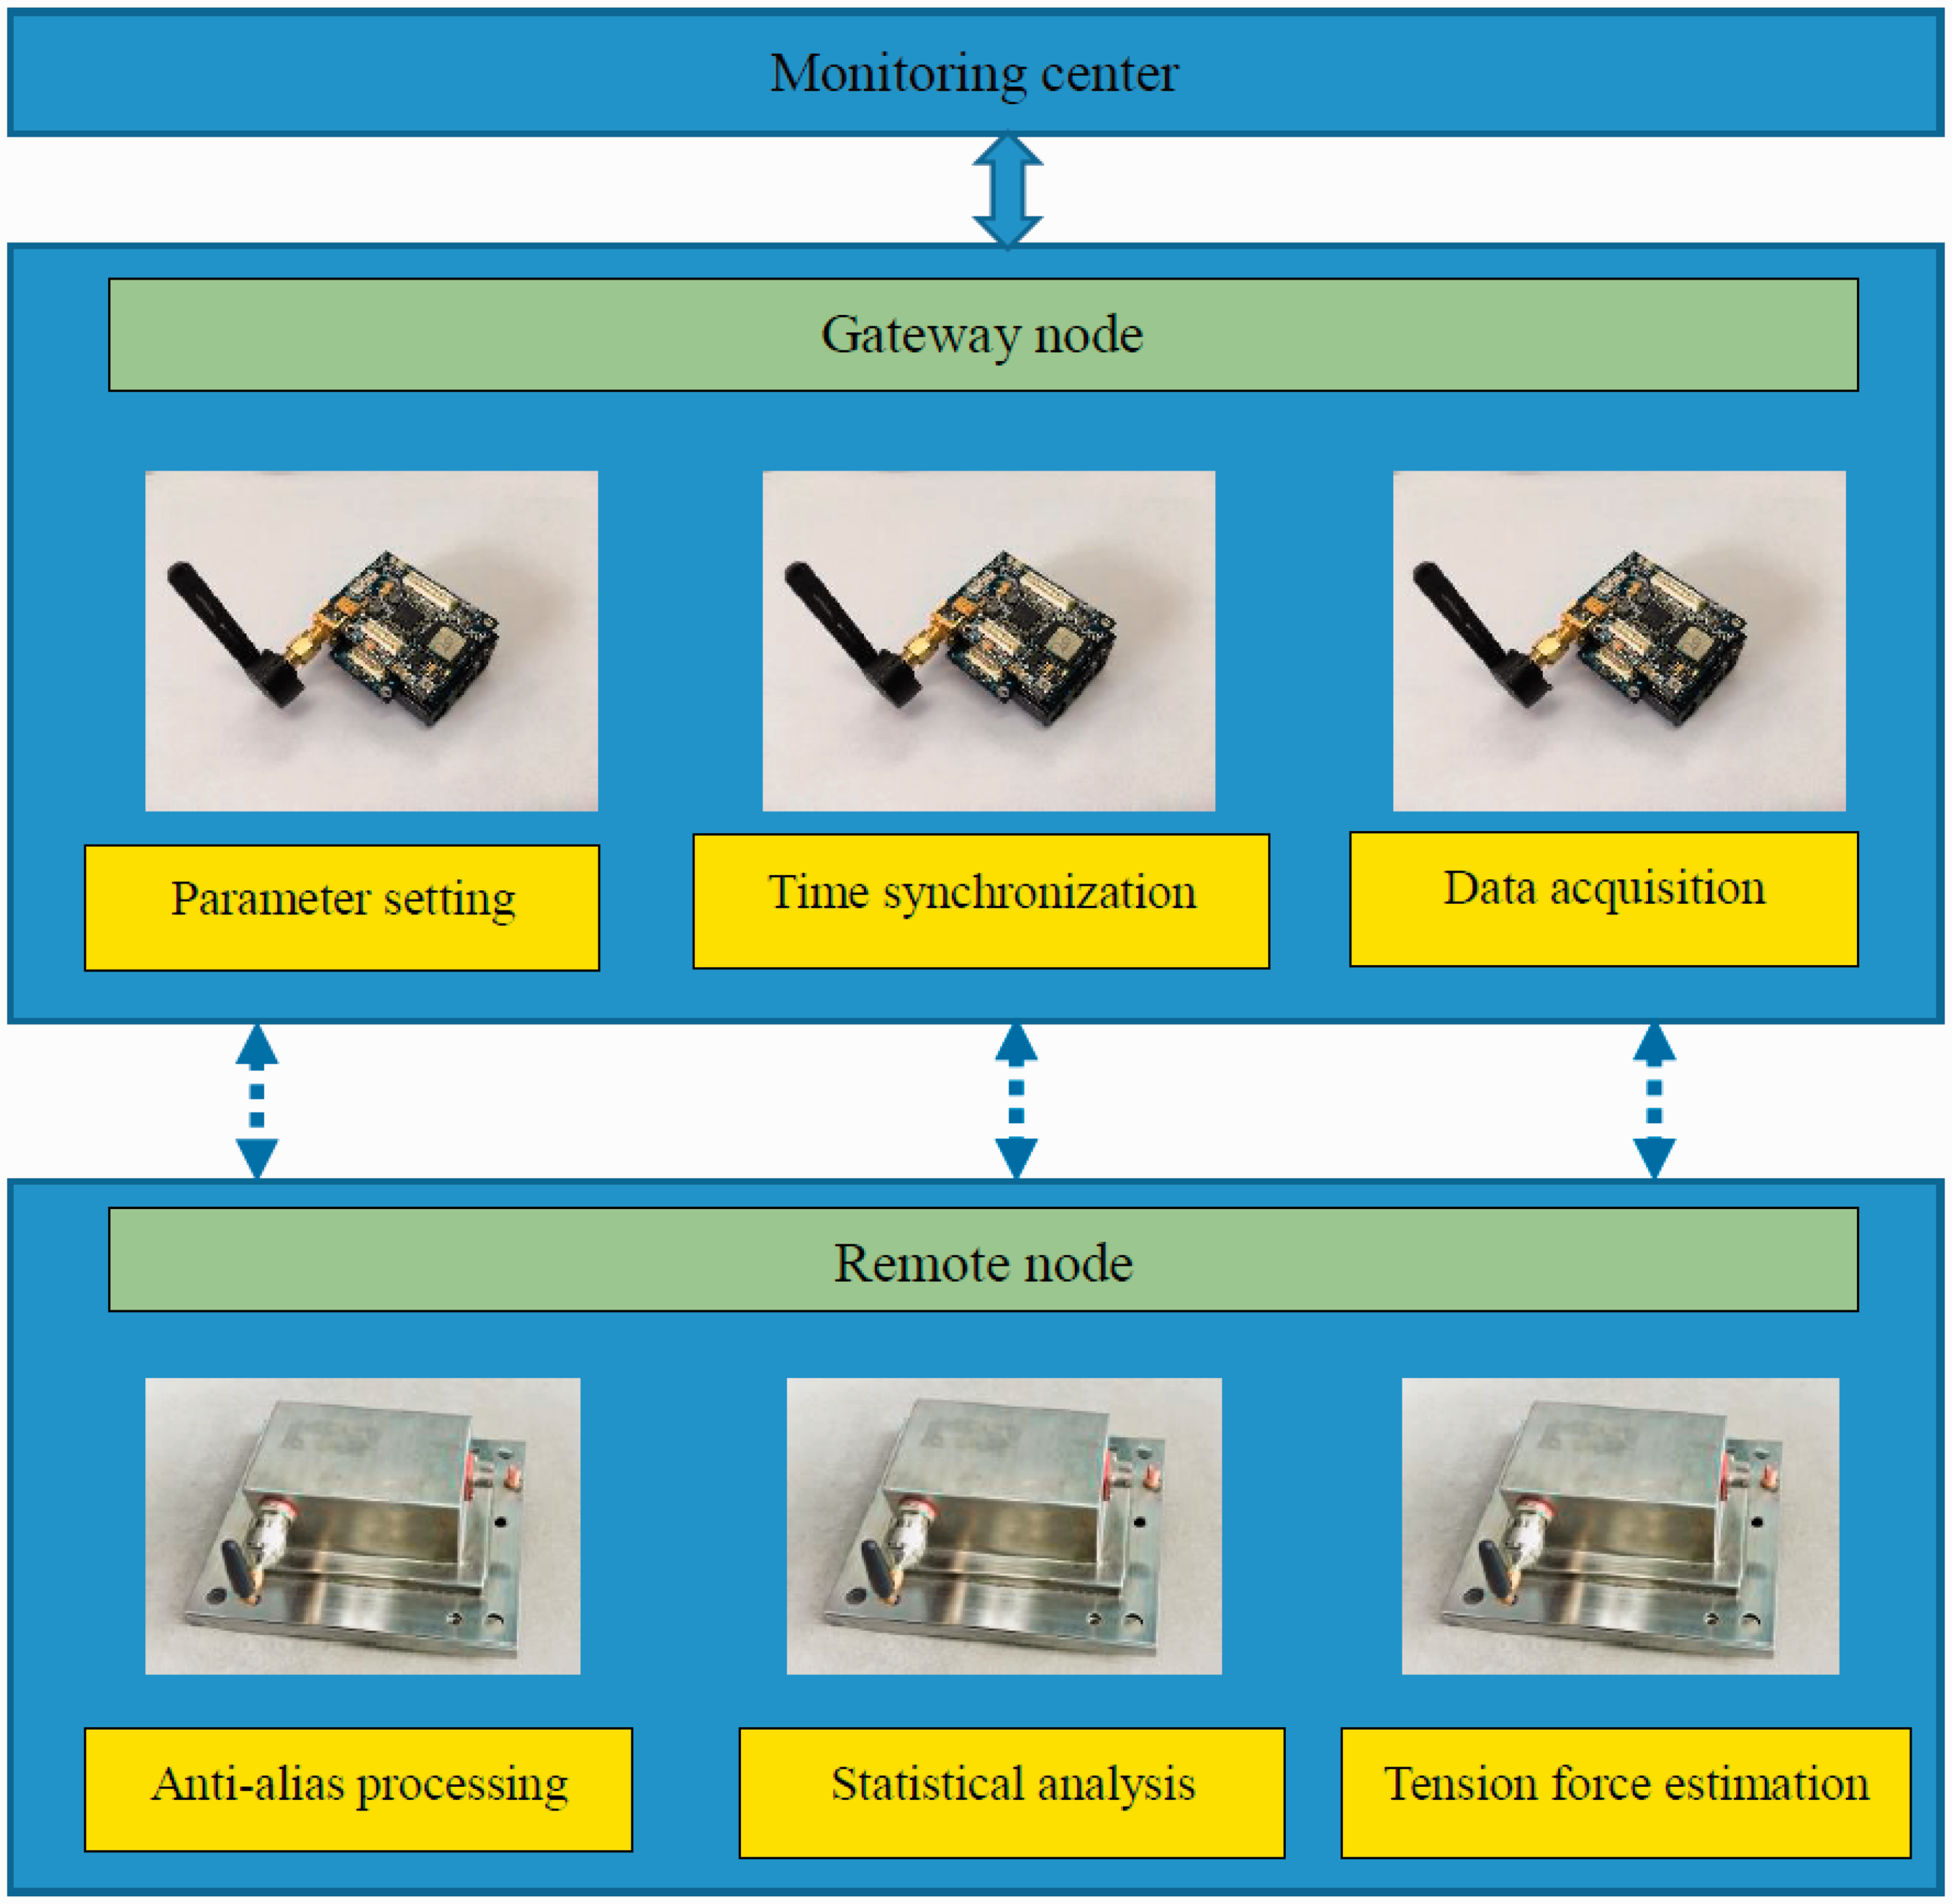
Schematic view of the wireless monitoring system.
Study object and WSSs deployment
Taizhou Bridge
The Taizhou Bridge, spanning the Yangtse River between Taizhou City and Yangzhong City, is the world’s first kilometer-length multiple-tower suspension bridge with two 1080-m continuous main spans and two 390-m side spans, as shown in Figure 5. The middle pylon is designed as an inverted Y steel structure in consideration of the rigidity of the middle tower and anti-sliding concerns between the main cables and saddles. More detailed structural information can be found in Li et al. 24
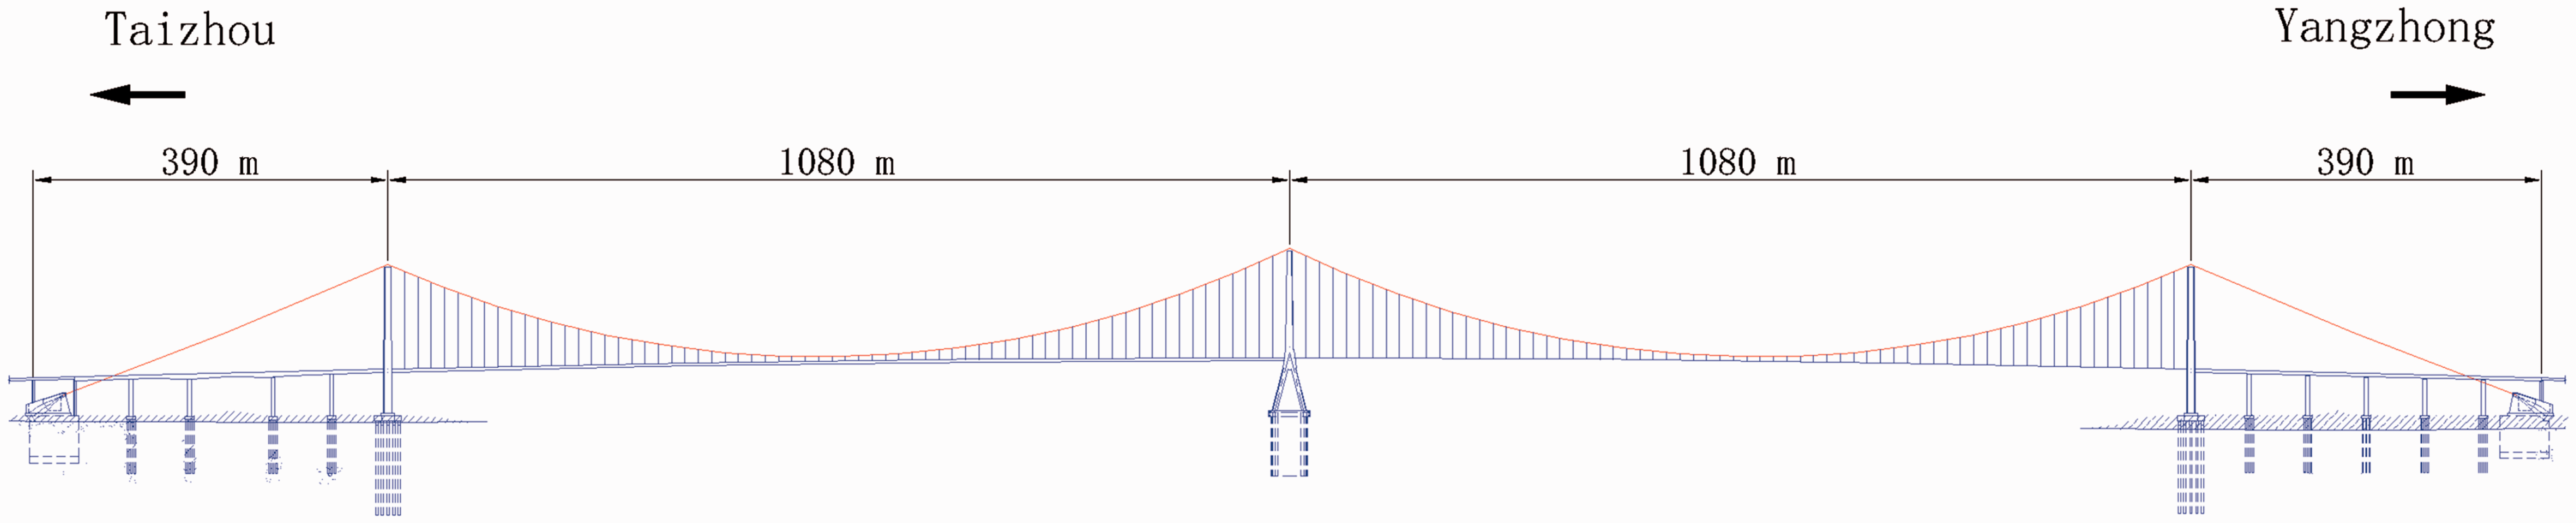
Layout of the Taizhou Bridge.
The main cable of the Taizhou Bridge is 3109-m long and has a diameter of 712 mm. The lateral distance between the two main cables is 34.8 m. Each main cable consists of 169 prefabricated parallel wire strands composed of 91 5.2-mm-diameter high-strength steel wires with ultimate tensile strength of 1670 MPa. The rise-to-span ratio, inertia moment, minimum resist slippage safety factor, and Young’s modulus of the main cables are 1:9, 0.0085 m4, 2.0 and 2 × 10⁸ kPa, respectively. Detailed information about the main cables can be found in Shen and Liang. 25
WSSs deployment
In the SHM system, there are 275 sensor nodes installed in the key parts of the bridge, such as the deck, suspender cables, towers, and main cables. According to the structural features of the Taizhou Bridge, 12 WSSs were deployed on the two main cables for real-time vibration monitoring, as shown in Figure 6. Every sensor has a unique ID, and the sensors on the main cables had IDs from 51–56 and 61–66. Ten gateway nodes (A1–A3, B1–B4, C1–C3) were installed on the three towers to receive the data from the WSSs.
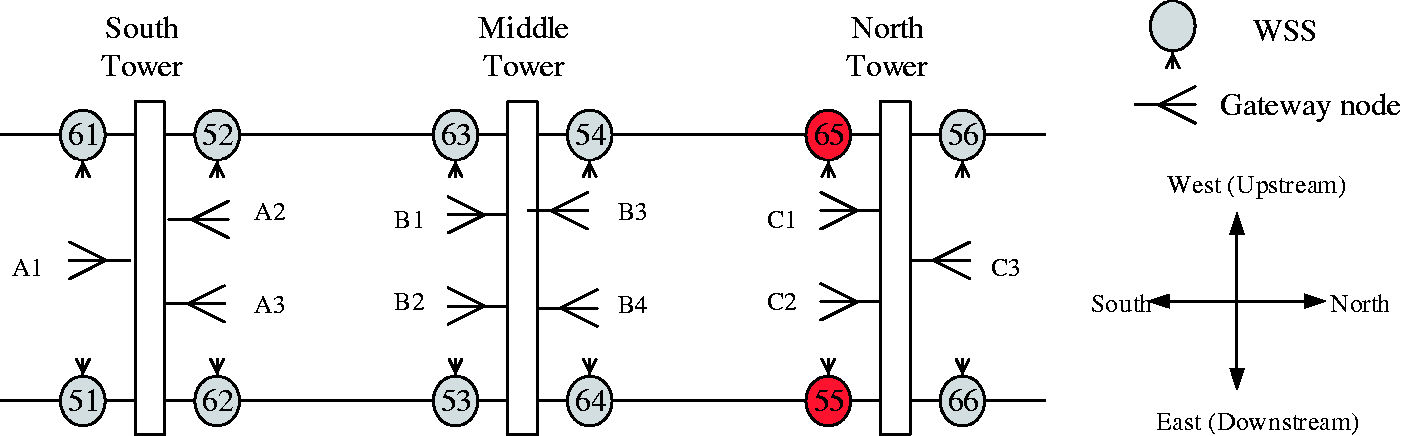
WSSs deployment on the main cables. WSS: Wireless smart sensor.
The installation locations of the remote nodes and gateway nodes are fixed, and directional antennas are used for high-quality communication. Figure 7 shows the directional antenna of the gateway node installed on the middle pylon.
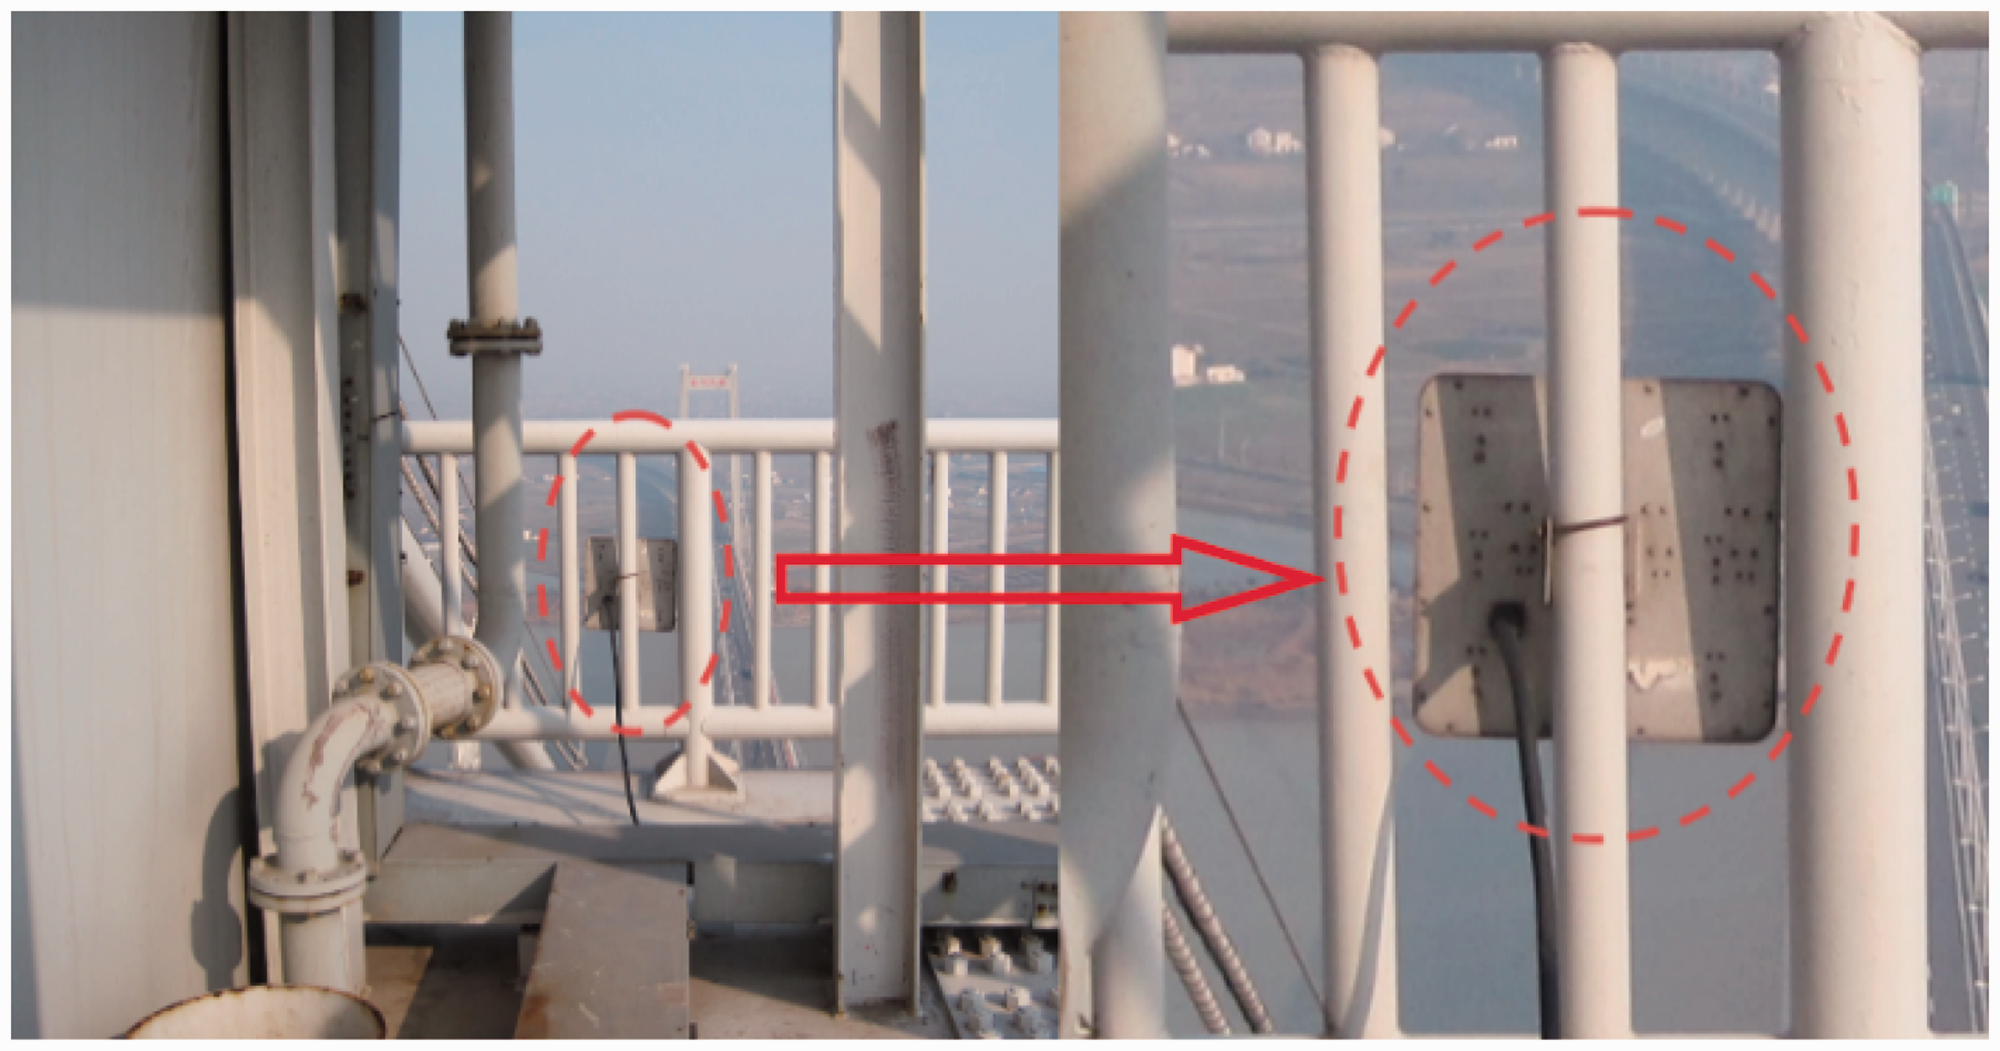
Directional antenna of a gateway node installed outside.
Assessment of the main cables based on the measured data
As mentioned above, the sensing system is configured with a sampling rate of 50 Hz and a cut-off frequency of 20 Hz. One-hour data from Nodes 55 and 65 on 2013–09-30, 2014–12-30, and 2015–04-28 were used to analyze the vibration of the two main cables.
Time history of the vibration data
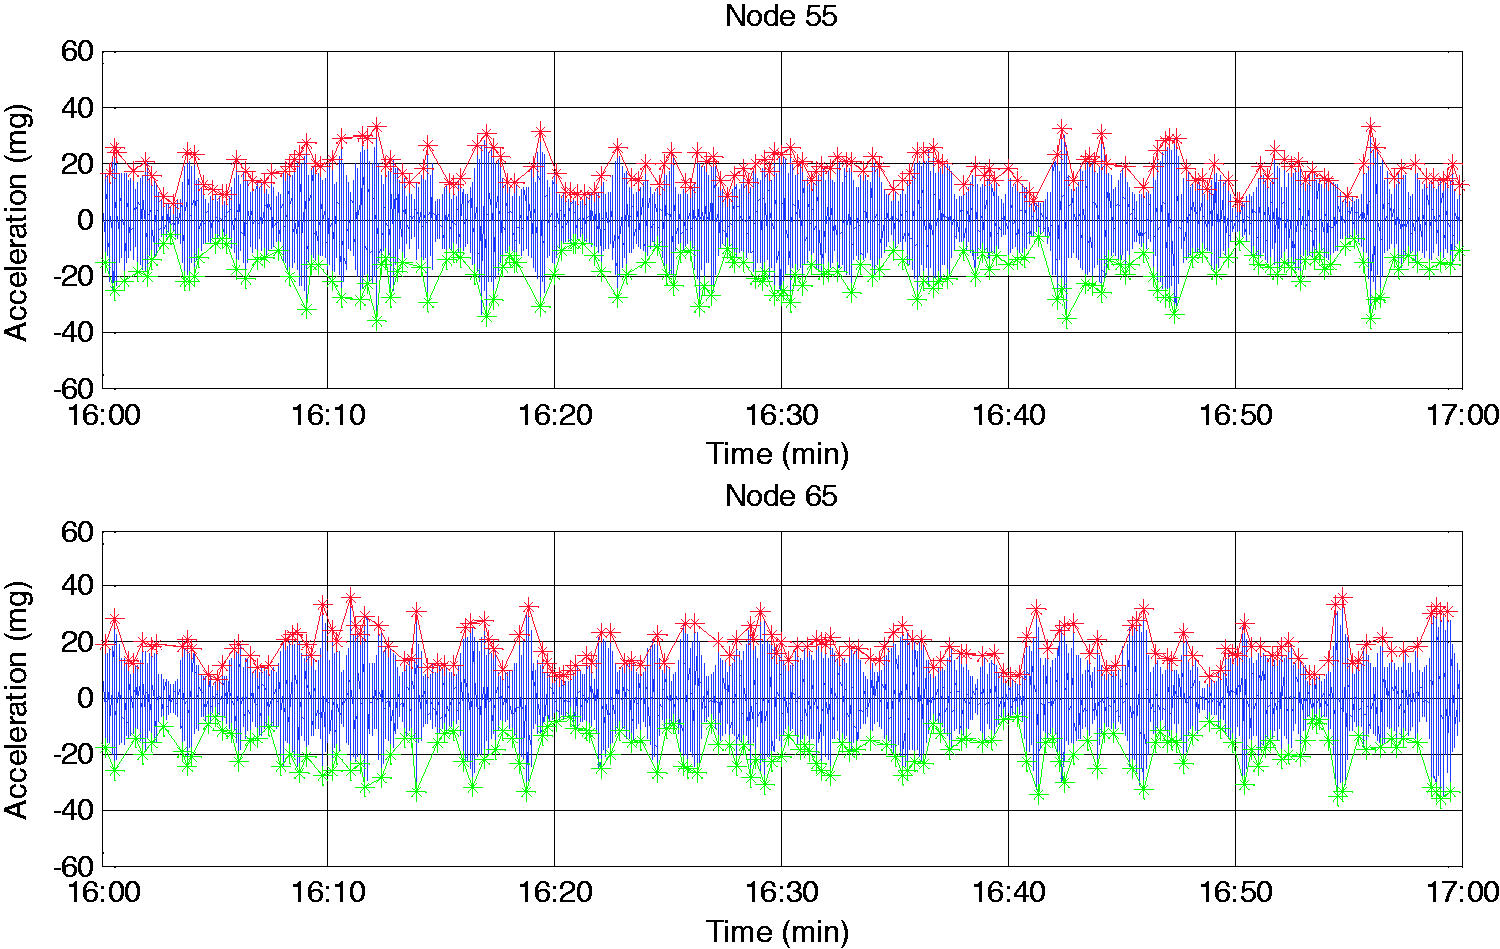
Figure 8 shows the time histories of the 1-h horizontal transverse (X-axis), horizontal longitudinal (Y-axis), and vertical (Z-axis) vibrations at Nodes 55 and 65 on 2013–09-30, 2014–12-30, and 2015–04-28. The vibration patterns and magnitudes of the vertical acceleration are consistent between the two nodes on all three days because the main cables are connected with the decks through suspenders, and the decks bear all the vertical loads from various vehicles. The transverse vibrations result from wind and unbalanced loads on the two main cables. The magnitudes and patters are quite different between the two nodes on all three days. Moreover, there are no significant vibrations in the longitudinal direction, which indicates that only two-axis acceleration sensors should be considered for main-cable vibration monitoring in the future designs.
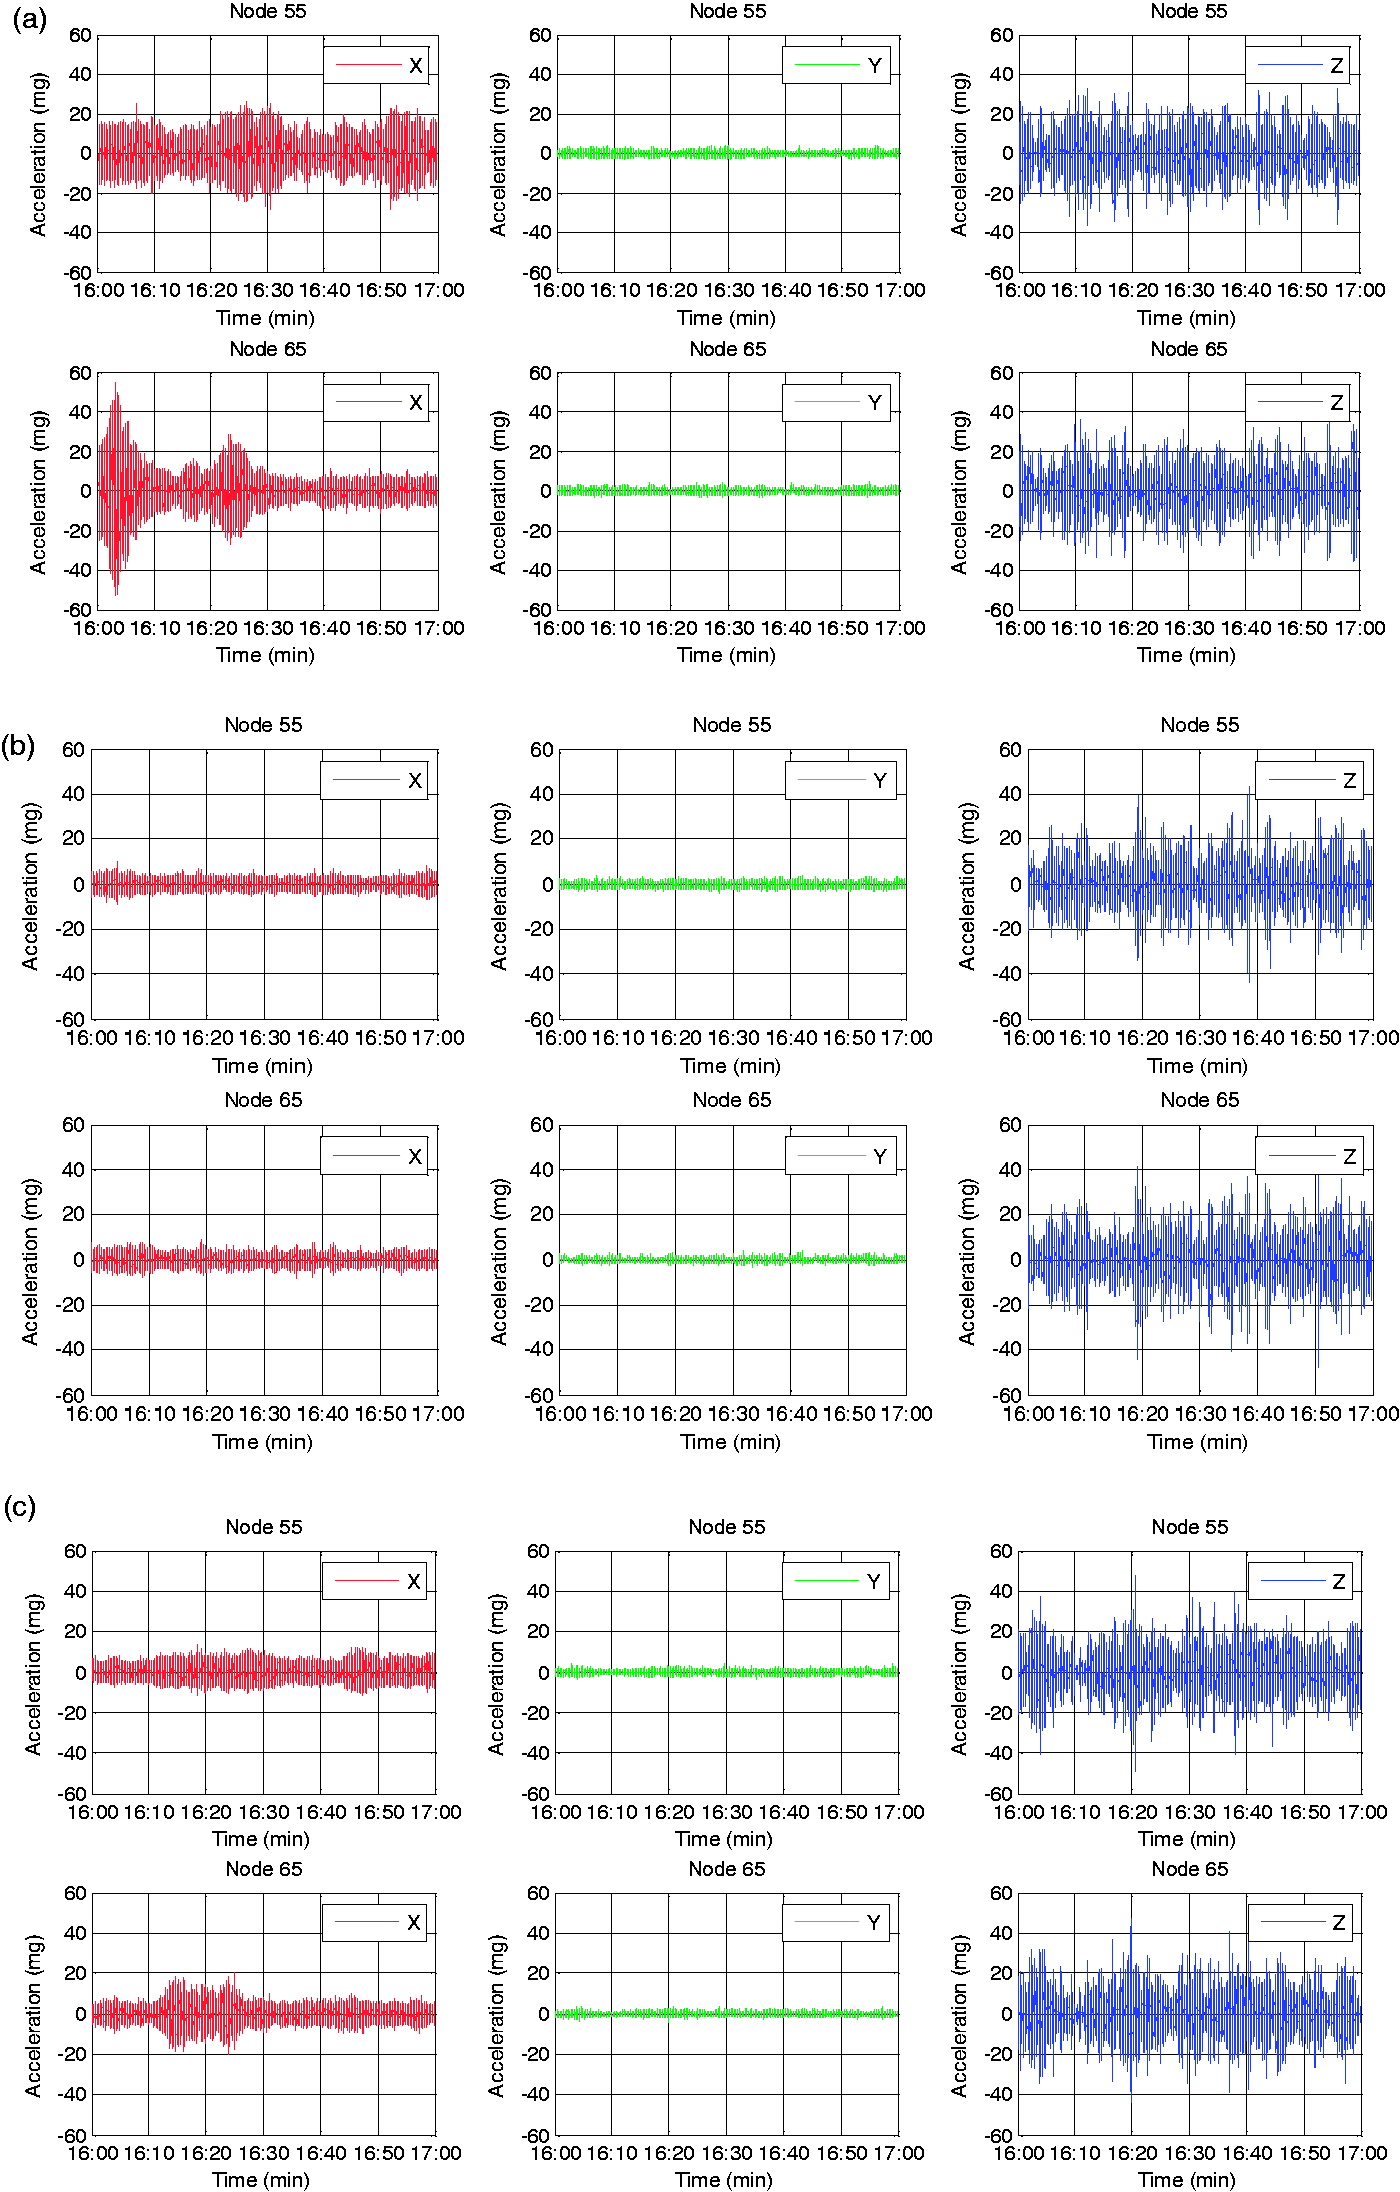
Time histories of the three-axis vibrations of the main cables at Nodes 54, 55, 64 and 65 on: (a) 2013–09-30, (b) 2014–12-30, and (c) 2015–04-28.
Statistical analysis of the vibration data
For suspension bridges, the local vibration of the main cable system will increase the flexibility of the bridge. Large-amplitude vibrations induced by wind, rain, and traffic will cause alternative significant stresses in the cables, which may result in bridge fatigue failure, thus shortening bridge life. Specifically, vortex-induced vibration (VIV) is a typical phenomenon that typically has a large amplitude and has a very serious impact on bridge safety. Analytical and experimental research was performed to study mitigation methods to control excess vibrations.26–29 The first step is to analyze these excess vibrations for monitoring purposes using a statistical method rather than simply using a threshold judgment method. Moreover, wirelessly transmitting significant results instead of transmitting all raw data makes the system more effective. The assessment consists of the following steps. First, pick the peaks and valleys of the main cables vibrations, as shown in Figure 9.
Peaks and valleys of the vertical acceleration of the main cables at Nodes 55 and 65 on 2013–09-30.
Second, calculate the distribution of the extracted peaks and valleys and simulate the distribution using the curve fitting tool of Matlab for further statistical analysis. Figure 10 shows the distribution simulation of the acceleration peaks of Node 55 on 2013–09-30. The distribution of the acceleration peaks can be modeled by the Gauss distribution with an R2 of 0.9952.
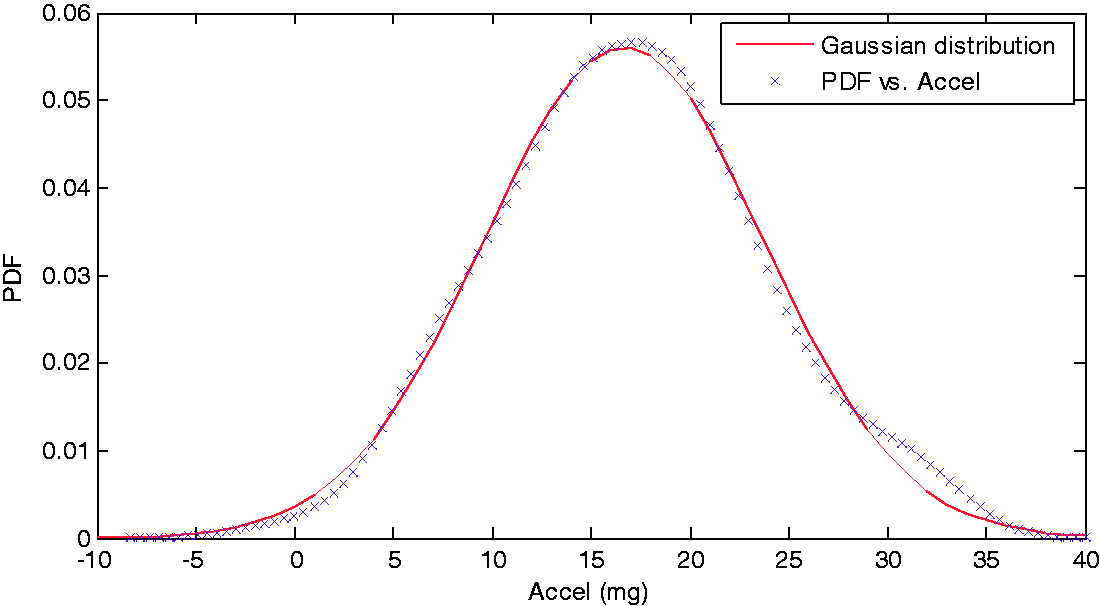
Distribution simulation of the acceleration peaks of Node 55 on 2013–09-30.
The Gaussian distribution is expressed as follows
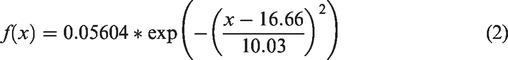
Finally, according to the principle of 3σ in the normal distribution, a vibration peak exceeding μ + 3σ is a small probability event that is unlikely to occur; therefore, the expected maximum peak was predicted based on the 3σ principle.
Table 2 lists the mean (μ), standard deviation (σ), measured maximum (MMAX), measured minimum (MMIN), expected maximum (EMAX), and expected minimum (EMIN) of the vibration peaks and valleys at Nodes 55 and 65 on the three days. The maximum EMAXs of Nodes 55 and 65 occur on 2015–04-28 at 39.77 mg and 41.99 mg, and the maximum MMAXs from Nodes 55 and 65 occur on 2015–04-28 at 47.39 mg and 46.92 mg. The mean vibration of both main cables is less than 20 mg.
Statistical analyses of the peaks and valleys of the main cables at Nodes 55 and 65 on 2013–09-30, 2014–12-30, and 2015–04-28 (Unit: mg).
The MMAX, MMIN, EMAX, and EMIN variation trends are plotted as bar graphs in Figure 11. The thin bars and thick bars represent the measured and expected ranges of the vibrations, respectively. After a time span of approximately 19 months, the changes in the vibration ranges of the main cables are not significant. A small increase in the range occurs due to the growing number of vehicles passing the bridge over time and the effect of the limited long-term reliability of the accelerometers. For example, the expected vibration range at Node 55 increased from 76.83 mg on 2013–09-30 to 80.75 mg on 2015–04-28, an increase of 5.1%. These results demonstrated that the two cables are in stable conditions.
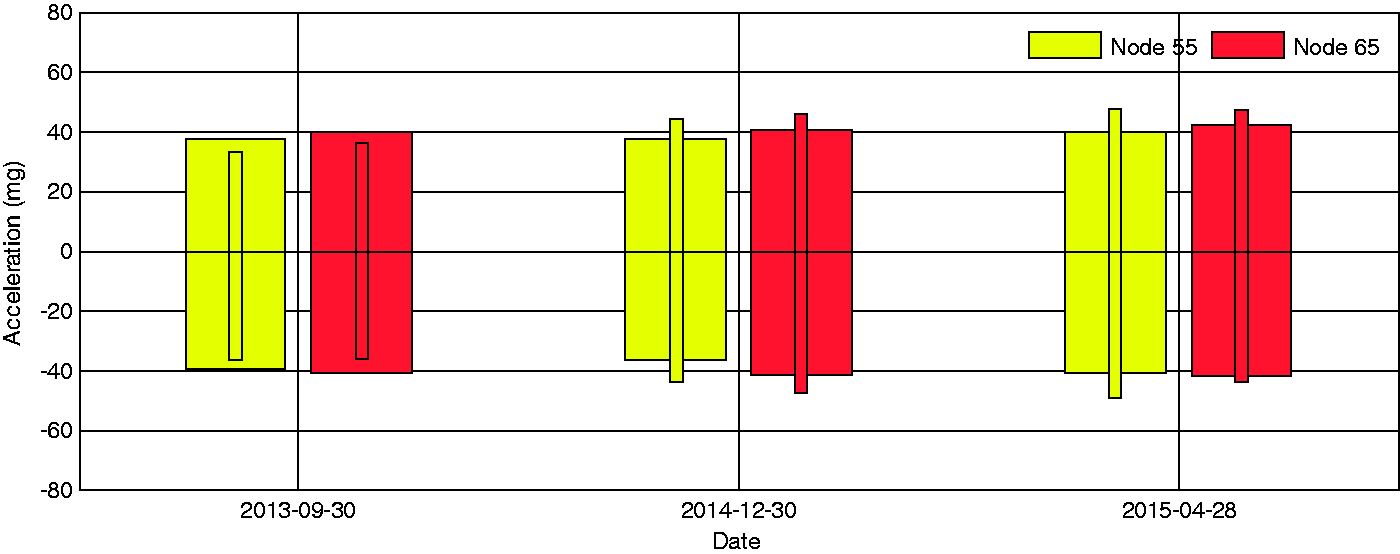
Comparison of the expected and measured acceleration ranges using the vertical acceleration of the main cables at Nodes 55 and 65 on 2013–09-30, 2014–12-20, and 2015–04-28.
Additionally, the method is feasibly embedded into the WSSs. Only the expected vibration ranges (EMAX-EMIN) will be sent to the gateway nodes for a reliable communication.
Tension force estimation based on measured natural frequencies
The tension force of the main cable is a key indicator of the structural soundness. This force can be indirectly obtained by using the vibration method, which is demonstrated to be more inexpensive and convenient than the static method by using a load cell to directly measure the tension force.30,31 According to Sim et al.,
21
the cable tension force and the cable natural frequencies have an explicit relationship, which can be described as
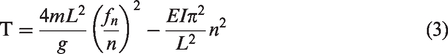
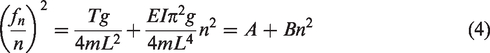
Figure 12 shows the power spectral density (PSDs) of the vertical acceleration of the main cables at Nodes 55 and 65 in the range of 0–25 Hz and 0–0.35 Hz on 2013–09-30, 2014–12-30, and 2015–04-28. It is clear that the built-in anti-aliasing filters function well. The signals below the cut-off frequency remain, and the others are increasingly attenuated. Figure 12(b) plots the first four order natural frequencies and uses circles to mark the prominent peaks. The PSDs show good agreement on the three days for Nodes 55 and 65.
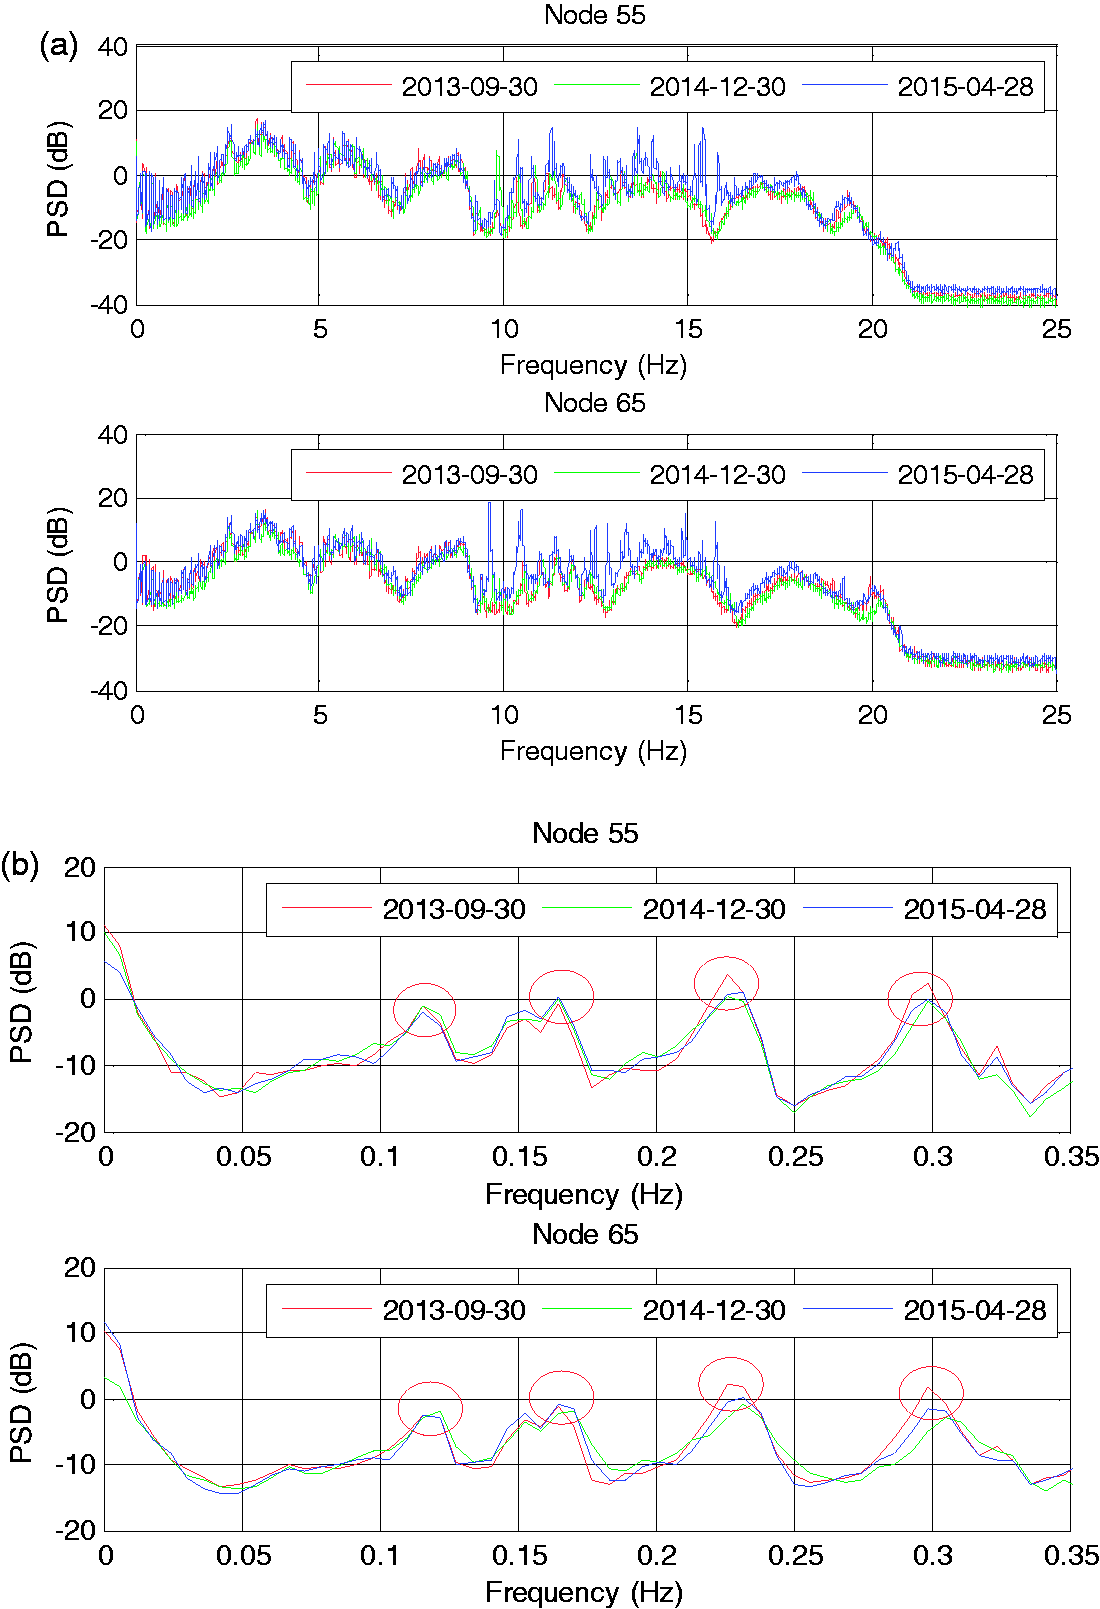
PSDs of the vertical acceleration of the main cables at Nodes 55 and 65 on 2013–09-30, 2014–12-30, and 2015–04-28: (a) 0–25 Hz and (b) 0–0.35 Hz.
According to Figure 12, the first four order natural frequencies of the main cables at node 55 are measured as 0.116 Hz, 0.1648 Hz, 0.2258 Hz, and 0.2991 Hz. Combined with equation (4), the constant coefficient A and the tension force are estimated as 0.01406 and
Conclusions
This paper presents a case study of the implementation of autonomous WSSs for vibration monitoring of the main cables of a large-scale three-pylon suspension bridge. The anti-aliasing filter, the statistical analysis method, and the cable tension estimation method were proposed and can be embedded into the WSSs. The WSSs provide flexible and autonomous vibration monitoring of the main cable and only the results are required to be sent to the gateway nodes instead of large quantity of raw data. According to the assessment of the main cable vibration data, the range of the vibration magnitude of the main cables increased slightly over 19 months, which was primarily due to the increasing number of vehicles passing the bridge over time and the effect of the limited long-term reliability of the accelerometers. Additionally, the measured tension force was consistent with the designed value over time, which means the main cables are stable.
Footnotes
Acknowledgements
The authors acknowledge the Construction Commanding Department of Jiangsu Provincial Yangtze River Highway Bridge and Jiangsu Taizhou Bridge Co., Ltd. for their support throughout the study.
Declaration of conflicting interests
The author(s) declared no potential conflicts of interest with respect to the research, authorship, and/or publication of this article.
Funding
The author(s) received no financial support for the research, authorship, and/or publication of this article.