
Abstract
The analysis of the random vibrations that occur during the flight of the unmanned aerial vehicles is important, as these random vibrations have random characteristic properties and have the ability to decrease the endurance of such systems. The accuracy of data collected from sensors in the unmanned aerial vehicle system is important for the flight control system. The transferring of these data among different sensors such as inertial measurement unit, axis accelerometers, GPS or cameras is usually affected by many factors. One of the important factors is the random vibration, which is usually caused by aerodynamic excitation or air turbulence. The problem of random vibrations has been studied for a long time and explained in many text books. In this study, the author introduces a mathematical analysis for random vibrations that are independent of their sources by considering these vibrations as a random and non-stationary process and designs a control methodology based on expectations and probability theory to reduce the effect of these vibrations. The analysis used in this research is based on the assumptions of practical approximation techniques.
Keywords
Introduction
The modeling and harvesting of the random vibrations in the unmanned aerial vehicle (UAV) systems is a complex issue due to the difficulty in the identification of the various sources. 1 The main rotor, engine and rechargeable battery power source are common sources of the undesired vibrations. 2 The responses of a sensitive electronic component mounted in UAV systems for pavement roughness, acoustic pressure and air disturbance are common sources of the random vibrations that have strong random characteristics. 3 This significant class of problems can cause the transition of the system from one stable state to the failure state. 4
During the flight path, the attitude estimation is the most noticeable problem caused by the random vibrations. The subsystems in the UAV such as MEMS gyros, cameras and accelerometers can be very sensitive to the vibration, and the filtering algorithm cannot always fix the problem, making the attitude estimation useless.
The vibrations in UAV systems have been studied earlier. Kumar and Devendra presented an experimental study that focused on the measurement of road transport vibrations of a UAV by using higher order moments to show the nature of road transport vibration as non-stationary and non-Gaussian. 5 Radkowski and Szulim presented a solution for the problem of vibrations that appear during the maneuvers of quad-copters. The main sources of vibrations in their approach come from motor and/or propellers unbalance. 6 Fresk and Nikolakopoulos established an induced frame vibration and attenuation scheme, specifically targeting the area of multirotor UAVs. 7 Lai et al. discussed the non-commutatively errors of strapdown inertial navigation system (SINS) in UAV caused by vibration environment. They discussed the UAV’s vibration and modeled it as a sinusoidal angular vibration and a random angular vibration. 8
Cai et al. dealt with the main vibration sources in a UAV helicopter. The three sources were rotation of the main motor, tail rotor and engine. He estimated the frequencies of these three parts based on the motor speed of 1850 r/min. 9
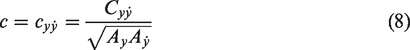
Dunbabin et al. stated that a UV system produces a unique and challenging environment in which all systems must operate correctly. 10
Plasencia et al. modeled a UAV system, generated a range of vibrations originating in the main rotor and designed a control methodology based on an adaptive neuro-fuzzy inference system to damp the unwanted vibrations. 11
From the aforementioned contributions, it can be seen that the random vibrations occur during the flight or landing of the UAV for several reasons—aerodynamic excitation, system malfunctions and external factors such as atmospheric turbulence.
The vibration environment of UAVs is complex, influenced by the actuating unit and aerodynamic forces. 12 Since the inertial measurement units are directly installed on UAVs, they are sensitive to nature or vehicle random vibrations. 13
Because of sufficient knowledge of dynamic excitations in the nature, Gan and Lei possess limited information on random vibrations parameters which is usually obtained from recorded data or observations of occurrences. 14 When the excitation of the nature such as wind varies arbitrarily in time, the corresponding response of the UAV will also be arbitrary in time. 15 Such a response process deals with the random vibration and its characteristic properties can be determined by using statistical and probabilistic methods. 16
The following are the main reasons to use the statistical method for analyzing the random vibration in UAVs:
Most studies dealt with random vibrations in UAVs and had idealized UAV systems (or subsystems) as linear and inputs as stationary. Practically, all UAV systems are nonlinear to a small or great extent; therefore, the response characterization can only be approximate. A closed-form solution for UAV behavior during the excitation of random vibration cannot always be practically obtained. Measures of system behavior, such as the stationary state response, probability distribution or moments of the response, can be obtained more easily.
12
In this study, the random vibration is expressed by its probability density function (PDF) and is built based on approximation technique since the bandwidth of the real random vibration is usually wider and can be up to several thousand hertz. The analysis of the random vibration is mathematically built based on the probability theory and stochastic treatment of random dynamics.
Mathematical analysis of random vibrations in UAVs
The vibration form of small types of UAV is close to sinusoidal vibration.
17
Sinusoidal vibration is periodic motion whose displacement changes over time in the form of a sine function.13,18–22 This form of vibration can be represented by its displacement as
The random vibration in UAV systems is considered as a random process Y(t) consisting of a series of many overlapping sine waves. In general, the random vibrations are supposed to follow the stochastic differential equation
23
The activities undertaken in analysis in the random vibrations can be succinctly described using a simple, representative dynamic equation of equilibrium 24

The quantity y represents the system response, x represents system excitation and
Miller and Childers define the autocorrelation function of a random process Y(t) as the cross-correlation of the signal Y(t) with itself at time lag τ as20,21:
The mathematical complexity of working with overlapping sine waves in the random vibration’s PDF is to find the instantaneous amplitude as an exact function of time. 25 Therefore, it can be helpful to describe the random vibration by statistical theories based on the expectations and probability of occurrence.
The random response in any system excited by random vibration can be represented as a correlation function. 26
However, the random vibration in this article can be expressed as a correlation function

By defining
In steady state, the amount of
In the case of
The square root of the variance of the random process (vibration) is called the standard deviation, and it is defined as
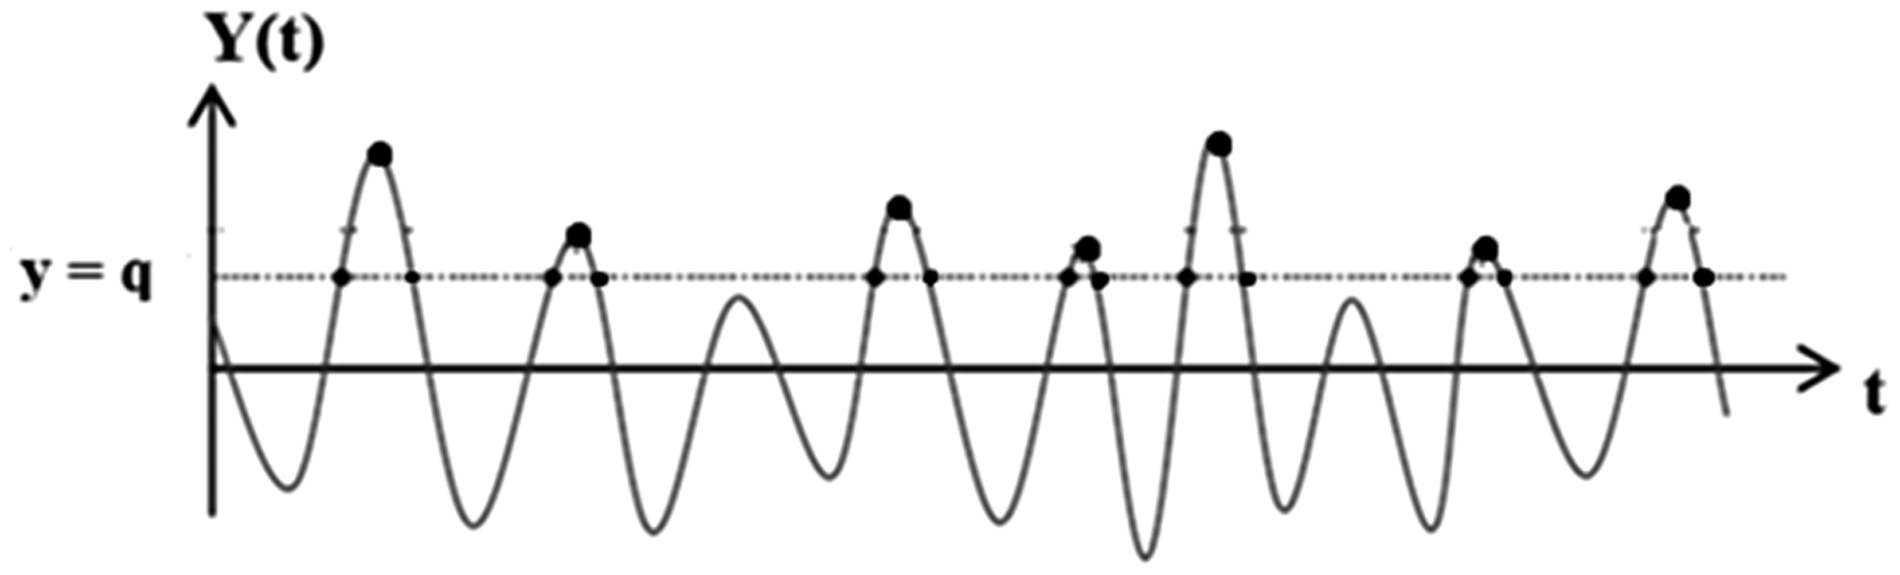
The bad influence of the random vibrations must not exceed a permissible positive amplitude level (q) during a time period (T) (Figure 1), where q is the permissible positive amplitude level of random vibration, and this level is defined for every specific element of the system and/or subsystem (electronics or mechanical devices). The increase in vibrations of this level will cause more errors in the data collection from the sensors and complicate the implementation of vibration sensing platform in the UAVs. To continue the analysis, it is important to calculate the number cycles of the random vibration y(t) that have amplitudes greater than the level y = q during the time period T.
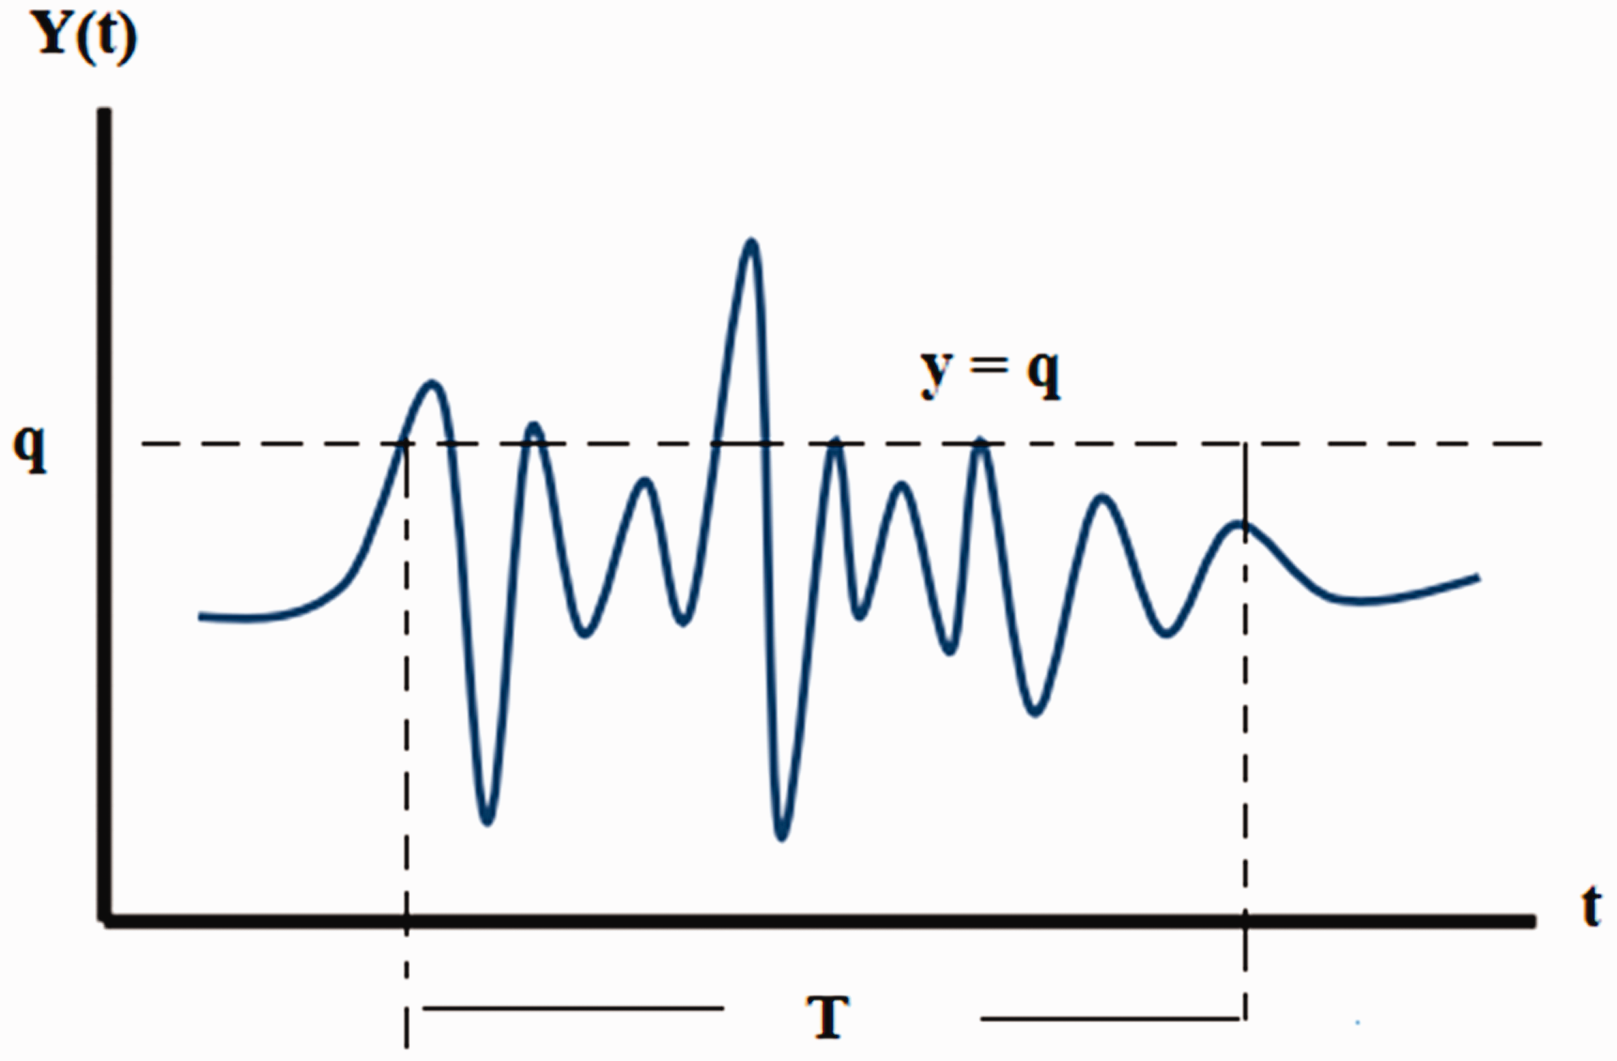
Typical sample of random vibration.
From Figure 1, it is obvious that the peaks of the cycles over the level y = q are not unique and show discrepancies in values. These peaks have different amplitudes at any period time in the random vibration, and therefore, they can be considered as random variables in the random process.
Mean (average) value of random vibration
Since the random variables are unpredictable and not specific values, the average value, which is also called as the mean value, of all random variables is an indicative measure.
28
Mathematically, the mean value for all the random variables under the level (q) in the interval [0, T] is defined by the following expression

The average value of any random process is considered as the first moment of the samples (random variables).
Integrating equation (2), and due to the properties of the delta function
At the points of intersection, the integration will increase by unity. Thus, integrating equation (2) will equal to the number of positive intersection points caused by the intersection between the random process
In practice, the outcomes (number of samples and amplitude) of all random variables, even under equal conditions, are not unique and show discrepancies in values. 20
Mathematical expectation value of vibration
The first moment (or center of gravity) of the values of all random variables in the random vibration is the expected value. Thus, the center of gravity of the histogram is the expected value of the random variable.
29
The mathematical expectation value of a particular random phenomenon basically means the average value of the random phenomenon. Thus, the expected value of the mean (average) random variables

By substituting equation (2) in equation (3) and using the rule of integration (the rule of a product of an arbitrary function by the delta function), and then integrating equation (3) with respect to the variable Y yields

Since the statistical properties of a random vibration are invariant in time, the process is said to be stationary in the strict sense.
30
Therefore, the inner integration is independent of time, so equation (4) can be written in the following form

By dividing the average number of expectation value for samples which exceed the level value (q) in the interval [0, T] (equation (5)) by the length of the interval, we can obtain the average number of occurrences of all peaks over the level y = q for in the specified period T as

Probability analysis and distribution
The random vibrations can be considered as a Gaussian process with zero mean value since the average value of the signal is located at the original of the histogram corresponding to a random signal, which is usually described in terms of the standard deviation for a given distribution. 31 The Gaussian process is a particular kind of statistical model where observations occur in a continuous domain, e.g. time or space. In a Gaussian process, every point in some continuous input space is associated with a normally distributed random variable. 32
Normally, all vibration testing and analysis is carried out under the assumption that the random variables are Gaussian distributed with the expectation value M and the variance value Ay. The primary reasons for this assumption are twofold:
15
The Gaussian process is one of the few processes that have been mathematically defined. Many physical processes have been found to be at least approximately Gaussian (central limit theorem).
For Gaussian random variables, the Gaussian probability density (GDP) function of a random variable Y and its derivative

By substituting in the general form of the GDP function (Appendix 3), the PDF function will take the form
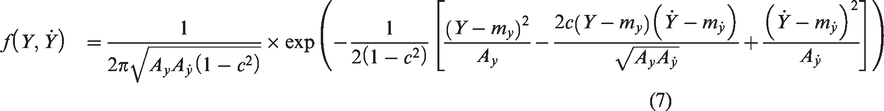
Substituting equation (6) into the expression of the PDF
If there is no correlation between the random vibration
Poisson law for the distribution of events (peaks)
Figure 2 shows the peaks (black dots) over the level (y
Random vibration sample with distributed peaks.
Under such assumptions, the analysis will be close to the Poisson law for the distribution of events (Appendix 4). The Poisson distribution is a discrete probability distribution for the counts of events that occur randomly in a given interval of time (or space). Here:
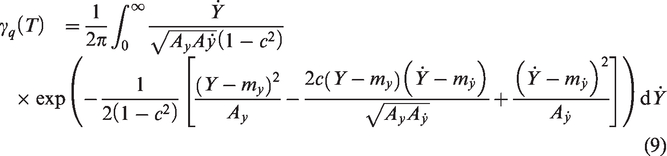
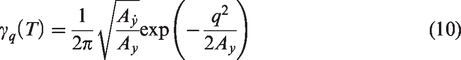
Based on equation (11), we can find the probability of no-peaks (P0) and the probability of at least one peak occurs (P1) in the interval [0, T] by following expressions

Expressions (9) to (12) allow to estimate the probabilistic characteristics of a random process (random vibration) with a correlation function of the form equation (1) describing the effect of exceeding the value vibrations level on the elements of the UAV in the steady state.
As an example for the approach, a sample of random vibration as shown in Figure 3 is taken to approve the analysis in this article.
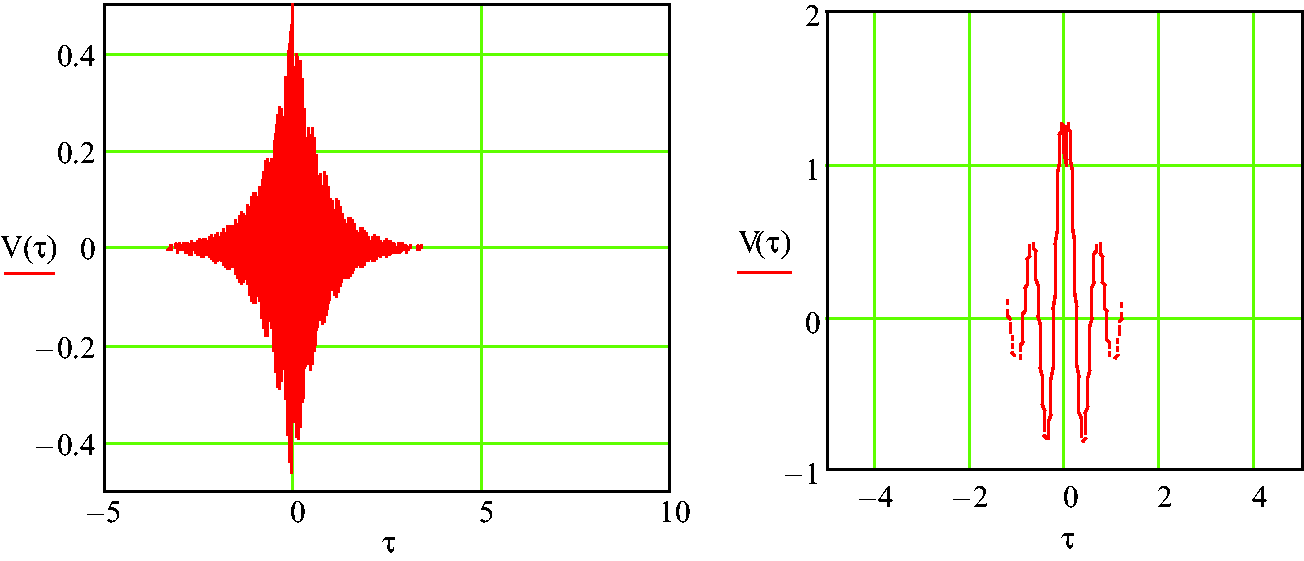
Sample of random vibration.
According to Figure 3, the following parameters obtained:
The attenuation parameter β = 1.5, frequency of vibration ω0 = 200 rad/s, the exponential decreasing coefficient λ=0.1 and the duration time t = 15 s.
By analyzing the results, it has been found that there is a relation between the positive level of permissible vibration (q) and the standard deviation (
Table 1 shows the results summarized for different values of q. The mean (average) number of peaks occurrences and the probability of occurrence of peaks in the random process (vibration) were subjected based on the research procedure.
The probability of occurrence values for different values of q.
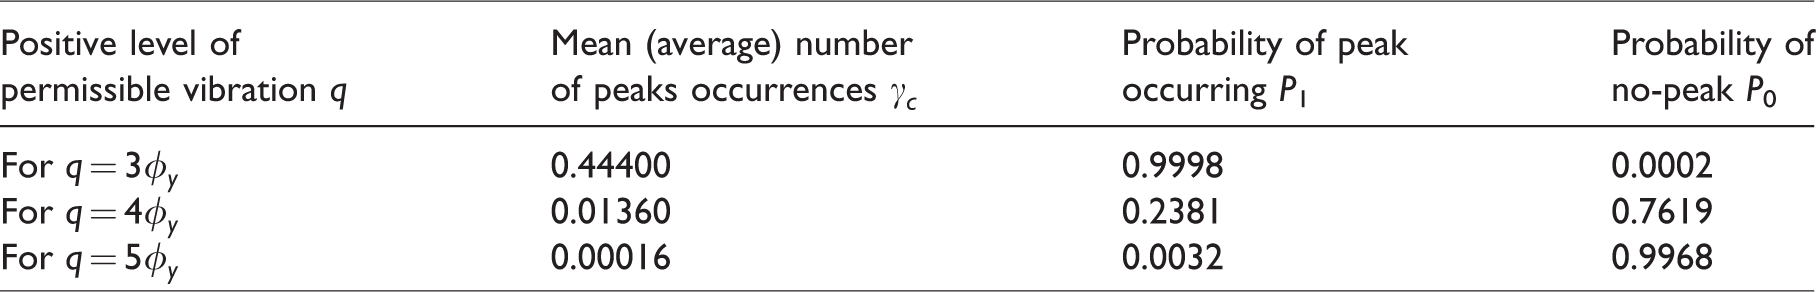
The results in Table 1 show that the mean (average) number of peaks occurrences and the probability of occurrence are decreasing with the high value of q. Thus, it is obvious that when the level q = 5
The computational approach in this analysis is simulated by using Mathcad application.
Figure 4 shows the changing in the mean (average) number of peaks occurrences
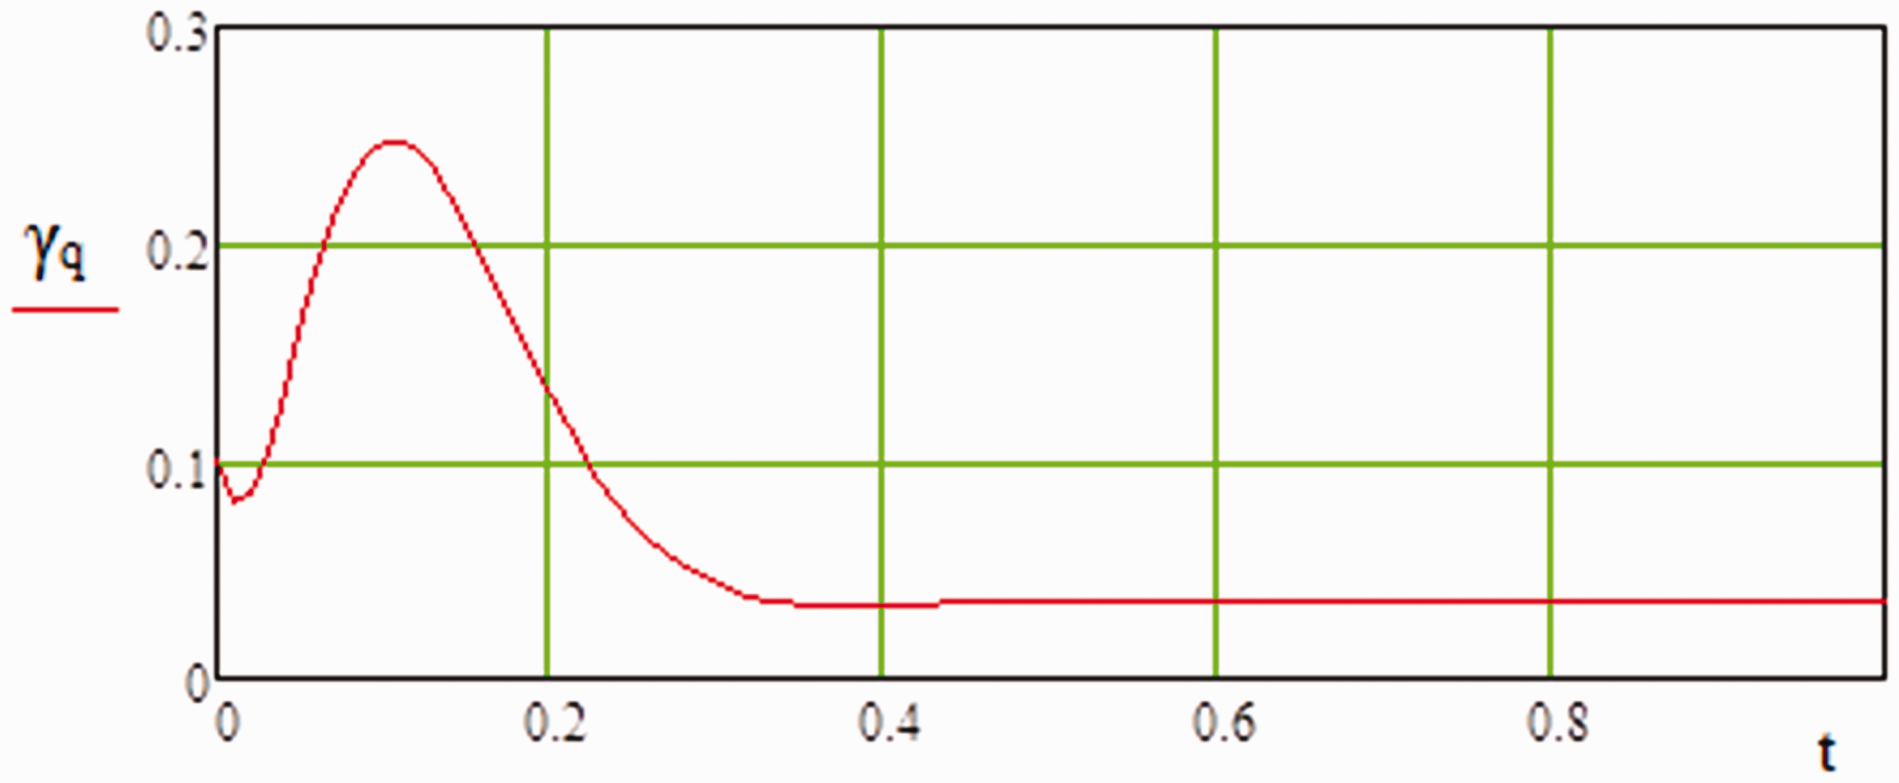
Changing in the mean (average) number of peaks occurrences
Figure 5 shows the change in the mathematical expectations for the random processes
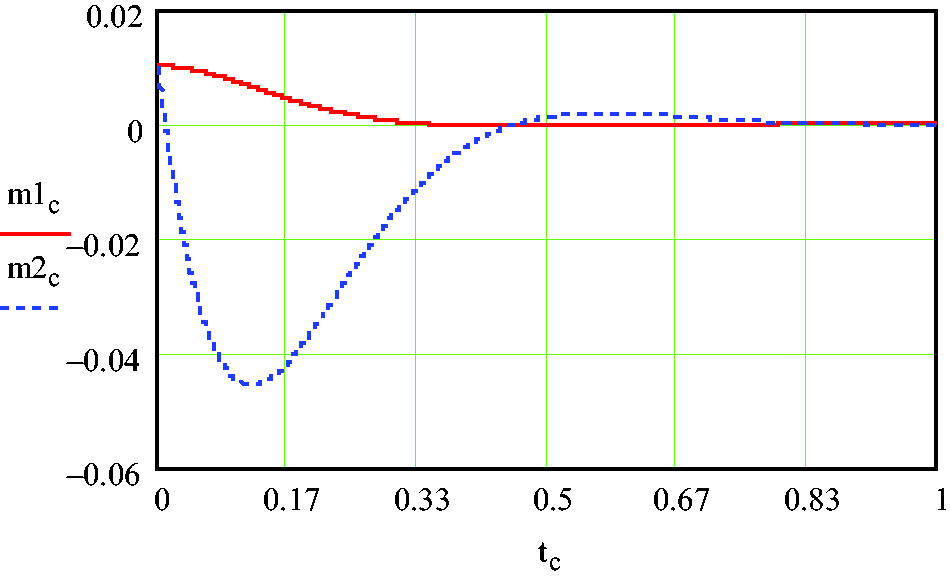
Changing in the expectations value for the processes
Figure 6 shows the change in the correlation moments C11, C12 and C22 for the processes
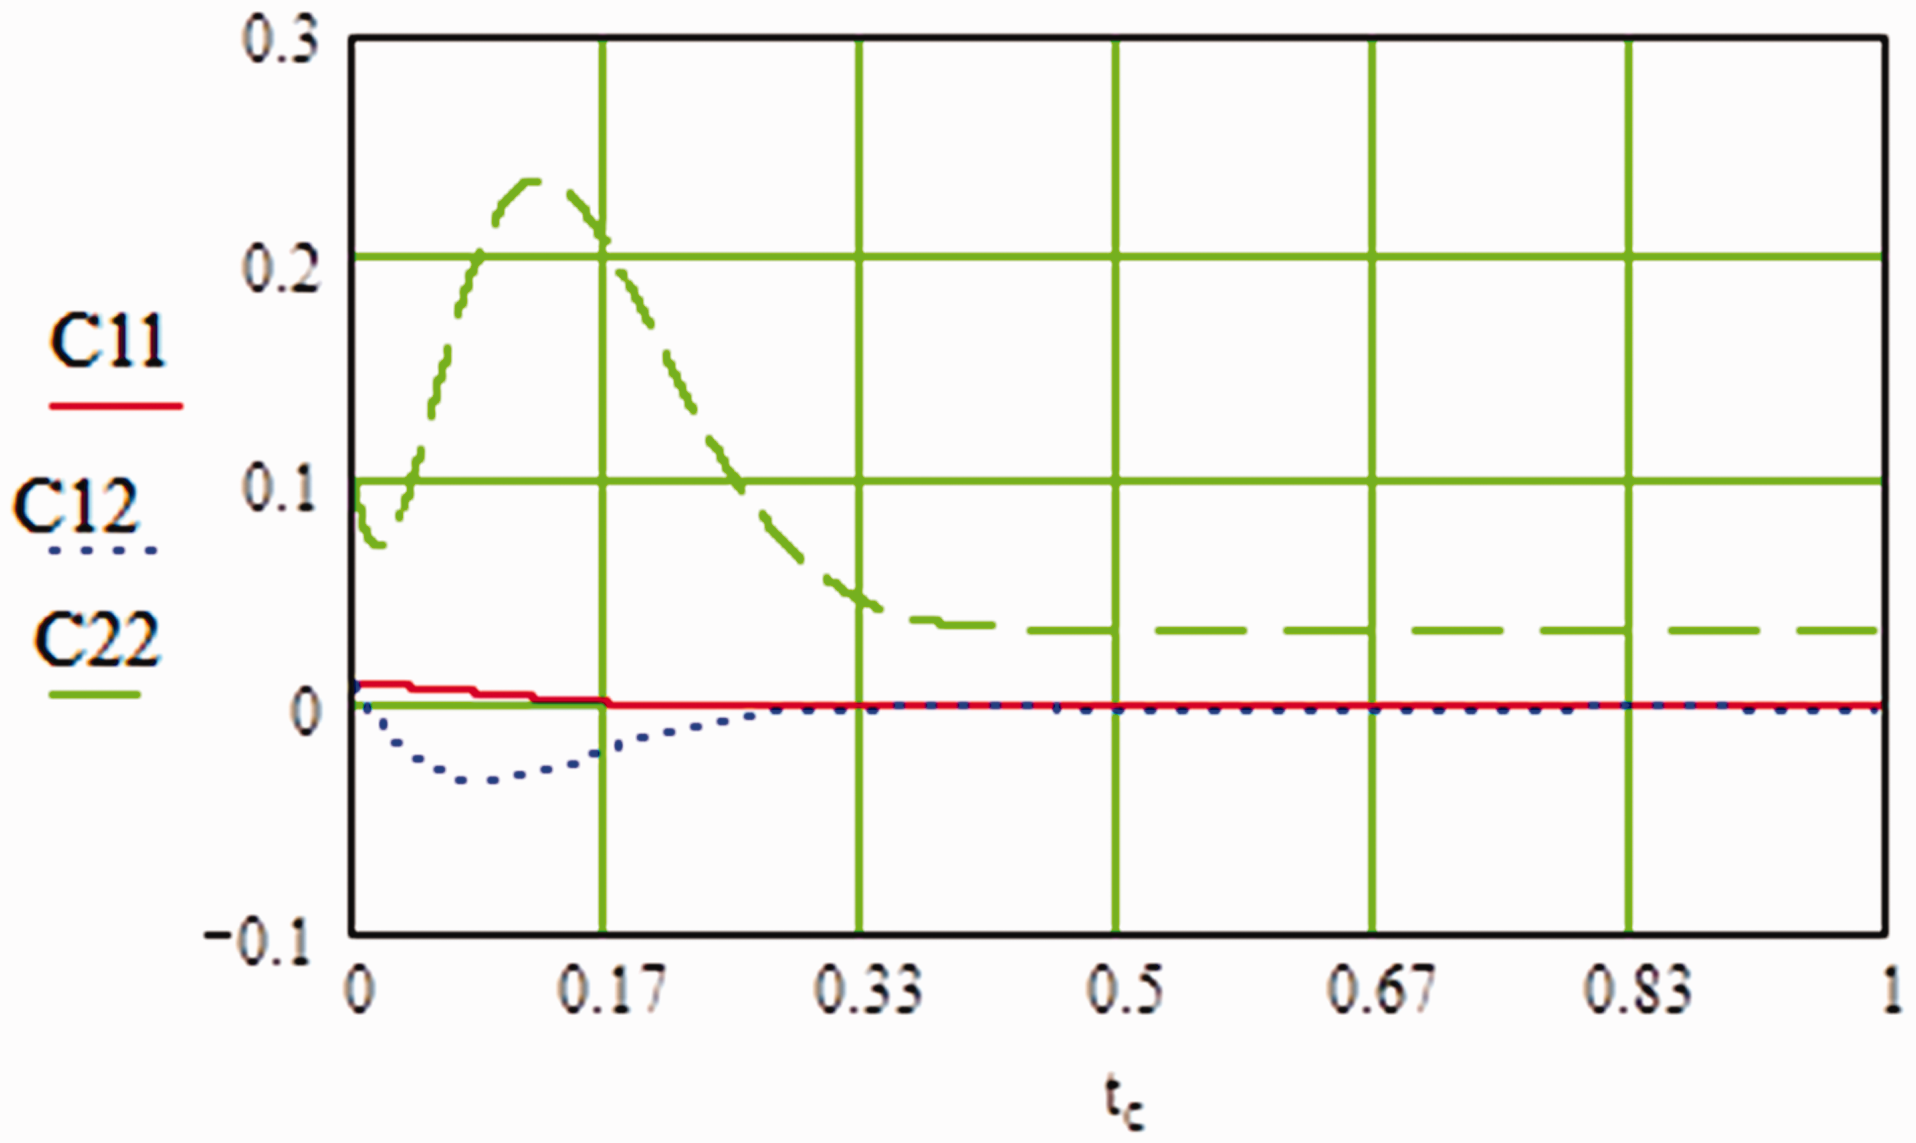
Correlation moments changing with time.
Figure 7 shows the change in the correlation coefficient c for the processes
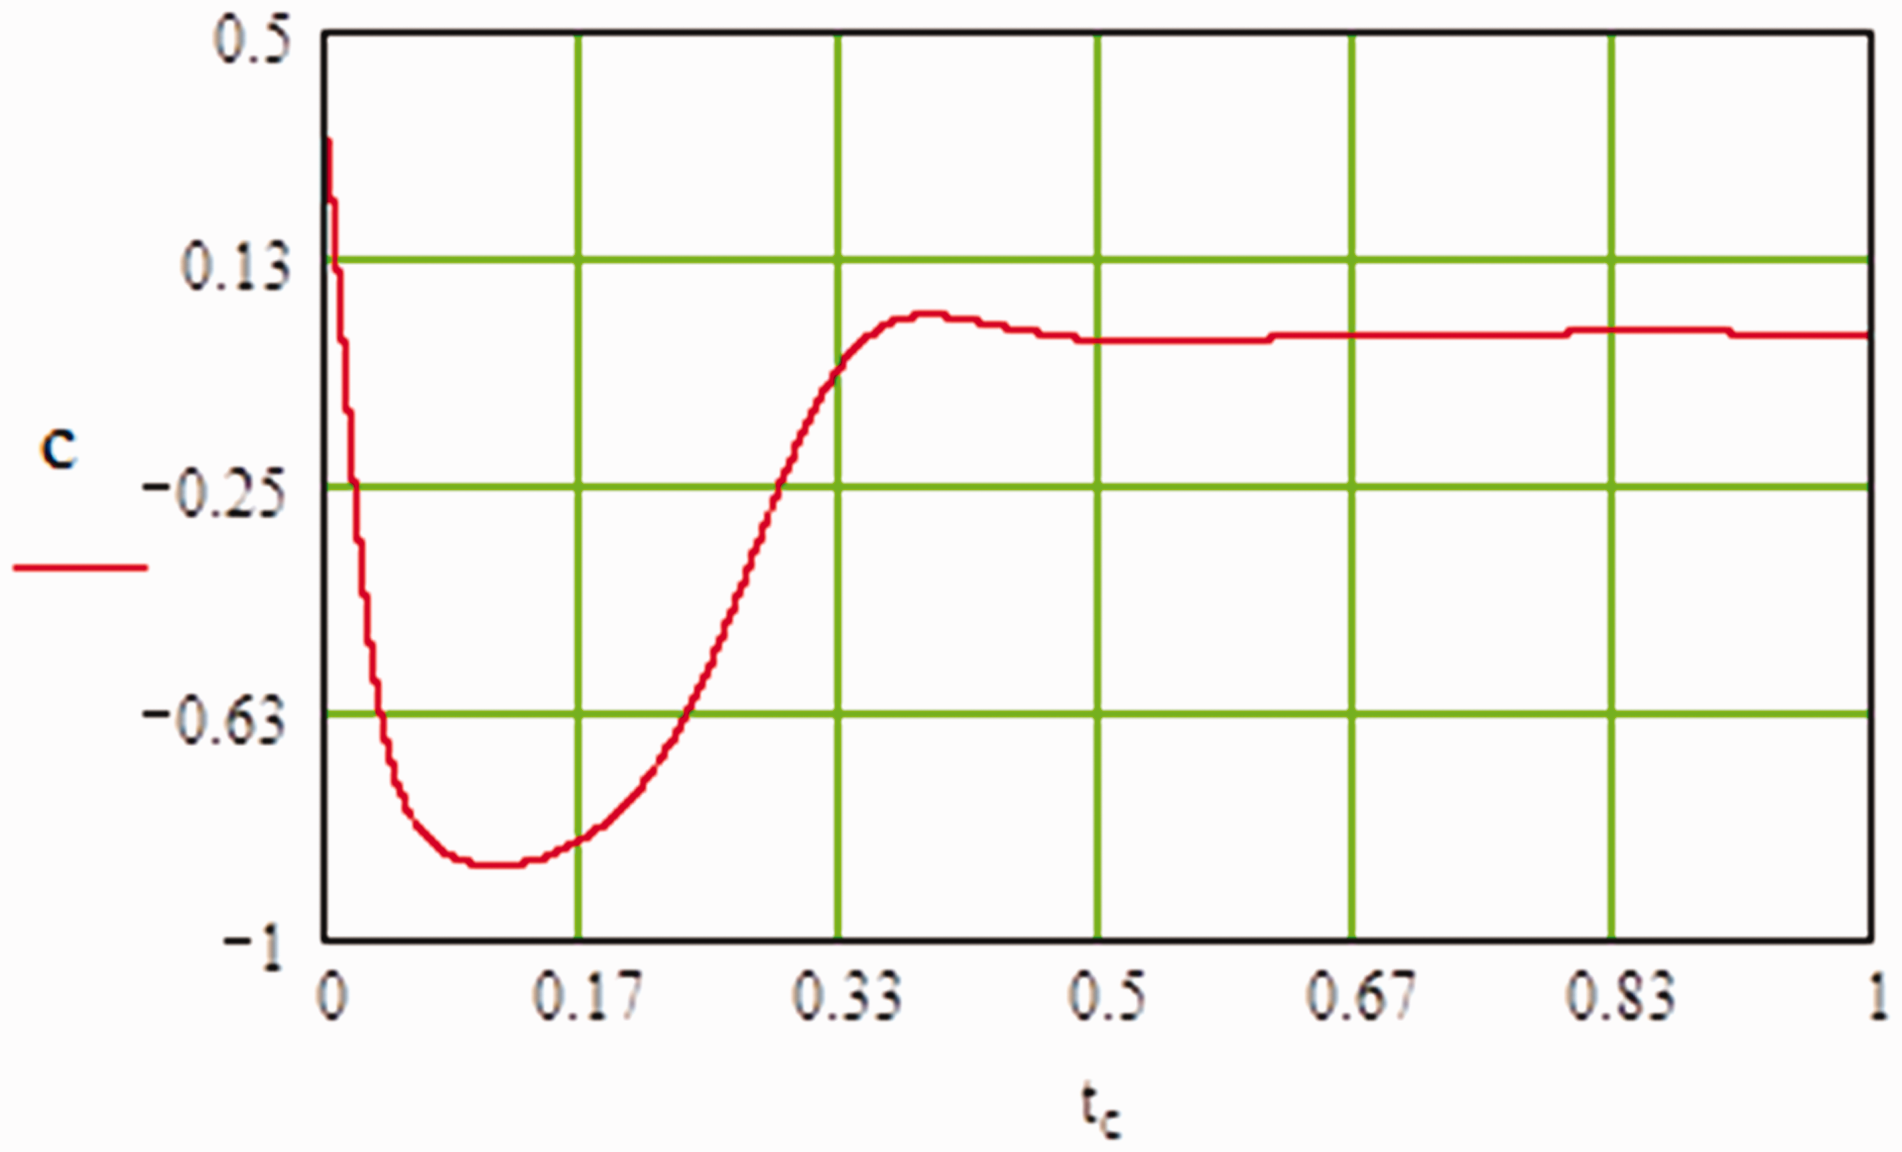
The correlation coefficient c.
If the condition for the random vibration
Conclusion
The study of random (stochastic) vibrations has shown that the random vibration is one whose absolute value is not predictable at any given time. As opposed to sinusoidal vibration, there is no well-defined periodicity – the amplitude at any point in time is not related to that at any other point in time. Exact analytical solutions for vibrations harvesting have been found for only relatively few systems of nonlinear stochastic dynamics. Thus, much of the analysis of such systems relies on approximate techniques. Therefore, the analysis in this article is based on an approximated formula for vibration. The mathematical approach is done depending on two hypotheses. The first hypothesis is that the random vibrations generated by independent sources. Therefore, the emissions of these vibrations should also be taken into account. The second hypothesis assumes that the statistical characteristics of emissions allowed to use the expectations and probability theory expect their value based on a certain time interval [0, T] of vibrations occurring. This will give an adequate description of the vibration’s problem and give a chance to harvest it. It was shown that the correction of boundary parameters (emissions) related to the vibration by the expectation and probability theory leads to decrease the undesirable random vibrations.
Footnotes
Declaration of conflicting interests
The author(s) declared no potential conflicts of interest with respect to the research, authorship, and/or publication of this article.
Funding
The author(s) received no financial support for the research, authorship, and/or publication of this article.